a comparison of higher education funding in … comparison of higher education funding in england...
TRANSCRIPT
0
A comparison of higher education funding in England and Australia: what can we learn?
A HEPI report by Libby Hackett
April 2014
About the author:
Libby Hackett is Chief Executive of University Alliance (UK) and a visiting Senior Research Fellow in
higher education policy at the University of the West of England. Libby has published extensively on
higher education supply and demand, the economic demand for graduates and the impact of fees,
including previous HEPI publications.
1
Contents Executive Summary and lessons to learn for both England and Australia .............................................. 2
Acknowledgements ................................................................................................................................. 6
Chapter 1/ Why make this comparison? ................................................................................................. 7
Chapter 2/ Funding: flows of public and private investment.................................................................. 9
What is the optimum balance of public: private contribution to HE? ................................................ 9
Flows of public and private investment: the students’ perspective ................................................. 10
Flows of public and private investment: the Government’s perspective ......................................... 14
England: What did £9,000 fees do to the balance of private: public investment? ........................... 16
How does the private: public balance of investment compare? ...................................................... 18
The structure of the Australian system in more detail ..................................................................... 20
Chapter 3/ Public v. private universities in the two systems ................................................................ 22
Treatment of for-profit providers in the English and Australian systems ......................................... 22
Funding on the basis of retention ..................................................................................................... 23
Chapter 4/ Design of fee loans .............................................................................................................. 24
Understanding income contingent loans .......................................................................................... 24
The English and Australian loan system in detail: understanding HECS-HELP and FEE-HELP ........... 26
So what does this mean for the outcomes of the loan system? ....................................................... 28
Chapter 5/ Student number controls .................................................................................................... 30
Understanding ‘demand driven’ policy in Australia .......................................................................... 30
Why England might fare differently following the removal of number controls in 2015-16 ........... 31
Chapter 6/ Fee variation, transparency and language .......................................................................... 33
Fee variation ...................................................................................................................................... 33
Transparency ..................................................................................................................................... 34
Language ........................................................................................................................................... 35
Chapter 7/ Regulation ........................................................................................................................... 37
RTOs and the VET sector in Australia – what not to do .................................................................... 37
Alternative providers in England – more than you might think ........................................................ 38
TEQSA – is this HEFCE and QAA combined? ...................................................................................... 39
Is co-regulation a better approach? .................................................................................................. 41
Chapter 8/ Areas that deserve further comparison .............................................................................. 42
Bibliography ........................................................................................................................................... 43
Annex 1: Australian student contribution and direct public funding .................................................... 46
2
Executive Summary and lessons to learn for both England and
Australia
About two years ago I began an academic study to compare and contrast the design of the student
loan systems in Australia and England. Following the introduction of £9,000 fees and with growing
concerns about the high levels of non-repayment of loans in England (up to 45% now according to
the Government) I soon realised the huge potential to apply some of the findings. Hopefully this HEPI
report will prove a timely contribution to the important debate about the future of higher education
funding and student finance in England and possibly in Australia as well.
The report identifies a number of lessons we can learn from our Australian cousins (and a few the
other way but I shall leave those for the full report to describe). Nobody is suggesting the Australian
system is perfect, or somehow ‘better’ than the English funding model, but there are a number of
lessons we can take from the Australian system; particularly addressing the high and growing cost of
non-repayment of student loans and the lack of fee loan access for postgraduate students and two
thirds of part-time students in England.
The report goes into much more detail but in very brief terms, the most interesting observations are
as follows:
First, the Australian system operates a much lower level of non-repayment of student loans. Public
subsidy of loans is just 25% in Australia (and this includes an interest-rate subsidy alongside non-
repayment) compared to the UK’s 45%. The Australian graduate repayment system has a high
earning threshold for repayment (like English system ) and a progressive, income-contingent
repayment system (like England ) but once the graduate crosses the earning threshold the monthly
repayments are higher. Australian graduates make higher repayments to achieve a much shorter
repayment period; just 8.4 years on average compared to over 26 years for English graduates. This
has a significant impact on bringing the rate of non-repayment down in the Australian system. It also
ensures that the vast majority of Australian graduates pay off their student loan before the age of 30
when, typically, they will be starting to buy houses, get married and /or have children.
The obvious lesson for us in England is that loan design matters; particularly the graduate repayment
system. There has been a lot of attention of future graduate wages increasing the 45% non-
repayment of loans (or ‘RAB’) in England but perhaps we should also look at a loan design that asks
only £7.50 a week from someone earning £25,000 a year. At this rate, no-one should be surprised
that it takes over 26 years to pay back and that over 60% of students will never repay their loan in
full.
Second, the Australian system includes a loan design called FEE-HELP. The undergraduate FEE-HELP
loan carries a 25% surcharge that gets added to the loan and, in effect, creates a student loan where
the cost of non-repayment of loans is zero. This is a relatively small part of the Australian system but
provides an excellent proof of concept that is possible to operate a student loan that does not carry
public subsidy. This is worth repeating. The undergraduate FEE-HELP loan proves that it is possible
to operate a non-subsidised student loan.

3
Third, unlike in England where postgraduate students and two thirds of part-time students cannot
access a loan to help with the cost of their fee, FEE-HELP in Australia ensures that virtually all
students can access a fee loan that is repaid after graduation. And it gets even better. Given the
relatively low level of loan subsidy, they are able to offer a lifetime loan allocation (around $100,000)
giving everyone maximum flexibility and choice to enable them to up-skill and re-train in support of a
diverse and rapidly evolving job market. Given the huge cost of non-repayment of student loans in
England, we are only able to offer fee loans to first-time undergraduate students – one hit and
you’re done.
Fourth, the Australian’s called it a Higher Education Loan Programme – HELP – and developed public
discourse based on the Government providing help for students to cover the cost of studying. In the
UK, we used terms like ‘fees’ and ‘debt’ and wondered why students protested in the streets.
Of equal significance, Australia chose to go with three fee bands rather than one fee maximum,
alongside published bands of ‘core funding’ by subject. In other words, every student knows both
what their contribution and the Government’s contribution is towards the cost of their course.
These funding levels are understood in the public mind-set, engendering a sense of social contract
based on the shared contribution of costs. There are obvious lessons for us to learn around both
language and transparency in a system where our Government now puts the vast majority of public
funding for higher education into invisible loan subsidy.
The report finds a few more ‘lessons’ for the English system in Australia’s recent experience, for
example in their recent ‘demand-led’ policy and their regulation of Alternative Providers. Both are
highly relevant to current policy in England following the autumn statement in 2013 that announced
the removal of student number controls from 2015-16 and the growth of alternative providers; they
make for interesting reading and are covered in detail in the report.
Given the central importance of higher education to any modern, global economy, these are big
issues for our Government or any future government to get right and will undoubtedly form part of
the election debate. Public and political discourse will focus on £9,000 fees, student debt and the
45% non-repayment of student loans but hopefully this report will contribute to the wider debate. A
well-designed higher education and student finance system will be critical to the future of our
economic and social prosperity as a nation; anything we can do to contribute to that is at the heart
of the purpose of both the Higher Education Policy Institute and University Alliance. Further
proposals for a future funding system will be published by University Alliance in June as part of our
uni_funding work.
Lessons to learn
1/ Evidence would suggest that a 50:50 balance of public: private contribution may achieve
something close to optimum economic efficiency. Even the best evidence, however, includes a
considerable amount of judgement, which means this figure should only be a rough guide at best.
2/ If England is concerned about the upfront cost of studying for postgraduate and many part-time
or second chance students, Australia is an excellent place to start looking. They have been able to
provide financial support for these students at minimal cost to Government; for undergraduate

4
students that cannot access publicly subsidised places, a loan is available at virtually zero cost to
Government.
3/ It is actually the English system that is closer to achieving the optimum level of 50:50 public:
private share of contribution overall. The lack of transparency in the English system, however, means
that there is almost zero public awareness of this balance of contribution, with most students
assuming they are paying the full cost of their studies at £9,000.
4/ The important lesson here for those in Australia who are looking to liberalise fees for the purpose
of raising funding to universities is that the trebling of fees to £9,000 in England did not bring in
much additional resource to English universities overall – and brought reductions for some. The
English experience suggests that any increase in the cost of public loan subsidy is likely to result in a
matched reduction in core public funding for teaching. The Australian HECS-HELP fee loan carries a
Government subsidy, so the same logic is likely to apply. Those in Australia who are seeking to raise
or fully liberalise the fee level should be wary of the consequence for their base funding.
5/ Given public reaction to £9,000 fees in England, including student riots, the lesson here for
England might be that direct funding for teaching is a more transparent method of public investment
in HE that can more easily facilitate a social contract based on a practical demonstration of shared
investment.
6/ The Australian model of a lifetime loan allocation for their FEE-HELP loan system is an important
and progressive step towards a more flexible, market-driven system that England should learn from.
7/ Given the Government’s commitment to increasing market forces in higher education in England,
it is helpful to observe the Australian system in this regard. The Australian system benefits from
operating publicly-supported higher education alongside a more marketised system that carries little
or no public subsidy; and yet still offers fee loans to nearly all students.
8/ For England, possibly the most important lessons can be learnt from the undergraduate FEE-HELP
loan design in particular; a Government fee loan system that carries little or no public subsidy. And
for Australia, some considerations about the benefits of a funding system that is more responsive to
retention.
9/ For English observers that are concerned about the 45% public subsidy on student loans, a vital
lesson is that it is not better employment prospects that are allowing Australian graduates to pay
back their loans faster (8 years on average, compared to our 26 year); it is lower debt levels and a
better designed repayment system – something England needs to learn from.
10/ The Australian system is distinct in having a tougher, shorter repayment period once over the
earnings threshold. For most graduates, this means an effective – and still affordable - means of
getting their loan paid off in full before they reach 30. It also means a lower level of public subsidy
(or RAB) on student loans for the Government.
11/ FEE-HELP loans have enabled the Australian Government to do two really important things that
the English system is not able to afford: first, offer a fee loan to every student and second, offer a
lifetime loan allocation; allowing students to re-enter the system and re-train throughout their
career. This has to be the primary lesson to learn from the Australian system for England.

5
12/ The English system already has levers in place to manage quality (funding on the basis of
completion, robust retention measures, co-regulation of standards and student information) and
price (fee controls). The lesson for England to learn is that a non-subsidised Government fee loan
could facilitate the expansion of new providers and new types of provision without carrying
considerable public subsidy. A FEE-HELP type approach would considerably reduce the risk to the
public purse, whilst enabling for-profit providers to grow.
13/ The lesson for England here is that transparency matters in the funding system – particularly if
you aim to build a social contract on the idea of a shared contribution towards the cost of gaining a
degree.
14/ The lesson for England here is that language matters in the funding system – particularly if you
aim to build a social contract on the idea of a shared contribution towards the cost of gaining a
degree.
15/ The problem, and the salient lesson for England as well as the Australian HE system, is that the
minimum threshold for entry to the market for new providers was set far too low. A regulator cannot
be expected to regulate thousands of providers that are flooding into a new market where the doors
are wide open. Many of the states staggered payments to providers on the basis of retention but this
did not help. The really important lesson for England is that it is far more important to establish and
enforce appropriate minimum standards for entry into the market when managing a growing and
diversifying market.
16/ This is where the Australian model of TEQSA has something to offer the English system. As a
national regulatory body, TEQSA has regulatory responsibility for all HE providers, public or private,
receiving public funding or otherwise.
17/ Furthermore, TEQSA is responsible for establishing and maintaining a National Register of Higher
Education Providers. Given recent student visa scandals with private providers – often English
language providers – a National Register of HE Providers could be helpful in making more sensible
visa rules. For example, England could return to an automatic two year right to stay and work for all
graduates from those institutions on the National Register of HE Providers. This would put England
back in line with Australia, Canada and other international competitors rather than the complicated
and off-putting system we have at present.
18/ In an English system that is about to experience further growth, TEQSA provides a useful
example of a national regulator that has proportionate regulatory engagement with all HE providers,
whether receiving public funding, fee loans or otherwise. TEQSA take a differentiated, risk-based
approach rather than a ‘level playing field’ approach. Australia also looks to the original providers /
accrediting body directly to uphold standards at franchise providers or face sanction itself – an
important lesson for England with the rampant growth of franchise providers. This is a model that
HEFCE could adopt without, necessarily, having to change the position or co-regulatory function of
QAA but it would require changes to primary legislation.
19/ From the Australian perspective, perhaps there is something for Australia to learn from the UK’s
approach to co-regulation of standards – a method that seems to be a little more harmonious but, so
far, equally effective at ensuring standards and protecting students.

6
Acknowledgements
I would like to thank the following colleagues in Australia for their generosity, expertise and a shared
passion for the advancement of higher education for the public good:
Vicki Thomson, Executive Director of the Australian Technology Network of universities
(ATN);
Professor Bruce Chapman, Crawford School of Public Policy, Australian National University
(ANU);
Dr Andrew Herd and colleagues at the Department for Education, Canberra;
Professor Leesa Wheelahan, former Associate Professor at the LH Martin Institute for
Tertiary Education Leadership and Management, University of Melbourne, now the William
G. Davis Chair in Community College Leadership at the University of Toronto;
Dr Gavin Moodie, Adjunct Professor and higher education policy expert, RMIT;
Dr Carol Nicoll and Michael Wells at the Tertiary Education Quality and Standards Agency
(TEQSA);
Belinda Robinson and colleagues at Universities Australia; and
Professor S Bruce Dowton, Vice Chancellor of Macquarie University.
My sincere thanks also go to colleagues in the UK for their expert advice, time and support,
particularly:
Professor Nicholas Barr, London School of Economics
Dr Richard Waller, Associate Professor of the Sociology of Education, University of the West
of England (UWE)
Chris Millward, Yvonne Hawkins and colleagues at the Higher Education Funding Council for
England (HEFCE)
And of course my thanks go to Nick Hillman, Director of the Higher Education Policy Institute (HEPI)
in the UK, for supporting, improving and publishing this report.

7
Chapter 1/ Why make this comparison? First, why bother comparing the English and Australian higher education funding systems? Well,
beyond this being just an intellectual exercise, there are some really interesting policy changes
recently on both sides that warrant closer investigation and may even allow practical application.
Just as those involved in Australian higher education (HE) have been keen to observe what lessons
they can learn from England’s trebling of undergraduate fees to £9,000 (a major acceleration of
previous trends), it is helpful for us to examine the Australian system to learn lessons from their
recent ‘demand driven’ policy where they lifted the cap on places. In additional the Australian
system is notable for their remarkable achievement of designing a Government loan system
(undergraduate FEE-HELP) that carries virtually no public subsidy and is available to those students
who cannot access subsidised places with subsidised fee loans. Given the calls in Australia to
liberalise the fee cap recently and, in England, the Coalition’s historic announcement to remove
student number controls (SNC) alongside our rising fee subsidy charge, it is important we take a very
close look.
Second: is such a comparison valid? My answer would be a resounding ‘yes’ – more so than any
other system I have ever looked at in comparison to the English system. Both Australia and England
have a mass higher education system (Trow M. , 1974), based on similar waves of expansion since
the 1950s (Wheelahan, 2010). These two countries also have a broadly similar balance of public and
private contribution with similar funding structures, quality assurance frameworks and participation
rates (see Chapter 2). The Australians might have, just, beaten us in introducing income contingent
loans in 1989 but our fee and loan systems have been developed almost in parallel over the past 20
years or so. Even the academic architecture supporting both systems developed almost in parallel
thanks in large part to Professor Nicholas Barr at the LSE in London1 and Professor Bruce Chapman at
the ANU in Canberra2.
The case for comparing England and Australia has already been established in academic literature by
Nicholas Barr and others (Barr, 1998). These comparisons, however, need to be undertaken with a
great deal of care. Context is everything. Alongside the difference in size, population (Australia’s
landmass is similar to the US but it’s population is just 42% of the UK’s) and let’s not forget climate,
the two countries have also had very different experiences of the global recession; a huge mining
boom and major, early Government stimulus has largely protected the Australian economy whilst
England has been experiencing an ‘era of austerity’. Any comparison of the costs or attitudes
towards HE, need to be undertaken in this context.
Third: am I the right person to be doing this? Well, I am a (relative) expert in the English higher
education system – particularly the funding system – and it is from this biased perspective that I will
offer some observations and comparisons. I have been able to identify lessons on both sides that
1 Professor Nicholas Barr’s publications on income contingent loans and the student finance system are listed
here: http://econ.lse.ac.uk/staff/nb/index_own.html Some of the best examples include (Barr N., 1989, 2001, 2004, 2005, 2010) and (Barr & Crawford, 2007). 2 Professor Bruce Chapman’s recent publications and current research areas, including the application of ICLs
to other countries are listed here: https://crawford.anu.edu.au/people/academic/bruce-chapman?tb=publication Excellent examples of Chapman’s work on ICLs include (Chapman & Ryan, 2002) and (Chapman, 2004).

8
could possibly address some topical issues in the respective countries. Any factual references to the
Australian system have been checked by bona fide Australians and for that I am hugely grateful. Any
analysis based on these observations is my own and I take full responsibility for where I may have
inadvertently gone awry. This paper is written primarily for an English audience and, whilst I shall
certainly identify some areas where we can learn from our Australian cousins, I have tried to be very
careful in proffering any lessons for Australian higher education experts to learn from our system.
9
Chapter 2/ Funding: flows of public and private investment With England and Australia both firmly in the category of mass higher education, the question of
how to finance higher education is both an important and highly politicised debate. With around
40% of the young population now gaining a higher education qualification in both countries3, both
the timescale of expansion and the underlying method of financing the system through the
introduction of income-contingent loans have been sufficiently similar to enable meaningful
comparison of the English and Australian systems, whilst being sufficiently different to learn lessons
from such a comparison, as demonstrated by previous studies (Barr, 1998).
This report assumes that it is good for the higher education system to expand for three purposes:
increasing future economic output (OECD, 2012); to meet growing demand for higher education
(Johnston & Barr, 2013); and to widen access to higher education. Although this view is by no means
universally accepted (Wolf, 2001) it is widely recognised that “knowledge-based economies require
high levels of human capital, which influences a large number of economic outcomes and boosts
long-term productivity” (Armstrong & Batten, 2011).
What is the optimum balance of public: private contribution to HE? In examining the flows of private and public funding in both countries, it is important to first consider
whether there is an optimum balance of public: private contribution that both countries should be
aiming for. It is widely recognised that there are considerable private and public benefits to higher
education. The question of what the balance of contribution should be in an ideal system to match
the balance of private and public benefit is an almost impossible question to answer, although many
have tried. The difficulty is primarily because of the complexity of attempting to estimate the public
benefit – although the private benefit carries its own complexities such as the considerable variation
underlying average figures.
Private rates of return have been researched extensively (see (Chevalier et al. 2002) for an excellent
summary of the literature in this area) and have received a great deal of attention in both countries
because of their use in justifying increased private contribution through higher deferred fee
payments. Andrew Norton at the Grattan Institute has published extensively from the Australian
perspective. The estimation of the social benefits of higher education have, historically, been much
harder to quantify; particularly the non-market benefits.
A public good or service is “neither rivalrous in consumption, nor excludable in ownership, and is available to all. […] one of the largest social benefits unique to higher education is from the wider diffusion of new knowledge. It is the omission of the non-market benefits that causes standard narrow social rate of return estimates to be most seriously understated.”
(McMahon 2009) As human capital theory and endogenous growth theory have achieved major advances, so has the
analysis of the social benefits or social returns to higher education. Based on international
comparisons of data across OECD countries, (Schleicher 2010) has found that the UK Government
3 In 2012 in Australia, 36.8% of 25 to 34 year olds had a degree or higher qualification (Norton, 2013). In 2012
in England, the participation rate of 18-21 year olds was 40% and for 18-30 year olds was 49% (BIS, 2013a).
10
benefits to the tune of $95,000 (US) per graduate, just in increased tax and social contributions. He
found that the public long-term gains in higher education are almost 3 times the size of the
investment in the UK. This is still likely to include an underestimate of the non-market benefits.
Critical studies were built on by McMahon (McMahon 2009) in a comprehensive and up-to-date
consideration of the private and social benefits of higher education. McMahon found total
externalities of higher education to be around 52% of total benefits, both market and non-market.
The estimate that social benefit externalities constitute about 52% of the total benefits of higher education is an approximate guide to how far the privatisation of higher education should proceed before public investment falls below the level conducive to optimum efficiency.
To be clear, this is not a social rate of return – rather an estimate of the per cent of the total benefits
that are social benefit externalities. 52% is, therefore “an estimate of the per cent of the total
investment in higher education that needs to be publicly financed if economic efficiency is to be
achieved” (McMahon 2009).
1/ Evidence would suggest that a 50:50 balance of public: private contribution may achieve something close to optimum economic efficiency. Even the best evidence, however, includes a considerable amount of judgement, which means this figure should only be a rough guide at best.
Flows of public and private investment: the students’ perspective This section focuses on the flow of public and private investment in higher education for different
parts of the sector / different types of students in England and Australia.
In both systems there are a couple of major lines in the sand based on types of students and the type
of public funding students will attract and the student support they can access. These have
consequences for students, as well as for the flow of both public and private investment in HE.
Figures 1 and 2 below describe the allocation of funding from the perspective of the student in
England and Australia respectively. In England (Figure 1) the primary distinction in the allocation of
public funding (including access to publicly subsidised fee loans) is whether you are a first time
undergraduate entrant; i.e. whether this is your first degree. If yes, (approximately 95% of all full-
time undergraduates and 33% of all part-time undergraduates4), you will have access to a fee loan
and your university will receive direct funding if you are on a high-cost course and (a much lesser
amount) if you are from a low-income background. If, however, you are re-training in a different
area, studying at less than 0.25 full-time equivalent (FTE), or a postgraduate student you do not
qualify for a fee loan and your university is much less likely to receive any direct funding for the cost
of your course, meaning you are likely to be on a full fee programme where you have to pay 100% of
the price of the course upfront (shown in dark blue).
4 For part-time students there is a second qualifying criteria in that you have to be studying at an intensity or
workload of more than 25% of a full-time equivalent to qualify for a fee loan

11
Figure 1: English criteria for accessing fee loans and public funding5
To be clear, for students in England, if you do not qualify for a Government subsidised fee loan (all
students in dark blue or purple in Figure 1 above), you have to pay the fee upfront in full. In most cases,
this will be the full cost of the programme.
Figure 2 below shows the Australian system. The major contrast from the student perspective is that
HELP – the Higher Education Loan Programme – is extended to all students.
If you qualify for a Government subsidised place in Australia (one that receives direct Government
funding for teaching, referred to as ‘base funding’ or ‘commonwealth funding’ – the same as HEFCE
teaching funding in England) you can also access a subsidised loan, called a HECS-HELP loan. This applies
to most undergraduate students and 40% of postgraduate students.
If you don’t qualify for HECS-HELP you can, in nearly all cases, access a FEE-HELP loan instead. FEE-HELP is
a Government-administered fee loan that is split into two types – undergraduate (UG) and postgraduate
(PG). All loans, HECS-HELP and FEE-HELP, have the same terms and conditions of repayment (income
contingent after graduation, collected through the tax system) but undergraduate FEE-HELP carries a
surcharge of 25%, which, broadly speaking, covers the Government’s cost of borrowing and any non-
repayment across the cohort. The Government does not, however, impose a surcharge for underwriting
and administering the loan. There is no surcharge for postgraduate FEE-HELP loans, which means they
continue to be subsidised.
FEE-HELP is a universal entitlement: it is available to all domestic students enrolled in approved higher
education providers, regardless of level of qualification or previous qualifications, up to a lifetime
maximum of around $96,0006 (around £56,000).
5 Figures 1 and 2 apply to all home and EU students. They exclude international student who pay 100% upfront
fee in both countries and attract no public investment. Post-graduate research students are also excluded.
First UG degree?
Studying over 25% intensity?
Studying at a private provider?
Studying a high cost subject?
Fee loan
(max fee £9K)
T funding
Fee loan
(max fee £9K)
Fee loan
(max fee £6K)
100% fee upfront
(no fee max)
Postgraduate?
On a subsidised postgraduate course?
Fee upfront
(no fee max)
Some T funding
100% fee upfront
(no fee max) 100% fee upfront
(no fee max)
Y
Y
N
N
N
Y
N
Y
N
Y
N
Y
12
The outcome is that undergraduate FEE-HELP in Australia is a Government loan system that carries
virtually no public subsidy. It allows Government backed fee loans to be extended to all students with
repayments on an income-contingent basis. This is a really significant part of the Australian loan design
that the UK can learn from.
For a more detailed explanation of HECS-HELP and FEE-HELP, please see Chapter 4 on loan design.
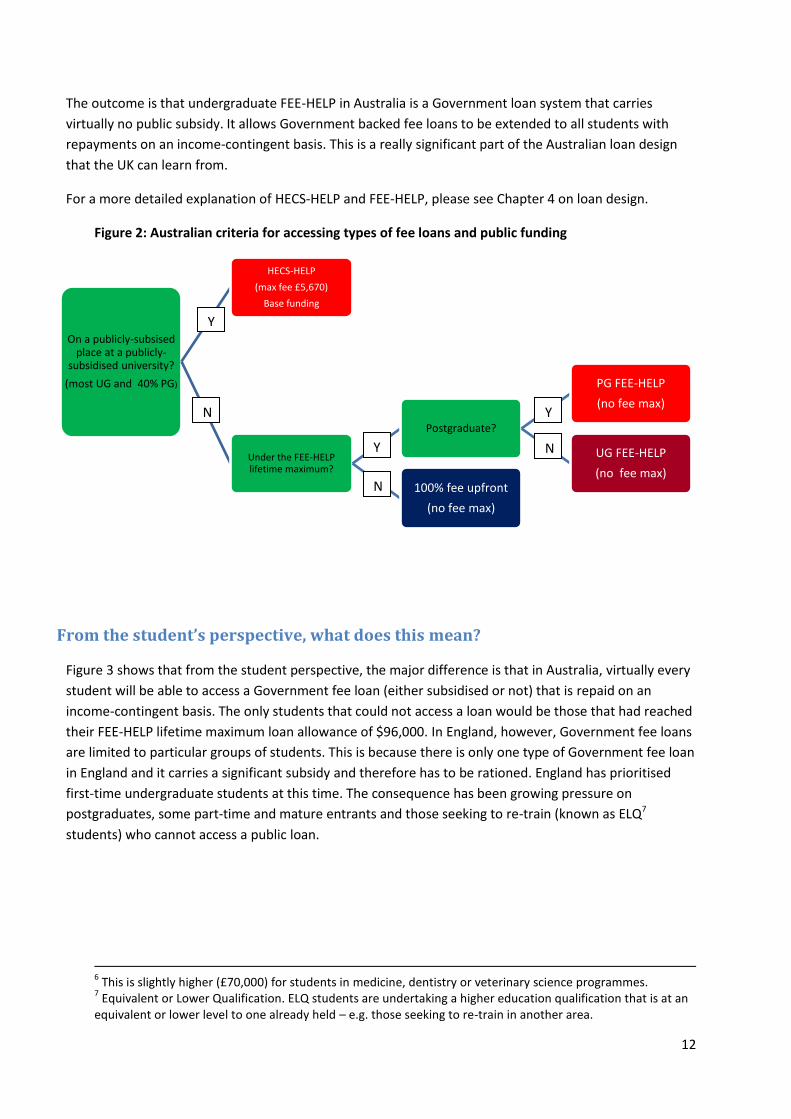
Figure 2: Australian criteria for accessing types of fee loans and public funding
From the student’s perspective, what does this mean?
Figure 3 shows that from the student perspective, the major difference is that in Australia, virtually every
student will be able to access a Government fee loan (either subsidised or not) that is repaid on an
income-contingent basis. The only students that could not access a loan would be those that had reached
their FEE-HELP lifetime maximum loan allowance of $96,000. In England, however, Government fee loans
are limited to particular groups of students. This is because there is only one type of Government fee loan
in England and it carries a significant subsidy and therefore has to be rationed. England has prioritised
first-time undergraduate students at this time. The consequence has been growing pressure on
postgraduates, some part-time and mature entrants and those seeking to re-train (known as ELQ7
students) who cannot access a public loan.
6 This is slightly higher (£70,000) for students in medicine, dentistry or veterinary science programmes.
7 Equivalent or Lower Qualification. ELQ students are undertaking a higher education qualification that is at an
equivalent or lower level to one already held – e.g. those seeking to re-train in another area.
On a publicly-subsised place at a publicly-
subsidised university?
(most UG and 40% PG)
HECS-HELP
(max fee £5,670)
Base funding
Under the FEE-HELP lifetime maximum?
Postgraduate?
PG FEE-HELP
(no fee max)
UG FEE-HELP
(no fee max) 100% fee upfront
(no fee max)
Y
N
Y
Y
N
N

13
Figure 3: nearly all students in Australia have access to a fee loan, in contrast to England
Given that upfront cost is detrimental to access to HE for those from a poor background (IFS, 2010),
England should be experiencing lower participation from non-traditional entrants into postgraduate and
non-subsidised undergraduate places, whereas Australia should not be experiencing these issues.
The experience in England is a complicated one. We know that applications from students from poor
backgrounds have actually increased despite an increase to a £9,000 fee but this is just amongst young,
full-time, first time undergraduate entrants – i.e. those students who can access a Government subsidised
fee loan. Whilst this is an important validation of the ability to increase fees without damaging access by
the method of income-contingent fee loans, this does not reflect the other parts of the system where
students do not have access to these loans.
For postgraduate students, the picture is complicated for a number of reasons. First and foremost, we are
yet to see any student graduate from the new £9,000 system that started in September 2012 entry.
Whilst we can speculate about the behaviour of students carrying an increased fee loan, we do not know
with certainty how these graduates will behave. Second, we are used to a postgraduate market in which
students have to pay the fee upfront – usually for a 1 year postgraduate taught degree. And whilst
postgraduate fees have gone up slightly since 20128, they have certainly not trebled and are unlikely to
suddenly do so in 2015 when the first year of 2012 students graduate. In some ways, therefore, the
market for postgraduates is unlikely to experience a sudden shock in 2015.
Thirdly, we are only at the early stages of developing credible measures of deprivation for postgraduate
students and therefore it is difficult to know the impact of these changes on access to postgraduate
education for certain. A recent study by Dr Paul Wakeling (Wakeling, 2013) looked at the factors
associated with transition to postgraduate study. It looked at subject, geographical location, financial and
demographic factors for UK and EU domiciled graduates only. What evidence exists on progression to
postgraduate study suggests that those with greater financial resources are more likely to gain a
postgraduate qualification and that holders of these qualifications have continued to benefit from an
earnings premium over time. This raises serious questions about social mobility. The study finds slight
8 The 2013‑14 average fee for UK or EU students on taught postgraduate courses rose by 7 per cent on the
previous year at universities that also provided data for 2012-13. International and postgraduate student fee survey, 2013, Times Higher Education.

14
disparity between students in different socio economic groups and significant disparities between
different ethnic backgrounds. Regardless of background there was little differentiation in how students
paid for their postgraduate study – with 80% of students financing their degree privately.
At this stage, one can only speculate about the 2012 cohort of entrants that will graduate in 2015 and
about likelihood of a student from a poor background carrying high levels of debt on graduation being
able to pay the upfront cost (or take out a private loan) for a postgraduate qualification. Given existing
access issues for postgraduate students and reduced availability of Government supported career
development loans from banks in England, it could be argued that there is likely to be even more
underinvestment in taught postgraduate from 2015 but this would be difficult to demonstrate beyond
doubt.
Australia has removed the risk of upfront costs reducing applications from poorer students by ensuring
that all postgraduate students can access a fee loan. Except for those who are seriously debt averse, we
know this will remove the obstacle of upfront cost and affordability – still the main barrier to access to
some forms of HE in England.
For part-time and mature students who cannot access a fee-loan because they are either studying at a
low intensity or are re-training when they already hold a degree qualification or higher, the picture does
not look good. We know there was a 40% drop in part-time entrants in England over just two years from
2011-13 (UUK, 2013c). Whilst this snap shot is by no means the whole picture (for example, much of this
drop happened the year before higher fees were introduced in 2012), it is difficult to deny that higher
fees, where combined with restricted access to fee loans, have reduced participation amongst some of
the most non-traditional and hard to reach students. How much of this was due to poor information or
other supply and demand factors (e.g. economic downturn in England) is almost impossible to ascertain
but the outcome is irrefutable.
Again, the Australian system avoids these issues by offering a lifetime loan allocation through FEE-HELP. I
am not suggesting the Australian system has no access issues. People from low socio economic status
backgrounds, Indigenous Australians and students from rural and isolated areas remain seriously under-
represented in higher education, but these access issues do not stem from a lack of access to financial
support to cover the upfront cost of studying.
2/ If England is concerned about the upfront cost of studying for postgraduate and many part-time or second chance students, Australia is an excellent place to start looking. They have been able to provide financial support for these students at minimal cost to Government; for undergraduate students that cannot access publicly subsidised places, a loan is available at virtually zero cost to Government.
Flows of public and private investment: the Government’s perspective It is important to recognise that whilst the difference in access to fee loans between the two systems is
significant for the student, it makes very little difference to the flow or balance of private / public
investment from the Government’s perspective. This is because the FEE-HELP system in Australia carries
minimal public subsidy (see Chapter 4 for more detail on loan design).
15
From the Government’s perspective, there are five main types of investment that need considering; two
private and three public. They are as follows:
1/ Private investment, fee loan – this refers to the loan repayments made by graduates through the tax
system. It is the percentage of the fee loan that will be repaid within 30 years. In both systems, fee loans
that will be repaid sit on the books as a long-term asset due to similar accrual accounting methods used in
both countries (Champoux, 2006).
2/ Private investment, direct fee – the upfront payment of a fee directly to the university by those who
cannot access a fee loan.
3/ Fee loan subsidy – this refer to the subsidy on fee loans that arises from the cost of borrowing
including non-repayment (for various reasons) and, in Australia’s case, interest rate subsidy. In England,
the loan subsidy or ‘RAB charge’9 is now estimated at 45% even without an interest rate subsidy10.
Generous terms and conditions for repayment alongside high loan value have seen the RAB charge rise
significantly under the new system. In Australia, HECS-HELP carries a subsidy of around 25%, which
includes an interest rate subsidy. On the FEE-HELP side the subsidy is virtually zero for undergraduates
(because of the surcharge) and around 25% for postgraduates.
4/ Direct Government funding for teaching – in Australia, this is called ‘base funding’ or Commonwealth
funding and accounts for an average of 60% of course cost alongside a subsidised student contribution
(HECS-HELP) but with the proportion varying considerably by subject. Most undergraduates are on these
subsidised or commonwealth places, as are 40% of postgraduate students. Other programmes do not
receive base funding (similar to England). In England the £9,000 fee has entirely replaced direct funding
for teaching (HEFCE ‘T’) on most undergraduate programmes. High cost subjects (over £9,000) receive
funding, as do some postgraduate courses, although the latter is being reduced over time. In England
there is also a Student Opportunity Fund (similar to a pupil premium) that goes some way towards the
additional cost of supporting non-traditional students to succeed, including into employment.
5/ Direct Government funding for capital – investment in teaching capital is an essential part of both
maintaining and improving facilities designed to support learning in universities. Before 2012, the English
and Australian Governments provided direct investment for capital as a separate strand alongside
teaching funding. As part of the reforms in 2012-13, England stopped providing this funding – or more
accurately, as with direct funding for teaching, this was re-directed into higher loan subsidy. The intention
was for universities to invest in capital from fee income, which they are doing. Interestingly, England has
just announced a new, small pot of teaching capital funds that will be distributed on a formula basis – a
creep back towards the old system perhaps.
From the perspective of the university, all streams of funding come from the Government, not the
student, with the exception of upfront fees paid (number 2). In the case of English fee loans, the money
goes through the Student Loan Company (SLC) to the university.
9 Resource Accounting and Budgeting charge, based on the use of accrual accounting methods.
10 House of Commons, March 2014
http://www.publications.parliament.uk/pa/cm201314/cmhansrd/cm140320/text/140320w0002.htm#140320w0002.htm_wqn21
16
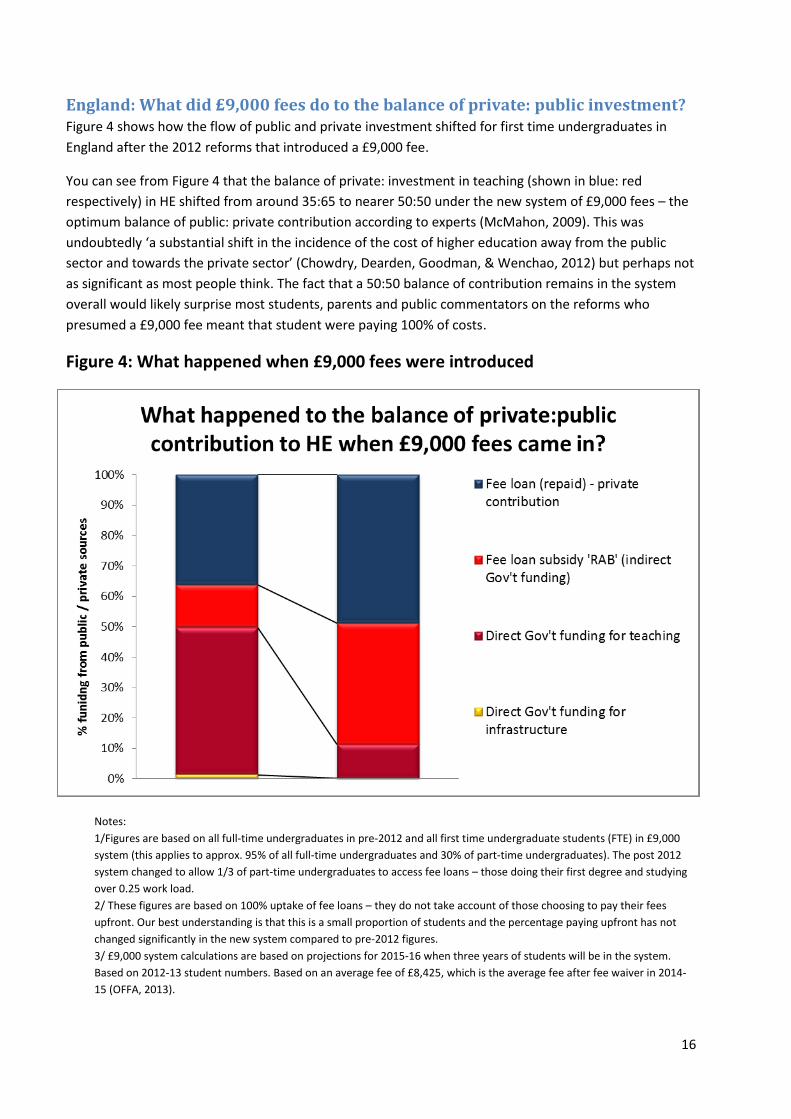
England: What did £9,000 fees do to the balance of private: public investment? Figure 4 shows how the flow of public and private investment shifted for first time undergraduates in
England after the 2012 reforms that introduced a £9,000 fee.
You can see from Figure 4 that the balance of private: investment in teaching (shown in blue: red
respectively) in HE shifted from around 35:65 to nearer 50:50 under the new system of £9,000 fees – the
optimum balance of public: private contribution according to experts (McMahon, 2009). This was
undoubtedly ‘a substantial shift in the incidence of the cost of higher education away from the public
sector and towards the private sector’ (Chowdry, Dearden, Goodman, & Wenchao, 2012) but perhaps not
as significant as most people think. The fact that a 50:50 balance of contribution remains in the system
overall would likely surprise most students, parents and public commentators on the reforms who
presumed a £9,000 fee meant that student were paying 100% of costs.
Figure 4: What happened when £9,000 fees were introduced
Notes:
1/Figures are based on all full-time undergraduates in pre-2012 and all first time undergraduate students (FTE) in £9,000
system (this applies to approx. 95% of all full-time undergraduates and 30% of part-time undergraduates). The post 2012
system changed to allow 1/3 of part-time undergraduates to access fee loans – those doing their first degree and studying
over 0.25 work load.
2/ These figures are based on 100% uptake of fee loans – they do not take account of those choosing to pay their fees
upfront. Our best understanding is that this is a small proportion of students and the percentage paying upfront has not
changed significantly in the new system compared to pre-2012 figures.
3/ £9,000 system calculations are based on projections for 2015-16 when three years of students will be in the system.
Based on 2012-13 student numbers. Based on an average fee of £8,425, which is the average fee after fee waiver in 2014-
15 (OFFA, 2013).

17
4/Figures based on a 28% RAB charge in the pre-2012 system (BIS, 2012) and 45% RAB charge in the £9,000 system (House
of Commons, March 2014
http://www.publications.parliament.uk/pa/cm201314/cmhansrd/cm140320/text/140320w0002.htm#140320w0002.htm_wqn21).
Sources: Higher Education Statistics Agency (HESA) figures for student numbers. HEFCE figures for public funding (HEFCE,
2013).
The lack of understanding of the new system is largely due to the fact that the considerable fee loan
subsidy is not well understood. The subsidy on fee loans are largely invisible to the ‘user’ in the
system, which means the public investment is invisible also. The high ‘sticker price’ of £9,000 leads
most students to assume they are paying the full cost of their course and, in turn, we are seeing their
behaviour and ‘customer demands’ shifting to reflect this. Whilst it is good to give students more of
a say in a higher education system based on co-production of learning, the lack of transparency in
the system is unhelpful. The idea of a social contract between the student, university and
Government has largely been lost – and this is despite a 50:50 share of costs. Perhaps this is just a PR
issue and potentially resolvable but there is something significant about the invisible nature of loan
subsidies that is fundamentally at odds with a more transparent funding system.
3/ It is actually the English system that is closer to achieving the optimum level of 50:50 public: private share of contribution overall. The lack of transparency in the English system, however, means that there is almost zero public awareness of this balance of contribution, with most students assuming they are paying the full cost of their studies at £9,000.
The second thing to notice from Figure 4 is the massive shift within the streams of public investment
(shown in shades of red). You can see clearly how direct funding for teaching has been almost
entirely substituted by loan subsidy, with some held back for high cost subjects and high cost
students (through the SOF fund). You can also see that capital funding for teaching was removed.
Higher fees were matched by cuts in direct funding for teaching (100% in most subjects), which
meant that universities did not see a significant rise in funding or resource.
What Figure 4 does not show you, because it is based on percentages, is the total resource going to
universities as a whole. Despite the trebling of fees to £9,000, the total resource going to universities
only slightly increased in 2012-13. It is projected to continue to increase gradually over time in line
with previous increases, largely driven by an expanding student population (UUK, 2013b, Figure 2.4).
The English university sector as a whole did, however, avoid any serious decline in resource during a
time when other non-protected areas were being cut. Individual universities experienced significant
cuts in funding due to policy interventions11 but overall levels of funding were successfully protected
whilst delivering a saving to the public purse.
Transferring public investment from core teaching funding to loan subsidy does, in theory, allow
greater total resources to flow into the system overall. Again, however, the English experience
teaches us that you cannot assume that any savings derived from transfer of funds between direct
public investment and loan subsidy will flow to the universities rather than make up savings for
Government. This is inevitably a political decision about whether any savings go to increase the HE
11
Namely ‘Core and Margin’ and ‘AAB’. See HEPI reports on the impact of 2012 reforms for further explanation of the impact of these policies.
18
budget or to other Government priorities, including just budget saving or deficit reduction in
England.
4/ The important lesson here for those in Australia who are looking to liberalise fees for the purpose of raising funding to universities is that the trebling of fees to £9,000 in England did not bring in much additional resource to English universities overall – and brought reductions for some. The Australian HECS-HELP fee loan carries a Government subsidy, so the same logic is likely to apply. The English experience suggests that any increase in the cost of public loan subsidy is likely to result in a matched reduction in core public funding for teaching. Those in Australia who are seeking to raise or fully liberalise the fee level should be wary of the consequence for their base funding.
How does the private: public balance of investment compare? Figure 5 shows that overall, the balance of private: public investment in HE across the two systems in
not that different even with much higher fees in England. For first time undergraduate students in
England, the private contribution is around 50% (shown in blue), whereas in Australia, for those who
are on state-supported places (including a subsidised HECS-HELP loan), the private contribution is
around 35% overall. It is the difference in type of public investment that is perhaps more interesting.
For Australia, if you take just the private contribution (blue) and direct funding for teaching (mauve),
the balance of investment is about 40:60 respectively. There is then a relatively moderate subsidy of
loans (public investment shown in red) of around 25%. By contrast England channels just 10% of
overall investment through direct funding for teaching choosing to invest it via loan subsidy instead.
The result is that the vast majority of funding flows via the student, with a high ‘sticker price’ of
£9,000 that carries a heavy loan subsidy. Whilst the subsidy is highly progressive, it is certainly much
less transparent than the Australian approach where there is a stronger sense of social contract and
understanding of shared investment from the individual and Government.
5/ Given public reaction to £9,000 fees in England, including student riots, the lesson here for England might be that direct funding for teaching is a more transparent method of public investment in HE that can more easily facilitate a social contract based on a practical demonstration of shared investment.

19
Figure 5: balance of public: private investment very similar across system
Notes:
1/Figures are based on same estimates and sources as Figure 4 for the English £9,000 system students (first column).
2/ Figures for ‘other UK students’ are based post-graduates and 2/3 of part-time students. Public investment and fee
income from (HEFCE, 2013).
3/Australia figures based on (Norton, 2013) and information from DIISRTE, now the Department of Education.
4/ HECS-HELP, Australia refers to students on state-supported programmes; this is most undergraduates and 40% of
postgraduates
5/ UG FEE-HELP, Australia refers to undergraduate FEE-HELP that carries virtually no fee loan subsidy.
6/ PG FEE-HELP, Australia refers to postgraduate FEE-HELP (available to the 60% of postgraduate students not on state-
supported programmes) that does carry a modest subsidy. The overall subsidy for all loans is around 25% so we have
estimated a slightly lower subsidy of 20% for postgraduate loans based on their higher earnings.
The other, really interesting observation from Figure 5 relates to the second two bars – the balance
of public: private investment for students who don’t attract public fee loans in England and don’t
attract subsidised HECS-HELP loans in Australia. What is fascinating is that in both systems, the
balance of contribution is remarkably similar. Both countries have created significant parts of the HE
system that carry virtually no public investment. This is an important (and often under recognised)
part of any HE market where public investment is selectively invested in priority areas. It has the
advantage of creating a genuine market in part of the HE system – in both countries this part of the
HE system has no fee control or number control. It is a genuine market that operates successfully.
The big difference of course, is that Australia has achieved this whilst still offering a FEE-HELP loan to
every student in this part of the system. In England, there is a much bigger divide between these two
systems from the perspective of the student because if you’re on this side of the system you cannot
access a fee loan – you’ve got to find the money to cover the upfront cost of learning yourself. This
opportunity for England to learn from Australia has already been mentioned.

20
The structure of the Australian system in more detail In 2005, following the Crossroads Review, the Australian Government increased fees by 25%. HECS-
HELP maximums have now reached $6,044 - $10,085 in 2014 (around £3,500 to £5,850), depending
on course (around 40% of the cost of provision across the system as a whole but with significant
variation by subject). These HECS-HELP maximums apply to both undergraduate and the 40% of
postgraduate courses that receive state-support. They also made a really important, and in my view
very intelligent, change to the student finance system. Alongside the mainstream publicly-subsidised
system that we would recognise with fee caps, student number controls, high levels of regulation
and with HECS-HELP loans (subsidised fee loans repaid on an income-contingent basis), they
introduced FEE-HELP to ensure that fee loans were available right across the HE system. In the more
marketised system there are no fee caps and no student number controls (similar to the English
market for postgraduate and most part-time students) but there are fee loans. Undergraduate FEE-
HELP loans carry a 25% surcharge that, in effect, covers the cost of loan subsidy and non-repayment
to Government. In effect, undergraduate FEE-HELP is a Government-backed income-contingent loan
system that carries virtually no public subsidy.
The other really significant change facilitated by creating a non-subsidised FEE-HELP loan was to
introduce a lifetime loan allocation to support re-skilling and lifelong learning. Given what we know
about the way people are working now (Hackett, Shutt, & Maclachlan, 2013), and will work in the
future, this has to be a progressive step forward for their higher education system.
6/ The Australian model of a lifetime loan allocation for their FEE-HELP loan system is an important and progressive step towards a more flexible, market-driven system that England should learn from.
Over the first 4 years or so, the more marketised FEE-HELP system developed alongside the
mainstream HECS-HELP system to absorb excess demand for UG (as well as delivering the majority of
PG) to a position where in 2011, around 10% of undergraduates had FEE-HELP rather than HECS-
HELP loans enabling increased undergraduate enrolment at virtually zero cost to Government. In
2012, the Australian Government removed controls on student numbers in the subsidised HECS-
HELP side which, unsurprisingly, saw much faster growth of student enrolment in the mainstream,
subsidised system at the expense of undergraduate FEE-HELP enrolments. The pros and cons of
adopting this ‘demand driven’ policy will be considered later but the principle and structure of the
2005 system was established and tested and England can learn important lessons from this.
7/ Given the Government’s commitment to increasing market forces in higher education in England, it is helpful to observe the Australian system in this regard. The Australian system benefits from operating publicly-supported higher education alongside a more marketised system that carries little or no public subsidy; and yet still offers fee loans to nearly all students.
There were some issues that arose under this system before 2012 when ‘demand driven’ was
introduced fully, however, that should be carefully considered. One major concern was with the
allocation of limited, subsidised HECS-HELP places. It sounds great that excess demand can be
soaked up on the FEE-HELP side but in reality, universities still had to make the same difficult choice

21
about how to ration the publicly-subsidised places before number controls were fully removed in
2012. Given that the stubborn correlation between family background and attainment at school level
is just as prevalent in Australia as it is in England, a purely meritocratic approach based on ATAR
entry score would have resulted in students from the most affluent backgrounds taking up the vast
majority of subsidised places, which seems far from ideal. Of course a FEE-HELP place is better than
an offer of no place at all in a world where public investment has to be limited at some point but it is
not clear that past academic record alone was going to provide the most effective rationing of public
investment. Before this could really be tested, the Government announced a ‘demand driven’
approach that would remove the cap on subsidised HECS-HELP places. Nevertheless, these
observations remain challenging for anyone proposing that a FEE-HELP style model could be used to
soak up excess demand for university places. Not unresolvable but challenging.
22
Chapter 3/ Public v. private universities in the two systems
The increase in alternative providers of higher education is an important component of a healthy,
diverse system that is constantly adapting to meet the changing needs of an evolving labour market
and society. Historically, the two systems have distinguished between ‘public’ and ‘private’
institutions in similar ways, based on the principle that private for-profit universities should not
receive public investment. The introduction of fee loans – or more importantly fee loans that carry
public subsidy – alongside the diversification of providers, including the growth of private for-profit
providers, has made this issue more complicated in both countries.
Before looking at this issue further, we need to remind ourselves that all ‘public’ universities are
actually autonomous, private, charitable organisations that receive public income. They are often
referred to as ‘public’ institutions because of their long-standing commitment to delivering, and
having concern for, the ‘public good’. The success of both the English and Australian university
systems are in large part predicated on the institutional autonomy of our universities so it is
important to remember this detail.
There is also an important distinction to make between private not-for-profit and the rise of the new
for-profit institutions in the higher education market. The former have existed, albeit on a limited
basis, for a long time in the UK and may indeed have elements of the ‘public good’ in their
objectives. By contrast, for-profit universities are, by definition, driven by delivering a profitable
product to market and are very unlikely to be concerned about the wider public good. For-profit
universities will no doubt gain a growing share of the higher education market in both countries in
future years. The question I would like to examine is how well the funding and regulatory systems in
England and Australia are able to manage the growth of for-profit providers in a way that maximises
the positives (choice, diversity, quality) and minimises the risks (fraudulent or exploitative providers,
low-quality provision, high dropout). There are lessons to be learnt from both systems.
Treatment of for-profit providers in the English and Australian systems Historically, the Higher Education Funding Council for England (HEFCE) has been explicit in
constraining HE funding to ensure that public investment in higher education does not go to for-
profit providers. The 2012 reforms and the introduction of £9,000 fees have shifted the landscape
for for-profit providers. Alternative providers (APs) currently have a lower tuition loan cap of £6,000.
When you consider that these fee loans carry a significant public subsidy, this is a major shift in the
flow of public investment in HE in England.
The shift of funding away from direct public investment in teaching toward fee loan subsidy has
resulted in a (perhaps) unintended redirection of public subsidy into for-profit providers at present.
Possibly due to the very small numbers involved or the lack of awareness about the public subsidy of
fee loans, this has not registered in public debate so far but it does, and still could, raise some
interesting issues. Because the Australian model provides the option of an undergraduate FEE-HELP
loan that carries almost no subsidy, it offers an obvious solution to this issue whereby students at
for-profit providers have access to FEE-HELP but not to subsidised HECS-HELP loans.
The Australian approach carries obvious lessons for England in providing clarity of allocation of public
investment whilst still providing fee loans to all students. It is interesting to recognise, however, that

23
there is growing pressure from for-profit providers in Australia to allow their students access to the
subsidised HECS-HELP loans. It is, therefore, possible that Australia might move closer to the English
system on this issue rather than the other way around. The public-political discourse on this issue is
likely to decide the outcome in both countries, although England doesn’t have an alternative loan
offer as things stand at present.
Funding on the basis of retention One string in the bow of the English system that the Australians might do well to consider is a
funding system that is more responsive to retention. In England’s pre-2012 funding system, the
HEFCE funding methodology ensured that funding was on the basis of completion of that year of
study, with adjustments made for any students that dropped out throughout the year. Whilst this
had to be changed with a shift to fee-based funding, England sensibly preserved the principle and
ensured that fee loans are paid to universities at three points throughout the year – allowing funding
to be withheld for any students that have dropped out. By contrast, in Australia, funding – base
funding and fee loan income – is received in one instalment. More precisely, funding is received on
the basis of those students who remain enrolled at the census date, which is no more than 20% of
the way through the unit. The Australian Government does adjust base funding according to
information collected on the census date. Nevertheless there is considerable scope to increase the
responsiveness of funding to retention in Australia.
England has a hard wired disincentive for fraudulent activity by rogue providers. Whilst this has not
been a major issue in the Australian higher education system recently, it has been a concern in the
further education (FE) or VET (vocational education and training) sector with the unwelcome activity
of some rogue RTOs (Registered Training Organisations). Funding on the basis of retention also
provides more options for managing rising rates of non-completion or drop-out – something that
might be more relevant to the Australian HE sector in an era of ‘demand driven’ expansion with
declining ATAR12 entry scores perhaps.
8/ For England, possibly the most important lessons can be learnt from the undergraduate FEE-HELP loan design in particular; a Government fee loan system that carries little or no public subsidy. And for Australia, some considerations about the benefits of a funding system that is more responsive to retention.
12
Australian Tertiary Admission Rank (ATAR). The ATAR is a percentile score up to 99.95 which denotes a student’s rank relative to their peers in their final school assessment.

24
Chapter 4/ Design of fee loans
“An important principle of a well-designed loan system is that the loan is repaid, in full, by the
majority of borrowers” Nicholas Barr, 2013.
Arguably, this principle has been forgotten, at least by England.
One of the motivating factors of undertaking this study was to get to the bottom of something that
puzzled me – why is it that the Australian Government and officials and even their Treasury are so
relaxed about the amount of fee loans going out in an expanding system? They are certainly not
relaxed about the growing cost of ‘base funding’ or Commonwealth funding (direct funding for
teaching) so why are they so relaxed about loans? In the context of growing concerns about the
escalating subsidy of fee loans (or ‘RAB charge’) in England, you can understand why this was of
particular interest. It is in large part related to the overall system design already described in Chapter
2 but it is also related to the loan design in Australia, which we shall look at in detail in this section.
As well as his first principle about full repayment in the quote above, Nicholas Barr has also argued
that a well-designed loan system should protect low earners and achieve progressive repayments on
an income-contingent basis. Whilst both systems achieve well on these counts, they do much less
well on the first principle of full repayment by most borrowers.
This principle of full repayment is therefore an important challenge for the design of the fee loan
system in both countries but perhaps more so in England where public subsidy is close to 45%13, the
average repayment period is over 26 years and where over 60% of graduates are predicted to
benefit from the write off of loans after 30 years. In Australia, HECS-HELP loans do carry a public
subsidy but it is a much lower figure of around 25% (similar to the 28% RAB charge of the pre-2012
English system) with an average repayment period of just 8 years. FEE-HELP loans stand out as
passing this repayment test for a well-designed loan system – they get paid back in full by the cohort
as a whole (if not every individual). Undergraduate FEE-HELP loans carry virtually no public subsidy
due to the surcharge added on graduation and also carry a relatively short repayment period despite
maintaining a high earning threshold and progressive repayment structure.
Understanding how differences in the design of the loan and repayment systems create these
different outcomes deserves further investigation but, first, let us consider what we mean by an
income-contingent loan.
Understanding income contingent loans In a small higher education (HE) system it is feasible, albeit highly regressive, for the government, in
other words the taxpayer, to fund higher education in full (Barr, 2010). In countries like England and
Australia, however, where there is mass higher education alongside a political consensus to limit tax
increases, it is necessary to bring in private finance of some sort. Assuming most governments would
share the broad objectives of seeking to improve quality, access, expansion and control of public
expenditure, there are two big questions for any government about higher education: how to bring
13
House of Commons, March 2014 http://www.publications.parliament.uk/pa/cm201314/cmhansrd/cm140320/text/140320w0002.htm#140320w0002.htm_wqn21
25
in private investment and; how to distribute the remaining, significant public investment to best
achieve these objectives.
Income-contingent loans (ICLs) are a method of bringing private finance into higher education and,
therefore, relate primarily to the first question but the loan design will have implications for the
second. ICLs facilitate private contribution without requiring upfront payment, providing a
mechanism for consumption smoothing whilst protecting access to HE. ICLs also solve the difficult
question of how to facilitate loans for human capital formation given the obvious lack of physical
collateral (Freedman, 1955) (Barr N. , 2001) (Chapman, 2004). In effect, the Government offers the
student an upfront loan to cover the cost of a ‘fee’ or ‘contribution’ and, in the case of England, an
additional loan to help with living costs, which the graduate then starts to repay as a percentage of
their salary once they cross a specified earnings threshold. In both countries, this repayment is
automatically deducted from the graduate’s salary through the central system for income tax
payments.
As well as establishing the feasibility and suitability of income contingent loans in higher education in
the first place (Barr, 1989), (Barr, 2001), (Chapman, 2011), Barr and Chapman have also debated the
case for real interest rates (Barr & Johnston, 2010), (Chapman, 2011), (Johnston & Barr, 2013). They
have also both examined other applications for income-contingent loans – either in different
countries (Barr, et al., 2009) (Armstrong & Chapman, 2011) (Chapman & Sinning, 2011) or, in
Chapman’s case, different public policy areas such as extended parental leave (Chapman & Hunter,
2009) (Chapman & Higgins, 2009) (Chapman, Higgins, & Withers, 2009).
The main benefits of an income contingent loan system are:
Everyone can afford HE at point of entry (discarding issues of living cost)
Government carries the financial risk, not the individual – i.e. low earners are protected
The impact on demand for HE of any fee increase will necessarily be muted because of the
nature of ICLs – designed to minimise the effect of upfront ‘fee’ level on demand for HE
International research has repeatedly demonstrated a relatively low price elasticity of demand for
higher education (Dynarski, 1994) although it is important to recognise that ‘students from more
disadvantaged backgrounds are more sensitive to net price changes’ (Santiago, 2008). IFS has
demonstrated that “increasing fees without increasing loans and/or grants by the same value or
more will result in a negative impact on participation” (IFS, 2010). Income contingent fee loans are
therefore essential to ensuring that an increase in fees does not flatten demand over time –
particularly for students from low-participation backgrounds. For a more in depth review of these
issues and consideration of this research, please see the University Alliance report ‘The impact of
fees; a review of the evidence’ (Aston & Shutt, 2010).
This chapter does not compare the extent to which ICLs have facilitated a ‘market’ in HE based on
fees – precisely because they are designed to flatten the effect of fees on demand, this is not a
particularly illuminating question to apply to ICLs. This chapter will not look at the impact of ICLs on
‘choice’ – again because ICLs are specifically designed to enable individuals to afford any course up
front and any career choice after graduating because the income contingent nature protects low
earners. Whether individuals are making rational choices is more about the question of information,
advice and guidance about how ICLs work rather than the mechanism itself. The dependence of the
26
success of ICLs on good understanding of how they work is something that justifies further
investigation or separate research.
Income-contingent loans have been chosen by both countries as a mechanism for increasing private
investment in HE. The particular design of the loan and repayment system has varied across the two
countries and across different Governments. These differences allow us to observe the impact of
design changes.
The English and Australian loan system in detail: understanding HECS-HELP
and FEE-HELP Figure 6 below gives a summary of both HECS-HELP and FEE-HELP in comparison to the English
system. HECS-HELP is the subsidised fee loan available to most undergraduate students and 40% of
postgraduates in Australia. There are HECS-HELP maximums or controls because this is part of the
mainstream, subsidised system and these courses / students also attract ‘base funding’ – which is
direct funding for teaching (see Figure 5). There are three HECS-HELP maximum levels between
$6,044 and $10,085 (about £3,505 to £5,849) depending on course (see Chapter 6 for more detail
and Annex 1 for a full list of contributions by subject). The ratio of HECS-HELP to base funding,
currently stands at about 40:60 overall but varies significantly by subject (see Figure 7). The level of
base funding and HECS-HELP is the same for both undergraduate and the 40% of postgraduate
courses that attract state support, based on subject.
FEE-HELP is a Government loan available to any student that cannot access a subsidised place which
comes with a subsidised HECS-HELP loan, whether at undergraduate or postgraduate level. In 2012-
13 around 75,000, 17% of all places, were FEE-HELP places (undergraduate and postgraduate); a
significant proportion of the overall system14. The fee charged by the HE provider is not limited and
will usually cover 100% of cost (fees are set according to both cost and market value). There is a
lifetime loan allocation of $96,000 (about £56,000) to allow students to re-train and re-skill
throughout their lifetime.
FEE-HELP is slightly different for postgraduate and undergraduate students. Undergraduate FEE-HELP
loans carry a surcharge of 25% (not for postgraduate FEE-HELP). The surcharge gets added to the
total loan value. In effect, this covers the Government’s cost of borrowing and any non-repayment
and means that the loan is virtually non-subsidised. This has created a fee loan system, with a
lifetime loan allocation, that carries virtually no cost to Government. Undergraduate FEE-HELP is
proof that a non-subsidised Government loan system is achievable.
Income contingent loans for postgraduates were first introduced in 2002 as the Postgraduate
Education Loans Scheme (PELS). They were the first extension of income contingent loans to full fee
paying places, though restricted to public universities at that time, and so the Government didn't
impose a loan fee. Postgraduate FEE-HELP replaced PELS in 2005. Access was extended to students
at alternative providers but the policy of subsidising postgraduate loans (or not applying a surcharge
to these loans) continued.
14
http://www.aph.gov.au/About_Parliament/Parliamentary_Departments/Parliamentary_Library/pubs/rp/rp1314/QG/HELP
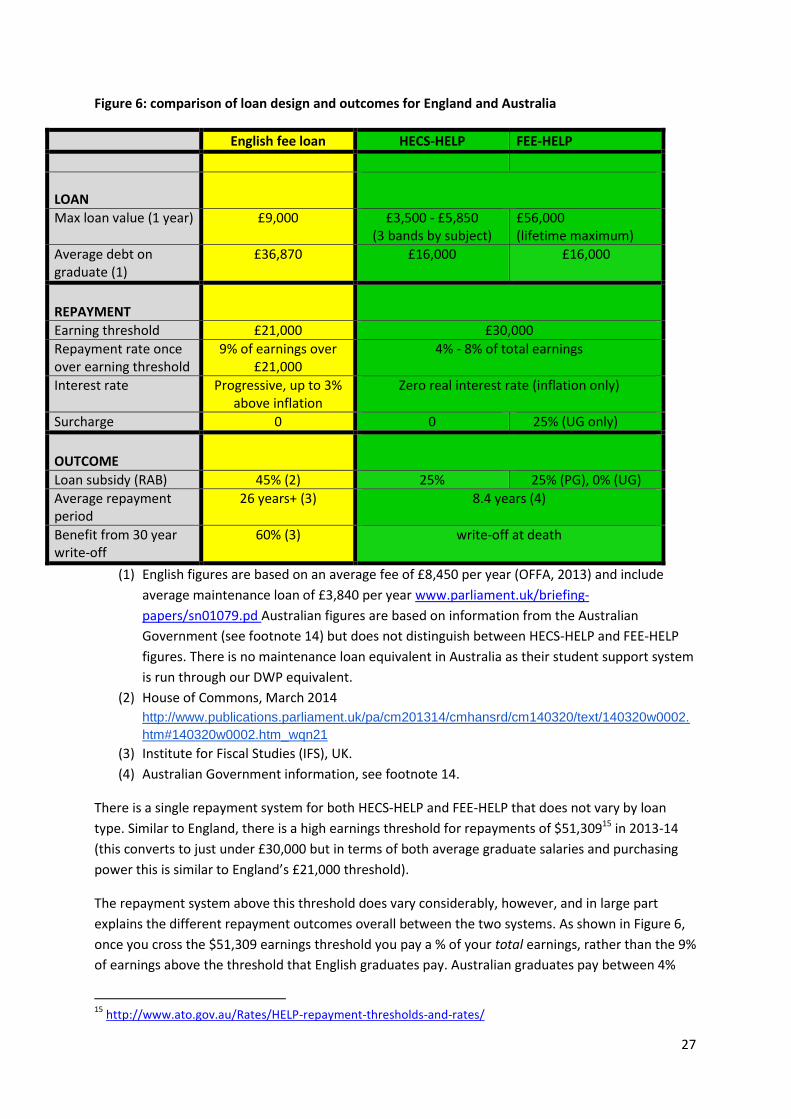
27
Figure 6: comparison of loan design and outcomes for England and Australia
English fee loan HECS-HELP FEE-HELP
LOAN
Max loan value (1 year) £9,000 £3,500 - £5,850 (3 bands by subject)
£56,000 (lifetime maximum)
Average debt on graduate (1)
£36,870 £16,000 £16,000
REPAYMENT
Earning threshold £21,000 £30,000
Repayment rate once over earning threshold
9% of earnings over £21,000
4% - 8% of total earnings
Interest rate Progressive, up to 3% above inflation
Zero real interest rate (inflation only)
Surcharge 0 0 25% (UG only)
OUTCOME
Loan subsidy (RAB) 45% (2) 25% 25% (PG), 0% (UG)
Average repayment period
26 years+ (3) 8.4 years (4)
Benefit from 30 year write-off
60% (3) write-off at death
(1) English figures are based on an average fee of £8,450 per year (OFFA, 2013) and include
average maintenance loan of £3,840 per year www.parliament.uk/briefing-
papers/sn01079.pd Australian figures are based on information from the Australian
Government (see footnote 14) but does not distinguish between HECS-HELP and FEE-HELP
figures. There is no maintenance loan equivalent in Australia as their student support system
is run through our DWP equivalent.
(2) House of Commons, March 2014
http://www.publications.parliament.uk/pa/cm201314/cmhansrd/cm140320/text/140320w0002.
htm#140320w0002.htm_wqn21
(3) Institute for Fiscal Studies (IFS), UK.
(4) Australian Government information, see footnote 14.
There is a single repayment system for both HECS-HELP and FEE-HELP that does not vary by loan
type. Similar to England, there is a high earnings threshold for repayments of $51,30915 in 2013-14
(this converts to just under £30,000 but in terms of both average graduate salaries and purchasing
power this is similar to England’s £21,000 threshold).
The repayment system above this threshold does vary considerably, however, and in large part
explains the different repayment outcomes overall between the two systems. As shown in Figure 6,
once you cross the $51,309 earnings threshold you pay a % of your total earnings, rather than the 9%
of earnings above the threshold that English graduates pay. Australian graduates pay between 4%
15
http://www.ato.gov.au/Rates/HELP-repayment-thresholds-and-rates/

28
and 8% of their total earnings once they are over the threshold. In effect, Australian graduates make
larger contributions once they cross the earnings threshold and pay back much faster as a result.
As an example, a graduate earning £30,000 in Australia would pay £125 a month compared to just
£67.30 in England. These higher repayment rates, alongside a lower overall debt value and no real
interest rate, explain why an Australian student will pay off their loan in an average of 8.4 years
compared to 26 years in England.
The Australian system is equally progressive across the system as a whole but tougher on those just
above the threshold in order to achieve shorter repayment terms. Arguably, at just £7.50 a week
contributions on earnings of £25,000, English graduates could afford to pay more to reduce their
loan value faster but that is ultimately a political judgement.
9/ For English observers that are concerned about the 45% public subsidy on student loans, a vital lesson is that it is not better employment prospects that are allowing Australian graduates to pay back their loans faster (8 years on average, compared to our 26 year); it is lower debt levels and a better designed repayment system – something England needs to learn from.
10/ The Australian system is distinct in having a tougher, shorter repayment period once over the earnings threshold. For most graduates, this means an effective – and still affordable - means of getting their loan paid off in full before they reach 30. It also means a lower level of public subsidy (or RAB) on student loans for the Government.
So what does this mean for the outcomes of the loan system? Figure 6 lists the four factors in the design of a loan system: earnings threshold for repayment;
repayment rate over earnings threshold; interest rate; and surcharge. Alongside the total debt value
of the graduate, it is these factors that affect the outcome of the loan design for both graduates (for
repayments) and Government (for subsidies / cost).
In England, it is the combination of a high debt value alongside a relatively high earnings threshold
and low contribution requirements over the earnings threshold that result in the long average
repayment period of 26 years and high subsidy cost to Government (45% RAB charge) as shown in
Figure 6. The real interest rate is a progressive tool for gaining higher repayment from high earners
but, in combination with other factors, is not enough to significantly reduce the Government
subsidy. With over 60% of graduates benefiting from the 30-year write-off of debt, this is not
surprising.
By contrast, Australia has a zero real interest rate and manages a much faster 8 year average
repayment period. This is a result of much lower overall debt profiles on graduation alongside higher
repayments for graduates once they cross the earnings threshold. Interestingly, the earnings
threshold is equally high compared to England – higher in fact – but payments of 4% - 8% of total
earnings once you are over the threshold result in much higher contributions for nearly all than the
English method of 9% of earnings above the threshold.
The undergraduate FEE-HELP part of the system then adds a 25% surcharge on loans, which means
there is virtually no public subsidy on these loans. In a system where, before 2012, any excess
demand was taken up on the FEE-HELP side and these students carried zero public investment from

29
base funding and almost zero subsidy on loans, you can start to see why their Government is much
more relaxed about loans going out. With 100% of loan value for non-subsidised FEE-HELP loans
sitting on Government books as an asset thanks to accrual accounting method (the same accounting
method as used in England) and a much shorter average repayment period compared to England,
the picture becomes even clearer.
The removal of number controls in 2012 has confused this picture slightly but not entirely. Given that
HECS-HELP loans carry a relatively modest subsidy of around 25%, the Government is still more
concerned about the increased cost of base funding (60% of course cost) than about the loan debt.
11/ FEE-HELP loans have enabled the Australian Government to do two really important things that the English system is not able to afford: first, offer a fee loan to every student and second, offer a lifetime loan allocation; allowing students to re-enter the system and re-train throughout their career. This has to be the primary lesson to learn from the Australian system for England.

30
Chapter 5/ Student number controls
Understanding ‘demand driven’ policy in Australia This chapter provides the opportunity for a closer look at what has happened in Australia since their
student number cap for subsidised HECS-HELP entrants was removed in 2012. In very crude terms
their recent ‘demand driven’ policy resulted in a massive explosion of university enrolments. There
was a 23% growth in this part of the system in the four years from 2009-2013. This started before
2012 because the Government relaxed caps and providers started to expand in anticipation of the
change. This is an impressive level of expansion, particularly when you consider that participation
rates were by no means low before they lifted the cap. Expansion has started to plateau since 2013-
14, as you would expect, due to unmet demand being exhausted and the balance of supply and
demand coming into closer equilibrium.
One of the stated aims of the policy was to improve access for non-traditional students, including
those from rural communities. On these grounds, the policy has been of mixed success. While the
proportion of Indigenous Australian students has increased markedly, the proportion of students
from low socio economic status backgrounds has increased measurably but modestly, and the
proportions from rural and isolated backgrounds have continued their 15-year fall. Certainly there
are those in Australia that sign up to the stubbornly persistent opinion that ‘more equals worse’ but
the majority opinion seems to be that this growth has been positive for Australia. The questions it
has raised, quite rightly, relate to quality and outcomes (particularly employment outcomes) for
students. There are appropriate questions that warrant close investigation – particularly when we
know that the average entry score of university entrants has fallen to accommodate this expansion.
Another legitimate issue is the financing of such expansion. This particular expansion has come at
significant cost to the Federal Government in base funding, which is direct Government funding for
teaching. The cost has been estimated to be as high as $4bn Australian dollars (about £2.3bn) – way
above any anticipated projections. Again, there is little mention of the additional loan cost in
Australia – even though these are HECS-HELP loans that carry a modest public subsidy – but we now
have a better understanding of why that is (see Chapter 4). No doubt the Government was keen to
introduce more ‘market forces’ into HE but hadn’t quite anticipated how the regulated, subsidised,
quasi-market might react; a debate that is very much alive in England. With price controls still in
place there was a surge in enrolments, including possible substitution from FE at the sub-bachelor
level, and the big questions in Australia are now about quality and retention. A new conservative
Coalition Government was elected in September 2013 with an election promise of keeping the cap
off but this promise is being tested.
So the Australian example might suggest that England would have to weigh up improved access
against questions of quality and outcomes for students alongside increased cost? Well, increased
cost is inevitable in the English system when it comes to growth of undergraduates who can access a
fee loan but apparently this will be covered by the sale of historic loan books. I shall choose not to
get distracted by this issue because there are some more interesting insights to be gained on the
other side of the picture – quality, standards and the student experience.
31
Why England might fare differently following the removal of number
controls in 2015-16 There are a few small but significant differences in the English model that might mean the English
experience of quality and student outcomes will not be identical to that of its Australian cousins in
recent years, since adopting a ‘demand driven’ policy for subsidised HECS-HELP students.
First, and most importantly, the English system still funds on the basis of retention. The Australian
system does make adjustments for any changes in student numbers at the census date but it is
slightly less responsive to retention / drop out throughout the year – as mentioned in Chapter 3. In
the post-2012 £9,000 fee system in England, the fee loan that goes to the university via the Student
Loan Company (SLC) is distributed at three points across the year. If the student has dropped out at
any point during that year, the university stops receiving funding for that student.
This creates a significant difference in incentives and disincentives for providers in the system. The
English principle of funding based on retention creates a strong incentive for institutions to be even
more concerned about the success of their students. Of course the vast majority of Australian
universities share this concern without the need for funding incentives but there are always those
willing to exploit an opportunity if one opens up. The English system creates a strong disincentive for
rogue providers to set up, receive funding, and then close down or let down their student in a way
that the Australian system does not. The Australian system has high ‘minimum standard thresholds’
for entry to the market for new providers but it is less able to control the behaviour of existing
providers in quite the same way as England can with staggered funding points throughout the year.
Secondly, England has an established track record of regulating standards by co-regulation between
the universities themselves and the Quality Assurance Agency (QAA) as well as monitoring and
bench-marking retention rates through the HEFCE Performance Indicators. England also has better
(although by no means perfect) student information thanks to recent developments with the
National Student Survey (NSS) and now the Key Information Set (KIS). These give the Government in
England more tools to protect both students and standards in an expanding system.
Thirdly, the £9,000 fee is considerably higher than any fees for further education level qualifications
at FE colleges, which means that the substitution effect (students undertaking HE qualifications that
otherwise would have taken FE qualifications) would be much less likely to happen. High sticker
prices, even with fee loans available, mean that the removal of student number controls is much less
likely to persuade anyone considering FE in England to undertake an HE qualification as an
alternative.
Together, these three factors mean that the English experience is unlikely to have the same
experience of 23% growth over four years when student number controls are removed in 2015-16.
The wild card, however, is the recent growth of provision by for-profit providers, particularly at sub-
degree level (or ‘sub-bachelor’), whose students can now access subsidised fee loans (up to £6,000)
following the 2012 reforms. Depending on the treatment of these providers in a relatively untested
market, there may well be a very rapid expansion of growth in this area at cost to Government
through subsidised fee loans. The level of this possible growth is hard to project at this point but it
could be a very high percentage increase from a relatively low base. A lot will depend, therefore, on
the treatment of new providers – those without degree awarding powers – that are offering sub-
32
degree qualifications. These are likely to be offering qualifications to small numbers of student but
cumulatively could start to become significant (similar to Australian RTOs). For the alternative
providers that will benefit from the removal of student number controls16, the rate of growth could
be very high. Based on the current funding system in England, this will come with significant public
cost in terms of loan subsidy unless a non-subsidised fee loan (using the model of the Australian
undergraduate FEE-HELP loan) can be established in this part of the system before 2015-16, or very
shortly after.
In an ideal world, you would not choose to put tough number controls on new providers because this
goes against the principle of increased marketisation of the HE system, where choice and diversity is
thought to improve quality and reduce price. The risk, of course, is that the opposite happens – that
quality is harder to regulate, price actually increases and all of this happens at cost to the public
purse because fee loans are carrying a public subsidy. Without wanting to explore the likelihood of
either option in any depth I would just observe that the Australian model of a non-subsidised
undergraduate FEE-HELP loans seems to provide options that would massively reduce the risk to the
public purse.
12/ The English system already has levers in place to manage quality (funding on the basis of completion, robust retention measures, co-regulation of standards and student information) and price (fee controls). The lesson for England to learn is that a non-subsidised Government fee loan could facilitate the expansion of new providers and new types of provision without carrying considerable public subsidy. A FEE-HELP type approach would considerably reduce the risk to the public purse, whilst enabling for-profit providers to grow.
16
A growing issue in the English HE system is that, due to the lack of an HE Bill following the 2012 reforms, new for-profit providers currently do not have their numbers controlled in the way that established universities do. It is intended that in 2014-15 student number controls will start to apply to these providers. After 2015-16, the Government has said they will ‘replicate, as far as possible, for alternative providers, the arrangements for HEFCE funded institutions [i.e. the removal of number controls] but will retain controls for high risk providers.’ HEFCE grant letter from BIS, February 2014 http://www.hefce.ac.uk/news/newsarchive/2014/news85409.html
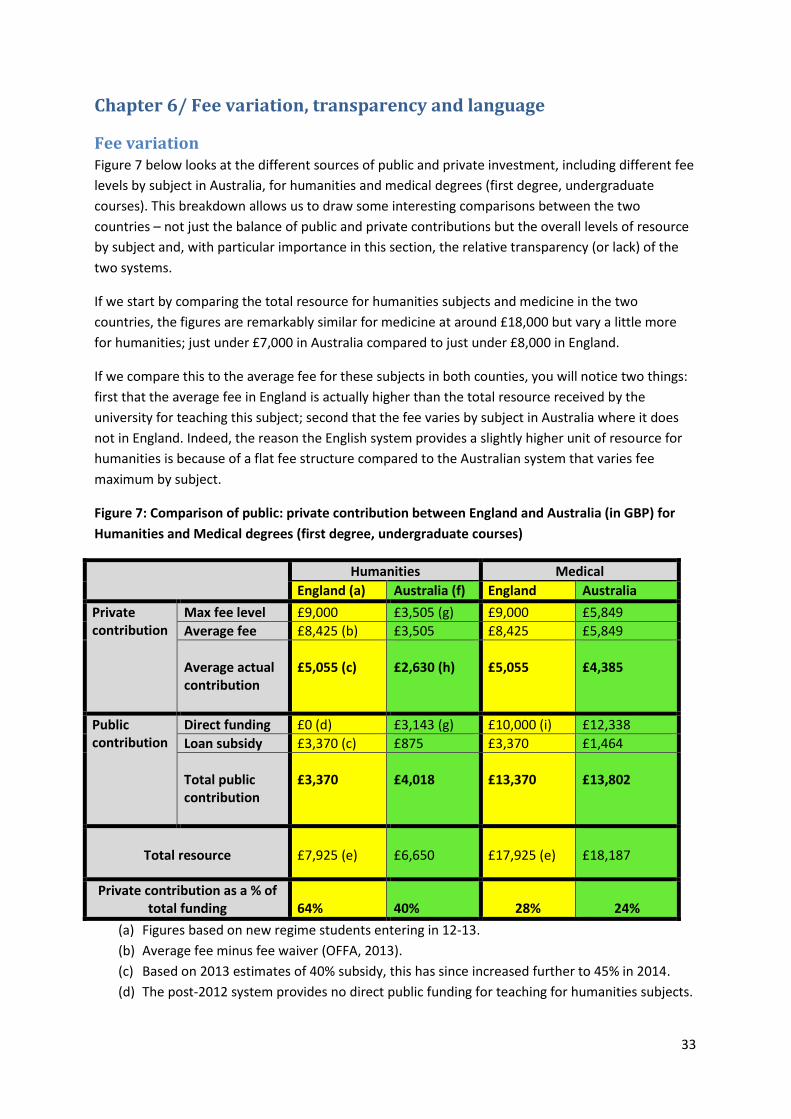
33
Chapter 6/ Fee variation, transparency and language
Fee variation Figure 7 below looks at the different sources of public and private investment, including different fee
levels by subject in Australia, for humanities and medical degrees (first degree, undergraduate
courses). This breakdown allows us to draw some interesting comparisons between the two
countries – not just the balance of public and private contributions but the overall levels of resource
by subject and, with particular importance in this section, the relative transparency (or lack) of the
two systems.
If we start by comparing the total resource for humanities subjects and medicine in the two
countries, the figures are remarkably similar for medicine at around £18,000 but vary a little more
for humanities; just under £7,000 in Australia compared to just under £8,000 in England.
If we compare this to the average fee for these subjects in both counties, you will notice two things:
first that the average fee in England is actually higher than the total resource received by the
university for teaching this subject; second that the fee varies by subject in Australia where it does
not in England. Indeed, the reason the English system provides a slightly higher unit of resource for
humanities is because of a flat fee structure compared to the Australian system that varies fee
maximum by subject.
Figure 7: Comparison of public: private contribution between England and Australia (in GBP) for
Humanities and Medical degrees (first degree, undergraduate courses)
Humanities Medical
England (a) Australia (f) England Australia
Private contribution
Max fee level £9,000 £3,505 (g) £9,000 £5,849
Average fee £8,425 (b) £3,505 £8,425 £5,849
Average actual contribution
£5,055 (c)
£2,630 (h)
£5,055
£4,385
Public contribution
Direct funding £0 (d) £3,143 (g) £10,000 (i) £12,338
Loan subsidy £3,370 (c) £875 £3,370 £1,464
Total public contribution
£3,370
£4,018
£13,370
£13,802
Total resource
£7,925 (e)
£6,650
£17,925 (e)
£18,187
Private contribution as a % of total funding
64%
40%
28%
24%
(a) Figures based on new regime students entering in 12-13.
(b) Average fee minus fee waiver (OFFA, 2013).
(c) Based on 2013 estimates of 40% subsidy, this has since increased further to 45% in 2014.
(d) The post-2012 system provides no direct public funding for teaching for humanities subjects.
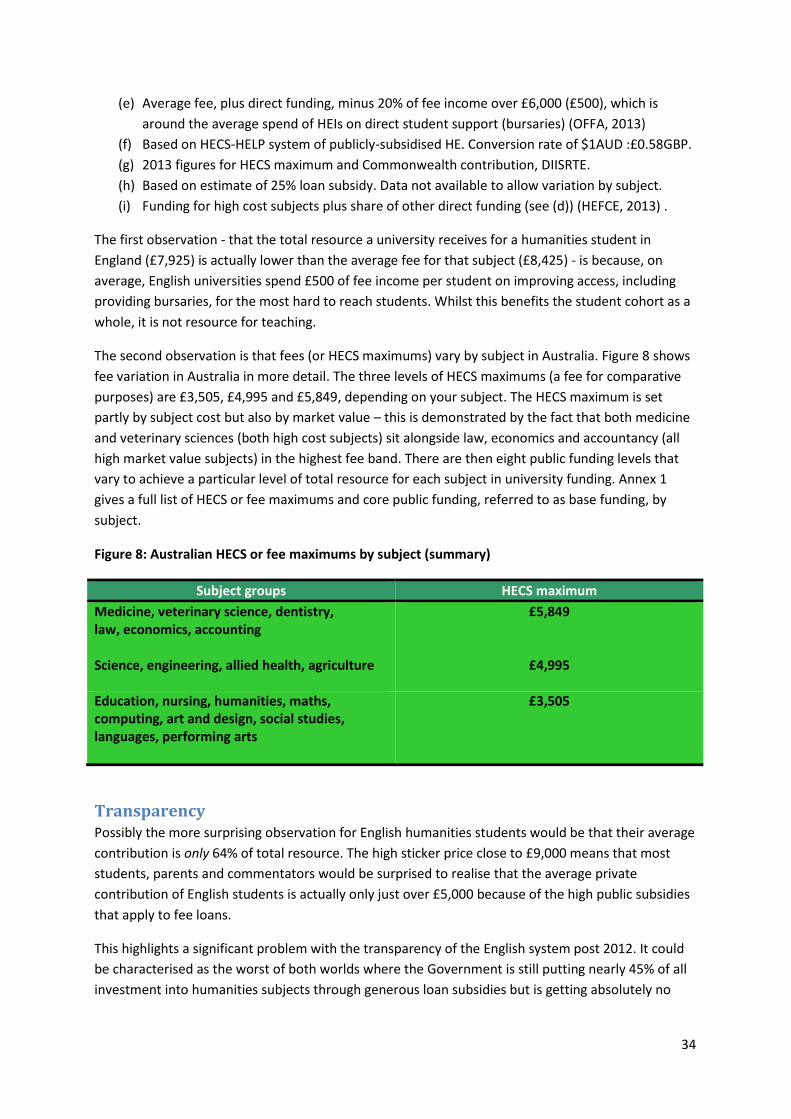
34
(e) Average fee, plus direct funding, minus 20% of fee income over £6,000 (£500), which is
around the average spend of HEIs on direct student support (bursaries) (OFFA, 2013)
(f) Based on HECS-HELP system of publicly-subsidised HE. Conversion rate of $1AUD :£0.58GBP.
(g) 2013 figures for HECS maximum and Commonwealth contribution, DIISRTE.
(h) Based on estimate of 25% loan subsidy. Data not available to allow variation by subject.
(i) Funding for high cost subjects plus share of other direct funding (see (d)) (HEFCE, 2013) .
The first observation - that the total resource a university receives for a humanities student in
England (£7,925) is actually lower than the average fee for that subject (£8,425) - is because, on
average, English universities spend £500 of fee income per student on improving access, including
providing bursaries, for the most hard to reach students. Whilst this benefits the student cohort as a
whole, it is not resource for teaching.
The second observation is that fees (or HECS maximums) vary by subject in Australia. Figure 8 shows
fee variation in Australia in more detail. The three levels of HECS maximums (a fee for comparative
purposes) are £3,505, £4,995 and £5,849, depending on your subject. The HECS maximum is set
partly by subject cost but also by market value – this is demonstrated by the fact that both medicine
and veterinary sciences (both high cost subjects) sit alongside law, economics and accountancy (all
high market value subjects) in the highest fee band. There are then eight public funding levels that
vary to achieve a particular level of total resource for each subject in university funding. Annex 1
gives a full list of HECS or fee maximums and core public funding, referred to as base funding, by
subject.
Figure 8: Australian HECS or fee maximums by subject (summary)
Subject groups HECS maximum
Medicine, veterinary science, dentistry, law, economics, accounting
£5,849
Science, engineering, allied health, agriculture
£4,995
Education, nursing, humanities, maths, computing, art and design, social studies, languages, performing arts
£3,505
Transparency Possibly the more surprising observation for English humanities students would be that their average
contribution is only 64% of total resource. The high sticker price close to £9,000 means that most
students, parents and commentators would be surprised to realise that the average private
contribution of English students is actually only just over £5,000 because of the high public subsidies
that apply to fee loans.
This highlights a significant problem with the transparency of the English system post 2012. It could
be characterised as the worst of both worlds where the Government is still putting nearly 45% of all
investment into humanities subjects through generous loan subsidies but is getting absolutely no
35
credit for doing so – quite the opposite in fact. Equally, students are convinced that they are paying
the full cost of their degree, which is far from the truth of the matter for the cohort as a whole.
Other interesting observations that Table 7 allows, is the fact that for medicine, the actual fee
contribution (not the sticker price but the average contribution when you discount subsidies) is very
similar between the two countries - £5,000 in England compared to £4,385 in Australia. The public
contribution to medicine is even closer at £13,370 and £13,802 in England and Australia respectively.
For humanities, again it is really interesting to observe that the public contribution is very similar at
£3,370 in England and £4,018 in Australia. Total resource for humanities is slightly higher in England
given the flat fee structure. This is particularly important to recognise in light of reaction to the 2012
reforms in England from those in the humanities as well as many public commentators. It was widely
reported that the Government was removing all funding for the humanities. This is an excellent
illustration of the problem the English Government has with transparency of its chosen approach to
move public investment away from direct funding for teaching and into fee subsidy. Yes, it is true
that there is no longer direct funding for teaching in the humanities in England but public investment
remains significant. Public investment in the humanities is not far off that in Australia where there is
still direct public funding for humanities teaching; and overall resource for the humanities is actually
higher in England than Australia. The problem the Government has in England is that fee subsidies
are not well understood – they are not transparent. The result is that students think they are paying
the full cost of humanities subjects and that Government are lambasted for pulling out all public
investment in the humanities – neither is true. Transparency, however, is a very real issue.
13/ The lesson for England here is that transparency matters in the funding system – particularly if you aim to build a social contract on the idea of a shared contribution towards the cost of gaining a degree.
Language Related to the issue of transparency, is the importance of the language used to describe the financial
system for students and parents. It is notable that Australia uses the language of HELP – the Higher
Education Loan Programme – and the public understanding of this system, broadly speaking, is that
this is about the Government providing ‘help’ for students to meet the cost of studying at the point
of purchase. HECS fees are called student contributions and direct funding is called the
Commonwealth contribution in official documents. In England, we are still using the language of
‘fees’ and ‘fee loans’ to describe exactly the same thing and we wonder why we get students rioting
and public discourse dominated by a debate of ‘fees’ and ‘debt’.
The Australians got this right from the start. While we were establishing the language of ‘fees’ and
then ‘top-up fees’ the Australians were establishing the language of the Higher Education
Contribution Scheme or ‘HECS’ in the public mind-set. The idea of HECS was that graduates made a
contribution towards the cost of gaining a degree. This has since evolved in Australia to HECS-HELP
and FEE-HELP – a shared language that is built on graduate contribution and Government help to
finance the upfront cost of your studies. Meanwhile, England was battling against public
misconception of the upfront cost fees and burdensome graduate debt. It is a fascinating contrast

36
when you realise that before 2012, these were almost identical systems with almost identical levels
of graduate contribution and Government support.
Of course, public reaction in 2012 was also to do with England trebling the graduate contribution or
‘fee’ from £3,000 to £9,000 and also to do with the lack of transparency in the system due to high
loan subsidies (a Government contribution) that go un-noticed and unrecognised, but surely we
would have stood a better chance of students understanding that this is about a shared cost with
both public and private contributions if we’d have used different language to describe the finance
system. A graduate contribution scheme, higher education contribution scheme (HECS) or a
Government HELP scheme (higher education loan programme) would surely have helped students to
understand that they would only be asked to make a contribution towards the cost of their degree
after they had graduated and were earning.
14/ The lesson for England here is that language matters in the funding system – particularly if you aim to build a social contract on the idea of a shared contribution towards the cost of gaining a degree.

37
Chapter 7/ Regulation A chapter on regulation you ask? Well regulation may have a reputation for being dull and incredibly
complicated but actually there are some informative comparisons to be drawn between the two
countries – particularly in handling new providers and new entrants to the market, which is highly
relevant to both systems as they expand and diversify.
RTOs and the VET sector in Australia – what not to do Whilst I believe that more doesn’t mean worse when it comes to higher education, it is also true that
more doesn’t necessarily mean better. It is actually the FE or VET (vocational education and training)
system in Australia that can teach us some salient lessons about the influx of new providers into the
market – particularly in contrast to the experience in their HE sector. The HE sector in Australia has
seen relatively gradual and highly successful growth of the private providers into their system,
particularly since 2005 when the FEE-HELP system started (although many were actually established
well before 2005, their enrolments of domestic students expanded greatly from 2005 when their
students were given access to FEE-HELP). There are 173 registered higher education institutions
(HEIs) in Australia, which includes 40 universities (3 of which are small, private, not for profit). Of the
133 HEIs that are not universities, 90 are approved to receive FEE-HELP loans for their students.
These 133 alternative higher education providers account for around 10% of enrolments in Australia.
Of course these alternative providers (some for-profit and some not) are a mixed bag in terms of
scale and quality but on the whole, these private providers have a good reputation for providing
specialist, high quality higher education qualifications.
By contrast, the vocational education and training (VET) system in Australia opened up to Registered
Training Organisations (RTOs) around the same time and has experienced an explosion, so that there
are now about 5,000 VET providers. There are approximately 3,800 private providers, with the
remainder including some schools, universities, community education providers, and industry and
professional bodies, all of which are mostly small. Unlike higher education where institutions have to
have the delivery of HE as their main purpose, VET institutions do not have this requirement. Many
RTOs are credible and reputable not-for-profit training providers but thousands are ‘car boot’
providers that register between a handful and thousands of students, get paid thousands
(sometimes millions) of dollars from the State Government in fee loan funding for the students and
then either close down shortly after or fail their students. The level of reported fraud and student
non-completion is astonishingly high. Some have argued that poor quality programmes, delivered in
a fraction of the standard time, with terrible employment outcomes is just as big a problem as fraud,
even though providers are officially sticking within the rules.
The FE regulator has an almost impossible job due to the sheer scale of thousands of tiny new
providers that they cannot possibly keep on top of. The numbers are eye watering: over 5,000 RTOs,
but the biggest 100 (that is 2% of providers) deliver almost 80% of teaching hours. In other words,
98% of all providers are delivering just 20% of all teaching17. It is the much maligned and
misunderstood Tertiary and Further Education (TAFE) Colleges (59 in all) that have steadily lost
student numbers (or teaching hours) thanks to the opening of the market to private providers. As
well as dramatically losing their market share, they have had their budgets slashed as well.
17
http://www.lhmartininstitute.edu.au/insights-blog/2012/06/89-vet-has-too-many-qualifications-and-is-too-complex

38
Commentators in Australia have argued that the FE Regulator is shutting down disreputable RTOs as
fast as it can but a handful of new ones are popping up for every one they are able to close.
15/ The problem, and the salient lesson for England as well as the Australian HE system, is that the minimum threshold for entry to the market for new providers was set far too low. A regulator cannot be expected to regulate thousands of providers that are flooding into a new market where the doors are wide open. Many of the states staggered payments to providers on the basis of retention but this did not help. The really important lesson for England is that it is far more important to establish and enforce appropriate minimum standards for entry into the market when managing a growing and diversifying market.
Alternative providers in England – more than you might think In 2012 (before fee changes) the department for Business Innovation and Skills (BIS) commissioned a
report to provide a comprehensive picture of provision by privately funded Higher Education
Institutions (HEIs) operating in UK higher education (BIS, 2013b) – some of the findings were quite
surprising to the UK higher education sector because so much of this activity had gone un-recorded,
un-regulated and largely un-noticed.
In 2012 there were 163 registered higher education institutions in the UK (UUK, 2013a), of which
around 110 had university title.
The BIS research identified a total of 674 alternative providers. These were named, privately funded
HEIs with over 160,000 students in total, including just under 80,000 UK domiciled students,
although these were minimum estimates. 27 of the 674 providers identified were lead
representatives of larger provider groups, often with multiple campuses or subsidiary colleges. The
majority operate as for-profit organisations and were very newly established, with a large proportion
catering to small numbers of students – 84% of providers had fewer than 100 students.
The biggest difference post-2012 is that alternative providers could receive fee loans for their
students up to a £6,000 limit per student. To do so, these providers had to register with BIS / HEFCE,
work with QAA and provide data returns. Two things have happened since 2012 as a result: the small
number of large, longer established private providers have come closer into the regulated sector and
a significant number of brand new, small providers have started providing qualifications (usually sub-
degree level) that are accredited by a for-profit organisation that is an accrediting body only – not a
provider itself.
This increased diversity in the market is most likely a positive thing but the lack of readiness for any
one body to regulate a changing environment is concerning. The lack of an HE Bill following the 2012
reforms means that there is no single body with regulatory responsibility for the entire sector. HEFCE
has always had regulatory responsibility for HEIs receiving public funding but it is increasingly
important that this regulatory authority be extended to all HE providers full stop. The 674 named
privately funded providers with 80,000 domiciled students should also come under their watch – not
in exactly the same way as those receiving public funding, but in an appropriate and proportionate
relationship.
16/ This is where the Australian model of TEQSA has something to offer the English system. As a national regulatory body, TEQSA has regulatory responsibility for all HE providers, public or
39
private, receiving public funding or otherwise. 17/ Furthermore, TEQSA is responsible for establishing and maintaining a National Register of Higher Education Providers. Given recent student visa scandals with private providers – often English language providers – a National Register of HE Providers could be helpful in making more sensible visa rules. For example, England could return to an automatic 2 year right to stay and work for all graduates from those institutions on the National Register of HE Providers. This would put England back in line with Australia, Canada and other international competitors rather than the complicated and off-putting system we have at present.
TEQSA – is this HEFCE and QAA combined? In the context of expansion and diversification of providers, perhaps we should not be surprised that
the Australian Government established the Tertiary Education Quality and Standards Agency (TEQSA)
in 2012 – the first national regulatory body for higher education ‘with teeth’. TEQSA has been
established for the purpose of registering and evaluating the performance of higher education
providers against the HE Standards Framework, specifically the Threshold Standards. TEQSA’s
approach is informed by three key principles for regulation; regulatory necessity, reflecting risk and
proportionate regulation.
It first identified 46 ‘risk factors’ against which it measures all HE providers but has since refined this
process to identify 12 risk factors (including 2 composite financial indicators). All providers, even
those that have operated for over a hundred years or more, have to have their licence renewed at
least every 7 years. TEQSA’s role is to interpret and enforce the minimum threshold standards for
entry to the HE market that were identified by an independent panel (HESP) and approved by the
Minister. TEQSA has been applying these minimum thresholds to all HE providers since January 2012.
This is surely a welcome step in managing quality and maintaining the all-important HE brand in
Australia but, interestingly and probably not entirely unexpectedly, the tough approach of TEQSA has
met with considerable opposition from some of the established universities that are not used to
having to prove themselves to an external regulatory body. Some of this will be teething problems
but there has, quite rightly, been considerable dialogue between the QAA and HEFCE in England with
TEQSA to see what lessons can be learnt on both sides.
From the English perspective it is helpful to consider whether TEQSA is the amalgamation of HEFCE
and QAA as called for in the Browne Review in 2011, or at least whether it looks similar to the ‘meta-
regulator’ role that many, including the UK HE Commission (Commission, 2013), have recommended
for HEFCE in the post-2012 system. On closer inspection, it becomes clear that TEQSA is not an
amalgamation of HEFCE and QAA because it has no funding role and because it doesn’t undertake
the broader quality improvement activity that QAA is known for, which is made possible through the
co-regulatory set up in the UK. Indeed, this broader quality improvement role was a feature of
TEQSA’s predecessor the Australian Universities Quality Agency which has been lost in TEQSA’s
tougher quality and standards regulation.
TEQSA does, however, provide a useful demonstration of what a single national regulatory body
might look like – one that has regulatory responsibility for all HE providers right across the board.
TEQSA takes a risk-based approach and is committed to the principle of appropriate, necessary
40
regulation; a differentiated approach rather than a ‘level playing field’ or ‘one size fits all’ approach,
which so much of the current debate is focussed on in England.
The English system also lacks any equivalent to the Australian version of course accreditation. This is
a really significant part of the regulation framework in Australia, as is the capacity to assess and grant
an application for self-accrediting authority. Despite the rampant increase of franchise delivery of
programmes in England, QAA does not have the authority to examine individual courses in the
current system – this may need to change.
The prescription in Australia, through the agreed minimum standards, is that universities (and any
provider / accrediting body for that matter) must take responsibility for ensuring that any third party
delivering any part of a course or award in the name of, or accredited by, the principal must ensure
the third party meets all of the standards and offers equivalent quality. Unlike in England, Australia
looks to the original provider / accrediting body (the principal) directly to uphold the standards or
face sanction itself. If the third party provider wants instead or additionally to enter the HE system
itself, then it goes through the rigorous registration front gate and has to have its courses
individually assessed and accredited by TEQSA. The Australian framework does not put the onus on
the regulator to chase directly the third parties used or franchised by universities. This is an
important feature. It leans heavily on the self-regulatory capacity of universities (or accrediting
bodies) but with the spectre of external scrutiny and accountability for the same high standards.
Both QAA and HEFCE would need significant changes to their regulatory authority in order to
operate in a similar way in the English system and this would require a change of primary
legislation18. QAA may also need some adjustments to its ownership if it is to co-regulate this new
sector.
18
see HEPI report no. 65 ‘Unfinished business?: higher education legislation’
18/ In an English system that is about to experience further growth, TEQSA provides a useful example of a national regulator that has proportionate regulatory engagement with all HE providers, whether receiving public funding, fee loans or otherwise. TEQSA take a differentiated, risk-based approach rather than a ‘level playing field’ approach. Australia also looks to the original providers / accrediting body directly to uphold standards at franchise providers or face sanction itself – an important lesson for England with the rampant growth of franchise providers. This is a model that HEFCE could adopt without, necessarily, having to change the position or co-regulatory function of QAA but it would require changes to primary legislation.

41
Is co-regulation a better approach? From the Australian perspective, the question is whether they might have something to learn from a
more settled approach to co-regulation in England. Co-regulation is a system by which the QAA and
universities have a shared agreement to regulate and improve standards. For providers receiving
public funding, it is HEFCE that carries regulatory responsibility but HEFCE commissions the QAA to
monitor and improve quality and standards. QAA does so through co-regulation. Co-regulation is
more robust than simple self-regulation because the QAA has certain powers to intercede where
there is poor performance, but the principle of shared responsibility and shared ownership of
standards avoids some of the ownership issues that are being experienced in Australia at present.
Co-regulation is not a straightforward solution in a system that is not used to having a national
regulator. Co-regulation was developed and has been refined over a long period of time in the UK
but it is certainly true to say that it has reached a stage where QAA’s approach might be a useful
model in some regards, given some of the teething problems TEQSA is experiencing in Australia.
19/ From the Australian perspective, perhaps there is something for Australia to learn from the UK’s approach to co-regulation of standards – a method that seems to be a little more harmonious but, so far, equally effective at ensuring standards and protecting students.
42
Chapter 8/ Areas that deserve further comparison There are some significant areas that deserve further comparison: the student support system; the
student visa system; research impact; the innovation ecosystem; doctoral training centres; open
access; and the future of the research landscape more widely. In each of these areas, the questions
facing both countries are remarkably similar – and the approach both similar and yet different
enough to warrant closer inspection.
There are many reasons why England would benefit from a closer policy dialogue with Australia.
There is already an active dialogue and a Memorandum of Understanding between Universities
Australia and Universities UK as well as between the Australian Technology Network of universities
(ATN) and University Alliance. I hope this report, amongst others, will encourage a growing sense of
cooperation, collaboration and shared learning between these two countries. By learning from each
other and collaborating more effectively, we can only improve our respective higher education
systems.
43
Bibliography Armstrong, S., & Batten, A. (2011). Issues and Overview: the economics of higher education and its
financing arrangements. In S. Armstrong, & B. Chapman, Financing higher education and
economic development in East Asia (pp. 1-4). Canberra: Australian National University.
Armstrong, S., & Chapman, B. (2011). Financing higher education and economic development in East
Asia. Canberra: Australia National University.
Aston, L., & Shutt, L. (2010). The impact of fees, a review of the evidence. London: University Alliance.
Barr, N. (1989). The White Paper on Student Loans. Journal of Social Policy, 409-417.
Barr, N. (1998). Higher Education in Australia and Britain: What Lessons? The Australian Economic
Review, 179-88.
Barr, N. (2001). The welfare state as a piggy bank. Oxford: Oxford University Press.
Barr, N. (2001). The Welfare State as Piggy Bank. Oxford: OUP.
Barr, N. (2004). Higher Education Funding. Oxford Review of Economic Policy, 264-282.
Barr, N. (2004). The economics of the welfare state (Fourth Edition ed.). Oxford: Oxford University
Press.
Barr, N. (2005). Financing Higher Education. Washington D.C.: Finance and Development, an IMF
publication.
Barr, N. (2009). Financing higher education: lessons from economic theory and reform in England.
Higher Education in Europe, 34(2), 201-209.
Barr, N. (2010). Paying for higher education: what policies in what order? London School of
Economics and Social Science. London: LSE.
Barr, N. (2010). Paying for higher education: what policies, in what order? London: Independent
Review of Higher Education Funding and Student Finance.
Barr, N., & Crawford, I. (2007). Financing higher education: answers from the UK. London: Routledge
Barr, N., & Johnston, A. (2010). Interest subsidies on student loans: a better class of drain. London:
LSE (online).
Barr, N., & Shephard, N. (2010). Towards setting student numbers free. London: LSE.
Barr, N., Berlinger, E., Dumcius, R., Gausas, S., Gilly, G., Macadie, H., et al. (2009). Feasability study on
student lending, for the European Commission. London: LSE.
BIS. (2012). BIS performance indicators: funding per student in higher education. London:
Department for Business, Innovation and Skills.
BIS. (2013a). Participation rates in higher education, Statistical First Release. London: Department for
Business, Innovation and Skills.
44
BIS. (2013b). Privately funded providers of higher education in the UK, BIS Research Paper Number
111. London: Department for Business Innovation and Skills.
Browne, J. (2010). Securing a sustainable future for higher education: an independent review of
higher education and student finance. London: Dept for Business, Innovation and Skills.
Champoux, M. (2006). Accrual accounting in New Zealand and Australia. Boston, MA: Harvard Law
School, Federal Budget Policy Seminar.
Chapman, B. (2004). Government Managing Risk: Income Contingent Loans for Social and Economic
Progress. Melbourne: Taylor and Francis.
Chapman, B. (2011). The Australian university stduent financing system: the rationale for, and
experience with, income-contingent loans. In S. Armstrong, & B. Chapman, Financing higher
education and economic development in East Asia (p. Chapter 5). Canberra: Australian
National University.
Chapman, B., & Higgins, T. (2009). An income contingent loan for extending paid parental leave.
Australian Journal of Labour Economics, 197-217.
Chapman, B., & Hunter, B. H. (2009). Exploring creative appliances of income contingent loans.
Australian Journal of Labour Economics, 133-145.
Chapman, B., & Ryan, C. (2002). Income-contingent financing of student charges for higher
education: assessing the Australian innovation. Canberra: Centre for Economic Policy
Research, Australian National University.
Chapman, B., & Sinning, M. (2011). Student loan reforms for German higher education: financing
tuition fees. Bochum, Germany: Ruhr-Universitat Bochum (RUB), .
Chapman, B., Higgins, T., & Withers, G. (2009). Income contingent loans for mature aged training.
Australian Journal of Labour Economics, 167-181.
Chevalier, A., Conlon, G., Galindo-Ruedo, F., & McNally, S. (2002). The returns to higher education.
London: Centre for the Economics of Education.
Chowdry, H., Dearden, L., Goodman, A., & Wenchao, J. (2012). The Distributional Impact of the 2012-
13 Higher Education Funding Reforms. Fiscal Studies, 211-236.
Commission, H. (2013). Regulating Higher Education: Protecting Students, Encouraging Innovation,
Enhancing Excellence. London: Higher Education Comission.
Dynarski, S. (1994). Who defaults on student loans: findings from the national post-secondary
student aid study. Economics of Education Review, 55-68.
Friedman, M. (1955). Capitalism and Freedom. Chicago: University of Chicago Press.
Hackett, L., Shutt, L., & Maclachlan, N. (2013). The way we'll work: labour market trends and
preparing for the hourglass. London: University Alliance.
45
HEFCE. (2013). Recurrent grants and student number controls for 2013-14 . Bristol: Higher Education
Funding Council for England.
IFS. (January 2010). Submission to the Independent Review of HE Funding and Student Finance.
London: IFS.
Institute for Fiscal Studies. (2011). The public expenditure and distributional implications of reforming
student loans and grants. London: IFS.
Johnston, A., & Barr, N. (2013). Student loan reform, interest subsidies and costly technicalities:
lessons from the UK experience.Journal of Higher Education Policy and Management,167-78.
Johnston, A., & Barr, N. (2013). Student loan reform, interest subsidies and costly technicalities:
lessons from the UK experience. Journal of Higher Education Policy and Management, 168.
McMahon, W. (2009). Higher learning, greater good: the private and social benefits of higher
education. Baltimore: Johns Hopkins University Press.
Norton, A. (2013). Mapping Australian higher education. Melbourne: The Grattan Institute.
OECD. (2012). Education at a Glance. Paris: OECD.
OFFA. (2013). 2014-15 access agreements: institutional expenditure and fee levels. Bristol: Office for
Fair Access.
Santiago, P. e. (2008). Tertiary Education for the Knowledge Society, Volume 1, Special Features:
funding, governance, quality. Paris: OECD.
Schleicher, A. (2010). Is the sky the limit to educational improvement? UUK Annual Conference,
September 2010. Cranfield: OECD and UUK.
Trow, M. (1974). Problems in the Transition from Elite to Mass Higher Education. Policies for Higher
Education, OECD (Paris), 51-101.
UUK. (2013a). Patterns and trends in UK higher education. London: Universities UK.
UUK. (2013b). The funding challenges for universities. London: Universities UK.
UUK. (2013c). The power of part-time; Review of part-time and mature higher education. London:
Universities UK.
Wakeling, P. and Hampden-Thompson, P. (2013). Transition to higher degrees across the UK: an
analysis of national, institutional and individual differences, Higher Education Academy, UK
Wheelahan, L. (2010). A Bernsteinian analysis of the 3rd wave of higher education expansion.
University of Melbourne, Australia: 6th International Basil Bernstein Symposium.
Wolf, A. (2001). Does Education Matter?: myths about education and economic growth. London:
Penguin Books Ltd.

46
Annex 1: Australian student contribution and direct public funding
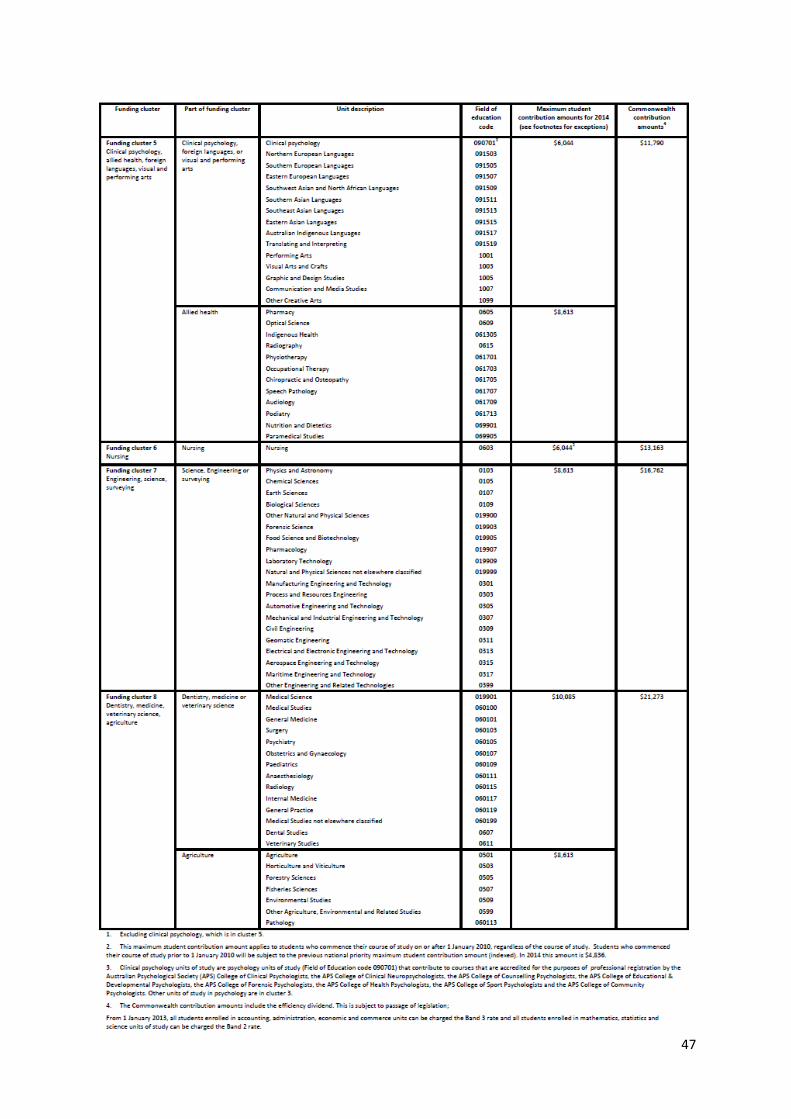
47