a comparison between tropical rainfall maps: trmm and era40
TRANSCRIPT

A comparison between tropical rainfall maps: TRMM and ERA40,1998 to 2001
Hezekiah M. Carty
December 23, 2007
1 Introduction
1.1 SubjectThe purpose of this study is to perform an initial qualitative and quantitative comparison between tropical rainfallvalues via multiple data sets, primarily ERA40 rainfall and TRMM rainfall. Rainfall information from GPCP andCMAP will be included in the analysis at a later time.
The Tropical Rainfall Measurement Mission (TRMM) satellite provides a unique view of the Earth’s tropicalprecipitation patterns. TRMM’s combination of diurnal coverage, multiple instruments on a single platform, and flightlongevity allow for a powerful addition to the currently available measures of precipitation and related meteorologicalfields. The objectives of the TRMM mission are to “measure rainfall and energy (i.e., latent heat of condensation)exchange of tropical and subtropical regions of the world”[3].
ERA40 is a reanalysis data set generated by ECMWF. Data are available at 2.5° x 2.5° grid spacing or higherresolutions, with monthly mean 6-hourly values for most available fields[1]. While the ERA40 data product doesprovide surface precipitation as part of its output, it does not include rainfall observations in its assimilation process,nor does include constraints to maintain a balanced hydrological budget. Despite this limitation, ERA40 provides oneof the most advanced global meteorology data sets available for the modern era and as such plays an important role inongoing climate, modeling and other meteorological studies.
1.2 ObjectivesA comparison between TRMM and ERA40 will provide a more detailed look at the strengths and weaknesses ofERA40’s precipitation handling in the tropics and subtropics. With the majority of the surface being ocean, “precipi-tation over the global tropics can be measured satisfactorily only from space”[3]. With the rainfall and the associatedatmospheric diabatic heating focused in the tropics it is important to have as accurate an image of these for this regionof the globe as possible. TRMM’s meteorological observations provide uniquely constructed views of the tropical andsubtropical rainfall and diabatic heating, which combined with the now approaching ten year lifespan of the satelliteallow for some of the most reliable remotely sensed observations currently available. These observations can be usedas both a comparative check against the ERA40 reanalysis results, as well as a complimentary data set to augmentERA40’s strengths in pressure structure derived fields such as winds.
Relationships between precipitation differences and other fields will be used as aids to hypothesize the reasonsbehind the differences between the data sets. Precipitation differences conditioned on precipitable water may be usedto provide some insight in to how realistically ERA40 is using the water it has available. Other conditioning variableswill be added in the future.
2 Required data sets
2.1 TRMMThere are three primary instruments on the TRMM satellite platform[3]:
1

1. TRMM Precipitation Radar (PR) is a rain profiling radar with a frequency of 13.8GHz. This instrument pro-vides rainfall measurements from approximately 37°N to 37°S. The active sensing nature of the PR allows forsampling at several height levels within the atmosphere, providing a view of the three-dimensional rainfall struc-ture within its field of view. With a wavelength of 2.2cm, PR’s signal is able to effectively penetrate heavilyprecipitating systems which occur often in the deep tropics.
2. TRMM Microwave Imager (TMI) is a nine channel passive microwave radiometer. TMI provides passive rainfallmeasurements, as well as some measure of inferred vertical structure.
3. Visible and Infrared Radiometer System (VIRS) is a visible and infrared passive radiometer. VIRS providescloud-top temperatures as well as contextual cloud top structure.
Both TMI and PR have their own range of available data products, while VIRS is used primarily as a calibration aidin combined precipitation data products. VIRS also provides a base for comparison with geostationary visible andinfrared satellite instruments.
The TRMM satellite flies with a 35° inclined orbit, causing it to precess during its orbits, seeing the same geo-graphic location at different local times during each orbit. Over time this provides a diurnal view of the precipitationpatterns for a given location.
Each of the TRMM data products mentioned here, as well as several others, along with their associated docu-mentation are available from the NASA Goddard Space Flight Center Data and Information Service Center http://daac.gsfc.nasa.gov/precipitation/TRMM_README/.
2.1.1 3B42
TRMM 3B42 is not used directly in this project. However, it serves as the base for the main TRMM data set usedhere: 3B43. TRMM 3B42 provides 3-hourly combined PR, TMI, VIRS and geostationary visible and infrared satellitecombined best-estimate gridded total rainfall product[2].
2.1.2 3B43
The TRMM 3B43 data set is a monthly mean version of the TRMM 3B42 data set, with additional rain gauge stationdata used for verification and adjustment of rainfall biases[2]. Coverage runs from 50°S to 50°N and from 180°Wto 180°E with a 0.25° x 0.25° grid spacing. Total surface rainfall values are provided for each grid box in units ofmm/hour. Data are available from January 1998 through the present.
2.2 ERA40The University of Maryland Department of Atmospheric and Oceanic Science in-house copy of the ERA40 data setprovides a monthly time scale, with global coverage on a 2.5° x 2.5° grid and 23 vertical pressure levels ranging from1000hPa to 1hPa.
2.2.1 Surface rainfall
Surface rainfall values are provided for each grid box, separated in to convective and stratiform components, in unitsof meters per 6 hours.
2.2.2 Precipitable water, from specific humidity
Specific humidity values are provided for each grid box at each of the 23 pressure levels in units of kg/kg. Precipitablewater is found from a vertical integral of the specific humidity from the surface pressure to 250mb and is in units ofmm.
2.2.3 Diagnosed diabatic heating
Diabatic heating values are provided for each grid box at each of the 23 pressure levels in units of K/sec. These dataare not yet utilized in this analysis.
2

3 MethodologyTRMM data are regridded to ERA40 spatial resolution in order to ease comparison between the two data sets. Unitsfor individual fields are selected based on convention and the units used in TRMM’s data products, and are as follows:
• Surface rainrate: mm/day
• Precipitable water: mm
• Diabatic heating: K/hour
3.1 RegriddingTRMM data are regridded to match the ERA40 2.5° x 2.5° resolution using a simple area average. Each TRMM gridvalue within a given 2.5° x 2.5° grid box is summed, then this sum is divided by the number of TRMM grid boxeswithin the ERA40 grid box to get the area average. No latitude-based weighting is used for the results presented here.
3.2 Difference mapsThe difference maps shown in figures 1 and 4 are a simple point-by-point difference.
4 Results
4.1 TRMM vs ERA40ERA40’s combined surface rainfall values (convective plus stratiform) tend to reconstruct general rainfall patterns ona global scale which are comparable to observations. However, the strength, location and spatial extent of several largescale features, such as the ITCZ, are notably different between the two data sets.
4.1.1 Total rain rate, January climatology
For the January climatology difference, shown in figure 1, ERA40 shows larger rainrates throughout the equatorialPacific. Corresponding TRMM and ERA40 precipitation maps can been seen in figures 2 and 3 respectively. TheERA40 ITCZ off of the South American coast out in to the eastern Pacific is both wider in extent to the north andsouth with respect to TRMM as well as having much larger peak rainrate values. ERA40 shows rainrates more than11mm/hour greater than reported by TRMM’s 3B43 data product on the South American equatorial coast and inseveral areas a few degress south of the equator out in to the Pacific. The differences are larger in the western Pacificwhere throughout the region from 30°S to the equator and 120°E to 130°W the ERA40 rainrate values are 3 mm/dayto over than 11mm/day larger than those shown by TRMM. A similar pattern exists over the equatorial Atlantic, withtropical precipitation which is too strong and widely spead latitudinally when compared with TRMM.
Differences over land are overall smaller in magnitude and vary between which data set shows the greater precip-itation values. The Gulf Coast states in the US show 2 to 4 mm/day more rainfall in TRMM’s view, while the westand east coasts of the US show approximately 2mm/day difference, with ERA40 precipitating more in the west andTRMM in the east. ERA40 shows more rainfall than TRMM in the US’s Pacific Northwest by 2 to 3mm/hour, butcomparisons at this latitude may be somewhat less reliable than at lower latitudes due to TRMM’s latitudinally limitedview.
In South America, Brazil and portions of Peru have one of the largest TRMM land rainrate surpluses in bothmagnitude and extent. TRMM ranges from 2-4 mm/hour greater than ERA40 throughout the center of the SouthAmerican continent in this area, likely indicating an underrepresentation of the convective processes in this region.A notable distinction here is that while ERA40’s tropical ocean rain rate maxima tend to fall in similar locations toERA40’s precipitable water maxima (see figure 7 for a map of the ERA40 precipitable water), this same relation doesnot hold over land. There is a precipitable water maximum in this South American region which is similar is spatialcoverage to the Brazil and Peru TRMM rainrate surplus.
3

4.1.2 Total rain rate, July climatology
The July climatology difference map is shown in figure 4. The picture here is notably different than that of the Januaryclimatology. ERA40’s tropical precipitation signal is shifted too far to the north throughout almost the entire westernhemisphere, resulting in a north-south ERA40-TRMM dipole effect. The precipitation difference magnitudes arelarger overall in this region than they were in the January climatology due to there being a difference in location of therain maxima in addition to the differences in strength and extent seen in January. The west Pacific again shows largerelative ERA40 precipitation values, with the focus now shifted in to the northern hemisphere following summer.
Land rainrate differences also shift to follow the change in seasonal rain patterns. The western hemisphere landmasses show generally smaller differences than those seen in the January climatology, though TRMM does show morerainfall than ERA40 in the central US by 2 to 3mm/day. In the eastern hemisphere the differences are now large withthe onset of the monsoon. TRMM shows a 3 to 9mm/day higher rainrate than ERA40 throughout most of India andChina below 30°N, with the exception of a strip of 4 to 7 mm/hour higher rainrate in ERA40 over TRMM in a bandaround 100°E, running up to the Tibetan Plateau where ERA40’s rainrate exceeds TRMM’s by between 4 and greaterthan 11mm/hour.
4.1.3 (TRMM - ERA40) total rainrate histogram
Each of the histograms shown in figures 9 and 10 show histograms representing the distribution of TRMM - ERA40surface rain rate across the 50°S to 50°N latitude belt for January and July climatologies, respectively. Each countrepresents one grid box which falls within a given histogram bin.
Figure 9 shows a histogram illustrating the distribution of (TRMM - ERA40) precipitation differences. There is aclear logarithmic curve to either side of the 0-difference bin peak. The ERA40 tail of the distribution - the negativeside - has a longer and larger in magnitude tail than the TRMM tail on the positive side of the histogram. This givesthe distribution a skew of -3.43 and a mean value of -0.993. The distribution comes to a sharp point at the 0-bin, witha kurtosis of 25.8. The result is that, for this 50°S to 50°N band, ERA40 produces more surface rainfall than TRMMobserves.
The July (TRMM - ERA40) histogram shown in figure 10 is similar to the January case, but July shows a sig-nificantly less distinct form on the ERA40 end of the curve than seen in the January curve. The TRMM tail of thedistribution, to the positive side, has a similar shape to the January histogram TRMM tail, with a similarly clear loga-rithmic curve. The ERA40 end of the curve has a less distinct shape than in the January climatology. This follows thepicture shown in the July climatology map (figure 4), with more offset in the locations of rainfall patterns in July ratherthan the larger magnitudes but similar spatial distribution of rainfall seen in the January map. The July distribution hasa skew of -2.39 and a mean of -1.05. The less distinct shape of the distribution histogram leads to a kurtosis of 12.3,much lower than the January distribution.
4.1.4 (TRMM - ERA40) rainrate distribution conditioned on precipitable water
Figure 11 shows the distribution of January climatology (TRMM - ERA40) surface rainrate differences conditionedon ERA40’s January climatology of precipitable water (figure 7). The rain rate differences, which correspond to gridpoints with the precipitable water values between 15mm and 35mm, are clustered close to zero, generally rangingbetween 1 and -1 mm/hour. For precipitable water values below 15mm, ERA40 tends to have rain rate values whichare larger by between 1 and 2 mm/hour. Both TRMM rain rates and ERA40 rain rates individually (figures 12 and13) conditioned on ERA40 precipitable water show a bulge in this region. The reason for this is unknown, but maybe due to some modeling artifact in the ERA40 production process. External validation from NVAP or other observedprecipitable water data sets will be neede for further clarification of what this feature may be.
A more striking feature of figure 11 is the growth in differences for precipitable water values greater than 35mm.Overall, ERA40 grows more quickly with rising precipitable water values in this range. These large precipitablewater values all fall in the tropics, where ERA40 tends to rain more than TRMM, so this fits well with the Januaryclimatology map (figure 1).
References[1] Era40 data archive website.
4

[2] Interface control specification between the tropical rainfall measuring mission science data and information system(tsdis) and the tsdis science user (tsu): Volume 4: File specifications for trmm products - level 2 and level 3.
[3] Christian Kummerow, William Barnes, Toshiaki Kozu, James Shiue, and Joanne Simpson. The tropical rainfallmeasuring mission (trmm) sensor package. Journal of Atmospheric and Oceanic Technology, pages 809–817,1998.
5

Figure 1: TRMM - ERA40 total surface rainfall difference for 1998 through 2001 January climatology
6

Figure 2: TRMM total surface rainfall for 1998 through 2001 January climatology
7

Figure 3: ERA40 total surface rainfall for 1998 through 2001 January climatology
8

Figure 4: TRMM - ERA40 total surface rainfall difference for 1998 through 2001 July climatology
9
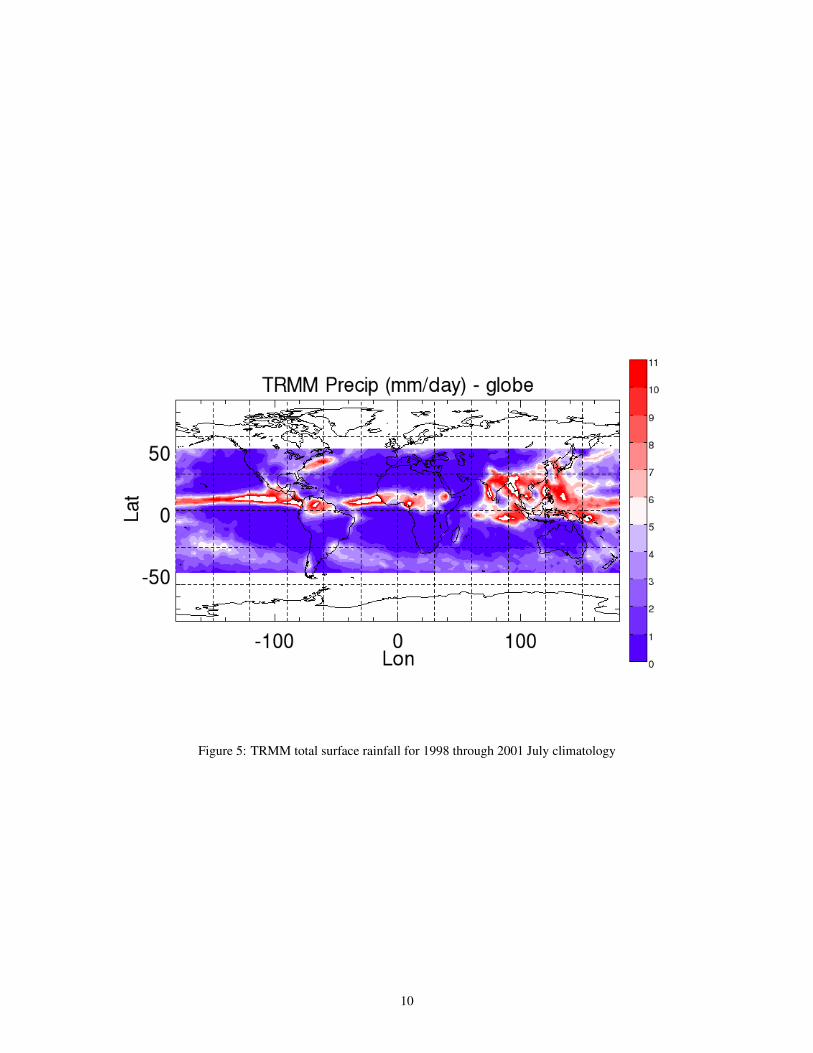
Figure 5: TRMM total surface rainfall for 1998 through 2001 July climatology
10

Figure 6: ERA40 total surface rainfall for 1998 through 2001 July climatology
11

Figure 7: ERA40 precipitable water for 1998 through 2001 January climatology
12

Figure 8: ERA40 precipitable water for 1998 through 2001 July climatology
13

Figure 9: TRMM - ERA40 surface rain rate distribution histogram for 1998 through 2001 January climatology
14

Figure 10: TRMM - ERA40 surface rain rate distribution histogram for 1998 through 2001 July climatology
15

Figure 11: TRMM - ERA40 surface rain rate distribution conditioned on ERA40 precipitable water, January climatol-ogy
16

Figure 12: TRMM surface rain rate distribution conditioned on ERA40 precipitable water, January climatology
17

Figure 13: ERA40 surface rain rate distribution conditioned on ERA40 precipitable water, January climatology
18