a comparative test of the punctuated equilibrium …
TRANSCRIPT
A COMPARATIVE TEST OF THE PUNCTUATED EQUILIBRIUM THEORY:
POLICY PUNCTUATIONS IN TOBACCO CONTROL 1
Shortened Title: A Comparative Test of the Punctuated Equilibrium Theory
Bio: Matia Vannoni (PhD, UCL) is currently a postdoctoral researcher at the Innocenzo Gasparini
Institute for Economic Research (IGIER), Bocconi University. His research has featured in several
journals, such as Policy Studies Journal, and Journal of Public Administration Research and
Theory.
Abstract: Tobacco control plays a central role in the development of the punctuated equilibrium
theory. The proponents of this theory posit that this policy, like many others, develop through
punctuations, namely the combination of periods of policy inertia, due to negative feedback
effects, and drastic policy change, due to positive feedback effects. Yet, little has been done to
empirically test this claim. By relying on a unique dataset of policy changes in tobacco taxation
and regulation across multiple countries over the last decades, I test the punctuation hypothesis in
tobacco control. Findings show that tobacco control evolves through long periods of policy inertia,
followed by short periods of drastic change, namely punctuations, thus providing further support
for the punctuated equilibrium theory. This article presents the first large-N test of the punctuated
equilibrium theory on tobacco control.
Key-words: tobacco control, punctuations, punctuated equilibrium theory, comparative public
policy
1 The research for this article was carried out when the author was a PhD student at the School of Public Policy, University College
London (UCL). The author would like to acknowledge the funding from the ESRC DTC (award number: 1328205) and thank
David Coen and Peter John for their support. Also, the author owes his gratitude to Donley Studlar, who kindly shared his dataset
and commented on previous drafts of this paper.

INTRODUCTION
The proponents of the punctuated equilibrium theory argue that tobacco control develops through
periods of negative feedback effects, where the low public attention and the monopoly of a few
stakeholders prevent any policy change, and periods of positive feedback effects, where public
attention increases and makes policy change possible. Until the 1980s, smoking received little
public attention in the US. This led to the creation of a policy-subsystem controlled by the tobacco
industry, triggering negative feedback effects and preventing any change. In the 1990s, strong
medical evidence against the harmful effects of smoking moved this issue to the center of the
public attention, empowering legislators to take strong action.
Despite the great attention of the public policy literature on tobacco control, little has been done
to empirically test these claims. This article seeks to fill in this gap, by testing whether tobacco
control is characterised by positive and negative feedback effects. I do so by looking at the
empirically observable implications of these effects. More specifically, I test whether tobacco
control is characterised by punctuations, namely the combination of drastic policy changes, related
to positive feedback effects, and incremental changes, which suggest the presence of negative
feedback effects. The article relies on a unique dataset of policy change in tobacco taxation and
regulation across multiple countries over the last decades. In line with the common practice in the
public policy literature, I use frequency distributions of percentage change to test the punctuation
hypothesis. Findings suggest that tobacco control is characterised by punctuations, thus providing
further support for the punctuated equilibrium theory.
The paper develops as follows. I commence by emphasizing the importance of tobacco control in
the punctuated equilibrium theory. I proceed by discussing how public policy scholars conceive
punctuations as the empirically observable implications of the positive and negative feedback

effects in public policy and which methods they use to measure punctuations. In the ensuing
sections, I apply these methods to tobacco control and provide evidence for the presence of
punctuations in tobacco control. This work concludes by discussing the implications of this finding
for the punctuated equilibrium theory.
TOBACCO CONTROL IN THE PUNCTUATED EQUILIBRIUM THEORY
Tobacco control is studied from a punctuated equilibrium theory perspective by the proponents of
this theory themselves (Baumgartner and Jones 2009, 1993) and in successive work (Givel, 2006,
Cairney 2007, Cairney, Studlar, and Mamudu 2012). The introduction of smoking bans across the
US is associated with the increasingly negative attention to this issue. In the aftermath of WWII
the low public attention to smoking (Baumgartner and Jones 1993, 91-94) and the relatively
positive tone with which this issue was discussed led to the creation of a policy subsystem based
on the dominance of the tobacco industry, triggering negative feedback effects, which in turn
prevented any substantial change (Baumgartner and Jones 1993, 91-92). Nonetheless, several
factors, such as the diffusion of medical evidence on the harmful effects of smoking, led to an
increasingly negative tone in the public attention to this issue (Baumgartner and Jones 1993, 91).
This increasingly negative public attention contributed to create an increasingly negative political
attention (Baumgartner and Jones 1993, 94, 116) and eventually the dismantling of the
predominant policy network led by the tobacco industry: what are called positive feedback effects.
2
The proponents of the punctuated equilibrium theory conceive policy change in tobacco control as
characterized by periods of negative feedback effects, characterised by the monopoly exercised by
2 The use of the concepts of negative and positive feedback effects is common practice in the literature on public policy. The former
refer to those mechanisms which prevent change and perpetuate the same dynamics over time, while the latter refer to those
mechanisms which trigger change.

the incumbent policy network in policy-making, and periods of positive feedback effects,
associated with the access of a new issue (or a new framing of an old issue) to the political agenda,
sustained by a new coalition of policy actors. The terms used for the two types of mobilization,
associated respectively with negative and positive feedback effects, are Downsian and
Schattschneider. Downsian mobilization is associated with the establishment of a new policy
subsystem (or policy network), whereas Schattschneider mobilization refers to the destruction of
the policy subsystem in place (Baumgartner and Jones 1993, 97-100). 3
Despite the great attention of the public policy literature on tobacco control, little has been done
to empirically test the claims above. This work seeks to fill in this gap, by testing the presence of
punctuations, namely the empirically observable implications of positive and negative feedback
effects, in tobacco control. The ensuing section introduces the concept of punctuations in public
policy and the policy dynamics underlying them.
PUNCTUATIONS IN PUBLIC POLICY
Some ideational approaches to public policy, namely those focused on the diffusion of ideas and
how decision-makers receive these ideas, suggest that policies evolve through periods of drastic
changes, because ideas spread fast across countries and decision-makers can only focus on a few
things at a time (Baumgartner and Jones 1993, 104). Studies of agenda setting point to the cognitive
limitations of decision-makers as the one of the main explanations for how policies evolve. 4
Several cognitive phenomena, such as the so-called bottleneck attention effect (Simon 1985, 302),
3 The proponents of the punctuated equilibrium theory acknowledge that several dynamics underlie the process through which an
issue enters the political agenda, such as venue shopping and strategic re-framing (Baumgartner and Jones 1993, 95-96). In other
words, actors in favour or against a particular issue can strategically choose to address the most like-minded political venue and/or
change how an issue is framed to make that issue more acceptable for certain decision-makers. 4 It should be noted that not all ideational approaches focus on the cognitive limitations of decision-makers and on drastic policy
change.

explain why rationally bounded individuals’ attention is limited and selective, namely why
individuals pay attention only to a few issues at a time and for short periods. Such cognitive
dynamics are replicated at macro level (Baumgartner and Jones 2009, 25). The result is that
policies evolve through short periods of drastic positive change, in occasion of increases in
political attention, followed by short periods of drastic negative change, in occasion of decreases
in political attention.
Assume an individual who takes decisions by balancing out different sources of information. In so
doing, he/she combines different indicators into an index, taking decisions based on that index
(Jones and Baumgartner 2005). If I observe this process for long enough, I will see that policy
change is incremental. The reason is that by combining different indicators, in turn based on
different social and political processes, the idiosyncratic processes behind each one of these
processes should cancel each other out (Jones and Baumgartner 2005, 155). 5 Yet, decision-makers
do not balance different information sources out, but focus only on some sources, because they do
not have time and resources, because some sources are more in line with their priors and so on
(Jones and Baumgartner 2005, 155-156). The result will be policy commitment jumping from an
issue to another, resulting in a combination of strong positive changes followed by strong negative
ones.
Conversely, policy network approaches elicit different implications for policy dynamics. 6 Policies
are conceived as evolving through long periods of incremental change, mainly due to the action of
societal actors in the form of policy subsystems. Indeed, only a few actors usually care about an
5 This holds true regardless of the distribution of the single processes, if and only if these distributions are independent from one
another. Yet, this assumption can be relaxed in this study, as discussed below. 6 Different policy network approaches are present (Rhodes 2006). In this work, I focus on the strand which refers to issue networks
(Heclo 1977), iron triangles (Maass 1951), epistemic communities (Haas 1992), policy communities (Richardson and Jordan 1979)
and so on. The reason is that in this work I am interested in studying how different actors affect policy-making, what Rhodes (2006,
427) calls ‘networks as interest intermediation’.
issue over time and they tend to monopolise decision-making (Heclo 1977, 47). A few societal
actors have a stake in the same issue over time and tend to monopolise decision-making in that
issue, by creating strong links with decision-makers. The results are small adjustments from the
status quo or policy inertia. Also the regulation strand of the public policy literature focuses on
incrementalism as the result of the way in which decision-makers muddle through, by balancing
out different perspectives from different interests in the society (Lindblom 1959, 174, 1979, 521).
In conclusion, these approaches conceive policies as evolving through long periods of incremental
change. 7
The punctuated equilibrium theory combines these two perspectives. 8 By building on earlier work
on budget decision-making (Padgett 1980), the punctuated equilibrium theory suggests that
policies evolve like most natural phenomena, subject to stochastic events (Breunig 2006, 1070-
1071). Long periods of policy inertia, due to negative feedback effects, are punctuated by short
periods of drastic change, due to positive feedback effects. In normal conditions policy
subsystems, supported by policy networks of key societal actors, monopolize policy-making and
oppose any substantial change: what the literature calls negative policy feedback. In this case the
policy does not evolve or it does so incrementally. Yet, sometimes the diffusion of policies and
ideas from other systems brings an issue to the political agenda and cognitively bounded
individuals suddenly shift their attention to this issue. In these rare occasions the policy is subject
7 Different mechanisms are at the basis of the policy dynamics discussed above. The politics of attention strand of the punctuated
equilibrium theory (Jones and Baumgartner 2005) focuses exclusively on the cognitive mechanisms which drive information
processing and hence decision-making. Instead, the original punctuated equilibrium theory grants a role also to policy network
dynamics which drive negative feedback effects. 8 Other two public policy theories synthesize these two perspectives: the advocacy coalition framework and the multiple stream
approach (John 2003, 487). The multiple stream approach focuses on how policy change is triggered by the combination of different
favorable conditions, such as the shift of competences to a ministry more open to certain ideas and the mobilization of like-minded
societal actors (Kingdon, 1995; Kingdon and Thurber, 2011; Zahariadis, 2003). The advocacy coalition framework emphasizes the
importance of societal actors in supporting certain ideas and how these ideas affect policy change (Sabatier, 1988; Sabatier, 1998;
Sabatier and Jenkins-Smith, 1993).

to short periods of drastic change. In conclusion, policy dynamics are conceived as composed of
long periods of inertia punctuated by short periods of drastic change, namely what this approach
calls punctuations (Baumgartner and Jones 1993, 10).
An important development of the punctuated equilibrium theory, namely the so-called friction
model (Baumgartner et al. 2009, Jones et al. 2009), studies the effects of institutional frictions on
policy change, by looking at different types of policy commitment: inputs, such as media attention;
processes, such as political commitment in the form of parliamentary hearings, laws and so on;
outputs, such as budget expenditures (Baumgartner et al. 2009, 611). In so doing, the proponents
of this theory argue that the degree of punctuations is smallest for inputs and highest for outputs,
because the decision-making process associated with outputs is characterised by more institutional
frictions (Baumgartner et al. 2009, 613). The main argument is that outputs are the results of long
and complicated processes which involve different actors, whereas inputs are the results of more
informal and straightforward processes. 9
The punctuated equilibrium theory finds extensive evidence for the presence of punctuations in
public policy. Findings show that budget expenditures in the US (Jones and Baumgartner 2005,
138) and other countries, such as Denmark (Mortensen 2005, 941, Breunig et al. 2009, 711) and
the UK (John and Margetts 2003, 421), are characterised by punctuations. Findings are robust also
in large-N studies including more countries (Baumgartner et al. 2009, Jones et al. 2009) and when
several types of policy commitment, other than budget outputs, are analysed (Baumgartner et al.
2009). Moreover, evidence supports the argument of the friction model, according to which
punctuations are a constant feature of public policy, but they vary according to institutional
9 Recent research focuses also on the mediating role of windows of opportunities (Kwak 2017).

frictions (Baumgartner et al. 2009). In conclusion, the public policy literature provides robust
evidence that public policy evolves through a combination of negative and positive feedback
effects, by testing the presence of punctuations.
RESEARCH DESIGN
I showed above that punctuations are considered by the public policy literature as the result of a
series of dynamics typical of public policies, namely the combination of positive feedback effects,
in turn related to cognitive limitations of decision-makers and policy diffusion, and negative
feedback effects, due to policy network dynamics. In the sections below, I test whether tobacco
control is characterised by punctuations, thus suggesting the presence of positive and negative
feedback effects, as the punctuated equilibrium theory would expect. This section first discusses
how to empirically study punctuations and the data used in this paper.
Frequency Distributions
As acknowledged in John and Margetts (2003, 415), different ways to measure how policies evolve
are present in the literature. Frequency distributions of annual percentage change represent the
mainstream approach in the punctuated equilibrium theory (Jones and Baumgartner 2005, 130),
which in turn builds on classic work on public budget, such as Davis, Dempster, and Wildavsky
(1966). In this approach “a policy change is an alteration in the commitment of a government to
an objective” (Jones and Baumgartner 2005, 141) and researchers pool frequency distributions of
changes across different policy areas. The use of annual percentage changes allows taking into
consideration the different scales of the different series pooled together. Although policy
commitments can take different forms, public spending has been the most studied one (Cairney
2011, 194).
The logic is to compare the distribution obtained with a normal one, which is associated with
incremental policy dynamics. Indeed, in a normal distribution the majority of the observations
(policy changes in this case) are clustered around the median (or the zero value, if the curve is
standardized, as it is the case if percentage changes are plotted). If we apply this logic to policy
change, this means that the majority of changes are close to zero and hence they are considered
incremental changes. Instead, if policy change follows the punctuation hypothesis, as suggested
by the punctuated equilibrium theory, the distribution of policy change will be a Pareto or power
distribution, taking a leptokurtic shape. The latter is characterized by heavy tails, suggesting the
presence of a few outliers (more than in a normal distribution), which represent rare episodes of
drastic policy change, and high frequency of median values, which represent recurrent episodes of
policy inertia. Furthermore, the public policy literature uses the kurtosis of a distribution to
measure its skewness and hence compare it with the normal distribution, which has kurtosis of 3
(and L-moments kurtosis of about 0.123). 10 It is also common practice to use statistical tests for
normality, such as the Skewness/Kurtosis, Shapiro-Wilk W and the Shapiro-Francia W'.
Another method to test the punctuation hypothesis in policy dynamics is to visualize the
distribution of percentage in policy change in a log-log plot (with the cumulative frequencies on
the vertical axis, representing how many observations have a certain degree of change or higher).
When plotted on a log-log graph a Pareto or power distribution (which in turn is a derivation of an
exponential distribution) appears as a straight line, because the logarithmic function is the inverse
function of the exponential function. Instead, in a log-log plot a normal distribution is characterised
by a downward curvature (John and Margetts 2003, 422-423).
10 Kurtosis calculated with moments is scale-free, more stable and less affected by outliers and as such, is considered a better
measure by the punctuated equilibrium theory (Baumgartner et al. 2009, 612).
This method has also been used by dividing the distribution of policy changes into two different
sub-distributions, respectively increases and decreases (John and Margetts 2003, 422-423). The
logic behind this distinction is that positive changes, such as increases in expenditures in a policy
area, represent the result of positive feedback effects. When an issue suddenly enters the political
agenda, decision-makers will take action by allocating more resources to it. Conversely, decreases
in expenditures may not reflect these sudden changes in political attention, as retrenchment is
inherently more resilient, being subject to dynamics like path dependence. In this vein, we would
expect the right tail, namely the positive changes, to behave like a power distribution and the left
tail, namely the negative changes, to behave more like a normal one (Jones et al. 2009, 860-862).
Data and Measurement
I test the punctuation hypothesis in tobacco control, by relying on a unique dataset of policy change
in tobacco taxation and regulation across multiple countries over the last decades. In the 1980s
tobacco taxation started to be widely used to curb tobacco consumption across advanced
democratic countries, becoming “a major policy instrument in the past 20–30 years” (Cairney,
Studlar, and Mamudu 2012, 18). The importance of taxation was formally acknowledged in art.6
of the World Health Organization Framework Convention on Tobacco Control, which mentions
price and tax measures among the most effective means to curb smoking, especially among young
people. The decision-making behind tobacco taxation is today characterised by the interaction
between different actors, supporting different and often contrasting interests. Health non-
governmental organizations and the medical community push for higher taxation as a way to curb
smoking, whereas the tobacco industry warns decision-makers of the negative economic effects of
tobacco taxation, such as the loss in state revenues and jobs, along with a series of indirect effects,
such as the increase in illicit trade. In the last decades decision-makers have shifted from
supporting one position to the other and political attention to the issue has been spasmodic.
Tobacco control and more specifically tobacco taxation has become a priority for national
politicians, especially in the occasion of the publication of important medical evidence and when
more action on smoking was urged by the international community.
Several issues need to be discussed when using tobacco taxation to measure policy change in
tobacco control. First, different systems of tobacco taxation are in place across the world,
characterised by two types of excise duties: ad valorem, which represents a percentage of the price
of the cigarette packet, and specific, which represents a specific amount per cigarette (WHO 2010,
28). 11 These excise duties are levied along with the regular Value Added Tax (VAT) and import
duties. Ad valorem excises arguably represent the most valid and reliable measure to be used in
annual percentage change distributions. Indeed, this measure allows controlling for inflation and
different purchasing power across countries and over time, as it is calculated as a percentage of the
price of cigarettes. Furthermore, although ad valorem excises have been recently criticized for
their ineffectiveness in curbing smoking, due to the counter-effect produced by tobacco industry’s
pricing (Gilmore et al. 2013, 1323-1324, Smith et al. 2011, 34-36), and although historically
countries vary in their tax structure (Aspect 2004, 77), ad valorem taxes are still commonly used
nowadays (Studlar, Christensen, and Sitasari 2011, 731, WHO 2010). In 2010, ad valorem excises
varied from 23 per cent in Portugal to 57 per cent in Spain (WHO 2010). 12
Second, the European Union has increasingly played a role in determining the tobacco tax structure
of its member states. In 1992 two Council Directives (92/79/EEC and 95/59/EC) harmonized
11 For instance, in the UK in 2016 the ad valorem excise duty equals 16.5 per cent of the retail price and the specific one is £3.93
on a packet of 20 cigarettes. 12 Detailed information on each country’s tobacco tax structure can be found in Table 3 and Figure 5 the Annex of World Health
Organization Technical Manual on Tobacco Tax Administration (WHO 2010).
tobacco tax levels. 13 More specifically, they established a minimum rate of excise duties to be
levied, but left countries free to set the balance between ad valorem and specific taxes and go
beyond the minimum threshold. A series of amendments in following years culminated with the
Council Directive 2011/64/EU, which clarified the exact composition of the minimum level of
excise duties, in terms of specific and ad valorem duties. 14 Nonetheless, high variation is still
present across European Union countries in the levels of these two types of excises. These
directives also harmonized the way in which Member States calculate and report excise duty
figures. As such, the analysis needs to take into consideration only those countries which are
subject to European Union regulation. This also dictates that the period of analysis should start in
1992. In conclusion, in this work I use the percentage in annual change in ad valorem excise duties
on cigarettes (more specifically, on manufactured cigarettes) pooled across the European Union
12 old Member States over time, from 1992 to 2013. 15
Third, it might be argued that tobacco taxation has constantly increased in the last decades due to
several reasons, such as the increasing attention to tobacco control across European countries and
the European Union raising the minimum rate of duties to be levied by its members, and that these
trends somehow bias the analysis. Yet, it should be noted that this is not necessarily true, as tobacco
taxation is one of the areas where most action is still needed, also among developed countries
13 The influence of the European Union elicits some considerations on how policy diffusion affects policy dynamics and whether
this creates some issues for the empirical analysis. As acknowledged by Jones and Baumgartner (2005) (p. 231) “heavy tails in
frequency distributions can be caused by policy cascades”. With the term policy cascades, they broadly refer to policy diffusion.
More specifically, they imply that positive feedback effects are caused by a combination of cognitive limitations of decision-makers
and external shocks transmitted through policy diffusion. The presence of policy diffusion across EU Member States is in line with
the punctuated equilibrium theory and hence does not bias results when using frequency distributions of policy change. 14 In spite of the harmonization at European Union level, European countries tend to be clustered into ‘families’, with different
approaches to tobacco taxation and tobacco control more in general (Cairney 2007, Cairney, Studlar, and Mamudu 2012). For
instance, Continental and Anglo-Saxon countries tend to have higher levels of taxation than Mediterranean ones. 15 These countries are: Belgium, Denmark, France, Germany, Greece, Ireland, Italy, Luxembourg, Netherlands, Portugal, Spain
and United Kingdom. Author’s own data collection from various sources (CEC 1991, 1992, 1993, 1994, 1995b, a, 1998c, b, a,
1999d, c, b, a, 2000c, b, a, 2001b, a, 2002, 2003, 2004, 2005, 2006, 2007, 2009, 2010, 2011, 2012a, b, 2013). Imputation for
missing data for two years was necessary.

(WHO 2013, 79-80). Furthermore, these trends are present also in public budget, namely what
Jones and Baumgartner (2005, 146-147) call incrementalism with upward drift, and they do not
prevent the researcher from using annual percentage change distributions to study policy
dynamics.
Finally, in line with recent developments in the punctuated equilibrium theory literature, I use
different types of policy commitments to measure punctuations. In so doing, I rely on a large
dataset containing information on all tobacco control measures in four broad policy categories,
namely advertising and sales restriction, education and environmental tobacco smoke regulation,
adopted in 24 countries in the post-WWII period. 16 17 Advertisement and sales restriction refer
respectively to those measures which prohibit tobacco advertisement and sponsorship of sports
and cultural events and those measures which prevent selling tobacco products to minors, for
instance. Education refers to regulation establishing health warning labels on tobacco products.
Environmental tobacco smoke regulation refers to the regulation of smoking in work and public
places, such as the smoking bans in the hospitality sector studied in this work.
These policy instruments have historically been used by different countries with a different timing.
Some countries have led the way, such as Nordic countries with the regulation of tobacco
advertisement and the introduction of health warnings on tobacco products in the 1990s (Cairney,
Studlar, and Mamudu 2012, 81) and Anglo-Saxon countries with the regulation of smoking in
public places in the 2000s (Cairney, Studlar, and Mamudu 2012, 81). Nonetheless, the scope of
tobacco control measures and their speed of introduction across countries have today reached
unprecedented levels. In the course of a few years, most countries around the world have
16 For more information on the dataset, see Studlar (2006) and Cairney, Studlar, and Mamudu (2012). 17 The countries are US, Canada, UK, France, Germany, Italy, Norway, Finland, Israel, Ireland, Australia, New Zealand, Denmark,
Spain, Belgium, Greece, Austria, Luxembourg, Iceland, Netherlands, Switzerland, Portugal and Sweden.
established complex tobacco control regimes, characterised by a combination of these different
policy instruments (Cairney, Studlar, and Mamudu 2012).
FINDINGS
Figure 1 shows the distribution of the percentage in annual change in ad valorem excise duties on
manufactured cigarettes pooled across the European Union 12 old Member States and over time,
from 1992 to 2013. This distribution does not take the shape of a normal distribution but a
leptokurtic distribution, characterised by heavy tails, suggesting the presence of a few outliers,
which represent rare episodes of drastic policy change, and high frequency of median values,
which represent recurrent episodes of policy inertia. Accordingly, policy change assumes a power
distribution, suggesting that it is characterized by long periods of inertia disrupted by sudden
drastic changes. The distribution in Figure 1 is very similar to the distribution of the percentage in
annual change in budget expenditures across policy areas in the US (Jones and Baumgartner 2005,
138) and in other countries, such as the UK (John and Margetts 2003, 421). 18
Figure 2 shows the log-log plot of the same distribution of the previous figure, but it disaggregates
this distribution into two sub-distributions: dots, which represent the right tail, and triangles, which
represent the left tail, respectively the increases and the decreases in excise. It should be noted that,
differently from the figure above, Figure 2 plots the logarithmic values on both axes, with the
cumulative frequencies on the vertical axis. Increases in excise duties behave similarly to a Pareto
distribution (which in turn is derived from an exponential distribution), as the dots in the log-log
plot are located on a straight line. When plotted on a log-log graph Pareto distributions appear as
straight lines, because the logarithmic function is the inverse function of the exponential function.
18 These results do not vary significantly when a country is left out from the analysis.

Conversely, decreases do not lie on a straight line: this means that they assume a distribution more
similar to a normal one. In conclusion, the degree of punctuations is higher in the increases in
cigarette taxes than in the decreases, in line with the expectations from the public policy literature.
The public policy literature uses the kurtosis of a distribution to measure its skewness, thus
comparing this distribution with the normal distribution, which has kurtosis of 3 (and L-moments
kurtosis of about 0.123). The most commonly used tests for normality, namely Skewness/Kurtosis,
Shapiro-Wilk W and the Shapiro-Francia W', show that the pooled distribution and the two sub-
distributions for the positive and negative changes are significantly different from a normal
distribution (with p<0.01). These distributions have kurtosis and L-moments kurtosis of
respectively: 30.14 and 0.727 for the pooled distribution; 13.92 and 0.351 for the positive change
distribution; 8.83 and 0.313 for the negative change distribution. These results also demonstrate
that the distribution of negative changes is still leptokurtic, but closer to a normal distribution than
the others.
By relying on tobacco taxation as a measure of policy commitment to tobacco control, I
demonstrated that tobacco control behaves like other policies. When the percentages in annual
change are pooled together the result is a leptokurtic distribution, which suggests that tobacco
control evolves through recurrent periods of inertia punctuated by rare periods of drastic change.
Furthermore, by dividing this distribution into two sub-distributions representing positive and
negative changes, I found that the former is more punctuated than the latter. In other words,
positive changes (in this case increases in tobacco taxation) are more characterised by positive
feedback effects, whereas negative changes are more characterised by negative feedback effects.
Again, this is in line with what happens in other policies.

This part tests whether punctuations are present also in other types of policy commitment than
taxation. Figure 3 shows the distribution of the percentage in change in tobacco control regulation
pooled across countries, years and policy areas. Differently from above, I do not use the annual
percentage change, but the percentage change between those years in which at least one piece of
legislation was enacted, as done in Baumgartner et al. (2009, 610). Similarly to tobacco taxation,
this distribution does not take a bell shape and all the main tests for normality above show that this
distribution is significantly different from a normal distribution (with p<0.01). Accordingly, I
provide confirmation for the punctuation hypothesis also in different types of policy commitments
other than taxation.
The distribution of the percentage in change in tobacco control regulation has kurtosis and L-
moments kurtosis values respectively of 5.81 and 0.226, which are much lower than the values for
the distribution of change in tobacco taxation and almost close to those of a normal distribution.
These findings provide empirical evidence for the claim put forward by the friction model, namely
that the degree of punctuations increases by moving down the policy cycle, because the role of
frictions is stronger for outputs (Baumgartner et al. 2009, 615). Indeed, tobacco taxation is the
result of a long and complicated decision-making process which involves different actors, similar
to the one in place for budgetary expenditures. Conversely, the tobacco regulation in Figure 3
comprises also laws and administrative decrees which are in turn more similar to what the literature
calls policy processes, which are the results of more informal and straightforward process, where
the role of frictions is in turn lower and punctuations are hence fewer.
Further evidence for the argument that tobacco control behaves like other issues is shown in Figure
4. This figure plots the same distribution as in Figure 3, but it divides it into different policy areas.
The normality tests show that the distributions for the different policy areas are different from a
normal distribution (with p<0.01). This is in line with what discussed above, namely that different
types of policy change and commitment are subject to punctuations. Table 1 shows the kurtosis
and L-moments kurtosis values for the distributions in the figure. Findings provide support for the
claim that certain policy commitments are characterised by more punctuations as the role of
institutional frictions is higher. Low kurtosis and L-moments kurtosis values are observed for sales
and advertisement regulation, whereas ETS regulation and education have high values. This
suggests that the former are closer to a normal distribution than the latter. The reason is presumably
that ETS regulation and education are policy areas which comprise many types of policy
instruments, but mostly highly conflictual legislation passed in the 2000s, such as smoking bans
and provisions imposing health warnings on cigarette packs. These types of policy commitment
are usually the result of a long and complicated process which requires coordination between
different actors (Baumgartner et al. 2009, 615). As argued by the friction model, these types of
policy commitment are more subject to institutional frictions and hence show higher levels of
punctuations. Conversely, sales and advertisement regulation comprises also a series of voluntary
agreements in place since the 1980s (which were then transposed into legislation decades later)
through which the industry regulated itself on these matters. These types of policy commitment in
turn do not require intense coordination across different actors and long and complicated
processes. Accordingly, the difference across distributions are presumably due to the fact that self-
regulation, strongly used in advertisement and sales restriction, is the result of a more
straightforward and informal decision-making process than legislation, which follows the formal
process, which is in turn more subject to institutional frictions.
The findings in Figure 4 and Table 1 provide some interesting and new insights on the evolution
of tobacco control over time. In the 1980s, tobacco control concerned mainly sales and
advertisement regulation, which took place in the form of voluntary agreements and soft
legislation, where the role of institutional frictions is lower, according to the public policy literature
(Baumgartner et al. 2009). Hence, during that time policy change in tobacco control was more
‘punctuatedly’ gradual. Conversely, in the 1990s and 2000s the focus in tobacco control shifted to
ETS regulation and education, mainly through tough legislation, such as advertisement and
smoking bans. In this case, policy change started to be more ‘punctuatedly’ drastic.
CONCLUSION
This work finds that both tobacco taxation and other types of policy commitment, such as
advertisement and smoking regulation, are characterised by punctuations. These findings suggest
that tobacco control is characterised by periods of incremental change or inertia, related to negative
feedback effects, punctuated by periods of drastic change, related to positive feedback effects. This
work is the first large-N test of the punctuated equilibrium theory on tobacco control. Future
research in this area should address some of the limitations in this study and, for instance, use data
for a higher number of policy instruments and over a longer period of time, in order to extend the
analysis and compare policy dynamics across countries.
The findings above have interesting implications for the public policy literature more in general.
First, they provide support for the punctuated equilibrium theory in a new empirical setting,
namely taxation. Although the literature has so far focused on several types of policy commitment,
such as budget output and legislation, taxation has received little attention. Second, the analysis
on tobacco regulation in the second part provides further confirmation for the friction model.
The findings in this study suggest practical implications for tobacco regulation. Today, the debate
on tobacco control in the Western world revolves around plain packaging. The latter refers to the

removal of branding from tobacco packaging and it represents the last frontier in the fight against
smoking. Australia was the first country to introduce this measure in 2012, followed by others,
such as the UK and Ireland. Yet, several countries are currently struggling to pass such legislation
and those that have already done it already are facing delays in the implementation stage. These
obstacles may be seen under the light of the processes uncovered in this study. Indeed, once the
momentum for tough regulation passes and media and public attention shifts away, the punctuation
seen above, it becomes harder and harder to regulate an area.

FIGURES AND TABLES
Figure 1 Distribution of the Percentage in Annual Change in Ad Valorem Excise on Cigarettes
(Pooled across Countries and Years)

Figure 2 Log-Log Plot of the Distribution of the Percentage in Annual Increases and Decreases
in Ad Valorem Excise on Cigarettes (Pooled across Countries and Years)
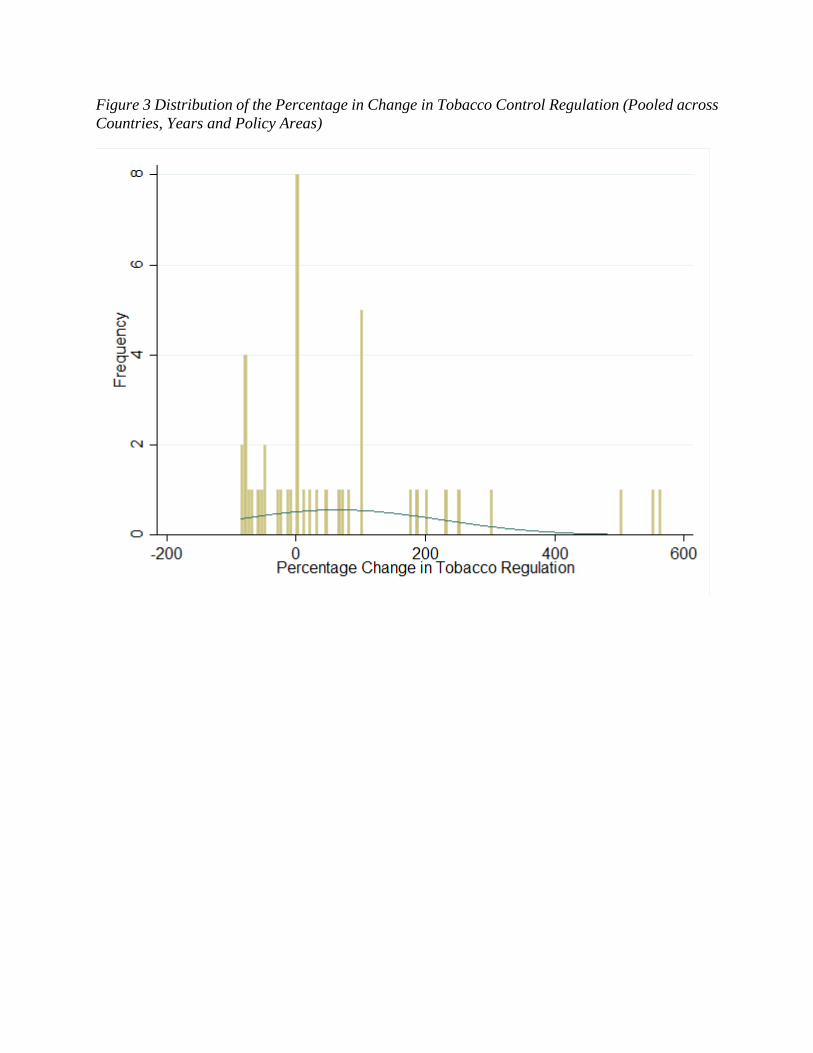
Figure 3 Distribution of the Percentage in Change in Tobacco Control Regulation (Pooled across
Countries, Years and Policy Areas)

Figure 4 Distribution of the Percentage in Change in Tobacco Control Regulation (Pooled across
Countries and Years, by Policy Area)

Table 1 Kurtosis and L-moments Kurtosis Values for the Distribution of the Percentage in Change
in Tobacco Control Regulation (Pooled across Countries and Years, by Policy Area)
Policy Area Kurtosis L-moments Kurtosis
Sales 4.49 0.17
Advertisement 4.36 0.14
ETS 18.80 0.43
Education 12.69 0.47

REFERENCES
Aspect. Tobacco or Health in the European Union - Past, Present and Future. European Commission, October 2004 2004. Available from http://ec.europa.eu/health/ph_determinants/life_style/Tobacco/Documents/tobacco_exs_en.pdf.
Baumgartner, F.R., and B.D. Jones. 1993. Agendas and Instability in American Politics. Chicago, IL: University of Chicago Press.
Baumgartner, F.R., and B.D. Jones. 2009. Agendas and Instability in American Politics, Second Edition. Chicago, IL: University of Chicago Press.
Baumgartner, Frank R., Christian Breunig, Christoffer Green-Pedersen, Bryan D. Jones, Peter B. Mortensen, Michiel Nuytemans, and Stefaan Walgrave. 2009. "Punctuated Equilibrium in Comparative Perspective." American Journal of Political Science no. 53 (3):603-620. doi: 10.2307/25548140.
Breunig, Christian. 2006. "The more things change, the more things stay the same: a comparative analysis of budget punctuations." Journal of European Public Policy no. 13 (7):1069-1085. doi: 10.1080/13501760600924167.
Breunig, C., Koski, C., & Mortensen, P. B. 2009. “Stability and punctuations in public spending: A comparative study of budget functions.” Journal of Public Administration Research and Theory no. 20 (3): 703-722.
Cairney, P. 2011. Understanding Public Policy: Theories and Issues. Basingstoke, UK: Palgrave Macmillan. Cairney, P., D.T. Studlar, and H.M. Mamudu. 2012. Global Tobacco Control: Power, Policy, Governance and
Transfer. Basingstoke, UK: Palgrave Macmillan. CEC. Excise Duty Tables 1991 [cited XXI-796/91-EN. Available from
https://circabc.europa.eu/faces/jsp/extension/wai/navigation/container.jsp. CEC. Excise Duty Tables 1992 [cited XXI-720/92-EN. Available from
https://circabc.europa.eu/faces/jsp/extension/wai/navigation/container.jsp. CEC. Excise Duty Tables 1993 [cited XXI-52/93-EN. Available from
https://circabc.europa.eu/faces/jsp/extension/wai/navigation/container.jsp. CEC. Excise Duty Tables 1994 [cited XXI-183/94-EN. Available from
https://circabc.europa.eu/faces/jsp/extension/wai/navigation/container.jsp. CEC. Excise Duty Rates 1995a [cited November. Available from
https://circabc.europa.eu/faces/jsp/extension/wai/navigation/container.jsp. CEC. Excise Duty Tables 1995b [cited March. Available from
https://circabc.europa.eu/faces/jsp/extension/wai/navigation/container.jsp. CEC. Excise Duty Tables 1998a [cited December. Available from
https://circabc.europa.eu/faces/jsp/extension/wai/navigation/container.jsp. CEC. Excise Duty Tables 1998b [cited September. Available from
https://circabc.europa.eu/faces/jsp/extension/wai/navigation/container.jsp. CEC. Excise Duty Tables 1998c [cited October. Available from
https://circabc.europa.eu/faces/jsp/extension/wai/navigation/container.jsp. CEC. Excise Duty Tables 1999a [cited REF 1.000 - April. Available from
https://circabc.europa.eu/faces/jsp/extension/wai/navigation/container.jsp. CEC. Excise Duty Tables 1999b [cited REF 1.001 - May. Available from
https://circabc.europa.eu/faces/jsp/extension/wai/navigation/container.jsp. CEC. Excise Duty Tables 1999c [cited REF 1.003 - October. Available from
https://circabc.europa.eu/faces/jsp/extension/wai/navigation/container.jsp.
CEC. Excise Duty Tables 1999d [cited REF 1.002 - June Available from https://circabc.europa.eu/faces/jsp/extension/wai/navigation/container.jsp.
CEC. Excise Duty Tables 2000a [cited REF 1.006 -March. Available from https://circabc.europa.eu/faces/jsp/extension/wai/navigation/container.jsp.
CEC. Excise Duty Tables 2000b [cited REF 1.009 - July. Available from https://circabc.europa.eu/faces/jsp/extension/wai/navigation/container.jsp.
CEC. Excise Duty Tables 2000c [cited REF 1.007 - April. Available from https://circabc.europa.eu/faces/jsp/extension/wai/navigation/container.jsp.
CEC. Excise Duty Tables 2001a [cited REF 1.012 - July. Available from https://circabc.europa.eu/faces/jsp/extension/wai/navigation/container.jsp.
CEC. Excise Duty Tables 2001b [cited REF 1.011 - April. Available from https://circabc.europa.eu/faces/jsp/extension/wai/navigation/container.jsp.
CEC. Excise Duty Tables 2002 [cited REF 1.014 - April. Available from https://circabc.europa.eu/faces/jsp/extension/wai/navigation/container.jsp.
CEC. Excise Duty Tables 2003 [cited REF 1.016 - April. Available from https://circabc.europa.eu/faces/jsp/extension/wai/navigation/container.jsp.
CEC. Excise Duty Tables 2004 [cited REF 1.019 - May. Available from https://circabc.europa.eu/faces/jsp/extension/wai/navigation/container.jsp.
CEC. Excise Duty Tables 2005 [cited REF 1.020 - January. Available from https://circabc.europa.eu/faces/jsp/extension/wai/navigation/container.jsp.
CEC. Excise Duty Tables 2006 [cited REF 1.023 - July. Available from https://circabc.europa.eu/faces/jsp/extension/wai/navigation/container.jsp.
CEC. Excise Duty Tables 2007 [cited 1.024 - January. Available from https://circabc.europa.eu/faces/jsp/extension/wai/navigation/container.jsp.
CEC. Excise Duty Tables 2009 [cited REF 1.028 rev.3 - January. Available from https://circabc.europa.eu/faces/jsp/extension/wai/navigation/container.jsp.
CEC. Excise Duty Tables 2010 [cited REF 1031 rev.1 - July. Available from https://circabc.europa.eu/faces/jsp/extension/wai/navigation/container.jsp.
CEC. Excise Duty Tables 2011 [cited REF 1033 - July. Available from https://circabc.europa.eu/faces/jsp/extension/wai/navigation/container.jsp.
CEC. Excise Duty Tables 2012a [cited REF 1035 REV 1 - July. Available from https://circabc.europa.eu/faces/jsp/extension/wai/navigation/container.jsp.
CEC. Excise Duty Tables 2012b [cited REF 1034 rev1 - January. Available from https://circabc.europa.eu/faces/jsp/extension/wai/navigation/container.jsp.
CEC. Excise Duty Tables 2013 [cited REF 1038 rev1 - July. Available from https://circabc.europa.eu/faces/jsp/extension/wai/navigation/container.jsp.
Davis, Otto A, Michael Alan Howarth Dempster, and Aaron Wildavsky. 1966. "A theory of the budgetary process." American Political Science Review no. 60 (03):529-547.
Gilmore, Anna B., Behrooz Tavakoly, Gordon Taylor, and Howard Reed. 2013. "Understanding tobacco industry pricing strategy and whether it undermines tobacco tax policy: the example of the UK cigarette market." Addiction no. 108 (7):1317-1326. doi: 10.1111/add.12159.
Givel, Michael. 2006. "Punctuated Equilibrium in Limbo: The Tobacco Lobby and U.S. State Policymaking from 1990 to 2003." Policy Studies Journal no. 34 (3):405-418. doi: 10.1111/j.1541-0072.2006.00179.x.
Heclo, H. 1977. A Government of Strangers: Executive Politics in Washington. Washington, DC: Brookings Institution Press.
John, Peter, and Helen Margetts. 2003. "Policy punctuations in the UK: Fluctuations and equilibria in central government expenditure since 1951." Public Administration no. 81 (3):411-432.
Jones, B.D., and F.R. Baumgartner. 2005. The Politics of Attention: How Government Prioritizes Problems. Chicago, IL: University of Chicago Press.
Jones, Bryan D., Frank R. Baumgartner, Christian Breunig, Christopher Wlezien, Stuart Soroka, Martial Foucault, Abel François, Christoffer Green-Pedersen, Chris Koski, Peter John, Peter B. Mortensen, Frédéric Varone, and Stefaan Walgrave. 2009. "A General Empirical Law of Public Budgets: A Comparative Analysis." American Journal of Political Science no. 53 (4):855-873. doi: 10.1111/j.1540-5907.2009.00405.x.
Kwak, Sunjoo. 2017. "“Windows of Opportunity,” Revenue Volatility, and Policy Punctuations: Testing a Model of Policy Change in the American States." Policy Studies Journal no. 45 (2):265-288. doi: 10.1111/psj.12144.
Lindblom, Charles E. 1959. "The Science of "Muddling Through"." Public Administration Review no. 19 (2):79-88. doi: 10.2307/973677.
Lindblom, Charles E. 1979. "Still Muddling, Not Yet Through." Public Administration Review no. 39 (6):517-526. doi: 10.2307/976178.
Mortensen, P. 2005. "Punctuations and stability in local Danish budgets." Public Administration no. 83 (4):931–950.
Padgett, John F. 1980. "Bounded rationality in budgetary research." American Political Science Review no. 74 (02):354-372.
Simon, Herbert A. 1985. "Human nature in politics: The dialogue of psychology with political science." American Political Science Review no. 79 (02):293-304.
Smith, K, A. Gilmore, F. Chaloupka, and S. Delipalla. 2011. Tobacco Industry Pricing, Price-Related Marketing and Lobbying Strategies, IARC Handbooks of Cancer Prevention: Tobacco Control. Lyon, France: International Agency for Research on Cancer.
Studlar, Donley T. 2006. "Tobacco Control Policy Instruments in a Shrinking World: How Much Policy Learning?" International Journal of Public Administration no. 29 (4-6):367-396.
Studlar, Donley T., Kyle Christensen, and Arnita Sitasari. 2011. "Tobacco control in the EU-15: the role of member states and the European Union." Journal of European Public Policy no. 18 (5):728-745. doi: 10.1080/13501763.2011.586801.
WHO. technical manual on tobacco tax administration 2010. Available from http://www.who.int/tobacco/publications/tax_administration/en/.
WHO. Enforcing bans on tobacco advertising,promotion and sponsorship 2013. Available from http://apps.who.int/iris/bitstream/10665/85380/1/9789241505871_eng.pdf.