a comparative study on development of small and medium...
TRANSCRIPT

DOI: 10.21276/sjbms
357
Saudi Journal of Business and Management Studies ISSN 2415-6663 (Print) Scholars Middle East Publishers ISSN 2415-6671 (Online)
Dubai, United Arab Emirates
Website: http://scholarsmepub.com/
A Comparative Study on Development of Small and Medium Enterprises (SMEs)
in Japan and Malaysia C. Hironaka
1*, M. A. Zariyawati
2, F. Diana-Rose
3
1Faculty of Economics, Shiga University, Hikone, Japan
2,3Faculty of Economics and Management, Universiti Putra Malaysia, Selangor, Malaysia
*Corresponding Author: C. Hironaka
Email: [email protected]
Abstract: The purpose of this paper is to explore the best practice of small medium enterprises (SMEs) from Japan.
Japan has been proven to be successful lesson to be followed by Malaysia. Japan’s SMEs began after World War II in
1945. Thus, it has shown that the development process has intricacies and can be studied by Malaysian SMEs, which
began in the 1970s due to the revolution of new economic policies. This paper provides the understanding of the
development of SMEs between Japan and Malaysia. Further, we identify a gap between SMEs in Malaysia and SMEs in
Japan as best practice. The challenges SMEs face might be different in their respective countries—it might be from the
perspective of cultural aspects, market environments, and more, but with the initiative measures, pro and cons of both
countries’ SMEs can enhance their duty as the backbone of a country’s economy.
Keywords: Business Support, Economy, Japan, Malaysia, Small and Medium Enterprises (SMEs)
INTRODUCTION
Small and medium enterprises (SMEs) indicate
the contribution to gross domestic product (GDP),
which constitutes the backbone of an economy in high-
income countries and is typically less developed in low-
income countries. SMEs also had significance in
creating employment opportunities. As describe by a
previous researcher, job creation is important for
survival, especially in third-world countries. Hence,
SMEs makes a critical contribution to GDP and
employment [1-3].
The term ―SME‖ encompasses a broad
definition. Different organizations and countries set
their own guidelines for defining SMEs businesses,
often based on employee, sales, or assets. For instance,
the World Bank defines SMEs based on total
employees, annual revenue, and assets. The European
Union (EU) is defined by total employees, annual
turnover, and/or annual balance sheets. However, Egypt
and Vietnam only are defined based on total employees.
Different countries usually have given their own
definitions based on the category of business.
Though definitions of SMEs vary, they have
similar duties. SMEs play a crucial role in stimulating
economic growth, generating employment, and
contributing to a country’s income. However, not all
SMEs succeed in performing their roles for income
generation. On the other hand, there are also SMEs in
countries that are a best practice as in Japan. Thus, this
study discusses a comparative study on development of
small and medium enterprises (SMEs) in Japan and
Malaysia. Mainly, it is based on difference functions of
SMEs implemented in both countries, where Japan has
experienced a lesson for Malaysia. Specifically, to
compare SMEs in Japan’s counterparts in Malaysia and
what lessons can be drawn for Malaysian in which to
enhance the contribution of the sector and industry.
Perhaps this study also would be a guideline and assist
government agencies, small business, consultants, and
policy planners that need to gain a better understanding
into the main challenges facing SMEs in these
countries.
OVERVIEW OF SMES IN MALAYSIA
The definition of small medium enterprises
(SME) varies in all countries. The policymakers of each
country use several criteria in categorizing SMEs. Most
countries use two criteria for separating and defining
SMEs into several categories, such as number of
employees, annual sales, total capital, and fixed assets.
In Malaysian, SMEs are defined based on two criteria,
which are total sales turnover and number of
employees. SMEs in Malaysia are classified into three
size categories:
i) Micro
ii) Small
iii) Medium
Further, SMEs fall into five industry sectors
under each size categories, as simplified in Table 1:

Hironaka C et al.; Saudi J. Bus. Manag. Stud.; Vol-2, Iss-4A (Apr, 2017):357-364
Available Online: http://scholarsmepub.com/sjbms/ 358
Table 1: Definition of SME by Sector Category
Category Micro Small Medium
Manufacturing Sales turnover of less than
RM300,000 OR
Employees of less than 5
Sales turnover from
RM300,000 to less than
RM15mil OR
Employees from 5 to less
than 75
Sales turnover from RM15mil
not exceeding RM50mil OR
Employees from 75 to not
exceeding 200
Services, Construction,
Agriculture, Mining and
Quarrying
Sales turnover of less than
RM300,000 OR
Employees of less than 5
Sales turnover from
RM300,000 to less than
RM3 mil OR
Employees from 5 to less
than 30
Sales turnover from RM3mil
to not exceeding RM20mil OR
Employees from 30 to not
exceeding 75
Source: SME Annual Report 2014 [4]
As acknowledged by the National SME
Development Council (NSDC), many challenges occur
in developing economies such as price inflation,
structural changes, and change in business trends. Due
to these matters, the Malaysian government has
reviewed and endorsed a new definition of SMEs in
2014, as proposed by the Ministry of International
Trade and Industry Malaysia (MITI). The government
has endorsed a new definition because it is more
appropriate for SMEs to meet new business challenges
in the competitive global business meets [5]. The new
definition also highlighted that all SMEs must be
entities registered with the Companies Commission of
Malaysia (SSM) or other equivalent bodies.
However, it excludes
i. Entities that are public listed on the main board
ii. Subsidiaries of
Multinational corporations (MNCs)
Government-linked companies (GLCs)
Syarikat Menteri Kewangan Diperbadankan
(MKDs)
State-owned enterprises
Based on the [6], there were about 645,136
total SMEs operating their businesses in Malaysia,
representing 97.3%. The highest establishment category
is micro size at 77%, small size at 20%, and medium at
3%. Table 2 shows the total numbers of SMEs in the
country based on industry sector. About 580,985 SMEs
are established in the service sector, which is the
highest industry sector of Malaysia, followed by the
manufacturing sector (37,861), construction (19,283),
and agriculture (6,708), and the least involvement of
SMEs is in the mining and quarrying sector, in which
only 299 SMEs are established.
Table 2: Number of Establishments by Sector and Percentage Share to Total SMEs and Establishments
Sector Total
Establishments
(a)
Total SMEs
(b)
Percentage (%) of SMEs
over Total Establishments
(b)/(a)*100
Total employment by
SMEs
Overall Total 662,939 645,136 97.3 3,669,259
Services 591,883 580,985 98.1 2,610,373
Manufacturing 39,669 37,861 95.4 698,713
Agriculture 8,829 6,708 76.0 78,777
Construction 22,140 19,283 87.1 275,631
Mining and
Quarrying
418 299 71.5 5,765
Source: Census Report SMEs 2011
Figure 1 shows a list of all subsectors in the
services sector. This clearly states that the wholesale
and retail trade, restaurants, and accommodation have
the highest concentration on SMEs, with a total of 75%
(435,336 establishments), followed by the second
highest in the service sector, which is finance,
insurance, real estate, and business services at 15%
(88,960 SME establishments), and the third highest
concentration is transport and storage and
communication at 7% (41,905 SME establishments).

Hironaka C et al.; Saudi J. Bus. Manag. Stud.; Vol-2, Iss-4A (Apr, 2017):357-364
Available Online: http://scholarsmepub.com/sjbms/ 359
Fig-1: Percentage of SMEs in the Service Sector by Sub-Sectors
Source: Census Report SMEs 2011
The manufacturing sector consists of five
subsectors, which consist of textile and wearing
apparel, non-metallic mineral products, basic metal, and
fabricated metal products, food, beverages and tobacco,
petroleum, chemical, rubber and plastics products, and
overall manufacturing. Figure 2 exhibits that the overall
manufacturing subsector is the largest (33%; 11785)
SME under manufacturing sectors. This establishment
is followed by textile and wearing apparel (27%;
10047), nonmetallic mineral products, basic metal and
fabricated metal products (17%; 6,414), food,
beverages, and tobacco (16%; 6176), and the least
subsector is petroleum, chemical, rubber, and plastics
products (7%; 2780).
Fig-2: Percentage of SMEs in the Manufacturing Sector by Sub-Sectors
Source: Economic Census SMEs 2011
Figure 3 shows a list of subsectors in
agriculture. The highest total establishment of SMEs is
crops at 70% (4,725), followed by the livestock at 13%
(900 SME establishments), fisheries at 12% (781 SME
establishments), and forestry and logging at 5% (302
SME establishments).
Fig-3: Percentage of SMEs in the Agriculture Sector by Sub-Sectors
Source: Economic Census SMEs 2011

Hironaka C et al.; Saudi J. Bus. Manag. Stud.; Vol-2, Iss-4A (Apr, 2017):357-364
Available Online: http://scholarsmepub.com/sjbms/ 360
The constructions sector has four subsectors
that consist of nonresidential buildings, civil
engineering, special trades, and residential buildings.
Figure 4 exhibits the highest distribution of SME
establishments, which are special trades at 40% (7,747),
followed by nonresidential buildings at 22% (4,149);
civil engineering at 21% (4,050), and residential
buildings at 17% (3,337).
Fig-4: Percentage of SMEs in the Construction Sector by Sub-Sectors
Source: Economic Census SMEs 2011
Last, Figure 5 displays two subsectors in
mining and quarrying. The highest concentration is
stone and quarrying at 84% (250 SME establishments)
and mineral mining at 16% (49 SME establishments).
Fig-5: Percentage of SMEs in the Mining and Quarrying Sector by Sub-Sectors
Source: Economic Census SMEs 2011
Contribution to Economic Development
Consistent with other countries, Malaysia’s
SMEs also play a vibrant component in economic
development. Despite the gross domestic product
(GDP) growth; contribution of SMEs to employment,
export, and productivity is essential for economic
development [7, 8]. According to the SME annual
report 2014/2015, SMEs contribute to 35.9% to
Malaysia’s GDP. This value has increased from 32.2%
in 2010. In addition, Figure 6 shows SME GDP growth
in all sectors. Meanwhile, Figure 7 shows value-added
growth of SMEs across all economic sectors. The
growth of value added in each sector in SMEs is higher
compared with the overall value-added GDP growth in
all sectors, excluding mining and quarrying.
Fig-6: SME GDP Growth
Source: SME Annual Report 2014/2015

Hironaka C et al.; Saudi J. Bus. Manag. Stud.; Vol-2, Iss-4A (Apr, 2017):357-364
Available Online: http://scholarsmepub.com/sjbms/ 361
Fig-7: Percentage of SME GDP in year 2014
Source: SME Annual Report 2014/2015
Table 3 shows total SME growth in
employment, exports, and productivity. SMEs also
contributed to about 65% of total employment in 2014.
The categories of workers in Malaysia are classified as
full-time employees, working proprietors, active
business partners, unpaid family workers, and part-time
employees. Furthermore, SMEs contribute to Malaysian
exports at 17.8% of total exports in 2014. However, the
productivity of SMEs slightly decreases from previous
years at RM62,327 in 2013 to RM58,213 in 2014.
Table 3: Total SME Growth in Employment, Export and Productivity
Year 2010 2011 2012 2013
2014
Share of SME Employment of Overall
Employment
57.1 57.3 57.2 57.5 65.0
SME Employment Growth - 3.9 5.9 6.3 21.6
Share of SME Export of Overall Export 16.4 16.9 15.5 17.8 17.8
SME Export Growth - 12.2 2.8 1.6 6.2
SME Productivity (RM) 60,241 62,179 62,277 62,327 58,213
SME Productivity Growth - 3.2 0.2 0.1 -6.6
Source: Department of Statistics Malaysia (DOSM)
Responsible Agency
The Ministry of International Trade and
Industry Malaysia (MITI) plays an important role in
ensuring the development of SMEs. It coordinates
SMEs by formulating all policies and strategies for
growth through SME Corporation Malaysia (SME
Corp.), previously known as the Small and Medium
Industries Development Corporation (SMIDEC). SME
Corp. is a central agency under MITI, established on
May 2, 1996, to spur SMEs by providing infrastructure
facilities, financial assistance, advisory services, market
access, and other support programs.
To ensure the role of SME Corp. is achieved,
they established the highest policy-making body in
2004: the National SME Development Council
(NSDC). Part of the NSDC task is to formulate
strategies for SME development across all economic
sectors. However, in 2007, the NSDC decided to
appoint a single dedicated agency to formulate overall
policies and strategies for SMEs and to coordinate
programs across all related ministries and agencies. Due
to this reason, SMIDEC was officially transformed into
the SME Corp. in 2009 as the central point of reference
information and advisory services for all SMEs in
Malaysia. It is called the nation’s premier organization
for the development of progressive SMEs in Malaysia
to achieve the 2020 master plan.
In achieving the 2020 master plan, a central
point (SME Corp.) under MITI will not be sufficient to
handle countless SMEs. Thus SMEs in Malaysia require
a variety of agencies from different ministries in order
to provide special functions and funds. For instance, the
Business Development Division (BPP) was established
in 2002 under the Ministry of Domestic Trade, Co-
operatives and Consumerism (KPDNKK) to elevate the
SMEs’ agenda by promoting them in domestic and
international levels. Parts of BPP activities are to
increase and enhance the participation of Bumiputera’s
SMEs in the distributive trade sector. In addition,
several ministries had established a statutory body,
which has been approved by an act of parliament. Table
4 shows functions of some statutory bodies in Malaysia.
Hironaka C et al.; Saudi J. Bus. Manag. Stud.; Vol-2, Iss-4A (Apr, 2017):357-364
Available Online: http://scholarsmepub.com/sjbms/ 362
Table 4: List of Related Ministry, Statutory Body and Functions
Related Ministries Statutory Body Functions 1Ministry of Science
Technology and Innovation
SIRIM To develop and enhance local M&E industries
capabilities in technologies. Specifically
promote development in the local machinery
and equipment. 2Ministry of Agriculture and
Agro Based Industry Malaysia
Federal Agricultural
Marketing Authority
(FAMA)
To improve the efficiency and effectiveness of
agriculture products among entrepreneurs in
marketing and remain competitive. 3Ministry of Rural and Regional
Development
Majlis Amanah Rakyat
(MARA)
Developing, encouraging, facilitating and
fostering the viable entrepreneurs in the
federation and particularly in rural areas.
Source: 1 Website: http://www.sirim.my 2 http://www.fama.gov.my/en/
3 http://www.mara.gov.my/en/
Furthermore, the SME Corp. forges close
partnerships with state governments. It collaborates
with industry associations and partners from public and
private sectors. The collaboration functions are to
support and promote the development of SMEs in each
state of Malaysia. Each state has its own agency such as
PERDA (Pulau Pinang), KuGerak (Kedah), Bahagian
Pembangunan (Pahang), and many more. Even though
many agencies are involved in the development of
SMEs by implementing programs such as market
access, human capital development, access to finance,
innovation, and technology adoption, and infrastructure,
all the activities are coordinated by the SME Corp.
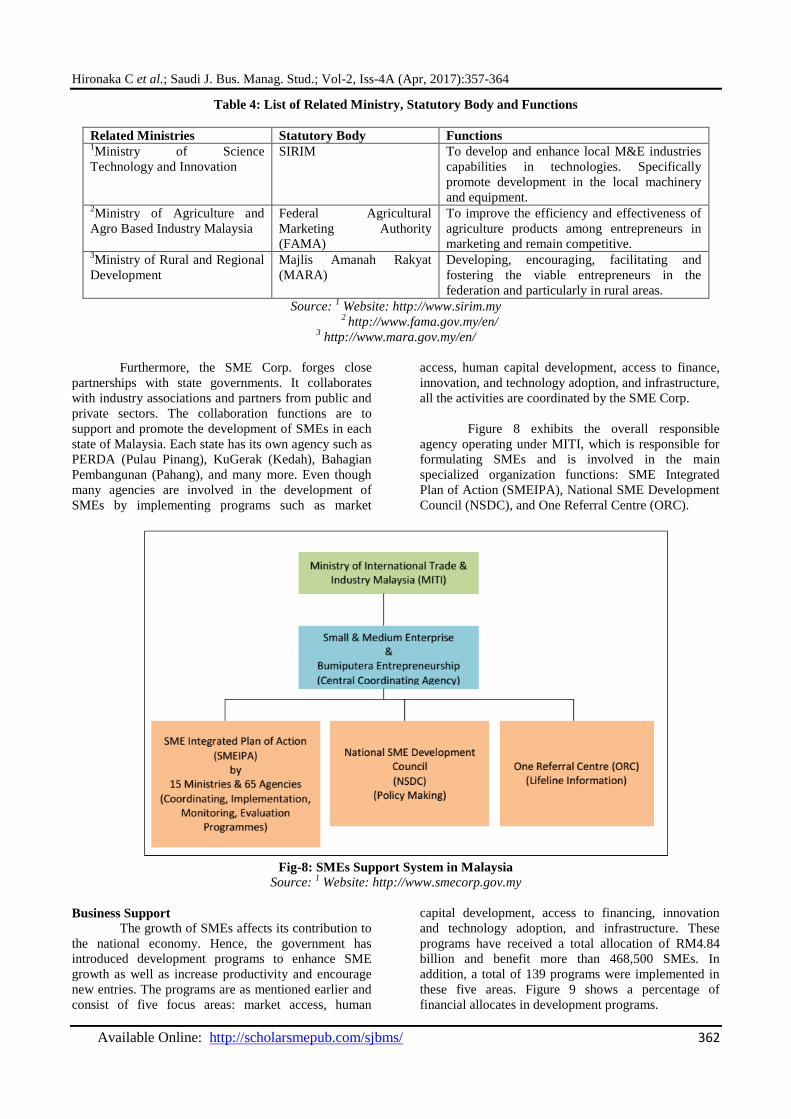
Figure 8 exhibits the overall responsible
agency operating under MITI, which is responsible for
formulating SMEs and is involved in the main
specialized organization functions: SME Integrated
Plan of Action (SMEIPA), National SME Development
Council (NSDC), and One Referral Centre (ORC).
Fig-8: SMEs Support System in Malaysia
Source: 1 Website: http://www.smecorp.gov.my
Business Support
The growth of SMEs affects its contribution to
the national economy. Hence, the government has
introduced development programs to enhance SME
growth as well as increase productivity and encourage
new entries. The programs are as mentioned earlier and
consist of five focus areas: market access, human
capital development, access to financing, innovation
and technology adoption, and infrastructure. These
programs have received a total allocation of RM4.84
billion and benefit more than 468,500 SMEs. In
addition, a total of 139 programs were implemented in
these five areas. Figure 9 shows a percentage of
financial allocates in development programs.

Hironaka C et al.; Saudi J. Bus. Manag. Stud.; Vol-2, Iss-4A (Apr, 2017):357-364
Available Online: http://scholarsmepub.com/sjbms/ 363
Fig-9: SME Development Programs in 2015 by Focus Areas
Source: SME annual report 2014/2015
Figure 9 also shows that the government has
allocated RM89.7 million for 36 programs through
various ministries and agencies in promoting access to
markets that are expected to benefit some 18,842 SMEs.
This is to motivate SMEs to take part in innovation,
diversifying their products/services, and expanding their
limits to adhere to higher standards. Meanwhile, in
human capital development, the government has lined
up 36 programs to train and upgrade the skills of SMEs
employees. In total, RM70.7 million has been allocated,
which has to assist almost 20,000 SMEs.
Next, the government has earmarked RM357.3
million in innovation and technology adoption. Figure 9
shows that about 7,000 total establishments of SMEs
received the programs such as receiving new
technology, technical improvements, and innovation for
business grow. This represents or has shifted the
products/services with licensing intellectual property
(IP) onto the next level. Other than that, the government
has encouraged all businesses to implement ICT
adoption in their operations. Besides, aside from
functioning operations, the government has provided
programs such as infrastructure facilities. This benefit
has been given to 228 establishments of SMEs with
RM224 million implemented for 15 programs. The
reasons are to enhance the organization’s reputation and
the ability to attract good quality clients and talent. It is
clearly seen that access to financing accounts as the
main contributor to the development of the SME
establishment. The benefit is expected to assist almost
422,838 SMEs with a total amount allocated at 4,102.9
million, thus bringing a total of 29 programs
implemented by the government.
This reveals that SME financing is one of the
primary facilities provided by the ministries and
agencies related to development of SMEs. Figure 10
exhibits the financial landscape for SMEs in Malaysia.
Financial institutions comprise of banking institutions
(BIs) and the development financial institutions (DFIs)
serve as the main source of financing to SMEs. In
Malaysia, SMEs can depend on financial institutions
owned by government funding and the private sector to
finance business operations. Prior to year 2000, only
government agencies, including DFIs (such as BSN
Bank, TEKUN, MARA, Agro Bank, and YUM), are the
main providers of financing facilities to SMEs. Private
sector agencies such as commercial banks typically
refuse to be involved in providing financial aid to SMEs
due to repayment problems [9]. In addition, many
SMEs, especially from the service sector, do not own
land and equipment; as a result, it is difficult to provide
any form of security or collateral to financial
institutions when applying loans [10].
Fig-10: Financial Landscape for SMEs

Hironaka C et al.; Saudi J. Bus. Manag. Stud.; Vol-2, Iss-4A (Apr, 2017):357-364
Available Online: http://scholarsmepub.com/sjbms/ 364
However, after year 2000, the number of
private sector agencies get involved in providing
financial aid to SMEs increased due to government
influence. For example, commercial banks that provide
financing facilities to SMEs are Maybank, Public Bank,
and CIMB. The main financing facilities provided by
the private sector to SMEs are various types of loans
such working capital loans and hire purchase loans.
Despite soft loans, government agencies also provide
different types of financing facilities such as grants,
equity financing, venture capital, guarantee schemes,
and tax incentives. A list of special funds and guarantee
schemes by the government sector is shown in Table 5.
Table 5: Types of Special funds and Guarantee Scheme by BNM
Types of fund/scheme Allocations (RM million) Utilization Rate (%)
Fund for Food 300 92.7
New Entrepreneurs Fund 2 2,555.0 36.0
Fund for Small and Medium Industries 2 6,300.0 82.7
Micro Enterprise Fund 200.0 73.3
Bumiputera Entrepreneurs Project Fund- Islamic 300.0 25.6
Total 9,650 68.7
Source: SME Annual Report 2014
Other than BIs and DFIs, the financial
landscape for SMEs also includes other sources of
financing such as venture capital companies, leasing
and factoring, Ar-Rahnu and pawn broking (Shariah-
compliant financing), and microfinance institutions.
OVERVIEW OF SMES IN JAPAN
Japanese SMEs are classified according to the
stated capital and number of employees. SMEs must
meet one or more of these conditions. SMEs in Japan
are also classified into two sizes as below:
iii. Micro
iv. Small and Medium
A breakdown of the SME definition is
displayed in Table 6. These are defined under Article 2
of the Small and Medium-size Enterprise Basic Act as
well.
They are categorized into four types of
industries:
1) Manufacturing, construction, transportation, etc.
(excluding 2–4)
2) Services (e.g., educational, medical, real estate, etc.)
3) Wholesale (wholesale for textiles, food, building
materials, and machinery, etc.)
4) Retail (food, machinery, restaurants, and
accommodation, etc.)
*Agricultural industry is excluded from SME, because
they are not incorporated legally.
Table 6: Definition of SME in Japan
Category SMEs Of which Micro Enterprises
Manufacturing Stated capital; 300 million JPY or less
OR
Employees: 300 or fewer
Employees; 20 or fewer
Wholesale
Stated capital; 100 million JPY or less
OR
Employees: 100 or fewer
Employees; 5 or fewer
Service Stated capital; 50 million JPY or less
OR
Employees: 100 or fewer
Employees; 5 or fewer
Retail Stated capital; 50 million JPY or less
OR
Employees: 50 or fewer
Employees; 5 or fewer
Source: Small and Medium-sized Enterprise Basic Act, Article 2, 1966 (Amended in 1999)
Contribution of Japan’s SMEs
There are two fundamental reasons why SMEs
are important in Japan. First, every company begins as
an SME. Well-known, established companies, such as
Honda and Sony, started business as small factories.
Thus, SMEs are the golden eggs of future major and
excellent companies. Second, the revitalization of
SMEs can promote competition in the marketplace, thus
creating new industries. SMEs are a powerful driving
force for boosting the economy. The Japanese
automotive and electronics industries are globally
competitive. However, even large companies cannot
manufacture finished products by themselves. The
majority of automotive and electronics components in

Hironaka C et al.; Saudi J. Bus. Manag. Stud.; Vol-2, Iss-4A (Apr, 2017):357-364
Available Online: http://scholarsmepub.com/sjbms/ 365
Japan are made by SMEs, and major companies
assemble these components. In a sense, SMEs are a
source of competitive advantage for major Japanese
companies.
Figure 11 illustrates how the productivity of
Japanese SMEs improved until the end of the 1980s.
After the 1990s, the growth rate stabilized but has
remained above 5 percent. Figure 12 shows the capital
equipment ratio of Japanese SMEs, which rose sharply
until 1990. During the 1990s, this ratio increased
gradually and has remained above 6.0 percent. This
indicates the improved performance and continuous
growth of Japanese SMEs; thus, SMEs are a source of
dynamism and economic growth.
Fig-11: Japanese SME Labour Productivity 1972–2009 (Manufacturing)
Fig-12: Japanese SME Capital Equipment Ratio 1972–2009 (Manufacturing)
Table 7 illustrates the number of business
establishments by industry based on white papers on
small and medium enterprises in Japan, 2015. There are
5.369 million SMEs in Japan. In total, 99.0% of
business establishments are SMEs in Japan, of which,
73.7% are microenterprises. It means SMEs are the
backbone of the Japanese economy. SMEs industrial
categorization (Table 6) and industrial classification in
general statistics (Table 7 and Table 8) are different in
Japan. To examine SMEs from more subdivided point
of view, we examine SMEs based on general statics
classification.
According to Table 7, more than 99% of
establishments are SMEs in all sectors. However, from
the microenterprises’ viewpoint, the ratio is different
depending on industry. Microenterprises constitute a
greater portion (more than 80.0%) in the following
industries:
Mining and quarrying of stone and gravel
Construction
Manufacturing
Finance and insurance

Hironaka C et al.; Saudi J. Bus. Manag. Stud.; Vol-2, Iss-4A (Apr, 2017):357-364
Available Online: http://scholarsmepub.com/sjbms/ 366
Real estate, goods rental and leasing
Life-related, entertainment and recreation Service
On the other hand, microenterprises shares are
relatively lower (less than 60%) in the following
industries:
Information and communication
Wholesale Trade
Medical, health care and welfare
Compound services
Table 7: Number of Establishments by Industry and Percentage Share to Total SMEs and Micro Enterprises
Establishments by Size
Small and medium business establishments Large business
establishments
Total
Of which micro
business establishments
Industry No % of Total No % of Total No % of Total No
Mining and quarrying
of stone and gravel
2,284 99.9 2,085 91.2 2 0.1 2,286
Construction 525,186 99.9 495,193 94.2 271 0.1 525,457
Manufacturing 490,081 99.3 413,942 83.9 3,299 0.7 493,380
Electricity, gas, heat
supply and water
3,846 97.7 2,337 59.4 89 2.3 3,935
Information and
communication
66,181 98.5 40,033 59.6 1,023 1.5 67,204
Transportation and
Postal services
134,704 99.4 96,363 71.1 774 0.6 135,478
Wholesale Trade 368,356 99.1 214,075 57.6 3,297 0.9 371,653
Retail Trade 1,015,571 98.3 711,788 68.9 17,787 1.7 1,033,358
Finance and Insurance 88,461 99.6 71,088 80.0 370 0.4 88,831
Real estate, goods
rental and leasing
379,412 99.9 359,462 94.7 307 0.1 379,719
Scientific research,
Professional and
Technical services
217,924 99.3 163,145 74.3 1,546 0.7 219,470
Accommodations and
food services
704,955 99.0 482,083 67.7 6,778 1.0 711,733
Life-related,
entertainment and
recreation Services
479,254 99.7 418,948 87.2 1,363 0.3 480,617
Education and
Learning support
159,377 98.8 111,764 69.3 1,910 1.2 161,287
Medical, health care
and welfare
350,522 97.6 152,104 42.4 8,475 2.4 358,997
Compound services 33,065 99.1 7,218 51.6 292 0.9 33,357
Services (not
otherwise classified)
348,520 97.9 245,486 68.9 7,636 2.1 356,156
Non Primary Industry
Total
5,367,699 99.0 3,997,114 73.7 55,219 1.0 5,422,918
Source: White Paper on Small and Medium Enterprises in Japan, 2015 [11]
There are 42,065 million employees working
for SMEs in Japan. SMEs employ a majority of the
workforce in Japan. Totally, 75.8% of employment are
by SMEs, of which, 24.1% are microenterprises.
According to Table 8, the ratio of SMEs employment
varies depending on industries. SMEs constitute a
greater portion (more than 80.0%) in the following
industries:
Mining and quarrying of stone and gravel
Construction
Transportation and Postal services
Finance and insurance
Real estate, goods rental and leasing
Life-related, entertainment and recreation Service
Accommodations and food services
On the other hand, SMEs shares are relatively
lower (less than 60%) in the service, which is not
otherwise classified. In terms of microenterprises, it
constitutes a greater portion (more than 60.0%) in the
following industries:
Mining and quarrying of stone and gravel
Construction
Real estate, goods rental and leasing

Hironaka C et al.; Saudi J. Bus. Manag. Stud.; Vol-2, Iss-4A (Apr, 2017):357-364
Available Online: http://scholarsmepub.com/sjbms/ 367
In contrast, microenterprises’ shares are
relatively lower (less than 20.0%) in the following
industries:
Electricity, gas, heat supply and water
Information and communication
Wholesale Trade
Education and Learning support
Medical, health care and welfare
Compound services
Services (not otherwise classified)
Table 8: Number of Employees by Industry and Percentage Share to Total SMEs and Micro Enterprises
Establishments by Size
Small and medium business establishments Large business
establishments
Total
Of which micro
business
Industry No % of Total No % of Total No % of Total No
Mining and quarrying
of stone and gravel
20,711 96.7 13,175 61.5 716 3.3 21,427
Construction 3,706,397 95.6 2,460,939 63.5 170,224 4.4 3,876,621
Manufacturing 6,708,812 72.5 2,257,215 24.4 2,538,905 27.5 9,247,717
Electricity, gas, heat
supply and water
138,285 68.7 17,329 8.6 63,141 31.3 201,426
Information and
communication
1,023,967 62.9 138,879 8.5 603,343 37.1 1,627,310
Transportation and
Postal services
2,865,455 86.8 669,513 20.3 436,603 13.2 3,302,058
Wholesale Trade 3,044,044 77.8 596,360 15.2 870,836 22.2 3,914,880
Retail Trade 5,894,020 75.3 1,781,846 22.8 1,937,192 24.7 7,831,212
Finance and
Insurance
1,259,889 79.3 494,355 31.1 329,560 20.7 1,589,449
Real estate, goods
rental and leasing
1,351,460 91.7 908,983 61.7 122,380 8.3 1,473,840
Scientific research,
Professional and
Technical services
1,195,466 71.9 394,785 23.7 468,324 28.1 1,663,790
Accommodations and
food services
4,656,524 85.9 1,335,454 24.6 764,308 14.1 5,420,832
Life-related,
entertainment and
recreation services
2,205,532 86.6 1,061,581 41.7 340,265 13.4 2,545,797
Education and
Learning support
1,084,353 63.0 212,947 12.4 637,206 37.0 1,721,559
Medical, health care
and welfare
4,064,417 65.8 420,569 6.8 2,114,521 34.2 6,178,938
Compound services 281,806 82.3 58,109 17.0 60,620 17.7 342,426
Services (not
otherwise classified)
2,563,829 56.7 555,508 12.3 1,957,926 43.3 4,521,755
Non Primary Industry
Total
42,064,967 75.8 13,377,54
7
24.1 13,416,07
0
24.2 55,481,03
7
Source: White Paper on Small and Medium Enterprises in Japan, 2015
SMEs play an important role in every area of
the economy. As illustrated in Table 9, SMEs have
produced approximately 50% of total manufacturing
value of shipments, and more than 50% for these 35
years. Table 10 indicates that SMEs shares in
wholesaling have been from 53% to 60%. In retailing,
SMEs shares are larger than that of wholesaling (Table
11) from 62% to 65%.

Hironaka C et al.; Saudi J. Bus. Manag. Stud.; Vol-2, Iss-4A (Apr, 2017):357-364
Available Online: http://scholarsmepub.com/sjbms/ 368
Table 9: SMEs Shares for Value of Shipments and Value added (Manufacturing Industry)
Year 1978 1985 1990 1995 2000 2009 2010 2011 2012 2013
SMEs shares of
Value of Shipments
53.3 50.5 51.8 51.3 51.1 49.8 46.7 49.1 48.6 47.9
SMEs shares of
Value added
58.0 54.7 55.5 55.6 56.7 57.9 53.3 56.3 55.0 54.0
Source: METI, Census of Manufactures; MIC, METI, 2012 Economic Census for Business Activity.
Table 10: SMEs' sales shares in Wholesaling
Year 1988 1991 1994 1997 1999 2002 2004 2007 2011
SMEs shares 62.1 62.1 64.1 64.2 62.3 63.2 64.7 64.4 64.6
Source: METI, Census of Commerce; MIC, METI, 2012 Economic Census for Business Activity.
Table 11: SMEs' sales shares in Retailing
Year 1988 1991 1994 1997 1999 2002 2004 2007 2011
SMEs shares 78.5 78.0 76.8 75.7 73.3 71.7 70.4 70.9 67.6
Source: METI, Census of Commerce; MIC, METI, 2012 Economic Census for Business Activity.
Responsible Agency
In Japan, the Small and Medium Enterprises
Agency operates under the Ministry of Economy, Trade
and Industry. The SME Agency is responsible for the
formulation of SME policy and comprises three
specialized organizations (Figure 13). At the national
level, there are two organizations to implement SME
policy. The ―Organization for Small and Medium
Enterprises and Regional Innovation, Japan (SMRJ)‖ is
in charge of domestic support aspects, including
regional development. The ―Japan External Trade
Organization (JETRO)‖ provides mainly overseas
support, such as international market expansion,
establishment of overseas branches, and so on. SME
Support Centers are established in each prefecture
(local government) that plan and implement local
support for SMEs.
Fig-13: SME Support System in Japan
SME policy in Japan
The SME Basic Act was legislated in 1963 to
upgrade the industrial structure and strengthen
competitiveness. At that time, the main issue was the
gap between large enterprises and SMEs in terms of
finance, technology, and human resources. SMEs were
regarded as vulnerable; therefore, the government took
action to rectify disparities between SMEs and large
enterprises. Under this Act, four primary measures were
implemented:
i) Improving the productivity of SMEs by
renewing capital equipment and promoting
alliances among SMEs.
ii) Correcting disadvantages of SMEs by
protecting subcontracting SMEs and requiring
government and government-linked
organizations to purchase from SMEs.
iii) Upgrading management skills by introducing
management consultant certificates and
retirement plans.
iv) Strengthening proprietary capital by
establishing the Small Business Investment
Company (GLC).
In 1999, the SME Basic Act was amended in
the so-called ―SME Diet.‖ The objective of the
amended Act was to promote diverse and vigorous
growth as the next phase following gap reduction.
Proceeding to the next phase, the government
encouraged SMEs to be independent. This means that
the SME policy focuses more on assistance to highly

Hironaka C et al.; Saudi J. Bus. Manag. Stud.; Vol-2, Iss-4A (Apr, 2017):357-364
Available Online: http://scholarsmepub.com/sjbms/ 369
committed and motivated SMEs than on protecting all
SMEs equally.
To accomplish that goal, the government
introduced a comprehensive package, including 1)
support for start-ups; 2) support for SME growth and
development; 3) fiscal and financial support; and 4)
commerce and regional support. Both new start-ups and
existing SMEs play important roles in boosting the
economy. Therefore, the support should also be
balanced and attention should be paid to
microenterprises as well. Government support is not
limited to the financial realm since financial assistance
has only a limited effect and the objective is to promote
SMEs to be independent. That is why numerous
measures for management support are initiated. The
government also has the ambition to connect SME
growth with regional revitalization. As a result of
depopulation, local economies are becoming depressed.
To revitalize the local economy, SMEs, especially
microenterprises, could play an important role. For
these reasons, policies are developed as a
―comprehensive‖ package.
i) Support for start-ups
To gain new start-ups, the government assists
those planning to start a business not only
through financing, in the form of loans and
investment but also by providing consultation
services and connections as well.
ii) Support for SME growth and development
For existing SMEs, there are a number of
packages available: support for
internationalization, human resource
development (SME–University), innovation
and intellectual property management,
environment/safety measures, support to
improve the attractiveness of SME merchants
and shopping zones, and support for smooth
business succession. What we would like to
emphasize are two policies. The first is support
for internationalization. Due to an aging
society and limited domestic market, the
Japanese government encourages SMEs to
enter international markets. The government
supports not only exporters but also the
establishment of overseas subsidiaries. As
described in Figure 14, the SMEs’ overseas
subsidiaries are being increased gradually.
Fig-14: Proportion of Enterprises that Own Overseas Subsidiaries
Source: White Paper on Small and Medium Enterprises in Japan, 2014 (Recompiled from METI, Basic Survey of
Japanese Business Structure and Activities) [12]
Second, the government also promotes to
develop eco-friendly SMEs. All companies, including
SMEs, must be eco-conscious to realize a sustainable
world. The experts provide advice to SMEs on
environmental issues, such as environment-related laws
and systems, energy saving, and recycling.
iii) Fiscal and financial support
Public banks (Shoko Chukin Bank,
Japan Finance Corporation) supply
loans to SMEs, which include policy
target loans (i.e., support for overseas
expansion) and safety net loans to
companies suffering a temporary
downturn due to economic trends,
natural disasters, etc. To facilitate the
supply of finance from private banks to
SMEs, credit guarantee corporations
(GLCs) provide guarantees for SME
debt obligations. Tax burdens are also
eliminated for SMEs to promote their
investment.
iv) Regional support
To revitalize industries in rural areas,
the government offers loans to local
businesses and traditional industries at
low interest rates. The government also
promotes alliances between SMEs,
agriculture, forestry, fisheries, and other
industries to maximize their potential.

Hironaka C et al.; Saudi J. Bus. Manag. Stud.; Vol-2, Iss-4A (Apr, 2017):357-364
Available Online: http://scholarsmepub.com/sjbms/ 370
Business Support for Japan’s SMEs
In this section, we outline the government
subsidies and financial measures for SMEs. In
accordance with SMEs policy, in The Budget Japan for
FY2016, 420.1 billion yen is prepared for SMEs. Table
12 show the breakdown.
Table 12: Budget FY2016 for SMEs subsidies in Japan
Budget Expenditure Allocations (JPY billion) Of which loans
Support for SMEs in disaster affected areas 48.10
Support for productivity improvement 162.71
Support for overseas business expansion 16.39
Support for Micro Enterprises 19.16 4.00
Support for SMEs to promote regional revitalization 19.55
Improvement for SMEs’ business environment 216.41 96.62
* Numbers don't equal the total due to duplicating.
There are six types of policy target budgets
[13]:
i) Support for SMEs in disaster-affected areas; it is
to assist SMES with recovery from natural
disasters such as earthquakes, tsunamis,
typhoons, etc.
ii) Support for productivity improvement; it is to
increase SMEs’ productivity by promoting
capital investment, enhancing SMEs’
collaboration with major companies and
universities, gaining bargaining power, etc.
iii) Support for overseas business expansion; it is to
stimulate SMEs internationalization. The
government helps SMEs to create overseas
business plans, and find overseas market, protect
international intellectual property.
iv) Support for microenterprises; it is to promote
microenterprises’ sustainability, developing
domestic and overseas market, and upgrading
strategy, etc.
v) Support for SMEs to promote regional
revitalization; it is to assist SMEs to contribute
local development. The government develops
local human resources, encourages start-ups,
especially in the social welfare field and ensures
smooth succession.
vi) Improvement for SMEs’ business environment;
this is to protect SMEs from the radical change
of business environment and support SMEs that
are growth-oriented.
Subsidies and loans are efficiently combined to
enhance SMEs’ independence and self-sustainability.
When SMEs are subsidized in Japan, the government
provides useful information and offers technical
consultation [14]. This leads the government to spend
its budget effectively. It would be harmful to simply
give subsidies and let them be. The most effective
method is to help SMEs grow and develop by
themselves. In terms of loans, the government provides
4 billion JPY special loans exclusively for
microenterprises. In addition, the loan for business
environment improvement is allocated to secure SMEs
financially. As previously mentioned, there are several
government-affiliated organizations to assist SMEs
financially. They support SMEs comprehensively from
three aspects: loan, credit guarantee, and investment.
i) Shoko Chukin and Japan Finance
Corporation are public banks for SMEs.
They provide a variety of loans to
financially support SMEs and start-ups
such as loans for capital investment and
long- and short-term working capital.
They also offer safety net loans to SMEs
that are suffering a temporary downturn in
business conditions or which have been
affected by a disaster such as earthquakes,
typhoons, etc. These banks are also
supportive in innovating technology and
expanding their overseas businesses.
ii) Credit Guarantee Corporations are
established to support SMEs by serving as
guarantors to make it easier for them to
borrow funds from financial institutions.
They are situated in each 47 prefecture
and four cities. Proximity increases
accessibility for SMEs.
iii) Small and medium business investment
and consultation companies are venture
capital firms for SMEs. Those are located
in major cities in Japan, e.g., Tokyo,
Osaka, Nagoya. They accept stocks, new
stocks, reservation rights for new stocks,
and bonds for reservation rights for new
stocks that are issued at the time of
establishment, or capital expansion.

Hironaka C et al.; Saudi J. Bus. Manag. Stud.; Vol-2, Iss-4A (Apr, 2017):357-364
Available Online: http://scholarsmepub.com/sjbms/ 371
Fig-15: SME Financial Support Organizations in Japan
COMPARATIVE STUDY AND
RECOMMENDATION
Malaysia’s goal (Vision 2020) is to reach high-
income status through the Masterplan (2012–2020). The
government has aimed to achieve SME contribution at
least at 41% of the GDP, 62% of employment, and 25%
of exports. In Malaysia, SMEs outperformed the GDP
compared with the overall economy. For this reason,
SMEs play an important role in fostering growth,
employment, and income, which are believed to be
integral to the economic transformation process.
Figure 16 shows that SMEs’ Malaysia
contributions are lagging compared with Japan’s. SME
Japan has contributed 50% and even more for the shares
in country employment, GDP, and export. In addition,
the contribution of SMEs’ Malaysia (19%) to total
exports lags far behind Japan (53.8%). Malaysia, which
currently is in the middle-income economy, where it
should have benchmarks high-income countries as best
practice countries for achieving its goals. One of the
best practices is Japan, which is known as a successful
high-income economy in Asia [15].
Fig-16: SMEs Contributions to Country Economy
Development of Supply Chain Network
One of the major differences in industrial
organization between Malaysia and Japan is the supply
chain network contributed by SMEs [16]. The supply
chain network design is a powerful modeling approach
proven to deliver significant reduction in supply chain
costs and improvements in service levels by better
aligning supply chain strategies. It incorporates end-to-
end supply chain cost, including purchasing,
production, warehousing, inventory, and transportation.
Due to limited supply of materials and labor force after
World War II, Japan’s large companies could not
manufacture products by themselves and had to rely on
SMEs. It was a catalyst for SME development in Japan.
Japan used the concept of a production
network, where the second- and third-tier SME supplier
produced a product for the first-tier suppliers who serve
directly to the anchor companies in the value chain,
namely, large companies and multinational companies.
In believing in the successful concept of SMEs, Japan
networking clearly focuses on supporting and making
home-grown businesses champions, thus Malaysian
SMEs have recently followed in Japan’s footsteps. In
addition, this concept for SMEs, especially
microenterprises, also can strengthen the relationship
with large companies. This production network also
clearly advocates strength between large enterprises and

Hironaka C et al.; Saudi J. Bus. Manag. Stud.; Vol-2, Iss-4A (Apr, 2017):357-364
Available Online: http://scholarsmepub.com/sjbms/ 372
SMEs partnerships. We suggest that the Malaysian
government should develop supply chain networks and
bridge a chasm between large companies and SMEs.
In line with other countries, SMEs in Japan are
also valued as the backbone in driving sources to their
economy. Small firms or SMEs as a foundation of
power businesses to large firms. When this happen
continuously, it results in small firms becoming
established firms. Honda and Sony are examples of
large and established firms that begin with SMEs and
become a large firm with their success. Currently, they
also depend on production networks with SMEs’ Japan
in their operation. Hence, the growth of SMEs of Japan
is parallel with the growth of large firms in Japan.
SMEs Life Span and Comprehensive Support
Package
SMEs in Malaysia are slow-moving in growth.
They are negatively correlated with the age of the firm.
Most of SMEs’ Malaysia are young and have operated
for less than 5 years. Only 12% of the SMEs have been
operating more than 20 years. The distribution differs
with large firms in Malaysia, whereby 60% of the
companies have operated longer than 10 years. In
Japan, SMEs’ average age is 36.7 years, and 91.7% of
SMEs exist for more than 10 years [17].
This indicates that SMEs in Malaysia that
become large firms are relatively low compared with
the number of established microenterprises that keep
increasing year to year. Failure rates are high among
new firms, which tend to be microenterprises. Many
studies on SMEs indicate that growth and key success
factors contribute to venture growth, yet only 10% of
these microenterprises have survived beyond the 10-
year mark. The reason for SME failure in Malaysia is
that they were unable to cope with the transition from
an entrepreneurial style of management to an organized,
professionally managed workforce and, as a result, not
being able to capitalize on further market opportunities
[18]. For example, microenterprises have limited
sources of financing. Hence, it is difficult for them to
compete with other established SMEs. Even though
they can get loans or external financing but not utilize
their loans in proper ways resulting in the failure of
their business. This happens when microenterprises lack
basic business skills.
Studies also have revealed that more than 90%
of new start-up businesses have failed within five years
of their operations. Due to this, the Malaysian
government has encouraged more government-linked
agencies to be involved in assisting the development of
new microenterprise, especially among fresh graduates.
This is because the government believes education
background is important for the entrepreneur. The
Malaysian government encourages fresh graduates
involved with business. They reform and provide the
support programs for fresh graduates to have businesses
and be owners of SMEs. In addition, the government,
with assistance of some agencies, implemented several
programs, which have benefited entrepreneurs and fresh
graduates in Malaysia. For example, SMEs compete
among universities where students act as consultants for
microenterprises and help them to improve their
business. Participants or student who won this
competition will get grant to start their business once
graduating. Additionally, the microenterprise involved
with this program will get the chance to continue
expanding its business after the improvement.
To extend SMEs life span, financial measures
should be carefully implemented. They would have
only limited effects unless SMEs understand how to
maximize them. Most SMEs, especially start-ups, lack
necessary business skills. As mentioned in Section 3.3,
the Japanese government always provides useful
information and technical consultation to subsidized
SMEs [19]. Additionally, the government monitors
subsidized SMEs all the time to check their
improvement. If SMEs fails to prove improvement, then
they do not deserve a second chance. This system leads
a Japanese SME to upgrade its skills. We also suggest
that the Malaysian government should not too much
focus on financial assistance. As described in Figure 9,
85% of development programs in Malaysia are
provided for access to finance. A comprehensive
support package would be more effective. For example,
assistance for human resource development, innovation,
and market access must be highlighted. The Japanese
government provides funds significantly for these areas
as discussed in Section 3.2.1. Human resource
development is the most powerful engine to make
SMEs grow. Educated owners and employees would
lead SMEs to a higher stage. Assistance for innovation
and market access also would be driving forces. The
more innovation and market access SMEs have, the
higher growth potential SMEs would have.
Responsible Agency and Program Duplication
In Japan, the Ministry of Economy, Trade and
Industry (METI) has been responsible to manage and
develop SMEs. METI has been responsible for the
formulation of SMEs policies and sustaining the three
specialized organizations. This includes providing
activities and programs through involvement in a
specialized agency. METI is the only ministry in charge
of SMEs and is responsible to support them in terms of
financial and nonfinancial endeavors. Hence, this makes
the ministry extensively focus on SMEs needs. This is
contrast with the responsible authority for SMEs in
Malaysia. The Malaysian government acts as facilitator
and catalyst. This government formulates and
implements laws and regulations that support the
activities of SMEs under the Ministry of International
Trade and Industry Malaysia (MITI). In addition, this
government will devote itself to various ministries and
agencies to get involved with SME support programs.
Recently, 15 ministries and 60 agencies have been

Hironaka C et al.; Saudi J. Bus. Manag. Stud.; Vol-2, Iss-4A (Apr, 2017):357-364
Available Online: http://scholarsmepub.com/sjbms/ 373
involved in creating and implementing programs to
assist in SME development.
There is no doubt that all programs from
various ministries and agencies do assist SMEs, which
are also designed to promote growth and create
employment in the Malaysian economy. However, all
programs were introduced independently, which often
results in program duplications and overlaps. This leads
to excess in national spending budget where it could be
possible to use the budget to finance SMEs. Some of
these programs are not reachable for SMEs in rural
areas. Hence, the quality of the programs is less
effective in underlying the excessive cost for programs
that benefit SMEs. Therefore, the spending on the
redundant programs should be countered and devoted to
the cost of capital with extra privileges to
microenterprises, which are believed to represent 70%
of establishments in Malaysia. Further, Malaysian
SMEs have become ever more productive and shift the
SMEs in competitive advantage.
Beyond Difference in the Definition
The Malaysian government needs to put more
effort into ensuring SMEs remain in line with Japan’s
SMEs. There is still more room for improvement for
Malaysia SMEs, so they can establish and develop like
Japan’s SMEs and contribute more to the country’s
economy. However, the comparison of SMEs between
Japan and Malaysia could be misleading because both
countries use different SME definitions, where it leads
to a huge gap between SME contributions in both
countries. Even though Japan and Malaysia are defined
as SMEs based on the two criteria (namely, annual sales
turnover and number of full-time employees) both
SMEs may operate in different market environments.
Thus, their industry components follow the
environment in each respective country. For example,
Malaysia consists of five industries: manufacturing,
services, construction, agriculture, and mining and
quarrying. Meanwhile, only four industries—
manufacturing, wholesale, service, and retail—are in
Japan. Both of these SMEs businesses are legally
structured with their own entities registered under their
own acts and regulations. Thus, we should be careful
with comparison and avoid oversimplification.
The biggest difference in definition between
Japan and Malaysia is the consideration of
multinational firms. Japan considers that all firms that
fulfill SMEs definition (based on annual sales turnover
and number of full-time employees) are categorized as
SMEs, although the firms are multinational. This point
would be helpful for SME policies in Malaysia. The
population of Malaysia is around 30 million, which
implies that its domestic market is limited. The
Malaysian government does encourage SMEs to go
global. However, once they do go global, and SMEs
manage their business in other countries, they will loss
their title as SMEs. This is because they are
automatically categorized as multinational firms. Once
they become multinational firms, they will no longer
receive the full support or special treatment as
previously when they are categorized as SMEs. This
could be one of the reasons why Malaysia SMEs do not
go global. Unlike Japan, exports would be one of the
attractive strategies for going global. Recent research in
Japan has revealed that headquarters of multinational
SMEs would boost domestic sales as well as
international sales [20-22]. For example, multinational
SMEs find new customers, and most of them are from
overseas, which further places an order to headquarters
in Japan. Hence, being multinationals has a significant
meaning for SMEs to grow.
CONCLUSION
Generally, SMEs play an important role in the
economics in Japan and Malaysia. This study sought to
comparatively examine the differences between SMEs
in Japan and Malaysia. Focusing on four points of
SMEs practice, the wide gap contribution between
SMEs in Japan and Malaysia can be narrowed down
when both of the countries use the same definition of
SMEs. SMEs in Japan, as one of the best practices, has
consistently been ranked among those to be followed.
Thus, the practice had been implemented by Japan
SMEs that contribute to their success and can be
emulated in Malaysia. Additionally, SMEs in Japan
have been developed for the last 50 years, earlier than
SMEs in Malaysia, which were started in the 1970s as a
revolution of new economic policies. This means there
is more hope for Malaysian SMEs to develop further in
the future.
REFERENCESS
1. Kartiwi, M., & MacGregor, R. C. (2007).
Electronic commerce adoption barriers in small to
medium-sized enterprises (SMEs) in developed and
developing countries: A cross-country comparison.
Journal of Electronic Commerce in Organizations
(JECO), 5(3), 35-51.
2. Abor, J., & Quartey, P. (2010). Issues in SME
development in Ghana and South Africa.
International Research Journal of Finance and
Economics, 39(6), 215-228.
3. Abernethy, M. (2002). SMEs: Small world order.
The Bulletin, 120(34).
4. National SME Development Council (NSDC).
SME Annual Report. (2011). Kuala Lumpur: SME
Corp.
5. Muhammad, M. Z., Char, A. K., bin Yasoa, M. R.,
& Hassan, Z. (2010). Small and medium
enterprises (SMEs) competing in the global
business environment: A case of Malaysia.
International Business Research, 3(1), 66.
6. National SME Development Council (NSDC).
SME Annual Report (2014). Kuala Lumpur: SME
Corp.
7. Saleh, A. S., & Ndubisi, N. O. (2006). An
evaluation of SME development in Malaysia.

Hironaka C et al.; Saudi J. Bus. Manag. Stud.; Vol-2, Iss-4A (Apr, 2017):357-364
Available Online: http://scholarsmepub.com/sjbms/ 374
International Review of Business Research Papers,
2(1), 1-14.
8. Aziz. (2012). Sizing up Malaysia’s Manufacturing
SMEs. Journal of Statistical Modeling and
Analytics, 3(1), 37-45, 2012
9. Morduch, J. (2006). Microinsurance: The next
revolution. Understanding poverty, 337-356.
10. Haron, H., Said, S. B., Jayaraman, K., & Ismail, I.
(2013). Factors Influencing Small Medium
Enterprises (SMES) in Obtaining Loan.
International Journal of Business and Social
Science, 4(15).
11. Ministry of Economy, Trade and Industry. (2015).
White Paper on White Paper on Small and Medium
Enterprises in Japan, Ministry of Economy, Trade
and Industry.
12. Ministry of Economy, Trade and Industry (2014).
White Paper on White Paper on Small and Medium
Enterprises in Japan, Ministry of Economy, Trade
and Industry.
13. Small and Medium Enterprise Agency Japan.
(2016). Outline of the Budget and Tax Reform for
SMEs and Micro Enterprises, Small and Medium
Enterprise Agency.
14. Small and Medium Enterprise Agency Japan.
(2015). Outline of the financial assistance for
SMEs 2015, Small and Medium Enterprise Agency.
15. Haron, H., Ismail, I., & Oda, S. (2015). Ethics,
Corporate Social Responsibility And The Use Of
Advisory Services Provided By Smes: Lessons
Learnt From Japan. Asian Academy of Management
Journal, 20(1), 71-100.
16. Wignaraja, G. (2013). Can SMEs participate in
global production networks. in Elms, D., and Low,
P., (ed), Global Value Chains in a Changing World,
WTO, available at
http://www.wto.org/english/res_e/booksp_e/aid4tra
deglobalvalue13 _e.pdf
17. Organization for Small and Medium Enterprises
and Regional Innovation Japan. (2011). Business
Continuity Survey, Organization for Small and
Medium Enterprises and Regional Innovation.
18. Hofer, C. W., & Charan, R. (1984). The transition
to professionalmanagement: Mission impossible?
American Journal of Small Business, 9(1), 1-11.
19. Shoko Research Institute. (2015). Commentary;
Small and Medium Enterprises in Japan, Shoko
Research Institute.
20. Taguchi, N. (2013). SMEs’ Globalization and
Business Expansion, Shoko-Kinyu, 1. Pp.9-20.
21. Nakazawa, T. (2012). Globalization and SMEs.
Chikuma Shobo.
22. Hamamatsu, S. (2013). Multinational Expansion
Effects on Headquarters’ Outcome: the
Competitive Factor of SMEs, in Japan Academy of
Small Business Studies (ed). Industrial
Restructuring and Small Business. Academy of
Small Business Studies Series, 32, 84-96.