a comparative study of bscs: human sciences program and
TRANSCRIPT
Louisiana State UniversityLSU Digital Commons
LSU Historical Dissertations and Theses Graduate School
1976
A Comparative Study of Bscs: Human SciencesProgram and Existing Scienceprograms Accordingto Achievement, Attitude, and Process Skills inSelected Sixth-Grade Classrooms in Baton Rouge,Louisiana.Donna Conner AshmeadLouisiana State University and Agricultural & Mechanical College
Follow this and additional works at: https://digitalcommons.lsu.edu/gradschool_disstheses
This Dissertation is brought to you for free and open access by the Graduate School at LSU Digital Commons. It has been accepted for inclusion inLSU Historical Dissertations and Theses by an authorized administrator of LSU Digital Commons. For more information, please [email protected].
Recommended CitationAshmead, Donna Conner, "A Comparative Study of Bscs: Human Sciences Program and Existing Scienceprograms According toAchievement, Attitude, and Process Skills in Selected Sixth-Grade Classrooms in Baton Rouge, Louisiana." (1976). LSU HistoricalDissertations and Theses. 2948.https://digitalcommons.lsu.edu/gradschool_disstheses/2948

INFORMATION TO USERS
This material was produced from a microfilm copy of the original document. White the most advanced technological means to photograph and reproduce this document have been used, the quality is heavily dependent upon the quality of the original submitted.
The following explanation of techniques is provided to help you understand markings or patterns which may appear on this reproduction.
1. The sign or "target" for pages apparently lacking from the document photographed is "Missing Page(s)". If it was possible to obtain the missing page(s) or section, they are spliced into the film along with adjacent pages. This may have necessitated cutting thru an image and duplicating adjacent pages to insure you complete continuity.
2. When an image on the film is obliterated with a large round black mark, it is an indication that the photographer suspected that the copy may have moved during exposure and thus cause a blurred image. You will find a good image of the page in the adjacent frame.
3. When a map, drawing or chart, etc., was part of the material being photographed the photographer followed a definite method in "sectioning" the material. I t is customary to begin photoing at the upper left hand corner of a large sheet and to continue photoing from left to right in equal sections with a small overlap. If necessary, sectioning is continued again - beginning below the first row and continuing on until complete.
4. The majority of users indicate that the textual content is of greatest value, however, a somewhat higher quality reproduction could be made from "photographs" if essential to the understanding of the dissertation. Silver prints of "photographs" may be ordered at additional charge by writing the Order Department, giving the catalog number, title, author and specific pages you wish reproduced.
5. PLEASE NOTE: Some pages may have indistinct print. Filmed as received.
Xerox University Microfilms300 North Zeeb RoadAnn Arbor, Michigan 48106
76-28,789ASHMEAD, Donna Conner, 1946- A COMPARATIVE STUDY OF BSCS: HUMAN SCIENCESPROGRAM AND EXISTING SCIENCE PROGRAMS ACCORDING TO ACHIEVEMENT, ATTITUDE, AND PROCESS SKILLS IN SELECTED SIXTH-GRADE CLASSROOMS IN BATON ROUGE, LOUISIANA.
The Louisiana State University and Agricultural and Mechanical College,Ph.D., 1976 Education, elementary Xerox University Microfilms t Ann Arbor, Michigan 40106
A COMPARATIVE STUDT OF BSCS: HUMAN SCIENCES PROGRAM
AND EXISTING SCIENCE PROGRAMS ACCORDING TO
ACHIEVEMENT, ATTITUDE, AND PROCESS SKILLS IN
SELECTED SIXTH-GRADE CLASSROOMS IN
BATON ROUGE, LOUISIANA.
A Dissertation
Submitted to the Graduate Faculty of the Louisiana State University and
Agricultural and Mechanical College in partial fulfillment of the
requirements for the degree of Doctor of Philosophy
in
The Department of Education
byDonna Conner Ashmead
B.S., University of Houston, 1969 M.Ed., Texas Southern University, 1972
August, 1976
ACKNOWLEDGEMENTS
The writer wishes to express her appreciation for the cooperation
of the many people and institutions that have given their support to this
study.
Grateful appreciation is expressed to Dr. James W. Firriberg,
Dr. Barbara Strawitz, Dr. Eric Thurston, Dr. Joe Parker and Dr. Grant
Young, members of the author's graduate committee for their advice and
unending support during the progress of the study.
A special word of thanks is due Dr. G. C. Gibson, the author's
advisor and chairman of her committee, for being thoroughly professional.
Gratitude is extended to the Graduate Faculty of the College of
Education for providing the essential learning experiences and instruction
associated with a doctoral program.
The principals, teachers, and students in Baton Rouge who were
involved in the study deserve a word of thanks for their cooperation,
time and effort.
For the strength, encouragement and determination to succeed,
the author is indebted to her parents and family.
Finally, my thanks are tendered to Fred, my husband, without
whose love, endurance, and inspiration the study could not have been
undertaken and completed; and to our children Tom and Channing both a
part of this study in their own special way.
ii
TABLE OF CONTENTS
PageACKNOWLEDGEMENTS........................................ ii
LIST OF TABLES.......................................... V
ABSTRACT................................................. viii
Chapter
1. INTRODUCTION .................................... 1
STATEMENT OF THE PROBLEM..................... 2
Hypotheses ................................ 2
Delimitations of the S t udy................. 3
Importance of the S t u d y ................... 4
Definition of T e r m s ....................... 4
SOURCES OF E A T A .............................. 5
EXPERIMENTAL PROCEDURE OFTHE S T U D ? .................................. 5
ORGANIZATION OF THE S T U D Y ................... 6
2. REVIEW OF THE RELATED LITERATURE............... 7
TRENDS IN ELEMENTARY SCHOOL SCIENCE ........ 7
A COMPARATIVE LOOK AT EXISTING METHODS . . . . 8
SCIENCE: PEOPLE, CONCEPTS, PROCESSES...PCP . 13
BIOLOGICAL SCIENCE CURRICULUM STUDY: HSP . . 14
3. EXPERIMENTAL DESIGN OF THE S T U D Y ............... 16
METHOD OF SAMPLE SELECTION................... 16
ADMINISTRATION OF THE P R E - T E S T S ............. 17
THE ACADEMIC Y E A R ........................... 21
ill
Chapter Page
ADMINISTRATION OF THE POST-TESTS............... 22
TREATMENT OF THE DATA............................ 23
4. PRESENTATION AND ANALYSIS OF D A T A ................ 24.
ANALYSIS OF DATA FOR EXPERIMENTALAND CONTROL GRO U P S ............................ 24
Data for the SRA, ACHIEVEMENT SERIES,SCIENCE, FORM F/GREEN LEVEL ............... 24
Data for the SEMANTIC DIFFERENTIALATTITUDE SURVEY ............................ 26
Data for the WEBER PROCESS • T E S T ............. 34
5. SUMMARY, CONCLUSIONSAND RECOMMENDATIONS............................ 44
SUMMARY OF RESULTS.............................. 45
CONCLUSIONS....................................... 45
RECOMMENDATIONS.................................. 46
SELECTED............ BIBLIOGRAPHY .......... 47
APPENDIX
A. SEMANTIC DIFFERENTIAL ATTITUDE SURVEY.............. 51
B. WEBER PROCESS T E S T ........................ 58
C. SCHOOL PERSONNEL PARTICIPATINGIN THE S T U D Y ..................................... 66
VITA....................... ................... ............... 68
lv

LIST OF TABLES
Table Page1. Number of Students in Study Dropped
from Pre-test to Post-test ............. 18
2. Population of Experimental andControl Groups by Number of Schools, Teachers, Classes,and Students.................................. 18
3. Composition of Pre-test Sample bySchool and Program........................... 19
4. Analysis of Variance on Post-test,SRA Achievement Series. Science.Form F/Green Level ................. . . . . . 23
5. Least Squares Mean Achievement on Post-test,SRA Achievement Series. Science.Form F/Green L e v e l ........................... 25
6. Analysis of Variance on Post-test,Semantic Differential AttitudeSurvey "Science".............................. 27
7. Analysis of Variance on Post-test,Semantic Differential AttitudeSurvey "Experimenting" ....................... 27
8. Analysis of Variance on Post-test,Semantic Differential AttitudeSurvey "Learning" ............................. 28
9. Analysis of Variance on Post-test,Semantic Differential AttitudeSurvey " M e " .................................... 28
10. Analysis of Variance of Post-test,Semantic Differential AttitudeSurvey "Human Sciences" . . . . . . . . . . . . 29
11. Analysis of Variance on Total Post-test Scores, SemanticDifferential Attitude Survey ................... 29
12. Least Squares Mean Achievementon Post-test, Semantic DifferentialAttitude Survey "Science" ....................... 31
v
Table Page
13. Least Squares Mean Achievementon Post-test, Semantic DifferentialAttitude Survey "Experimenting" ............... 31
14. Least Squares Mean Achievementon Post-test, Semantic DifferentialAttitude Survey "Learning" ................... 32
15. Least Squares Mean Achievement on Post-test, Semantic DifferentialAttitude Survey " M e " .......................... 32
16. Least Squares Mean Achievement on Post-test, Semantic DifferentialAttitude Survey "Human Sciences" ............. 33
17. Least Squares Mean Achievement on Total Post-test ScoresSemantic Differential Attitude Survey . . . . 33
18. Analysis of Variance on Post-test,Weber Process Test "Observing"............... 35
19. Analysis of Variance on Post-test,Weber Process Test "Classifying"............. 35
20. Analysis of Variance on Post-test,Weber Process Test "Measuring" ............. 36
21. Analysis of Variance on Post-test,Weber Process Test "Experimenting"........... 36
22. Analysis of Variance on Post-test,Weber Process Test "Interpreting" ........... 37
23. Analysis of Variance on Post-test,Weber Process Test "Predicting"............. 37
24. Analysis of Variance on TotalPost-test Scores, Weber Process Test ......... 38
25. Leas}: Squares Mean Achievement on Post-test, Weber ProcessTest "Observing".............................. 39
26. Least Squares Mean Achievement on Post-test, Weber Process Test"Classifying" ................................ 39
vi
Table Page
27. Least Squares Mean Achievement onPost-test, Weber Process Test"Measuring" .............................. 40
28. Least Squares Mean Achievement onPost-test, Weber Process Test"Experimenting"............................ 40
29. Least Squares Mean Achievement onPost-test, Weber Process Test"Interpreting" ........................... 41
30. Least Squares Mean Achievement onPost-test, Weber Process Test"Predicting"................................ 41
31. Least Squares Mean Achievement onTotal Post-test Scores,Weber Process Test......................... 43
vii
ABSTRACT
Problem
The problem was to determine If there was a significant difference
in the mean scores in the areas of achievement, attitude, and process
skills between students who participated in the Biological Sciences
Curriculum Study: Human Sciences Program and those who participated in
the existing science program which centered around a basal text.
Hypotheses
The following hypotheses were made:
1. There would be significant differences between the standard
achievement test mean scores of the students who received science
instruction through Biological Sciences Curriculum Study: Human Sciences
Program when compared with the standard achievement test mean scores of
students who received instruction through the basal text approach.
2. There would be significant differences between the attitude
mean scores of the students who received science instruction through Bio
logical Sciences Curriculum Study: Human Sciences Program when compared
with the attitude mean scores of students who received instruction through
the basal text approach.
3. There would be significant differences between the process
test mean scores of the students who received science instruction through
Biological Sciences Curriculum Study: Human Sciences Program when
compared with the process test mean scores of students who received
instruction through the basal text approach.viii
Procedure
Randomly assigned sixth*-grade students In two schools in Baton
Rouge, Louisiana comprised the sample. The schools were located in a
predominately white, upper socio-economic, residential section of town.
Four classes (two at each school) were designated as the experimental
group. The control group consisted of three classes (one school had
two control classes while the other had one). The total sample num
bered 182 students. The experimental group received science instruction
through Biological Sciences Curriculum Study: Human Sciences Program
(BSCS: HSP) and the control group through Sciences: Prople, Concepts
and Processes (PCP), the basal text series published by Webster Division,
McGraw-Hill. In the fall of 1974, one-half of the total sample was
pre-tested with the SRA Achievement Series, Science, Form F/Green Level
and a Semantic Differential Attitude Survey.
The sixth-grade classes then proceeded with their assigned ;
treatments for science instruction during the school year 1974-1975.
The experimental group utilized the materials of the BSCS: HSP
modules for their science program. Each module contained at least
twenty activities from which the learner could choose to work. Upon
completion of the activity, the student, with his teacher's assistance,
evaluated his work and prepared to select another lesson. The control
group used the basal text and scheduled chapters throughout the year.
All of the students were post-tested in May, 1975 using the
SRA Achievement Series, Science, Form F/Green Level and a Semantic
Differential Attitude Survey. Over one-third of the entire sample was
post-tested with the Weber Process Test. The standard achievement and
attitude survey took less than an hour to administer to each class.ix

The process test was administered on an individual basis with the
testing sessions lasting from one-half to an hour.
The post-test data were subjected to a least squares analysis
of variance.
Summary and Conclusions
Hypothesis one-The findings indicated there were no significant
differences between the two programs on the standard achievement mean
test scores.
Hypothesis two-The findings Indicated there were no significant
differences between the two programs on the attitude survey mean score.
Hypothesis three-The findings indicated there were no signifi-*
cant differences between the two programs on the process test mean
scores.
Overall, the BSCS: HSP was as beneficial as the basal text
approach based on the mean scores of achievement, attitude and process.
Because the experimental program was as effective in the areas of
achievement, attitude and process skills, it offered an alternative
method of science instruction and should continue to be encouraged
by teachers who by disposition and inclination feel comfortable with '
this method of instruction.
x

Chapter 1
INTRODUCTION
A renewed interest in science education has taken place both
at the elementary and secondary school level. One of the major outcomes
of this renewed interest in science was a review and restatement of the
objectives of science teaching. Numerous scientists, science educators,
and philosophers have stated that science includes more than the facts,
concepts, and theories; it also includes the philosophy and process of
science. It has been emphasized that, ’’The first task in the teaching of
science is to teach the inquiry process of science" (Hurd, 1971). A
second outcome of the revolution in science has been the development of
many "new" science curricula at the elementary and secondary levels.
"National programs, such as AAAS, ESS, SCIS, PSSC, BSCS, EGCP, and IPS,
all stress the process aspect of science and the nature of the scientific
enterprise as well as the knowledge of science" (Wood, 1972).
Once the curriculum projects found their direction, they then
identified the population with which to work. However, Watson (1967),
Shoreman (1964), and Sutman (1966) decried the fact that the content was
selected at the whim of the scientists and was not required to meet
children's needs and their different ability levels. Logically, it would
seem that one would identify the population, then develop the program
around the characteristics, needs, and assets of that group. This was
what Biological Sciences Curriculum Study: Human Sciences Program set
out to do: for this curriculum was, "designed to fit the psychological
and physiological needs of eleven to thirteen-year olds" (Rationale
for Human Sciences, 1973).
The main problem areas during adolescence are evidenced by the
adolescent's marginal status, his changes in self-concept, the search
for his future role, his changing body image, his emergence into puberty,
and variance of his maturation rate (Rogers, 1972). Once areas of con
cern had been identified, curriculum developers could examine the im
plications for education. The shift of emphasis to the adolescent by
BSCS curriculum developers could best be observed through the gearing of
content to the individual's developmental level instead of to chrono
logical age; producing materials and diagnostic procedures that would
facilitate movement from one level of developmental growth to the next
encouraging substantive social Interaction. "The Human Sciences Program
is preceding on the assumption that it has developed a substantive and
interesting course of study that will be useful in all of the cultural
subgroups in our society " (The Early Adolescent, 1973).
STATEMENT OF THE PROBLEM
The problem was to determine if there was any significant differ
ence between the mean scores of the experimental group who used the
Biological Sciences Curriculum Study: Human Sciences Program and the
control group which continued to use the traditional science program of
Science: People. Concepts, and Processes, on a standardized
achievement test, an attitude inventory, and an inventory of processes.
Hypotheses
The following hypotheses were made:
3
1. There would be significant differences between the standard
achievement test mean scores of the students who received science in
struction through Biological Science Curriculum Study: Human Sciences
Program when compared with the standard achievement test mean scores of
students who received instruction through the basal text approach,
2. There would be significant differences between the attitude
mean scores of the students who received science instruction through
Biological Sciences Curriculum Study: Human Sciences Program when com
pared with the attitude mean scores of students who received instruction
through the basal text approach.
3. There would be significant differences between the process
test mean scores of the students who received science instruction
through the Biological Sciences Curriculum Study: Human Sciences
Program when compared with the process test mean scores of students
who received instruction through the basal text approach.
Delimitations of the Study
The sixth-grade classes of Sherwood Forest and LaSalle Elemen
tary Schools comprised the sample of 182 pupils. These schools were
located in East Baton Kouge Parish, Louisiana. The students in these
seven classes were white and from an upper socio-economic strata.
They lived in a residential area of the city and had a wealth of
experiences in their backgrounds. The students were reading at
or above grade level.
The experimental group had 103 students, while the control
group had 79. This study commenced with the pre-testing of the groups
during September, 1974 and ended with the post-testing during May, 1975.

Importance of the Study
This study has' contributed on a local basis to the information
the East Baton Rouge School District has had available to decide
on their adoption of this science program when offered by the publisher.
The BSCS staff in Boulder, Colorado also has had access to the results
of this study to add to the data they have collected. The National
Science Foundation requested a copy of the findings of the study as one
facet of the evaluation of the grant bestowed on Louisiana State
University at Baton Rouge during the 1974-1975 school year.
Definition of Terms
BSCS: HSP. The Biological Sciences Curriculum Study: Human
Sciences Program was developed by the BSCS group headquartered in Boul
der, Colorado. The program was designed for use as a sixth-grade .
science curriculum and encompassed the scope of sciences that served as
content sources for the activities. The materials were developed
specifically to meet the interests, characteristics, problems and needs
of eleven to thirteen year olds.
Module. A module was an arbitrary division of time and subject
matter for presentation purposes.
Textbook. The adopted textbook series for science in East Baton
Rouge Parish, Science: People Concepts and Processes...(PCP).
Achievement scores. Achievement scores are those derived from
SRA Achievement Series, Science, Form F/Green Level.
Attitude scores. Attitude scores were those derived from a
Semantic Differential Attitude Survey.
5
Process scores. Process scores were those derived from the
Weber Process Test.
SOURCES OF DATA
The East Baton Rouge Parish School Board's official records were
employed to collect information concerning students, individual schools,
teachers and programs deemed necessary in conducting this study.
EXPERIMENTAL PROCEDURES OF THE STUDY
The sample of this study was comprised of 182 sixth-grade pupils
at Sherwood Forest and LaSalle Elementary Schools in East Baton Rouge
Parish, Louisiana. Two sixth-grade teachers at each of these schools
volunteered to become Involved with BSCS: HSP for the school year,
1974-1975. These four teachers and their pupils, about twenty six per
class, comprised the experimental group for this study. The remaining
sixth-grade teachers in these schools: two at Sherwood Forest and one at
LaSalle, along with their pupils, about thirty per class, comprised the
control group for this study.
The children in the study were assigned to the classes on a
totally random basis as the year began.
The Science Research Associates, Inc., Assessment Survey,
Achievement Series, Science, 1971 Edition. Form F/Green Level and a
Semantic Differential Attitude Survey were administered to one-half
of the students in the experimental and control groups.according to the
Solomon four-group design.
The sixth-grade classes then proceeded with their assigned treat
ments according to the various manuals for the two programs. The experi-
mental classes explored the BSCS: HSP materials during the year as their
science program. The material was arranged in five modules which lasted
between six and nine weeks. The control group utilized the PCP science
series.
Post-tests of the Science Research Associates, Inc., Assessment
Survey. Achievement Series. Science, 1971 Edition, Form F/Green Level,
the Semantic Differential Attitude Survey, and the Weber Process Test
were administered in May, 1975 by the researcher and the classroom
teacher with direction from the researcher.
The tests were scored by the researcher, and the information was
compiled, coded and transferred to computer cards. An analysis of
covariance was the statistical procedure that was to have been used in
the original design of the study. A preliminary analysis of post-test
data indicated that differences were so small in comparison to class
variation that it was not necessary to use the pre-test data. A
randomized, control group, post-test only design was followed and
data was subjected to a least squares analysis of variance. The find^-
ings were summarized and conclusions drawn.
ORGANIZATION OF THE STUDY
The studv was organized into five chapters: The necessary
introductory statements were made in Chapter 1; comparable studies
were reviewed in Chapter 2; the experimental procedures and sources
of data were described in Chapter 3; presentation and analysis of
data collected comprised Chapter 4; and findings, summaries, conclu
sions and recommendations for future study conclude the study in
Chapter 5.
Chapter 2
REVIEW OF RELATED LITERATURE
Science education today has evolved from a beginning in nature
study, through the fact-laden textbook stage, to an era that emphasized
manipulation, inquiry and process (Thier, 1970).
TRENDS IN ELEMENTARY SCHOOL SCIENCE
In the curriculum projects of the 1960’s, there was a great
emphasis on the pupil and his participation in the science program.
Each of the projects emphasized extensive use of materials by pupils
and to a greater or lesser degree converted the elementary school
classroom into a laboratory where children worked and had direct
experiences in science. The major projects did not have student
textbooks and the only extensive use of the printed materials by the
s indent ~'as for the purpose of making a record of what one had
observed, planning of experiments, and answering questions which
led to further activities. The emphasis was on a laboratory record
book rather than on a text. The main differences of the projects were
in the various approaches to teaching science and the different amounts
of freedom given to the teacher and school system using the programs.
As materials developed by the federally funded programs
passed into the public domain, many commercial programs incorporated
various elements into their textbooks.
A COMPARATIVE LOOK AT EXISTING METHODS8
In the past, science educators had placed such a priority on
intellectual qualities that the other facets of humanness had been
ignored or shunted into subordinate positions (Samples, 1972), Nay and
Crocker (1970) have stated, ’’the affective growth of students in the
science classroom is virtually ignored. If any growth did take place,
it was usually insignificant or negative and develops by chance or as
a by product." Traditionally, success was measured by cognitive
achievement. Curriculum developers became concerned not only with the
processes of science, but the affective aspects of the curriculum as
well. In depth evaluations of curriculum projects and experimental
teaching techniques have been lacking, especially at the elementary
level. Measurement by standardized test is only one facet of evalua
tion needing supplement by attitude and process measures.
Brudzynski (1966), compared an inductive method where pupils
learned concepts by directed self-discovery in a pupil-centered atmos
phere to a lecture-demonstration, teacher-centered one. The inductive
method favored above-average students in the fifth- and sixth-grade
population studied, but teacher expectation can often be a factor in
this type of situation.Three studies found no significant differences between methods
used. These included: Geme (1967) who compared a traditional text
book method with a method utilizing a specially designed board to teach
electricity and magnetism; one by Bennett (1965) who compared a field
method with a classroom method for teaching ecology; and Smith (1966)
comparing a lecture-demonstrated style of teaching carried out in a
classroom Co teaching In a planetarium for presenting a lesson on astron
omy concepts to sixth-grade pupils. These studies suggested that the use
of any visual aid or direct experience did not necessarily of itself
produce significant outcome gains in children.
O'Toole (1966) compared an individualized method with a teacher-
centered approach in the teaching of science to fifth graders. He found
no significant differences between his groups in achievement, problem
solving ability or science interest. The teacher-centered program with
problem-solving as a major objective was more effective in developing the
ability to identify valid conclusions while the individualized program
was more effective in developing ability to recognize hypotheses and
problems.
Schiller (1962) used activity booklets and data sheets to indivi
dualize instruction for sixth-grade pupils. The materials were designed
to give children an opportunity to complete some science experiments and
other activities which were in addition to the formal Instructional pro
gram. Much of the evaluation was subjective, but students were eager to
participate in the activities and seemed to gain from them.
Other attempts at individualizing instruction were undertaken by
LaCava (1965) who used the tape recorder as an aid in individualizing,
Carter (1967) who developed a science experience center and Lipson (1966)
who developed an individualized program by coordinating audio-taped to
simple science kits. These studies, in general, supported the contention
that individualizing instruction was possible and educationally desirable
at the elementary level. Evaluation, presently, had only been
subjective.
10
A more rigorous evaluation of an individualized program was
undertaken by Gleason (1965). He measured pupil growth in areas of
general science knowledge, liking for science, and learning to
generalize. Although he found no specific advantages in favor of
individualized self-study activity in science, pupils learned as
much content by themselves as they did when taught by a teacher.
Fulton (1971), Mahan (1970), Kellough (1970), and Hug (1971)
found that the individualized (self-pacing) approach developed better
attitudes toward science, toward school, and in personal growth, than
that of the group approach.
Vanek (1974) found no difference in achievement or classifica
tion skills between a group using ESS and a group using a direct
teaching approach. Significant differences did occur in three areas
of attitude. The ESS group like science class, like scientists and
were more sure in their ability to perform science activities.
Sixth graders using SCIS materials viewed their science class
as a happy experience according to Hagerman (1974). They also preferred
experimenting to other types of classroom activities, regardless of the
teacher’s attitude or the availability of materials in the classroom.
Barksdale's (1973) investigation of ESS and non-ESS fourth,
fifth and sixth grade science classes Indicated that the experimental
group had a more favorable attitude toward their science classes, a
greater appreciation of science materials mastered and enjoyed their
science learning more than did students in the control group,
Allen (1973) found no significant differences between SCIS and
non-SCIS third grade students in respect to their preferences for school
subject. The SCIS children were statistically superior to non-SCIS
11children in both cogiiitive and motivational (explanatory) behavior.
Fourth and fifth grade students according to Bonhardt (1974)
did not feel that process-based science was dull or boring, but
students from sixth grade demonstrated marked levels of boredom.
Sixth grade students also indicated that science was interesting but
was not the best subject in school. Generally, sixth grade students
were apathetic toward process-science experiences.
Much emphasis had been placed on the development of science
process skills and the use of inquiry methods to develop certain cog
nitive abilities by the new elementary science course improvement pro
jects; but little research has been done in the area. Raun (1967,1969)
investigated the interaction between curriculum variables and selected
classroom-student characteristics using the AAAS (SAFA) materials. He
was interested in the changes in cognitive and affective behavior brought
about by children using some of the strategies of science. He found
limited evidence of significant grade differences between behavior and
performance in the strategies of inquiry in science, and that there was
no consistent pattern of behavioral change among grades. In fact, on
many of the factors investigated, grades five and six showed regressive
tendencies which supported the argument that there was rather slow
development of science process skills beyond grade five.
Price (1968) investigated whether students who had manipulated
objects and materials to gather empirical data in an elementary school
classroom would transfer this manipulative process behavior to a test
situation outside the classroom. It was found that children rarely
sought data by overt manipulative behavior to the test situations,
even when verbal responses to them indicated high motivational interest.
12
Also gifted children showed no greater tendency to empirically gather
data to solve problems than students in the normal range of Intelligence.
Scott and Sigel (1965) used grades four through six to investigate
the effects of inquiry in physical science on creativity and cognitive
style. Pupils receiving inquiry training learned science concepts as
well or better than children in conventional classes and no significant
differences were found between boys and girls. Cognitive styles did
seem to be influenced by the inquiry process and some differences in the
developmental trends of cognitive styles of boys compared to girls were
apparent.
Results of Zubulake's (1970) study comparing discovery, guided
discovery, or programmed instruction demonstrated that guided Instruction
was significantly superior to discovery instruction when immediate
learning was the criterion, but if long term retention was the criterion
the results were not conclusive. The findings of his study seemed to
favor guided discovery as an effective approach to learning.
Renner's (1973) evaluation of SCIS at the sixth-grade level
found that SCIS was superior to a textbook program in aiding children
to develop the process skills of science. His conclusion was that SCIS
could lead children to develop scientific literacy. A marked improvement
in intellectual development was found in first grades and kindergarten
children in the program.
A survey of studies using the process approach to science by
Welch (1972) indicated that the stress placed by the programs upon the .
development of process skills did not adversely affect the level of
competence in the science content. Data also revealed that children
who were taught science with Process Approach materials had a greater

13preference for science as a subject than did children taught by the
conventional programs.
Data collected by Macbeth (1974) from kindergarten and third
grade experimental classes suggested that the influences of direct
first-hand manipulative experiences in the development of process
skills may well be more important for the early primary grades than
for older children.A comparison made by Vejdovec (1974) of fifth grade students
after five years of science instruction through a process approach
(SAPA) and fifth graders taught using a content approach indicated
there was no significant difference between the groups in favor of one
or the other science curriculum approach.
Science: People, Concepts, and Processes (PCP)
One of the programs used in this study was a textbook series,
Science: People. Concepts, and Processes (PCP), published by Webster
Division, McGraw-Hill Book Company. The program was a process science
approach that involved active participation in investigations. The
concepts and process of science were learned through direct experience
and in such a way that man's responsibility to his environment and to
his fellow man were focal points throughout.
Each of the 32 chapters in the sixth grade text was designed for
one week duration and provided a modular Instructional program. The PCP
series included a program for kindergarten through sixth grade, made up
of the following elements: pupil textbooks, teacher's edition, classroom
kit, evalutation program tests, individualized activity cards, and
extension and enrichment activity cards. Webstermaster tests and the
cards provide a means of evaluating students.
14
BIOLOGICAL SCIENCE CURRICULUM STUDY:HUMAN SCIENCES PROGRAM (BSCS: HSP)
The Biological Science Curriculum Study began their curriculum
development program in March, 1971. The purpose of this program was "to
invent an entirely new curriculum, one especially designed to fit the
psychological and physiological needs of eleven to thirteen-year olds"
(Rationale for Human Sciences, 1973). The findings of a study that ex
plored and identified problems of early adolescent education revealed
disinterest was increasing on the part of students, students were ques
tioning what they were studying and seeing little relationships between
school and their lives (Rationale for Human Sciences, 1973).
To further Identify concerns of students the BSCS staff talked
and listened to early adolescents. The very variety found in Interest,
levels of cognitive thinking, ability, and child growth all added to the
heterogeity of the adolescent. The BSCS consultants felt that physical,
cognitive, phycho-social, and moral development characteristics should
have been included in curriculum design. HSP was specifically designed
for the middle school, grades six, seven and eight. Subject sources
for Human Sciences were the natural and social behavioral sciences.
Material for the sixth year level was arranged in five modules;
Behavior, Learning, Sense..or..Nonsense, Survival, and Growing, Modules
were merely arbitrary divisions of subject matter into manageable units
of time. The time boundaries were flexibly arranged. "Modules replace the text, workbooks, laboratory guides, and supplementary materials
usually provided as curriculum resources" (Rationale for Human Sciences,
1973). Yet, modules contained all of these things and more including
15Film loops, slides, tapes, small books, flat photographs and pictures.
Modules were generally non-sequential, as were activities within the
modules. Individual choice of activity was built into the module design.
Activities within the modules were nonlinear but include analogous
activities. It was noted that no single Individual was expected to en
gage in all of the activities provided in a module, which number between
20 and 30. Each module included activities that take students out of the
school and into the community; open-ended activities; as well as acti
vities on a variety of difficulty levels. The three levels of activities
began with those designed for small group involvement that provided
concrete experiences; the second level activities revolved around the
manipulating of data; level three activities included the highest level
of cognitive development by formulating new hypotheses and synthesizing
data from levels one and two.
Cohen (1972) had stated that the ability to read was integral
to an individual's success in.science. The Human Sciences material re
volved around the printed word but included multimedia whenever possible.
Stressing small-group and paired activities aided a non-reader's involve
ment with the materials.
The survey of the literature revealed that the area of process
skills was the area evaluated the least. Only one study (Renner, 1973)
focused on all of the processes of science. In no study were the areas
of achievement, attitude and process skills assessed simultaneously.
The two programs in this study were completely new to the area of
elementary science and their first Implementation was the year the
study was conducted.

Chapter 3
EXPERIMENTAL DESIGN OF THE STUDY
METHOD OF SAMPLE SELECTION
. Two of the seyenty-five schools In East Baton Rouge Parish
that had a sixth-grade science program were utilized in this study
In September, 1974. Descriptive brochures and applications were
sent to all principals and teachers of schools that had sixth grades.
Interested persons returned completed forms that indicated their
desire to participate. The two target schools were selected by the
Central Office of the East Baton Rouge Parish School Board. The deci
sion was made at that level because personnel involved in the program
were going to need released time from their teaching and/or administra
tive duties to attend and conduct workshops and conferences. All of
the children in the study were assigned to their respective classrooms
on a random basis.
The teachers participating in the experimental program attended
a workshop in Boulder, Colorado and had a variety of experiences with
BSCS: HSP material, evolved plans for forthcoming workshops they would
conduct and made preliminary plans for the utilization of BSCS: HSP.
They received college credit and a stipend for their participation.
Of the two schools participating In this study, both had
experimental and control groups. Data from these two schools were
compiled, tabulated and analyzed.
An equalization of students in the classrooms did not exist at
16

17the onset of the study nor at Its end. A total of seven teachers and 182 children took part in the completed study. The data presented in Table 1
showed the attrition of students from pre-test to post-test. The 3.5 per
cent loss represented the students who moved during the treatment period,
as well as those who were absent during the testing period due to illness.
All information concerning the sixth grade population was ob
tained from the individual classroom teachers. The numbers of students,
teachers, classes, and schools which comprised the experimental and con
trol groups are shown in Table 2.
ADMINISTRATION OF THE PRE-TEST
The Sclenc_e_Research Associates. Assessment Survey. Achievement Series. Science. 1971 Edition. Form F/Green Level and a Semantic
Differential Attitude Survey were administered to about one-half of the
students in the experimental and control groups in September, 1974. The
Solomon Four-Group design of pre-testing and post-testing was used in
this study. Those classes to be pre-tested were selected on a random
basis in each school, in a manner which enabled one-half of the experi
mental and control groups to be included in the pre-test sample. Thus
each school had one experimental and one control group pre-tested. Data
presented in Table 3 revealed the composition of the pre-tested group
according to school and program.
One of the pre-tests, the Science Research Associates. Inc.T
Assessment Survey. Achievement Series. Science. Form F/Green
Level, is designed for grades 4-9 and served as the standardized achieve
ment test in this study. The purpose as stated by the author was, "to
measure the student's ability to read and interpret science material and

18
Table 1
Number of Students In Study Dropped from Pre-test to Post-test
Program NumberPre-tested
NumberPost-tested
NumberDropped
PercentageDropped
Experimental 108 103 5 4.6
Control 81 79 2 2.4
Total 189 182 7 3.5
Table 2
Population of Experimental and Control Groups by Numbers of Schools,
Teachers, Classes, and Students
Experimental Control Total
Schools 2* 2* 2
Teachers 4 3 7
Classes 4 3 7
S tudents 103 79 182
*Both schools had experimental and control programs.

19
Table 3
Composition of Pre-test Sample by School
and Program
School Experimental Control Pre-test Enrollment
Sherwood Forest
Class 1 yes 28Class 2 no
Class 3 yes 26Class 4 no
LaSalle
Class 5 yes 24Class 6 no
Class 7 yes 27
20
of his understanding of facts, principles, applications, and generaliza
tions drawn from the biological, physical, and earth sciences" (Your
Scores and What They Mean, 1971). Bryan (1972) agreed that the science
test was designed to measure knowledge and understanding of certain
representative facts and principles of science. Nelson (1972) also
noted that this test appeared to measure primarily a mastery of content
as it focused mainly upon knowledge and to a more limited extent upon
understanding. This test was also the one chosen by the Bast Baton Rouge
Parish School Board to administer district-wide for testing, though not
in the area of science.
Nelson (1972) made a further recommendation that if any other
areas needed evaluation, that went beyond this test's scope, that the
SRA test would have to be supplemented with additional items.
A Semantic Differential Attitude Survey served as the attitude
inventory in this study. It was a multi-level instrument and in this
instance was geared toward science. The semantic differential technique
was developed during the early and middle nineteen-fifties by Osgood,
Suci, and Tannenbaum, Their primary interest was in the problems of
'meaning1. In essence the instrument consisted of pairing a concept
with a set of bipolar adjectives. The direction and intensity of the
association (response) was indicated on a seven-step scale.
It was felt that a semantic differential instrument would examine
attitudes in a more subtle way than conventional rating scales based on
requested introspection. Since the late nineteen-fifties, the original
developers, as well as numerous other researchers demonstrated the use
fulness and validity of the semantic differential technique (Snider,
1969).

21
Because the evaluation dimension was the strongest, the seman
tic differential used in this study was constructed in this area. The
items used to measure attitude, and thereby attitude change on the part
of the sample were not geared specifically toward BSCS: HSP, but more
over to science in general.
Both tests were given to the classes at the same sitting. Total
test time was less than an hour. The two classes at the LaSalle Elemen
tary School were given the pre-tests on September 19, 1975 and the two
classes at Sherwood Forest were administered the test on September 20,
1975. Provisions were made by the principals of the selected schools
and the teachers of the selected classes to allow the researcher to
administer the tests. Upon completion of the testing, the tests were
collected and scored by the researcher.
THE ACADEMIC YEAR
The sixth-grade classes proceeded with their assigned treat
ments in accordance with their respective manuals for the two programs
during the ensuing school year, independent of the researcher.
The experimental classrooms utilized the contents of the BSCS:
HSP modules for their science program. Due to state law and subject
matter sensitivity, the Growing module was not taught at Sherwood
Forest and portions of the module were excluded from selection by the
LaSalle students. BSCS: HSP served as a self-pacing curriculum, with
the learner making decisions as he chose a lesson and evaluated it on
its completion. Each teacher developed her own style for handling the
program. Some restricted a class’ use of the materials to one section
of the module at a time, while others allowed students to have complete
22
freedom in their choice of lessons. Some teachers felt the necessity
to establish a minimum number of lessons to be completed per module or
during a set period of time. One student having completed sixteen
activities while another student finished only four were both considered
successful by their teacher. The. teacher's assessment of the maturity
of her children and the potential of each seemed to be the deciding
factor. The teachers were in contact with the college personnel from
Louisiana State University who were aiding in the program's implementa
tion and the BSCS consultant team from Boulder.
The control classrooms utilized the newly adopted textbook
series, Science: People, Concepts and Processes. The thirty two
chapters in the book were not taught in a prescribed sequence but
rather as the teacher's appraisal of her class' interest directed.
ADMINISTRATION OF THE POST-TESTS
Three post-tests were chosen to provide a more comprehensive
test of the various aspects of science. The Science Research
Associates, Assessment Survey, Achievement Series, Science, 1971
Edition, Form F/Green Level and a Semantic Differential Attitude
Survey were given to both the experimental and control groups. The
Weber Process Test was given to students selected at random from
both the experimental and control groups.
The achievement test and attitude survey were given to all the
students of the experimental and control groups at LaSalle Elementary
on May 6 , 1975 and to all the students of the experimental and control
groups at Sherwood Forest on May 16, 1975. The same procedure used
for the pre-testing was followed and the duration of the testing
23
session was less than an hour.
The Weber Process Test served to measure the process
skills in this study. This test was specifically designed for sixth-
grade classrooms. A description of the test by the authors stated
(Renner, 1973):r
The process Instrument which we prepared consisted of seventeen tasks which required the student to function in each of the previously identified process areas. Each task was completely designed around a performance problem and the child was provided the necessary materials needed to successfully attack the problem. While attempting to solve the problem, the child was involved in physical and mental manipulation of the materials which also needing specific science process skills.
This test was chosen on the basis of its validity as judged by
a panel of nationally recognized science educators (Renner, 1973).
This test was administered on an individual basis to students
from both the experimental and control groups by a team of volunteers
consisting of graduate and undergraduate students trained in the giving
and scoring of the test items. The researcher met with the volunteers
on April 24, 1975 and tests, materials, score sheets, and assignments
were distributed. The testing sessions varied from one-half to an
hour. The completed tests were collected and scored by the researcher.
TREATMENT OF DATA
All data were.compiled, coded, and transferred to IBM code
sheets by the researcher and punched on computer cards. All of the
post-test data were then subjected to a least squares analysis of
variance.
Chapter 4
PRESENTATION AND ANALYSIS OF DATA
In this chapter, data have been examined and analyses made In
an attempt to answer the questions presented in Chapter one: Was there
a significant difference between the science achievement, attitude and
process scores of students in the experimental and control groups?
ANALYSIS OF DATA FOR EXPERIMENTAL AND CONTROL GROUPS
In this section of the study, data pertaining to the comparison
of achievement of students In the experimental and control groups are
presented. Randomization was used to obtain two groups which could be
considered statistically comparable. The analysis of variance was used
to determine the significance of the difference between the means. The
least squares technique was used to adjust the means for dispropor
tionate numbers for various characteristics (race, sex, etc.).
Difference in the achievement, attitude, and process scores were
tested to determine if the differences could be attributed to chance.
Thus, the differences were submitted to tests of significance at the
.05 and .01 levels.
Data for the SRA, Achievement Series, Science, Form F, Green Level
Tables 4 and 5 contained the data resulting from the analysis
of variance and the least squares mean achievement computations for the
SRA Achievement Test. The variance ratio (.01) in Table 4 did not
24

25
Table 4
Analysis of Variance on Post-test, SRA Achievement Series, Science,
Form P, Green Level
Sourcesof
Variation
Degreesof
Freedom
Sumof
Squares
F-ratio
Program 1 0.31 .01
C las is/Group 5- 427.29 2.07
Sub/Class 175 7226.77
Table 5Least Squares Mean Achievement on Post-test,
SRA Achievement Series, Science Form F/Green Level
Program N Mean
Experimental 103 25.16
Control 79 25.27
Total Program 182 25.21

26show a significant difference at the .05 level between the students in
the experimental and control groups. The total program mean on Table 5
indicated that the students in the experimental group scored lower
than those in the control group. The mean of the experimental group
was 25.16, while the control group mean was 25.27, a difference of
.11 that was not significant. Thus neither program was found to be
significantly more effective for the sixth-grade students in the area
of achievement.
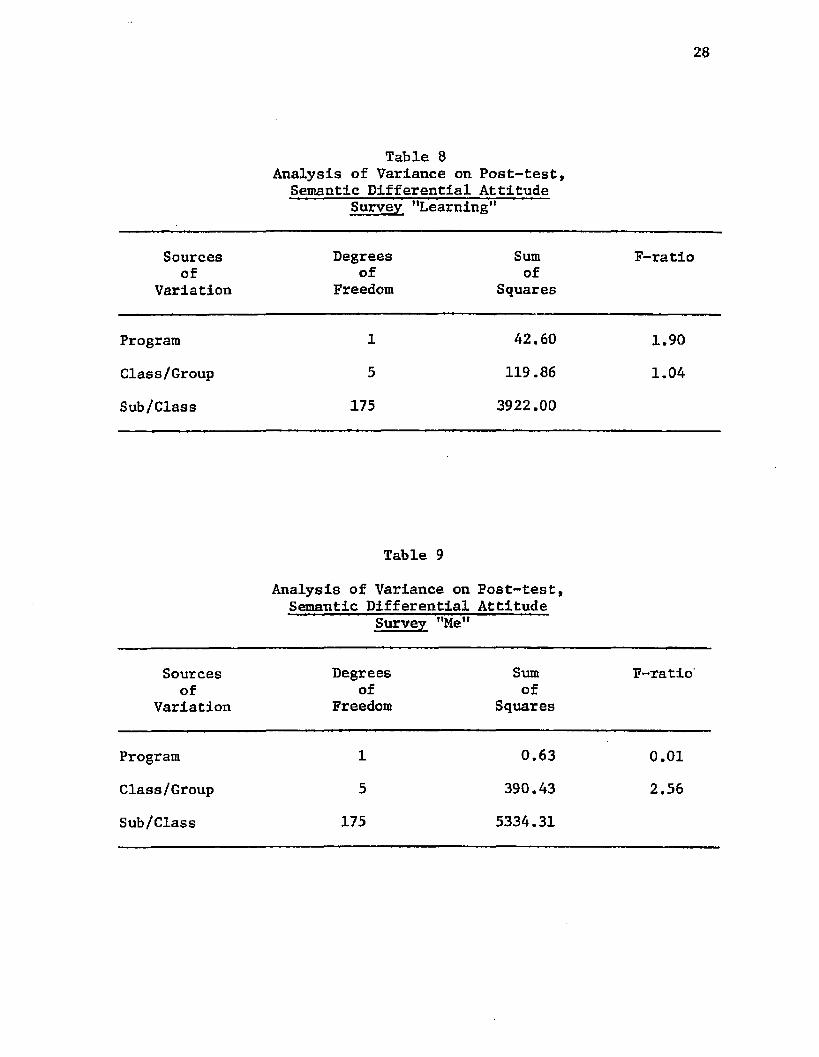
Data for the Semantic Differential Attitude Survey
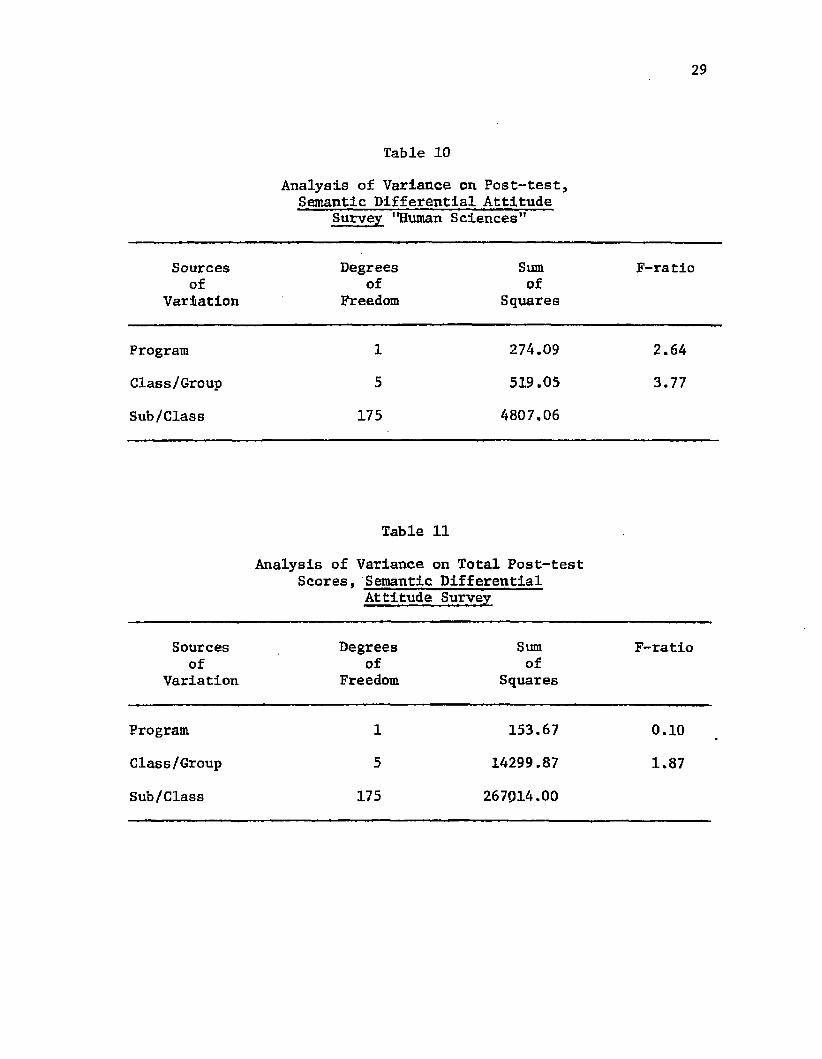
From the data in Tables 6 through 10 which Indicated the analysis
of variance on the subtests of the Semantic Differential Attitude Survey,
the following results were determined. On the subtest "science'’
(Table 6), the variance ratio (.01) of the two programs was not signifi
cant. On the subtest "experimenting" (Table 7), the variance ratio (.37)
did not indicate a significant difference between the students in the
two programs in their attitude toward experimenting. The variance
ratio (1.90) presented in Table 8 revealed that there were no signifi
cant differences found in scores on the subtest "learning" of students
classified according to program. The variance ratio (.01) in Table 9
disclosed that there was no significant difference between the attitude
of students in the two programs on the subtest "me". On the subtest
"human sciences" (Table 10) the variance ratio (2.64) indicated the
greatest amount of difference between the students in the two programs
occurred on this subtest, but the difference was not significant.
The analysis of variance for the composite attitude score was
given in Table 11. The variance ratio (.10) indicated there was not a
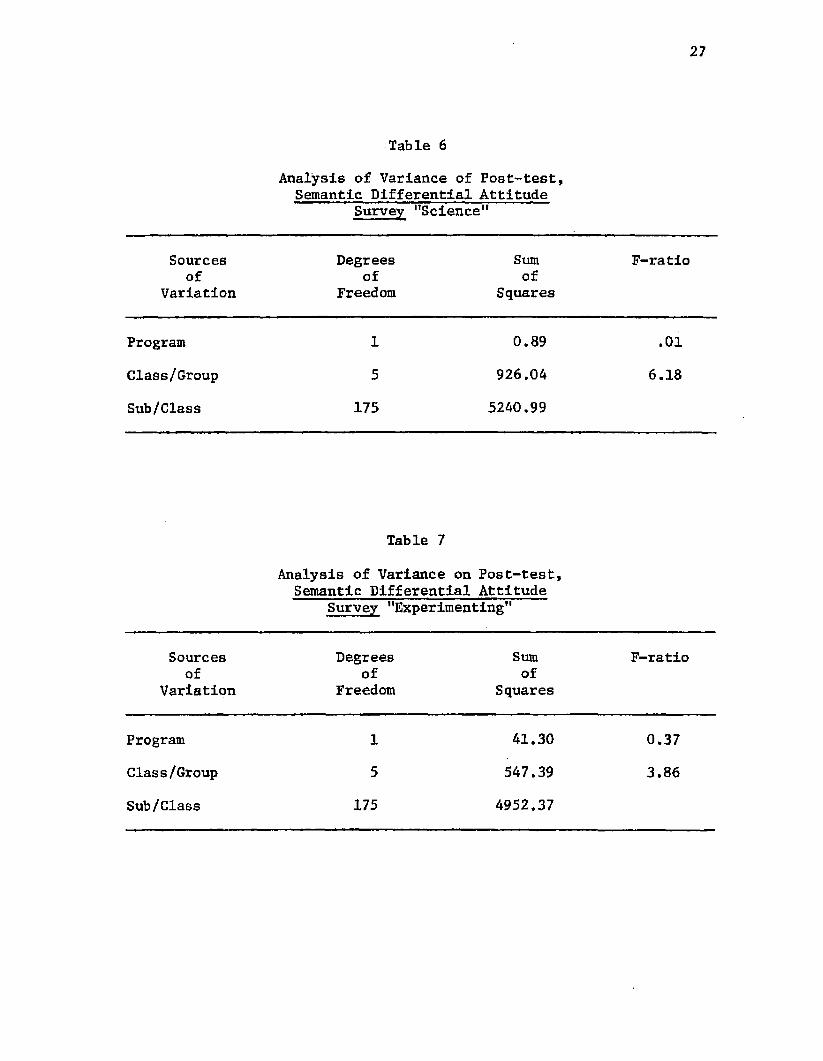
27
Table 6
Analysis of Variance of Post-test,Semantic Differential Attitude
Survey "Science"
Sourcesof
Variation
Degreesof
Freedom
Sumof
Squares
F-ratio
Program 1 0.89 .01
Class/Group 5 926.04 6.18
Sub/Class 175 5240.99
Table 7
Analysis of Variance on Post-test, Semantic Differential Attitude
Survey "Experimenting"
Sources Degrees Sum F-ratioof of of
Variation Freedom Squares
Program 1 41.30 0.37
Class/Group 5 547.39 3.86
Sub/Class 175 4952.37
28
Table 8Analysis of Variance on Post-test,
Semantic Differential Attitude Survey "Learning"
Sourcesof
Variation
Degreesof
Freedom
Sumof
Squares
F-ratio
Program 1 42.60 1.90
Class/Group 5 119.86 1.04
Sub/Class 175 3922.00
Table 9
Analysis of Variance on Post-test, Semantic Differential Attitude
Survey "Me"
Sources Degrees Sum F-ratioof of of
Variation Freedom Squares
Program 1 0.63 0.01
Class/Group 5 390.43 2.56
Sub/Class 175 5334.31
29
Table 10
Analysis of Variance on Post-test,Semantic Differential Attitude
Survey "Human Sciences"
Sourcesof
Variation
Degreesof
Freedom
Sumof
Squares
F-ratio
Program 1 274.09 2.64
Class/Group 5 519.05 3.77
Sub/Class 175 4807.06
Table
Analysis of Variance Scores, Semantic
Attitude
11
on Total Post-test Differential Survey
Sources Degrees Sum F-ratioof of of
Variation Freedom Squares
Program 1 153.67 0.10
Class/Group 5 14299.87 1.87
Sub/Class 175 267014.00
30significant difference in scores on the attitude survey of students
classified according to program.
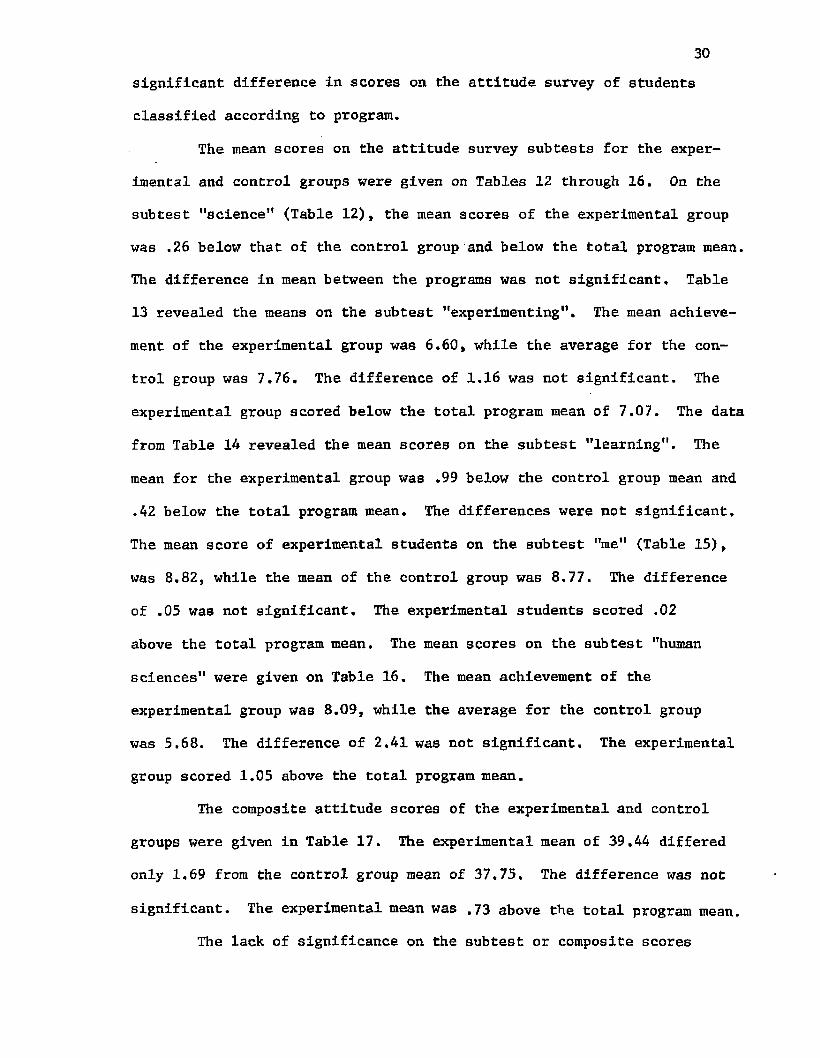
The mean scores on the attitude survey subtests for the exper
imental and control groups were given on Tables 12 through 16. On the
subtest "science" (Table 12), the mean scores of the experimental group
was .26 below that of the control group and below the total program mean.
The difference in mean between the programs was not significant. Table
13 revealed the means on the subtest "experimenting". The mean achieve
ment of the experimental group was 6.60, while the average for the con
trol group was 7.76. The difference of 1.16 was not significant. The
experimental group scored below the total program mean of 7.07. The data
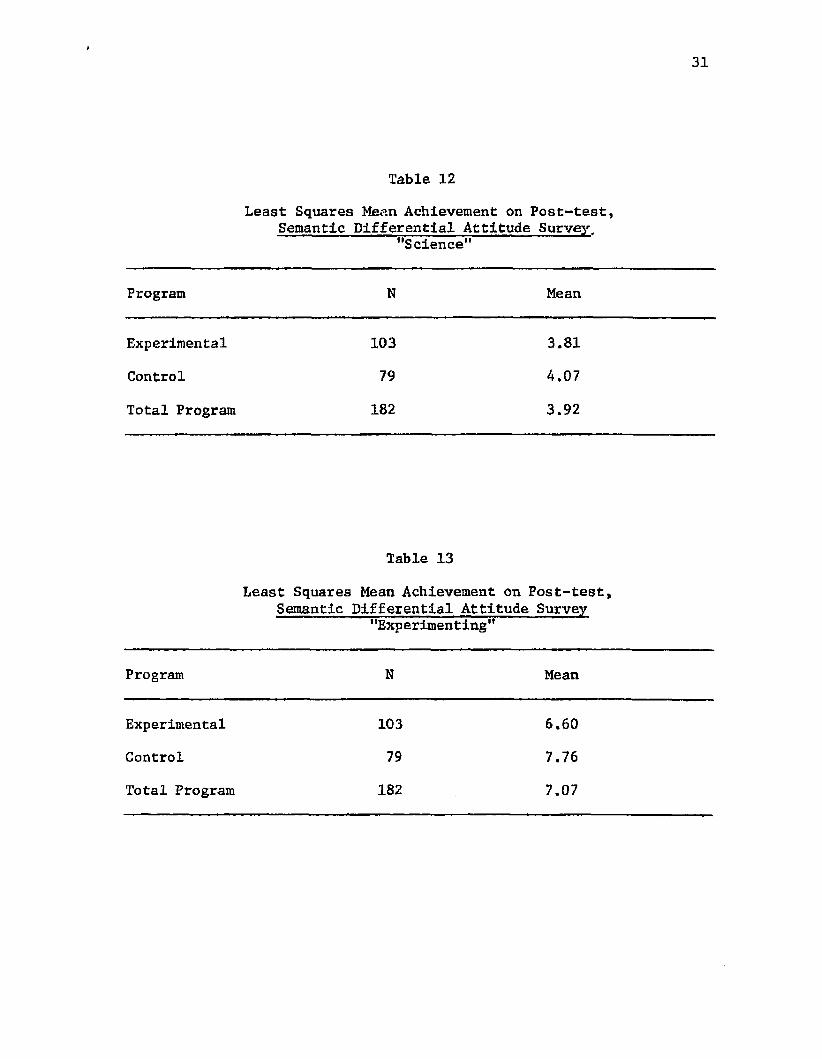
from Table 14 revealed the mean scores on the subtest "learning". The
mean for the experimental group was .99 below the control group mean and
.42 below the total program mean. The differences were not significant.
The mean score of experimental students on the subtest "me" (Table 15),
was 8.82, while the mean of the control group was 8.77. The difference
of .05 was not significant. The experimental students scored .02
above the total program mean. The mean scores on the subtest "human
sciences" were given on Table 16. The mean achievement of the
experimental group was 8.09, while the average for the control group
was 5,68. The difference of 2,41 was not significant. The experimental
group scored 1.05 above the total program mean.
The composite attitude scores of the experimental and control
groups were given in Table 17. The experimental mean of 39,44 differed
only 1.69 from the control group mean of 37.75, The difference was not
significant. The experimental mean was .73 above the total program mean.
The lack of significance on the subtest or composite scores
31
Table 12
Least Squares Mean Achievement on Post-test,Semantic Differential Attitude Survey,
"Science"
Program N Mean
Experimental 103 3.81
Control 79 4.07
Total Program 182 3.92
Table 13
Least Squares Mean Achievement on Post-test, Semantic Differential Attitude Survey
' 'Exp eriment ing''
Program N Mean
Experimental 103 6.60
Control 79 7.76
Total Program 182 7.07
32
Table 14
Least Squares Mean Achievement on Post-test, Semantic Differential Attitude Survey
"Learning"
Program N Mean
Experimental 103 7.68
Control 79 8.67
Total Program 182 8.10
Table 15
Least Squares Mean Achievement on Post-test, Semantic Differential Attitude Survey
"Me"
Program N Mean
Experimental 103 8.82
Control 79 8.77
Total Program 182 8.80

33
Table 16
Least Squares Mean Achievement on Post-test,Semantic Differential Attitude Survey
"Human Sciences"
Program N Mean
Experimental 103 8.09
Control 79 5.68
Total Program 182 7.04
Table 17
Least Squares Mean Avhievement on Total of Post-test Scores, Semantic Differential
Attitude Survey
Program N Mean
Experimental 103 39.44
Control 79 37.75
Total Program 182 38.71

34
indicated that neither program was found to be significantly more effec
tive for the sixth-grade student in the area of attitude.
Data for the Weber Process Test
The analysis of variance for processes serving as subtest scores
for the Weber Process Test was given in Tables 18 through 23. The
variance ratio (1.86) on Table 18 revealed there was no significant
difference between the two programs in the process "observing".
For the process "classifying" (Table 19), the variance ratio of .94
indicated there was not a significant difference between the experi
mental and control groups. Table 20 indicated the variance ratio (.05)
for the process "measuring" was not significant. For the process
"experimenting" (Table 21), the variance ratio of .04 indicated there
was no significant difference between students classified according
to program. The variance ratio (.14) on Table 22 indicated there
was no significant difference between the programs in the process
"interpreting". For the process "predicting" (Table 23), the variance
ratio (.97) Indicated there was no significant difference between the
two programs.
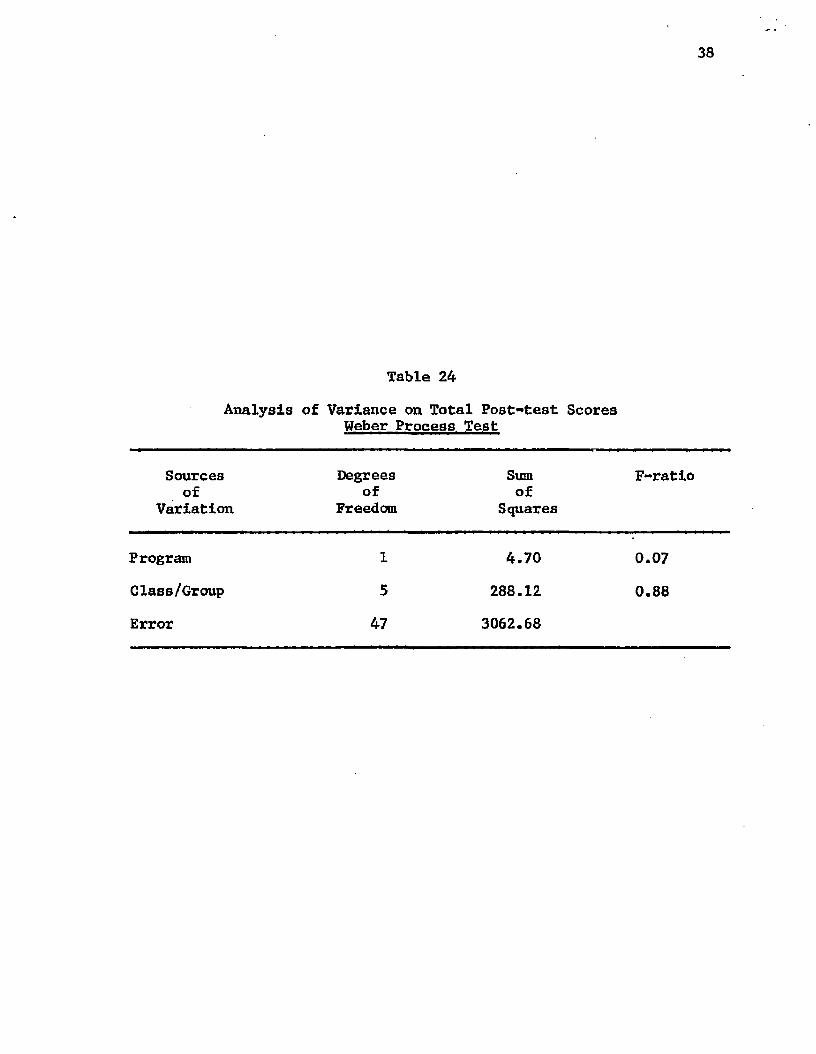
The variance ratio (.07) for the composite process scores
(Table 24) Indicated that there was no significant difference between
students classified according to program.
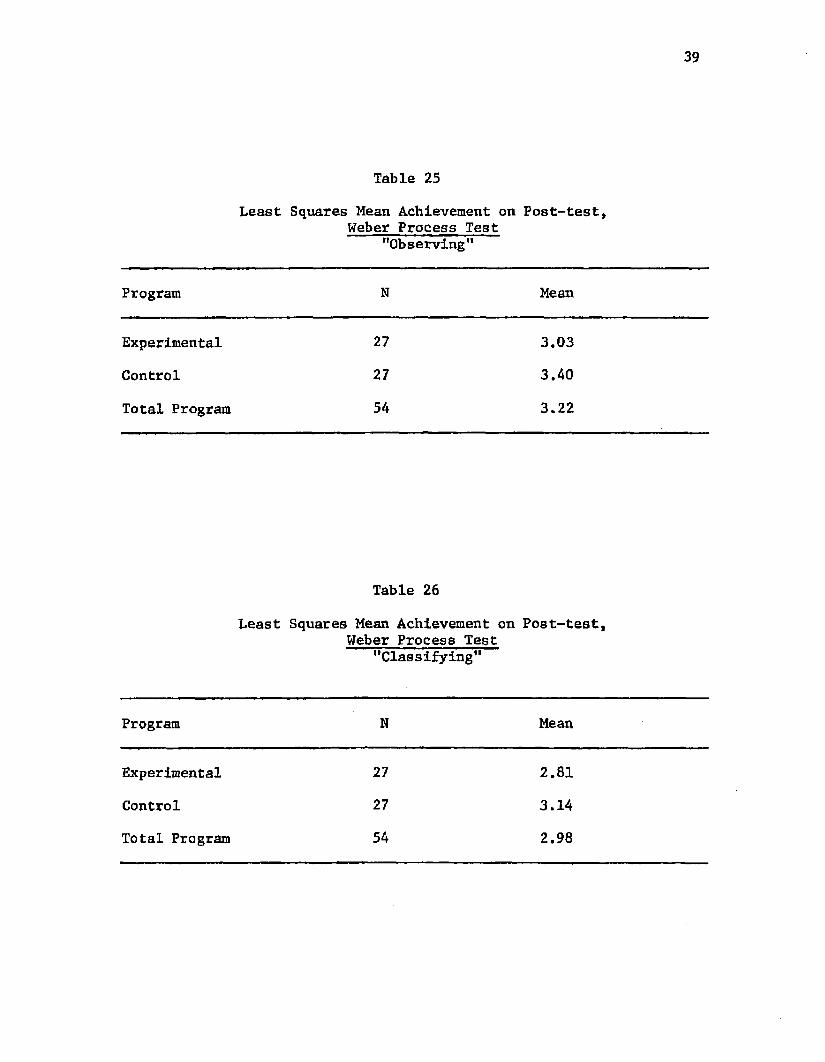
The meaii scores on. the sub tests of the Weber Process Test were
given in Tables 25 through 30. On the process "observing (Table 25)
the mean of the experimental group was .37 below the control group •
mean and .19 below the total program mean. However, the difference
between the two programs was not significant. Table 26 revealed the .
mean scores for the experimental and control group for the process

35
Table 18
Analysis of Variance on Post-test,Weber Process Test
"Observing"1
Sourcesof
Variation
Degreesof
Freedom
Sumof
Squares
F-ratio
Program 1 2.43 1.86
Class/Group 5 6.15 .94
Error 47 61.32
Table 19
Analysis' of Variance on Post-test, Weber Process Test
"Classifying"
Sources Degrees Sum F-ratioof of of
Variation Freedom Squares
Program 1 2.63 0.94
Class/Group 5 13.92 3.48
Error 47 37.55

36
Table 20
Analysis of Variance on Post-test Weber Process Test
"Measuring"
Sources Degrees Sum F-ratloof of of
Variation Freedom Squares
Program 1 0.19 0.05
Class/Group 5 16.16 0.98
Error 47 154.87
Table 21
Analysis of Variance on Post-test Weber Process Test
' 'Exp er Imen t Ing''
Sources Degrees Sum F-ratloof of of
Variation Freedom Squares
Program 1 0.22 0.04
Class/Group 5 33.04 1.26
Error 47 246.36

37
Table 22
Analysis of Variance on Post-testWeber Process Test
"Interpreting"
Sourcesof
Variation
Degreesof
Freedom
Sumof
Squares
F-ratio
Program 1 0.45 0.14
Class/Group 5 5.81 0.38
Error 47 142.55
Table 23
Analysis of Variance on Post-test Weber Process Test
"Predicting"
Sources Degrees Sum F-ratioof of of
Variation Freedom Squares
Program 1 3.76 0.97
Class/Group 5 37.14 1.91
Error 47 182.26
38
Table 24
Analysis of Variance on Total Post-test Scores Weber Process Test
Sourcesof
Variation
Degreesof
Freedom
Sumof
Squares
F-ratio
Program 1 4.70 0.07Glass/Group 5 288.12 0.88
Error 47 3062.68
39
Table 25
Least Squares Mean Achievement on Post-test,Weber Process Test
"Observing"
Program N Mean
Experimental 27 3.03
Control 27 3.40
Total Program 54 3.22
Table 26
Least Squares Mean Achievement on Weber Process Test
"Classifying"
Post-test,
Program N Mean
Experimental 27 2.81
Control 27 3.14
Total Program 54 2.98

40
Table 27
Least Squares Mean Achievement on Post-test,Weber Process Test
"Measuring"
Program N Mean
Experimental 27 4.37
Control 27 4.48
Total Program 54 4.42
Table 28
Least Squares Mean Achievement on Weber Process Test
' 'Exp er iment ing "
Post-test,
Program N Mean
Experimental 27 3.14
Control 27 3.00
Total Program 54 3.07
41
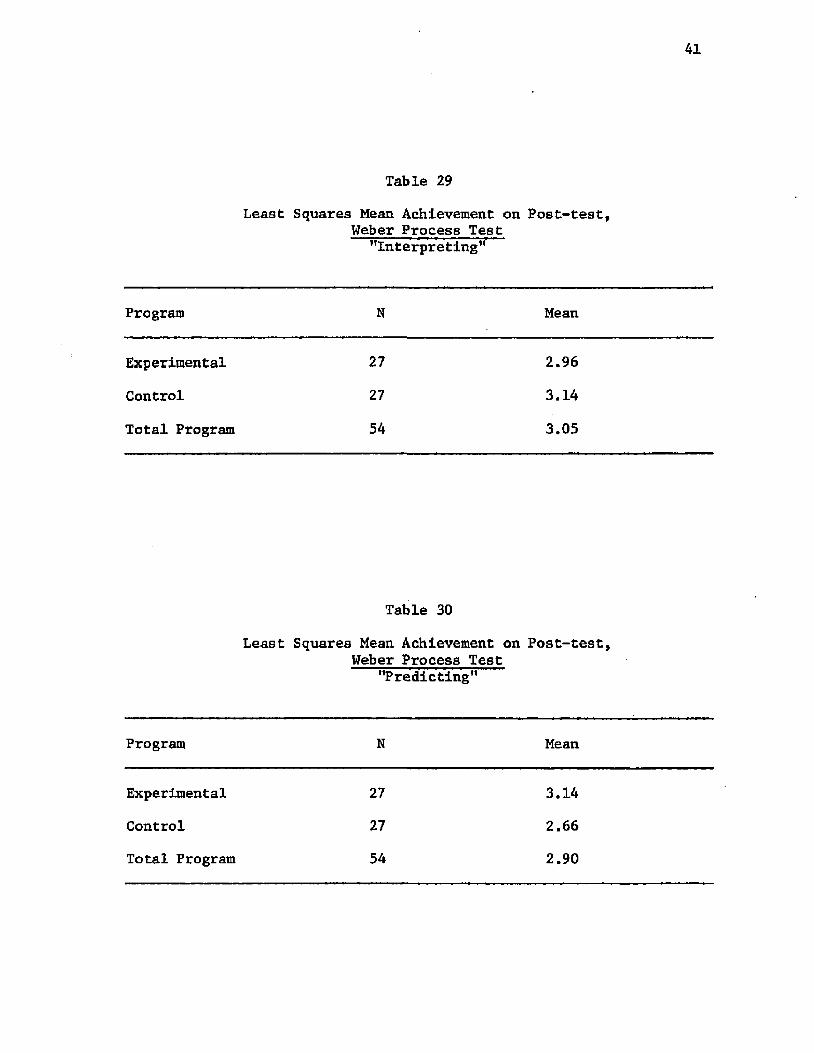
Table 29
Least Squares Mean Achievement on Post-test,Weber Process Test
"Interpreting”
Program N Mean
Experimental 27 2.96
Control 27 3.14
Total Program 54 3.05
Table 30
Least Squares Mean Achievement on Weber Process Test
"Predicting"
Post-test,
Program N Mean
Experimental 27 3.14
Control 27 2.66
Total Program 54 2.90

42
"classifying". The mean for the experimental group was .33 below the ‘
mean of the control group and ,17 below the total program mean. The
difference between the means was not significant. For the process
"measuring" (Table 27), the experimental mean was ,11 below the control
mean and .05 below the total program mean. The differences were not
significant. The experimental mean for the process "experimenting"
(Table 28), was .14 above the control average and .07 above the total
program mean. The difference between the two programs was not signifir-
cant. The difference of .18 between the experimental mean of 2.96
and the control mean of 3,14 was not significant for the process
"interpreting" (Table 29). The total program mean was 3.05 and .09
above the experimental mean. For the process "predicting" (Table 30)
the difference of .48 was not significant. The experimental mean was
3.14, while the control average was 2.66. The experimental was .24 . •-
above the total program mean of 2,90.
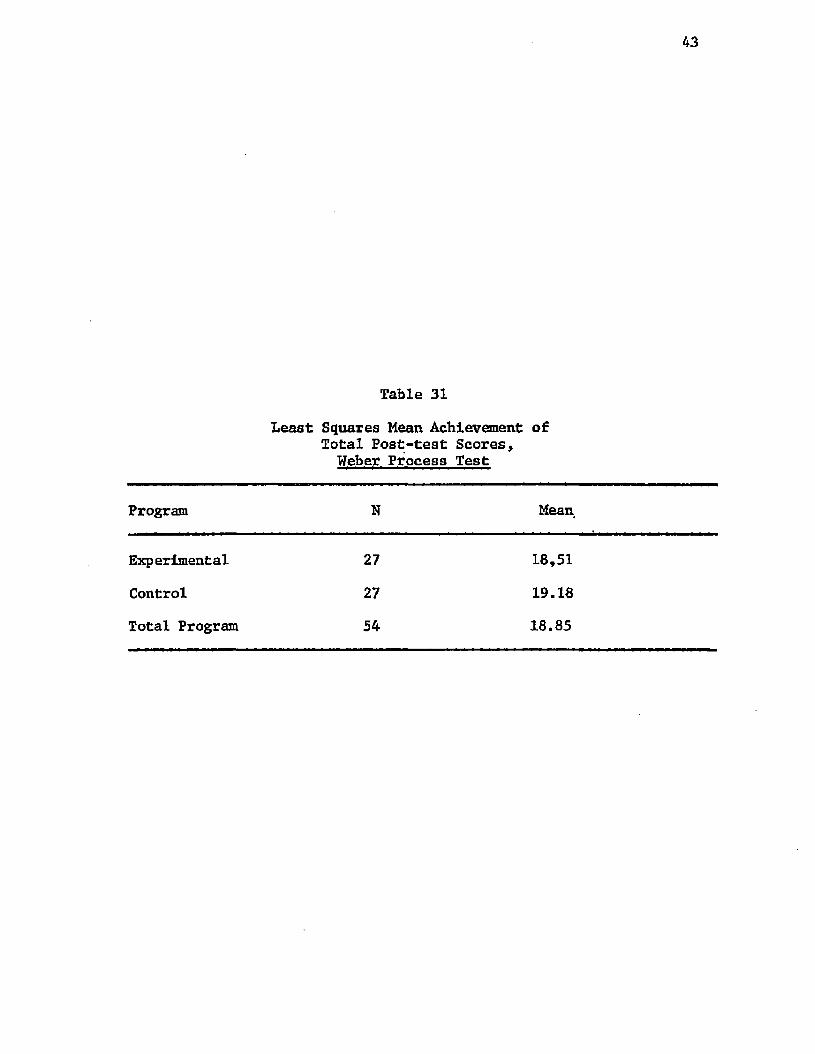
The composite score mean achievement as presented on Table
31 yielded an experimental mean of 18.51 and a control mean of 19.18.
The difference of ,67 was not significant. The mean of the experimental
group was .34 below the total program mean. Since no significant
difference was found between the mean scores of the experimental and
control groups on the processes of the Weber Process Test, neither
program proved more effective than the other.
43
Table 31
Least Squares Mean Achievement Total Post-test Scores, Weber Process Test
of
Program N Mean
Experimental 27 18,51
Control 27 19.18
Total Program 54 18.85

Chapter 5
SUMMARY, CONCLUSIONS, AND RECOMMENDATIONS
. The major purpose of this study was to determine if there was a
significant difference in achievement, attitude, and process mean scores
between students who participated in the BSCS: HSP curriculum and those
who participated in the existing science programs which centered around
a basal text. Randomly assigned sixth-grade students in two schools in
Baton Rouge, Louisiana comprised the sample. Approximately one-half of
this sample was assigned to an experimental group which received science
instruction through the Biological Sciences Curriculum Study: Human
Sciences Program developed in Boulder, Colorado. The other half of the
students was assigned to the control group and instructed through the
traditional textbook approach utilizing Science: People, Concepts and
Processes, published by Webster Division, McGraw-Hill. In the fall of
1974, one-half of the total sample was pre-tested with the SRA Achieve
ment Series, Science. Form F/Green Level and a Semantic Differential
Attitude Survey following a Solomon Four-Group experimental design.
All of the students were post-tested in May, 1975 using the SRA Achieve
ment Series, Science, Form F/Green Level and a Semantic Differential
Attitude Survey. Over one-third of the entire sample was post-tested
with the Weber Process Test.
The post-test data were subjected to least squares analysis of
variance. A’ preliminary analysis of post-test data indicated that the
use of pre-test data was not necessary. A randomized, control group,
44

45
post-test only design was followed. The data were analyzed and the
results were reported in tabular form, A summary of the results of
these analyses follows.
SUMMARY OF RESULTS
1. It was hypothesized that there would be significant differ
ences between the standard achievement test mean scores of the students
who received science Instruction through BSCS: HSP when compared with
the standard achievement test mean scores of students who received
instruction through the basal text. The findings indicated there were
no significant differences between the two programs at the .05 level.
2. It was hypothesized that there would be significant differ
ences between the attitude mean scores of the students who received
science instruction through BSCS: HSP when compared with the attitude
mean scores of students who received instruction through the basal text
approach. The findings indicated there were no significant differences
between the two programs at the ,05 level.
3. It was hypothesized that there would be significant differ
ences between the process test mean scores of the students who received
science instruction through BSCS: HSP when compared with the process
test mean scores of students who received science instruction through
the basal text. The findings indicated there were no significant
differences between the two programs at the .05 level.
CONCLUSIONS
From a consideration of the data presented within the limita
tions of this study,.the following conclusions appeared to be warranted:
46
Overall, the BSCS: HSP was as beneficial as the basal text approach
based on the mean scores of achievement, attitude and process. Because
the experimental program was effective In the areas of achievement,
attitude and process skills, It offered an alternative method of science
instruction and should continue to be encouraged for use by teachers
who by disposition and inclination feel comfortable with this method
of instruction.
The experimental program may also have fostered growth in areas
that were not measured in this study such as; helping a child move to a
more complex level of thinking, stressing of the learner’s independence
and encouraging the learner to become more involved with his environment.
RECOMMENDATIONS FOR FURTHER STUDY
1. Follow-up studies should be made with a population comprised
of representative numbers of both black and white students.
2. Follow-up studies should be made with a population comprised
of representative numbers of both rural and urban students.
3. Follow-up studies should be made with a population comprised
of representative numbers of both readers and non-readers.
4. Follow-up studies should be made with a population comprised
of representative numbers of upper, middle and lower socio-economic
status.

SELECTED BIBLIOGRAPHY
Agne, Russell M. and Robert Nash. "Systems Engineering, Humanism, and the Teaching of Science," Science Education. 57:227-289,June, 1973.
Allen, Leslie R. "An Evaluation of Children's Performance on Certain Cognitive, Affective and Motivational Aspects of the Systems and Subsystems Unit of the Science Curriculum Improvement Study Elementary Science Program," Journal of Research in Science Teaching. 10: 125-134, 1973.
Anderson, 0. Roger. "Editorial: Research on the Open Classroom",Journal of Research in Science Teaching. 8: 97-98, 1971.
Barksdale, Arvell Troy. "An Evaluation of the Elementary ScienceStudy Program in Selected Classrooms in East Baton Rouge Parish, Louisiana," Dissertation Abstracts International. 34: 5741-A, 1973
Bass, Joele and Earl Montagle. "Piaget-Based Sequences of Instruction in Science," Science Education. 56: 503-512, December, 1972.
Beltran, Paquita U. "Analysis and Design of Selected Science Exercises for the Sixth Grade," Dissertation Abstracts International.31: 6140-A, 1970.
Bennett, Lloyd M. "A Study of the Comparison of Two InstructionalMethods, Involving Science Content in Ecology for the 7th Grade," Science Education. 50: 525-29, December, 1965.
Blackburn, Thomas R. "Sensuous Intellectual Complementarity . in Science," Science. 172: 3897, June, 1971.
Bohardt, Paul Clifford. "Attitudes Toward Process-Based Science Instruction Held by Students and Teachers in Grades 4-8," Dissertation Abstracts International. 35: 7631-A, 1974.
Brudzynski, Alfred John. "A Comparative Study of Two Methods for Teaching Electricity and Magnetism with Fifth and Sixth Grade Children," University Micofilms, 1966.
Carter, Neal. "Science Experience Center," Science and Children.4: 17-19, February, 1967.
Cohen, Ronald D. "Unwarranted Assumptions in our Innovative Science Curricula, Part I," Science Education. 56: 179-87, July, 1972.
"The Early Adolescent," Human Sciences: A Developmental Approach toAdolescent Education. Boulder, Colo.: BSCS, 1973.
47

48
Fulton, Harry. "A Comparative Study of Students Attitudes To Science and the Ability of the Teacher to Make Material Understandable in the Individualized and Group Approaches to BSCS Biology," School Science and Mathematics. 71: 198-202, March, 1971.
Gerne, Timothy. "A Comparative Study of Two Types of Science Teaching on the Competence of Sixth-Grade Students to Understand Selected Topics in Electricity and Magnetism," University Microfilms, 1967.
Gleason, Walter Patterson. "An evaluation of Some Effects of Pupil Self-Instruction Methods Compared with the Effects of Teacher- Led Classes in Elementary Science of Fifth-Grade Pupils," University Microfilms, 1965.
Hagerman, Barbara Heine. "A Study of Teachers' Attitudes Toward Science and Science Teaching as Related to Participation in a CCSS Project and to Their Pupils1 Perceptions of Their Science Classes," Dissertation Abstracts International. 35:5149-A, 1974.
Hounshell, Paul B. and Edwin West. "Trends in Teaching Science,"The Education Digest. 35: 25-8, April, 1970.
Hug, William E.. "Comparison of Cognitive and Affective GainsBetween Individual Study, Small Group Discussion and Large Group Presentation in High School Biology," Science Education. 55: 241-7, June, 1971.
Hurd, Paul DeHart. "Research in Science Education Planning for theFuture," Journal of Research in Science Teaching. 8: 243-9, 1971.
Kellough, Richard D. "The Humanistic Approach: An Experiment in theTeaching of Biology to Slow Learners in High School: AnExperiment in Classroom Experimentation," Science Education.354: 253-63, July, 1970.
LaCava, George. "An Experiment Via Tape," Science and Children.2: 56, October, 1965.
Lipson, Joseph I. "An Individual Science Laboratory,11 Science and Children. 3: 44, December, 1966.
Macbeth, Douglas Russel. "The Extent to Which Pupils ManipulateMaterials and Attainment of Process Skills in Elementary School Science," Journal of Research in Science Teaching. 11: '45-51, 1974.
Mahan, L. A. "Which Extremem Variant of the Problem Solving Method of Teaching Should be More Characteristic of the Many Teacher Variations of Problem-Solving Teaching?" Science Education.54: 309-16.

49
Nay, Marchall and Robert Crocker. "Science Teaching and the Affective Attributes of Scientists," Science Education. 54: 59-67,March, 1970.
Nelson, Charles. Review of SRA Science Test, The Seventh MentalMeasurement Yearbook, ed. Oscar K. Buros, 2 Vols. Highland Park, New Jersey: Gryphon Press, 1972.
Osgood, Charles, George Suci, and P. Tannenbaum. The Measurement of Meaning. The Urbana: University of Illinois Press, 1957.
O'Toole, Raymond. "A Study to Determine Whether Fifth-Grade Children Can Learn Certain Selected Problem-Solving Abilities Through Individualized Instruction," University Microfilms, Research Study No.l, 1966.
Price, LaMar. "A$ Investigation of the Transfer of an Elementary Science Process," University Microfilms, 1968.
"Rationale for Human Sciences," Human Sciences; A Developmental Approach to Adolescent Education. Boulder, Colo.:BSCS, 1973.
Rauh, Chester. "The Interaction Between Curriculum Variables andSelected Classroom Student Characteristics," University Microfilms, 1967.
Raun, Chester and David Butts. "The Relationship Between theStrategies of Inquiry in Science and Student Cognitive and Affective Behavioral Change," Journal of Research in Science Teaching. 5: 261-8, 1969.
Renner,-John W. and others. "An Evaluation of the Science Curriculum Improvement Study," School Science and Mathematics. 73:291-318, April, 1973.
Rogers, Dorothy. Adolescence: A Psychological Perspective. Monterey:Brooks/Cole, 1972.
Samples, Robert. "Science, A Human Enterprise," The Science Teacher. 39: 29, October, 1972.
Schiller, Le Roy. "A Study of the Effect of Individualized Activities On Understanding," University Microfilms, 1962.
Scott, Norval C. and I. E. Siegel. Effects of Inquiry Training inPhysical Science on Creativity and Cognitive Styles of Elementary Science Children. Washington, D. C.: U. S, Office of Education,Cooperative Research Reporting Branch, 1965.
Shoreman, Peter. "Comment and Criticism: Grade Placement-Need for aShift In Emphasis?" Journal of Research in Science Teaching.2: 77-79, 1964.

50
Smith, Billy Arthur. "An Experimental Comparison of Teaching Selected Concepts to Sixth-Grade Students," University Microfilms, 1966,
Snider, J. C. and C. E. Osgood, Semantic Differential Techniquev Chicago: Aldine Publishing Co., 1969.
Sutman, Frank S. "Mass Education and the New Science," Science Education. 50: 494-6, 1966.
Taylor, Slone. "Curriculum and Instructional Evaluation in Science," Science Education. 54: 237-9, September, 1970.
Thier, Herbert D. Teaching Elementary School Science. Heath and Co., California, 1970.
Thomas, Elizabeth and K. Yamamoto. "Minority Children and TheirSchool-Related Perceptions," Journal of Experimental Education. 40: 89-96, 1971.
Troast, Cornelius. "Science Curriculum Improvement Study and the Problems of Right and Wrong," School Science and Mathematics.70: 522-526, June, 1970,
Vanek, Augenla Ann Poporad. "A Comparative Study of Selected Science Teaching Materials (ESS) and a Teaching Approach on Classifica- tory Skills, Science Achievement and Attitude," Dissertation Abstracts International. 35: 1522-A, 1974.
Vejdovec, William Edward. "The Effects of Two Science Curriculum .Approaches on the Achievement of Science Knowledge of Elementary Students," Dissertation Abstracts International. 34: 6477-A,1974.
Watson, F. G. "Teaching Science to the Average Pupil," Science Teacher. 34: 24-6, March, 1967.
Welch, Wayne. "Curriculum Evaluation," Review of Education Research. 39: 429-43, 1972.
Wood, Roger. "University Education Student’s Understnading of the Nature and Processes of Science," School Science and Mathematics . 72: 73, January, 1972.
"Your scores and What They Mean," Science Research Associates,Inc., 1971.
Zubulake, George Richard. "A Study of the Learning by Discovery Controversy in Science Teaching," Dissertation Abstracts International. 31: 6435-A, 1970,

APPENDIX A
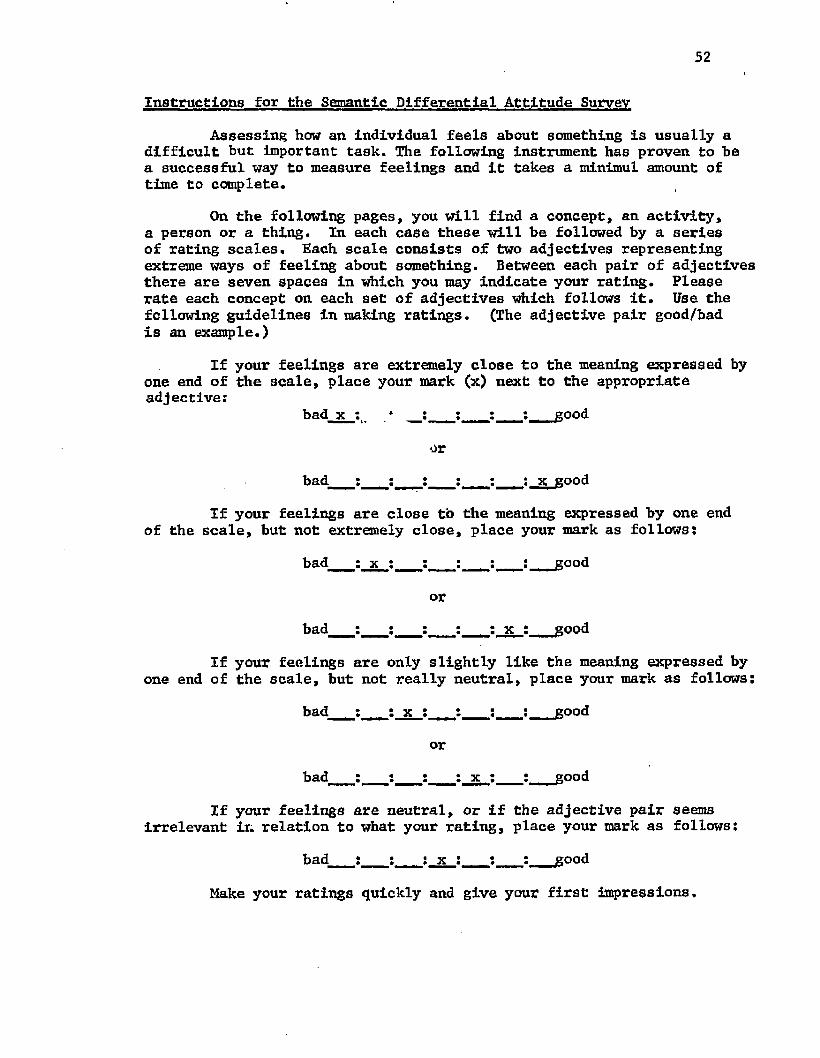
52
InstructIons for Hie Semantic Differential Attitude Survey
Assessing how an Individual feels about something is usually a difficult but important task. The following instrument has proven to be a successful way to measure feelings and it takes a minimul amount of time to complete.
On the following pages, you will find a concept, an activity, a person or a thing. In each case these will be followed by a series of rating scales. Each scale consists of two adjectives representing extreme ways of feeling about something. Between each pair of adjectives there are seven spaces in which you may indicate your rating. Please rate each concept on each set of adjectives which follows it. Use the following guidelines in making ratings. (The adjective pair good/bad is an example.)
If your feelings are extremely close to the meaning expressed by one end of the scale, place your mark (x) next to the appropriate adjective:
bad x : . ̂ __; : : : good
or
bad__ : : : : : ; x good
If your feelings are close to the meaning expressed by one end of the scale, but not extremely close, place your mark as follows:
bad__ : x : : : : :__ good
orbad__ :___ : : : : x :___good
If your feelings are only slightly like the meaning expressed by one end of the scale, but not really neutral, place your mark as follows:
bad : : x : :___:___ : good
or
bad : :____:___ : x :___:___good
If your feelings are neutral, or if the adjective pair seems Irrelevant in relation to what your rating, place your mark as follows:
bad__ :___ : : x :___: : good
Make your ratings quickly and give your first impressions.
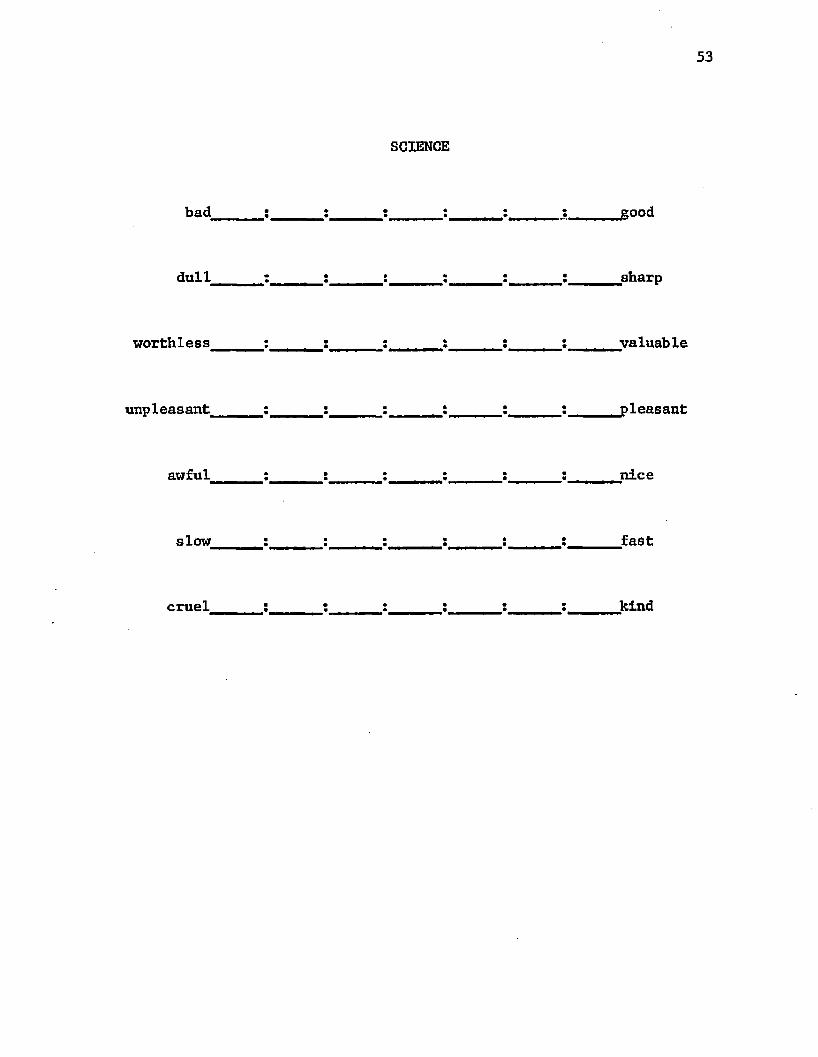
53
SCIENCE
bad i t : i : t______ good
dull sharp
worthless______ :______ :______ :______ i______ :______ :______ valuable
unpleasant______ : : : : : : pleasant
awful______ :______ :______ :______ :______ :______ :______ nice
slow______ :______ :______ :______ :______ :______ :______ fast
crue 1______ :______ :______ :______ :______ :______ :______ kind
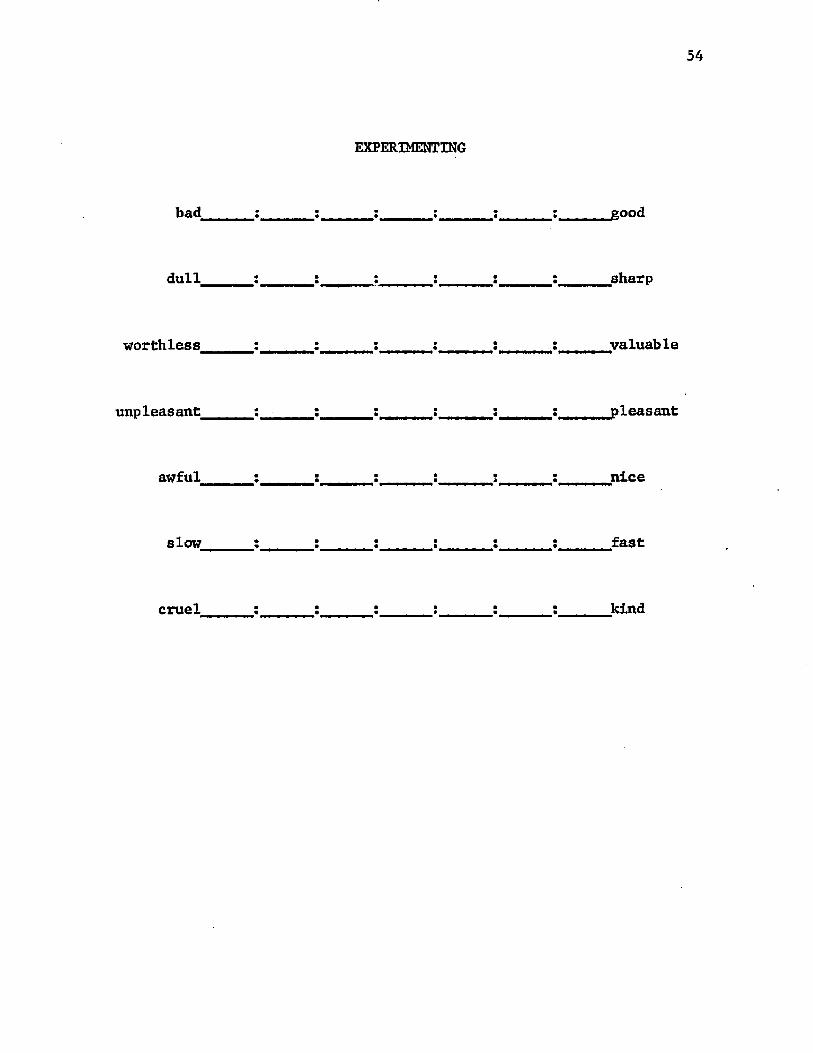
54
EXPERIMENTING
bad______ :______ :______ :______ :______ :______ :______ good
dulI : ; ; ; ; ; sharp
worthless______ :______ :______ :______ :______ :______ :______ valuable
unpleasant : : : ; ; pleasant
awful______ :______ :______ :______ :______ :______ :______ nice
s low______ :______ :______ :______ :______ :______ :______ fast
cruel : : : : : : kind
55
LEARNING
dull ;______ : i ; : : sharp
worthless______:______ :______ :______:______ :______:______valuable
unpleasant ; i : : ; : pleasant
awful______I______ :______:______:______ :______:______nice
slow______:______:______:______:______ :______ :______ fast
cruel______ :______ :______ :______ :______ :______ :______ kind
ME
bad good
dul 1 : : : ;______ :______ :______ sharp
worthless______ :______ :______ :______ :______ :______ :______ valuable
unpleasant pleasant
awful :______ :___ :______ :______ :______ :______ nice
slow :______ :______ :______ :______ :______ :______ fast
cruel______ ;______ :______ :______ :______ :______ :______ kind
57
HUMAN SCIENCES
bad : i : : : : good
dull : : : ; . : ; sharp
wor thl es s______ :______ :______ :______ :______ :______ :______ valuab le
unpleasant : ; :______ :______ :______ :______ pleasant
awful______ :______ :______ :______ : : :______ nice
s low______ :______ :______ : :______ :______ :______ fas t
cruel______ :______ :______ :______ :______ :______ :______ kind

APPENDIX B
WEBER PROCESS TEST
Process-Observing-Task 1. Nos. 1-0 and 2-0.
Materials: A piece of clear, transparent plastic 8 1/2 x 5 1/4 inches.Administrative Procedure: Give the plastic to the child.Instructions to the child: Describe this object.Score: 1-0. Place a check in the acceptable column if four
properties are given.2-0. Place a check in the acceptable column if eight
or more properties are given.
Process-Observing-Task 2. Nos. 3-0 and 4-0.
Materials: Ten pieces of chalk, four marbles, three ping pongballs, five dominoes, three wooden cubes, four nails, two identical boxes (cigar) .
Administrative procedure: One of the empty boxes is sealed withthree pieces of chalk in it. Place this box In front of the child. Place the objects and the other empty opened box In front of the child.
Instructions to the child: What is in this sealed box? (The administrator will just point to the sealed box.)
Score: 3-0. Place a check in the acceptable column if the childmanipulates the sealed box before he attempts to make the identification.
4-0. Place a check in the acceptable column if the childattempts to use the empty box and the objects to Identify what isin the sealed box.
Process-Observing-Task 3. Nos. 5-0 and 6-0.
Materials: Magnifier, ruler, a piece of string, two sea shells(different), a spring balance.
Administrative procedure: Give the materials to the child.Instructions to the child: Tell how these two shells are
different.Score: 5-0. Place a check in the acceptable column if the
child gives four qualitative differences (non-measured, nonnumbered) .
6-0. Place a check In the acceptable column If the child gives two quantitative differences (measured, numbered).
Frocess-Classifying-Task 4. Nos. 7-C and 8-C.
Materials: A collection of the following objects: two nails,
39
60one plastic spoon, 4 x 4 inch aluminum foil, four marbles, one thumb tack, one wooden pencil, one index card ( 3 x 5 inches) .
Administrative procedure: Give the collection of objects to thechild.
Instructions to the child: Place these objects in groups so thatthe objects in each group are alike in some way and tell how they are alike.
Score: 7-C. Place a check in the acceptable column if the childplaces the objects in logical groups.
8-C. Place a check in the acceptable column if the child properly identifies the characteristic of each group.
Process-Classifying-Task 5. Nos. 9-C and 10-C.
Materials: Cards cut in these designs: six red diamonds, six bluediamonds, six yellow diamonds, six red circles, six blue circles, six red rectangles, six blue rectangles, six yellow rectangles, and six yellow circles.
Administrative procedure: The cards will be placed in a pile infront of the child and the administrator will begin and control the initial part of the activity. With the appropriate instructions he will give a set of two cards to the child and then give a set of two cards to himself. The administrator will do this for a total of three moves. The following pattern will be followed:
To Child To Administrator1st move2nd move 03 0 0 03rd move © CDAfter the administrator has completed the third move, the childwill be asked to select from the card pile, two cards for himselfand two cards for the administrator.
Instructions to the child: I am going to give you two cards andthen give myself two cards. I will do this in a special way.Here is your first pair and here is nor first pair of cards. Hereis your next pair and here is my next pair. Here is your thirdpair and here is my third pair. Now, you give yourself two cards and then give me two cards. Do this in the same special way which I did.
Score: 9-C. Place a check in the acceptable column if the childgives himself either two of the same shape or two of a different color.
10-C. Place a check in the acceptable column if the child gives the administrator two of the same color.
Process-Measurlng-Task 6. Nos. 11-M and 12-M.
Materials: A collection of the following: a strip of paper twoinches by one-half inch, a marble, a nail, a button and twelve beans, and a 3 x 5 card, (no ruler.)
61Administrative procedure: Give the collection to the child. After
he examines.them, give him the 3 x 5 card.Instructions to the child: Measure the length of the card.Score: 11-M. Place a check in the acceptable column if the childattempts to use any of the objects to measure the card's length.
12-M. Place a check in the acceptable column if the child actually gives a measurement. Example - 3 1/2 nails long.
Process-Measuring-Task 7. Nos. 13-M and 14-M.
Materials: Tripod support, stiff wire, a rubber band, a sheet ofgraph paper, 1/2 oz. fishing weights, and a large nut (a threaded head of a bolt).
Administrative procedure: Give the objects to the child and thenhand him the nut.
Instructions to the child: What is the weight of this object? Useany of these objects if you want to. These fishing weights weigh 1/2 oz. each.
Score: 13-M. Place a check in the acceptable column if the childattempts to calibrate the rubber band stretch with the 1/2 oz. weights.
14-M. Place a check in the acceptable column if the child gives the weight of the nut as between 2-4 ounces,
Process-Measuring-Task 8. Nos. 15-M and 16-M.
Materials: Four 3 x 5 inch blank index cards with one each paintedred, yellow, blue and green, a small metric-scale ruler.
Administrative procedure: The four cards must be of identical lengthbut each painted a different color. The metric ruler should be in the 160 mm class or larger.
Instructions to the child: Measure these cards and determine hawmany little marks each card is long and how many little marks each card is wide.
Score: 15-M. Place a check in the acceptable column if the childgives the length of each card as identical -127 marks.
16-M. Place a check in the acceptable column of the childgives the width of each card as identical - 76 marks.
Process-Experimenting-Task 9, Nos 17-E and 18-E.
Materials: Solutions of salt water (A), water with phenolphthalein(B), and distilled water (C). The following dry powders: leadnitrate (1), calcium oxide (2), and sodium chloride (3). Straws to serve as droppers and scoops. Wax paper on which to mix.Powder papers and small paper cups to hold the liquids.
Administrative procedure: The solutions and the powders must beprepared before the test administration. Give the child about 25 ml. of each solution and 5 grams of each powder. Also, a sheet of wax paper should be given for the mixing. The straws, cups, and powder papers should be discarded after each child is tested. In placing the materials before the child, make it a point not to order them, I.e., 1, 2, and 3 or A, B, and C.
62
Instructions to the child: A red color will be formed when one of these liquids and one of these powders are mixed. Find which two will give the color.
Score: 17-E. Place a check in the acceptable column if the childapproaches the task in a systematic manner, i.e., put powder 1 in liquid A, B, C, etc.
18-E. Place a check in the acceptable column if the child finds powder 2 and liquid B will give the red color.
Process-Experimenting-Task 10. Nos. 19-E and 20-E.
Materials: A piece of cotton material (3 x 10 inches), a piece of .knit material (3 x 10 inches), four containers, a source of time measurement, a ruler, and water.
Administrative procedure: The materials are given to the child.Instructions to the child: Which of these pieces of cloth will
soak up water faster? Tell what you would do in finding out.Score: 19-E. Place a check in the acceptable column if the child
gives two of the following:____Put the same length of each clothin water. Keep them in the water for the same length of time. See how far the water moves on each cloth. Use water of thesame temperature. Use same amount of water.
Instructions to the child: Go ahead and see if the cloth youselected does soak up water faster.
Score: 20-E. Place a check in the acceptable column If the childapproaches the task in a systematic manner, i.e., controls the variables as he listed In 19-E.
Process-Experimenting-Task 11. Nos. 21-E and 22-E.
Materials: Ruler, string, scissors, support stand, wire, washers,lenses, three index cards, three rubber stoppers, and three marbles.
Administrative procedure: The collection of materials is given to :the child. The objective is to see whether the child can utilize them in some experimental design.
Instructions to the child: Here are some things. Use them and workan experiment of some kind. Do anything you wish. I will be asking you some questions about your experiment in five minutes or before if you finish your experiment.
Score: 21-E. Place a check in the acceptable column if the childdoes all the following:____Identifies an experimental problem.(What is the name of your experiment?) Sets up the materials inan attempt to solve the problem. (What did you do in yourexperiment?) Shows a concern for the necessity of controllingthe variables.
22-E. Place a check in the acceptable column if the childdoes all the following:____Attempts to hold some variables constant. Actually arrives at some data. Offers a possible solutionbased on his data.
Process-Interpreting-Task 12. Nos. 23-1 and 24-1.
Materials: Four microscope slides and four water solutions of sodiumchloride for each child.
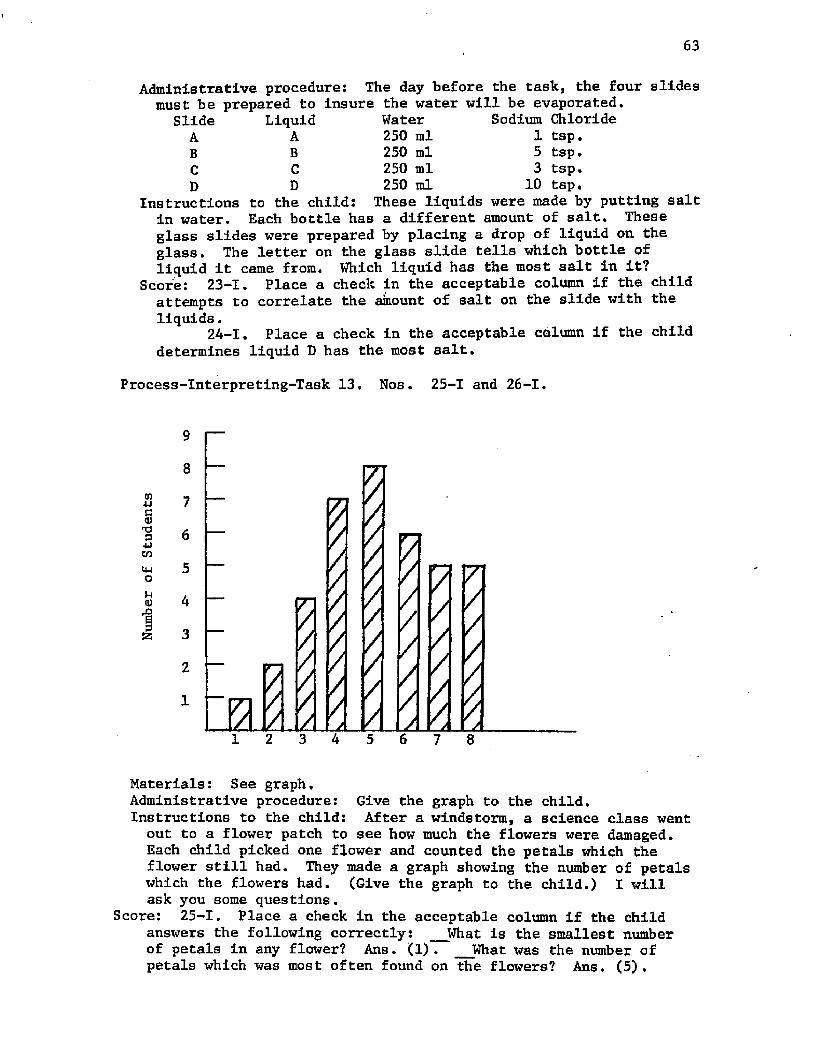
63
Administrative procedure: The day before the task, the four slidesmust be prepared to insure the water will be evaporated.
Slide Liquid Water Sodium ChlorideABCD
ABCD
250 ml 250 ml 250 ml 250 ml
1 tsp. 5 tsp. 3 tsp.
10 tsp.Instructions to the child: These liquids were made by putting salt
in water. Each bottle has a different amount of salt. These glass slides were prepared by placing a drop of liquid on the glass. The letter on the glass slide tells which bottle of liquid it came from. Which liquid has the most salt in it?
Score: 23-1. Place a check in the acceptable column if the childattempts to correlate the amount of salt on the slide with the liquids.
24-1. Place a check in the acceptable column if the child determines liquid D has the most salt.
Process-Interpreting-Task 13, Nos. 25-1 and 26-1.
m«e<DT334Jto
OHa)
r O
9
87
65
4
3
2
1
Materials: See graph.Administrative procedure: Give the graph to the child.Instructions to the child: After a windstorm, a science class went
out to a flower patch to see how much the flowers were damaged. Each child picked one flower and counted the petals which the flower still had. They made a graph showing the number of petals which the flowers had. (Give the graph to the child.) I will ask you some questions.
Score: 25-1. Place a check in the acceptable column if the childanswers the following correctly: What is the smallest numberof petals in any flower? Ans. (1). What was the number of petals which was most often found on the flowers? Ans. (5).
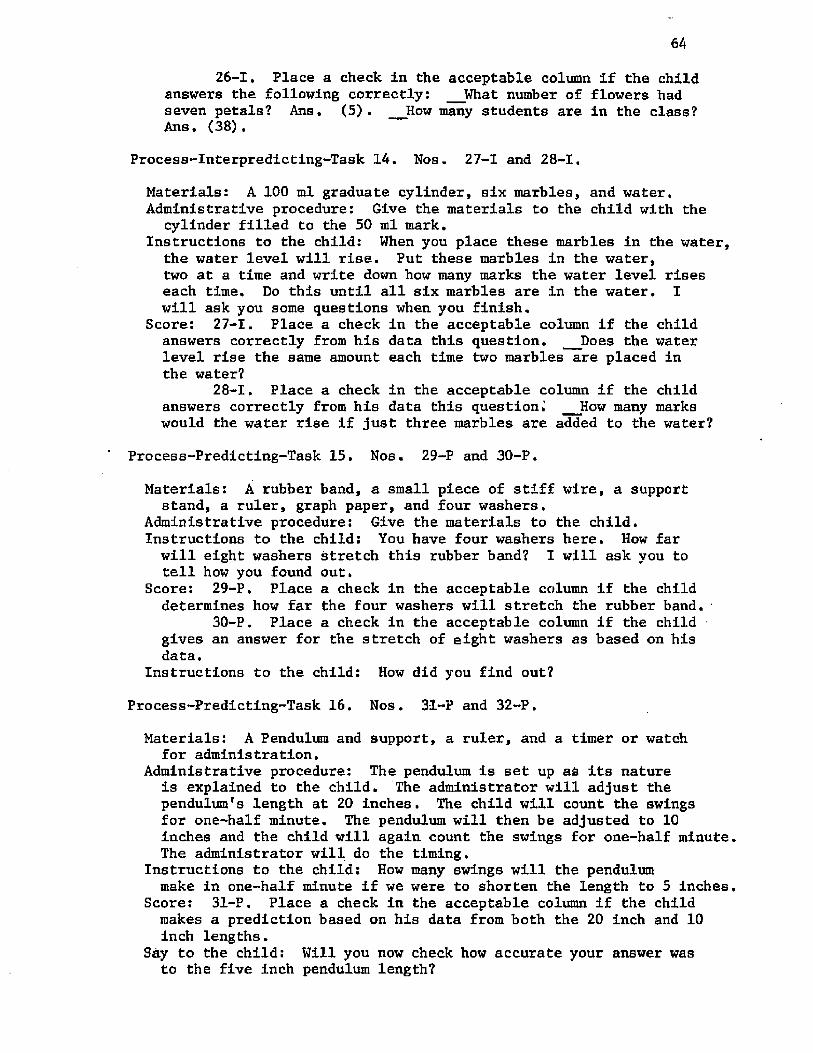
64
26-1. Place a check In the acceptable column If the child answers the following correctly: What number of flowers hadseven petals? Ans. (5). __How many students are in the class?Ans. (38).
Process-Interpredicting-Task 14. Nos. 27-1 and 28-1.
Materials: A 100 ml graduate cylinder, six marbles, and water.Administrative procedure: Give the materials to the child with the
cylinder filled to the 50 ml mark.Instructions to the child: When you place these marbles in the water,
the water level will rise. Put these marbles in the water, two at a time and write down how many marks the water level rises each time. Do this until all six marbles are in the water. I will ask you some questions when you finish.
Score: 27-1. Place a check in the acceptable column if the childanswers correctly from his data this question. Does the waterlevel rise the same amount each time two marbles are placed in the water?
28-1. Place a check in the acceptable column if the childanswers correctly from his data this questioni How many markswould the water rise if just three marbles are added to the water?
Process-Predicting-Task 15, Nos. 29-P and 30-P,
Materials: A rubber band, a small piece of stiff wire, a supportstand, a ruler, graph paper, and four washers.
Administrative procedure: Give the materials to the child.Instructions to the child: You have four washers here. How farwill eight washers stretch this rubber band? I will ask you to tell how you found out.
Score: 29-P. Place a check in the acceptable column if the childdetermines how far the four washers will stretch the rubber band.
30-P. Place a check in the acceptable column if the child gives an answer for the stretch of eight washers as based on his data.
Instructions to the child: How did you find out?
Process-Predicting-Task 16. Nos. 31-P and 32-P.
Materials: A Pendulum and support, a ruler, and a timer or watchfor administration.
Administrative procedure: The pendulum is set up as its natureis explained to the child. The administrator will adjust the pendulum's length at 20 inches. The child will count the swings for one-half minute. The pendulum will then be adjusted to 10 inches and the child will again count the swings for one-half minute. The administrator will do the timing.
Instructions to the child: How many swings will the pendulummake in one-half minute if we were to shorten the length to 5 Inches.
Score: 31-P. Place a check in the acceptable column if the childmakes a prediction based on his data from both the 20 inch and 10 inch lengths.
Say to the child: Will you now check how accurate your answer wasto the five inch pendulum length?

65
Score: 32-P. Place a check in the acceptable column if the childshortens the pendulum length to five inches and counts the swings in one-half minute.
Process-Predicting-Task 17. Nos. 33-P and 34-P.
Materials: Three different kinds of rubber balls (different indiameter, color, etc.).
Administrative procedure: The three balls are given to the child.Instructions to the child: Here are three rubber balls. You can doanything with them that you wish except bounce them. Decide which one will bounce higher when dropped from the same height.
Score: 33-P. Place a check in the acceptable column if the childmanipulates the three rubber balls to obtain data of some kind from which his prediction was made.
34-P. Place a check in the acceptable column if the child makes an accurate prediction based on his data.

APPENDIX G

67
SCHOOL PERSONNEL PARTICIPATING IN THE STUDy
Sherwood Forest Elementary, Mr. Biljy Stephens, Principal, 12000 Goodwd,
Ms. Ruby Campbell Ms. Marty Truax Ms. Jan Latimer Ms. Naomi McCrory
LaSalle Elementary, Ms. Amelia Elkins, Principal, 8000 LaSalle Ave.
Ms. Mary Saia Ms. Vera Olds Ms. Janet Belle
68
VITA
Donna Jean Conner Ashmead was bora in Houston, Texas on August 17,
1946, the oldest child of William Thomas and Fay Conner and sister of
Michael Thomas Conner.
She was educated in the Houston Independent School District
and graduated from Waltrip Senior High School in 1964. She was employed
by Southwest Distributing Company and attended the University of Houston
from 1964 to 1969. She then received a Bachelor of Science degree with
a major In elementary education and a minor in speech. The author was
employed by Cypress-Fairbanks School District during 1969 to 1972 serving
as a teacher on the applied skills team (4-5) and team leader of the basic
skills team (1-3). She received an M. Ed. degree from Texas Southern
University with a major in reading and a minor in psychology in August,
1972. She was employed by Conroe School District as team leader during
the 1972-1973 school year.
The author attended Louisiana State University from June, 1973,
to May, 1976, and served as a Consultant to the Houston School District
during the 1974-1975 school year.
Donna was married to Bernald Fred Ashmead on December 23, 1971.
They are the parents of a son, Thomas McClain, and a daughter, Channing.
EXAMINATION AND THESIS REPORT
Candidate: Donna Conner Ashmead
Major Field: E d u ca tio n
A Comparative Study of BSCS: Human Sciences Program and ExistingTitle of Thesis: Science Programs According to Achievement, Attitude, and Process
Skills in Selected Sixth-Grade Classrooms in Baton Rouge, LouisianaApproved:
Major Professor and Chairman
Dean of the Graduate School
EXAMINING COMMITTEE:
Date of Examination:
April 22, 1976