a comparative integrated geophysical study of horseshoe
TRANSCRIPT
Stephen F. Austin State University Stephen F. Austin State University
SFA ScholarWorks SFA ScholarWorks
Faculty Publications Department of Geology
1-2011
A Comparative Integrated Geophysical Study of Horseshoe A Comparative Integrated Geophysical Study of Horseshoe
Chimney Cave, Colorado Bend State Park, Texas Chimney Cave, Colorado Bend State Park, Texas
Wesley A. Brown College of Sciences and Mathematics, Department of Geology, Stephen F. Austin State University, [email protected]
Kevin W. Stafford College of Sciences and Mathematics, Department of Geology, Stephen F. Austin State University, [email protected]
Melinda G. Shaw-Faulkner College of Sciences and Mathematics, Department of Geology, Stephen F. Austin State University, [email protected]
Andy Grubbs Tejas Geo Services
Follow this and additional works at: https://scholarworks.sfasu.edu/geology
Part of the Geology Commons
Tell us how this article helped you.
Repository Citation Repository Citation Brown, Wesley A.; Stafford, Kevin W.; Shaw-Faulkner, Melinda G.; and Grubbs, Andy, "A Comparative Integrated Geophysical Study of Horseshoe Chimney Cave, Colorado Bend State Park, Texas" (2011). Faculty Publications. 6. https://scholarworks.sfasu.edu/geology/6
This Article is brought to you for free and open access by the Department of Geology at SFA ScholarWorks. It has been accepted for inclusion in Faculty Publications by an authorized administrator of SFA ScholarWorks. For more information, please contact [email protected].
9
International Journal of Speleology 40 (1) 9-16 Tampa, FL (USA) January 2011
INTRODUCTIONInvestigating subsurface voids has been done
traditionally by drilling boreholes which are costly, may damage the subsurface structure and produce information that is often inaccurate if extrapolated over wider areas. Geophysical techniques are non-invasive and in most cases may be used to accurately map shallow subsurface voids regardless of the challenges posed by the rugged nature of karst terrains.
The last few decades have seen an increase in the use of integrated geophysical methods in investigating subsurface voids, fractures and stability in karstic regions (Chamberlain, et al., 2000; Ho et al., 2000; Sumanovac & Weisser, 2001; Barbadello et al., 2002; Luecci, 2003; Luecci & De Giorgi, 2005; Elawadi et al., 2006; Lazzari et al., 2010). This manuscript reports results of an integrated geophysical survey undertaken in Colorado Bend State Park (CBSP) at a 50 m x 50 m square grid with the aim of evaluating the effectiveness of various geophysical tools in mapping
1 Department of Geology, Stephen F. Austin State University,
P.O. Box 13011, SFA Station, Nacogdoches, TX 75962-3011,
email: [email protected] 2 Department of Geology, Stephen F. Austin State University,
P.O. Box 13011, SFA Station, Nacogdoches, TX 75962-3011,
email: [email protected]; [email protected] 3 Tejas Geo Services, P.O. Box 208, San Marcos, TX 78667,
email: [email protected]
subsurface voids and collapsed structures in a karst environment. Geophysical techniques used included microgravity, ground penetrating radar (GPR), direct current (DC) resistivity, capacitively coupled (CC) resistivity, induced polarization (IP) and ground conductivity (GC) measurements. This combination of geophysical survey is unique to this study and provides a model for future scientists interested in non-invasive ways of exploring subsurface karstic features. This study focuses on an area located over a portion of Horseshoe Chimney Cave.
STUDY SITE
Colorado Bend State Park (CBSP) is located in San Saba and Lampasas Counties, Texas approximately 145 kilometers northwest of Austin, Texas (Figure 1). It covers an area of 21.56 square kilometers (Texas Parks and Wildlife Department, 2010) along a highly entrenched segment of the Colorado River immediately upstream of Lake Buchanan. CBSP opened in 1987 after the land, which formerly included Gorman and Lemons Ranches, was purchased by the State of Texas in 1984 and 1987. Annual precipitation averages 40-80 centimeters with an annual average high temperature of 29°C and an annual average low of 8°C (Texas Parks and Wildlife Department, 2010).
CBSP is dominated by outcrops of the lower Ordovician Ellenburger Group, including all three associated formations: Tanyard, Gorman and
Available online at www.ijs.speleo.it & scholarcommons.usf.edu/ijs/
International Journal of SpeleologyOfficial Journal of Union Internationale de Spéléologie
Wesley A. Brown1, Kevin W. Stafford2, Mindy Shaw-Faulkner2, Andy Grubbs3
Brown W.A., Stafford K.W., Shaw-Faulkner M., Grubbs A. 2011. A comparative integrated geophysical study of Horseshoe Chimney cave, Colorado Bend State Park, Texas. International Journal of Speleology, 40(1), 9-16. Tampa, FL (USA). ISSN 0392-6672. DOI: 10.5038/1827-806X.40.1.2
An integrated geophysical study was performed over a known cave in Colorado Bend State Park (CBSP), Texas, where shallow karst features are common within the Ellenberger Limestone. Geophysical survey such as microgravity, ground penetrating radar (GPR), direct current (DC) resistivity, capacitively coupled (CC) resistivity, induced polarization (IP) and ground conductivity (GC) measurements were performed in an effort to distinguish which geophysical method worked most effectively and efficiently in detecting the presence of subsurface voids, caves and collapsed features. Horseshoe Chimney Cave (HCC), which is part of a larger network of cave systems, provides a good control environment for this research. A 50 x 50 meter grid, with 5 m spaced traverses was positioned around the entrance to HCC. Geophysical techniques listed above were used to collect geophysical data which were processed with the aid of commercial software packages. A traditional cave survey was conducted after geophysical data collection, to avoid any bias in initial data collection. The survey of the cave also provided ground truthing. Results indicate the microgravity followed by CC resistivity techniques worked most efficiently and were most cost effective, while the other methods showed varying levels of effectiveness.Keywords: microgravity, GPR, resistivity, ground conductivity, speleogenesis, karst
Abstract:
Received 6 July 2010; Revised 23 August 2010; Accepted 24 September 2010
A comparative integrated geophysical study of Horseshoe Chimney Cave, Colorado Bend State Park, Texas

10
Honeycut (Barnes & Cloud, 1945). The Ellenburger Group represents peritidal carbonate shelf deposits that formed as fan delta, restricted shelf, tidal flat and open shelf facies (Kerans, 1990). Carbonate facies are primarily ooid grainstones, peloid wackestones and mudstones, much of which have been extensively dolomitized. Minimal faulting has been documented within the CBSP region, but regions of intense jointing are common throughout the park. Bedding is near horizontal throughout the region with minor tilting locally, generally resulting from local subsidence as a result of karst processes.
Cave and karst development is extensive throughout CBSP, with more than 200 individual karst features currently identified, including many active springs. Ellenburger karst development has a complicated speleogenetic history within the study area, including multiple phases of overprinting. Early, eogenetic karst development likely exists due to subaerial exposure of the Ellenburger strata in the middle Ordovician as proposed by Kerans (1990). More recently, strata within the study area have experienced hypogene speleogenesis as indicated by geomorphic features observed in individual caves as well as extensive deposits of secondary calcite spar filling many large-scale vugs and some smaller cavernous porosity (DeLeon & Stafford, 2010). Hypogene speleogenesis was likely driven by the potentiometric low of the Colorado River as it entrenched into its current location. Extensive epigene speleogenesis has overprinted hypogene karst development and has formed integrated drainage networks that are hydrologically active today. Current research in the area is attempting to unravel some of the complexities of the speleogenetic evolution of the CBSP region.
This study focuses on a portion of Horseshoe Chimney Cave, which is part of the Gorman Creek Crevice Cave System with more than 1500 meters of passage currently surveyed and a total depth exceeding 35 meters. The cave system consists of
vertical, shaft entrances developed along fractures that are connected to low bedding plane conduits that meander along the local dip, all developed within the Gorman Formation (Groat, 1976). The cave is primarily epigene in origin with minor sections that appear to incorporate older segments of hypogene origin.
Horseshoe Chimney Cave is characterized by a vertical entrance approximately 8 meters deep along a dominant northeast / southwest joint that connects to a low, bedding plane conduit averaging 1.5 meters wide and 1 meter tall. The Horseshoe Chimney Cave entrance is the southern most known extension of the Gorman Creek Crevice Cave System. The geophysical analyses included within this study are over a segment of Horseshoe Chimney Cave that includes the cave entrance. The survey grid was established without prior knowledge of the location of underlying cave passages in order to reduce human bias in placement of the survey grid in order to test the effectiveness of various geophysical tools in the characterization of subsurface void development within the Ellenburger Group of central Texas.
MICROGRAVITY PROSPECTING
Gravimetry is a geophysical technique that measures and quantifies subtle changes in gravity pull. These changes, termed “anomalies” are the result of changes in density or mass of the materials being studied. The units are expressed as units of acceleration of gravity (1 Gal = 980 cm/sec2). Microgravity prospecting is performed primarily to locate underground cavities and solve various problems of engineering geology. The anomalies resulting from microgravity studies are usually minute, a few tenths of 1 mGal, and therefore require a very high level of accuracy and competence during the data acquisition and processing. Detailed measurements of high accuracy can indicate cavities, provided the size of the cavity is large enough to produce gravity contrast significantly stronger than the background gravity signal.
Microgravity data were collected using a Lacoste & Romberg Model G Gravimeter. The instrument’s accuracy has been quoted at 0.005 mGal. Gravity readings were taken over the 2500 m2 study area with gravity stations evenly spaced 5 m apart along NW-SE profiles. A base station was setup within the study grid for convenience and quality control and a total of 110 readings taken over a two day period. Base station readings were taken after every 10 readings or 2 hrs (whichever came first) in order to monitor drift behavior. The study location is quite remote, so there was very little chance of environmental noise created by human activity. Weather conditions were calm and favorable, so temporal variations caused by disturbance from wind or tree roots did not affect final results.
Station locations were recorded using a Trimble Pro-XR model, differential GPS unit. All stations in the grid were mapped using 60 - 90 second minimum time observations. A connection to a differential beacon station was used to provide real
Wesley A. Brown, Kevin W. Stafford, Mindy Shaw-Faulkner, and Andy Grubbs
Fig. 1. Location of study area showing locations of survey grids.
International Journal of Speleology, 40 (1), 9-16. Tampa, FL (USA). January 2011
11
GROUND PENETRATING RADAR SURVEYGround Penetrating Radar is a high resolution
geophysical technique that uses electromagnetic (EM) waves in frequencies ranging from 50 to 2000 MHz to locate shallow structures and geological features (Davis & Annan, 1989; Annan, 1992). GPR profiling was conducted using a Pulse EKKO 100 system manufactured by Sensors and Software Inc. Data acquisition parameters were: antenna center frequency 100 MHz; step mode; 64 samples per scan; 400 ns time window; antenna separation 1 m; and 0.25 m trace spacing. The common offset technique was used where the pair of transmitter and receiver antennae separated by 1 m was advanced simultaneously along the profile. The survey was carried out over the 50 x 50 m grid along profiles spaced 10 m apart.
GPR data were processed using EKKO_View Deluxe software, version 2 (Sensors & Software, 2003). The processing flow consisted of filtering (Dewow), automatic gain control (AGC) application (window width 1.5 and maximum gain 500) and time to depth conversion. The velocity used to convert time to depth was 0.104 m/ns obtained from hyperbola velocity calibration tool built into the software.
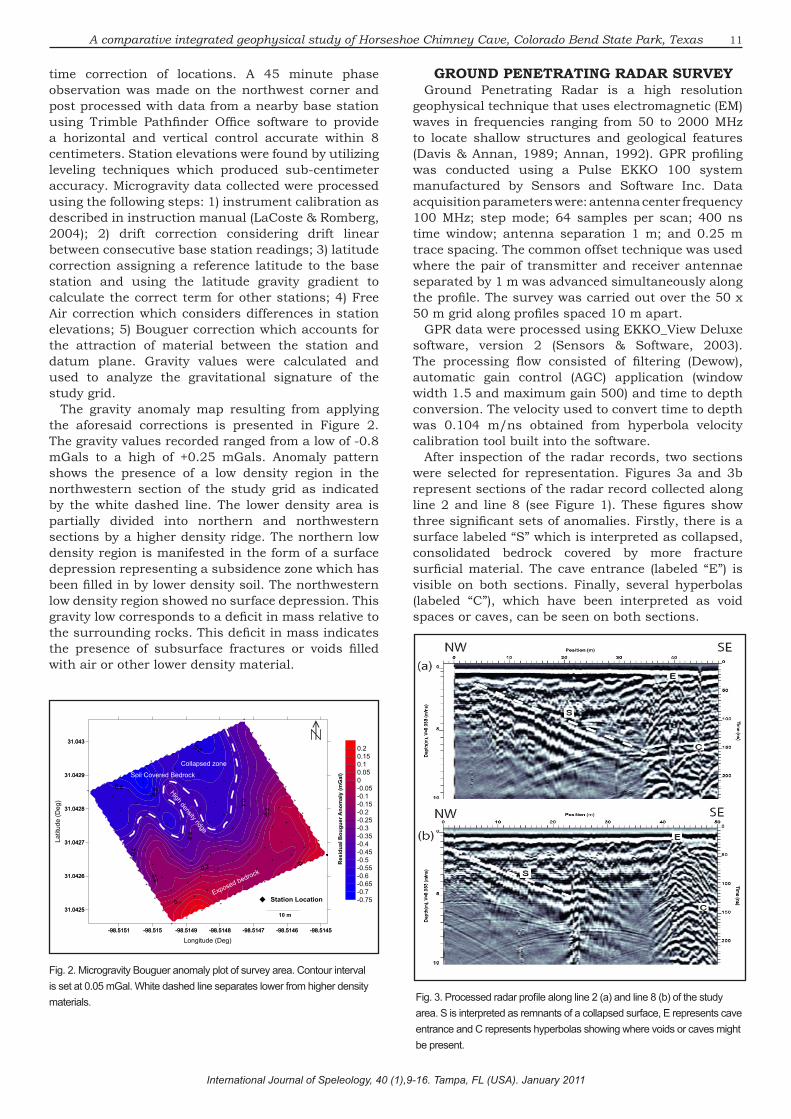
After inspection of the radar records, two sections were selected for representation. Figures 3a and 3b represent sections of the radar record collected along line 2 and line 8 (see Figure 1). These figures show three significant sets of anomalies. Firstly, there is a surface labeled “S” which is interpreted as collapsed, consolidated bedrock covered by more fracture surficial material. The cave entrance (labeled “E”) is visible on both sections. Finally, several hyperbolas (labeled “C”), which have been interpreted as void spaces or caves, can be seen on both sections.
A comparative integrated geophysical study of Horseshoe Chimney Cave, Colorado Bend State Park, Texas
time correction of locations. A 45 minute phase observation was made on the northwest corner and post processed with data from a nearby base station using Trimble Pathfinder Office software to provide a horizontal and vertical control accurate within 8 centimeters. Station elevations were found by utilizing leveling techniques which produced sub-centimeter accuracy. Microgravity data collected were processed using the following steps: 1) instrument calibration as described in instruction manual (LaCoste & Romberg, 2004); 2) drift correction considering drift linear between consecutive base station readings; 3) latitude correction assigning a reference latitude to the base station and using the latitude gravity gradient to calculate the correct term for other stations; 4) Free Air correction which considers differences in station elevations; 5) Bouguer correction which accounts for the attraction of material between the station and datum plane. Gravity values were calculated and used to analyze the gravitational signature of the study grid.
The gravity anomaly map resulting from applying the aforesaid corrections is presented in Figure 2. The gravity values recorded ranged from a low of -0.8 mGals to a high of +0.25 mGals. Anomaly pattern shows the presence of a low density region in the northwestern section of the study grid as indicated by the white dashed line. The lower density area is partially divided into northern and northwestern sections by a higher density ridge. The northern low density region is manifested in the form of a surface depression representing a subsidence zone which has been filled in by lower density soil. The northwestern low density region showed no surface depression. This gravity low corresponds to a deficit in mass relative to the surrounding rocks. This deficit in mass indicates the presence of subsurface fractures or voids filled with air or other lower density material.
-98.5151 -98.515 -98.5149 -98.5148 -98.5147 -98.5146 -98.5145
31.0425
31.0426
31.0427
31.0428
31.0429
31.043
-0.75-0.7-0.65-0.6-0.55-0.5-0.45-0.4-0.35-0.3-0.25-0.2-0.15-0.1-0.0500.050.10.150.2
10 m
-98.5151 -98.515 -98.5149 -98.5148 -98.5147 -98.5146 -98.5145
Longitude (Deg)
31.0425
31.0426
31.0427
31.0428
31.0429
31.043
Latit
ude
(Deg
)
Station Location
Res
idua
l Bou
guer
Ano
mal
y (m
Gal
)
Exposed bedrock
Soil Covered Bedrock
High density ridge
Collapsed zone
Fig. 2. Microgravity Bouguer anomaly plot of survey area. Contour interval is set at 0.05 mGal. White dashed line separates lower from higher density materials.
Fig. 3. Processed radar profile along line 2 (a) and line 8 (b) of the study area. S is interpreted as remnants of a collapsed surface, E represents cave entrance and C represents hyperbolas showing where voids or caves might be present.
International Journal of Speleology, 40 (1),9-16. Tampa, FL (USA). January 2011
12
ELECTRICAL RESISTIVITY AND INDUCED POLARIZATION TOMOGRAPHY
Two different types of resistivity techniques were performed over the study grid. First, conventional resistivity survey was carried out using a MiniRes resistivity meter produced by L and R Instruments Inc. In conventional resistivity surveys, four electrodes are inserted into the ground by connecting a DC power source to two of the electrodes. Voltage is then measured at the remaining two electrodes, and the resistance calculated by Ohm’s Law (Edwards, 1977). Resistivity measurements vary as a function of electrode spacing and array of electrodes, so measurements are normalized by a geometric correction factor that converts the values to resistivity (Geometrics, 1999). Data acquisition parameters for the conventional resistivity survey were: Wenner array horizontal profiling, an “a” spacing of 5 m, and all electrodes were advanced 5 m after each reading. Apparent resistivity (ρa) values were calculated for each spacing using ρa= 2πa ΔV/I, where ΔV is the potential difference, I is the applied current and 2πa is the geometric factor (Mussett & Khan, 2000). Data was gridded and contoured using the kriging method of Golden Surfer® software.
The second set of resistivity readings was recorded using an OhmMapper TR1 resistivity system produced by Geometrics, Inc. The OhmMapper instrument is a capacitively coupled resistivity system that uses dipole-dipole array to measure electrical properties of the ground without the use of galvanic electrodes used in traditional resistivity surveys (Geometrics Inc., 1999). The dipole-dipole array is very sensitive to horizontal changes in resistivity but relatively insensitive to vertical changes, meaning that it is good in mapping vertical structures but relatively poor in mapping horizontal structures (Loke, 2001). For this experiment, the coaxial-cable array with transmitter and receiver sections was manually pulled along the ground covering the study area. The dipole length was kept constant at 2.5 meters throughout the experiment while transmitter receiver lengths were varied at 2.5 m, 5 m, and 10 m. The depth of investigation is the depth at which 50% of the total response originates from above and 50% from below (Edwards, 1977).
The CC data were processed using EarthImager 2D Resistivity and IP Inversion Software (Advanced Geosciences Inc., 2007). EarthImager 2D is a post-acquisition Resistivity and IP Inversion software which imports and processes data files. The smooth model iterative inversion technique was selected for optimization.
In addition to collecting electrical resistivity readings, the MiniRes is designed to also record Induced Polarization (IP) data. This additional data was collected with only a few additional moments of field time at each resistivity observation setup. Induced polarization is a current stimulated electrical phenomenon observed as a delayed voltage response in earth minerals (Sharma, 1997). Membrane IP may be associated with the presence of clay minerals within pore channels, such as impure sandstone or
limestone (Reynolds, 1997). The MiniRes employs the phase shift method of measuring IP, where an alternating current is injected into the ground through the current electrode. If there is no Induced Polarization, the signal received at the potential electrode is in perfect phase with the injected signal. However, the more Induced Polarization in the earth, the more the received signal is out of phase with the injected signal (Telford et al., 1990).
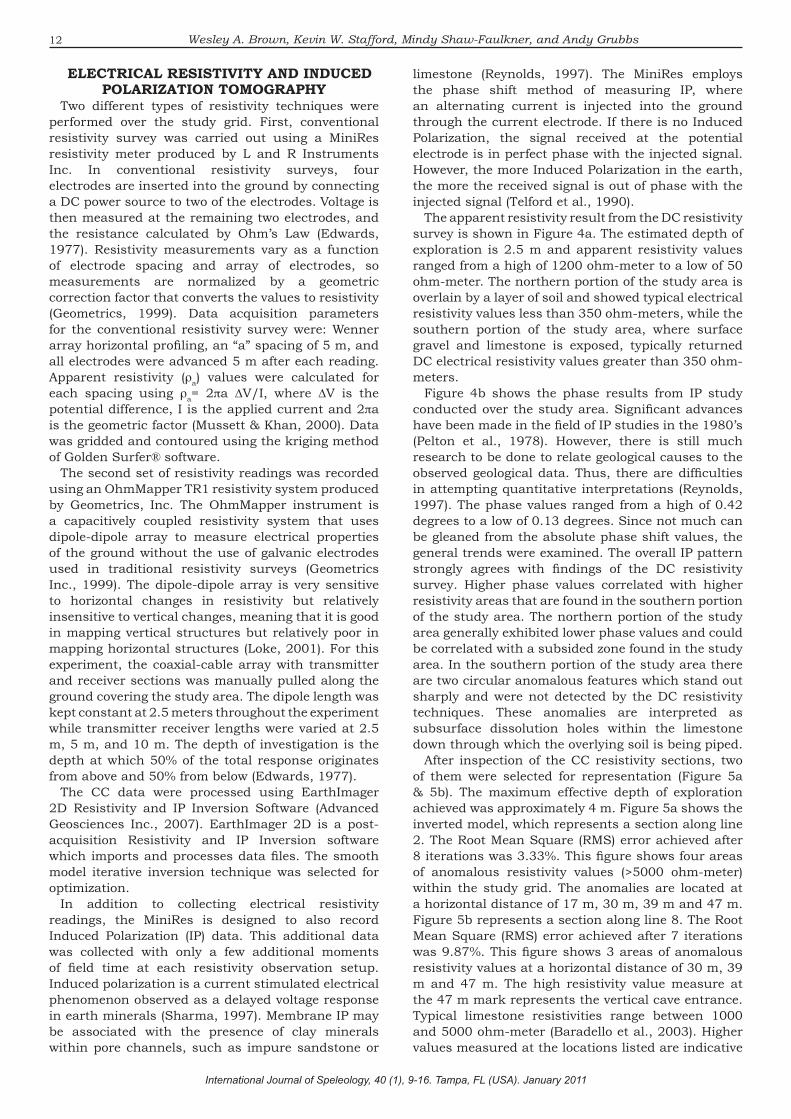
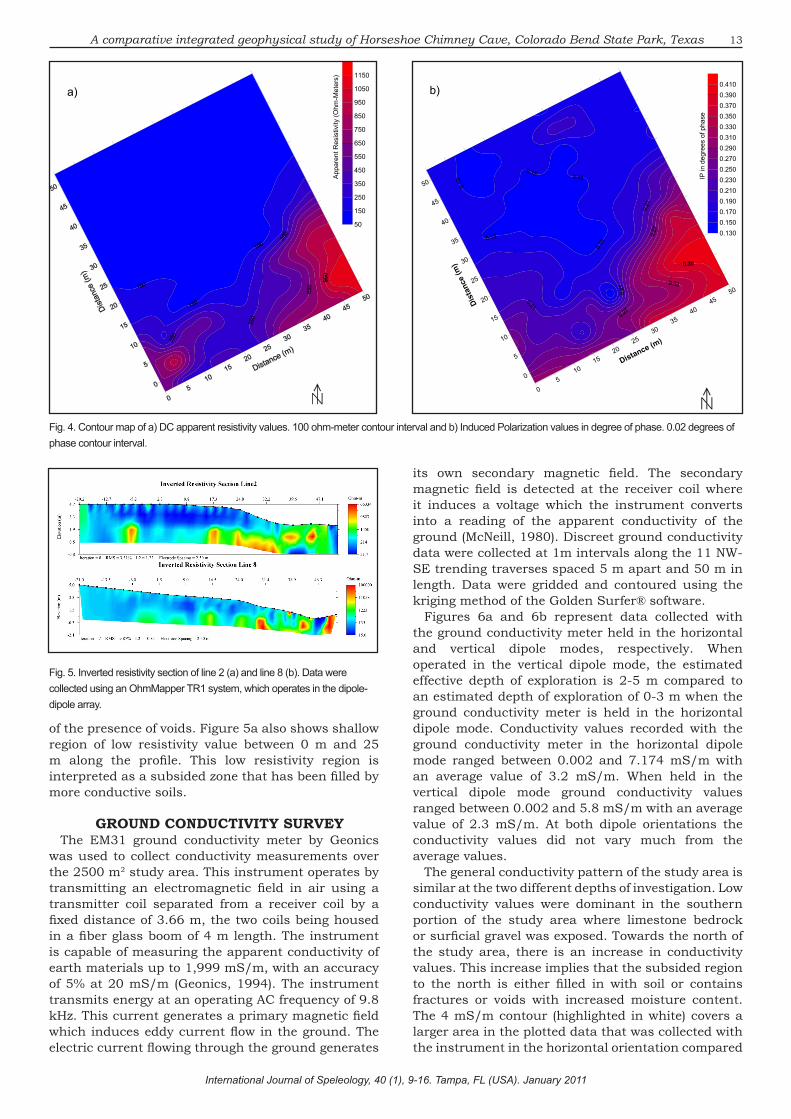
The apparent resistivity result from the DC resistivity survey is shown in Figure 4a. The estimated depth of exploration is 2.5 m and apparent resistivity values ranged from a high of 1200 ohm-meter to a low of 50 ohm-meter. The northern portion of the study area is overlain by a layer of soil and showed typical electrical resistivity values less than 350 ohm-meters, while the southern portion of the study area, where surface gravel and limestone is exposed, typically returned DC electrical resistivity values greater than 350 ohm-meters.
Figure 4b shows the phase results from IP study conducted over the study area. Significant advances have been made in the field of IP studies in the 1980’s (Pelton et al., 1978). However, there is still much research to be done to relate geological causes to the observed geological data. Thus, there are difficulties in attempting quantitative interpretations (Reynolds, 1997). The phase values ranged from a high of 0.42 degrees to a low of 0.13 degrees. Since not much can be gleaned from the absolute phase shift values, the general trends were examined. The overall IP pattern strongly agrees with findings of the DC resistivity survey. Higher phase values correlated with higher resistivity areas that are found in the southern portion of the study area. The northern portion of the study area generally exhibited lower phase values and could be correlated with a subsided zone found in the study area. In the southern portion of the study area there are two circular anomalous features which stand out sharply and were not detected by the DC resistivity techniques. These anomalies are interpreted as subsurface dissolution holes within the limestone down through which the overlying soil is being piped.
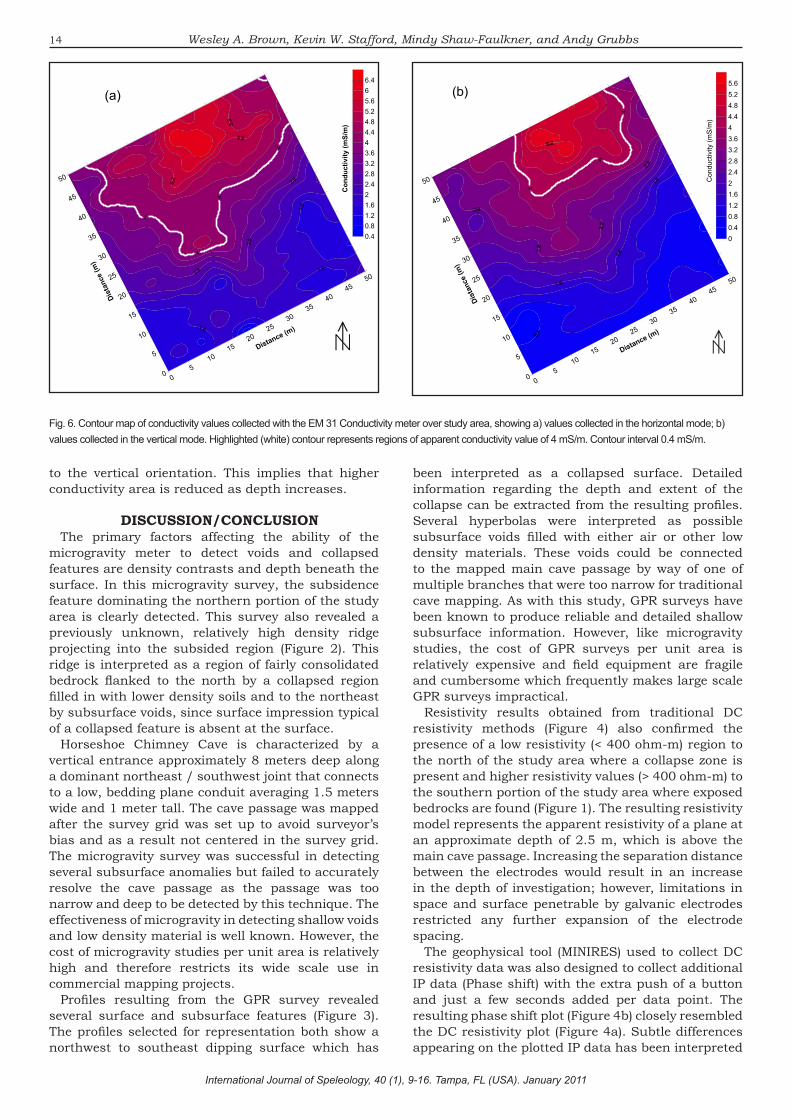
After inspection of the CC resistivity sections, two of them were selected for representation (Figure 5a & 5b). The maximum effective depth of exploration achieved was approximately 4 m. Figure 5a shows the inverted model, which represents a section along line 2. The Root Mean Square (RMS) error achieved after 8 iterations was 3.33%. This figure shows four areas of anomalous resistivity values (>5000 ohm-meter) within the study grid. The anomalies are located at a horizontal distance of 17 m, 30 m, 39 m and 47 m. Figure 5b represents a section along line 8. The Root Mean Square (RMS) error achieved after 7 iterations was 9.87%. This figure shows 3 areas of anomalous resistivity values at a horizontal distance of 30 m, 39 m and 47 m. The high resistivity value measure at the 47 m mark represents the vertical cave entrance. Typical limestone resistivities range between 1000 and 5000 ohm-meter (Baradello et al., 2003). Higher values measured at the locations listed are indicative
Wesley A. Brown, Kevin W. Stafford, Mindy Shaw-Faulkner, and Andy Grubbs
International Journal of Speleology, 40 (1), 9-16. Tampa, FL (USA). January 2011
13
of the presence of voids. Figure 5a also shows shallow region of low resistivity value between 0 m and 25 m along the profile. This low resistivity region is interpreted as a subsided zone that has been filled by more conductive soils.
GROUND CONDUCTIVITY SURVEYThe EM31 ground conductivity meter by Geonics
was used to collect conductivity measurements over the 2500 m2 study area. This instrument operates by transmitting an electromagnetic field in air using a transmitter coil separated from a receiver coil by a fixed distance of 3.66 m, the two coils being housed in a fiber glass boom of 4 m length. The instrument is capable of measuring the apparent conductivity of earth materials up to 1,999 mS/m, with an accuracy of 5% at 20 mS/m (Geonics, 1994). The instrument transmits energy at an operating AC frequency of 9.8 kHz. This current generates a primary magnetic field which induces eddy current flow in the ground. The electric current flowing through the ground generates
its own secondary magnetic field. The secondary magnetic field is detected at the receiver coil where it induces a voltage which the instrument converts into a reading of the apparent conductivity of the ground (McNeill, 1980). Discreet ground conductivity data were collected at 1m intervals along the 11 NW-SE trending traverses spaced 5 m apart and 50 m in length. Data were gridded and contoured using the kriging method of the Golden Surfer® software.
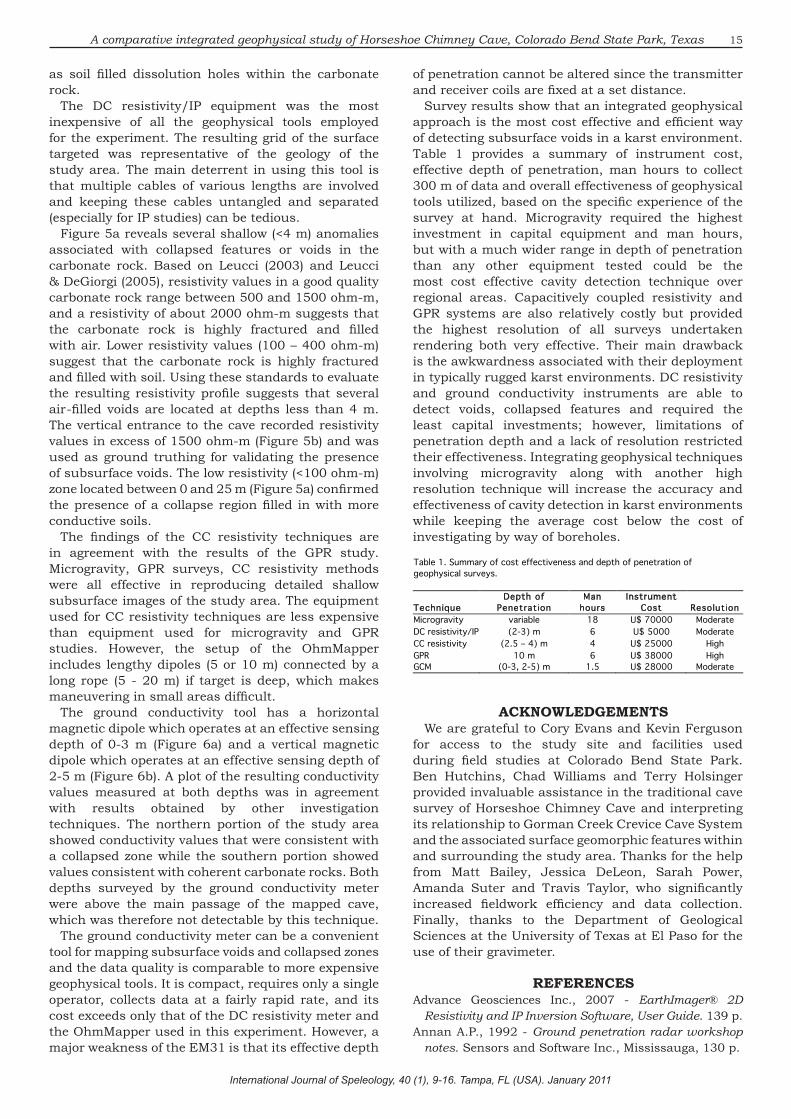
Figures 6a and 6b represent data collected with the ground conductivity meter held in the horizontal and vertical dipole modes, respectively. When operated in the vertical dipole mode, the estimated effective depth of exploration is 2-5 m compared to an estimated depth of exploration of 0-3 m when the ground conductivity meter is held in the horizontal dipole mode. Conductivity values recorded with the ground conductivity meter in the horizontal dipole mode ranged between 0.002 and 7.174 mS/m with an average value of 3.2 mS/m. When held in the vertical dipole mode ground conductivity values ranged between 0.002 and 5.8 mS/m with an average value of 2.3 mS/m. At both dipole orientations the conductivity values did not vary much from the average values.
The general conductivity pattern of the study area is similar at the two different depths of investigation. Low conductivity values were dominant in the southern portion of the study area where limestone bedrock or surficial gravel was exposed. Towards the north of the study area, there is an increase in conductivity values. This increase implies that the subsided region to the north is either filled in with soil or contains fractures or voids with increased moisture content. The 4 mS/m contour (highlighted in white) covers a larger area in the plotted data that was collected with the instrument in the horizontal orientation compared
A comparative integrated geophysical study of Horseshoe Chimney Cave, Colorado Bend State Park, Texas
Fig. 4. Contour map of a) DC apparent resistivity values. 100 ohm-meter contour interval and b) Induced Polarization values in degree of phase. 0.02 degrees of phase contour interval.
Fig. 5. Inverted resistivity section of line 2 (a) and line 8 (b). Data were collected using an OhmMapper TR1 system, which operates in the dipole-dipole array.
50
150
250
350
450
550
650
750
850
950
1050
1150
App
aren
t Res
istiv
ity (O
hm-M
eter
s)
a)
05
1015
2025
3035
4045
50
Distance (m)
0
5
10
15
20
25
30
35
40
45
50
Dist
ance
(m)
0.1300.1500.1700.1900.2100.2300.2500.2700.2900.3100.3300.3500.3700.3900.410
IP in
deg
rees
of p
hase
b)
International Journal of Speleology, 40 (1), 9-16. Tampa, FL (USA). January 2011
14
to the vertical orientation. This implies that higher conductivity area is reduced as depth increases.
DISCUSSION/CONCLUSIONThe primary factors affecting the ability of the
microgravity meter to detect voids and collapsed features are density contrasts and depth beneath the surface. In this microgravity survey, the subsidence feature dominating the northern portion of the study area is clearly detected. This survey also revealed a previously unknown, relatively high density ridge projecting into the subsided region (Figure 2). This ridge is interpreted as a region of fairly consolidated bedrock flanked to the north by a collapsed region filled in with lower density soils and to the northeast by subsurface voids, since surface impression typical of a collapsed feature is absent at the surface.
Horseshoe Chimney Cave is characterized by a vertical entrance approximately 8 meters deep along a dominant northeast / southwest joint that connects to a low, bedding plane conduit averaging 1.5 meters wide and 1 meter tall. The cave passage was mapped after the survey grid was set up to avoid surveyor’s bias and as a result not centered in the survey grid. The microgravity survey was successful in detecting several subsurface anomalies but failed to accurately resolve the cave passage as the passage was too narrow and deep to be detected by this technique. The effectiveness of microgravity in detecting shallow voids and low density material is well known. However, the cost of microgravity studies per unit area is relatively high and therefore restricts its wide scale use in commercial mapping projects.
Profiles resulting from the GPR survey revealed several surface and subsurface features (Figure 3). The profiles selected for representation both show a northwest to southeast dipping surface which has
been interpreted as a collapsed surface. Detailed information regarding the depth and extent of the collapse can be extracted from the resulting profiles. Several hyperbolas were interpreted as possible subsurface voids filled with either air or other low density materials. These voids could be connected to the mapped main cave passage by way of one of multiple branches that were too narrow for traditional cave mapping. As with this study, GPR surveys have been known to produce reliable and detailed shallow subsurface information. However, like microgravity studies, the cost of GPR surveys per unit area is relatively expensive and field equipment are fragile and cumbersome which frequently makes large scale GPR surveys impractical.
Resistivity results obtained from traditional DC resistivity methods (Figure 4) also confirmed the presence of a low resistivity (< 400 ohm-m) region to the north of the study area where a collapse zone is present and higher resistivity values (> 400 ohm-m) to the southern portion of the study area where exposed bedrocks are found (Figure 1). The resulting resistivity model represents the apparent resistivity of a plane at an approximate depth of 2.5 m, which is above the main cave passage. Increasing the separation distance between the electrodes would result in an increase in the depth of investigation; however, limitations in space and surface penetrable by galvanic electrodes restricted any further expansion of the electrode spacing.
The geophysical tool (MINIRES) used to collect DC resistivity data was also designed to collect additional IP data (Phase shift) with the extra push of a button and just a few seconds added per data point. The resulting phase shift plot (Figure 4b) closely resembled the DC resistivity plot (Figure 4a). Subtle differences appearing on the plotted IP data has been interpreted
Wesley A. Brown, Kevin W. Stafford, Mindy Shaw-Faulkner, and Andy Grubbs
Fig. 6. Contour map of conductivity values collected with the EM 31 Conductivity meter over study area, showing a) values collected in the horizontal mode; b) values collected in the vertical mode. Highlighted (white) contour represents regions of apparent conductivity value of 4 mS/m. Contour interval 0.4 mS/m.
05
1015
2025
3035
4045
50
Distance (m)
0
5
10
15
20
25
30
35
40
45
50
Dist
ance
(m)
0.40.81.21.622.42.83.23.644.44.85.25.666.4
Con
duct
ivity
(mS/
m)
(a)
0
510
1520
2530
3540
4550
Distance (m)
0
5
10
15
20
25
30
35
40
45
50
Dist
ance
(m)
00.40.81.21.622.42.83.23.644.44.85.25.6
Con
duct
ivity
(mS
/m)
(b)
International Journal of Speleology, 40 (1), 9-16. Tampa, FL (USA). January 2011
15
as soil filled dissolution holes within the carbonate rock.
The DC resistivity/IP equipment was the most inexpensive of all the geophysical tools employed for the experiment. The resulting grid of the surface targeted was representative of the geology of the study area. The main deterrent in using this tool is that multiple cables of various lengths are involved and keeping these cables untangled and separated (especially for IP studies) can be tedious.
Figure 5a reveals several shallow (<4 m) anomalies associated with collapsed features or voids in the carbonate rock. Based on Leucci (2003) and Leucci & DeGiorgi (2005), resistivity values in a good quality carbonate rock range between 500 and 1500 ohm-m, and a resistivity of about 2000 ohm-m suggests that the carbonate rock is highly fractured and filled with air. Lower resistivity values (100 – 400 ohm-m) suggest that the carbonate rock is highly fractured and filled with soil. Using these standards to evaluate the resulting resistivity profile suggests that several air-filled voids are located at depths less than 4 m. The vertical entrance to the cave recorded resistivity values in excess of 1500 ohm-m (Figure 5b) and was used as ground truthing for validating the presence of subsurface voids. The low resistivity (<100 ohm-m) zone located between 0 and 25 m (Figure 5a) confirmed the presence of a collapse region filled in with more conductive soils.
The findings of the CC resistivity techniques are in agreement with the results of the GPR study. Microgravity, GPR surveys, CC resistivity methods were all effective in reproducing detailed shallow subsurface images of the study area. The equipment used for CC resistivity techniques are less expensive than equipment used for microgravity and GPR studies. However, the setup of the OhmMapper includes lengthy dipoles (5 or 10 m) connected by a long rope (5 - 20 m) if target is deep, which makes maneuvering in small areas difficult.
The ground conductivity tool has a horizontal magnetic dipole which operates at an effective sensing depth of 0-3 m (Figure 6a) and a vertical magnetic dipole which operates at an effective sensing depth of 2-5 m (Figure 6b). A plot of the resulting conductivity values measured at both depths was in agreement with results obtained by other investigation techniques. The northern portion of the study area showed conductivity values that were consistent with a collapsed zone while the southern portion showed values consistent with coherent carbonate rocks. Both depths surveyed by the ground conductivity meter were above the main passage of the mapped cave, which was therefore not detectable by this technique.
The ground conductivity meter can be a convenient tool for mapping subsurface voids and collapsed zones and the data quality is comparable to more expensive geophysical tools. It is compact, requires only a single operator, collects data at a fairly rapid rate, and its cost exceeds only that of the DC resistivity meter and the OhmMapper used in this experiment. However, a major weakness of the EM31 is that its effective depth
of penetration cannot be altered since the transmitter and receiver coils are fixed at a set distance.
Survey results show that an integrated geophysical approach is the most cost effective and efficient way of detecting subsurface voids in a karst environment. Table 1 provides a summary of instrument cost, effective depth of penetration, man hours to collect 300 m of data and overall effectiveness of geophysical tools utilized, based on the specific experience of the survey at hand. Microgravity required the highest investment in capital equipment and man hours, but with a much wider range in depth of penetration than any other equipment tested could be the most cost effective cavity detection technique over regional areas. Capacitively coupled resistivity and GPR systems are also relatively costly but provided the highest resolution of all surveys undertaken rendering both very effective. Their main drawback is the awkwardness associated with their deployment in typically rugged karst environments. DC resistivity and ground conductivity instruments are able to detect voids, collapsed features and required the least capital investments; however, limitations of penetration depth and a lack of resolution restricted their effectiveness. Integrating geophysical techniques involving microgravity along with another high resolution technique will increase the accuracy and effectiveness of cavity detection in karst environments while keeping the average cost below the cost of investigating by way of boreholes.
A comparative integrated geophysical study of Horseshoe Chimney Cave, Colorado Bend State Park, Texas
Table 1. Summary of cost effectiveness and depth of penetration of geophysical surveys.
Technique Depth of
Penetration Man
hours Instrument
Cost Resolution Microgravity variable 18 U$ 70000 Moderate DC resistivity/IP (2-3) m 6 U$ 5000 Moderate CC resistivity (2.5 – 4) m 4 U$ 25000 High GPR 10 m 6 U$ 38000 High GCM (0-3, 2-5) m 1.5 U$ 28000 Moderate
ACKNOWLEDGEMENTSWe are grateful to Cory Evans and Kevin Ferguson
for access to the study site and facilities used during field studies at Colorado Bend State Park. Ben Hutchins, Chad Williams and Terry Holsinger provided invaluable assistance in the traditional cave survey of Horseshoe Chimney Cave and interpreting its relationship to Gorman Creek Crevice Cave System and the associated surface geomorphic features within and surrounding the study area. Thanks for the help from Matt Bailey, Jessica DeLeon, Sarah Power, Amanda Suter and Travis Taylor, who significantly increased fieldwork efficiency and data collection. Finally, thanks to the Department of Geological Sciences at the University of Texas at El Paso for the use of their gravimeter.
REFERENCESAdvance Geosciences Inc., 2007 - EarthImager® 2D
Resistivity and IP Inversion Software, User Guide. 139 p.Annan A.P., 1992 - Ground penetration radar workshop
notes. Sensors and Software Inc., Mississauga, 130 p.
International Journal of Speleology, 40 (1), 9-16. Tampa, FL (USA). January 2011
16
Barbadello L., Bratus A., Yabar D.N., Paganini P. & Palmieri F., 2002 - Integrated geophysical methods to define hypogenous karstic features. Atti del Museo Civico di Storia Naturale di Trieste, 49: 15-21.
Barnes V.E. & Cloud P.E., 1945 - Representative Sections of the Ellenburger Group in Central Texas. Bureau of Economic Geology, University of Texas, Austin, Texas, 44 p.
Chamberlain T.A., Sellers W., Protector C. & Coard R., 2000 - Cave detection in limestone using ground penetrating radar. Journal of Archaeological Science, 27: 957-964.
Davis J.L. & Annan A.P., 1989 - Ground penetrating radar for high resolution mapping of oil and rock stratigraphy. Geophysical Prospecting, 37: 531-551.
DeLeon J.L. & Stafford K.W., 2010 - Speleogenesis of Ordovician carbonates proximal to the Colorado River near Colorado Bend State Park, Central Texas. Geological Society of America Abstracts with Programs, 42 (2): 98.
Edwards L.S., 1977 - A modified pseudosection for resistivity and induced-polarization. Geophysics, 42: 1020–1036.
Elawadi E., El-Qady G., Nigm A., Shaaban F. & Ushijima K., 2006. - Integrated Geophysical survey for site investigation at a dwelling area, Egypt. Journal of Environmental & Engineering Geophysics, 11: 249-259.
Geometrics, 1999 - OhmMapper TR1 Operation Manual. Geometrics Inc., San Jose, CA, 147 p.
Geonics, 1994 - Operating Manual. Mississauga, Ontario, Geonics Limited, 61 p.
Groat C.G., 1976 - Geologic Atlas of Texas: Brownwood Sheet. Bureau of Economic Geology, University of Texas, Austin, Texas, 1 sheet.
Ho C.S., Othman J., Ghazali S., & Kamaruzaman A.Z., 2000 - Integrated geophysical survey for detection of caves in limestone bedrock. Technical papers-Mineral and Geoscience Department Malaysia, 1: 43-61.
Kerans C., 1990 - Depositional systems and karst geology of the Ellenburger Group (Lower Ordovician), Subsurface West Texas. Bureau of Economic Geology, University of Texas, Austin, Texas, 63 p.
Lacoste & Rhomberg, 2004 - Instruction manual model G & D gravimeters. 127 p.
Lazzari M., Loperte A. & Perrone A., 2010 – Near surface geophysical techniques and geomorphological approach to reconstruct the hazard cave map in historical and urban areas. Advances in Geosciences, 24: 35-44.
Leucci G., 2003 - Evaluation of karstic cave stability using integrated geophysical methods. GeoActa, 2: 75-88.
Leucci G. & De Giorgi L., 2005 - Integrated geophysical surveys to assess the structural conditions of a karstic cave of archeological importance. Natural Hazards and Earth System Sciences, 5: 17-22.
Loke M.H., 2001 - Electrical imaging surveys for environmental and engineering studies: A practical guide to 2D and 3D surveys: RES2DINV Manual, IRIS Instruments, www.iris-instruments.com Geometrics, San Jose, CA.
McNeill J.D., 1980 - Application of transient electromagnetic techniques. Geonics limited Technical note TN-7.
Mussett A.E. & Khan M.A., 2000 - Looking into the earth: An introduction to geological geophysics. Cambridge University Press, 470 p.
Pelton W.H., Ward SH. Hallof P.G., Sill W.R. & Nelson P.H., 1978 - Mineral discrimination and removal of inductive coupling with multi-frequency induced polarization. Geophysics, 43(3): 588-609.
Reynolds JM., 1997 - An introduction to applied and environmental geophysics, John Wiley and Sons, 796 p.
Sensors & Softwares, 2003 - EKKO_View Enhanced and EKKO_View Deluxe, User Guide, 94 p.
Sumanovac F. & Weisser M., 2001 - Evaluation of resistivity and seismic methods for hydrogeologic mapping in karst terrains. Journal of Applied Geophysics, 33: 119-124.
Sharma P.V., 1997 - Environmental and engineering geophysics, Cambridge University Press, 475 p.
Telford W.M., Geldart L.P. & Sheriff R.E., 1990 - Applied Geophysics, 2nd ed., Cambridge University Press, 770 p.
Texas Parks & Wildlife Department, 2010 - Colorado Bend State Park, http://www.tpwd.state.tx.us/spdest/findadest/parks/colorado_bend/, accessed 5 June 2010.
International Journal of Speleology, 40 (1), 9-16. Tampa, FL (USA). January 2011
Wesley A. Brown, Kevin W. Stafford, Mindy Shaw-Faulkner, and Andy Grubbs