a comparative analysis of socially responsible investment
TRANSCRIPT

A Comparative Analysis of SociallyResponsible Investment (SRI) Funds:
How Sustainable Are SRI Funds?The Harvard community has made this
article openly available. Please share howthis access benefits you. Your story matters
Citable link http://nrs.harvard.edu/urn-3:HUL.InstRepos:37736804
Terms of Use This article was downloaded from Harvard University’s DASHrepository, and is made available under the terms and conditionsapplicable to Other Posted Material, as set forth at http://nrs.harvard.edu/urn-3:HUL.InstRepos:dash.current.terms-of-use#LAA
A Comparative Analysis of Socially Responsible Investment (SRI) Funds:
How Sustainable are SRI Funds?
Hilary Chidi
A Thesis in the Field of Sustainability
for the Degree of Master of Liberal Arts in Extension Studies
Harvard University
November 2017

Copyright 2017 Hilary Chidi
Abstract
Between 2012 and 2014, socially responsible investments (SRI) grew by 76%,
with over $6.5 trillion now being held in managed SRI assets (Schueth et al., 2014). This
remarkable growth accentuates the blossoming interest that retail investors in particular
are showing in investment products that not only seek economic returns but also adhere
to certain principles, such as aversion to particular industries or business practices (Berry,
2013).
While investment managers have readily approached this fast-growing segment of
the investment market, a persistent issue that plagues the industry is the lack of uniform
understanding of what truly defines a socially responsible investment. Furthermore, while
investment returns are easily measured, reported, and assessed, the sustainability profiles
of ostensibly responsible investments are rarely reviewed, assessed, or challenged by
third parties. It is therefore conceivable that investment managers responsible for
developing and managing SRI funds, for retail investors in particular, may veer toward
some investment products that do not correspond to their sustainability mandates in order
to achieve much-desired economic returns at the expense of non-economic factors. This
dire possibility would clearly entail some exploitation of the faith that investors place in
investment managers’ practices, and thus calls for further examination.
This research focused on determining whether the companies that constitute SRI
funds are generally sustainable relative to conventional funds, with the goal of answering
the fundamental question: Are SRI funds’ portfolio companies markedly more
sustainable than those in traditional funds? From this research question, a hypothesis was
developed and examined: Companies whose equity or debt is represented in SRI retail
funds do not have inherent sustainability characteristics that differ from those of the
companies in non-SRI funds.
A subordinate hypothesis this research also explored was that there is significant
overlap between the companies whose equities and debt are included in SRI funds and
those whose equities are included in non-SRI funds. Another perspective of this premise
is that SRI funds, in particular, typically include companies that do not rate highly as
sustainable enterprises at least as often as they include companies that do rate highly as
sustainable enterprises.
The research methodology focused on establishing two sample sets of mutual
funds: the first group comprising the 10 largest SRI mutual funds and the second group
comprising 10 conventional mutual funds of comparable sizes (in terms of assets under
management). A scorecard was then developed using commonly accepted measures of
corporate sustainability—such as adherence to GRI reporting frameworks, existence of
robust sustainability programs and governance structures, and activity in select industries.
The scores of the top 10 most significant holdings in each of the 20 funds were assessed
using the scorecard, and a comparison of the SRI group vs. the conventional group was
conducted.
The study conclusively determined that SRI mutual funds are not necessarily a
more effective solution for investors with socially responsible investing inclinations. The
traditional fund group scored higher (64.55) than the SRI group (61.39) on average.
Therefore, SRI fund holdings were not shown to be any more socially responsible than
holdings in traditional funds.
Ultimately, this research study determined that the top holdings in the SRI funds
did not materially possess sustainability attributes that differed from the traditional group.
This research study not only determined that socially responsible funds were somewhat
following their SRI mandates, but also introduced a framework for the assessment of
these funds from a sustainability perspective going forward.

vi
Acknowledgements
I owe Carlos Vargas a debt of gratitude for the guidance and feedback that he
provided as I deliberated, researched and wrote this paper. I am also very grateful for the
feedback that my classmates, professor and instructors in the thesis proseminar provided,
particularly as it was coupled with nudging and encouragement without which I may
have gone a less ambitious and fulfilling path. These classmates not only astounded me
with the breadth of their interests in the field of sustainability, but also with their sheer
intellectual curiosity and passion. I gained valuable insights on Sustainable Investing
from Edward Marks, who answered every question with a question, but managed to lead
me to meaningful insights every time.
Finally, I owe my wife, Dr. Arati Chidi, an unfathomable amount of gratitude.
She instinctively understood why this program was so important to me and never
questioned the passion nor the time dedicated to it. Had she been less understanding, I
would never have reached the thesis stage.
vii
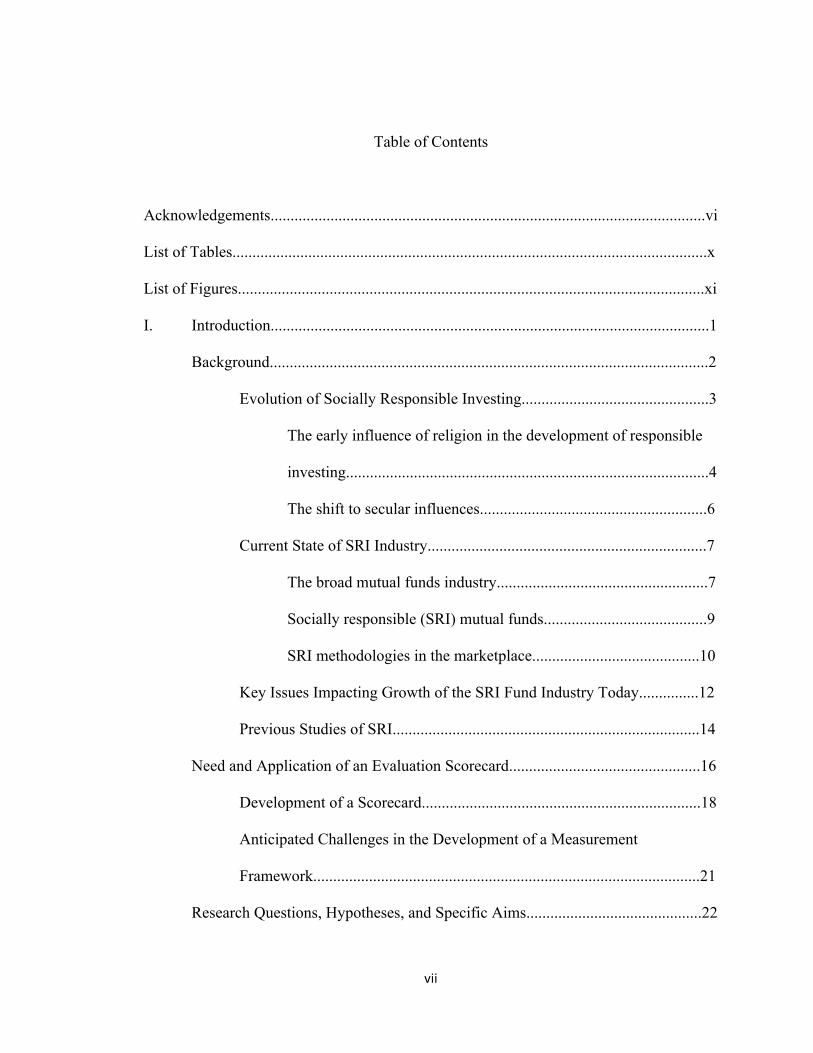
Table of Contents
Acknowledgements.............................................................................................................vi
List of Tables.......................................................................................................................x
List of Figures.....................................................................................................................xi
I. Introduction..............................................................................................................1
Background..............................................................................................................2
Evolution of Socially Responsible Investing...............................................3
The early influence of religion in the development of responsible
investing...........................................................................................4
The shift to secular influences.........................................................6
Current State of SRI Industry......................................................................7
The broad mutual funds industry.....................................................7
Socially responsible (SRI) mutual funds.........................................9
SRI methodologies in the marketplace..........................................10
Key Issues Impacting Growth of the SRI Fund Industry Today...............12
Previous Studies of SRI.............................................................................14
Need and Application of an Evaluation Scorecard................................................16
Development of a Scorecard......................................................................18
Anticipated Challenges in the Development of a Measurement
Framework.................................................................................................21
Research Questions, Hypotheses, and Specific Aims............................................22
viii
Specific Aims.............................................................................................23
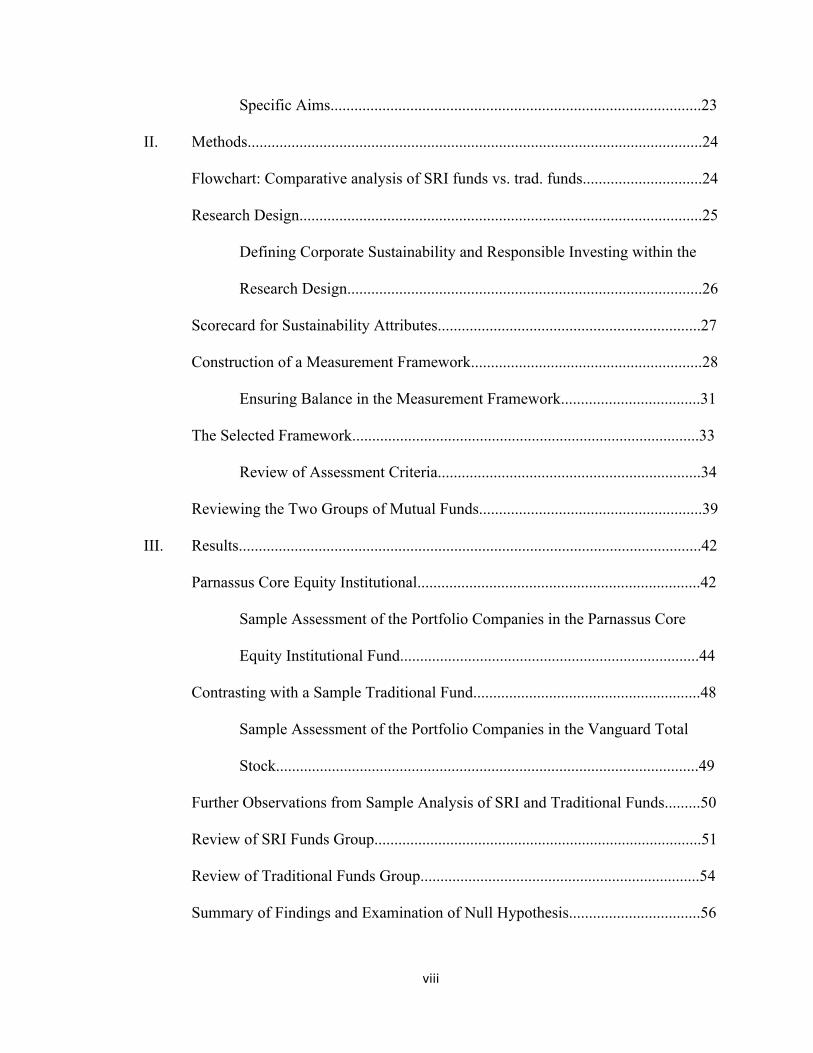
II. Methods..................................................................................................................24
Flowchart: Comparative analysis of SRI funds vs. trad. funds..............................24
Research Design.....................................................................................................25
Defining Corporate Sustainability and Responsible Investing within the
Research Design.........................................................................................26
Scorecard for Sustainability Attributes..................................................................27
Construction of a Measurement Framework..........................................................28
Ensuring Balance in the Measurement Framework...................................31
The Selected Framework.......................................................................................33
Review of Assessment Criteria..................................................................34
Reviewing the Two Groups of Mutual Funds........................................................39
III. Results....................................................................................................................42
Parnassus Core Equity Institutional.......................................................................42
Sample Assessment of the Portfolio Companies in the Parnassus Core
Equity Institutional Fund...........................................................................44
Contrasting with a Sample Traditional Fund.........................................................48
Sample Assessment of the Portfolio Companies in the Vanguard Total
Stock..........................................................................................................49
Further Observations from Sample Analysis of SRI and Traditional Funds.........50
Review of SRI Funds Group..................................................................................51
Review of Traditional Funds Group......................................................................54
Summary of Findings and Examination of Null Hypothesis.................................56
ix
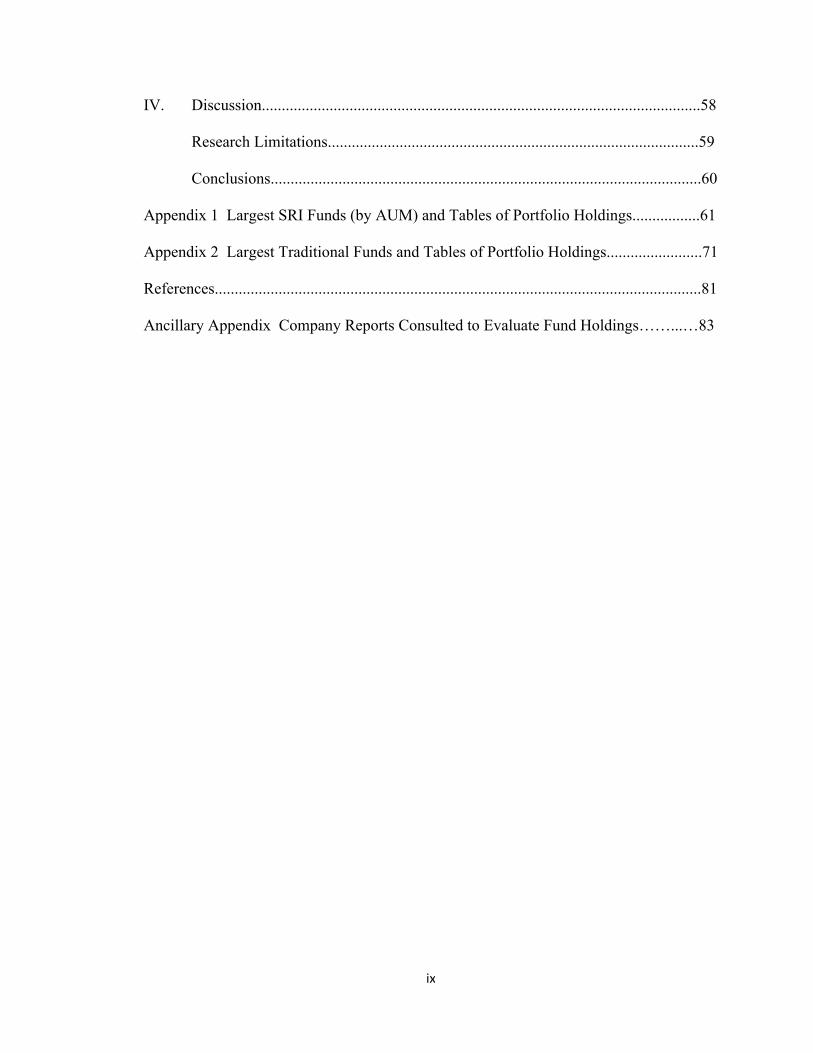
IV. Discussion..............................................................................................................58
Research Limitations.............................................................................................59
Conclusions............................................................................................................60
Appendix 1 Largest SRI Funds (by AUM) and Tables of Portfolio Holdings.................61
Appendix 2 Largest Traditional Funds and Tables of Portfolio Holdings........................71
References..........................................................................................................................81
Ancillary Appendix Company Reports Consulted to Evaluate Fund Holdings……...…83
x
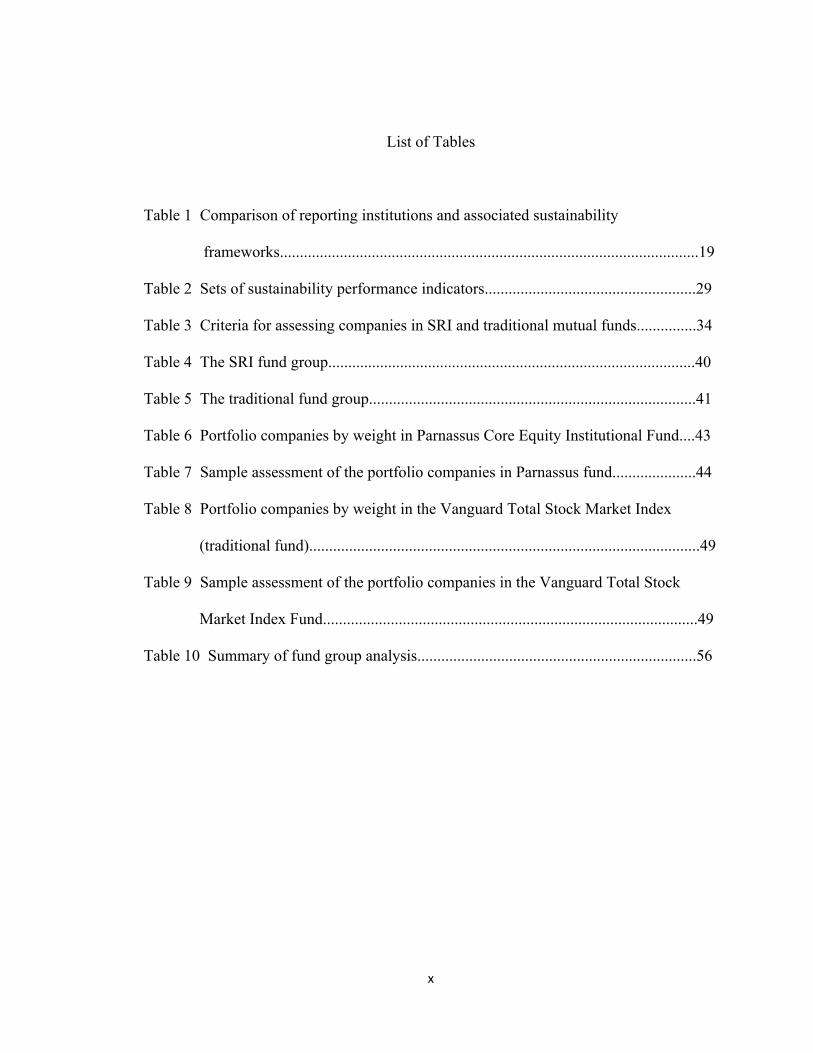
List of Tables
Table 1 Comparison of reporting institutions and associated sustainability
frameworks.........................................................................................................19
Table 2 Sets of sustainability performance indicators.....................................................29
Table 3 Criteria for assessing companies in SRI and traditional mutual funds...............34
Table 4 The SRI fund group............................................................................................40
Table 5 The traditional fund group..................................................................................41
Table 6 Portfolio companies by weight in Parnassus Core Equity Institutional Fund....43
Table 7 Sample assessment of the portfolio companies in Parnassus fund.....................44
Table 8 Portfolio companies by weight in the Vanguard Total Stock Market Index
(traditional fund)..................................................................................................49
Table 9 Sample assessment of the portfolio companies in the Vanguard Total Stock
Market Index Fund..............................................................................................49
Table 10 Summary of fund group analysis......................................................................56

xi
List of Figures
Figure 1 Flowchart: comparative analysis of SRI funds vs. traditional funds...............25
1
Chapter I
Introduction
Socially Responsible Investing (SRI) is neither new, nor is it a fringe concept.
The Forum for Sustainable and Responsible Investment estimates that there are $6.5
trillion in managed portfolios in the United States that follow strategies that would be
defined as SRI. The growth of these assets has been particularly noteworthy—SRI assets
grew by 76% between 2012 and 2014. This growth has been fueled by a number of
factors, such as increased awareness of climate change and corporate scandals as well as
sociological and demographic changes that have brought more women and millennials
into the investing landscape (Schuert, 2014). However, as more investors flock to socially
responsible investing, the lack of a standard definition is potentially problematic: Are
investors seeking socially responsible investing able to put their money where their hearts
are? How are retail funds being positioned to address the demand for socially responsible
investing? The lack of a standard definition even impacts how investors and fund
managers define the space and their perspectives. For instance, in previous years, the
term “Socially Responsible Investing” had come to represent the universe of investing
approaches that pertained to this space; however, in more recent years, “ESG” or
“Environmental, Social, and Governance” investing has become fairly commonplace in
investing discourse. Even though both terms are used somewhat interchangeably, some
investors and investment managers associate SRI more with the screening methodologies
that either exclude or include particular investments depending on the impact that the
2
portfolio companies have had in terms of environmental or social practices. ESG
investing, on the other hand, has pertained more specifically to an approach whereby
investment managers infuse ESG considerations into the general criteria by which they
assess entities and, based on these considerations, decide on how risky or attractive the
entities may be.
Within the fund industry, ESG and SRI investing are still generally regarded as
being part of the same broader socially responsible segment without very much
delineation from either fund managers or investors. Fund prospectuses invariably
describe the investing process, including comprehensive information on the
methodologies employed by the investment team. These managers almost always specify
a certain amount of flexibility in how they approach the market, beyond the primary
investment strategies that are advocated. This flexibility somewhat compounds the ability
to strictly define or understand how much some of the fund managers may have diverged
from their stated investment strategies. The naming of the funds also does not have to
reflect an SRI or ESG approach and may not be truly indicative of the degree to which
socially investing parameters are being followed (Lee, Humphrey, Benson, & Ahn,,
2010).
Given the general contiguity of the ESG and SRI terms in the mutual fund
investing universe, this thesis defined SRI to include ESG-related investing activities.
Research Significance and Objectives
A prevailing assumption made throughout this research was that the firms that
have been selected for SRI funds have gone through a screening process (whether
“positive” or “negative”) and thus should represent firms that hold attributes that qualify
3
them as being sustainable enterprises. Thus, the focus of this paper is to examine the
soundness of the selection process by which companies have been deemed appropriate to
be included in an SRI fund. This scrutiny is particularly apt given that the fundamental
premise that SRI funds generally advocate is that the companies they comprise are
intrinsically different from those that would otherwise be found in traditional (i.e., non-
SRI) funds. This paper fundamentally challenges that notion.
Background
There are significant challenges that persist for retail investors who are interested
in investing in SRI mutual funds. One critical challenge is the lack of a standard
definition of what actually constitutes Socially Responsible Investing (Smith, 2011),
which means that fund managers have perhaps too much latitude in how they construct,
manage, and market their funds. This thesis is focused on assessing whether SRI mutual
funds indeed constitute verifiably sustainable firms; however, in order to adequately
review the marketplace, it is important to assess and understand how the SRI marketplace
has advanced from its origins and how the motivations for investors in this space have
similarly evolved over time.
Evolution of Socially Responsible Investing
The Socially Responsible Investing approach is to invest in equities or debt
instruments from entities that follow or promote certain actions or eschew those which
participate in activities deemed objectionable, or to provide an additional set of
environmental, social, or governance considerations when assessing investment
4
opportunities. The consideration of non-economic factors in the assessment of investment
opportunities dates back to the dawn of commerce; however, even a cursory review of the
evolution of socially responsible investing reveals the inextricable links between
responsible investing approaches and religion (Schueth, 2014).
The early influence of religion in the development of responsible investing. In Judaic and
Islamic law, there are clear stipulations governing almost all forms of commerce,
particularly financial matters such as lending and credit transactions (Schueth, 2014). As
was common in other areas of early human endeavor, such as medicine, education, and
government, strict religious guidance was often the basis of early professional practices,
and finance was clearly no exception. For instance, Islamic law mandated alternatives to
the charging of interest on loans. This religious mandate duly spread as adherents of the
religion grew around the world and is now considered one of the foundational tenets of
Sharia-compliant finance. Indeed, Koranic guidelines actually provide a solid
interpretation that is fairly similar to modern understanding of socially responsible
finance:
In common parlance, Muslims' financial operations and interest-free banking qualify for defining the expression "Islamic finance." Technically, however, the definition goes beyond the common understanding.' It includes the avoidance of interest or usury, which is generally referred to and known as riba or "unjustified increase," and the avoidance of ambiguity, which is generally referred to and known as gharar or excessive "uncertainty, risk [or] speculation." Islamic finance also means to earn in a religiously permissible way (halal), "and more generally the quest for justice, and other ethical and religious goals. (Ibrahim, 2011)
Other religious influences in the development of responsible investing have
occurred through the centuries and in more recent years have become even more
5
pronounced in the financial markets as religious entities have engaged in direct investing
activities. Expectedly, religious organizations have focused on social issues which they
believe either have direct bearing on their congregations or may be of some concern to
their adherents. Examples of such social issues include slavery, women’s suffrage,
prohibition, child labor, and warfare.
In America, John Wesley, a founder of the Methodist movement in the 18th
century, was starkly opposed to the slave trade as well as “conspicuous consumption.”
These quasi-religious convictions invariably led to the Methodist movement’s continued
opposition to investments in “companies manufacturing liquor or tobacco products or
promoting gambling” (Berry, 2013, p 14). Even today, the United Methodist Church as
an institution has continued to adhere to its investing principles with regard to its own
portfolios—through the use of positive and negative screening, social impact analysis,
and even shareholder activism (Berry, 2013). Other religious entities in the United States,
including the Episcopal Church, the Church of Latter-Day Saints (Mormons), and various
Jewish groups, have also evolved comparable principles over the years. The Episcopal
Church, for instance, traditionally adheres to an interpretation of biblical guidelines on
investment and business practices (Schori, 2015). These principles still shape its
approach, and presently, it regularly releases audited financial reports that detail its
investment practices, which are now categorized based on three As: avoidance,
affirmative investment, and advocacy (Schori, 2015).
• Avoidance: Not investing in companies whose activities are contrary to our social
and moral values.
6
• Affirmative investing: Investing in institutions that can provide financial
resources to underserved communities.
• Advocacy: Voting proxies and activism that focus on constructively influencing
corporate behavior.
The shift to secular influences.Even as religious influence continued to play an important
role, responsible investing increasingly drew from secular influences in the 20th century,
particularly in the United States, with the advent of various progressive and civic
initiatives, such as women’s suffrage, the Civil Rights Movement, and the Vietnam War,
among other causes. For instance, as the movement against the Vietnam War peaked with
student protests and other acts of civil disobedience, a picture of a nine-year-old girl
aflame from napalm sparked significant indignation directed against Dow Chemical, a
major supplier to the U.S. Army, impacting its shares on the stock market (Berry, 2013).
During the 1960s and 1970s, businesses also became increasingly aware of the
dangers of being perceived as socially irresponsible—particularly by customers and by
investors—and many made more of a concerted effort to position themselves
appropriately; however, the challenges of doing so were fairly complex as social issues
continued to evolve. The 1970s and early to mid 1980s marked a heightened period of
social awareness that began to shift investing methodology remarkably (Berry, 2013).
Most importantly, this period marked a shift in the SRI industry from screening to avert
investments in “sin industries,” such as gaming and adult entertainment, to one focused
more broadly on social and geo-political matters, such as the screening of investments in
apartheid South Africa during the 1980s and early 1990s. This more expansive approach
7
can probably be considered to be the foundational antecedent of ESG investing as it
exists today.
Current State of SRI Industry
Since the 1980s, the SRI landscape has grown substantially, with approximately
11% of all professionally managed assets in the United States involved in SRI as of 2012
(Junkus, 2013). Even more notably, the growth rate of the SRI sphere has outstripped that
of the broader managed investments universe significantly, with over $6.5 trillion being
held in SRI-themed managed assets as of 2013, up from under $3 trillion in 2007
(Schueth, 2014). Most of these investments are held specifically in mutual funds.
Although mutual funds constitute only a part of the broader investing landscape, they
remain the primary vehicle through which most individual investors can access the SRI
market besides investing directly in companies that they may deem socially responsible.
Hence, the size and popularity of the mutual fund industry makes it an important focal
point to study and understand how investment managers are positioning socially
responsible investing opportunities to investors in the U.S.
The broad mutual funds industry. In essence, mutual funds are basically professionally
managed investment vehicles that are made up of diversified portfolios of securities such
as stocks, bonds, and money market instruments and are generally available to retail and
institutional investors for certain fees. These funds generally fall into one of two broad
categories—open-ended funds and closed-ended funds—with both being significant
components of the financial systems of most developed markets (and although there are
8
important technical attributes that make closed-ended funds also compelling in the
marketplace, the focus of this paper is strictly on the open-ended variety, which remains
the more prevalent of the two). The U.S. mutual fund industry can certainly be described
as being rather mature, as funds have been in existence in the country since the late 19th
century in various shapes, even as the regulations that govern the industry and the
regulatory bodies have evolved over the years. Within the United States, presently,
mutual funds are registered with and regulated by the Securities and Exchange
Commission. Overall, the popularity and utility of this investment vehicle has continued
to grow significantly over the years as investors have continued to be attracted by the
diversification opportunities offered as well as the liquidity that the fund markets provide;
by 2010, approximately 45% of households held investments in mutual funds (Barreda-
Tarrazona., Matallín-Sáez, & Balaguer-Franch, 2011).
The vast majority of such retail investors access mutual funds through employer-
sponsored retirement plans or through the use of financial advisors. Increasingly, many
investors are also directly buying and trading mutual funds independently using online
trading solutions. The substantial role that mutual funds play in most markets continues
to be a focal point of myriad academic research endeavors.
With the growth of the mutual fund industry, one opportunity that has risen for
fund managers has been the opportunity to serve particular niches or categories of the
fund market. Much of this fund specialization has been focused on particular
subcategories of asset classes, such as global equities, domestic equities, and emerging
market bonds; however, socially responsible investing has also become an important
niche that is inclusive of, yet distinct from, a traditional asset class categorization. In
9
essence, socially responsible (SRI) funds may include any funds that invest primarily in
the aforementioned asset classes (e.g., municipal bonds, global equities) as long as these
funds are conspicuously identified and recognized as adhering to certain non-economic
criteria, such as social or environmental considerations pertaining to the underlying
components of that fund (e.g., the industry in which the company is active, its track
record with unions or with the social concerns, or its corporate governance approach).
Socially responsible (SRI) mutual funds. With responsible investing trends and awareness
evolving and growing rapidly, coupled with the ubiquitous presence and sustained
popularity of mutual funds within institutional and individual investment communities,
SRI-themed mutual funds have emerged as the most developed component of the SRI
landscape. The popularity of SRI mutual funds has risen markedly even in recent years
and has continued to garner the attention of not just investors, but also industry analysts
as well as third-party investment research providers. Notably, the number of SRI mutual
funds in the United States has grown to over 450, with their collective assets rising to
$1.93 trillion, an over 200% increase from 2012 to 2014 (USSIF, 2015).
As more retail investors continue to seek opportunities to invest according to their
beliefs and principles, growth in these funds is expected to remain strong. There is some
indication that demographic changes may also be playing a role in the increase in SRI-
fund popularity as Millennials in particular seek to mesh their investment goals with their
social principles (Turner, 2015):
Those Millennials old enough and successful enough to have made significant amounts of money are now more likely to demand high standards of socially responsible investing (SRI), keen to measure the impact of that strategy and better informed about the activities that
10
companies are up to. And in a break from previous generations of SRI investors, they have grown as interested in positive as well as negative screening for their investments.
This considerable disposition by Millennials toward measurable investments in
socially significant investment opportunities clearly augments the case for SRI mutual
funds, which generally offer broad accessibility to retail investors as well as
measurability against traditional benchmarks. The inherent diversification that mutual
funds offer may also provide a valuable alternative to investing in singular companies
that meet certain socially responsible standards.
Besides Millennials, other demographic groups are also increasingly showing
interest in values-driven investing as information on environment concerns and social
issues become more readily available and as investment solutions become more
accessible through the use of new technologies (Junkus & Berry, 2013).
Fund managers, on the other hand, have seized the opportunity to increasingly
develop and market various SRI-themed funds to retail investors; however, the
techniques that these fund managers apply in developing and managing the SRI funds are
almost as numerous as the managers, and the most prevalent investment approaches
require some significant scrutiny.
SRI methodologies in the marketplace. Since the advent of modern finance, and
particularly since the end of the second world war, general investment methodologies
have evolved at a fairly brisk pace. New investment vehicles, risk management solutions
and the use of more advanced technologies have enabled compelling and specialized
investment products and strategies to evolve in the marketplace. Such new vehicles range
11
from Exchange Traded Funds (ETFs) to Smart-Beta funds that go beyond traditional
index funds in layering additional index construction rules that extend beyond the cap-
weighted approach of traditional index funds. Socially responsible investing is yet
another investing arena that has evolved and grown very strongly in recent decades.
In general, socially responsible investing is based on investing in funds or
companies that are viewed as having desirable attributes and avoiding those that do not,
as well as influencing the practices of companies toward certain SRI objectives. SRI
managers may also invest directly in community projects and initiatives that yield
benefits beyond economic returns. The Social Investment Forum lists three SRI strategies
that investment managers may adopt to further their SRI goals (Barreda-Tarrazona et al.,
2011): screening, shareholder advocacy, and community investing. These strategies are
described in detail below.
• Screening: This is the process of either excluding or including companies into a
portfolio based on a range of non-economic criteria, including social and
environmental attributes. Some screening techniques are “positive,” in which case
firms that are involved in businesses or practices that are deemed socially
responsible (e.g., solar power entities, micro-finance providers) are considered for
inclusion. On the other hand, “negative” screening excludes firms that are
engaged in business sectors or practices that are not deemed socially responsible
(e.g., gaming enterprises, tobacco growers, coal miners) from the universe of
investing opportunities.
• Shareholder advocacy: Investment managers can also advance SRI goals through
active engagement with portfolio companies in their SRI funds. Generally, the
12
degree of influence that investment managers have is proportional to the
significance of their investment in the portfolio company. Some SRI managers
often try to promote socially responsible goals primarily through engagement with
company boards and senior executives, while other investment managers may
even push for the inclusion of particular board members who are similarly
inclined on SRI issues.
• Community investing: Investment managers can also directly invest in
community projects as a means of advancing socially responsible goals.
Key Issues Impacting Growth of the SRI Fund Industry Today
Despite the brisk growth of SRI fund assets relative to traditional funds, there are
challenges and issues that beset the fund industry. For instance, even as SRI funds have
become much more popular, there are persisting concerns that “imposing non-financial
screens restricts investment opportunities, reduces diversification efficiencies and thereby
adversely impacts performance” (Lee, Humphrey, Benson, & Ahn, 2010). research did
not address the performance of SRI funds relative to traditional funds, as this has been the
focus of numerous studies, albeit with no clear consensus regarding whether SRI funds
outperform or underperform their traditional counterparts. However, this performance
point is significant, as it remains a fundamental challenge for fund managers as they
reach out to investors: There persists a market expectation that all funds (including SRI
funds) will obviously strive to deliver a certain acceptable rate of return, and so
investment managers are loath to make investment decisions that may jeopardize returns
significantly, even in the interest of other tenable concerns (such as social or
environmental responsibility). Given the measurability of returns and the ubiquitous
13
nature of ratings methodologies such as Lipper and Morningstar that heavily utilize past
performance results, even the most philosophically resolute SRI fund managers will
undoubtedly face pressure to meet investors’ performance expectations. And given that
there is not as much comparability or scrutiny regarding the makeup of funds as there is
with performance, one can contend that many SRI managers may see opportunities to
loosen their selection standards in order to expand the pool of investment opportunities
(i.e., companies), particularly as they seek to maintain certain performance expectations.
The preceding issue is particularly predicated on the fundamental problem that
impacts the industry: the lack of a common definition of what constitutes socially
responsible investing (Smith, 2011). This lack of a common definition ensures that there
are no common standards or methodologies across the industry for determining what
should or should not be considered a socially responsible investment, and thus investment
managers are left to devise and apply proprietary screens that best meet their interests.
This broad latitude that SRI fund managers enjoy in how they construct their SRI funds is
a challenge for investors, regulators, and even SRI fund managers themselves. The
growth of this industry will be somewhat dependent on greater clarity and confidence
among the investor community about SRI standards, goals, and relative performance. For
such clarity to exist in the marketplace, there needs to be increased comparability and
analysis of SRI investing philosophies and methodologies in a manner that sheds more
light on how SRI funds achieve their goals and how they differ from traditional funds.
Given that the most common measure by which fund managers of every stripe (including
traditional fund managers) are measured is typically fund performance, a basic
assumption at the root of this study is that there is significant incentive to select firms that
14
would yield stronger fund performance above and beyond selecting firms based on their
sustainability merits; therefore, there is ample cause to examine whether these funds are
indeed socially responsible.
However, it is also important to reflect on the existing research in the SRI space,
as this will not only provide some guidance how certain attributes of the industry have
evolved, but in particular, may also shed some light on what aspects of the industry have
been considered critical by practitioners and researchers and how that may not only
reflect industry standards, but also continue to shape the evolution of the industry.
Previous Studies of SRI
Although there has been considerable academic examination of the socially
responsible investing space, much of the previous research and existing literature has
been focused on examining the motivations of investors in socially responsible
investments as well as on contrasting the performance of socially responsible investments
from that of traditional investments.
Notable studies include that of Lee et al. (2010), which examined how SRI fund
managers applied screens and the effect that their approaches had on the risk profiles of
their portfolios. While this study provided a very useful analysis of screening techniques,
it was specifically focused on the effect of screening on the risk profiles of the portfolios,
and so did not address the issue of general sustainability of the companies reviewed.
Barreda-Tarrazona et al. (2011) provided a pioneering look at how individual
retail investors (rather than professional money managers) assess socially responsible
investments using mutual funds. Interestingly, this study revealed that “although
15
individuals’ criteria for investment are essentially guided by returns and diversification,
participants invest significantly more in a fund when they are explicitly informed about
its SR nature.” While Barreda-Tarrazona et al.’s (2011) study differs considerably from
the essence of the research reported here, it does provide added emphasis for the
significance of this study. For instance, the researchers’ conclusions clearly validated the
premise that investment managers are incentivized to position funds as being socially
responsible in order to lure investments. This incentive is a primary motivation for the
loosening of standards discussed in preceding paragraphs.
As was typical of several SRI studies, Bauer et al. (2005) explored distinctions in
performance between SRI and traditional funds and found that there was “no evidence of
significant differences in risk-adjusted returns between ethical and conventional funds for
the 1990–2001 period.” This remarkable finding adds yet more credence to the
significance of the present research, as it also indicates a lack of distinction between SRI
funds and conventional funds, albeit in terms of performance. The Bauer et al. (2005)
study is particularly noteworthy in the industry, as it has been somewhat interpreted as
being a linchpin in the defense of the SRI fund industry from those who may have
challenged investment advisors and managers who promote socially responsible
investments for their clients as neglecting their fiduciary responsibility to seek to channel
their clients’ assets toward the best economic returns available in the marketplace. This
study fundamentally provided some basis to infer that such worries (including from
certain regulatory bodies) were perhaps not justified.
The investing approach taken by endowments has also been a particularly notable
area of focus for previous research studies, especially because of the pioneering role that
16
these organizations played in the 1960s and 1970s in compelling institutional investors to
adopt policies necessary to address social and environmental concerns. For instance, a
well-received research study by the Investor Responsibility Research Center (IRRC,
2012) examined some of the sustainability attributes used by fund managers. The
attributes are noteworthy for their mix of issues that are relatively transient with those
that are long-standing. For instance, three of the top four focus areas—tobacco, human
rights, and defense/weapons—were all established SRI attributes; however, Sudan-related
investment activity (in terms of screened asset levels in U.S. dollars) was the top attribute
at the time that the survey was completed in 2009, despite not even having been an SRI
issue just a few years earlier. Given some of the subjectivity in assessing or determining
the severity of various global conflicts, it may be difficult to foretell or identify when a
global conflict or crisis warrants an SRI focus or when the investors’ sentiment may shift
significantly on a particular issue. This highlights some of the challenges in assessing or
comparing different SRI approaches, particularly across geographies where values and
perspectives may differ considerably among investors who basically share other
demographic attributes and economic goals.
Need and Application of an Evaluation Scorecard
While a scorecard can be a useful comparison and evaluation tool, it is not meant
to replace or even necessarily augment platforms such as the Global Reporting Initiative
(GRI) from which it derives important elements. In essence, the scorecard is merely
intended to be a structured framework for consistent and comparable measurement of
basic corporate sustainability standards along some common dimensions. Furthermore, it
17
is also critical to recognize that while a scorecard may indeed help to assess how
companies approach certain sustainability issues, much of this assessment may reflect the
effort that the company has taken to position or communicate its sustainability strategies
rather than the extent to which the organization is actually sustainable. There are two
fundamental reasons why corporate reporting may overemphasize sustainability merits:
First, the political cost theory asserts that managers employ CSR reporting initiatives to avoid explicit or implicit taxes, regulatory actions and potential regulation. Second is the legitimacy theory in which companies develop a CSR disclosure so as to legitimize their activities and be consistent with the concept of corporate citizenship. (Giannarakis et al., 2014)
However, there is still significant value to be drawn from sustainability-related
disclosures that organizations release to various stakeholders. For instance, other research
has also shown the following results:
Research results indicate a positive relationship between disclosure quality, particularly investor relations practices, and CSR. That is, firms that engage in socially responsible activities provide more informative and extensive disclosures than do companies that are less focused on advancing social goals. These results support the contention that increased disclosure is a form of socially responsible behavior. Many firms recognize the importance of stakeholder management and, accordingly, provide more informative disclosures in an effort to satisfy stakeholder needs. (Gelb et al., 2001)
Notably, the use of such ratings providers is being driven not just by investors, but
quite often by banks and providers of credit and funding lines:
Several rating agencies such as Asset 4, SAM, Inrate or oekom research specialize on the provision of ratings concerning particular stocks or companies. Apart from investment funds specializing in SRI and individual investors with similar preferences, some banks attach importance to the sustainability of firms demanding credit from them, be it for moral reasons or because a positive relation between corporate sustainability and financial performance is assumed. (Docekalova, & Kocmanová, 2016)
18
Development of a Scorecard
The construction of scorecards for measuring sustainability is a fairly nebulous
area for academics. For instance:
There are two broad responses to the sustainability measurement problem. The first begins with the proposition that there is little in the notion of the sustainable business or ‘corporate sustainability’ beyond defining a set of pragmatic guidelines whereby a corporate entity can monitor and improve its environmental performance. The measurement issue here is to find meaningful environmental indicators that capture the flavor of the broader sustainability debate; for example, by conveying environment– economy linkages. (Atkinson, 1999)
While this perspective does not reflect many of the more recent advances in
corporate sustainability assessment, such as the Global Reporting Initiative framework
which is part of the assessment mechanism, Atkinson did provide some basis for how
such objective frameworks may have evolved:
The second response is that lessons drawn from the green, national or ‘macro’ accounting literature allow us to define more formally what it means for a business to be either ‘sustainable’ or ‘unsustainable’. Common to both approaches is an increased emphasis on ‘micro’ accounting for external pressures or impacts attributable to a corporate entity. (Atkinson, 1999)
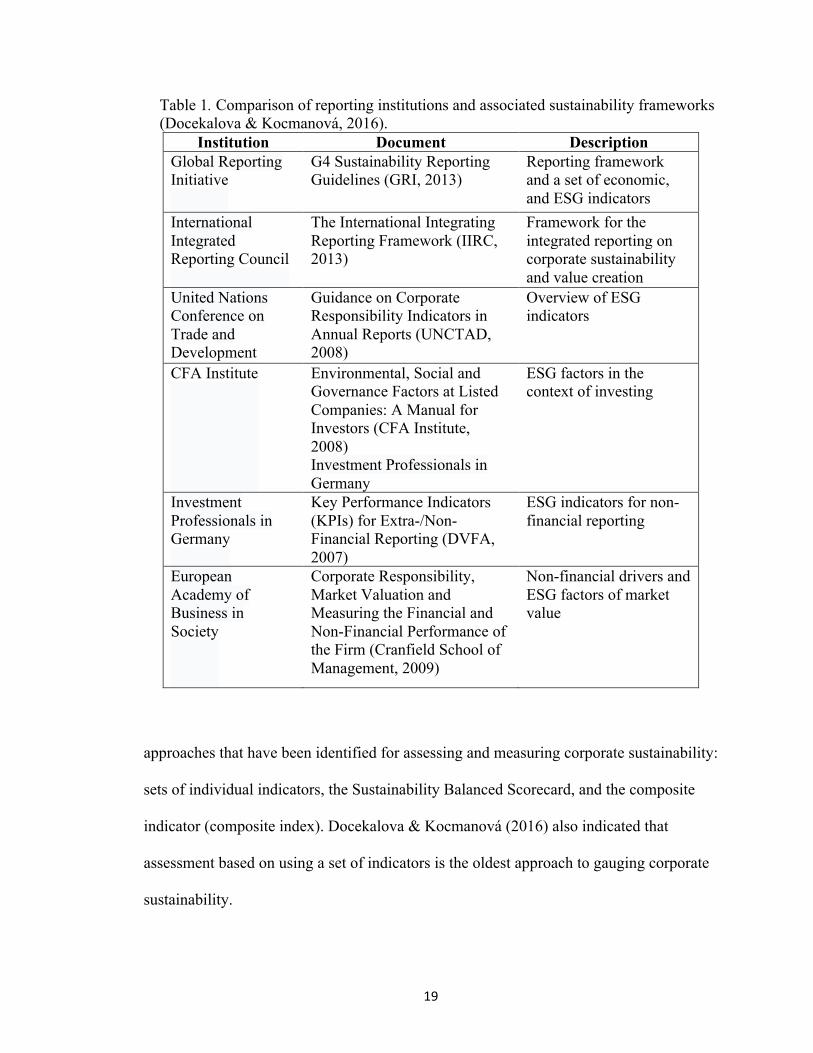
Furthermore, several other academic studies have provided even more insight into
the evolution of assessment frameworks for corporate sustainability. For instance,
Docekalova & Kocmanová (2016) ). l suggested that there are three broadly recognized
19
Table 1. Comparison of reporting institutions and associated sustainability frameworks (Docekalova & Kocmanová, 2016).
Institution Document Description Global Reporting Initiative
G4 Sustainability Reporting Guidelines (GRI, 2013)
Reporting framework and a set of economic, and ESG indicators
International Integrated Reporting Council
The International Integrating Reporting Framework (IIRC, 2013)
Framework for the integrated reporting on corporate sustainability and value creation
United Nations Conference on Trade and Development
Guidance on Corporate Responsibility Indicators in Annual Reports (UNCTAD, 2008)
Overview of ESG indicators
CFA Institute Environmental, Social and Governance Factors at Listed Companies: A Manual for Investors (CFA Institute, 2008) Investment Professionals in Germany
ESG factors in the context of investing
Investment Professionals in Germany
Key Performance Indicators (KPIs) for Extra-/Non-Financial Reporting (DVFA, 2007)
ESG indicators for non-financial reporting
European Academy of Business in Society
Corporate Responsibility, Market Valuation and Measuring the Financial and Non-Financial Performance of the Firm (Cranfield School of Management, 2009)
Non-financial drivers and ESG factors of market value
approaches that have been identified for assessing and measuring corporate sustainability:
sets of individual indicators, the Sustainability Balanced Scorecard, and the composite
indicator (composite index). Docekalova & Kocmanová (2016) also indicated that
assessment based on using a set of indicators is the oldest approach to gauging corporate
sustainability.
20
Conceivably, the advantage of the composite indicators (or indexes) described
above over individual indicators is that they summarize complex multidimensional
attributes in a single score that is relatively easy to interpret. The popularity of such
composite indexes is increasing significantly, with at least one prominent index of this
kind having been released during the period in which this research paper was being
developed. In particular: “A special group of composite indices includes indices
concerning responsible investing. They are, for example, the Dow Jones Sustainability
Index, FTSE4 Good Sustainability Indexes, Morningstar Socially Responsible Investment
Index, and the Ethibel Sustainability Index” (Docekalova & Kocmanová, 2016).
Ultimately, the quality of models used to assess companies for SRI criteria is of
paramount importance. The comprehensiveness and relevance of selected attributes has
been studied in various research papers and is often the basis for comparative arguments
in support of one framework or another over others. Approaches and metrics vary
significantly across the board; however, the following are a set of characteristics that
have proven to be somewhat relevant in prominent studies. These attributes have been
used as a foundational basis for the framework used in this research study. In essence, a
robust model for measuring corporate sustainability should satisfy the following criteria:
• it should integrate the four factors of corporate sustainability—economic,
environmental, social and corporate governance,
• it should not be based only on financial indicators but should also include
non-financial indicators,
• it should not be universal but should reflect the specifics of the industry in
which the company operates,
21
• it should be easy to interpret, i.e. the composite corporate performance
indicator is a model in the mathematical sense,
• the calculation must be simple,
• it should include the principle of benchmarking,
• individual indicators must be relative and data for the calculation must be
available. (Docekalova & Kocmanová, 2016)
A model or framework that satisfies the conditions stated above is likely to be
fairly comprehensive (i.e., across the broad facets of sustainability—environmental,
social, etc.), as well as being flexible enough to apply to various industries and objective
enough to be effective in comparing two entities with a certain degree of precision.
Anticipated Challenges in the Development of a Measurement Framework
It was clear that in order to assess and contrast the sustainability profiles of SRI
funds relative to traditional funds, I had to examine the corporate social responsibility
standards of individual firms using a uniform approach that allows comprehensive yet
‘apples-to-apples’ measurement. However, it is important to reiterate that such a standard
measure does not exist and that any such framework that is applied stands the risk of
being profoundly deficient for certain types of firms or for particular industries. Some
researchers have explored this topic in depth and provided particular insight into the issue
of measurement standards:
The review highlighted that one of the most important challenges in the Corporate Sustainability field is to find a standard method for valuing Corporate Sustainability. Most Corporate Sustainability-focused articles either described facts or present case studies of “success” (e.g., Stubbs & Cocklin, 2008). CS empirical articles tend to rely on data provided by different sources, such as the Kinder, Lydenberg, and Domini (KLD) Indices, the GRI, or the Dow Jones
22
Sustainability Index (DJSI). Although there seems to be some agreement on how to measure the environmental dimension of Corporate Sustainability, it is unclear how the economic and social dimensions can be best measured. For instance, some studies analyzing firms’ environmental performance in the U.S. context that have been published in top academic journals used the EPA’s Toxic Release Inventory as their data source (Montiel & Delgado-Ceballos 2014).
The approach taken toward the development of an assessment framework for this
thesis sought to avoid the narrow dependence of metrics that unduly punish or favor
specific industries (such as the EPA’s Toxic Release Inventory, as noted in the research
findings by Montiel et al. (2014). However, there is still a certain amount of subjectivity
built into this framework, which is somewhat inevitable when applying a varied
assortment of selected criteria in order to assess firms of equally varying characteristics.
Research Question, Hypotheses, and Specific Aims
The central question I addressed in this study was whether or not funds that are
labelled and marketed as socially responsible investment (SRI) funds are indeed
sustainable financial products.
The primary hypothesis that this thesis examined was: Companies whose equity
or debt is represented in SRI retail funds have inherent sustainability characteristics that
differ from those of the companies in non-SRI funds. Subordinate predictions of this
hypothesis were:
i. There is a significant overlap in the companies whose equities and debt are
included in SRI funds and those whose equities and debt are included in non-
SRI funds.
23
ii. SRI funds, in particular, generally include equities and debt from companies
that do not rate highly as sustainable enterprises at least as often as they
include equities and debt from companies that rate highly as sustainable
enterprises.
Specific Aims
To examine these hypotheses, I had to:
i. Determine two sample sets of leading SRI funds and non-SRI funds (e.g.,
leading S&P 500 index funds)
ii. Postulate a set of attributes that exemplify companies that adhere to ESG or
SRI principles
iii. Develop a scorecard that would be used to assess companies based on the
attributes described in (ii)
iv. Review the SRI funds and non-SRI funds defined in step (i) to determine
companies represented in these two sample sets
v. Apply comparative analysis and the scorecard developed in step (iii) to test
the hypothesis that the attributes determined in step (ii) are not any more
prevalent in companies represented in the SRI fund set than they are in the
companies represented in the non-SRI fund set.
24
Chapter II
Methods
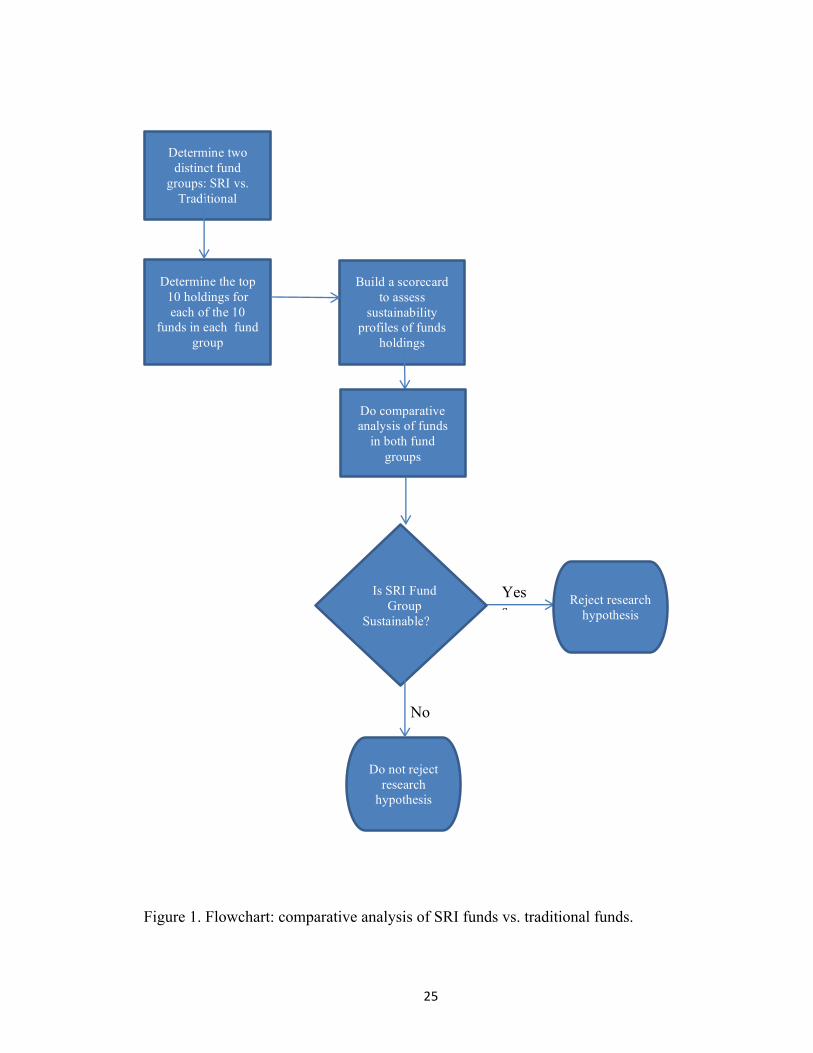
This research sought to test the notion that managers of SRI mutual funds have
exploited the latitude described above by investing in firms that do not score highly as
sustainable enterprises. In order to test this, two sample sets of funds (SRI and traditional)
from the retail mutual fund industry were developed, and the top 10 holdings held in each
set of 10 SRI and 10 traditional funds were assessed using the scorecard of sustainability
attributes that was developed as part of this research study (Figure 1). Funds were pulled
from the Morningstar Direct database, which holds data reported to the SEC on all retail
funds regulated under the 1940 Investment Companies Act. S&P 500 and other similar
index funds typically represent market-neutral investment strategies and would represent
the control group for comparison. The SRI funds, however, by definition should include
selected holdings that represent particular fundamentals or attributes. Theoretically, this
approach could have entailed the examination of 200 distinct firms (i.e., 100 in the SRI
fund set and 100 in the traditional fund set); however, this was not the case given the
overlap of firms in both sets. This approach is preferable as it is founded on utilizing
publicly available data as well as the use of an objective scorecard.
Research Design
This research was focused on examining mutual fund products that are regulated
under the 1940 Investment Companies Act (also referred to as the ’40 Act), which is
overseen by the Securities and Exchange Commission (SEC). The regulatory prerogative
25
Figure 1. Flowchart: comparative analysis of SRI funds vs. traditional funds.
Determine two distinct fund
groups: SRI vs. Traditional
Determine the top 10 holdings for each of the 10
funds in each fund group
Build a scorecard to assess
sustainability profiles of funds
holdings
Is SRI Fund Group
Sustainable? Reject research
hypothesis
Do not reject research
hypothesis
Yess
No
Do comparative analysis of funds
in both fund groups
26
ensures that all retail mutual fund data is publicly available and so can be readily sourced
for purposes of research by downloading SEC data directly or through a third-party tool
such as Morningstar’s Direct database.
The data elements that were collected and analyzed included the following:
i. the top 10 SRI funds,
ii. the top 10 traditional funds,
iii. the top 10 holdings of the top ten SRI funds (i),
iv. the top 10 holdings of the top ten traditional funds (ii),
v. GRI reports for the all companies in either set of mutual funds (SRI and
traditional) (potentially up to 200 companies, but likely to be much fewer,
as many companies are likely to belong to both the SRI fund group and the
traditional fund group), and
vi. annual reports for all companies in either set of mutual funds (SRI and
traditional).
For convenience and to ensure consistency across time periods, methodology,
formatting, and data structure, the requisite fund data was sourced entirely from
Morningstar Direct. The scorecard was then used to assess the two sets of companies
(i.e., the SRI group and the non-SRI group) to determine how each of the fund groups
measures against the predetermined sustainability attributes.
Defining Corporate Sustainability and Responsible Investing Within the Research Design
Responsible investing in public entities is ultimately chiefly concerned with the
identification and selection of entities that are deemed to possess the right attributes of
27
corporate sustainability; however, the fundamental challenge is that “corporate
sustainability” is itself a fairly broad term:
Given that there is ambiguity about whether CS should be a tridimensional construct (economic, social, and environmental), a bidimensional one (social and environmental), or a synonym for environmental management. Some scholars identify the concept of CS exclusively in terms of its environmental dimension. In other words, they view it as a synonym for environmental management. Other scholars refer to both social and environmental issues of Corporate Sustainability. Finally, a large proportion of scholars agree on the definition that encompasses economic, social, and environmental dimensions. These scholars use different terminologies, such as “Triple Bottom Line” or the “3 Ps” of people, planet, and profit.(Montiel et al., 2014) For purposes of this research thesis, the definition of ‘corporate sustainability’
will be consistently that of the broadest perspective—incorporating social, economic,
environmental, and governance factors.
Scorecard for Sustainability Attributes
A scorecard was used to assess each of the companies within the SRI and
traditional fund sample sets based on academic and industry material. These attributes
were prioritized and provided arbitrary weightings that formed the basis for the
scorecard. Given uncertainty regarding what should be included as an attribute and what
weightings should be applied to the attributes, a variation of the scorecard was also
developed and used to provide an alternative perspective.
In certain ways, the scorecard is intrinsically similar to proprietary SRI screens
employed by various investment managers. It consists of both a positive dimension (i.e.,
points awarded for being active in certain industries, such as solar or wind, or for
adhering to GRI reporting standards which govern sustainability reporting) and a
negative dimension (i.e., points deducted for being active in certain industries, such as
28
coal and fossil fuels). There is also a comprehensive review of the fiscal year-end reports
(which are all publicly available) of each firm to evaluate the extent to which a
sustainability program is described and whether a governance framework (preferably
with senior stakeholder involvement) is in place at the company. This assessment has also
been provided a weighting in the scorecard.
The final step was a scoring of companies in both sample sets (i.e., SRI and non-
SRI) using the scorecard described in Research Method (ii). The scorecard included
cardinal points assigned to a binary score (e.g., Company X adheres to GRI Reporting
Standards: Yes/No?). In essence, the score for each fund was the mean scorecard value
determined across the 10 holdings. it was then possible to accept or reject the hypothesis:
The companies in the non-SRI set are rather similar to those in the SRI set in terms of
their sustainability profiles.
Construction of a Measurement Framework
Although this study largely relied on the use of GRI as a basis for assessing the
sustainability profile of the firms included in both sets of funds (i.e., the SRI group and
the traditional group), it is important to fully understand how such metrics are developed.
For instance, reviewing the universe of available factors may also lead to a better
understanding of how to enhance or refine the assessment methodology. A relatively
comprehensive list of sustainability factors from which a measurement framework can
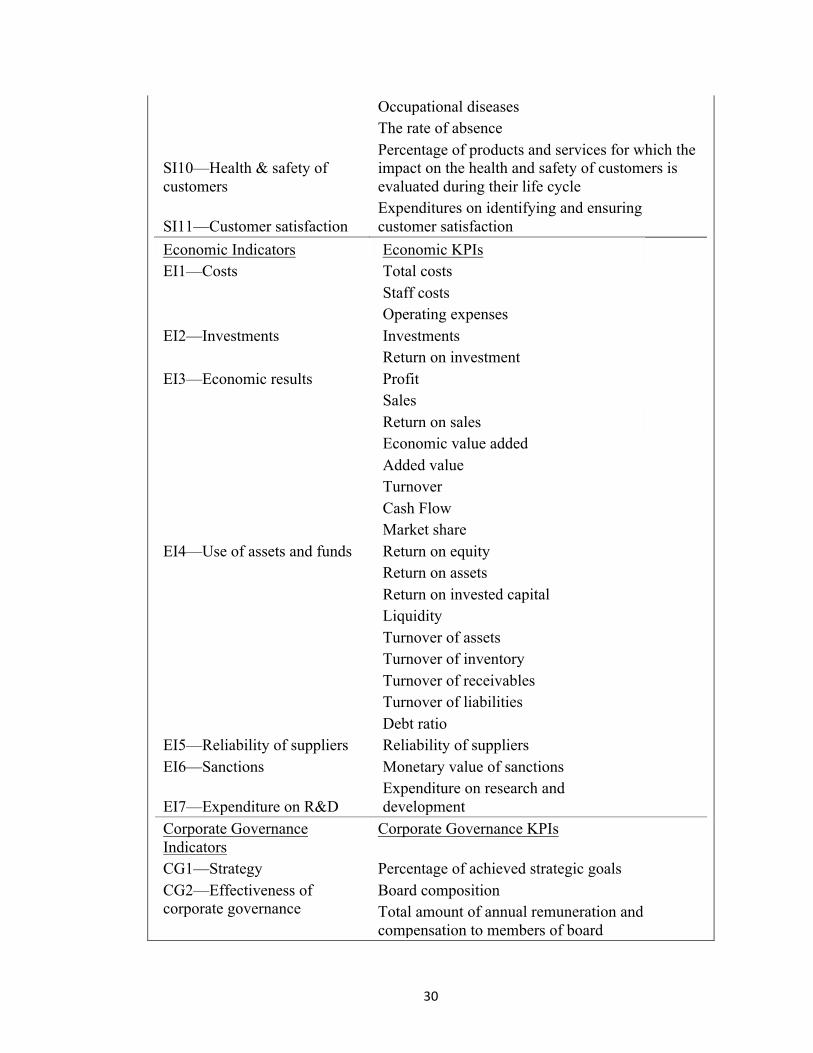
draw is shown in Table 2.
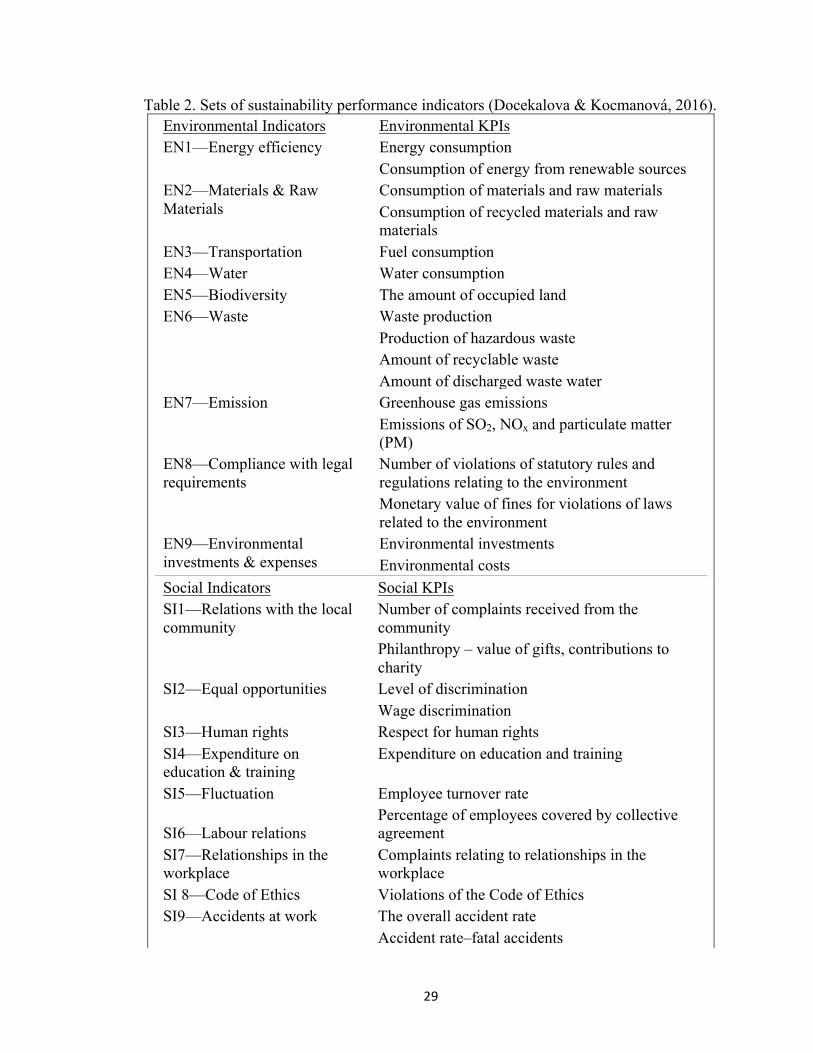
29
Table 2. Sets of sustainability performance indicators (Docekalova & Kocmanová, 2016). Environmental Indicators Environmental KPIs EN1—Energy efficiency Energy consumption
Consumption of energy from renewable sources EN2—Materials & Raw Materials
Consumption of materials and raw materials Consumption of recycled materials and raw materials
EN3—Transportation Fuel consumption EN4—Water Water consumption EN5—Biodiversity The amount of occupied land EN6—Waste Waste production
Production of hazardous waste Amount of recyclable waste Amount of discharged waste water
EN7—Emission Greenhouse gas emissions Emissions of SO2, NOx and particulate matter (PM)
EN8—Compliance with legal requirements
Number of violations of statutory rules and regulations relating to the environment
Monetary value of fines for violations of laws related to the environment
EN9—Environmental investments & expenses
Environmental investments Environmental costs
Social Indicators Social KPIs SI1—Relations with the local community
Number of complaints received from the community Philanthropy – value of gifts, contributions to charity
SI2—Equal opportunities Level of discrimination Wage discrimination
SI3—Human rights Respect for human rights SI4—Expenditure on education & training
Expenditure on education and training
SI5—Fluctuation Employee turnover rate
SI6—Labour relations Percentage of employees covered by collective agreement
SI7—Relationships in the workplace
Complaints relating to relationships in the workplace
SI 8—Code of Ethics Violations of the Code of Ethics SI9—Accidents at work The overall accident rate
Accident rate–fatal accidents
30
Occupational diseases The rate of absence
SI10—Health & safety of customers
Percentage of products and services for which the impact on the health and safety of customers is evaluated during their life cycle
SI11—Customer satisfaction Expenditures on identifying and ensuring customer satisfaction
Economic Indicators Economic KPIs EI1—Costs Total costs
Staff costs Operating expenses
EI2—Investments Investments Return on investment
EI3—Economic results Profit Sales Return on sales Economic value added Added value Turnover Cash Flow Market share
EI4—Use of assets and funds Return on equity Return on assets Return on invested capital Liquidity Turnover of assets Turnover of inventory Turnover of receivables Turnover of liabilities Debt ratio
EI5—Reliability of suppliers Reliability of suppliers EI6—Sanctions Monetary value of sanctions
EI7—Expenditure on R&D Expenditure on research and development
Corporate Governance Indicators
Corporate Governance KPIs
CG1—Strategy Percentage of achieved strategic goals CG2—Effectiveness of corporate governance
Board composition Total amount of annual remuneration and compensation to members of board
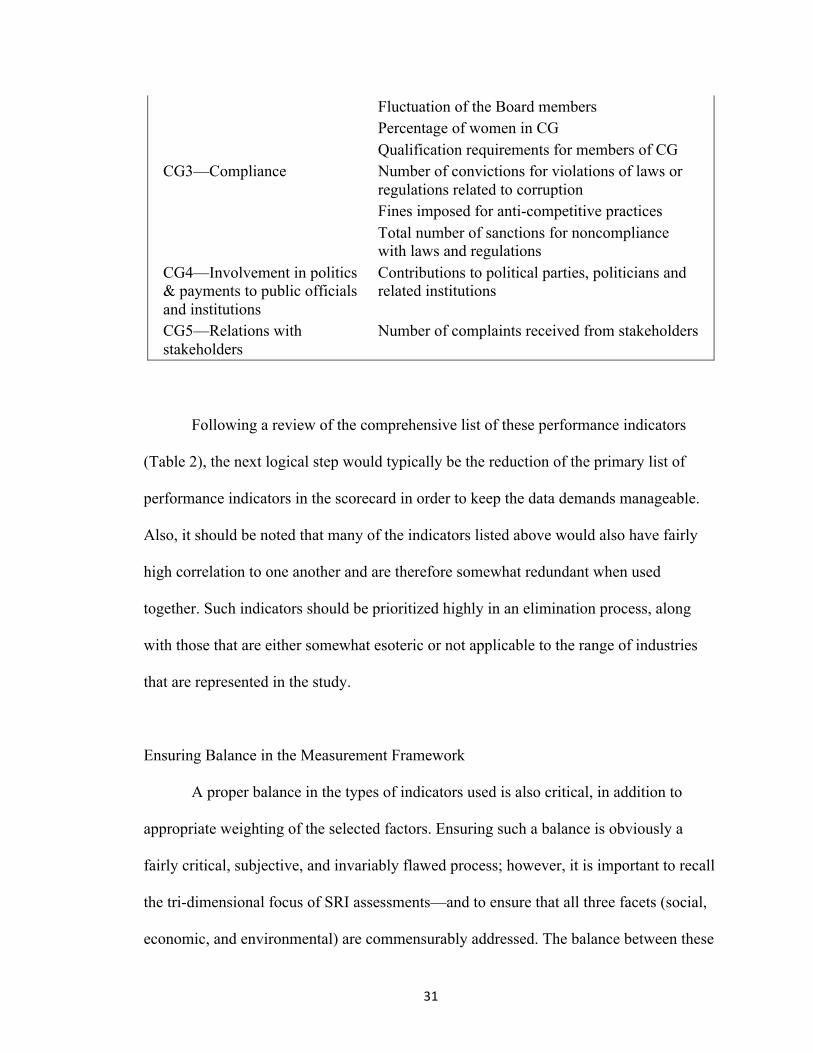
31
Fluctuation of the Board members Percentage of women in CG Qualification requirements for members of CG
CG3—Compliance Number of convictions for violations of laws or regulations related to corruption Fines imposed for anti-competitive practices Total number of sanctions for noncompliance with laws and regulations
CG4—Involvement in politics & payments to public officials and institutions
Contributions to political parties, politicians and related institutions
CG5—Relations with stakeholders
Number of complaints received from stakeholders
Following a review of the comprehensive list of these performance indicators
(Table 2), the next logical step would typically be the reduction of the primary list of
performance indicators in the scorecard in order to keep the data demands manageable.
Also, it should be noted that many of the indicators listed above would also have fairly
high correlation to one another and are therefore somewhat redundant when used
together. Such indicators should be prioritized highly in an elimination process, along
with those that are either somewhat esoteric or not applicable to the range of industries
that are represented in the study.
Ensuring Balance in the Measurement Framework
A proper balance in the types of indicators used is also critical, in addition to
appropriate weighting of the selected factors. Ensuring such a balance is obviously a
fairly critical, subjective, and invariably flawed process; however, it is important to recall
the tri-dimensional focus of SRI assessments—and to ensure that all three facets (social,
economic, and environmental) are commensurably addressed. The balance between these
32
three dimensions that are being measured is generally considered to be organic in the
stronger and more sustainable firms in various industries. In essence, academics rarely
consider it possible to find a firm that excels in two of the dimensions but is thoroughly
deficient in the third, or vice versa. Overall, what this means is that the environmental
and social performance of an organization becomes somewhat integrated into the firm’s
core functioning and its very visible economic performance—and in turn, this ensures
that the interests of the firm’s current proprietors or shareholders become somewhat
integrated with those of the firm’s future owners and to some degree those of the broader
population:
If companies wish to achieve long-term success, they should operate at the highest possible complex (sustainable) performance. If we modify the definition of sustainable development published in the Report of the World Commission on Environment and Development established (WCED, 1987) by the UN, companies should define such corporate strategies that seek to apply the best processes and practices to meet and balance the needs of current and future stakeholders. It entails a complex task to achieve competitive results in the short term and, at the same time, to protect, maintain and develop human and natural resources that will be required in the future. This definition contains a requirement for continuous improvement of corporate performance. (Montiel et al., 2014)
Inherently, the most successful sustainable enterprises generally possess the right
balance of attributes; however, as always, measuring this complex assortment of relevant
attributes is where the challenge lies. There also has to be proper care to ensure that a
company’s sheer involvement in a certain industry is not in itself the primary factor in
determining its sustainability profile. For instance, should a forward-looking natural gas
refiner with sound social and environmental practices be consequentially rated below a
toy manufacturer with abhorrent social or environmental practices? To what degree
should the industry in which an organization is involved determine its sustainability
standing, particularly if its approach within that industry is comparatively positive
33
relative to its peers? Conversely, one can also challenge the extent to which firms that are
involved in relatively innocuous industries but do not have any significant sustainability
awareness or substantial proactive programs have been held to account for their social
and environmental practices and impact. Quite clearly, the bulk of scrutiny is likely to
continue falling on those organizations perceived to have the most significant impact on
the environment (e.g., natural resource-dependent sectors such as oil/gas and paper, as
well as organizations that are involved in the industries that have been identified with
high-profile social or labor issues, e.g., textiles). This issue becomes particularly
challenging when one factors in the myriad convoluted and often opaque policies and
practices that are common in many multinational firms. For instance, with regard to
Hewlett-Packard (a Fortune 500 information systems multinational corporation):
Although HP has resisted unionization of its own facilities, the firm mandates that its suppliers respect local laws pertaining to freedom of association and collective bargaining. HP's 2009 Code of Conduct (version 3.01) reads: “Participants are to respect the rights of workers as established by local law to associate freely on a voluntary basis, seek representation, join or be represented by Works Councils, and join or not join labor unions and bargain collectively as they choose. (Locke, 2013)
In a reasonably comprehensive and incisive study of Hewlett-Packard’s sustainability
practices, its fairly progressive approach to the unionization at suppliers’ locations should
be well regarded; however, this should also be set in stark contrast to its own practices in
its home country.
The Selected Framework
The framework for assessing the companies in each of the SRI and traditional
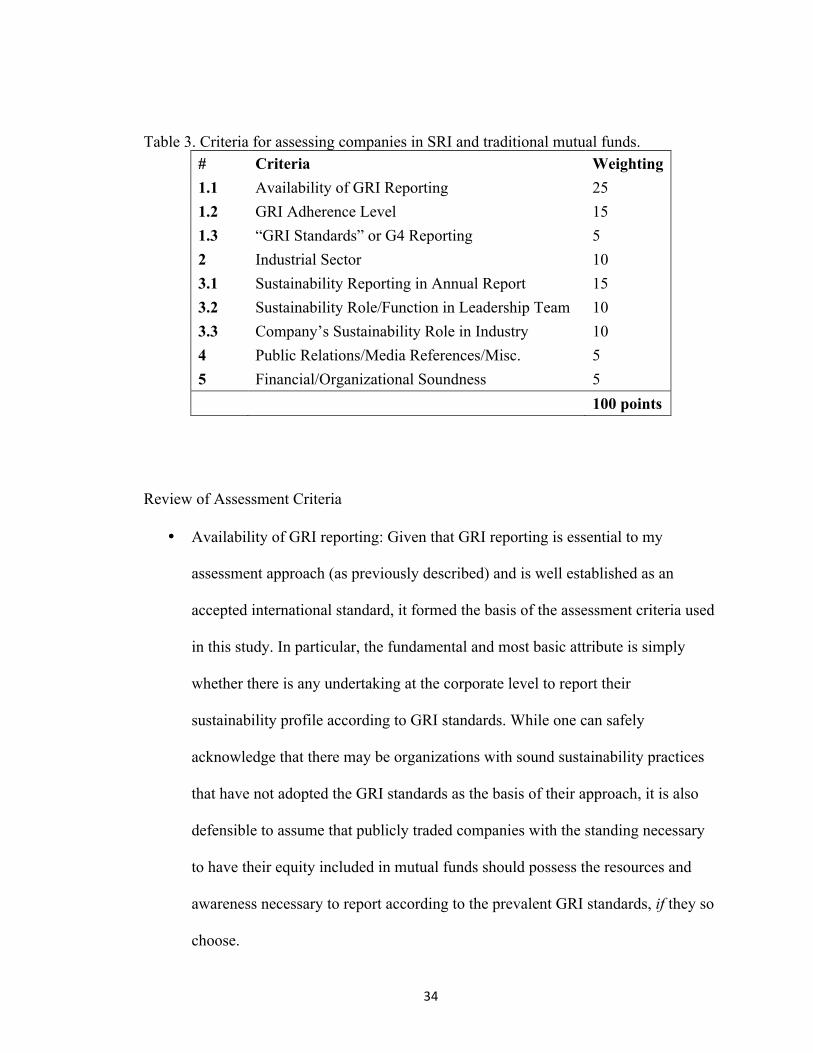
mutual funds includes nine criteria, tallying 100 points (Table 3).
34
Table 3. Criteria for assessing companies in SRI and traditional mutual funds. # Criteria Weighting 1.1 Availability of GRI Reporting 25 1.2 GRI Adherence Level 15 1.3 “GRI Standards” or G4 Reporting 5 2 Industrial Sector 10 3.1 Sustainability Reporting in Annual Report 15 3.2 Sustainability Role/Function in Leadership Team 10 3.3 Company’s Sustainability Role in Industry 10 4 Public Relations/Media References/Misc. 5 5 Financial/Organizational Soundness 5 100 points
Review of Assessment Criteria
• Availability of GRI reporting: Given that GRI reporting is essential to my
assessment approach (as previously described) and is well established as an
accepted international standard, it formed the basis of the assessment criteria used
in this study. In particular, the fundamental and most basic attribute is simply
whether there is any undertaking at the corporate level to report their
sustainability profile according to GRI standards. While one can safely
acknowledge that there may be organizations with sound sustainability practices
that have not adopted the GRI standards as the basis of their approach, it is also
defensible to assume that publicly traded companies with the standing necessary
to have their equity included in mutual funds should possess the resources and
awareness necessary to report according to the prevalent GRI standards, if they so
choose.
35
• GRI adherence level: This attribute measured the degree to which the reporting
conformed to GRI standards. No interpretation or determination was necessary for
this attribute, as it is directly provided by GRI. However, it is important to note
that this score is obviously dependent on the availability of GRI reporting in the
first place, and thus further underlines the substantial role that GRI serves in the
assessment approach and in this study overall.
• Reporting standards: The reporting standards in use have evolved greatly since
the turn of the millennium, and companies continue to conduct GRI reporting
through several “guidelines.” The most robust and recent approach was until
recently described in the G4 Reporting Guidelines; however, on October 19,
2016, the GRI Standards were released, which now supersede the G4 guidelines.
The G4 guidelines will be completely phased out by July 2018, at which point all
new reporting and materials will be required to be in accordance to the GRI
Standards. Any new entities are currently encouraged to immediately adopt the
GRI Standards.
• Industrial sector: Comparing organizations that function in differing industrial
sectors can always be a rather challenging endeavor in trying to ensure fairness
and adequate balance, and this paper concedes that a great degree of subjectivity
is invariably involved in any such comparison. For instance, assessing the
sustainability profile of a petrochemicals organization would obviously factor in
the considerable impact on the environment from drilling and other related
extraction activities; however, that same organization may be at the forefront of
its peer group within that industrial sector and, furthermore, may even have social
36
and governance practices that are patently superior to those at organizations in
sectors with less of an environmental impact. In any regard, it is still
fundamentally rational to expect that firms that are heavily involved in certain
industries that heavily impact the environment (e.g., coal mining or
petrochemicals) or have somewhat controversial social impacts (e.g., gun
manufacturers) should be held to account when assessing socially responsible
investments.
• Sustainability reporting in annual report: The annual report is a uniquely
important component that most organizations of significant size release following
the end of their fiscal year—highlighting not only their financial and operational
performance, but also some of their goals and milestones as well as any new
competitive or marketplace developments. For publicly traded companies, the
annual report is not only a requirement, but also serves to reassure shareholders
that the organization is indeed moving in the direction that its management and
board or directors are tasked with ensuring. Increasingly, the annual report has
become an essential medium to depict an organization’s sustainability strategy,
responsibilities, milestones, and achievements. Quite often, firms use the annual
report as an opportunity to let their stakeholders know that their sustainability
goals and practices are inherently integral to their core business functions and in
essence support their strategic objectives. Given the centrality of the annual report
across public companies of every stripe and industrial sector, it is appropriate to
gauge how this medium is being used. For instance, how prominent is
sustainability in companies’ annual reports? Such prominence, while subjective,
37
does provide some insight into how much the board of directors and the executive
management want to be held accountable for sustainability at the organization.
This also indicates the degree to which sustainability principles permeate the
general strategic thinking and business operations of an organization.
• Sustainability role/function in the leadership group: Another indicative attribute
that alludes to the level of prominence attached to sustainability within an
organization is the reporting hierarchy in which its sustainability function is
placed. Obviously, the first element is ensuring that there is indeed a sustainability
function or there are clearly identified individuals who are charged with ensuring
that certain sustainability principles are recognized in the firm, made relevant for
the various divisions and groups, as well as tracked and reported for the executive
management and board of directors to action as needed. Given enough
prominence, such a group or individual would be easily identifiable within the
annual report, on a company’s sustainability or GRI report, and/or on the
company’s website.
• Sustainability role in industry: As in all disciplines, certain companies continue to
be pioneers in establishing and propagating best practices in their respective
industrial sectors, while others may adhere to sustainability practices but are not
necessarily pioneering or driving the adoption of new standards within their
industry. Quite clearly, some organizations would also be laggards in their
respective industries and would typically not be involved in advancing best
practices in sustainability, if they actually adhere to commonly accepted industrial
practices at all. Assessment of a company’s role in its industry was based on its
38
membership in or leadership of industry groups as well as its efforts to promote
certain standards and practices, such as collaboration with labor groups and local
communities. Efforts to derail or restrict advancement in industrial practices, such
as through political lobbying efforts to increase drilling access or lower emission
standards, was conversely assessed negatively.
• Public relations/media references: Consideration was also made for an
organization’s public relations activities inasmuch as they directly related to
advancing sustainability causes in society. Expectedly, it would be prudent to
recognize the tendency for certain organizations to use public relations and
promotional activities to obfuscate their own direct business conduct with respect
to sustainability principles; however, it is also important to recognize the value
that can accrue from a company deploying its wealth of resources toward
advancing the public’s awareness or participation in sustainability ideals.
Examples of such activities include corporate programs encouraging volunteering
in various social or environmental programs and corporate sponsorship of such
programs.
• Financial/organizational soundness: Although the central focus of this paper is
assessing two groups of companies within sustainability parameters, it is
important to recognize that strong sustainability practices invariably should be
reflected in the general health of an organization over time. The goal of this is not
to place too heavy an emphasis on financial performance over sustainability
principles (especially given that the null hypothesis of this study alludes to fund
managers possibly doing exactly that when developing mutual funds); however, it
39
is impactful to recognize that financial performance and organizational stability
also enable organizations to continue developing and advancing their
sustainability programs effectively with the support of important stakeholders
such as shareholders. Any significant belief that organizational performance has
been particularly weak or that the organization is fundamentally unsound will
likely incentivize stakeholders to seek organizational change that may or may not
be consistent with the organization’s sustainability goals. Hence, solid financial
performance and general organizational soundness is often a typical byproduct of
a strong sustainability culture.
Reviewing the Two Groups of Mutual Funds
The SRI group consisted of the largest SRI funds as determined by the size of their assets
under management as of September 30, 2016 (Table 4). Similarly, the traditional group
(Table 5) comprised the largest mutual funds in the marketplace as of September 30,
2016 (regardless of underlying investment strategy). These tables provide a listing of the
top SRI and traditional mutual funds, as of September, 2016.
It is important to note that given the SRI funds’ relative newness in terms of
prominence in the marketplace and their avowedly narrower investment scope, the SRI
fund group invariably consisted of funds with much smaller assets under management
than the traditional group. This was certainly expected and does not in any way detract
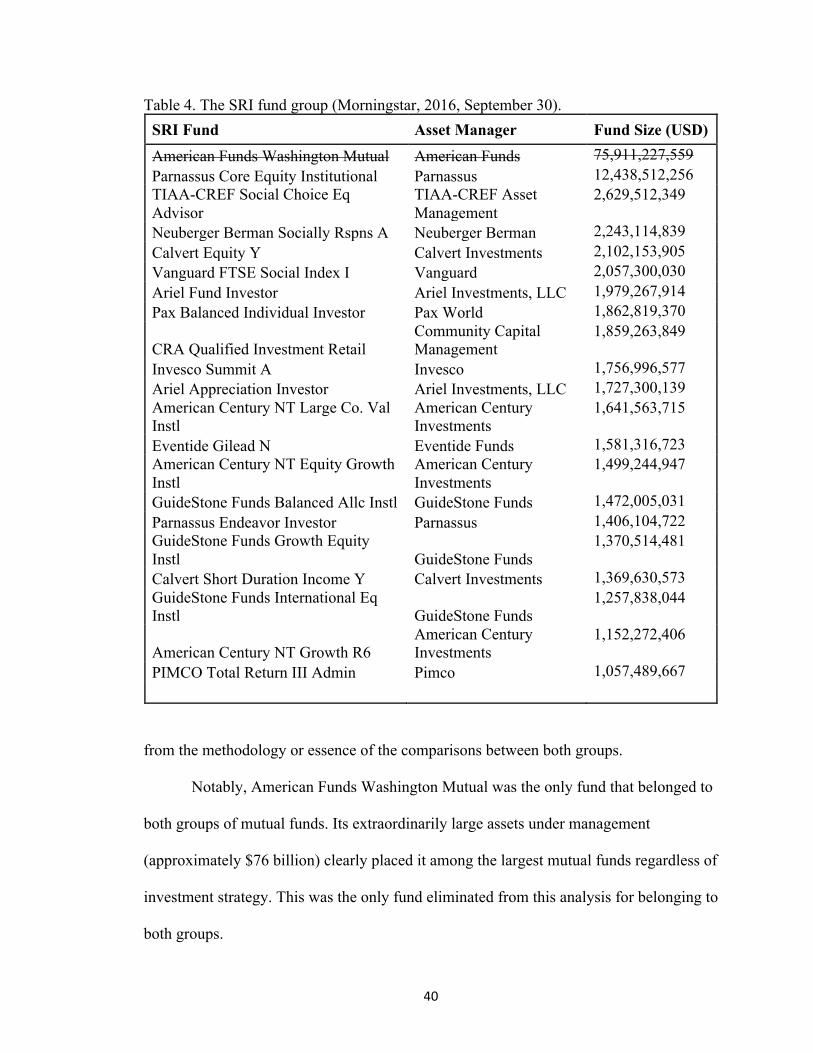
40
Table 4. The SRI fund group (Morningstar, 2016, September 30). SRI Fund Asset Manager Fund Size (USD) American Funds Washington Mutual American Funds 75,911,227,559 Parnassus Core Equity Institutional Parnassus 12,438,512,256 TIAA-CREF Social Choice Eq Advisor
TIAA-CREF Asset Management
2,629,512,349
Neuberger Berman Socially Rspns A Neuberger Berman 2,243,114,839 Calvert Equity Y Calvert Investments 2,102,153,905 Vanguard FTSE Social Index I Vanguard 2,057,300,030 Ariel Fund Investor Ariel Investments, LLC 1,979,267,914 Pax Balanced Individual Investor Pax World 1,862,819,370
CRA Qualified Investment Retail Community Capital Management
1,859,263,849
Invesco Summit A Invesco 1,756,996,577 Ariel Appreciation Investor Ariel Investments, LLC 1,727,300,139 American Century NT Large Co. Val Instl
American Century Investments
1,641,563,715
Eventide Gilead N Eventide Funds 1,581,316,723 American Century NT Equity Growth Instl
American Century Investments
1,499,244,947
GuideStone Funds Balanced Allc Instl GuideStone Funds 1,472,005,031 Parnassus Endeavor Investor Parnassus 1,406,104,722 GuideStone Funds Growth Equity Instl GuideStone Funds
1,370,514,481
Calvert Short Duration Income Y Calvert Investments 1,369,630,573 GuideStone Funds International Eq Instl GuideStone Funds
1,257,838,044
American Century NT Growth R6 American Century Investments
1,152,272,406
PIMCO Total Return III Admin Pimco 1,057,489,667
from the methodology or essence of the comparisons between both groups.
Notably, American Funds Washington Mutual was the only fund that belonged to
both groups of mutual funds. Its extraordinarily large assets under management
(approximately $76 billion) clearly placed it among the largest mutual funds regardless of
investment strategy. This was the only fund eliminated from this analysis for belonging to
both groups.
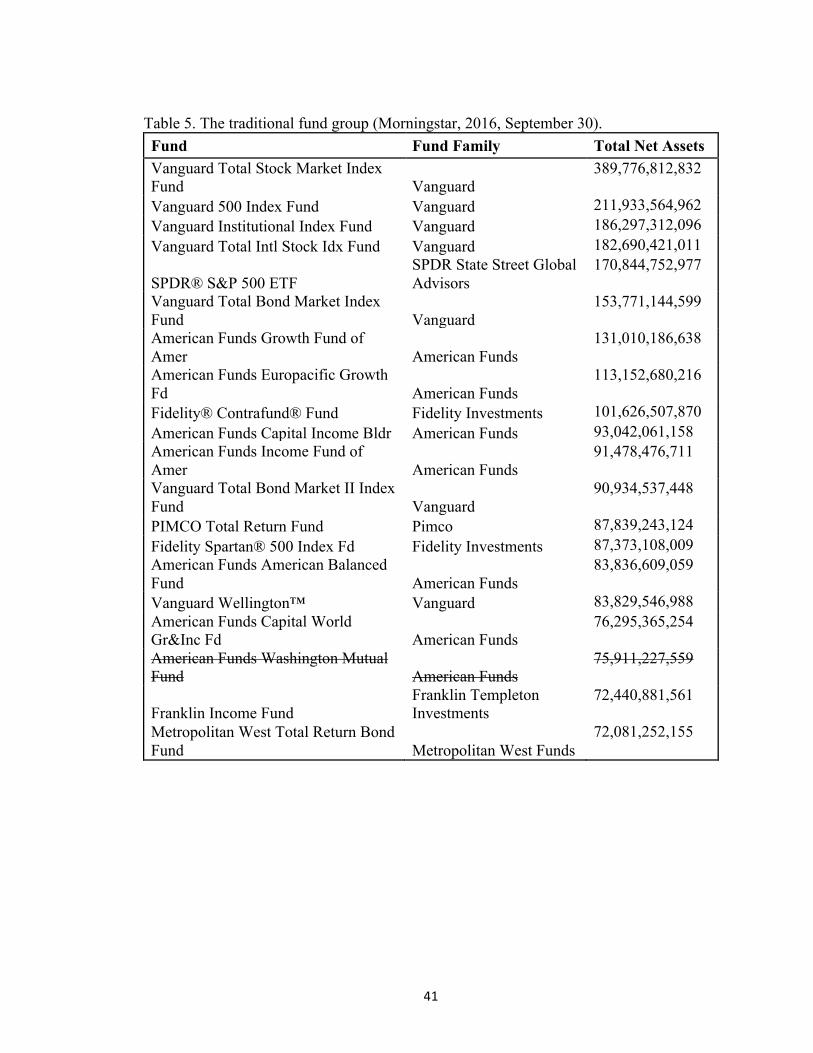
41
Table 5. The traditional fund group (Morningstar, 2016, September 30). Fund Fund Family Total Net Assets Vanguard Total Stock Market Index Fund Vanguard
389,776,812,832
Vanguard 500 Index Fund Vanguard 211,933,564,962 Vanguard Institutional Index Fund Vanguard 186,297,312,096 Vanguard Total Intl Stock Idx Fund Vanguard 182,690,421,011
SPDR® S&P 500 ETF SPDR State Street Global Advisors
170,844,752,977
Vanguard Total Bond Market Index Fund Vanguard
153,771,144,599
American Funds Growth Fund of Amer American Funds
131,010,186,638
American Funds Europacific Growth Fd American Funds
113,152,680,216
Fidelity® Contrafund® Fund Fidelity Investments 101,626,507,870 American Funds Capital Income Bldr American Funds 93,042,061,158 American Funds Income Fund of Amer American Funds
91,478,476,711
Vanguard Total Bond Market II Index Fund Vanguard
90,934,537,448
PIMCO Total Return Fund Pimco 87,839,243,124 Fidelity Spartan® 500 Index Fd Fidelity Investments 87,373,108,009 American Funds American Balanced Fund American Funds
83,836,609,059
Vanguard Wellington™ Vanguard 83,829,546,988 American Funds Capital World Gr&Inc Fd American Funds
76,295,365,254
American Funds Washington Mutual Fund American Funds
75,911,227,559
Franklin Income Fund Franklin Templeton Investments
72,440,881,561
Metropolitan West Total Return Bond Fund Metropolitan West Funds
72,081,252,155
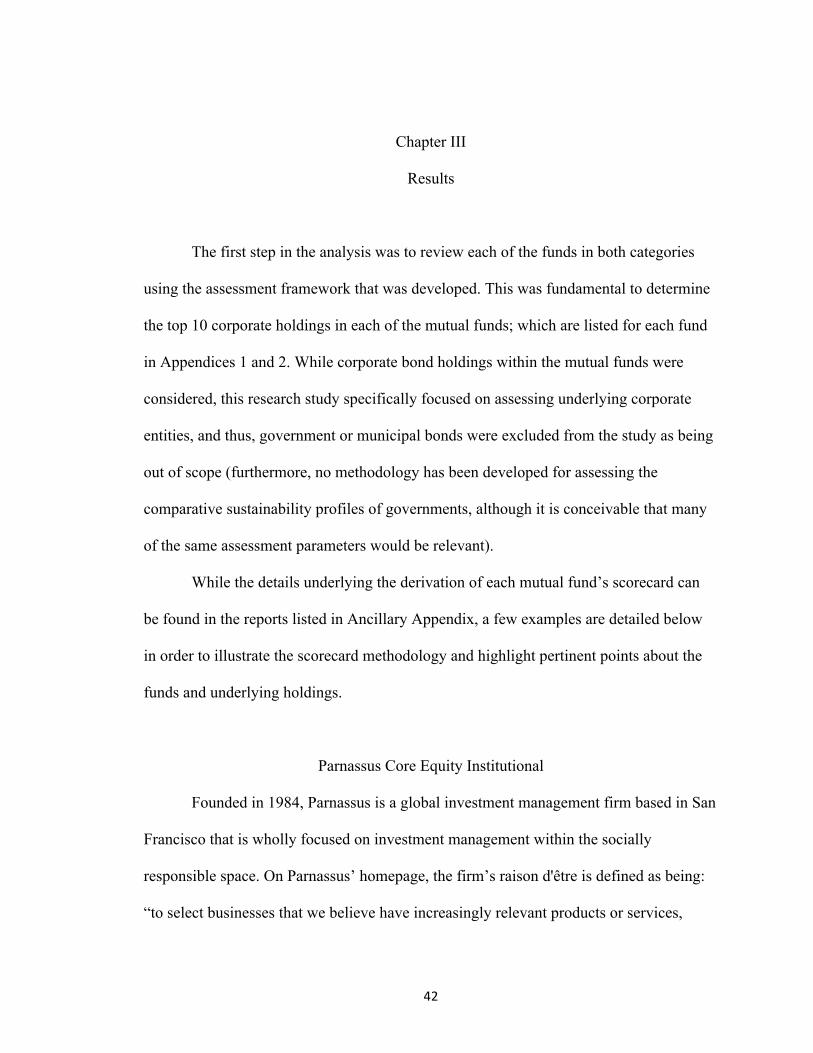
42
Chapter III
Results
The first step in the analysis was to review each of the funds in both categories
using the assessment framework that was developed. This was fundamental to determine
the top 10 corporate holdings in each of the mutual funds; which are listed for each fund
in Appendices 1 and 2. While corporate bond holdings within the mutual funds were
considered, this research study specifically focused on assessing underlying corporate
entities, and thus, government or municipal bonds were excluded from the study as being
out of scope (furthermore, no methodology has been developed for assessing the
comparative sustainability profiles of governments, although it is conceivable that many
of the same assessment parameters would be relevant).
While the details underlying the derivation of each mutual fund’s scorecard can
be found in the reports listed in Ancillary Appendix, a few examples are detailed below
in order to illustrate the scorecard methodology and highlight pertinent points about the
funds and underlying holdings.
Parnassus Core Equity Institutional
Founded in 1984, Parnassus is a global investment management firm based in San
Francisco that is wholly focused on investment management within the socially
responsible space. On Parnassus’ homepage, the firm’s raison d'être is defined as being:
“to select businesses that we believe have increasingly relevant products or services,
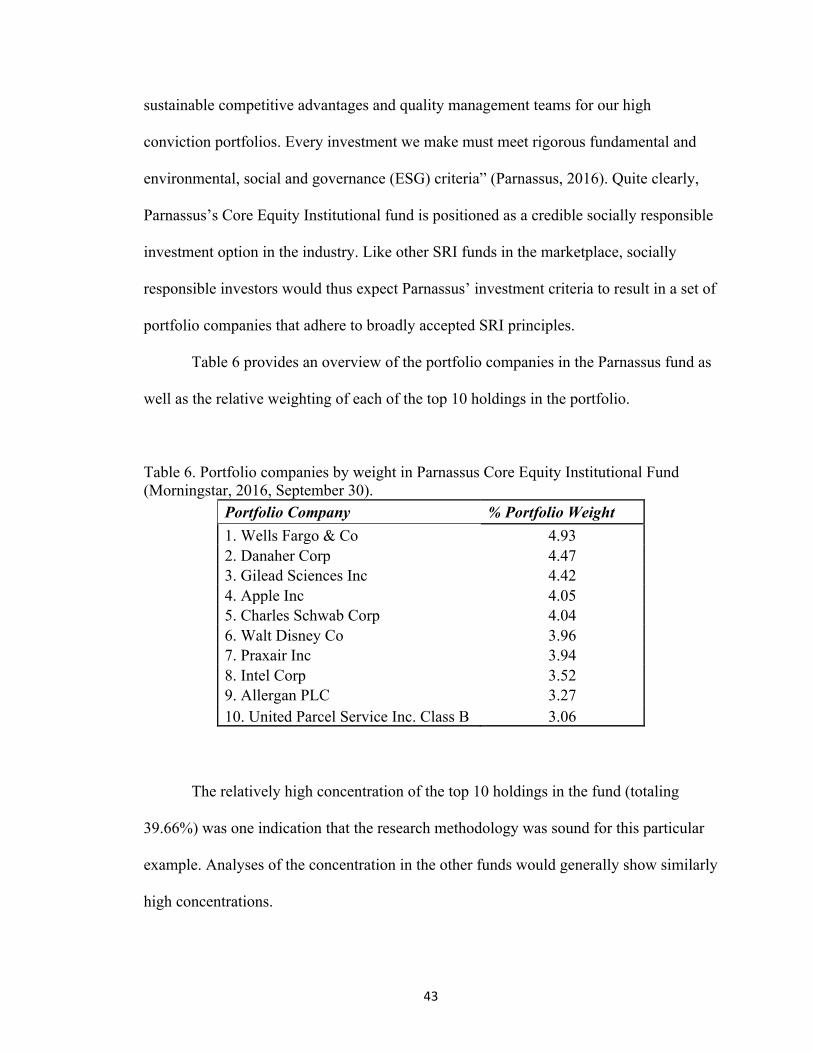
43
sustainable competitive advantages and quality management teams for our high
conviction portfolios. Every investment we make must meet rigorous fundamental and
environmental, social and governance (ESG) criteria” (Parnassus, 2016). Quite clearly,
Parnassus’s Core Equity Institutional fund is positioned as a credible socially responsible
investment option in the industry. Like other SRI funds in the marketplace, socially
responsible investors would thus expect Parnassus’ investment criteria to result in a set of
portfolio companies that adhere to broadly accepted SRI principles.
Table 6 provides an overview of the portfolio companies in the Parnassus fund as
well as the relative weighting of each of the top 10 holdings in the portfolio.
Table 6. Portfolio companies by weight in Parnassus Core Equity Institutional Fund (Morningstar, 2016, September 30).
Portfolio Company % Portfolio Weight 1. Wells Fargo & Co 4.93 2. Danaher Corp 4.47 3. Gilead Sciences Inc 4.42 4. Apple Inc 4.05 5. Charles Schwab Corp 4.04 6. Walt Disney Co 3.96 7. Praxair Inc 3.94 8. Intel Corp 3.52 9. Allergan PLC 3.27 10. United Parcel Service Inc. Class B 3.06
The relatively high concentration of the top 10 holdings in the fund (totaling
39.66%) was one indication that the research methodology was sound for this particular
example. Analyses of the concentration in the other funds would generally show similarly
high concentrations.
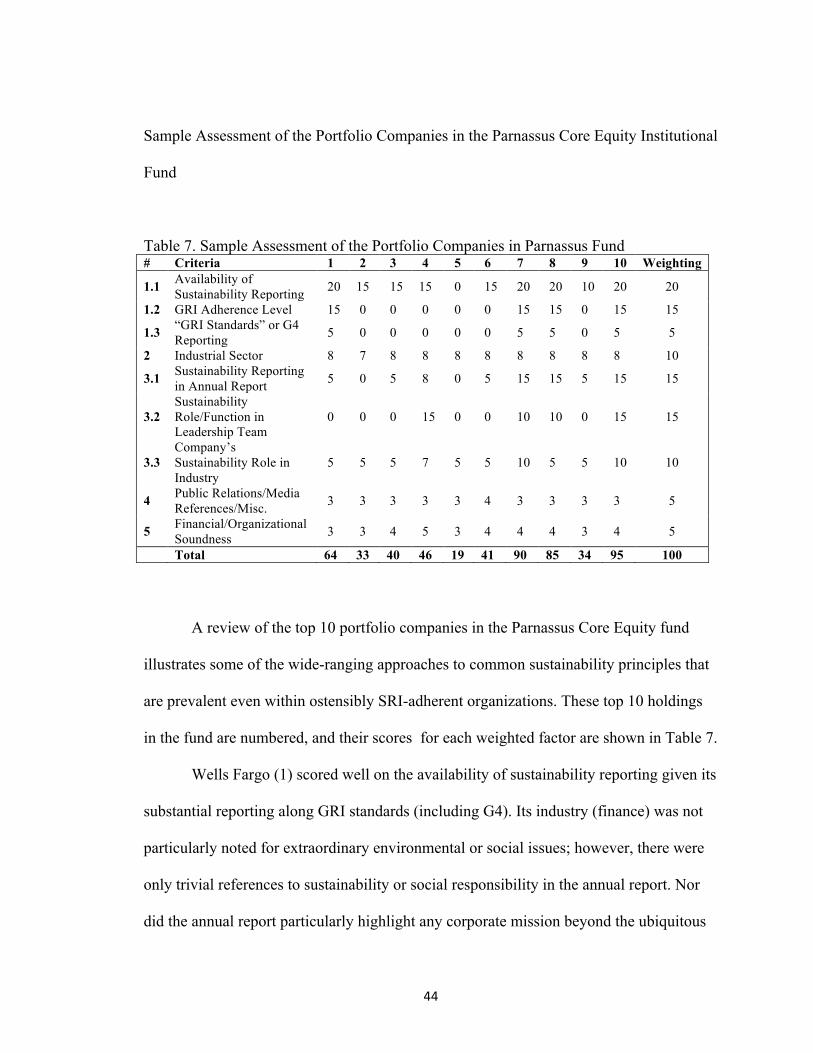
44
Sample Assessment of the Portfolio Companies in the Parnassus Core Equity Institutional
Fund
Table 7. Sample Assessment of the Portfolio Companies in Parnassus Fund # Criteria 1 2 3 4 5 6 7 8 9 10 Weighting
1.1 Availability of Sustainability Reporting 20 15 15 15 0 15 20 20 10 20 20
1.2 GRI Adherence Level 15 0 0 0 0 0 15 15 0 15 15
1.3 “GRI Standards” or G4 Reporting 5 0 0 0 0 0 5 5 0 5 5
2 Industrial Sector 8 7 8 8 8 8 8 8 8 8 10
3.1 Sustainability Reporting in Annual Report 5 0 5 8 0 5 15 15 5 15 15
3.2 Sustainability Role/Function in Leadership Team
0 0 0 15 0 0 10 10 0 15 15
3.3 Company’s Sustainability Role in Industry
5 5 5 7 5 5 10 5 5 10 10
4 Public Relations/Media References/Misc. 3 3 3 3 3 4 3 3 3 3 5
5 Financial/Organizational Soundness 3 3 4 5 3 4 4 4 3 4 5
Total 64 33 40 46 19 41 90 85 34 95 100
A review of the top 10 portfolio companies in the Parnassus Core Equity fund
illustrates some of the wide-ranging approaches to common sustainability principles that
are prevalent even within ostensibly SRI-adherent organizations. These top 10 holdings
in the fund are numbered, and their scores for each weighted factor are shown in Table 7.
Wells Fargo (1) scored well on the availability of sustainability reporting given its
substantial reporting along GRI standards (including G4). Its industry (finance) was not
particularly noted for extraordinary environmental or social issues; however, there were
only trivial references to sustainability or social responsibility in the annual report. Nor
did the annual report particularly highlight any corporate mission beyond the ubiquitous
45
goal of servicing banking needs. Furthermore, no executive at the highest level was
primarily focused on sustainability or social responsibility issues. The organization
belonged to a number of industry groups (along with most other peer banking
institutions) and did not really display any extraordinary leadership on sustainability
issues that would warrant any particular recognition in that respect. Media references
generally seemed to focus on a recent corporate-wide scandal involving bank personnel
being encouraged to fraudulently enroll customers into bank services in which they had
not expressly shown interest or agreed to join. This practice, being clearly unethical, has
resulted in congressional hearings and in the recent (January 2017) departure of the
organization’s chief executive officer. Score: 64.
Danaher Corporation (2) received a score for having a sustainability report, albeit
not one that adhered to any GRI reporting frameworks or standards. As a manufacturer,
there is certainly significant impetus for a robust sustainability program—particularly
given that it even develops some products for the environmental market. Disappointingly,
there was absolutely no sustainability reporting in their annual report, nor was there any
identified senior executive with a sustainability brief. The company’s media profile was
typical of that befitting a Fortune 100 organization with tens of billions of dollars of
revenue, although it had no sustainability leadership profile in the industry. Score: 33.
Gilead Sciences (3) produced a sustainability report but did not conform to any
GRI reporting standards. Being a biopharma organization, it obviously serves a great
purpose with its research and development of important medical treatments; however, its
minimal coverage of sustainability or social responsibility is disappointing. The firm also
46
has no specified senior executive with primary responsibility for sustainability matters,
despite being a leading organization in its field. Score: 40.
Apple (4) is one of the most recognizable organizations on the planet and remains
the largest publicly traded American organization, with a market capitalization of over
$700 billion. Despite its huge public profile (particularly social issues regarding its
supply chain in China), its sustainability reporting is rather suboptimal, as it does not
conform to any recognized standards, such as GRI. While it does provide some overview
of its sustainability approach in the annual report, this is still rather limited, particularly
given the span of its operations. Commendably, though, Apple does have a senior
executive, Lisa Jackson, primarily responsible for sustainability issues. Jackson, who
reports directly to the CEO, Tim Cook, is the vice president in charge of Environment,
Policy and Social Initiatives. She previously served as the administrator of the U.S.
Environmental Protection Agency under President Obama. Score: 46.
Charles Schwab (5) provides no sustainability reporting at all, despite the size of
the enterprise. Furthermore, it had no sustainability-related reporting in its annual report.
Not surprisingly, there is no senior executive with a sustainability brief at Charles
Schwab. The organization has no perceptible profile in the industry as a proponent of any
sustainability issues or causes. Score: 19.
Walt Disney (6) received a score for having a sustainability report; however, its
report does not conform to GRI standards. Its annual report does include some
information on its sustainability approach and performance, but this is also rather limited
in its coverage—particularly given the span of Disney’s operations, which include
disparate businesses with significant environmental and social impacts. Quite
47
surprisingly, the organization still lacks a senior executive primarily focused on
sustainability. Score: 41.
Praxair (7) had an exemplary sustainability report that was not only
comprehensive but also adhered with GRI at the highest level. Furthermore, its annual
report was also very comprehensive in its coverage of Praxair’s sustainability mission,
strategy, and execution. The annual report presented relevant sustainability metrics and
detailed key environmental and social sustainability milestones that had either been
reached or were targets for the coming years. Although Praxair did not have a senior
executive at the highest level primarily focused on sustainability, it still was clearly
recognized as a sustainability leader in its industry. For instance, it was the only U.S.
chemical company that was a member of the Dow Jones Sustainability World Index.
Score: 90.
Intel Corporation (8) not only has comprehensive sustainability reporting that
adheres rigorously to GRI standards, but also provides robust reporting in its annual
report that broadly covers important sustainability goals and results that are pertinent for
investors and other key stakeholders who need to know about the business and its
operations. No identified senior executive is primarily focused on sustainability issues.
Score: 85.
Allergan (9) provides a sustainability report that falls short of GRI standards. Its
annual report also fails to provide much insight into its sustainability responsibilities,
strategy, or results. Unsurprisingly, the company does not have any identified senior
executive primary focused on sustainability issues. There is no significant evidence of
sustainability leadership in the industry. Score: 34.
48
United Parcel Services (UPS) (10) provides exemplary sustainability reporting
which fully adheres with GRI standards. Furthermore, UPS’s annual report also provides
comprehensive and well-structured analysis of the company’s sustainability challenges,
opportunities, and strategy. It lays out some of the approaches that have been taken and
the expected impact from those activities, including its efforts to influence its broad
customer base along with the rest of the industry. As would be expected, given the high
prominence afforded to sustainability within the company, UPS indeed has a senior
executive with primary responsibility for sustainability: Mark Wallace sits on the
management committee and is senior vice president for global engineering and
sustainability. Score: 95.
The Parnassus Fund included a number of portfolio companies that scored highly
when the framework was applied to them; however, the mean score of portfolio
companies in this fund was 55.2, - which may be a somewhat mediocre average score in
terms of the fund’s sustainability profile. Comparisons with the traditional funds would
be further illuminating.
Contrasting with a Sample Traditional Fund
An immediate observation as one reviews the portfolio companies in the
Vanguard Total Stock Market Index Fund is that this traditional fund clearly includes
some of the most-recognized blue-chip organizations in the world.
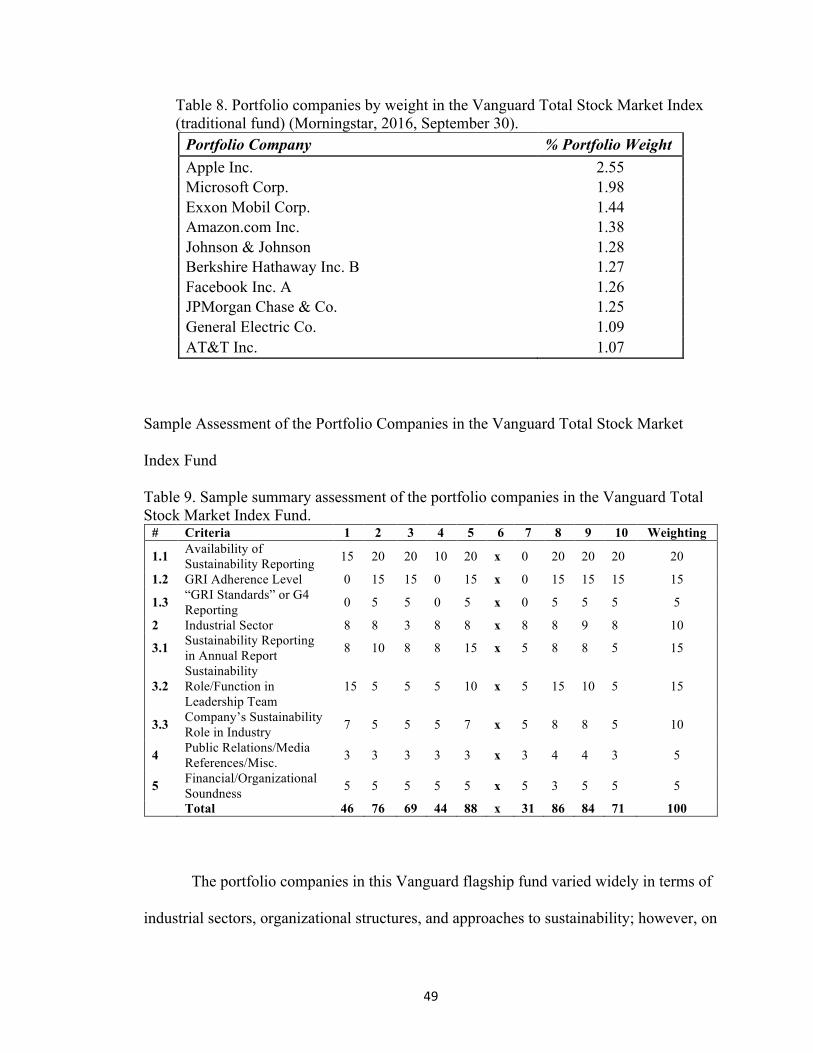
49
Table 8. Portfolio companies by weight in the Vanguard Total Stock Market Index (traditional fund) (Morningstar, 2016, September 30).
Portfolio Company % Portfolio Weight Apple Inc. 2.55 Microsoft Corp. 1.98 Exxon Mobil Corp. 1.44 Amazon.com Inc. 1.38 Johnson & Johnson 1.28 Berkshire Hathaway Inc. B 1.27 Facebook Inc. A 1.26 JPMorgan Chase & Co. 1.25 General Electric Co. 1.09 AT&T Inc. 1.07
Sample Assessment of the Portfolio Companies in the Vanguard Total Stock Market
Index Fund
Table 9. Sample summary assessment of the portfolio companies in the Vanguard Total Stock Market Index Fund.
# Criteria 1 2 3 4 5 6 7 8 9 10 Weighting
1.1 Availability of Sustainability Reporting 15 20 20 10 20 x 0 20 20 20 20
1.2 GRI Adherence Level 0 15 15 0 15 x 0 15 15 15 15
1.3 “GRI Standards” or G4 Reporting 0 5 5 0 5 x 0 5 5 5 5
2 Industrial Sector 8 8 3 8 8 x 8 8 9 8 10
3.1 Sustainability Reporting in Annual Report 8 10 8 8 15 x 5 8 8 5 15
3.2 Sustainability Role/Function in Leadership Team
15 5 5 5 10 x 5 15 10 5 15
3.3 Company’s Sustainability Role in Industry 7 5 5 5 7 x 5 8 8 5 10
4 Public Relations/Media References/Misc. 3 3 3 3 3 x 3 4 4 3 5
5 Financial/Organizational Soundness 5 5 5 5 5 x 5 3 5 5 5
Total 46 76 69 44 88 x 31 86 84 71 100
The portfolio companies in this Vanguard flagship fund varied widely in terms of
industrial sectors, organizational structures, and approaches to sustainability; however, on
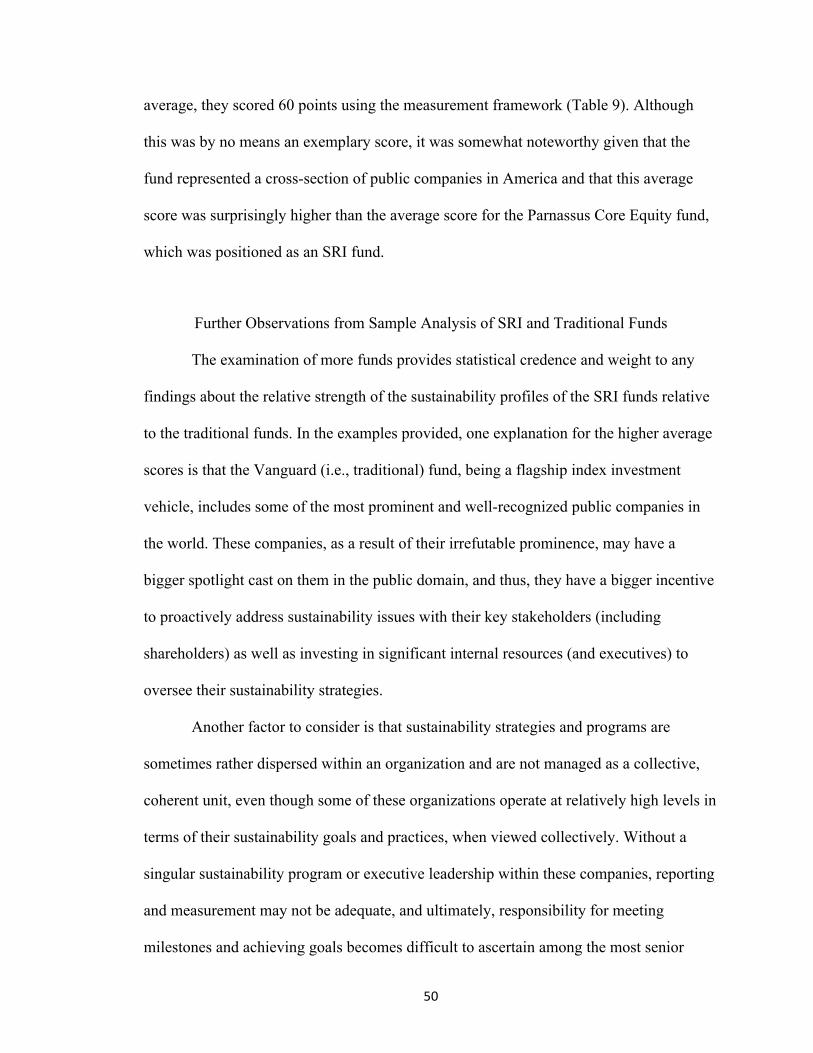
50
average, they scored 60 points using the measurement framework (Table 9). Although
this was by no means an exemplary score, it was somewhat noteworthy given that the
fund represented a cross-section of public companies in America and that this average
score was surprisingly higher than the average score for the Parnassus Core Equity fund,
which was positioned as an SRI fund.
Further Observations from Sample Analysis of SRI and Traditional Funds
The examination of more funds provides statistical credence and weight to any
findings about the relative strength of the sustainability profiles of the SRI funds relative
to the traditional funds. In the examples provided, one explanation for the higher average
scores is that the Vanguard (i.e., traditional) fund, being a flagship index investment
vehicle, includes some of the most prominent and well-recognized public companies in
the world. These companies, as a result of their irrefutable prominence, may have a
bigger spotlight cast on them in the public domain, and thus, they have a bigger incentive
to proactively address sustainability issues with their key stakeholders (including
shareholders) as well as investing in significant internal resources (and executives) to
oversee their sustainability strategies.
Another factor to consider is that sustainability strategies and programs are
sometimes rather dispersed within an organization and are not managed as a collective,
coherent unit, even though some of these organizations operate at relatively high levels in
terms of their sustainability goals and practices, when viewed collectively. Without a
singular sustainability program or executive leadership within these companies, reporting
and measurement may not be adequate, and ultimately, responsibility for meeting
milestones and achieving goals becomes difficult to ascertain among the most senior
51
executive team. ExxonMobil and Facebook (which scored 46 and 31 points, respectively)
are two examples of companies that undoubtedly must have sustainability initiatives that
are not as readily identifiable due to the fact that no executives at the very highest levels
of the organization have been assigned to primarily lead sustainability initiatives (such as
at United Parcel Services and at Apple) and also because of the dispersed nature of
sustainability initiatives across the organization (which may also be directly related to the
lack of a primary senior executive leader overseeing the domain). For instance, these
executives may:
factor in the interests and views of multiple stakeholders and typically exceed the legal requirements when it comes to employment practices, product safety, and the natural environment. However laudable these efforts may be, they are typically conceived of and managed as matters of compliance, philanthropy, stakeholder relations, or operational improvement. (Googins, 2007)
Further analysis of the two pools of traditional and SRI funds (along with the
accompanying data) is included in the Ancillary Appendix; however, comprehensive
analysis of the two sets of fund groups follows here.
Review of SRI Funds Group
A review of the socially responsible funds and their respective portfolios showed
some significant variation in the approaches that socially responsible fund managers have
taken to meeting their SRI mandates. The following were some notable observations
regarding the SRI fund group:
i. Some companies that are not particularly noted for their SRI credentials happen to
be cornerstones of the SRI fund industry. For instance, Alphabet (the parent company of
Google) is part of half of the funds in the SRI group despite not being particularly noted
52
in the industry for its sustainability credentials relative to its peers. It is especially
noteworthy that Alphabet appears to be more popular in the SRI fund group than it is in
traditional fund group. However, it is also important to note that the company scored 64
using the framework developed for this research—a score somewhat higher than the
61.39 average for the SRI fund group. Other companies with surprising popularity in the
SRI group include Microsoft and Apple. However, unlike Alphabet, Microsoft was more
popular in the traditional group, while Apple was featured exactly the same number of
times in SRI funds as it did in traditional funds (see Tab 8 in Excel file).
ii. Some companies in industries typically plagued by environmental concerns still
managed to be selected as SRI fund portfolio companies. For instance, Occidental
Petroleum Company and Total SA are portfolio companies for two distinct SRI funds
despite not being in any of the funds in the traditional group. ExxonMobil and Chevron,
however, were the two most popular companies from the petrochemicals industry in the
traditional fund group. Both of these companies were also portfolio companies for two
other SRI funds. Save for a handful of noted exceptions, the SRI funds typically seemed
to avoid the petrochemicals industry in general: “Firms that extract natural resources,
such as oil and timber companies, are monitored closely by NGOs and find themselves
more exposed on their environmental performance. Risk management criteria naturally
dictate that they give greater attention to environmental safeguards” (Googins, 2007).
iii. Many SRI fund managers appear to be rather willing to take some companies’
sustainability claims at their word (in the absence of independent assessments and
standardized reporting). One notable example of this is clearly Alphabet (Google’s parent
company), which still does not abide by GRI frameworks although it produces its own
53
fairly comprehensive sustainability report. The two Ariel SRI funds reviewed in this
research (i.e., Appreciation Investor and Fund Investor) also included myriad portfolio
companies that had absolutely no adherence to GRI or any broadly recognized reporting
standard. Notably, of the top 20 companies (by portfolio weight), in these two Ariel
funds, only three portfolio companies actually reported their sustainability performance
with adherence to any notable standard. It may therefore be important to particularly
examine the process by which Ariel is able to effectively determine the SRI qualifications
of its portfolio companies in accordance with its own well-touted SRI investment
philosophy. One may even ask—if Ariel is willing to look past companies’ inability or
unwillingness to use broadly recognized reporting standards for sustainability, would it
do the same for financial or accounting standards if they were not required by the
Securities and Exchange Commission?
iv. A comparison of two financial companies’ inclusion (or lack thereof) in SRI
funds also provided some interesting perspective on how attitudes and assessments to
these companies’ profiles may change with time. For example, J.P. Morgan was
overwhelmingly more popular in the reviewed traditional funds than in the reviewed SRI
funds (perhaps owing to some reputational damage stemming from its involvement in a
widely reported LIBOR rate-fixing scheme, for which it was heavily fined. While J.P.
Morgan was featured in nine of the selected traditional funds, only one SRI fund deemed
it worthy of being a portfolio company. Meanwhile, Wells Fargo was selected as a
portfolio company by three SRI funds as well as by four traditional funds. However, it is
important to recognize that Wells Fargo’s recent public fiasco, in which it was found to
have systematically and unethically opened and operated thousands of accounts without
54
the express permission of the customers, has probably not been reflected in fund
selections, which sometimes lag behind significant issues or may even completely
overlook them when they are not considered substantial enough.
v. Some companies have truly become SRI stars and have garnered reputations
befitting their sustainability strengths relative to their peers. However, despite being well-
known brands with strong financial performance, these companies overwhelmingly
appear in the reviewed SRI funds rather than in the traditional funds (for instance, Visa,
which was featured in four SRI funds compared to just one traditional fund, or PepsiCo,
which was featured in four SRI funds but not in any traditional fund, as well as
Qualcomm, which similarly was not featured in any traditional fund, but was a portfolio
company in three SRI funds). It is probable that these organizations’ sustainability
strengths are still not being adequately recognized by traditional fund managers as
fundamental for continued success and are thus entirely missing the essence of corporate
sustainability.
Review of Traditional Funds Group
Traditional fund managers obviously have a greater flexibility to achieve their
fund mandates that SRI managers; however, it is also probable that some of them still
approach their portfolio selection process with a certain sustainability awareness or
sensitivity, even if that is not explicitly part of their respective mandates (particularly in a
post-Deepwater Horizon oil spill era). The following are some notable observations
regarding the traditional fund group from this research:
i. Despite having a broader pool of portfolio companies relative to the SRI fund
group, the traditional funds are more highly concentrated in the Fortune 100 companies
55
(which is likely due to the increasing prevalence of index funds, which generally follow
the same index and thus invest in almost identical manners). Of these index funds, the
largest (and the largest mutual fund in the world) is Vanguard’s Total Stock Market Index
fund, whose portfolio companies generally tended to be the most prevalent across the
reviewed traditional funds (including companies such as Apple, Microsoft, ExxonMobil,
Facebook, Johnson & Johnson, General Electric, and JP Morgan Chase, among others).
ii. As expected, certain industries were predominantly represented in one fund group
or the other, with petrochemicals being understandably more prevalent in the traditional
group than in the SRI group; however, it is still noteworthy that pharmaceutical and
biotechnology companies appeared to be more prevalent in the SRI funds than in
traditional funds. Bio-pharma industry leaders such as Allergan and Gilead were barely
represented in the traditional group, while being part of multiple SRI fund groups. For
traditional fund managers, it appears that there is significant tendency to align with
certain indexes, even at the expense of missing out on well-regarded industry leaders that
are not part of these indexes. This further indicates the possibility of SRI funds being
possible vehicles for diversification from traditional funds; however, that is outside the
scope of this research.
iii. The traditional funds reviewed included a few “actively managed” funds
(specifically, American Funds Growth Fund, American Funds EuroPacific Fund, and
Fidelity Contrafund) which (with the exception of the EuroPacific fund) tended to skew
very closely to the most prominent index funds (e.g., Vanguard Total Stock Market
Index) in the makeup of their portfolio companies. And clearly, the managers of these
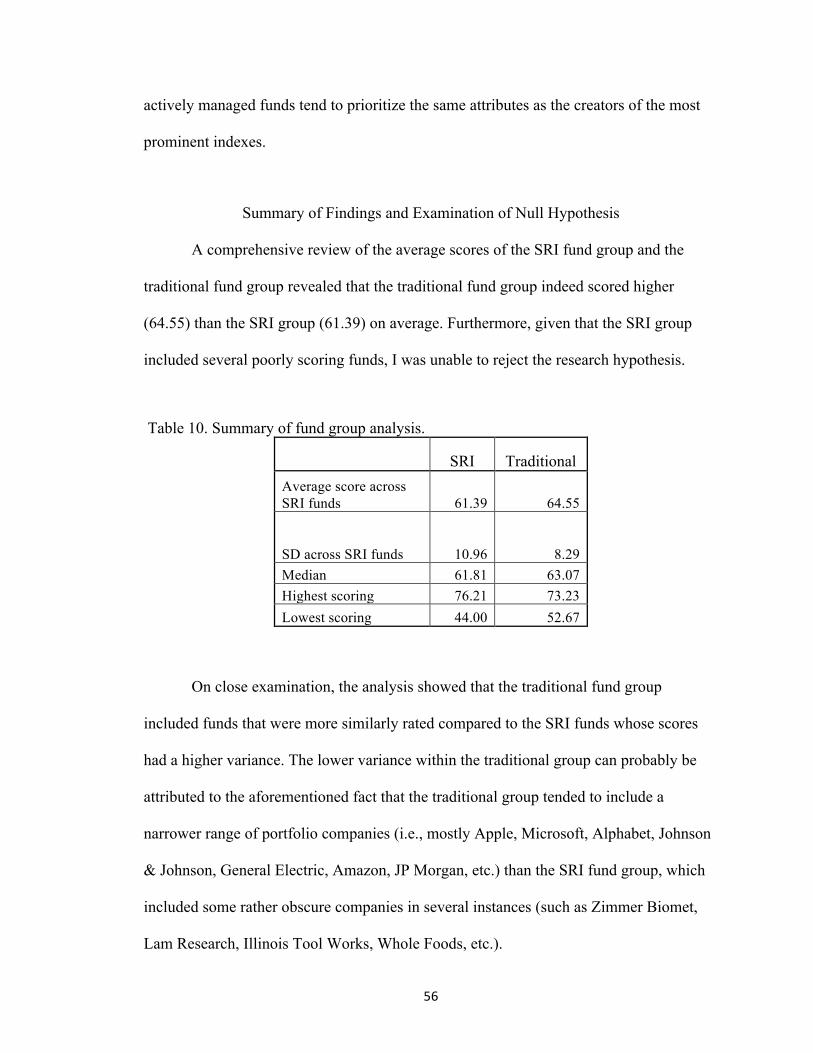
56
actively managed funds tend to prioritize the same attributes as the creators of the most
prominent indexes.
Summary of Findings and Examination of Null Hypothesis
A comprehensive review of the average scores of the SRI fund group and the
traditional fund group revealed that the traditional fund group indeed scored higher
(64.55) than the SRI group (61.39) on average. Furthermore, given that the SRI group
included several poorly scoring funds, I was unable to reject the research hypothesis.
Table 10. Summary of fund group analysis.
SRI Traditional Average score across SRI funds 61.39 64.55
SD across SRI funds 10.96 8.29 Median 61.81 63.07 Highest scoring 76.21 73.23 Lowest scoring 44.00 52.67
On close examination, the analysis showed that the traditional fund group
included funds that were more similarly rated compared to the SRI funds whose scores
had a higher variance. The lower variance within the traditional group can probably be
attributed to the aforementioned fact that the traditional group tended to include a
narrower range of portfolio companies (i.e., mostly Apple, Microsoft, Alphabet, Johnson
& Johnson, General Electric, Amazon, JP Morgan, etc.) than the SRI fund group, which
included some rather obscure companies in several instances (such as Zimmer Biomet,
Lam Research, Illinois Tool Works, Whole Foods, etc.).
57
In particular, the results also showed significant differences in how SRI managers
approached their investment mandates. For instance, while the TIAA and Neubeger funds
scored in the mid 70s on average, the two Ariel funds scored an average of 44 points
(largely due to their inclusion of holdings with no available sustainability reporting and
hence scored lowly). In essence, investors who are interested in socially responsible
investments may find opportunities to meet their investment objectives through some of
these leading SRI funds; however, given the vast difference in the manner in which these
funds approach their mandates, such investors may be better served by focusing on those
funds whose investment methodologies involve the use of broadly accepted sustainability
reporting in their criteria. Unsurprisingly, the leading SRI funds (in this research) scored
higher (76.2) than the highest-scoring traditional fund (73.2), even though the SRI group
lagged behind the traditional group in aggregate, hence highlighting the need to be
particularly fastidious as an SRI investor when selecting among mutual fund investment
options.
58
Chapter IV
Discussion
This research study focused on a comparative assessment of two rather distinct
mutual fund groups (albeit with some common holdings). Through the specific
assessment of each of the holdings in the two groups, it was possible to determine that the
traditional group was as likely as SRI mutual funds to include holdings with sustainable
attributes. This finding ultimately undercuts the premise of SRI funds- a claim that
investors seeking to invest in companies with markedly sustainable attributes can do so
with SRI funds in lieu of traditional mutual funds.
Although the findings were somewhat consistent with the hypothesis going into
the study, there were a few other notable observations from this study. For instance, it
became increasingly clear that some of the larger organizations tended to perform better
than the smaller ones based on the scoring approach that I used. However, this was
certainly not universal, as companies such as Google and Alphabet did not perform as
well as some of the smaller companies in their industry. This is understandable, as larger
entities can more readily afford some of the overhead required with establishing stronger
sustainability programs.
Furthermore, some companies may also be reluctant to aggressively tout their
sustainability credentials as publicly as others do (and hence may have scored lower than
they otherwise would have scored). The rationale for this reticence is often linked to a
fear of being accused of greenwashing: “Greenwashing is certainly still a danger and
59
companies continue to wrestle with the balance of transparency versus backlash should
their information be overstated” (Farver, 2015).
Overall, this study certainly illuminated some of the challenges posed by fund
managers in determining how to position their funds and some of the underlying
difficulties in trying to assess whether one company is more sustainable than another. In
particular, the study exposed the value of standardized sustainability reporting
frameworks that enable greater comparability between companies—particularly those in
different industries. Ultimately, SRI funds serve a valuable purpose and have a promising
future, but fund managers are best advised to be transparent about their processes and to
ensure that their portfolio companies, in turn, are also very transparent about their
sustainability-related activities, infrastructure, and results.
Research Limitations
This study had a certain limitation which was made clear in the research design
phase: Given that some funds can contain dozens of different stocks, it would be
particularly challenging to evaluate each fund in its entirety. However, reviewing only the
top 10 stocks in each fund (as was the approach of this study) may leave out important
investments. Regardless, this research approach remains quite defensible as a measured
and fair aspect of the overall research methodology, given the logistical challenges of
potentially scrutinizing thousands of companies as an alternative and the top-heavy
investing approach that is commonly deployed by fund managers, in which certain
holdings tend to dominate each fund.
60
Furthermore, it is important to note that in the interest of research expediency,
only the top 10 portfolio holdings for each of the 10 SRI and 10 traditional funds were
examined. I anticipate that due to the concentration of mutual fund holdings, limiting the
scope in such a way did not impact the ultimate findings of the study.
Conclusions
This research study achieved two significant goals. First, it provided a fact-driven
appraisal of whether the most prominent socially responsible funds in the industry are
generally following their SRI mandates. Second, it introduced a framework for the
assessment of these funds from a sustainability perspective going forward. The study
conclusively determined that SRI mutual funds are not necessarily a more effective
solution for investors with socially responsible investing inclinations. This conclusion is
based on the fact that SRI fund holdings were not shown to be any more socially
responsible than holdings in traditional funds.
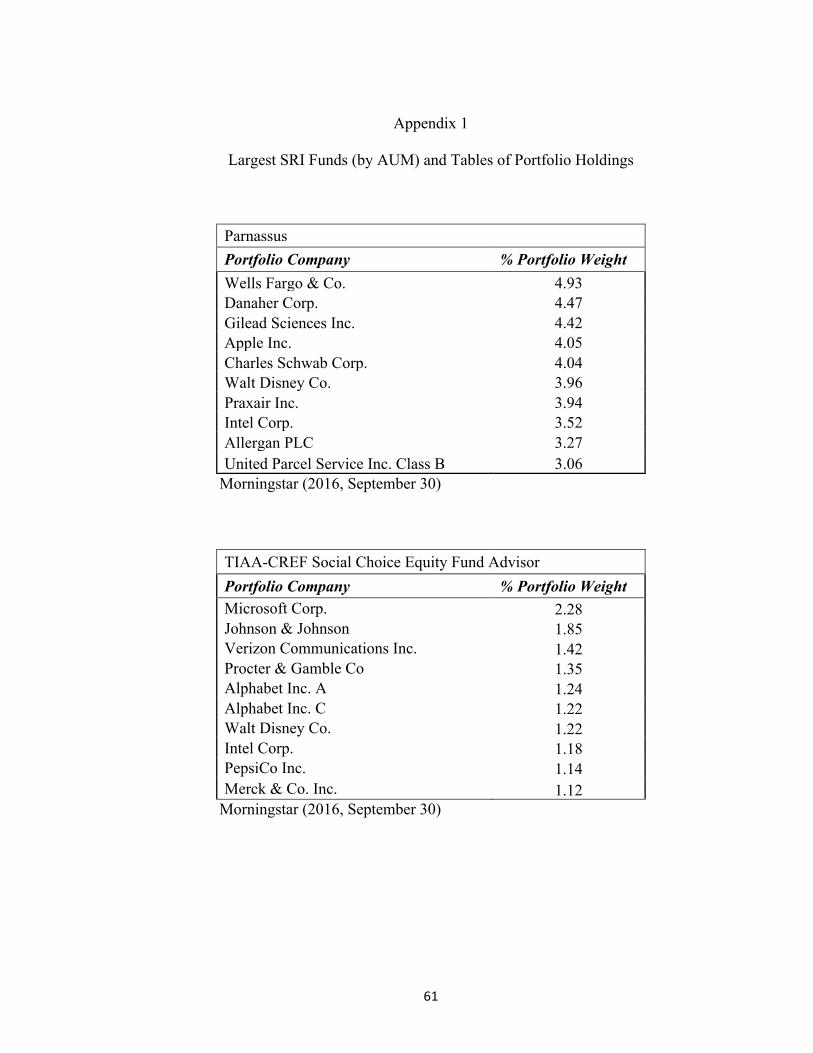
61
Appendix 1
Largest SRI Funds (by AUM) and Tables of Portfolio Holdings
Parnassus Portfolio Company % Portfolio Weight Wells Fargo & Co. 4.93 Danaher Corp. 4.47 Gilead Sciences Inc. 4.42 Apple Inc. 4.05 Charles Schwab Corp. 4.04 Walt Disney Co. 3.96 Praxair Inc. 3.94 Intel Corp. 3.52 Allergan PLC 3.27 United Parcel Service Inc. Class B 3.06
Morningstar (2016, September 30)
TIAA-CREF Social Choice Equity Fund Advisor Portfolio Company % Portfolio Weight Microsoft Corp. 2.28 Johnson & Johnson 1.85 Verizon Communications Inc. 1.42 Procter & Gamble Co 1.35 Alphabet Inc. A 1.24 Alphabet Inc. C 1.22 Walt Disney Co. 1.22 Intel Corp. 1.18 PepsiCo Inc. 1.14 Merck & Co. Inc. 1.12
Morningstar (2016, September 30)
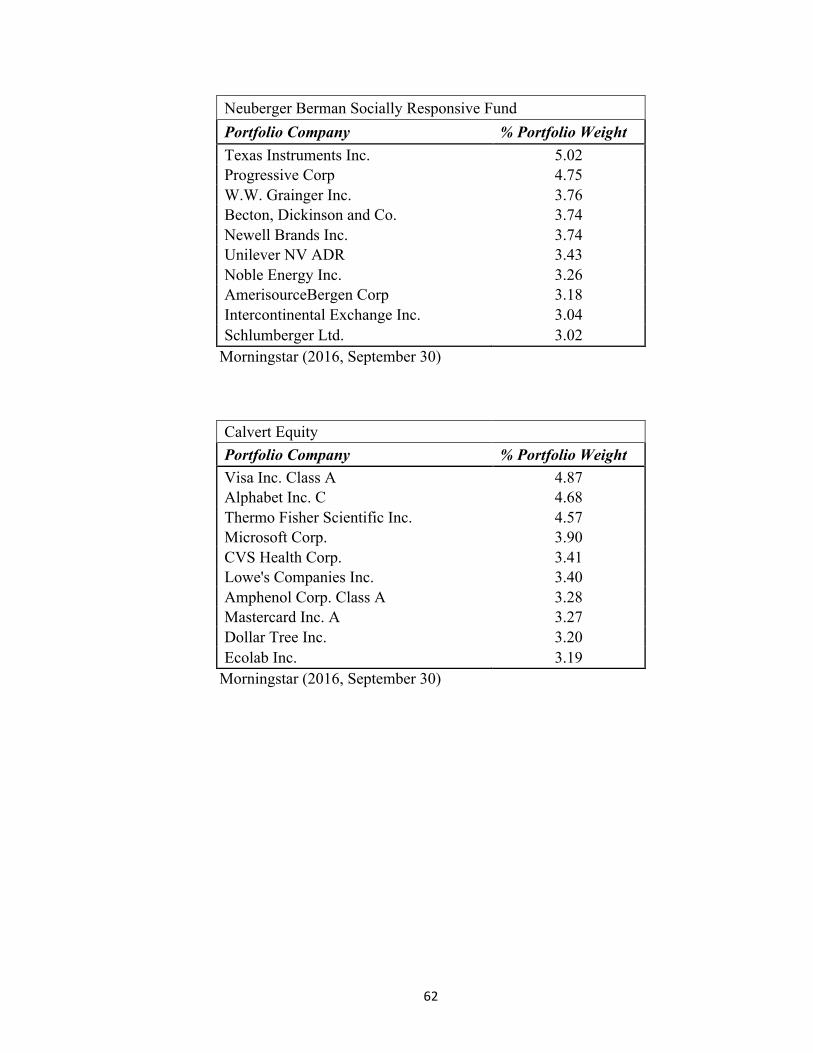
62
Neuberger Berman Socially Responsive Fund Portfolio Company % Portfolio Weight Texas Instruments Inc. 5.02 Progressive Corp 4.75 W.W. Grainger Inc. 3.76 Becton, Dickinson and Co. 3.74 Newell Brands Inc. 3.74 Unilever NV ADR 3.43 Noble Energy Inc. 3.26 AmerisourceBergen Corp 3.18 Intercontinental Exchange Inc. 3.04 Schlumberger Ltd. 3.02
Morningstar (2016, September 30)
Calvert Equity Portfolio Company % Portfolio Weight
Visa Inc. Class A 4.87 Alphabet Inc. C 4.68 Thermo Fisher Scientific Inc. 4.57 Microsoft Corp. 3.90 CVS Health Corp. 3.41 Lowe's Companies Inc. 3.40 Amphenol Corp. Class A 3.28 Mastercard Inc. A 3.27 Dollar Tree Inc. 3.20 Ecolab Inc. 3.19
Morningstar (2016, September 30)
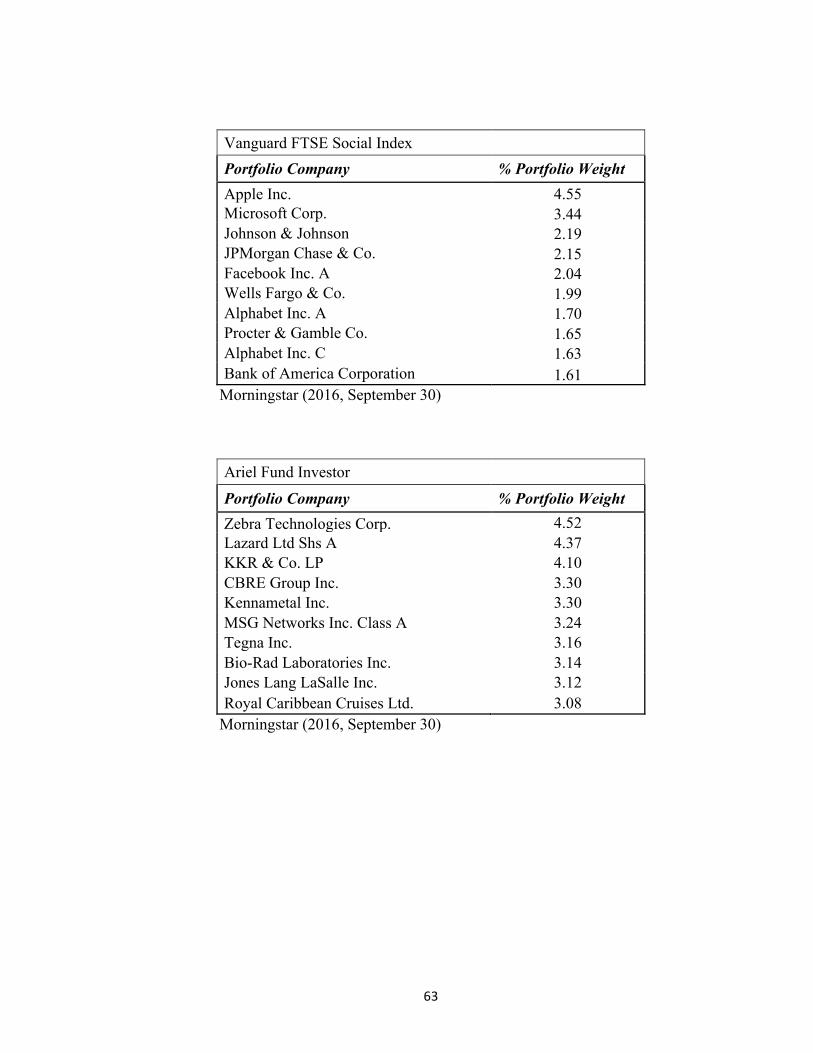
63
Vanguard FTSE Social Index Portfolio Company % Portfolio Weight
Apple Inc. 4.55 Microsoft Corp. 3.44 Johnson & Johnson 2.19 JPMorgan Chase & Co. 2.15 Facebook Inc. A 2.04 Wells Fargo & Co. 1.99 Alphabet Inc. A 1.70 Procter & Gamble Co. 1.65 Alphabet Inc. C 1.63 Bank of America Corporation 1.61
Morningstar (2016, September 30)
Ariel Fund Investor Portfolio Company % Portfolio Weight
Zebra Technologies Corp. 4.52 Lazard Ltd Shs A 4.37 KKR & Co. LP 4.10 CBRE Group Inc. 3.30 Kennametal Inc. 3.30 MSG Networks Inc. Class A 3.24 Tegna Inc. 3.16 Bio-Rad Laboratories Inc. 3.14 Jones Lang LaSalle Inc. 3.12 Royal Caribbean Cruises Ltd. 3.08
Morningstar (2016, September 30)
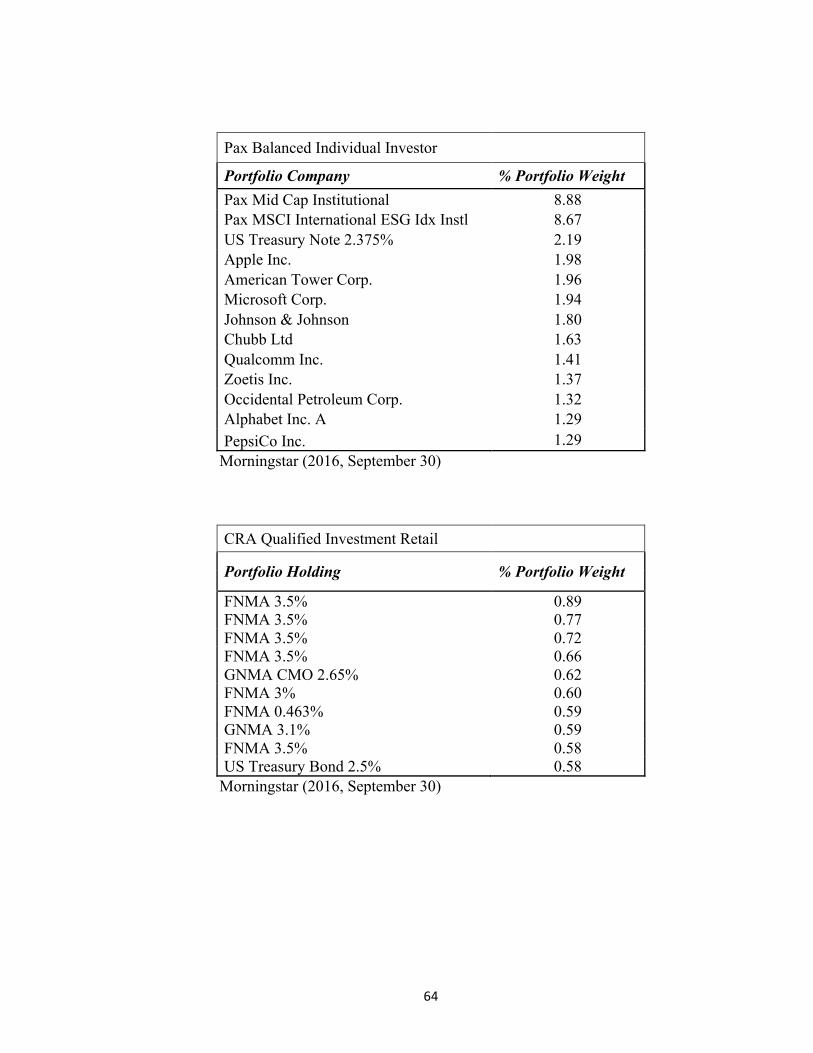
64
Pax Balanced Individual Investor Portfolio Company % Portfolio Weight Pax Mid Cap Institutional 8.88 Pax MSCI International ESG Idx Instl 8.67 US Treasury Note 2.375% 2.19 Apple Inc. 1.98 American Tower Corp. 1.96 Microsoft Corp. 1.94 Johnson & Johnson 1.80 Chubb Ltd 1.63 Qualcomm Inc. 1.41 Zoetis Inc. 1.37 Occidental Petroleum Corp. 1.32 Alphabet Inc. A 1.29 PepsiCo Inc. 1.29
Morningstar (2016, September 30)
CRA Qualified Investment Retail Portfolio Holding % Portfolio Weight
FNMA 3.5% 0.89 FNMA 3.5% 0.77 FNMA 3.5% 0.72 FNMA 3.5% 0.66 GNMA CMO 2.65% 0.62 FNMA 3% 0.60 FNMA 0.463% 0.59 GNMA 3.1% 0.59 FNMA 3.5% 0.58 US Treasury Bond 2.5% 0.58
Morningstar (2016, September 30)
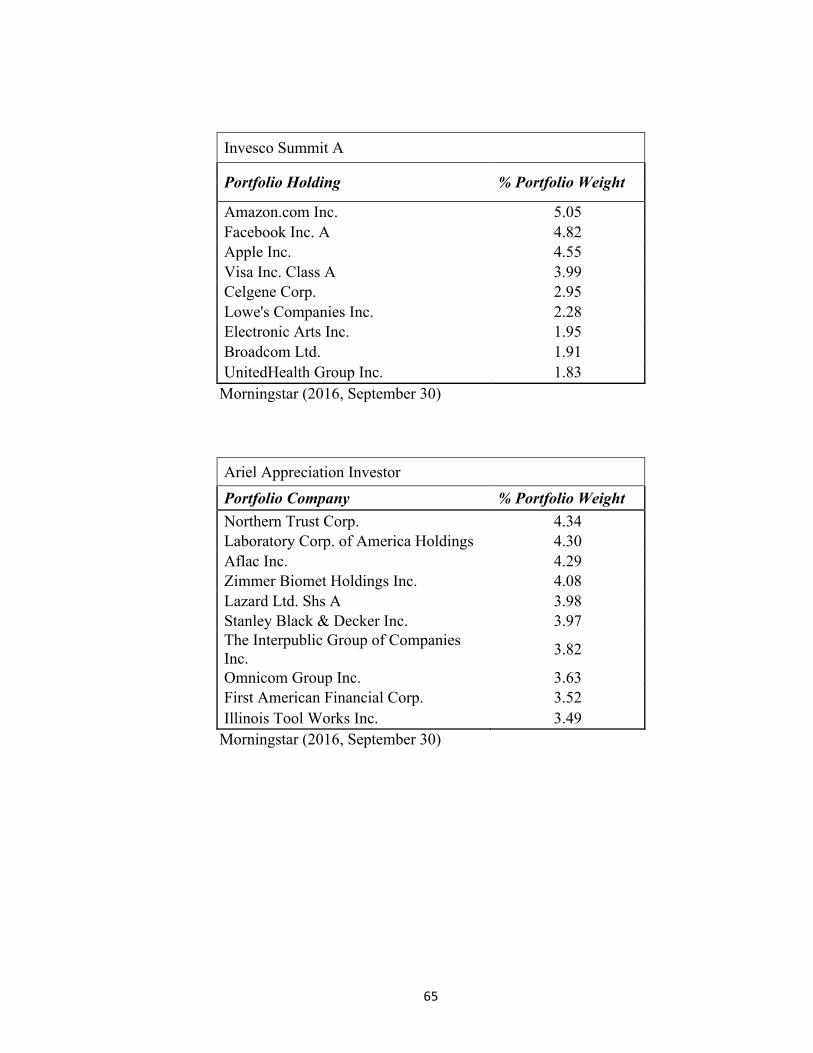
65
Invesco Summit A Portfolio Holding % Portfolio Weight
Amazon.com Inc. 5.05 Facebook Inc. A 4.82 Apple Inc. 4.55 Visa Inc. Class A 3.99 Celgene Corp. 2.95 Lowe's Companies Inc. 2.28 Electronic Arts Inc. 1.95 Broadcom Ltd. 1.91 UnitedHealth Group Inc. 1.83
Morningstar (2016, September 30)
Ariel Appreciation Investor Portfolio Company % Portfolio Weight
Northern Trust Corp. 4.34 Laboratory Corp. of America Holdings 4.30 Aflac Inc. 4.29 Zimmer Biomet Holdings Inc. 4.08 Lazard Ltd. Shs A 3.98 Stanley Black & Decker Inc. 3.97 The Interpublic Group of Companies Inc. 3.82
Omnicom Group Inc. 3.63 First American Financial Corp. 3.52 Illinois Tool Works Inc. 3.49
Morningstar (2016, September 30)
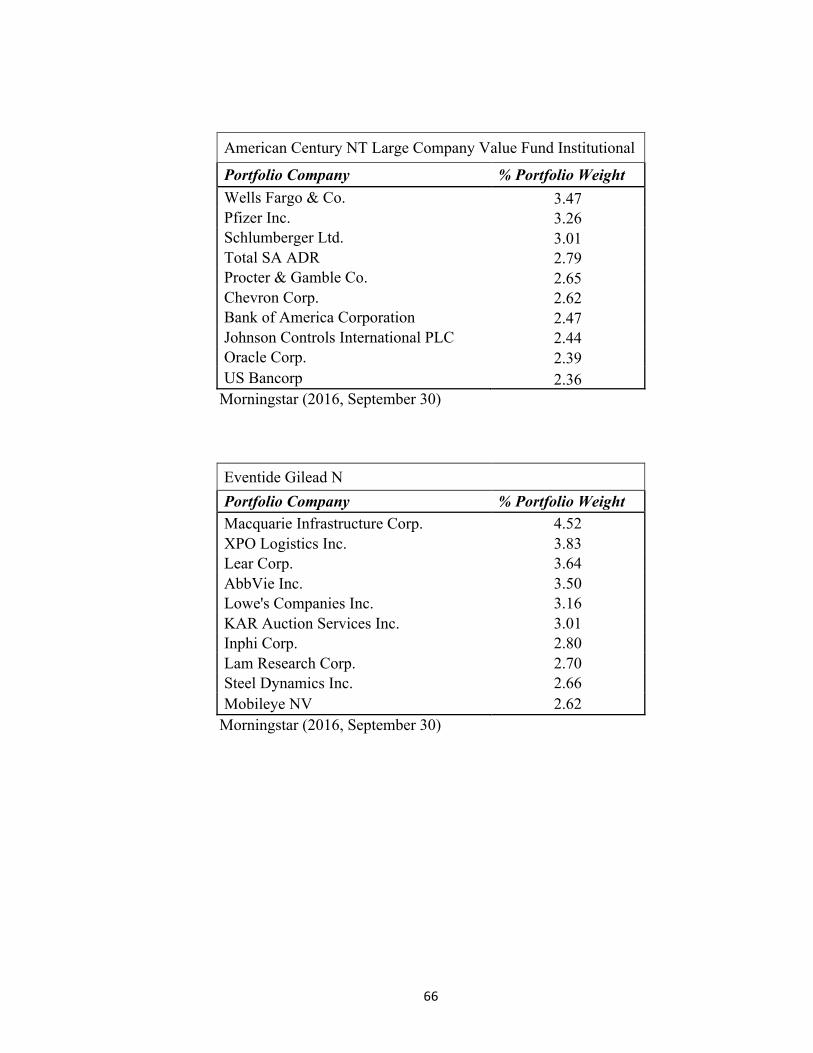
66
American Century NT Large Company Value Fund Institutional
Portfolio Company % Portfolio Weight Wells Fargo & Co. 3.47 Pfizer Inc. 3.26 Schlumberger Ltd. 3.01 Total SA ADR 2.79 Procter & Gamble Co. 2.65 Chevron Corp. 2.62 Bank of America Corporation 2.47 Johnson Controls International PLC 2.44 Oracle Corp. 2.39 US Bancorp 2.36
Morningstar (2016, September 30)
Eventide Gilead N Portfolio Company % Portfolio Weight
Macquarie Infrastructure Corp. 4.52 XPO Logistics Inc. 3.83 Lear Corp. 3.64 AbbVie Inc. 3.50 Lowe's Companies Inc. 3.16 KAR Auction Services Inc. 3.01 Inphi Corp. 2.80 Lam Research Corp. 2.70 Steel Dynamics Inc. 2.66 Mobileye NV 2.62
Morningstar (2016, September 30)
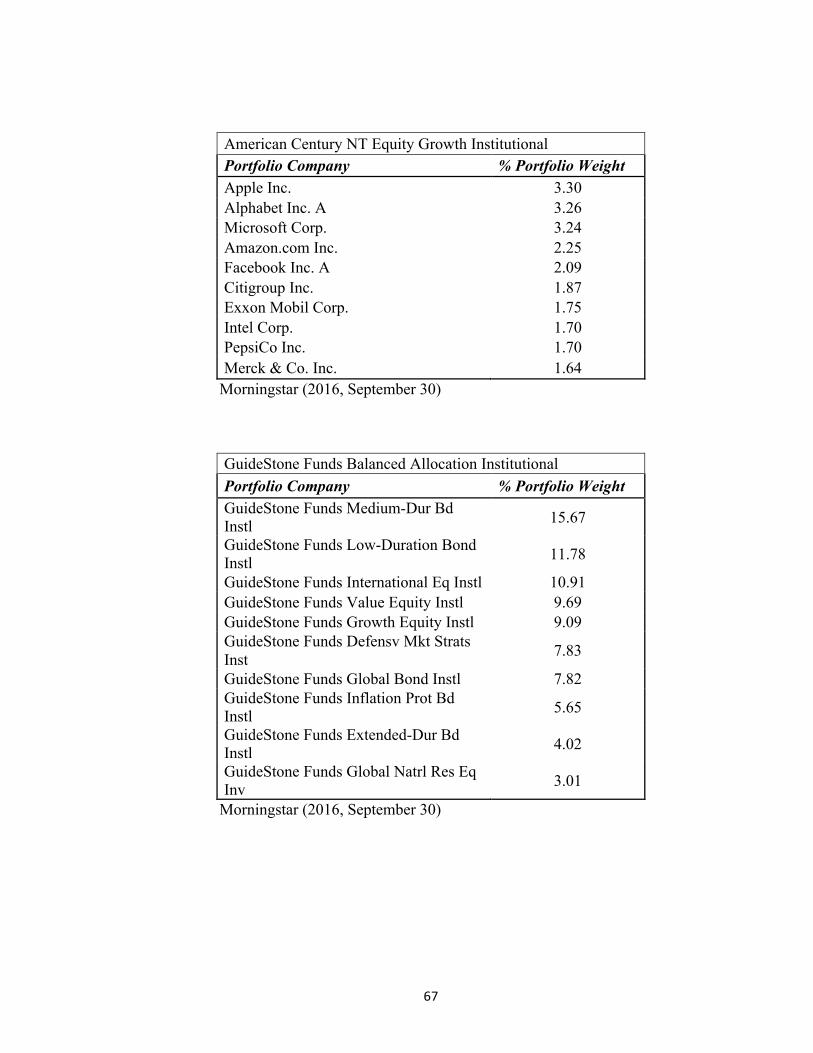
67
American Century NT Equity Growth Institutional Portfolio Company % Portfolio Weight Apple Inc. 3.30 Alphabet Inc. A 3.26 Microsoft Corp. 3.24 Amazon.com Inc. 2.25 Facebook Inc. A 2.09 Citigroup Inc. 1.87 Exxon Mobil Corp. 1.75 Intel Corp. 1.70 PepsiCo Inc. 1.70 Merck & Co. Inc. 1.64
Morningstar (2016, September 30)
GuideStone Funds Balanced Allocation Institutional Portfolio Company % Portfolio Weight GuideStone Funds Medium-Dur Bd Instl
15.67
GuideStone Funds Low-Duration Bond Instl 11.78
GuideStone Funds International Eq Instl 10.91 GuideStone Funds Value Equity Instl 9.69 GuideStone Funds Growth Equity Instl 9.09 GuideStone Funds Defensv Mkt Strats Inst 7.83
GuideStone Funds Global Bond Instl 7.82 GuideStone Funds Inflation Prot Bd Instl 5.65
GuideStone Funds Extended-Dur Bd Instl 4.02
GuideStone Funds Global Natrl Res Eq Inv 3.01
Morningstar (2016, September 30)
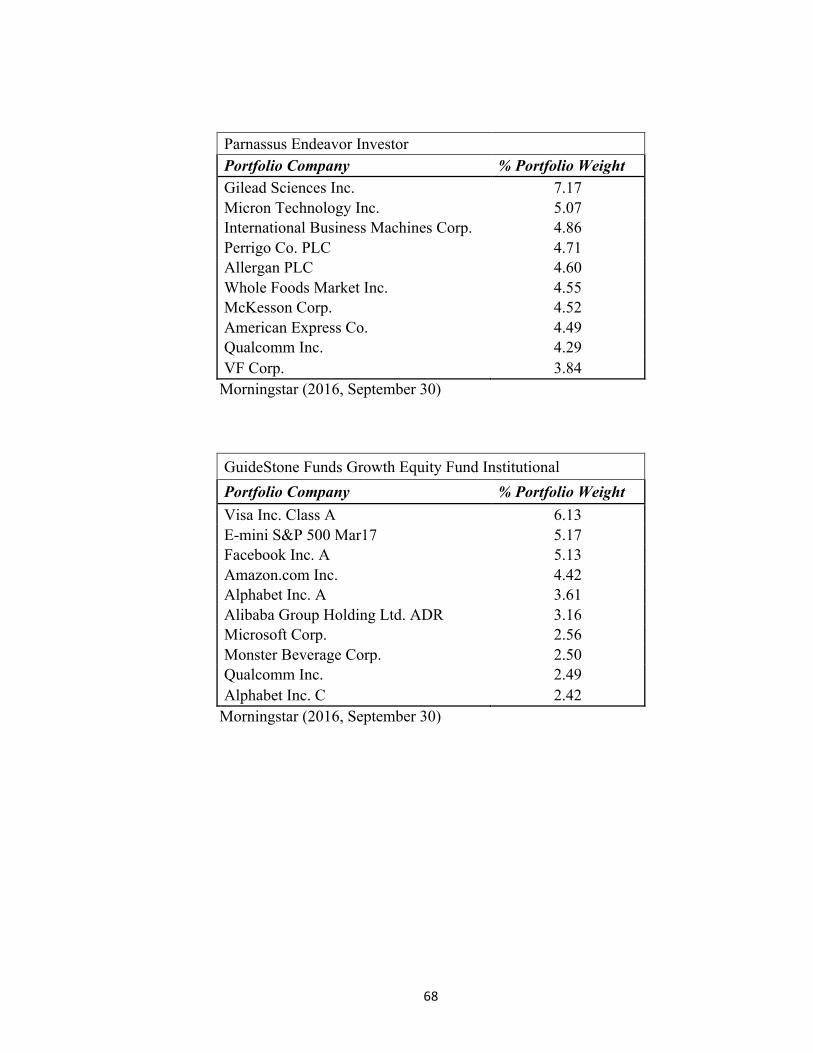
68
Parnassus Endeavor Investor Portfolio Company % Portfolio Weight
Gilead Sciences Inc. 7.17 Micron Technology Inc. 5.07 International Business Machines Corp. 4.86 Perrigo Co. PLC 4.71 Allergan PLC 4.60 Whole Foods Market Inc. 4.55 McKesson Corp. 4.52 American Express Co. 4.49 Qualcomm Inc. 4.29 VF Corp. 3.84
Morningstar (2016, September 30)
GuideStone Funds Growth Equity Fund Institutional Portfolio Company % Portfolio Weight Visa Inc. Class A 6.13 E-mini S&P 500 Mar17 5.17 Facebook Inc. A 5.13 Amazon.com Inc. 4.42 Alphabet Inc. A 3.61 Alibaba Group Holding Ltd. ADR 3.16 Microsoft Corp. 2.56 Monster Beverage Corp. 2.50 Qualcomm Inc. 2.49 Alphabet Inc. C 2.42
Morningstar (2016, September 30)
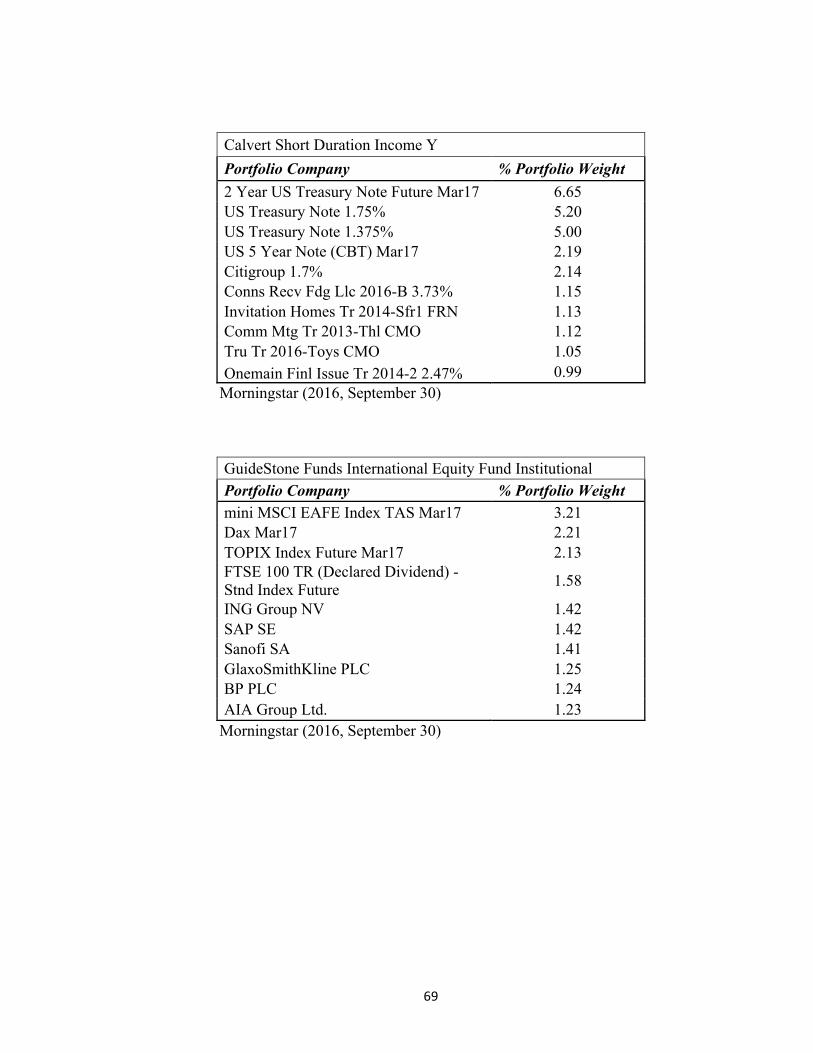
69
Calvert Short Duration Income Y Portfolio Company % Portfolio Weight 2 Year US Treasury Note Future Mar17 6.65 US Treasury Note 1.75% 5.20 US Treasury Note 1.375% 5.00 US 5 Year Note (CBT) Mar17 2.19 Citigroup 1.7% 2.14 Conns Recv Fdg Llc 2016-B 3.73% 1.15 Invitation Homes Tr 2014-Sfr1 FRN 1.13 Comm Mtg Tr 2013-Thl CMO 1.12 Tru Tr 2016-Toys CMO 1.05 Onemain Finl Issue Tr 2014-2 2.47% 0.99
Morningstar (2016, September 30)
GuideStone Funds International Equity Fund Institutional Portfolio Company % Portfolio Weight mini MSCI EAFE Index TAS Mar17 3.21 Dax Mar17 2.21 TOPIX Index Future Mar17 2.13 FTSE 100 TR (Declared Dividend) - Stnd Index Future 1.58
ING Group NV 1.42 SAP SE 1.42 Sanofi SA 1.41 GlaxoSmithKline PLC 1.25 BP PLC 1.24 AIA Group Ltd. 1.23
Morningstar (2016, September 30)
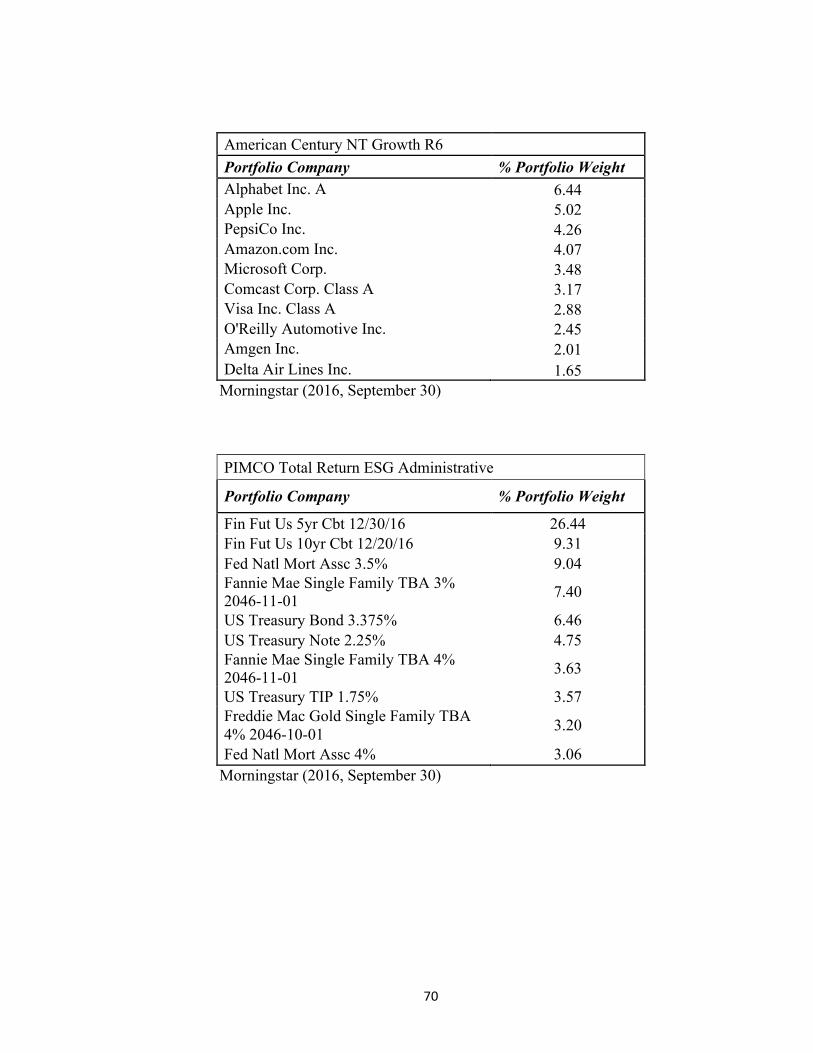
70
American Century NT Growth R6 Portfolio Company % Portfolio Weight Alphabet Inc. A 6.44 Apple Inc. 5.02 PepsiCo Inc. 4.26 Amazon.com Inc. 4.07 Microsoft Corp. 3.48 Comcast Corp. Class A 3.17 Visa Inc. Class A 2.88 O'Reilly Automotive Inc. 2.45 Amgen Inc. 2.01 Delta Air Lines Inc. 1.65
Morningstar (2016, September 30)
PIMCO Total Return ESG Administrative
Portfolio Company % Portfolio Weight
Fin Fut Us 5yr Cbt 12/30/16 26.44 Fin Fut Us 10yr Cbt 12/20/16 9.31 Fed Natl Mort Assc 3.5% 9.04 Fannie Mae Single Family TBA 3% 2046-11-01 7.40
US Treasury Bond 3.375% 6.46 US Treasury Note 2.25% 4.75 Fannie Mae Single Family TBA 4% 2046-11-01 3.63
US Treasury TIP 1.75% 3.57 Freddie Mac Gold Single Family TBA 4% 2046-10-01 3.20
Fed Natl Mort Assc 4% 3.06 Morningstar (2016, September 30)
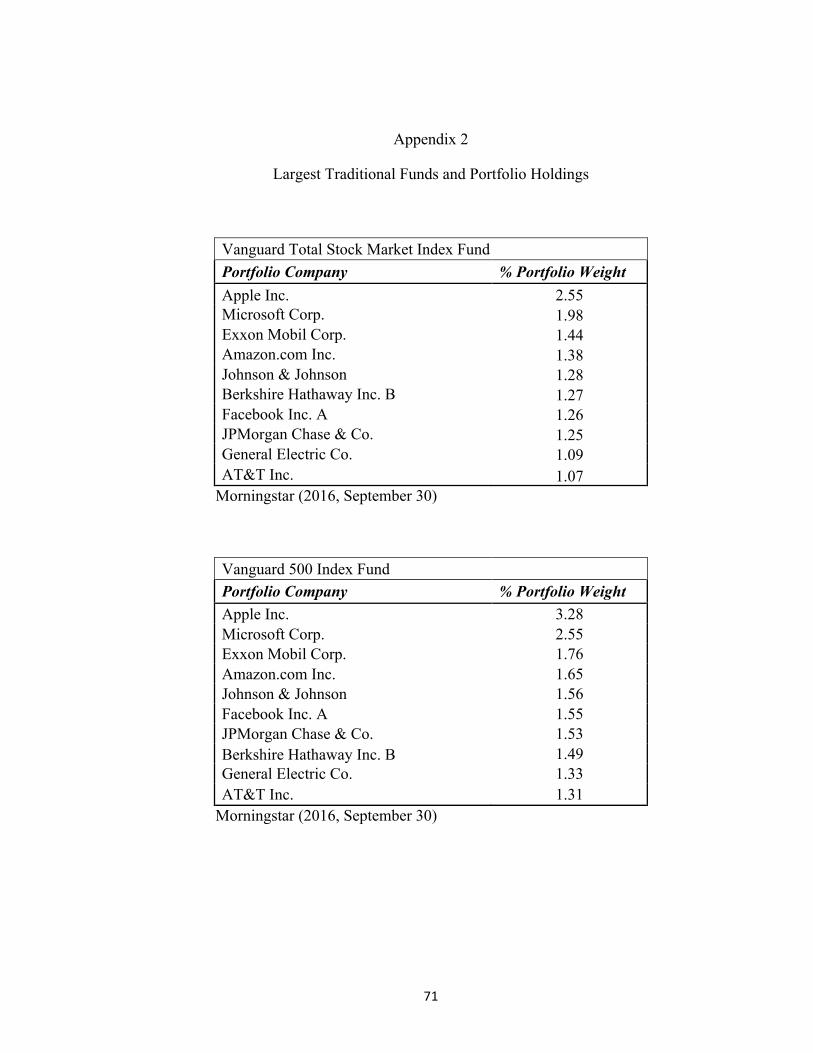
71
Appendix 2
Largest Traditional Funds and Portfolio Holdings
Vanguard Total Stock Market Index Fund Portfolio Company % Portfolio Weight Apple Inc. 2.55 Microsoft Corp. 1.98 Exxon Mobil Corp. 1.44 Amazon.com Inc. 1.38 Johnson & Johnson 1.28 Berkshire Hathaway Inc. B 1.27 Facebook Inc. A 1.26 JPMorgan Chase & Co. 1.25 General Electric Co. 1.09 AT&T Inc. 1.07
Morningstar (2016, September 30)
Vanguard 500 Index Fund Portfolio Company % Portfolio Weight
Apple Inc. 3.28 Microsoft Corp. 2.55 Exxon Mobil Corp. 1.76 Amazon.com Inc. 1.65 Johnson & Johnson 1.56 Facebook Inc. A 1.55 JPMorgan Chase & Co. 1.53 Berkshire Hathaway Inc. B 1.49 General Electric Co. 1.33 AT&T Inc. 1.31
Morningstar (2016, September 30)
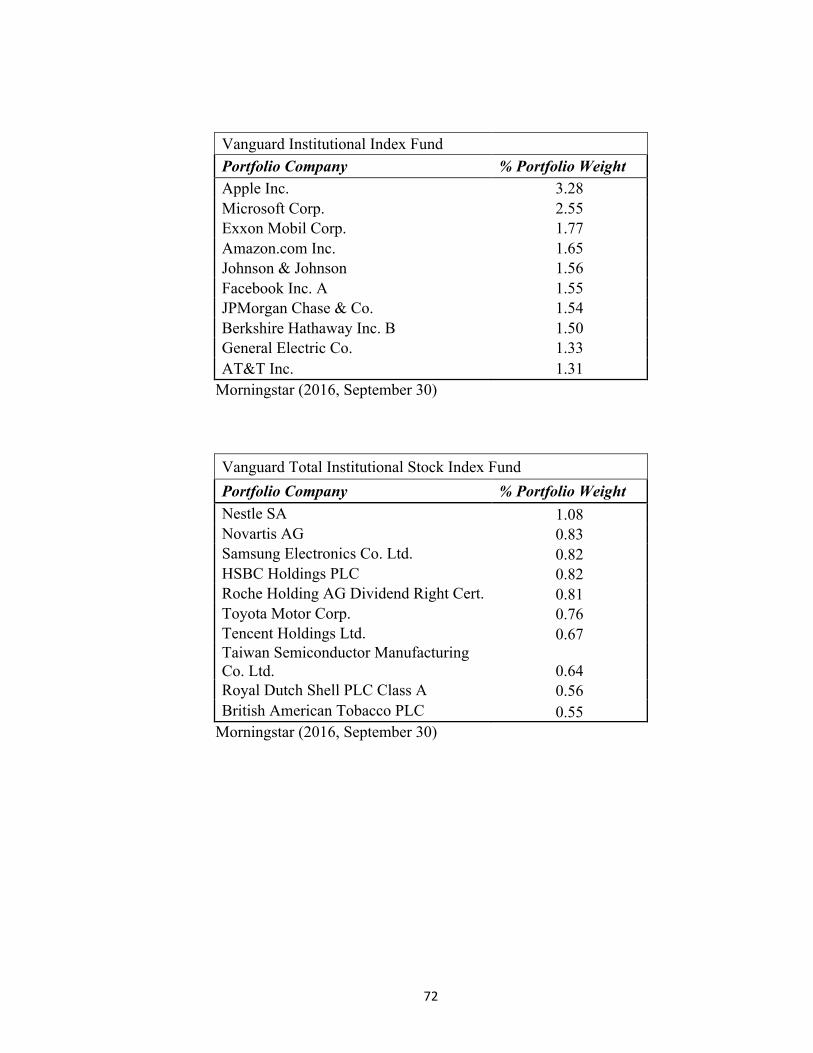
72
Vanguard Institutional Index Fund Portfolio Company % Portfolio Weight
Apple Inc. 3.28 Microsoft Corp. 2.55 Exxon Mobil Corp. 1.77 Amazon.com Inc. 1.65 Johnson & Johnson 1.56 Facebook Inc. A 1.55 JPMorgan Chase & Co. 1.54 Berkshire Hathaway Inc. B 1.50 General Electric Co. 1.33 AT&T Inc. 1.31
Morningstar (2016, September 30)
Vanguard Total Institutional Stock Index Fund Portfolio Company % Portfolio Weight Nestle SA 1.08 Novartis AG 0.83 Samsung Electronics Co. Ltd. 0.82 HSBC Holdings PLC 0.82 Roche Holding AG Dividend Right Cert. 0.81 Toyota Motor Corp. 0.76 Tencent Holdings Ltd. 0.67 Taiwan Semiconductor Manufacturing Co. Ltd. 0.64 Royal Dutch Shell PLC Class A 0.56 British American Tobacco PLC 0.55
Morningstar (2016, September 30)
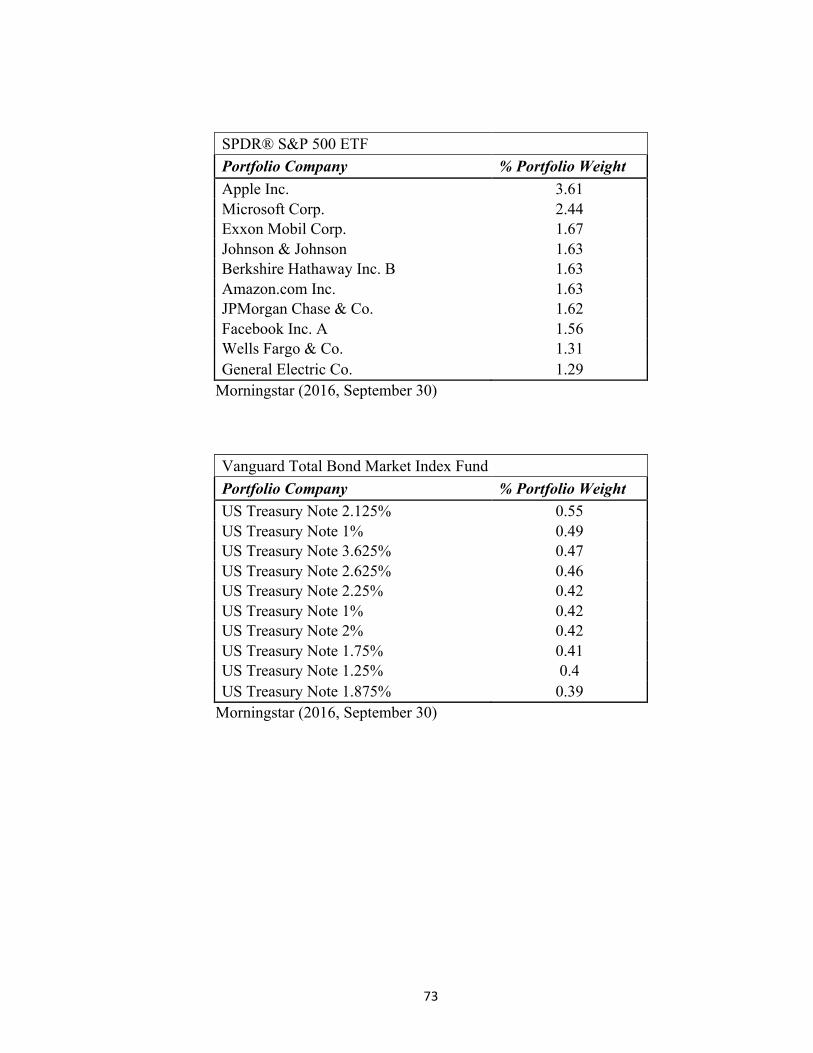
73
SPDR® S&P 500 ETF Portfolio Company % Portfolio Weight
Apple Inc. 3.61 Microsoft Corp. 2.44 Exxon Mobil Corp. 1.67 Johnson & Johnson 1.63 Berkshire Hathaway Inc. B 1.63 Amazon.com Inc. 1.63 JPMorgan Chase & Co. 1.62 Facebook Inc. A 1.56 Wells Fargo & Co. 1.31 General Electric Co. 1.29
Morningstar (2016, September 30)
Vanguard Total Bond Market Index Fund Portfolio Company % Portfolio Weight US Treasury Note 2.125% 0.55 US Treasury Note 1% 0.49 US Treasury Note 3.625% 0.47 US Treasury Note 2.625% 0.46 US Treasury Note 2.25% 0.42 US Treasury Note 1% 0.42 US Treasury Note 2% 0.42 US Treasury Note 1.75% 0.41 US Treasury Note 1.25% 0.4 US Treasury Note 1.875% 0.39
Morningstar (2016, September 30)
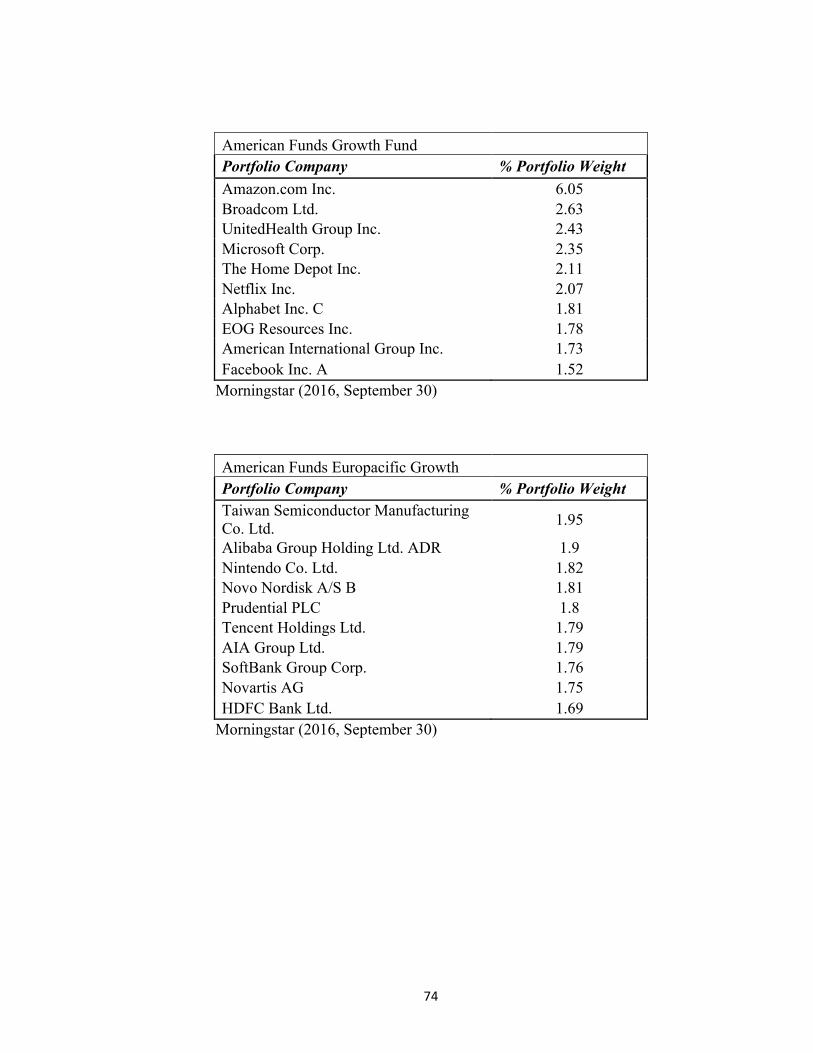
74
American Funds Growth Fund Portfolio Company % Portfolio Weight
Amazon.com Inc. 6.05 Broadcom Ltd. 2.63 UnitedHealth Group Inc. 2.43 Microsoft Corp. 2.35 The Home Depot Inc. 2.11 Netflix Inc. 2.07 Alphabet Inc. C 1.81 EOG Resources Inc. 1.78 American International Group Inc. 1.73 Facebook Inc. A 1.52
Morningstar (2016, September 30)
American Funds Europacific Growth Portfolio Company % Portfolio Weight
Taiwan Semiconductor Manufacturing Co. Ltd. 1.95
Alibaba Group Holding Ltd. ADR 1.9 Nintendo Co. Ltd. 1.82 Novo Nordisk A/S B 1.81 Prudential PLC 1.8 Tencent Holdings Ltd. 1.79 AIA Group Ltd. 1.79 SoftBank Group Corp. 1.76 Novartis AG 1.75 HDFC Bank Ltd. 1.69
Morningstar (2016, September 30)
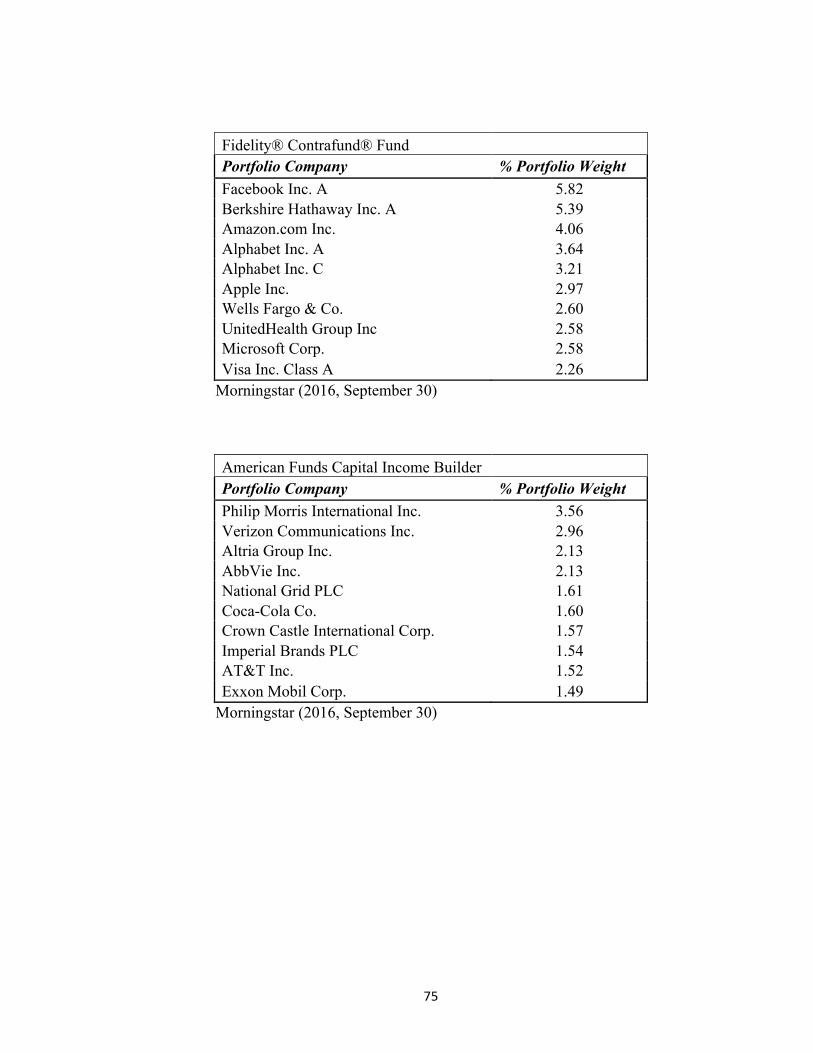
75
Fidelity® Contrafund® Fund Portfolio Company % Portfolio Weight
Facebook Inc. A 5.82 Berkshire Hathaway Inc. A 5.39 Amazon.com Inc. 4.06 Alphabet Inc. A 3.64 Alphabet Inc. C 3.21 Apple Inc. 2.97 Wells Fargo & Co. 2.60 UnitedHealth Group Inc 2.58 Microsoft Corp. 2.58 Visa Inc. Class A 2.26
Morningstar (2016, September 30)
American Funds Capital Income Builder Portfolio Company % Portfolio Weight
Philip Morris International Inc. 3.56 Verizon Communications Inc. 2.96 Altria Group Inc. 2.13 AbbVie Inc. 2.13 National Grid PLC 1.61 Coca-Cola Co. 1.60 Crown Castle International Corp. 1.57 Imperial Brands PLC 1.54 AT&T Inc. 1.52 Exxon Mobil Corp. 1.49
Morningstar (2016, September 30)
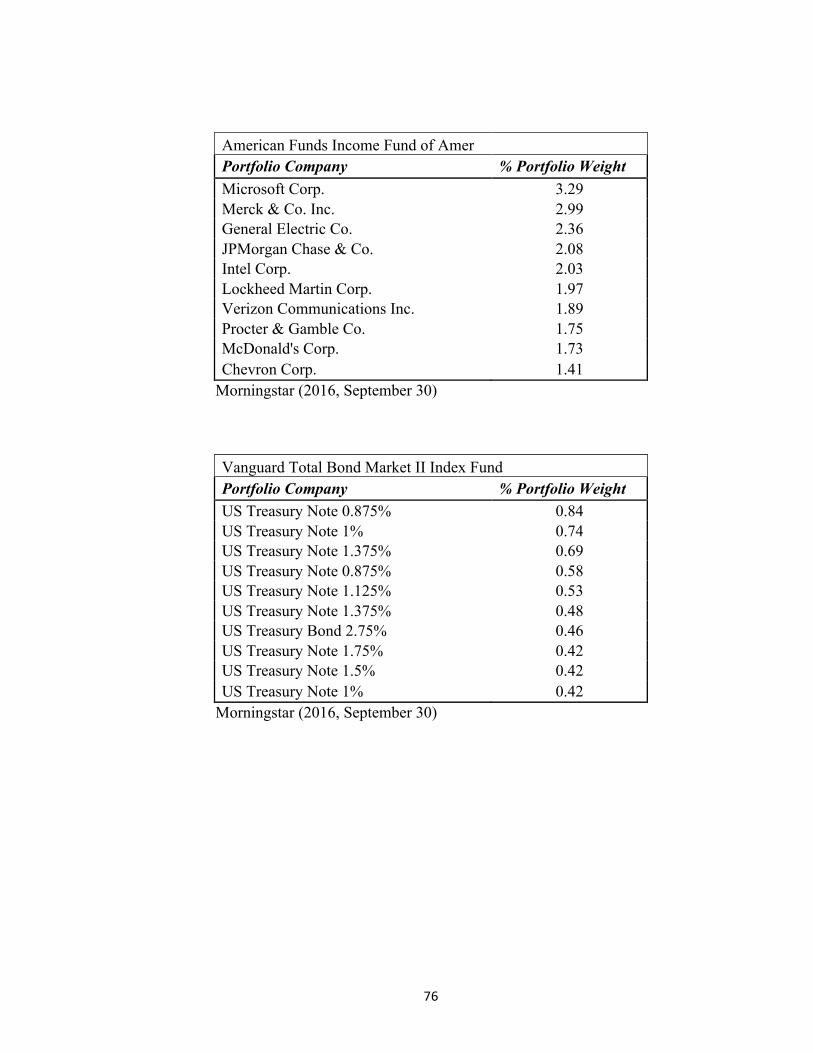
76
American Funds Income Fund of Amer Portfolio Company % Portfolio Weight
Microsoft Corp. 3.29 Merck & Co. Inc. 2.99 General Electric Co. 2.36 JPMorgan Chase & Co. 2.08 Intel Corp. 2.03 Lockheed Martin Corp. 1.97 Verizon Communications Inc. 1.89 Procter & Gamble Co. 1.75 McDonald's Corp. 1.73 Chevron Corp. 1.41
Morningstar (2016, September 30)
Vanguard Total Bond Market II Index Fund Portfolio Company % Portfolio Weight US Treasury Note 0.875% 0.84 US Treasury Note 1% 0.74 US Treasury Note 1.375% 0.69 US Treasury Note 0.875% 0.58 US Treasury Note 1.125% 0.53 US Treasury Note 1.375% 0.48 US Treasury Bond 2.75% 0.46 US Treasury Note 1.75% 0.42 US Treasury Note 1.5% 0.42 US Treasury Note 1% 0.42
Morningstar (2016, September 30)
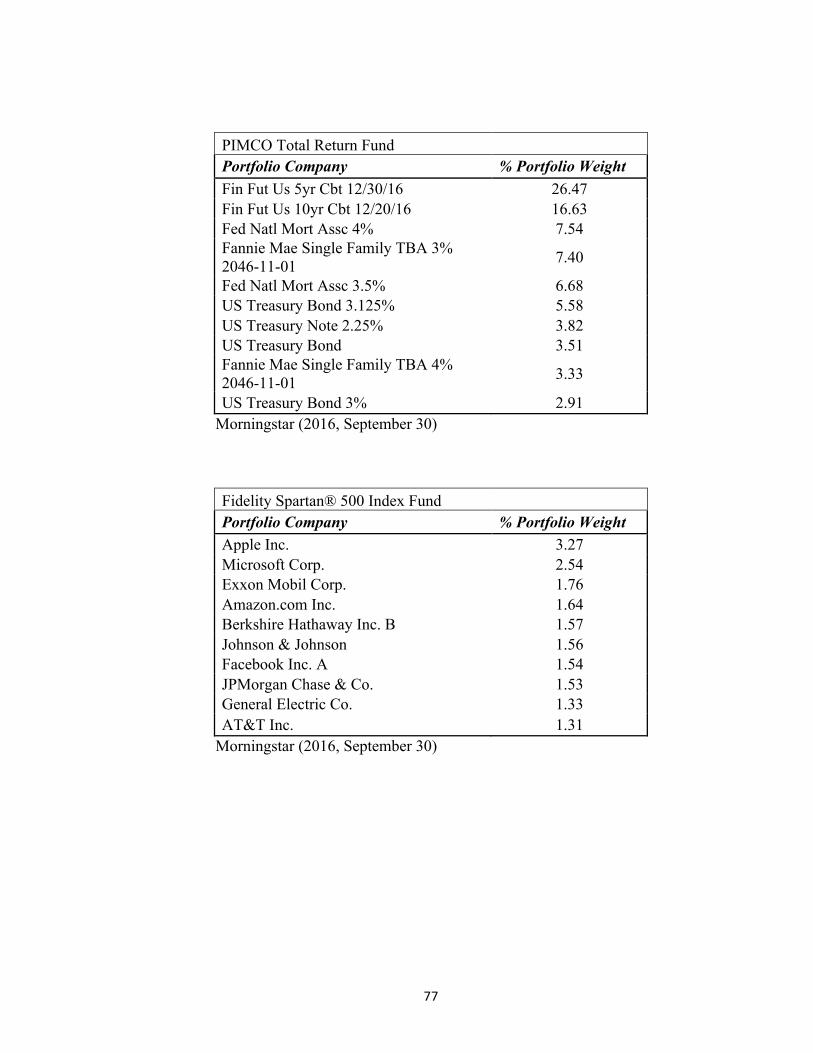
77
PIMCO Total Return Fund Portfolio Company % Portfolio Weight
Fin Fut Us 5yr Cbt 12/30/16 26.47 Fin Fut Us 10yr Cbt 12/20/16 16.63 Fed Natl Mort Assc 4% 7.54 Fannie Mae Single Family TBA 3% 2046-11-01 7.40
Fed Natl Mort Assc 3.5% 6.68 US Treasury Bond 3.125% 5.58 US Treasury Note 2.25% 3.82 US Treasury Bond 3.51 Fannie Mae Single Family TBA 4% 2046-11-01 3.33
US Treasury Bond 3% 2.91 Morningstar (2016, September 30)
Fidelity Spartan® 500 Index Fund Portfolio Company % Portfolio Weight
Apple Inc. 3.27 Microsoft Corp. 2.54 Exxon Mobil Corp. 1.76 Amazon.com Inc. 1.64 Berkshire Hathaway Inc. B 1.57 Johnson & Johnson 1.56 Facebook Inc. A 1.54 JPMorgan Chase & Co. 1.53 General Electric Co. 1.33 AT&T Inc. 1.31
Morningstar (2016, September 30)
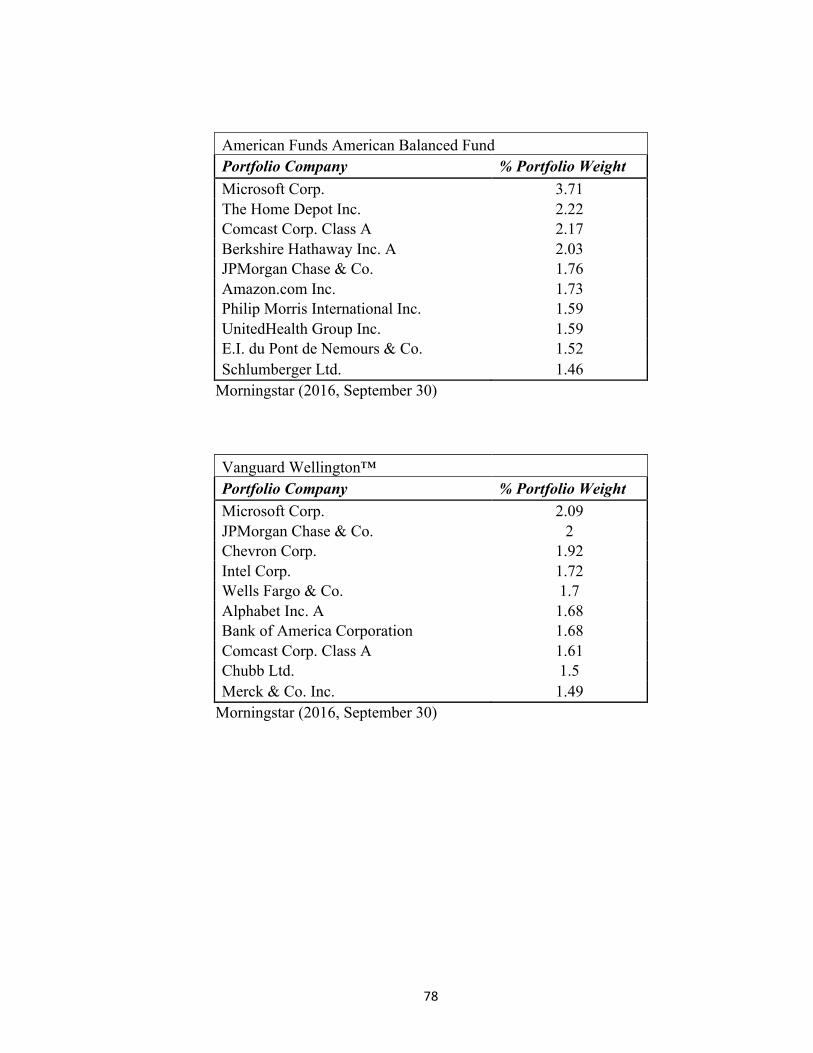
78
American Funds American Balanced Fund Portfolio Company % Portfolio Weight Microsoft Corp. 3.71 The Home Depot Inc. 2.22 Comcast Corp. Class A 2.17 Berkshire Hathaway Inc. A 2.03 JPMorgan Chase & Co. 1.76 Amazon.com Inc. 1.73 Philip Morris International Inc. 1.59 UnitedHealth Group Inc. 1.59 E.I. du Pont de Nemours & Co. 1.52 Schlumberger Ltd. 1.46
Morningstar (2016, September 30)
Vanguard Wellington™ Portfolio Company % Portfolio Weight
Microsoft Corp. 2.09 JPMorgan Chase & Co. 2 Chevron Corp. 1.92 Intel Corp. 1.72 Wells Fargo & Co. 1.7 Alphabet Inc. A 1.68 Bank of America Corporation 1.68 Comcast Corp. Class A 1.61 Chubb Ltd. 1.5 Merck & Co. Inc. 1.49
Morningstar (2016, September 30)
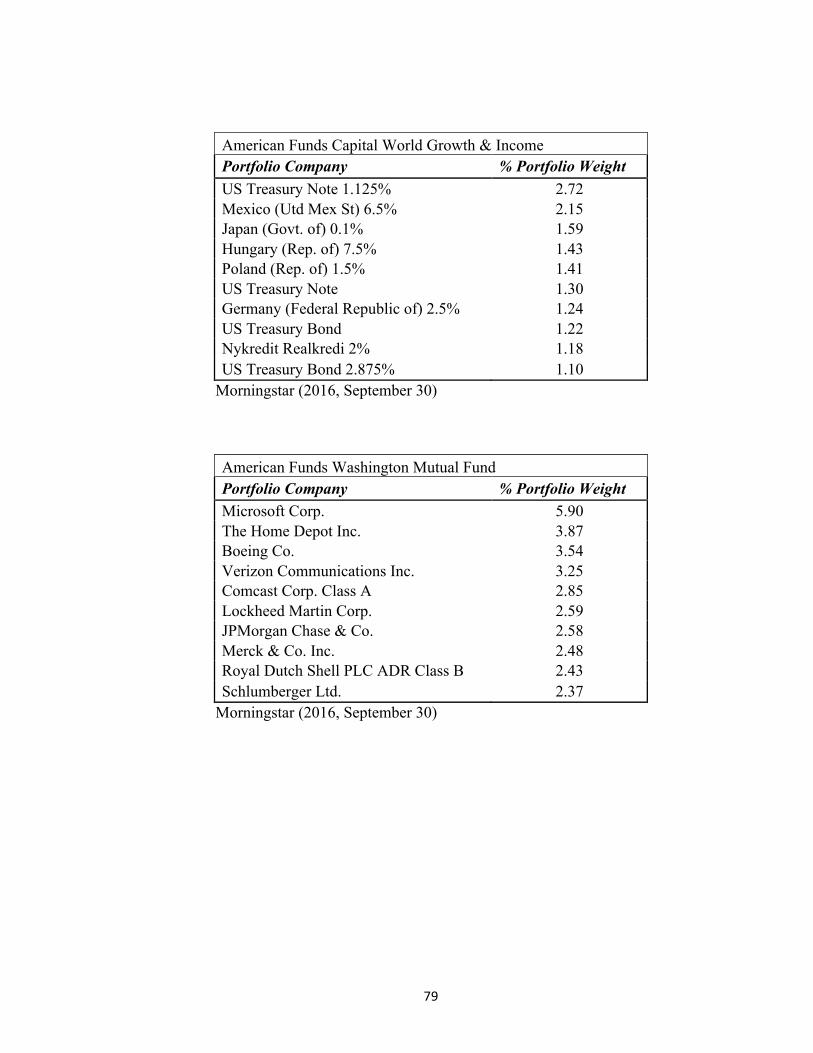
79
American Funds Capital World Growth & Income Portfolio Company % Portfolio Weight US Treasury Note 1.125% 2.72 Mexico (Utd Mex St) 6.5% 2.15 Japan (Govt. of) 0.1% 1.59 Hungary (Rep. of) 7.5% 1.43 Poland (Rep. of) 1.5% 1.41 US Treasury Note 1.30 Germany (Federal Republic of) 2.5% 1.24 US Treasury Bond 1.22 Nykredit Realkredi 2% 1.18 US Treasury Bond 2.875% 1.10
Morningstar (2016, September 30)
American Funds Washington Mutual Fund Portfolio Company % Portfolio Weight Microsoft Corp. 5.90 The Home Depot Inc. 3.87 Boeing Co. 3.54 Verizon Communications Inc. 3.25 Comcast Corp. Class A 2.85 Lockheed Martin Corp. 2.59 JPMorgan Chase & Co. 2.58 Merck & Co. Inc. 2.48 Royal Dutch Shell PLC ADR Class B 2.43 Schlumberger Ltd. 2.37
Morningstar (2016, September 30)
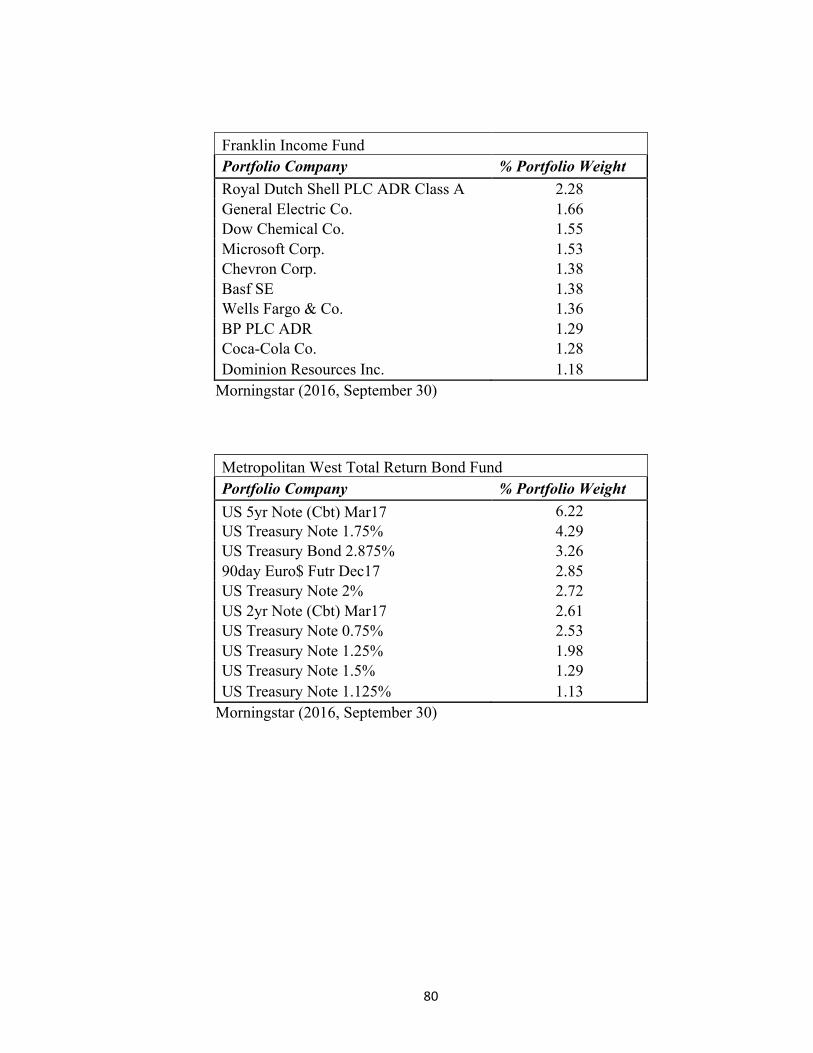
80
Franklin Income Fund Portfolio Company % Portfolio Weight
Royal Dutch Shell PLC ADR Class A 2.28 General Electric Co. 1.66 Dow Chemical Co. 1.55 Microsoft Corp. 1.53 Chevron Corp. 1.38 Basf SE 1.38 Wells Fargo & Co. 1.36 BP PLC ADR 1.29 Coca-Cola Co. 1.28 Dominion Resources Inc. 1.18
Morningstar (2016, September 30)
Metropolitan West Total Return Bond Fund Portfolio Company % Portfolio Weight US 5yr Note (Cbt) Mar17 6.22 US Treasury Note 1.75% 4.29 US Treasury Bond 2.875% 3.26 90day Euro$ Futr Dec17 2.85 US Treasury Note 2% 2.72 US 2yr Note (Cbt) Mar17 2.61 US Treasury Note 0.75% 2.53 US Treasury Note 1.25% 1.98 US Treasury Note 1.5% 1.29 US Treasury Note 1.125% 1.13
Morningstar (2016, September 30)
81
References
Atkinson, G. (1999). Measuring corporate sustainability. Journal of Environmental Planning and Management, 43(2), 235–252.
Barreda-Tarrazona, I., Matallín-Sáez, J.C. & Balaguer-Franch, M.R. (2011). Measuring investors’ socially responsible preferences in mutual funds. Journal of Business Ethics, 103(2), 305–330. Berry, M. D. (2013). History of socially responsible investing in the U.S. Retrieved from
http://sustainability.thomsonreuters.com/2013/08/09/history-of-socially-responsible-investing-in-the-u-s/
Bauer, R., Koedijk, K., & Otten, R. (2005). International evidence on ethical mutual fund
performance and investment style. Journal of Banking and Finance, 29(7), 1751–1767.
Docekalova, M., & Kocmanová, A. (2016). Composite indicators for measuring
corporate sustainability. Ecological Indicators, 61(2), 612–623. Farver, S. (2015). Mainstreaming Corporate Sustainability: Using Proven Tools to Promote Business Success. [Kindle Edition]. Retrieved from Amazon.com
Gelb, D., & Stawser, J. (2001). Corporate social responsibility and financial disclosures: An alternative explanation for increased disclosure. Journal of Business Ethics, 33(1), 1–13.
Giannarakis, G., Konteos, G., & Sariannidis, N., (2014). Financial, governance and
environmental determinants of corporate social responsible disclosure. Management Decisions, 52(10), 1928–1951.
Googins, B. K. (2007). Beyond good company [Kindle version]. Retrieved from Amazon.com Ibrahim, A. A. (2011). The rise of customary businesses in international financial
markets: An introduction to Islamic finance and the challenges of international integration. American University International Law Review, 23(4).
IRRC Institute (2012, July). Environment, social, governance investing by college and
university endowments in the United States: Social responsibility, sustainability, and stakeholder relations. Retrieved from http://www.irrcinstitute.org/wp-content/uploads/2015/09/FINAL_IRRCi_ESG_Endowments_Study_July_2012.pdf
82
Junkus, J., & Berry, T. (2013). Socially responsible investing: An investor perspective.
Journal of Business Ethics, 112(4), 707–720. Lee, D., Humphrey, J., Benson, K. & Ahn, J. (2010). Socially responsible investment
fund performance: The impact of screening intensity. Accounting and Finance, 50(2), 351–370.
Locke, R. M. (2013). The promise and limits of private power: Promoting labor
standards in a global economy (Cambridge studies in comparative politics) [Kindle version]. Retrieved from Amazon.com
Montiel, I., & Delgado-Ceballos, J. (2014). Defining and measuring corporate
sustainability: Are we there yet? Organization and Environment, 27(2), 113–139. Schneider, A., & Meins, E. (2011). Two dimensions of corporate sustainability
assessment: Towards a comprehensive framework. Business Strategy and the Environment, 21(4), 211–222.
Schori, K. (2015). Socially responsible investing. Retrieved from
http://www.episcopalchurch.org/page/socially-responsible-investing Schueth S. (2014). History of SRI. Retrieved from
http://www.sriconference.com/about/what-is-sri/history-of-sri.html Schwartkopf, Y., & Farmer, D., (2010). What Drives Mutual Fund Concentration? Shaukat, A., Qiu, Y., & Trojanowski, G. (2016). Board attributes, corporate social
responsibility strategy, and corporate environmental and social performance. Journal of Business Ethics, 135(3), 569–585
Turner, D. (2015, December 30). How millennials shape socially responsible investing.
Institutional Investor, 12. USSIF (2015). SRI basics. Retrieved from http://www.ussif.org/sribasics

83
Ancillary Appendix
Company Reports Consulted to Evaluate Fund Holdings
Abbvie (2016). 2015 annual report. Retrieved from http://investors.abbvie.com/phoenix.zhtml?c=251551&p=irol-reportsannual
Aflac (2016). 2015 annual report. Retrieved from
http://investors.aflac.com/~/media/Files/A/Aflac-IR/financial-reporting/annual-reports/ar2015.pdf
AIA Group (2016). 2015 annual report. Retrieved from
https://www.aia.com/content/dam/group/en/docs/annual-report/aia-annual-report-2015-eng.pdf
Alibaba (2016). 2015 annual report. Retrieved from
http://ar.alibabagroup.com/2015/index.html Allergan (2016) 2015 annual report. Retrieved from
https://www.allergan.com/investors/financial-information/annual-reports Alphabet/Google (2016). 2015 annual report. Retrieved from
https://www.sec.gov/Archives/edgar/data/1288776/000165204416000012/goog10-k2015.htm
Amazon (2016). 2015 annual report. Retrieved from
http://quicktake.morningstar.com/stocknet/secdocuments.aspx?symbol=amzn American Express (2016). 2015 annual report. Retrieved from
http://ir.americanexpress.com/Annual-Reports American Tower (2016). 2015 annual report. Retrieved from
http://www.americantower.com/corporateus/investor-relations/annual-reports-proxy-statements/index.htm
AmerisourceBergen (2016). 2015 annual report. Retrieved from
http://quicktake.morningstar.com/stocknet/secdocuments.aspx?symbol=abc Amgen (2016). 2015 annual report. Retrieved from
http://investors.amgen.com/phoenix.zhtml?c=61656&p=irol-reportsannual Amphenol (2016). 2015 annual report. Retrieved from
84
https://www.amphenol.com/fr/2015_APH_Annual_Report.pdf Apple (2016) 2015 annual report. Retrieved from
http://www.annualreports.com/HostedData/AnnualReports/PDF/NASDAQ_AAPL_2015.pdf
Bank of America (2016). 2015 annual report. Retrieved from
http://investor.bankofamerica.com/phoenix.zhtml?c=71595&p=irol-reportsannual#fbid=JIzrDACxkrA
Becton Dickinson (2016) 2015 annual report. Retrieved from
http://www.bd.com/ar15/annual-report-2015.pdf Bio-Rad (2016). 2015 annual report. Retrieved from http://www.bio-
rad.com/webroot/web/pdf/corporate/annualreport/Annual_Report_2015.pdf BP PLC (2016). 2015 annual report. Retrieved from
https://www.bp.com/content/dam/bp/pdf/investors/bp-annual-report-and-form-20f-2015.pdf
Broadcom (2016). 2015 annual report. Retrieved from
http://investors.broadcom.com/phoenix.zhtml?c=203541&p=irol-reportsannual Cantrell, J. (2015). Developing CSR giving as a dynamic capability for salient
stakeholder management. Journal of Business Ethics, 130(2), 403–421.
CBRE (2016). 2015 annual report. Retrieved from http://ir.cbre.com/phoenix.zhtml?c=176560&p=irol-reportsannual
Celgene (2016). 2015 annual report. Retrieved from http://ir.celgene.com/annuals-
proxies.cfm Charles Schwab (2016) 2015 annual report. Retrieved from
https://www.aboutschwab.com/images/uploads/inline/Schwab_AR2015.pdf Chevron Corporation (2016). 2015 annual report. Retrieved from
https://www.chevron.com/-/media/chevron/annual-report/2015/2015-Annual-Report.pdf
Chubb (2016). 2015 annual report. Retrieved from http://investors.chubb.com/investor-
relations/financials/annual-reports/default.aspx Citigroup (2016). 2015 annual report. Retrieved from
http://www.citigroup.com/citi/investor/quarterly/2016/ar15c_en.pdf Comcast (2016). 2015 annual report. Retrieved from
85
http://www.cmcsa.com/secfiling.cfm?filingID=1193125-15-68526 CVS (2016). 2015 annual report. Retrieved from
http://investors.cvshealth.com/~/media/Files/C/CVS-IR-v3/reports/2015-annual-report.pdf
Danaher (2016). 2015 annual report. Retrieved from http://investors.danaher.com/2015-
Annual-Report/images/Danaher-AR2015.pdf Delta Air Lines (2016). 2015 annual report. Retrieved from
http://ir.delta.com/shareholder-resources/annual-meetings/default.aspx Disney (2016) 2015 annual report. Retrieved from https://ditm-twdc-
us.storage.googleapis.com/2015-Annual-Report.pdf Dollar Tree (2016). 2015 annual report. Retrieved from
http://www.dollartreeinfo.com/investors/financial/annuals/ Ecolab (2016). 2015 annual report. Retrieved from
http://investor.ecolab.com/earnings-center/annual-reports Electronic Arts (2016). 2015 annual report. Retrieved from
http://investor.ea.com/annuals.cfm Erdiaw-Kwasie, M. O. (2015). Towards understanding stakeholder salience transition and
relational approach to ‘better’ corporate social responsibility: A case for a proposed model in practice. Journal of Business Ethics, 1–17.
ExxonMobil (2016). 2015 annual report. Retrieved from
http://www.annualreports.com/Company/exxon-mobil Facebook (2016). 2015 annual report. Retrieved from
http://www.annualreports.com/Company/facebook First American Financial Corporation (2016). 2015 annual report. Retrieved from
http://investors.firstam.com/phoenix.zhtml?c=233852&p=irol-irhome Gilead (2016). 2015 annual report. Retrieved from
http://investors.gilead.com/phoenix.zhtml?c=69964&p=irol-reportsannual GlaxoSmithKline PLC (2016). 2015 annual report. Retrieved from
https://pk.gsk.com/media/128803/gsk-annual-report-2015.pdf Gourevitch, P. (2007). What do corporations owe citizens? Society, 44(5), 12–18.
Grainger (2016) 2015 annual report. Retrieved from
86
http://invest.grainger.com/phoenix.zhtml?c=76754&p=irol-reports IBM (2016). 2015 annual report. Retrieved from
https://www.ibm.com/investor/att/pdf/IBM_Annual_Report_2015.pdf Illinois Tools (2015). 2014 annual report. Retrieved from
http://investor.itw.com/investor-information/financial-reports/annual-reports ING Group (2016). 2015 annual report. Retrieved from https://www.ing.com/investor-
relations/annual-reports.htm Inphi (2016). 2015 annual report. Retrieved from
http://investors.inphi.com/phoenix.zhtml?c=237726&p=irol-irhome Intel (2016) 2015 annual report. Retrieved from
http://www.annualreports.com/HostedData/AnnualReports/PDF/NASDAQ_INTC_2015.pdf
Intercontinental Exchange (2016). 2015 annual report. Retrieved from http://ir.theice.com/annual-and-quarterly-reports/annual-reports
Interpublic (2016). 2015 annual report. Retrieved from
http://investors.interpublic.com/phoenix.zhtml?c=87867&p=irol-reportsannual Johnson and Johnson (2016) 2015 annual report. Retrieved from
https://www.jnj.com/about-jnj/annual-reports Johnson Controls (2016). 2015 annual report. Retrieved from
http://investors.johnsoncontrols.com/financial-information/annual-reports-and-proxystatements/2015
Jones Lang LaSalle 2015 Annual Report (2016). 2015 annual report. Retrieved from
https://www.jll.com/InvestorPDFs/JLL-2015-Annual-Report.pdf J.P. Morgan Chase (2016). 2015 annual report. Retrieved from
https://www.jpmorganchase.com/corporate/investor-relations/document/2015-annualreport.pdf
KAR Auction Services (2016). 2015 annual report. Retrieved from
http://karauctionservices.com/wp-content/uploads/2014/06/KAR-Auction-Services-2015-Annual-Report.pdf
Kennametal (2016). 2015 annual report. Retrieved from
http://www.annualreports.com/HostedData/AnnualReports/PDF/NYSE_KMT_2015.pdf
87
KKR (2016). 2015 annual report. Retrieved from http://ir.kkr.com/kkr_ir/kkr_annuals.cfm
Laboratory Corporation of America (2016). 2015 annual report. Retrieved from
http://www.annualreports.com/Company/laboratory-corporation-of-america-holdings
Lam Research (2016). 2015 annual report. Retrieved from
http://investor.lamresearch.com/annuals-proxies.cfm Lazard (2016). 2015 annual report. Retrieved from
http://files.shareholder.com/downloads/LAZARD/0x0x881107/3E178DC5-0E8C-40F9-A8FB-C1E537FF6884/Lazard_annual_report_2015.pdf
Lear (2015). 2014 annual report. Retrieved from
http://www.lear.com/Site/Company/Resources/Annual-Reports.aspx Lowe’s (2016). 2015 annual report. Retrieved from http://phx.corporate-
ir.net/phoenix.zhtml?c=95223&p=irol-reportsannual Macquarie Group (2016). 2015 annual report. Retrieved from
https://www.macquarie.com/dafiles/Internet/mgl/global/shared/about/investors/results/2015/Macquarie_Group_FY15_Annual_Report.pdf?v=5
Mastercard (2016). 2015 annual report. Retrieved from
http://investor.mastercard.com/investor-relations/financials-and-sec-filings/annual-reports/default.aspx
McKesson (2016). 2015 annual report. Retrieved from
http://investor.mckesson.com/report/2015/2015-annual-report-and-letter-stockholders-pdf
Merck (2016). 2015 annual report. Retrieved from
http://www.emdgroup.com/emd/media/topics/ar_2015.html Micron Technology (2015). 2014 annual report. Retrieved from
http://investors.micron.com/secfiling.cfm?filingid=723125-14-195&cik= Microsoft (2016) 2015 annual report. Retrieved from
https://www.microsoft.com/investor/reports/ar16/index.html
MobilEye (2016). 2015 annual report. Retrieved from http://ir.mobileye.com/investor- relations/financial-information/annual-reports/default.aspx
Monster Beverages (2016). 2015 annual report. Retrieved from
http://investors.monsterbevcorp.com/annuals.cfm
88
MSG Networks (2016). 2015 annual report. Retrieved from
http://investor.msg.com/annuals.cfm Newell Rubbermaid (2016) 2015 annual report. Retrieved from
http://s1.q4cdn.com/122517005/files/doc_financials/annual_reports/2015/2015-Form-10-K-and-Selected-Shareholder-Information.pdf
Noble Energy (2016). 2015 annual report. Retrieved from
http://investors.nobleenergyinc.com/annuals.cfm Northern Trust (2016). 2015 annual report. Retrieved from
https://www.northerntrust.com/about-us/investor-relations/annual-report Occidental (2016). 2015 annual report. Retrieved from
http://www.oxy.com/investors/Reports/Pages/Annual-Report.aspx Omnicom Group (2016). 2015 annual report. Retrieved from
http://investor.omnicomgroup.com/investor-relations/overview/default.aspx Oracle Corporation (2016). 2015 annual report. Retrieved from
http://investor.oracle.com/financial-reporting/sec-filings/ O’Reilly Auto (2016). 2015 annual report. Retrieved from
https://corporate.oreillyauto.com/corporate/Financials.do Pepsi (2016). 2015 annual report. Retrieved from
https://www.pepsico.com/docs/album/annual-reports/pepsico-2015-annual-report_final_s57dqszgmy22ggn.pdf?sfvrsn=0
Perrigo (2016). 2015 annual report. Retrieved from
http://www.perrigo.com/about/AnnualReport2015.pdf Pfizer (2016). 2015 annual report. Retrieved from
http://www.pfizer.com/investors/financial_reports/financial_reports Praxair (2016) 2015 annual report. Retrieved from http://www.praxair.com/-
/media/praxairar/documents/annual-reports/praxair2015annualreport.pdf?la=en Procter & Gamble (2016). 2015 annual report. Retrieved from
http://news.pg.com/blog/annual-report/2016AR Progressive (2016) 2015 annual report. Retrieved from http://media.corporate-
ir.net/media_files/IROL/81/81824/qInter/2016/16Q3/pdf/Progressive-2015-AR.pdf
89
Qualcomm (2016). 2015 annual report. Retrieved from http://investor.qualcomm.com/annuals-proxies.cfm
Royal Caribbean (2016). 2015 annual report. Retrieved from
http://www.rclcorporate.com/investors/financial-information/financial-reports/#annual-reports
Sanofi SA (2016). 2015 annual report. Retrieved from
http://en.sanofi.com/investors/events/Results/2016-02-09_Results_2015.aspx SAP (2016). 2015 annual report. Retrieved from
https://www.sap.com/docs/download/investors/2015/sap-2015-annual-report.pdf Schlumberger (2016). 2015 annual report. Retrieved from
http://investorcenter.slb.com/phoenix.zhtml?c=97513&p=irol-reportsannual Sievänen, R (2013). The drivers of responsible investment: The case of European pension funds. Journal of Business Ethics, 117(1), 137–151. Stanley Black and Decker (2016). 2015 annual report. Retrieved from
http://ir.stanleyblackanddecker.com/phoenix.zhtml?c=114416&p=irol-yearinreview
Steel Dynamics (2016). 2015 annual report. Retrieved from
http://ir.steeldynamics.com/Annual_Reports Tegna (2016). 2015 annual report. Retrieved from
http://investors.tegna.com/phoenix.zhtml?c=84662&p=irol-reportsAnnual Texas Instruments (2016) 2015 annual report. Retrieved from
http://investor.ti.com/secfiling.cfm?filingID=97476-15-3 Thermo Fisher Scientific (2016). 2015 annual report. Retrieved from
http://ir.thermofisher.com/investors/financial-information/annual-reports/default.aspx
Total Corporation (2016). 2015 annual report. Retrieved from
http://www.total.com/en/media/news/press-releases/2015-annual-reports Unilever (2016) 2015 annual report. Retrieved from
https://www.unilever.com/Images/annual_report_and_accounts_ar15_tcm244-478426_en.pdf
UnitedHealth Group (2016). 2015 annual report. Retrieved from
http://www.unitedhealthgroup.com/Investors/AnnualReports.aspx
90
United Parcel Services (2016) 2015 annual report. Retrieved from http://nasdaqomx.mobular.net/nasdaqomx/7/3491/4988/
U.S. Bancorp (2016). 2015 annual report. Retrieved from
https://www.usbank.com/en/annual_report/invest/ Verizon (2016) 2015 annual report. Retrieved from
https://www.verizon.com/about/sites/default/files/annual/verizon-annual-2015/downloads/15_vz_ar.pdf
VF Corporation (2016). 2015 annual report. Retrieved from
http://c.eqcdn.com/_227390da3faf99f263a5796e61b9a460/vfc/db/74/17020/annual_report/VF_Annual_Report_2015-Digital.pdf
Visa (2016). 2015 annual report. Retrieved from
https://s1.q4cdn.com/050606653/files/doc_financials/annual/VISA-2015-Annual-Report.pdf
Wang, Y. (2015). Corporate social responsibility and financial performance. Journal of
Economic Interaction and Coordination, 1–27. Wells Fargo (2016). 2015 annual report. Retrieved from
https://www08.wellsfargomedia.com/assets/pdf/about/investor-relations/annual-reports/2015-annual-report.pdf
Whole Foods (2016). 2015 annual report. Retrieved from
http://investor.wholefoodsmarket.com/investors/financial-information/annual- reports-and-proxy/default.aspx
XPO Logistics (2016). 2015 annual report. Retrieved from
http://investors.xpo.com/phoenix.zhtml?c=204615&p=irol-reportsannual Zebra Technologies (2016). 2015 annual report. Retrieved from
http://investors.zebra.com/financial-reports/annual-reports.aspx Zimmer Biomet (2016). 2015 annual report. Retrieved from
http://investor.zimmerbiomet.com/annuals.cfm?id=8 Zoetis (2016). 2015 annual report. Retrieved from http://investor.zoetis.com/annual-
reports