a comparative analysis of price effects of two airline mergers in china€¦ · 1. introduction...
TRANSCRIPT

LOGO
A Comparative Analysis of Price Effects of Two Airline Mergers in China
Wenliang Ma,1 Qiang Wang,1 Hangjun Yang,1* and Yahua Zhang2
1 School of International Trade and Economics, University of International Business and Economics, Beijing, China2 School of Commerce, University of Southern Queensland, Toowoomba, Queensland, Australia
* Corresponding author. Email address: [email protected].

LOGOOutline
• Introduction1• Literature Review2• Data3• Methodology4• Results5• Conclusion6
2017/9/19 University of International Business and Economics 2

LOGO1. Introduction In 2010, two large-scale airline mergers took place in China State-owned China Eastern completed its merger with
Shanghai Government-owned Shanghai Airlines (MU-FM) State-owned Air China successfully increased its stake in
private Shenzhen Airlines from 25% to 51% (CA-ZH)
2017/9/19 3
China Eastern (MU) & Shanghai Airlines (FM)
Air China (CA) &Shenzhen Airlines (ZH)
Hub Shanghai & Shanghai Beijing & Shenzhen
Before Merger Both suffered severe financial losses
ZH was seeking for financial support
Network Parallel nature Complementary nature
University of International Business and Economics

LOGO1. Introduction The CA-ZH merger was of complementary nature while the
MU-FM was regarded as a parallel merger in terms of their route systems.
For complementary alliances, airfares decreased and consumers were better off while airfares increased in the markets where parallel alliances occurred.
Although the appeal of mergers and of airline alliances is much the same for an airline, the same conclusion may not necessarily apply to the airline merger cases, given that alliances are frequently subject to instability, while a merger is usually irreversible and permanent.
The two mergers with different route systems provides us with a great opportunity to examine their effects on airfare.
2017/9/19 4University of International Business and Economics
LOGO1. Introduction Although the impact of mergers on airfare has been
extensively studied in previous literature, research into the merger cases in the Chinese market is sporadic, mainly due to the unavailability of data.
To the best of our knowledge, the CA-ZH merger has not been rigorously studied in the literature.
Zhang (2015) is the only paper that examined the price effects of MU-FM merger based on a small number of routes.
Given that the two mergers took place roughly at the same time, and that merging parties, Air China and China Eastern, and the acquired parties, Shanghai and Shenzhen Airlines, are of similar size, it is interesting to do a comparative study.
2017/9/19 5University of International Business and Economics
LOGO1. Introduction Although China introduced its Anti-Monopoly Law in 2008, the
new antitrust enforcement agencies had limited resources and little experience in dealing with antitrust cases.
All the airline mergers or code sharing agreements in China have never been challenged.
China’s state-owned airlines could enjoy a certain degree of market power through either explicit and implicit collusion, or mergers and acquisitions to defend their market share and eliminate potential competition from private carriers.
Therefore, the lack of a general deterrent effect of antitrust law gives us an opportunity of examining the pricing effects, which would be otherwise suppressed by effective anticompetitive laws in many developed economies.
2017/9/19 6University of International Business and Economics

LOGO2. Literature Review In the US, there were two waves of airline mergers. The first wave occurred in the 1980s following airline
deregulation (Borenstein, 1990; Werden et al., 1991; Kim and Singal, 1993; Morrison, 1996; Kwoka and Shumilkina, 2010).
The second wave emerged in the new century when the landscape of the world airline industry had completely changed and airlines operated in a more deregulated and competitive environment (Brueckner et al., 2013; Luo, 2014; Huschelrath and Muller, 2014, 2015).
Market power has been detected following the mergers when the merging firms had overlapping routes or if one party provided services and the other was a potential entrant.
However, fares are likely to decrease in complementary networks because of scale effects, improved service quality and more travel options.
2017/9/19 7University of International Business and Economics

LOGO2. Literature Review Outside US, the results are varied on different cases. In the EU market, some papers reported significant price
increase after airline mergers (Veldhius, 2005; Brueckner and Pels, 2005; Gaggero and Piga, 2010).
Other studies drew opposite conclusions. Dobson and Piga(2013) found that after LCC mergers, fares were greatly reduced especially for those early booking tickets.
Fageda and Perdiguero (2014) found no significant change in price on routes where the two LCCs competed before the merger, whilst price notably increased on routes where full-service airline was competing with LCC.
In the Japanese market, Mizutani (2011) reported that the merger between Japan Airlines and Japan Air System significantly increased competition and reduced the price.
2017/9/19 8University of International Business and Economics

LOGO2. Literature Review
The research on Chinese airline mergers is very limited. Zhang and Round (2009) studied the airfare changes
charged by China Eastern and China Southern after 2002, and showed that the merger did not trigger significant airfare increase due to stable competition from other airlines and the complementary nature of the consolidation.
Zhang (2015) investigated the merger between China Eastern and Shanghai Airlines and found that on average the prices increased by approximately 22% on the seven sample routes one year after the merger.
2017/9/19 9University of International Business and Economics

LOGO3. Data Our dataset was constructed using information from the IATA
Airport Intelligence Services database. The dataset contains monthly domestic airline route
information on origin, destination, monthly economy-class airfares and monthly number of passengers by routes and carriers, spanning from January 2005 to December 2016.
Based on the Statistical Data on Civil Aviation of China(CAAC, 2015), we selected 280 most heavily travelled routes with each carrying at least 300,000 passengers in 2014.
Although there were 2,652 domestic air routes in 2014, these top 280 accounted for two thirds of the total traffic volume.
Although dozens of airlines operated on these 280 routes, we focus only on the first 11 largest carriers in terms of annual passenger traffic carried.
2017/9/19 10University of International Business and Economics

LOGO3. Data Due to incompleteness of route data in early periods,
observations before April 2007 were dropped from the dataset. In order to be consistent with some macro variables that are
reported quarterly, we use monthly air traffic information to construct a quarterly panel dataset of directional non-stop airport-pair markets.
We treat each of the pair of route directions as a separate market. This is consistent with the view held in the airline industry that each route direction is a separate market.
2017/9/19 11University of International Business and Economics

LOGO3. Data In total there are 560 domestic directional airline routes. We
only keep routes with no missing data during the whole period of study.
In line with previous literature, routes carrying less than 1,000 passengers a quarter were removed from the dataset.
As a result, 509 routes are kept in the analysis. Overall, the unbalanced panel data set contains quarterly data ranging from the 2nd quarter of 2007 to the 4th quarter of 2016, with 47,474 observations.
As both mergers occurred in the first half of 2010, the data set contains a 3-year period before the mergers and a 6-year period after the mergers.
2017/9/19 12University of International Business and Economics

LOGO4. Methodology Difference-in-Difference Model
ln (𝑓𝑓𝑓𝑓𝑓𝑓𝑓𝑓)𝑖𝑖𝑖𝑖𝑖𝑖 = 𝛽𝛽0 + 𝛽𝛽1𝑜𝑜𝑜𝑜𝑓𝑓𝑓𝑓𝑜𝑜𝑓𝑓𝑜𝑜ij + 𝛽𝛽2𝑜𝑜𝑜𝑜𝑝𝑝𝑓𝑓𝑝𝑝𝑝𝑝𝑝𝑝𝑓𝑓𝑜𝑜ij + 𝛽𝛽3𝑓𝑓𝑝𝑝𝑜𝑜𝑓𝑓𝑜𝑜ij + 𝛽𝛽4𝑇𝑇𝑖𝑖+𝛽𝛽5𝑜𝑜𝑜𝑜𝑓𝑓𝑓𝑓𝑜𝑜𝑓𝑓𝑜𝑜ij × 𝑇𝑇𝑖𝑖 + 𝛽𝛽6𝑜𝑜𝑜𝑜𝑝𝑝𝑓𝑓𝑝𝑝𝑝𝑝𝑝𝑝𝑓𝑓𝑜𝑜ij × 𝑇𝑇𝑖𝑖 + 𝛽𝛽7𝑓𝑓𝑝𝑝𝑜𝑜𝑓𝑓𝑜𝑜ij × 𝑇𝑇𝑖𝑖
+𝛿𝛿𝑋𝑋𝑖𝑖𝑖𝑖𝑖𝑖 + 𝛾𝛾𝑖𝑖 + 𝜑𝜑𝑖𝑖 + 𝑜𝑜𝑖𝑖 + 𝜇𝜇𝑖𝑖𝑖𝑖𝑖𝑖 Overlap, potential, and rival are different route types following the
classification by Kwoka and Shumilkina (2010) and Le (2016) Overlap route: only served by Air China and Shenzhen Airlines
before they merged, or by China Eastern and Shanghai Airlines in the MU-FM case
Potential route: served by one of the merging party, with the other operating as a potential entrant
Rival route: at least one non-merging firm, competing with one or two merging carriers before the merger
Time dummy T is 0 before merger and 1 after merger
2017/9/19 13University of International Business and Economics

LOGO4. Methodology Route types
2017/9/19 14
Overlap Potential Rival Control Total
MU & FM 112 167 297 453 1029
CA & ZH 36 203 315 435 989
• The number of total route observations and the number of total route-carrier observations of the two mergers are quite close.
• However, the MU-FM merger sample contains much more overlap routes than the CA-ZH merger sample.
University of International Business and Economics

LOGO4. Methodology The following control variables are included Distance, measured as the logarithm of route distance, is
expected to have a negative sign because our dependent variable is average airfare per kilometer.
Population, measured as the logarithm of the arithmetic mean of city populations at the two endpoints of each route.
Tour, a dummy variable, equals one for a tourist route. HHI is the route HHI in logarithmic form measuring market
concentration. LCC is a dummy denoting the presence of Spring Airlines on
route j at time t. HSR is a dummy variable that takes the value of one if direct
high-speed rail (HSR) service is available on route j at time t.
2017/9/19 15University of International Business and Economics

LOGO5. Results
2017/9/19 16
The Estimation Results for the MU-FM Merger
Basic Models Dynamic Models System GMM
RE FE FE+IV FE FE+IV IV for Yt-1 IV for Yt-1 and more
T*Overlap 0.0224* 0.0344** 0.0300*** 0.0200*** 0.0168*** 0.0177 0.0110
T*Potential 0.0206* 0.0277*** 0.0334*** 0.0155*** 0.0176*** -0.0012 -0.0014
T*Rival 0.0034 0.0050 0.0024 -0.0003 -0.0037 -0.0009 -0.0030
lnHHI-0.0507*** -0.0767*** -0.0747*** -0.0461*** -0.0453*** 0.0045 0.0031
lnDistance -0.4418*** - - - - -0.2243*** -0.1788***
lnPOP 0.0247** 0.2662*** 0.1783*** 0.1579*** 0.0298 -0.0115 -0.0029
University of International Business and Economics

LOGO5. Results
2017/9/19 17
The Estimation Results for the MU-FM Merger Cont’d
Basic Models Dynamic Models System GMM
RE FE FE+IV FE FE+IV IV for Yt-1 IV for Yt-1 and more
HSR 0.0176** 0.0152* -0.0135*** 0.0066* -0.0097*** 0.0066 0.0124**
LCC -0.0554*** -0.0446*** -0.0473*** -0.0230*** -0.0310*** -0.0553*** -0.0419***
Tour -0.0292** - - - - -0.0176* -0.0082
L.lnfare - - - 0.5350*** 0.4477*** 0.4111*** 0.5605***
L.lndemand -0.0049 -0.0184*** -0.0506*** -0.0160*** -0.0290*** 0.1456*** 0.0422***
N 36590 36590 34381 36590 34381 36590 36590
R2 0.549 0.243 0.112 0.446 0.284 - -
University of International Business and Economics
LOGO5. Results
2017/9/19 18
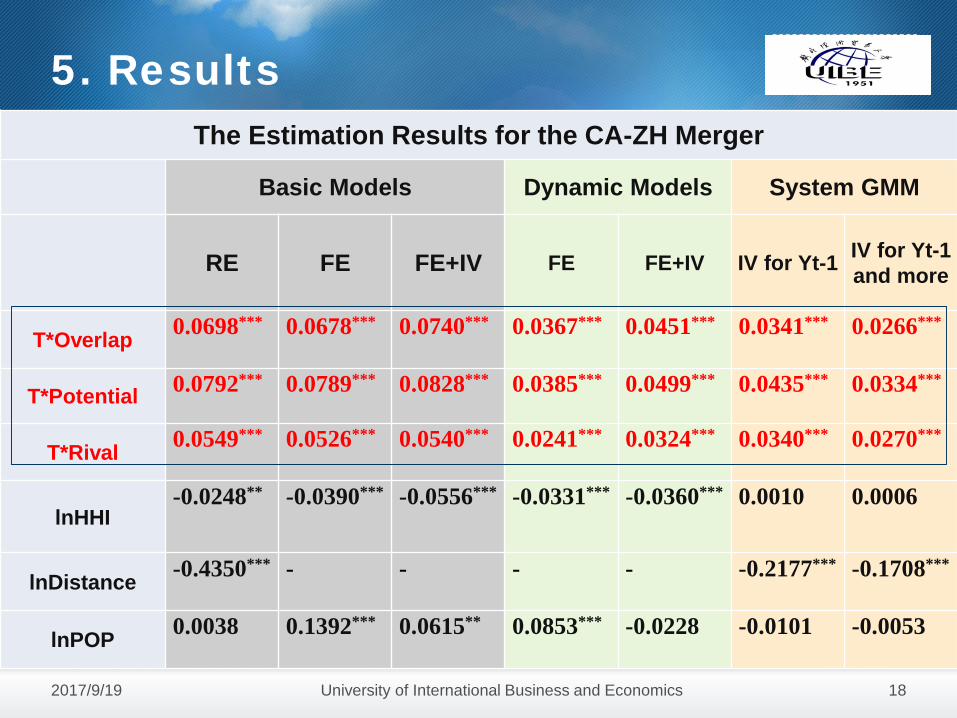
The Estimation Results for the CA-ZH Merger
Basic Models Dynamic Models System GMM
RE FE FE+IV FE FE+IV IV for Yt-1 IV for Yt-1 and more
T*Overlap 0.0698*** 0.0678*** 0.0740*** 0.0367*** 0.0451*** 0.0341*** 0.0266***
T*Potential 0.0792*** 0.0789*** 0.0828*** 0.0385*** 0.0499*** 0.0435*** 0.0334***
T*Rival 0.0549*** 0.0526*** 0.0540*** 0.0241*** 0.0324*** 0.0340*** 0.0270***
lnHHI-0.0248** -0.0390*** -0.0556*** -0.0331*** -0.0360*** 0.0010 0.0006
lnDistance -0.4350*** - - - - -0.2177*** -0.1708***
lnPOP 0.0038 0.1392*** 0.0615** 0.0853*** -0.0228 -0.0101 -0.0053
University of International Business and Economics

LOGO5. Results
2017/9/19 19
The Estimation Results for the CA-ZH Merger Cont’dBasic Models Dynamic Models System GMM
RE FE FE+IV FE FE+IV IV for Yt-1 IV for Yt-1 and more
HSR 0.0238*** 0.0215*** 0.0025 0.0089** 0.0004 0.0011 0.0121**
LCC -0.0642*** -0.0480*** -0.0576*** -0.0273*** -0.0390*** -0.0686*** -0.0480***
Tour -0.0370*** - - - - -0.0228*** -0.0126**
L.lnfare - - - 0.5356*** 0.4398*** 0.4556*** 0.5889***
L.lndemand 0.0038 -0.0091** -0.0432*** -0.0167*** -0.0273*** 0.0963*** 0.0229***
N 35140 35140 33029 35140 33029 35140 35140
R2 0.529 0.249 0.140 0.453 0.302 - -
University of International Business and Economics

LOGO5. Results
2017/9/19 20University of International Business and Economics
HSR entered 224 air routes out of all 509 routes in our sample by 2016.
However, among the 224 routes, only 62 had HSR services before late 2013 while HSR started to operate on the remaining 162 routes after early 2014.
Add another dummy variable HSR2014, which equals one if a route enters HSR after early 2014, zero otherwise.
The coefficient of HSR2014 measures the average different impact of HSR service on airfare before and after early 2014.
The sum of the coefficients of HSR and HSR2014 therefore indicates average airfare difference on routes with HSR entry after early 2014 and on routes without HSR entry.

LOGO5. Results
2017/9/19 21
The Estimation Results of the MU-FM Merger with HSR2014Basic Models Dynamic Models System GMM
RE FE FE+IV FE FE+IV IV for Yt-1 IV for Yt-1 and more
T*overlap 0.0213 0.0333** 0.0311*** 0.0196*** 0.0175*** 0.0175 0.0110
T*rival 0.0209* 0.0280*** 0.0345*** 0.0157*** 0.0185*** -0.0009 -0.0010
T*potential 0.0048 0.0065 0.0055 0.0004 -0.0019 0.0001 -0.0023
HSR -0.0468*** -0.0504*** -0.0543*** -0.0227*** -0.0367*** -0.0402*** -0.0138*
HSR2014 0.0762*** 0.0775*** 0.0724*** 0.0347*** 0.0446*** 0.0566*** 0.0341***
LCC -0.0530*** -0.0418*** -0.0413*** -0.0218*** -0.0278*** -0.0561*** -0.0417***
Constant 1.0369*** -3.3738*** - -1.6074*** - -1.0980*** -0.1505*
N 36590 36590 34381 36590 34381 36590 36590R2 0.530 0.246 0.122 0.447 0.285 - -
University of International Business and Economics

LOGO5. Results
2017/9/19 22
The Estimation Results of the CA-ZH Merger with HSR2014Basic Models Dynamic Models System GMM
RE FE FE+IV FE FE+IV IV for Yt-1 IV for Yt-1 and more
T*overlap 0.0688*** 0.0664*** 0.0695*** 0.0362*** 0.0430*** 0.0341** 0.0259***
T*rival 0.0808*** 0.0803*** 0.0830*** 0.0395*** 0.0506*** 0.0448*** 0.0337***
T*potential 0.0573*** 0.0550*** 0.0557*** 0.0254*** 0.0339*** 0.0359*** 0.0278***
HSR -0.0591*** -0.0618*** -0.0695*** -0.0307*** -0.0446*** -0.0458*** -0.0249***
HSR2014 0.0986*** 0.0991*** 0.0978*** 0.0472*** 0.0592*** 0.0578*** 0.0474***
LCC -0.0606*** -0.0440*** -0.0499*** -0.0256*** -0.0350*** -0.0691*** -0.0471***
Constant 0.8016*** -2.9417*** - -1.2278*** - -0.5601*** 0.0815
N 35140 35140 33029 35140 33029 35140 35140R2 0.549 0.253 0.147 0.454 0.303 - -
University of International Business and Economics

LOGO5. Results
2017/9/19 23University of International Business and Economics
Coefficients of T*overlap, T*rival and T*potential in the MU-FM merger
0.0273**
0.0424***0.0279*
0.0453**
0.0786***
0.0644***
0.0294***
0.0446***0.0398*** 0.0445***
0.0503***0.0428**0.0403*** 0.04***
0.00310.0078
0.024
-0.0159
-0.04
-0.02
0
0.02
0.04
0.06
0.08
0.1
1 year aftermerger
2 years aftermerger
3 years aftermerger
4 years aftermerger
5 years aftermerger
6 years aftermerger
T*overlap T*rival T*potential

LOGO5. Results
2017/9/19 24University of International Business and Economics
-0.015
0.0097
0.0585***
0.1225***
0.1534***
0.1916***
0.0254*** 0.0211**
0.0854***
0.1452*** 0.1549***0.1784***
0.0145
-0.0086
0.0342***
0.1093***
0.1469*** 0.1408***
-0.05
0
0.05
0.1
0.15
0.2
0.25
1 year aftermerger
2 years aftermerger
3 years aftermerger
4 years aftermerger
5 years aftermerger
6 years aftermerger
T*overlap T*rival T*potential

LOGOMarket power after merger
2017/9/19 25University of International Business and Economics
MU-FM Merger
-.6-.4
-.20
.2.4
Lern
er In
dex
20102008 2012 2014 20162007 2009 2011 2013 2015
China Eastern
CA-ZH Merger
-.6-.4
-.20
.2.4
Lern
er In
dex
2007 2008 2009 2010 2011 2012 2013 2014 2015 2016
Air China

LOGO6. Conclusion
2017/9/19 26University of International Business and Economics
First, the results are in line with the existing literature that both airline mergers triggered significant price increases on routes affected by mergers relative to the control group.
However, the average rise is smaller for the merger between China Eastern and Shanghai Airlines than between Air China and Shenzhen Airlines, although the former is of parallel nature.
We suppose that it was a result of the intense competition brought about by low cost carrier (LCC) and private airline that had a heavy presence in the Shanghai market.

LOGO6. Conclusion
2017/9/19 27University of International Business and Economics
Second, incorporating lag effects in our model, we find that in the long run, the price effects are similar in both MU-FM and CA-ZH mergers.
The patterns have been verified by the calculated Lerner indices, suggesting that substantial market power might not have arisen shortly after the merger until a few years later.
However, in the short run, the effects of the MU-FM merger are much larger than the CA-ZH merger.
The variate results in short-term and long-term could be caused by different network structure, distinct financial states and diverse market position of the companies involved in the two mergers.

LOGO6. Conclusion
2017/9/19 28University of International Business and Economics
Third, the empirical results show different effects of HSR on airfare during different time periods.
Specifically, before early 2014, HSR had significantly negative impact on airfare; while after early 2014, the negative effect of HSR on airfare gradually weakened and turned into positive effect.
Both airline-HSR cooperation after early 2014 and new strategies adapted by airlines in order to react to HSR’s competition are possible reasons causing the surprising results.
LOGOFuture research First, with the rapid development of HSR network in
China, airline-HSR cooperation has been topical and various theoretical models have been developed such as Xia et al. (2017). However, more empirical studies are needed to confirm the positive impact of HSR on airfares revealed in this study by using more recent data.
Second, we have analyzed the overall price effects of mergers in the Chinese airline market. It would be interesting to have an in-depth examination of a small number of important routes to airlines to give us a better understanding of how airlines interact in pricing by taking into more route-specific characteristics.
2017/9/19 此处添加公司信息 29

LOGO
Thank you!
Any Questions/Comments?
2017/9/19 30University of International Business and Economics