a combination method for multi-criteria decision making
TRANSCRIPT

Manufacturing Rev. 8, 26 (2021)© D. Duc Trung, Published by EDP Sciences 2021https://doi.org/10.1051/mfreview/2021024
Available online at:https://mfr.edp-open.org
RESEARCH ARTICLE
A combination method for multi-criteria decision making problemin turning processDo Duc Trung*
Faculty of Mechanical Engineering, Hanoi University of Industry, Hanoi, Vietnam
* e-mail: d
This is anO
Received: 4 August 2021 / Accepted: 27 September 2021
Abstract. This paper presents a multi-criteria decision making (MCDM) for a turning process. Anexperimental process was performed according to the sequence of a matrix using the Taguchi method with nineexperiments. The parameters including workpiece speed, feed rate, depth of cut, and nose radius were selected asthe input variables. At each experiment, three cutting force components that were measured in the threedirections X, Y, and Z, were Fx, Fy, and Fz, respectively. The value of Material Removal Rate (MRR) was alsocalculated at each experiment. The main purpose of this study is determination of an experiment in totalperformed experiments simultaneously ensuring the minimum Fx, Fy, and Fz and the maximum MRR. TheEntropy method was applied to determine the weights for parameters Fx, Fx, Fx, and MRR. Eight MCDMmethods were applied for multi-criteria decision making, this has not been performed in any studies. Theimplementation steps of each method were also presented in this paper. Seven ones of these eight methodsdetermined the best experiment in total nine performed experiments. A new multi-criteria decision-makingmethod as well as orientation for the further works were also proposed in this study.
Keywords: MCDM / Taguchi / weight / entropy / multi-criteria decision making methods / turning
1 Introduction
The concept of “multi-criteria decision making � MCDM”is used to make a decision for selecting an option related tomultiple criteria, of which the criteria may be contradicto-ry. There are many mathematical tools to support themulti-criteria decision making such as SAW (simpleadditive weighting) [1], WASPAS (weighted aggregatessum product assessment) [2], TOPSIS (preference bysimilarity to ideal solution) [3], VIKOR (vlsekriterijumskaoptimizacija i kompromisno resenje in Serbian) [4],MOORA (multiobjective optimization on the basis ofratio analysis) [5], COPRAS (complex proportionalassessment) [6], PIV (proximity indexed value) [7], PSI(preference selection index) [8], etc. These methods wereapplied for multi-criteria decision making in many studies,undermany different fields. Only considering in the turningprocess, these methods were also applied in many studies.The following is a summary of main contents of a number ofstudies on multi-criteria decision-making in turningprocesses that were published.
The TOPSIS method was used for multi-criteriadecision making when turning EN8 steel [9]. Theexperimental matrix was designed according to the
penAccess article distributed under the terms of the CreativeComwhich permits unrestricted use, distribution, and reproduction
Taguchi method with 27 experiments. In this study, thecutting velocity, feed rate, and depth of cut were selected asthe input parameters. The output parameters that wereselected included surface roughness (Ra) and MaterialRemoval Rate (MRR). The weights of the criteria weredetermined by the Entropy method. This study deter-mined an experiment that simultaneously ensured theminimum surface roughness and the maximum MRR.
Multi-criteria decisionmaking when turning EN25 steelwas also carried out using the TOPSISmethod [10]. In thisstudy, the experimental matrix of 18 experiments was alsodesigned according to Taguchi method. The parametersincluding the type of cutting tool materials, cuttingvelocity, feed rate, and depth of cut were selected as theinput parameters. The hardness of workpiece surface,surface roughness, and MRR were selected as the outputparameters. The weights of criteria were determined usingthe Analytic Hierarchy Process (AHP) method. This studydetermined an experiment where the minimum values ofhardness of workpiece surface and surface roughness, andthe maximum value ofMRR were simultaneously ensured.
The TOPSIS method was also used for multi-criteriadecision making when turning AISI 52100 steel [11]. Thecutting velocity, feed rate, depth of cut, nose radius, andnegative rake angle were selected as the input parameters.The experimental matrix was also designed according to
monsAttribution License (https://creativecommons.org/licenses/by/4.0),in any medium, provided the original work is properly cited.

2 D. Duc Trung: Manufacturing Rev. 8, 26 (2021)
the Taguchi method with 32 experiments. The surfaceroughness and cutting force were measured at eachexperiment. This study determined an experiment wherethe minimum surface roughness and minimum cuttingforce were simultaneously ensured.
In turning processes of EN19 steel, the multi-criteriadecision making was also performed by the TOPSISmethod [12]. A matrix (nine experiments) was designedaccording to the Taguchi method with the inputparameters including cutting velocity, feed rate, and depthof cut. MRR, Ra (the arithmetic mean roughness), and Rz(the maximum roughness) were selected as the criteria forassessing the turning process. The Entropy method wasalso used to determine the weight for each criterion. Thisstudy has determined an experiment where the minimumRa and Rz, and the maximum MRR were ensuredsimultaneously.
The TOPSISmethod was also applied to make a multi-criteria decision when turning AISI D2 steel [13]. In thisstudy, an experimental matrix was also designed accordingto the Taguchi method with 20 experiments. The cuttingvelocity, feed rate, and depth of cut were also selected asthe input parameters. Surface roughness and MRR wereselected as the output parameters. The weights of criteriawere calculated using the Entropy method. This studydetermined an experiment where the minimum surfaceroughness and the maximum MRR were simultaneouslyensured.
The authors also used the TOPSIS method for multi-criteria decision making when turning Pure Titaniummaterial [14]. They also designed an experimental matrixaccording to the Taguchi method with nine experiments.The cutting velocity, feed rate, and depth of cut wereselected as the input parameters. The cutting force, surfaceroughness, tool life, and MRR were selected as the criteriato assess the turning process. The weight of each criterionwas selected by the authors of this paper. Finally, theydetermined an experiment where the minimum cuttingforce and surface roughness, the maximum tool life andMRR were simultaneously ensured.
The TOPSIS and MOORA methods were used formulti-criteria decision making when turning ASTM A558steel [15]. The spindle speed, feed rate, and depth of cutwere selected as the input parameters. An experimentalmatrix was designed according to the Taguchi methodwith 27 experiments. The cutting power, surface rough-ness, and tool vibration frequency were determined ineach experiment. The weights of the criteria weredetermined by the Principal Component Analysis(PCA) method. The ranking results of the performedexperiments by these two methods were completelydifferent. The authors explained that the ranking ofoptions by the TOPSIS method based on the Euclideandistance function is not related to the machiningcharacteristics and cutting power.
TheTOPSIS and SAWmethods were applied for multi-criteria decision making when turning Ti-6Al-4V steel [16].In this study, they selected cutting velocity, feed rate, anddepth of cut as the input parameters. An experimentalmatrix was designed according to the Taguchi method with27 experiments. The surface roughness, tool wear, cutting
temperature, and cutting force were selected as the outputparameters. The purpose of this study is determination ofan experiment in total 27 performed experiments thatsimultaneously ensured all four output parameters with theminimum values. The weights of criteria were determinedby the AHP method. The ranking results according to thetwo methods coincided with 16/27 options (with of 11different options). However, both methods have consistentresults in determining the best and worst experiments.
The VIKOR method was applied for multi-criteriadecision making when turning EN 10503 steel [17]. In thisstudy, they also designed an experimental matrix accord-ing to the Taguchi method with nine experiments. Thespindle speed, feed rate, and depth of cut were selected asthe input parameters. The weight of MRR was selected tobe 0.5, the weight of remaining criteria (surface roughnessand three cutting force components) has also been selectedto be 0.5. The authors of this study determined anexperiment that simultaneously ensures the minimumsurface roughness, three minimum cutting force compo-nents, three minimum vibration components and themaximum MRR.
When turning the CP-Titanium Grade 2 material, theauthors also designed an experimental matrix according tothe Taguchi method with 27 experiments [18]. In thisstudy, they selected cutting velocity, feed rate, and depthof cut as the input parameters. They measured surfaceroughness, MRR, and cutting force for each experiment.The VIKOR method was applied to determine anexperiment where simultaneously ensured the minimumsurface roughness, maximum MRR and minimum cuttingforce. In which the authors also selected the weight ofMRR to be 0.5, and the weight of remaining criteria(surface roughness and cutting force) was also selected tobe 0.5.
The VIKOR method also was used for multi-criteriadecisionmaking when turning AISI 316Lmaterial [19]. Thecutting parameters including workpiece speed, feed rate,and depth of cut were selected as the input parameters foreach experiment. An experimental matrix was alsodesigned according to the Taguchi method with 16experiments. Surface roughness, tool wear, and MRR weredetermined for each experiment. The weight of MRR wasselected to be 0.5, the weight of remaining criteria (surfaceroughness and tool wear) was also selected to be 0.5. Thisstudy determined an experiment where simultaneouslyensured theminimum surface roughness, theminimum toolwear and the maximum MRR.
In study [20], theVIKORmethod has also been used formulti-criteria decision making when turning mild steel. Inthis study, an experimental matrix was also designedaccording to the Taguchi method with 9 experiments. Thecutting velocity, feed rate, depth of cut, and coolant flowwere selected as the input parameters. The surfaceroughness, MRR, and energy consumption were deter-mined in each experiment. The weight ofMRRwas selectedto be 0.5, the weight of remaining criteria (surfaceroughness and energy consumption) was also selected tobe 0.5. This study has selected an experiment wheresimultaneously ensures the minimum surface roughnessand energy consumption, and the maximum MRR.

D. Duc Trung: Manufacturing Rev. 8, 26 (2021) 3
The authors also designed an experimental matrixaccording to the Taguchi method for turning AA7075aluminum alloy [21]. They also selected cutting velocity,feed rate, and depth of cut as the input parameters for theexperimental process. At each experiment, they deter-mined MRR, Ra, Rz, and Rq (the root-mean-squareroughness). They also applied the VIKOR method todetermine an experiment which simultaneously ensuredthe maximum MRR, the minimum Ra, Rq and Rzparameters. In this study, the weight of each criterionwas selected to be 0.25.
The MOORA method was used for multi-criteriadecision making when turning EN 10503 steel [22]. Theauthors of this study also designed an experimental matrixaccording to the Taguchi method with nine experiments.The cutting velocity, feed rate, depth of cut, and noseradius were also selected as the input parameters. Thesurface roughness, three cutting force components, andMRRwere determined for each experiment. The weights ofthese output parameters were calculated by the Entropymethod. This study determined an experiment wheresimultaneously ensured the minimum surface roughness,the three minimum cutting force components and themaximum MRR.
The MOORA method for multi-criteria decisionmaking when turning EN25 steel [23]. In this study, theparameters including nose radius, cutting velocity, feedrate, and depth of cut were selected as the inputparameters. The surface roughness, workpiece hardnessafter turning, and MRR were determined for eachexperiment. An experimental matrix was also designedaccording to the Taguchi method with 18 experiments. Theweight of each output parameter was calculated using theEntropy method. Finally, they determined an experimentat which the minimum surface roughness and minimumworkpiece surface hardness and the maximum MRR weresimultaneously ensured.
The MOORA method has also been used for multi-criteria decision making when turning Al6026-T9 alumi-num alloy [24]. The cutting velocity, feed rate, depth of cut,positive rake angle, and cutting conditions (Dry andMQL)were selected as input parameters. An experimental matrixwas also designed according to the Taguchi method withsixteen experiments. At each experiment, the feed force,tangential force, radial force, resultant cutting force, andshape deviations were measured. The weights of responseswere determined according to the CRriteria ImportanceThrough Inter-criteria Correlation (CRITIC) method.This study determined an experiment that ensured allresponse having a minimum value.
The authors also used MOORA method for multi-criteria decision making when turning Commercially PureTitanium (Cp-Ti) [25]. A matrix including 27 experimentswas also designed according to the Taguchi method. Thecutting velocity, feed rate, and depth of cut were selected asthe input parameters. The cutting force, surface roughness,and tool wear were determined in each experiment. Theweights of these output parameters were determined usingthe Fuzzy logic method. Finally, they have determined anexperiment that ensured all three responses having aminimum value simultaneously.
The MOORA and WASPAS methods were used formulti-criteria decision making when turning Al 6063aluminum alloy [26]. The cutting speed, feed rate, depthof cut, and percentage of TiC (additive in materials) wereselected as input parameters. The cutting force, surfaceroughness, and MRR were selected as responses of eachexperiment. The Entropy method was selected to deter-mine the weight of responses. The results of ranking optionsaccording to the two methods completely coincided in 27experiments. Finally, this study has determined anexperiment where the minimum cutting force and surfaceroughness, and the maximum MRR were simultaneouslyensured.
The authors combined the COPRAS method with theGrey decision-making system method (COPRAS-G meth-od) for multi-criteria decision making when turning ASTMA36 steel [27]. In this study, they designed an experimentalmatrix according to the Taguchi method with 27 experi-ments. The input parameters included spindle speed, feedrate, and depth of cut. At each experiment, the cuttingpower, tool vibration, and surface roughness were deter-mined. The weights of output parameters were calculatedaccording to the “relative weights for each option”method.Finally, they determined an experiment that simulta-neously ensured all three output parameters having aminimum value.
The PSI method is known as a multi-criteria decisionmaking method without determining the weights forcriteria [8]. This method was used for multi-criteriadecision making when turning EN24 steel [28]. In thisstudy, an experimental matrix was also designed accordingto Taguchi method with sixteen experiments. The spindlespeed, feed rate, depth of cut, and nose radius were selectedas the input parameters. The surface roughness and MRRwere selected as the output parameters. This studydetermined an experiment that simultaneously ensuredthe minimum surface roughness and the maximum MRR.
Through the above studies on the multi-criteriadecision making of the turning process, it is shown that:
Firstly, the experimental matrix is usually designedaccording to the Taguchi method. This is also easy tounderstand because this is a method that allows to design amatrix with a small number of experiments with a largenumber of input parameters and each input parameter hasmany value levels. Another outstanding advantage of theTaguchi method is that it allows the selection of inputparameters with the qualitative parameters [29].
Secondly, spindle speed (cutting velocity), feed rate,depth of cut, and nose radius are often selected as the inputparameters. This is also easy to understand as these areparameters that can be easily adjusted by the machineoperator.
Thirdly, the determination of weights for the criteriawas performed by several methods (Entropy, AHP, PCA,etc.) or by the selection of decision makers. However, itmust also be said that, if the weighting of the criteria isperformed according to a subjective opinion of the decisionmaker, it is an act that lacks the necessary reliability. Theweighting of each criterion is performed by expert opinionsalso depends a lot on the knowledge of experts, andsometimes is also greatly influenced by the designing of

4 D. Duc Trung: Manufacturing Rev. 8, 26 (2021)
questionnaires. The fact shows that the Entropy methodhas been used more than other methods. This provides us asolid confidence in the accuracy of this method.
Fourthly, although the above MCDM methods havebeen applied in many studies. However, no studies haveapplied all above methods in multi-criteria decisionmakingfor the turning process. If the multi-criteria decision-making for a machining process is performed by multiplemethods that indicate the same best option too, theconfidence level of the obtained results will be increased.
Fifthly, PIV is a method for multi-criteria decisionmaking, firstly introduced in 2018 [7]. This method hasbeen successfully applied in multi-criteria decision makingin some cases, such as in the ranking and selection ofE-learning sites [30], for the selection of materials tomanufacture some parts of automobiles [31], for theselection of elements in logistics activities of the EUcountries [32], for the selection of additives in a productionprocess [33]. However, up to now, no studies have beenfound to apply this method for multi-criteria decisionmaking in the turning process.
From the above analysis, this paper will inherit anddevelop to fill the gaps that previous studies have not done.In particular, the Taguchi method will be applied to designan experimental matrix with input parameters includingspindle speed, feed rate, depth of cut, and nose radius.Three components of cutting force Fx, Fy, Fz, andMRR areselected as the criteria for evaluating the turning process.The weights of criteria will be determined by the Entropymethod. All eight methods including SAW, WASPAS,TOPSIS, VIKOR, MOORA, COPRAS, PIV, PSI, areapplied for multi-criteria decision making. The objective ofthis study is determination of an experiment thatsimultaneously ensures three minimum components ofcutting force and the maximum MRR.
2 Determine the weights using the Entropymethod
Determining the weights of criteria by the Entropy methodis performed according to the following steps [34–36].
Step 1. Determine the normalized value for thecriteria.
pij ¼yij
mþXm
i¼1y2ij
ð1Þ
where yij is the value of the criterion j corresponding to theoption i; m is the number of options (solutions).
Step 2. Calculate the value of the Entropy measure-ment degree for each criterion.
ej ¼ �Xm
i¼1pij � lnðpijÞ� �� 1�
Xm
i¼1pij
� �
� ln 1�Xm
i¼1pij
� �ð2Þ
Step 3. Calculate the weight for each criterion.
wj ¼ 1�ejXm
j¼11�ejð Þ. (3)
3 MCDM methods
3.1 SAW method
The SAWmethod was firstly recommended in 2006 [1]. Theimplementation steps according to this method arepresented as follows.
Step 1.Establish an initial decision-makingmatrix (Y)as shown in equation (4).Wherem is the number of options((A1, A2,…,Am), n is the number of criteria (C1, C2,…,Cn).
Y ¼A1
A2
⋯
Am
C1 C2 ⋯ Cn
y11 y12 ⋯ y1n
y21 xy22 ⋯ y2n
⋯ ⋯ ⋯ ⋯
ym1 ym2 ⋯ ymn
266664
377775
ð4Þ
Step 2. Determine the normalized matrix according tothe following formula.
nij ¼yij
max yijfor C1;C2; :::;Cn ∈B ð5Þ
nij ¼min yijyij
for C1;C2; :::;Cn ∈C ð6Þ
where B represents the criterion as large as better, Crepresents the criterion as small as better.
Step 3. Calculate the preference value for each option.
V i ¼Xnj¼1
wj⋅nij ð7Þ
where wj is the weight of the criterion j.Step 4. Rank the options according to the principle that
the best solution is the solution having the maximum Vi.
3.2 WASPAS method
The WSPAS method was firstly recommended in 2012 [2],the performing steps are presented as follows.
Step 1 and Step 2: The same step 1 and step 2 of theSAW method.
Step 3. Develop a weight matrix by multiplying theinitial matrix by the weights of criteria withwj is the weightof the criterion j.
nn ¼ nij� �
m�nð8Þ
nij ¼ wj � nij; i ¼ 1; 2; . . . ; m j ¼ 1; 2; . . . ;n ð9ÞStep 4. Calculate the sum the values nij in each row for
each solution.
Qi ¼ qij� �
1�mð10Þ
qij ¼Xn
j¼1nij ð11Þ

D. Duc Trung: Manufacturing Rev. 8, 26 (2021) 5
Step 5. Calculate the product the values (nij)wj in each
the row for each solution.
Pi ¼ pij� �
1�mð12Þ
pij ¼ ∏nj¼1 nij
� �wj ð13Þ
Step 6.Determine the relative valuesAi of the options.
Ai ¼ aij� �
1�mð14Þ
Ai ¼ l � Qi þ 1� lð Þ � Pi ð15Þwhere the factor l can be choose one of the following values:0; 0.1; 0.2; ...; 1.0
Step 7. Rank the options according to the principlethat the best option is the solution having themaximumAi.
3.3 TOPSIS method
The implementation steps of the TOPSIS method aredescribed as follows [3].
Step 1: The same step 1 of the SAW method.Step 2: Determine the converted values according to
the formula.
y0ij ¼yijffiffiffiffiffiffiffiffiffiffiffiffiffiffiffiffiffiffiXn
i¼1y2ij
q ð16Þ
Step 3: Calculate a normalized matrix according to theformula.
Y ¼ wj:y0ij ð17Þ
where wj is the weight of the criterion j.Step 4: Determine the best solution A+ and the worst
solution A- for the criteria according to the followingformulas.
Aþ ¼ yþ1 ; yþ2 ; . . . ; y
þj ; . . . ; y
þn
n oð18Þ
A� ¼ y�1 ; y�2 ; . . . ; y
�j ; . . . ; y
�n
n oð19Þ
where yþj and y�j are the best and worst values of thecriterion j, respectively.
Step 5: Determine the values Sþi and S�
i according tothe following two formulas.
Sþi ¼
ffiffiffiffiffiffiffiffiffiffiffiffiffiffiffiffiffiffiffiffiffiffiffiffiffiffiffiffiffiffiffiffiffiffiffiffiffiffiXn
j¼1yij � yþj
� �2r
i ¼ 1; 2; . . . ; m ð20Þ
S�i ¼
ffiffiffiffiffiffiffiffiffiffiffiffiffiffiffiffiffiffiffiffiffiffiffiffiffiffiffiffiffiffiffiffiffiffiffiffiffiffiXn
j¼1yij � y�j
� �2r
i ¼ 1; 2; . . . ; m ð21Þ
Step 6: Determine the values C�i according to the
formula.
C�i ¼
S�i
Sþi þ S�
i
i ¼ 1; 2; . . . ; m; 0 � C�i � 1 ð22Þ
Step 7: Rank the options according to the principlethat the option with the maximum value of C�
i is the bestsolution.
3.4 VIKOR method
The implementation steps of the VIKOR method arepresented as follows [4].
Step 1: Determine the best value y*j and the worstvalue y-j of all criteria.
–If the criterion j is a positive one, then: y*j=max yij,and y-j =min yij.
– If the criterion j is a negative one, then: y*j =min yij,and y-j =max yij.
Step 2: Calculate the values rij, Si, Ri according to thefollowing formulas.
rij ¼ jy�j � yijj� �
= jy�j � y�j j� �
ð23Þ
Si ¼Xnj¼1
wj jy�j � yijj� �
= jy�j � y�j j� �
¼Xnj¼1
wjrij ð24Þ
Ri ¼ max wj jy�j � yijj� �
= jy�j � y�j j� �h i
¼ max wjrij� �
ð25ÞStep 3: Calculate Qi
Qi ¼ n Si � S�ð Þ= S� � S�ð Þ þ 1� nð Þ Ri �R�ð Þ= R� �R�ð Þð26Þ
with 0� n� 1 where n is the weight of the positive group.Normally n=0.5 [4].
1� n is the weight of the negative group.
S� ¼ minSi ð27Þ
S� ¼ maxSi ð28Þ
R� ¼ minRi ð29Þ
R� ¼ maxRi ð30ÞStep 4: Rank the options according to the principle
that the option with the minimum Qi is the best one.
3.5 MOORA method
TheMOORAmethod was firstly introduced in 2004 [5], thesteps are presented as follows.

6 D. Duc Trung: Manufacturing Rev. 8, 26 (2021)
Step 1 and Step 2: The same step 1 and step 2 of theSAW method.
Step 3: Calculate a normalized decision making matrixXij
� �m�n
according to the formula.
X ¼ Xij
� �m�n
; with Xij ¼yijPmi¼1 y
2ij
ð31Þ
Step 4: Calculate the decision making matrices afternormalizing the weights according to the formula.
Wij ¼ wj � yij ð32Þ
Step 5: Calculate Pi and Ri according to the followingtwo formulas.
Pi ¼ 1
jBjXj∈B
Wij ð33Þ
Ri ¼ 1
jNBjXj∈NB
Wij ð34Þ
where B and NB are the number of the criterion as large asbetter and the criterion as small as better, respectively.
Step 6: Calculate the values Qi according to theformula.
Qi ¼ Pi �Ri ð35ÞStep 7: Rank the options according to the principle
that the option with the minimum Qi is the best one.
3.6 COPRAS method
The COPRAS method was firstly introduced in 1994 [6].The steps are presented as follows.
Step 1 and Step 2: The same step 1 and step 2 of theSAW method.
Step 3, Step 4, and Step 5: The same step 3, step 4,and step 5 of the MOORA method.
Step 6: Calculate the values Qi according to theformula.
Qi ¼ Pi þXm
i¼1Ri
Ri �Xm
i¼1
1
Ri
ð36Þ
Step 7: Rank the options according to the principlethat the option with the minimum Qi is the best one.
3.7 PIV method
The PIV method was firstly introduced in 2018 [7]. Theimplementation steps for multi-criteria decision makingaccording to this method are presented as follows:
Step 1 and Step 2: The same step 1 and step 2 of theSAW method.
Step 3: Determine the normalized decision-makingmatrix using the formula.
Rj ¼yjffiffiffiffiffiffiffiffiffiffiffiffiffiffiffiffiffiXm
i¼1y2j
q ð37Þ
Of which Yi is the actual decision value of option i.Step 4: Determine the weighted normalized decision-
making matrix according to the formula.
nj ¼ W j � Rj ð38ÞOf which wj is the weight of the criterion j.Step 5: Evaluate the weighted proximity index
according to the following formula.
ui ¼nmax � ni for the criterion as large as better
ni � nmin for the criterion as small as better
ð39Þ
Step 6. Determine the overall proximity valueaccording to the following formula.
di ¼Xnj¼1
ui ð40Þ
Step 7. Rank the options according to the principlethat the option with the minimum di is the best one
3.8 PSI method
The PSI method was firstly introduced in 2010 as the onefor multi-criteria decision making without determining theweight of the criteria [8]. The implementation stepsaccording to this method are presented as follows.
Step 1: Normalize the attributes.
Nij ¼yijymaxj
for the criterion as large as better ð41Þ
Nij ¼yminj
yijfor the criterion as small as better ð42Þ
Step 2: Calculate the mean value of the normalizeddata.
N ¼ 1
n
Xn
i¼1Nij ð43Þ
Step 3: Determine the preference value from the meanvalue.
’j ¼Xn
i¼1Nij � n� �2 ð44Þ
Step 4: Determine the deviation in the preferencevalue.
∅j ¼ 1� ’j
� � ð45Þ

Table 1. Input parameters.
Parameters Symbol Unit Value at the level
1 2 3
Workpiece speed nw rev/min 460 650 910Feed rate fd mm/rev 0.08 0.194 0.302Depth of cut ap mm 0.15 0.30 0.45Nose radius r mm 0.4 0.6 1.2
Table 2. Experimental matrix.
Trial. Coded value Actual value
x1 x2 x3 x4 nw (rev/min) fd (mm/rev) ap (mm) r (mm)
1 1 1 1 1 460 0.08 0.20 0.42 1 2 2 2 460 0.194 0.35 0.63 1 3 3 3 460 0.302 0.50 1.24 2 2 3 3 650 0.08 0.35 1.25 2 3 1 1 650 0.194 0.50 0.46 2 1 2 2 650 0.302 0.20 0.67 3 3 2 2 910 0.08 0.50 0.68 3 1 3 3 910 0.194 0.20 1.29 3 2 1 1 910 0.302 0.35 0.4
D. Duc Trung: Manufacturing Rev. 8, 26 (2021) 7
Step 5: Determine the overall preference value for thecriteria.
bj ¼∅jXm
j¼1∅j
ð46Þ
Step 6: Calculate the Preference Selection Index (PSI)of each option.
uj ¼Xmj¼1
yij:b j ð47Þ
Step 7: Rank the options according to the principlethat the solution with with the maximum ui is the best one.
4 Turning process experiment
The experimental workpiece is 150Cr14 steel with adiameter of 30mm and a length of 280mm. This is amartensitic steel, and this steel was commonly used tomake wear-resistant parts such as shafts, gears, turbines,rolling shafts, etc.
The TiAlN coated insert was used during theexperimental process. This cutter insert type has highhardness, high wear resistance as well as high toughness.So, this type of cutting tool has capable of reducingchipping during the machining process.
Four parameters including cutting velocity (nw), feedrate (fd), depth of cut (ap), and nose radius (r) wereselected as the input parameters of the experimentalprocess. These parameters can be easily adjusted by themachine operator.
The Taguchi method was applied to design anexperimental matrix. Each input parameter was selectedwith three value levels as shown in Table 1. These valueswere selected according to the recommendations of thecutting tool manufacturer and according to the technolog-ical capabilities of the experimental machine. Theorthogonal matrix with nine experiments is presented inTable 2.
Cutting forces directly influence on the machinedsurface roughness and tool life, and cutting forces are alsoinfluenced by many factors in machining processes [37,38].In this study, three cutting force components in threedirections (X, Y, Z) were determined at each experimentalpoint. The experiments were performed in a conventionallathe. The force sensor (Kistler type 9139AA) was used tomeasure three components of the cutting force. The forcesensor is placed on the carriage, then the tool holder is fixedon the force sensor (Fig. 1). The value of the cutting force ineach direction in each experiment is calculated as itsaverage value during the cutting time.
MRR is the most important measure to evaluate theproductivity of the cutting process [39]. MRR is calculatedaccording to formula (48). Where nw is the number ofrevolutions of the workpiece per minute, d is the diameter
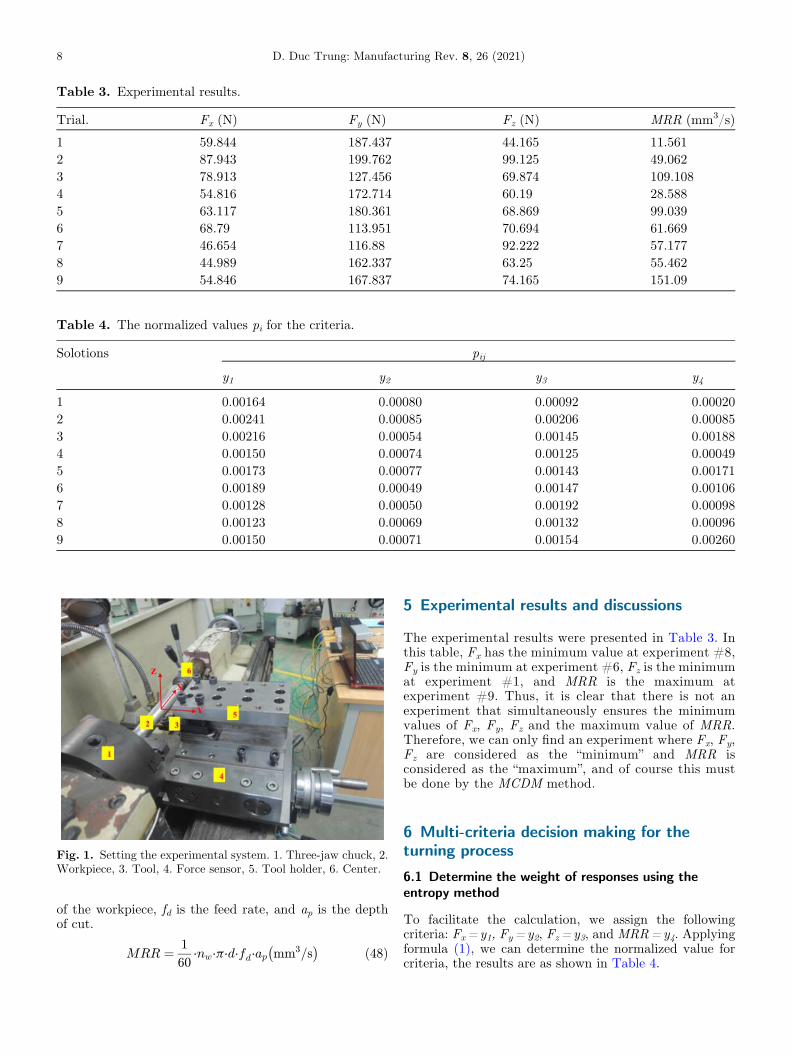
Fig. 1. Setting the experimental system. 1. Three-jaw chuck, 2.Workpiece, 3. Tool, 4. Force sensor, 5. Tool holder, 6. Center.
Table 3. Experimental results.
Trial. Fx (N) Fy (N) Fz (N) MRR (mm3/s)
1 59.844 187.437 44.165 11.5612 87.943 199.762 99.125 49.0623 78.913 127.456 69.874 109.1084 54.816 172.714 60.19 28.5885 63.117 180.361 68.869 99.0396 68.79 113.951 70.694 61.6697 46.654 116.88 92.222 57.1778 44.989 162.337 63.25 55.4629 54.846 167.837 74.165 151.09
Table 4. The normalized values pi for the criteria.
Solotions pij
y1 y2 y3 y4
1 0.00164 0.00080 0.00092 0.000202 0.00241 0.00085 0.00206 0.000853 0.00216 0.00054 0.00145 0.001884 0.00150 0.00074 0.00125 0.000495 0.00173 0.00077 0.00143 0.001716 0.00189 0.00049 0.00147 0.001067 0.00128 0.00050 0.00192 0.000988 0.00123 0.00069 0.00132 0.000969 0.00150 0.00071 0.00154 0.00260
8 D. Duc Trung: Manufacturing Rev. 8, 26 (2021)
of the workpiece, fd is the feed rate, and ap is the depthof cut.
MRR ¼ 1
60⋅nw⋅p⋅d⋅fd⋅ap mm3=s
� � ð48Þ
5 Experimental results and discussions
The experimental results were presented in Table 3. Inthis table, Fx has the minimum value at experiment #8,Fy is the minimum at experiment #6, Fz is the minimumat experiment #1, and MRR is the maximum atexperiment #9. Thus, it is clear that there is not anexperiment that simultaneously ensures the minimumvalues of Fx, Fy, Fz and the maximum value of MRR.Therefore, we can only find an experiment where Fx, Fy,Fz are considered as the “minimum” and MRR isconsidered as the “maximum”, and of course this mustbe done by the MCDM method.
6 Multi-criteria decision making for theturning process
6.1 Determine the weight of responses using theentropy method
To facilitate the calculation, we assign the followingcriteria: Fx=y1, Fy=y2, Fz= y3, and MRR=y4. Applyingformula (1), we can determine the normalized value forcriteria, the results are as shown in Table 4.

Table 5. Entropy measure of the criteria.
ej
y1 y2 y3 y4
0.11271 0.05037 0.10007 0.08099
Table 6. The weight of criteria.
wj
y1 y2 y3 y4
0.2427 0.25976 0.24616 0.25138
Table 7. Normalized matrix.
Solotions nij
y1 y2 y3 y4
1 0.75177 0.60794 1.00000 0.076521 0.51157 0.57043 0.44555 0.324722 0.57011 0.89404 0.63207 0.722144 0.82073 0.65977 0.73376 0.189215 0.71279 0.63179 0.64129 0.655506 0.65400 1.00000 0.62473 0.408167 0.96431 0.97494 0.47890 0.378438 1.00000 0.70194 0.69826 0.367089 0.82028 0.67894 0.59550 1.00000
Table 8. Vi values of each option and ranking of options.
Solotions Vi Ranking
1 0.60577 72 0.46364 93 0.70772 24 0.59876 85 0.65975 66 0.67487 57 0.70030 38 0.68920 49 0.77341 1
D. Duc Trung: Manufacturing Rev. 8, 26 (2021) 9
Applying formula (2), we can determine the entropymeasure degree for the criteria, the results are shown inTable 5.
Applying formula (3), we can determine the weights forthe criteria, the results are presented in Table 6.
6.2 Multi-Criteria decision making using the SAWmethod
Establish an initial decision-making matrix (Y). Thismatrix is the last 4 columns in Table 3 (table ofexperimental results).
Normalize the initial matrix according to formulas (5)and (6). The results are presented in Table 7.
Calculate the preference value for each option accord-ing to formula (7). The results are presented in Table 8.The ranking of options according to the values Vi has alsobeen carried out, the results were also added in this table.The ranking of options was also performed in this table.
6.3 Multi-criteria decision making using the WASPASmethod
Develop a weighted matrix by multiplying the initialmatrix by the weights of criteria according to formulas (8)and (9), where the weight of criteria was determined (inTab. 6). The results are presented in Table 9.
Calculate the sum of all the values vij of the criteria ineach option according to formulas (10) and (11). Theresults are included in Table 10.
Calculate the product of all values (vij)wj of the criteria
in each option according to formulas (12) and (13). Theresults were also added in Table 10.
Determine the relative valuesAi of options according toformulas (14) and (15). The results are shown in Table 10.
The ranking of options according to the value Ai wasalso added in Table 10.
6.4 Multi-criteria decision making using the TOPSISmethod
Applying the formula (16) to determine the convertedvalues for the criteria as shown in Table 11.
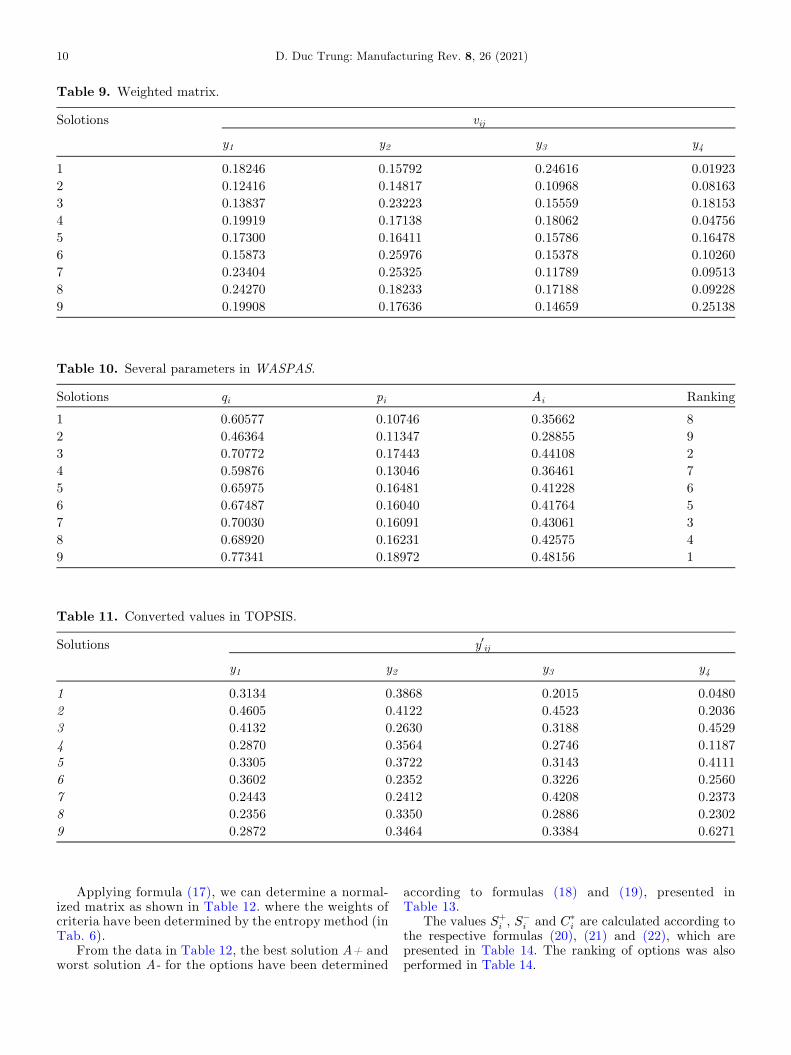
Table 9. Weighted matrix.
Solotions vij
y1 y2 y3 y4
1 0.18246 0.15792 0.24616 0.019232 0.12416 0.14817 0.10968 0.081633 0.13837 0.23223 0.15559 0.181534 0.19919 0.17138 0.18062 0.047565 0.17300 0.16411 0.15786 0.164786 0.15873 0.25976 0.15378 0.102607 0.23404 0.25325 0.11789 0.095138 0.24270 0.18233 0.17188 0.092289 0.19908 0.17636 0.14659 0.25138
Table 10. Several parameters in WASPAS.
Solotions qi pi Ai Ranking
1 0.60577 0.10746 0.35662 82 0.46364 0.11347 0.28855 93 0.70772 0.17443 0.44108 24 0.59876 0.13046 0.36461 75 0.65975 0.16481 0.41228 66 0.67487 0.16040 0.41764 57 0.70030 0.16091 0.43061 38 0.68920 0.16231 0.42575 49 0.77341 0.18972 0.48156 1
Table 11. Converted values in TOPSIS.
Solutions y0ij
y1 y2 y3 y4
1 0.3134 0.3868 0.2015 0.04802 0.4605 0.4122 0.4523 0.20363 0.4132 0.2630 0.3188 0.45294 0.2870 0.3564 0.2746 0.11875 0.3305 0.3722 0.3143 0.41116 0.3602 0.2352 0.3226 0.25607 0.2443 0.2412 0.4208 0.23738 0.2356 0.3350 0.2886 0.23029 0.2872 0.3464 0.3384 0.6271
10 D. Duc Trung: Manufacturing Rev. 8, 26 (2021)
Applying formula (17), we can determine a normal-ized matrix as shown in Table 12. where the weights ofcriteria have been determined by the entropy method (inTab. 6).
From the data in Table 12, the best solution A+ andworst solution A- for the options have been determined
according to formulas (18) and (19), presented inTable 13.
The values Sþi , S
�i and C�
i are calculated according tothe respective formulas (20), (21) and (22), which arepresented in Table 14. The ranking of options was alsoperformed in Table 14.

Table 12. Normalized matrix Y=wj · y0ij.
Solutions wj · y0ij
y1 y2 y3 y4
1 0.0761 0.1005 0.0496 0.01212 0.1118 0.1071 0.1113 0.05123 0.1003 0.0683 0.0785 0.11384 0.0697 0.0926 0.0676 0.02985 0.0802 0.0967 0.0774 0.10336 0.0874 0.0611 0.0794 0.06437 0.0593 0.0627 0.1036 0.05978 0.0572 0.0870 0.0710 0.05799 0.0697 0.0900 0.0833 0.1576
Table 13. The best and worst solutions.
y1 y2 y3 y4
A+ 0.0572 0.0611 0.0496 0.1576A− 0.1118 0.1071 0.1113 0.0121
Table 14. Several values in TOPSIS.
Solutions Si+ Si− C*i Ranking
1 0.1745 0.0716 0.2910 82 0.1683 0.0391 0.1887 93 0.0921 0.1143 0.5539 24 0.1559 0.0649 0.2939 75 0.1116 0.1029 0.4797 36 0.1163 0.0804 0.4087 47 0.1254 0.0840 0.4012 58 0.1302 0.0843 0.3929 69 0.0912 0.1551 0.6295 1
Table 15. Minimum and maximum values of the criteria.
y1 y2 y3 y4
Min yij 87.9430 199.7620 99.1250 11.5610Max yij 44.9890 113.9510 44.1650 151.0900
D. Duc Trung: Manufacturing Rev. 8, 26 (2021) 11
6.5 Multi-criteria decision making using the VIKORmethod
Determine the best value y*j and worst value y−j of allcriteria, the results are presented in Table 15. Where for thecriteriay1,y2, andy3 is thebestvalue is theminimumone,andfor the criterion y4 is the best value is the maximum one.
The calculated results of rij according to formula (23)are presented in Table 16.
The calculated results of Si, Ri, and Qi according to theformulas from (24) to (30) are presented in Table 17.Where
the weight ofMRR (the bigger the better) is also selected as0.5, the weight of remaining criteria (Fx, Fy, Fz � thesmaller the better) is also selected as 0.5 [4]. The results ofranking options according to the value Qi have also beenshown in this table.
6.6 Multi-criteria decision making using the MOORAmethod
Using equation (31) to calculate the normalizedmatrix, thecalculated results were presented in Table 18.

Table 16. Values rij.
Solutions rij
y1 y2 y3 y4
1 0.6542 0.1436 1.0000 0.00002 0.0000 0.0000 0.0000 0.26883 0.2102 0.8423 0.5322 0.69914 0.7712 0.3151 0.7084 0.12205 0.5780 0.2260 0.5505 0.62706 0.4459 0.9996 0.5173 0.35917 0.9612 0.9655 0.1256 0.32698 1.0000 0.4360 0.6527 0.31469 0.7705 0.3719 0.4541 1.0000
Table 17. Values Si, Ri, and Qi and ranking.
Solutions Si Ri Qi Ranking
1 0.0676 0.3333 0.5977 82 0.0676 0.3333 0.0000 93 0.0676 0.3333 0.8455 54 0.0676 0.3333 0.7485 65 0.0676 0.3333 0.6135 76 0.0676 0.3333 0.9725 37 0.0676 0.3333 0.9663 48 0.0676 0.3333 0.9942 29 0.0676 0.2598 0.9924 1
Table 18. Normalized matrix X.
Solutions X ¼ Xij
� �m�n
y1 y2 y1 y2
1 0.3134 0.3868 0.2015 0.04802 0.4605 0.4122 0.4523 0.20363 0.4132 0.2630 0.3188 0.45294 0.2870 0.3564 0.2746 0.11875 0.3305 0.3722 0.3143 0.41116 0.3602 0.2352 0.3226 0.25607 0.2443 0.2412 0.4208 0.23738 0.2356 0.3350 0.2886 0.23029 0.2872 0.3464 0.3384 0.6271
12 D. Duc Trung: Manufacturing Rev. 8, 26 (2021)
Using equation (32) to calculate the normalized matrixwith weight. Where the weights of the criteria weredetermined using Entropy method in Table 6. Thecalculated results were presented in Table 19.
Applying the equation (33) to caltulate the value of Pi,using equation (34) to calculated the value of Ri, and usingequation (35) to calculate the value of Qi, the calculated
results were listed in Table 20. The ranking results of thesolutions were also presented in this table.
6.7 Multi-criteria decision making using the COPRASmethodThe values Pi and Ri are calculated in the same way as theMOORA method. Using formula (36) to calculate the

Table 19. Normalized matrix with the weight.
Solutions Wij = wj · yij
y1 y2 y1 y2
1 14.5244 48.6879 10.8717 2.90622 21.3441 51.8894 24.4006 12.33323 19.1525 33.1074 17.2002 27.42764 13.3041 44.8635 14.8164 7.18655 15.3187 46.8498 16.9528 24.89646 16.6956 29.5994 17.4020 15.50247 11.3231 30.3603 22.7014 14.37328 10.9190 42.1680 15.5696 13.94209 13.3113 43.5967 18.2565 37.9810
Table 20. Calculated results of Pi, Ri, Qi and the ranking results.
Solutions Pi Ri Qi Ranking
1 24.6946 2.9062 21.7884 92 32.5447 12.3332 20.2115 83 23.1534 27.4276 –4.2742 24 24.3280 7.1865 17.1415 75 26.3738 24.8964 1.4774 36 21.2324 15.5024 5.7300 47 21.4616 14.3732 7.0884 58 22.8855 13.9420 8.9435 69 25.0548 37.9810 –12.9262 1
D. Duc Trung: Manufacturing Rev. 8, 26 (2021) 13
values Qi, the calculated results are presented in Table 21.The ranking results of the solutions were also presented inthis table.
6.8 Multi-criteria decision making using the PIVmethod
Evaluate the weighted proximity index according to theformula (39). The results are presented in Table 22.
Determine the overall proximity value according to theformula (40). The results are presented in Table 23. Theranking of options according to the value di is alsopresented in this table.
6.9 Multi-criteria decision making using the PSImethod
The normalized values of attributes are calculatedaccording to the formulas (41) and (42), as presented inTable 24.
The mean of normalized values is calculated accordingto formula (43). This value was also added in Table 24.
Determine the preference value from the mean accord-ing to the formula (44): ’y1=0.21784; ’y2=0.21564;’y3=0.20693; ’y4 =0.65516.
Determine the deviation in the preference valueaccording to the formula (45): ∅y1=0.78216; ∅y2=0.78436;∅y3=0.79307; ∅y4=0.34484.
Determine the overall preference value according to theformula (46): by1=0.2892, by2=0.2900, by3=0.2932;by4=0.1275.
Calculate the preference selection index u (PSI) of eachoption according to the formula (47), the calculated resultsare presented in Table 25.
From the ranking results of the options according toabove methods (in Tabs. 8, 10, 14, 17, 20, 21, 23, 25), allseven methods, including SAW, WASPAS, TOPSIS,VIKOR,MOORA,COPRAS, PIV indicate that the optionnumber 9 is the best one. Particularly for the PSI method,it is determined that the option number 2 is the best one.Another special thing is that option number 2 isdetermined as the worst option when applying the SAW,WAPSAS, TOPSIS, VIKOR, and PIV methods, while thePSI method determines that option 2 is the best one. Thiscreates a feeling of unreliability when using the PSImethod. This difference is explained that seven methods(SAW,WASPAS, TOPSIS, VIKOR, MOORA, COPRAS,PIV) use the weight of criteria according to the entropymethod too, while the PSI method uses the “preference

Table 21. Results of calculating Pi, Ri, Qi and ranking.
Solutions Pi Ri Qi Ranking
1 24.6946 2.9062 86.3909 92 32.5447 12.3332 47.0828 73 23.1534 27.4276 29.6907 24 24.3280 7.1865 49.2780 85 26.3738 24.8964 33.5757 46 21.2324 15.5024 32.7985 37 21.4616 14.3732 33.9364 58 22.8855 13.9420 35.7461 69 25.0548 37.9810 29.7756 1
Table 22. Evaluate the weighted proximity index.
Solotions uij
y1 y2 y3 y4
1 0.01888 0.03940 0.00000 0.145582 0.05459 0.04600 0.06173 0.106453 0.04312 0.00724 0.02887 0.043804 0.01249 0.03150 0.01800 0.127815 0.02304 0.03560 0.02775 0.054316 0.03025 0.00000 0.02980 0.093307 0.00212 0.00157 0.05398 0.097988 0.00000 0.02594 0.02143 0.099779 0.01253 0.02889 0.03369 0.00000
Table 23. Overall proximity values and ranking ofoptions.
Solotions di Ranking
1 0.20385 82 0.26878 93 0.12304 24 0.18981 75 0.14070 36 0.15335 57 0.15565 68 0.14715 49 0.07511 1
14 D. Duc Trung: Manufacturing Rev. 8, 26 (2021)
value from the mean value”, “the deviation in the preferencevalue”, and “the overall preference value”.
From this problem, a new idea is proposed, that iscombining the PSImethod with the entropy determinationweight method and called the PSIe method. In the PSIemethod, instead using the “preference value from the meanvalue”, the “deviation in the preference value”, and “overallpreference value”, the entropy weight was used. Thatmeans the “preference selection index u” will be calculatedas the sum of the products between the value of thiscriterion and its weight as described by equation (49).
uj ¼Xmj¼1
yij:wj: ð49Þ
Applying the formula (49) to the calculation of ui in thePSIemethod, the results are shown in Table 26. The resultsof ranking options according to the value ui are alsopresented in Table 26.
A summary of the ranking of options according to 9methods (SAW, WASPAS, TOPSIS, VIKOR, MOORA,COPRAS, PIV, PSI, and PSIe) is presented in Table 27.
According to the results of ranking options in Table 27,there are 8/9 methods determining that option 9 is the best
one (except for the PSI method as mentioned above). Theworst option is determined by the PSIe method is alsoconsistent with the MOORA and COPRAS methods.These results provide us with more confidence in using thePSIe method than using the PSI method. The applicationof the entropy method to determine the weight of thecriteria was helped the multi-criteria decision making

Table 24. Normalized value of attributes.
Solutions Nij
y1 y2 y3 y4
1 0.7518 0.6079 1.0000 0.07652 0.5116 0.5704 0.4455 0.32473 0.5701 0.8940 0.6321 0.72214 0.8207 0.6598 0.7338 0.18925 0.7128 0.6318 0.6413 0.65556 0.6540 1.0000 0.6247 0.40827 0.9643 0.9749 0.4789 0.37848 1.0000 0.7019 0.6983 0.36719 0.8203 0.6789 0.5955 1.0000Mean 0.7562 0.7466 0.6500 0.4580
Table 25. Values u in PSI and rankings.
Solutions u Ranking
1 86.0950 62 118.6949 13 94.1912 44 87.2412 55 103.3881 36 81.5383 97 81.7260 88 85.7135 79 105.5537 2
Table 26. Values u in PSIe and ranking.
No. u Ranking
1 76.9901 92 109.9673 23 96.8877 44 80.1704 65 104.0178 36 79.1994 77 78.7579 88 82.5987 59 113.1455 1
Table 27. Ranking of options according to the MCDM methods.
Solutions Ranking
SAW WASPAS TOPSIS VIKOR MOORA COPRAS PIV PSI PSIe
1 7 8 8 8 9 9 8 6 92 9 9 9 9 8 7 9 1 23 2 2 2 5 2 2 2 4 44 8 7 7 6 7 8 7 5 65 6 6 3 7 3 4 3 3 36 5 5 4 3 4 3 5 9 77 3 3 5 4 5 5 6 8 88 4 4 6 2 6 6 4 7 59 1 1 1 1 1 1 1 2 1
D. Duc Trung: Manufacturing Rev. 8, 26 (2021) 15
methods to identify the best solution among the imple-mented ones. From that, it can be seen that when theweight of the criteria is determined by the entropy method,the stability in determining the best solution is very high.In the particular case of this study, the level of stability was
absolute. Thus, not only for the turning process but also forother machining processes, in determination process of thebest solution, in order to have the high reliability for thebest solution, it is necessary to apply many multi-criteriadecision making methods. In these cases, the entropy
16 D. Duc Trung: Manufacturing Rev. 8, 26 (2021)
method should be chosen to determine the weights for thecriteria.
From this result, we also come to the conclusion that ifwe wish to simultaneously ensure the “minimum” Fx, Fy,and Fz, and the “maximum” MRR, the spindle speed is910 rev/min, the feed rate is 0.302mm/ rev, the depth ofcut is 0.35mm, and the nose radius is 0.4mm.
7 Conclusion
In this study, the turning experimental process of 150Cr14steel was performed using TiAlN coated cutting insert. Anexperimental matrix was designed according to theTaguchi method with four input parameters includingspindle speed, feed rate, depth of cut, and nose radius. Ateach experiment, four output parameters of the turningprocess were determined including three components of thecutting force in three directions (Fx, Fy, and Fz), andMRR.The Entropy method was applied to determine the weightsof criteria. Eight methods including SAW, WASPAS,TOPSIS, VIKOR, MOORA, COPRAS, PIV, PSI wereapplied to rank the options. Several conclusions are drawnas follows:– This is the first time that the PIV method is applied tomake the multi-criteria decision for the turning process.This study is also the first study that applied all eightmethods including SAW, WASPAS, TOPSIS, VIKOR,MOORA, COPRAS, PIV, PSI for multi-criteria decisionmaking. Seven of these eight methods determined thesame best solution (except for the PSI method).
– The multi-criteria decision making methods all deter-mine the best solution if the weight of the criteria isdetermined by the Entropy method. This leads to thepromotion of the use of the Entropy method indetermining the weights for the criteria.
– The PSI method does not use entropy weights, so theranking results are very different from the other ones.This means that there must be careful considerations indeciding whether or not to use the PSImethod for multi-criteria decision making.
– A new method proposed in this study is the combinationof the PSI method with the Entropy weight method,called the PSIe method. The PSIe method alsodetermined the best experiment like the other sevenones including SAW, WASPAS, TOPSIS, VIKOR,MOORA, COPRAS, PIV.
– The weight of the four parameters Fx, Fy, Fz, and MRRare 0.24270, 0.25976, 0.24616, and 0.25138, respectively.
– To simultaneously ensure the criteria including threeminimum components of the cutting forces and themaximum MRR, the spindle speed is 910 (rev/min), thefeed rate is 0.302 (mm/rev), the depth of cut is 0.35(mm), and the nose radius is 0.4 (mm).
– The combination of all methods, Taguchi � Entropy �SAW � WASPAS � TOPSIS � VIKOR � MOORA �COPRAS � PIV, and PSI was applied for the first time,andwas succeeded in selecting the best experiment in thisstudy. This combination also promises to be successfulwhen applied to other machining processes.
– It is required to perform further studies to apply thePSIe method in multi-criteria decision making, thencompare the results with other methods. Thereby, it ispossible to decide whether to use the PSIe method ornot. These are the tasks that the author will perform innear future.
References
1. S. Kusumadewi, S. Hartati, A. Harjoko, R. Wardoyo,Fuzzy Multi-Attribute Decision Making (FUZZY MADM),Penerbit Graha Ilmu, Yogyakarta 2006
2. E.K. Zavadskas, Z. Turskis, J. Antucheviciene, A. Zakar-evicius, Optimization of weighted aggregated sum productassessment, Elektr. ir Elektrotech 122 (2012) 3–6
3. C.-L. Hwang, Y.-J. Lai, T.-Y. Liu, A new approach formultiple objective decision making, Comput. Oper. Res. 20(1993) 889–899
4. S. Opricovic, G.-H. Tzeng, Compromise solution by MCDMmethods: a comparative analysis of VIKOR and TOPSIS,Eur. J. Oper. Res. 156 (2004) 445–455
5. W. Brauers, Optimization methods for a stakeholder society.A revolution in economic thinking by multi-objectiveoptimization, Springer, Kluwer, 2004
6. E. Triantaphyllou, Multi-criteria Decision Making Methods:A Comparative Study, Springer � Science+Busines Media,2020
7. S. Mufazzal, S.M. Muzakkir, A new multi-criterion decisionmaking (MCDM) method based on proximity indexed valuefor minimizing rank reversals, Comput. Ind. Eng. (2008) 1–38
8. K. Maniya, M.G. Bhatt, A selection of material using a noveltype decision-making method: preference selection indexmethod, Mater. Des. 31 (2010) 1785–1789
9. Ch.M. Rao, K. Venkatasubbaiah, Application of MCDMapproach-TOPSIS for the multi-objective optimizationproblem, Int. J. Grid Distrib. Comput. 9 (2016) 17–32
10. B. Singaravel, T. Selvaraj, Optimization of machiningparameters in turning operation using combined TOPSISand AHP method, Tehnički vjesnik 22 (2015) 1475–1480
11. P. Umamahesarrao, D. Ranga Rauju, K. Naga Sai Suman, B.Ravi Sankar, Optimizing cutting parameters in hard turningof AISI 52100 steel using topsis approach, J. Mech. EnergyEng. 3 (2019) 227–232
12. Ch.M. Rao, K.J. Rao, K.L. Rao, Multi-objective optimiza-tion of MRR, Ra and Rz using Topsis, Int. J. Eng. Sci. Res.Technol. 5 (2016) 376–384
13. S.S. Mane, A.M. Mulla, Relevant optimization methodselection in turning of AISI D2 steel using Crygenic cooling,Int. J. Creat. Res. Thoughts 8 (2020) 803–812
14. K. Maity, A. Khan, Application of MCDM-based TOPSISmethod for the selection of optimal process parameter inturning of pure titanium, Benchmarking 24 (2017) 1–19
15. H. Majumder, A. Saha, Application of MCDM based hybridoptimization tool during turning of ASTM A588, Decis. Sci.Lett. 7 (2018) 143–156
16. R. Singh, J.S. Dureja, M. Dogra, J.S. Randhawa, Optimi-zation of machining parameters under MQL turning ofTi-6Al-4V alloy with textured tool using multi-attributedecision-making methods, World J. Eng. 16 (2019) 648–659
17. N.V. Thien, D.H. Tien, N.-T. Nguyen, D.D. Trung, Multi-Objective Optimization of turning process using VIKORmethod, J. Appl. Eng. Sci. (2021)
D. Duc Trung: Manufacturing Rev. 8, 26 (2021) 17
18. A. Khan, K. Maity, A novel MCDM approach forsimultaneous optimization of some correlated machiningparameters in turning of CP-titanium grade 2, Int. J. Eng.Res. Africa 22 (2016) 94–111
19. K.A.Vikram,T.V.K.Kanth,Shabana,K.Suresh,Experimentalevaluation formulti-response optimality onAISI 316Lmaterialswith coated carbide inserts using GRA and Vikor methods, Int.J. Mech. Product. Eng. Res. Dev. 8 (2018) 1197–1206
20. I. Nayak, J. Rana, Selection of a suitable multiresponseoptimization technique for turning operation, Decis. Sci.Lett. 5 (2016) 129–142
21. G.K. Kumar, Ch.M. Rao, V.V.S. Kesava Rao, Investigationof effects of speed and depth of cut on multiple responsesusing Vikor analysis, Int. J. Modern Trends Eng. Res. 5(2018) 164–168
22. D.D. Trung, N.-T. Nguyen, D.V. Duc, Study on multi-objective optimization of the turning process of EN 10503steel by combination of Taguchi method and Mooratechnique, Eureka 2 (2021) 52–65
23. B. Singaravel, T. Selvaraj, S. Vinodh, Multi-objectiveoptimization of turning parameters using the combinedMoora and Entropy method, Trans. Can. Soc. Mech. Eng. 40(2016) 101–111
24. M. Abas, B. Salah, Q.S. Khalid, I. Hussain, A.R. Babar, R.Nawaz, R. Khan,W. Saleem, Experimental investigation andstatistical evaluation of optimized cutting process parame-ters and cutting conditions to minimize cutting forces andshape deviations in Al6026-T9, Materials 13 (2020) 1–21
25. A. Khan, K. Maity, D. Jhodkar, An integrated fuzzy-MOORA method for the selection of optimal parametriccombination in turing of commercially pure titanium,Springer Ser. Adv. Manufactur. (2020) 163–184
26. V.R. Pathapalli, V.R. Basam, S.K. Gudimetta, M.R.Koppula, Optimization of machining parameters usingWASPAS and MOORA, World J. Eng. 17 (2020) 237–246
27. A. Saha, H. Majumder, Multi criteria selection of optimalmachining parameter in turning operation using comprehen-sive grey complex proportional assessmentmethod for ASTMA36, Int. J. Eng. Res. Africa 23 (2016) 24–32
28. Ch.M. Rao, P.S. Reddy, D. Suresh, R.J. Kumar, Optimiza-tion of turning process parameters using PSI-based desir-ability-grey analysis, Recent Adv.Mater. Sci. (2019) 231–246
29. D.D. Trung, N.V. Thien, N.-T. Nguyen, Application ofTOPSIS method in multi-objective optimization of thegrinding process using segmented grinding wheel, Tribol. Ind.43 (2021) 12–22
30. N.Z. Khan, T.S.A. Ansari, A.N. Siddiquee, Z.A. Khan,Selection of E-learning websites using a novel ProximityIndexed Value (PIV) MCDM method, J. Comput. Edu. 6(2019) 241–256
31. S. Wakeel, S. Bingol, M.N. Bashir, S. Ahmad, Selectionof sustainable material for the manufacturing of complexautomotive products using a new hybrid Goal Program-ming Model for Best Worst Method-Proximity IndexedValue method, Proc. Inst. Mech. Eng. L 0 (2020)1–15
32. A. Ulutas, Ç. Karakoy, An analysis of the logisticsperformance index of EU countries with an integratedMCDM model, Econ. Bus. Rev. 5 (2019) 49–69
33. J. Raigar, V.S. Sharma, S. Srivastava, R. Chand, J. Singh, Adecision support system for the selection of an additivemanufacturing process using a new hybridMCDM technique,Sādhanā 45 (2020) 1–14
34. X. Li, K. Wang, L. Liu, J. Xin, H. Yang, C. Gao, Applicationof the entropy weight and TOPSIS method in safetyevaluation of coal mines, Proc. Eng. 26 (2011) 2085–2091
35. Y. Zhu, D. Tian, F. Yan, Effectiveness of entropyweight method in decision-making, Math. Probl. Eng.(2020) 1–5
36. Z. Zhi-hong, Y. Yi, S. Jing-nan, Entropy method fordetermination of weight of evaluating in fuzzy syntheticevaluation for water quality assessment, J. Environ. Sci. 18(2006) 1020–1023
37. S.K. Pattnaik, M. Behera, S. Padhi, P. Dash, S.K. Sarangi,Study of cutting force and tool wear during turning ofaluminium with WC, PCD and HFCVD coated MCD tools,Manufactur. Rev. 7 (2020) 1–14
38. P.B. Patole, V.V. Kulkarni, S.G. Bhatwadekar, MQLmachining with nano fluid: a review, Manufactur. Rev. 8(2021) 1–18
39. V.V.K. Lakshmi, K. Venkata Subbaiah, A.V. Kothapalli, K.Suresh, Parametric optimization while turning Ti-6Al-4Valloy in Mist-MQCL (Green environment) using the DEARmethod, Manufactur. Rev. 7 (2020) 1–13
Cite this article as: Do Duc Trung, A combination method for multi-criteria decision making problem in turning process,Manufacturing Rev. 8, 26 (2021)