a co-integration analysis approach to european union ...eiop.or.at/eiop/pdf/2006-007.pdf · a...
TRANSCRIPT

HOME | CURRENT | ARCHIVES | ABOUT | LOG IN | REGISTER | SEARCH
Home > Current Issue Vol. 10 (2006) > Onay, Ceylan
A Co-integration Analysis Approach to European Union Integration: The Case of Acceding and Candidate Countries
Onay, Ceylan Date of publication in the EIoP: 8 Sep 2006 Keywords: economic integration, financial markets, enlargement, globalization, international trade, EMU, liberalization, Central and Eastern Europe, EU-East-Central Europe, Euro, economics
Full Text: HTML PDF Abstract This paper examines the long-term financial integration of second-round acceding and candidate countries’ with the European Union and the US stock markets during the Accession Process. The lowpair wise correlations between these markets imply portfolio diversification opportunities, yet correlation is a short-term measure. The long-term stock market interdependence is analyzed with Johansen (1991) cointegration approach, which indicates no long-term relationship between the second-round countries and the EU and US stock markets. Yet Engle-Granger (1987) causality test presents evidence of a casual flow from European and US equity markets to Croatian stock market and from Turkish Stock market to Bulgarian stock market suggesting a short-term lead-lag relationship amongst. The results indicate that the completion of accession negotiations with Bulgaria and Romania and ongoing negotiations with Croatia and Turkey have not yet resulted in the complete financial integration of these markets with the European Union. They still offer significant long-term diversification opportunities for the European as well as the US investors. Full Text: HTML PDF
Ceylan Onay, Ph.D., Department of Management Information Systems, Bogazici Universtiy, Istanbul e-mail: [email protected]
FrontpageEIoP: Text 2006-007: Full Text

Contents: 1. Introduction 2. Literature Review 3. Methodology 4. Data 5. Empirical Findings 6. Conclusion References
1. Introduction The objective of this research is to investigate if the fulfillments of Copenhagen economic criteria and increased trade linkages during the accession period towards the Maastricht criteria have resulted in the stock market integration of second-round countries with the European Union. The EU Enlargement entails three main criteria to be fulfilled by the acceding and candidate countries; political, economical and adoption of the Community Acquis. The Copenhagen economic criteria oblige acceding and candidate countries to have a viable market economy, apply reform programs to obtain capacity to cope with market forces and competitive pressures within the Union and ability to take on the obligations of membership including Economic and Monetary Union (EMU). Thus, these countries have to adjust their monetary and fiscal policies to adopt to EMU nominal convergence criteria in the areas of inflation, long term interest rates, exchange rate stability and GDP deficits defined in Maastricht Treaty. Accordingly, their economies become more and more connected with the EU member states. Furthermore, accession to EMU demands new member states to have closer trade links with the EU-15 or with the current Eurozone, including the intra-industry trade, synchronization of business cycles, actual exchange rate variability and actual factor mobility between the new and old members. The objective is to obtain stronger trade integration and closer comovement of business cycles between countries to diversify the idiosyncratic shocks. Rostowski (2002) and Blaszkiewicz and Wozniak (2003) arrive to similar conclusions that candidate countries are actually very open to trade with EU and trade a very high share of their GDP with EMU. Regarding the new member states, almost 60-70% of their exports are already made to EU-15. Brozozowski (2003) suggest that increased trade activity with EMU and Foreign Direct Investments to new member states would increase correlation between new member states and EMU, decreasing the possibility of asymmetric shocks. Basically EU economical convergence criteria combined with efforts to join the EMU result in macro economic fundamentals of acceding and candidate countries to be brought in line with EU member states and stronger trade linkages between.
From the perspective of an international investor who is willing to make portfolio investments in acceding and candidate countries for diversification purposes, accession period has some important implications due to economic convergence. The objective of an international investor is to minimize his/her portfolio risk at a given level of expected return. The modern portfolio theory suggests that low correlations between assets result in lower risk where return of the portfolio is measured by its mean and risk is measured by its standard deviation. In this respect less than positive perfect
A Co-integration Analysis Approach to European Union Integration: The Case of Acceding and Candidate Countries(*)
Ceylan OnayEuropean Integration online Papers (EIoP) Vol. 10 (2006) N° 7;
http://eiop.or.at/eiop/texte/2006-007a.htm
Date of Publication in European Integration online Papers: 8.9.2006| Abstract | PDF |
Page 2 of 11EIoP: Text 2006-007: Full Text

correlation between assets provide portfolio diversification. Accordingly, correlation has been used as the main indicator of diversification opportunities within asset classes and on international basis within countries. Developed countries with higher economic and trade linkages amongst had higher correlations and as a result assets traded in their capital markets responded to certain common factors. These assets’ prices are dominated by global factors rather than country-specific (idiosyncratic) factors. On the other hand, emerging markets, whose asset returns are dominated by country-specific factors, had lower correlations with their mature counterparts and provided a natural hedge for developed market portfolios. However, recent research has proven that correlation is a short-term process and a time-varying measure. Thus, a more accurate measure of co-movement between stock markets is needed for long term portfolio investments.
As of 2004, 10 new countries joined the European Union of which Czech Republic, Hungary, Slovakia and Poland are the most studied ones. The enlargement process continues with the second-round acceding Bulgaria and Romania, and candidate Turkey and Croatia. Bulgaria and Romania’s accession negotiations were opened in February 2000 and finalized on April 2005. They will be joining the Union as of January 2007. On the other hand, although Turkey has a longer history with the EU, accession negotiations was started only in October 2005 while Croatia’s negotiations are postponed for a while. Although second-round acceding and candidate countries have developed certain economic linkages over time with EU, these markets’ integration with the EU remains an unstudied issue. This research focuses on the integration of acceding and candidate countries to the European Union in the last five years period employing the Johansen (1991) cointegration approach and Engle-Granger (1987) causality tests. The political and economic converge combined with market deregulations, liberalizations and increased multinational corporation activities is expected to bring these markets closer to the EU-15 and doing so result in integration of stock markets as their assets will be dominated more and more by global factors already affecting EU members. In the study not only integration with Europe is investigated but also a long term relationship with US equity market is studied as previous research reveals that it has a major effect on emerging markets.
2. Literature Review As Ghosh et al.(1999) suggest “economic theory posits that certain pairs of financial time series are expected to move together in the long run. In the short run they may deviate from each other, but investors’ tastes and preferences, market forces and government regulations will bring them back to their equilibrium.” In this respect, cointegration is a reliable approach to modeling short- and long-run dynamics in a multivariate system. It is a long term measure of asset price co-movement within an equilibrium model. It first establishes long-run equilibrium between asset prices thereby identifying a long term relationship. Then in the second step, dynamic correlations within an error correction model are estimated. As a result, common stochastic trends between time series are identified before correlation analyses are made. The existence of a long-term cointegrating vector implies that series will not drift away from each other and will revert to their long-run equilibrium. In this respect it provides a long-term measure of diversification opportunities between international financial markets as well as short-term deviations. For long term portfolio investment and hedging purposes it is a better and stable tool than correlation. Portfolios designed within this framework require much less portfolio rebalancing and result in lower transaction costs. Furthermore, establishment of an error correction model enable some insight on forecasting. However, it is necessary to mention that forecasting implied by presence of cointegration relations indicate violation of weak form market efficiency that historical prices can be used to forecast tomorrow’s prices.
Many studies have used the cointegration measure to analyze long-term relations between developed markets, between developed and emerging markets, and on regional basis. Recent studies have focused on the Central and East European stock markets’ integration with the European stock markets and the US equity market. Also regional integration is explored in the Pacific Rim, Asian and European regions.
Page 3 of 11EIoP: Text 2006-007: Full Text

Kasa (1992) has pointed out that for investors with long term investment horizons, low correlations could suggest overestimated gains if equity markets shared a common stochastic trend in the long term. Following Kasa, cointegration rather than correlation has been used in the literature to analyze the long-term diversification opportunities between and amongst the developed and emerging equity markets as well as the integration and convergence across regions. Arshanapalli and Doukas (1993) suggest that as a result of financial liberalizations and October 1987 crash, linkage among international markets is strengthened. Bessler and Yang (2003) investigate the cointegration among Australia, Japan, Hong Kong, UK, Germany, France, Switzerland, US and Canada. They present evidence of one cointegrating vector and suggest that US has a consistent long-run impact on the other markets. Phylaktis and Ravazzolo (2005) employing a multivariate cointegration model, examine the stock market linkages between certain Pacific-Basin countries with US and Japan. It is found that relaxation of foreign ownership restrictions have strengthened the international market interrelations.
In this context, integration and convergence in the European Union equity markets has also attracted the attention of investors not only due to EMU but also due to the changing composition of EU as a result of the ongoing EU Enlargement process. Serletis and King (1997) provide evidence of cointegration among ten European Union countries and suggest a strengthening link towards convergence. On the other hand, Rouwenhorst (1998) analyze the effect of EMU on the EU and show that despite convergence of interest rates and harmonization of fiscal policies, country factors are still dominant in equity returns. Meanwhile, Haug et al. (2000) present an analysis of cointegration among 12 EU members and suggest that some members need greater policy harmonization so that EMU can be successful for all members. Masih and Masih (2004) examining the effect of 1987 crash on the cointegration of five European stock markets, suggest unique cointegrating vectors before and post the crash eras but not in the entire sample period of 1979 to 1994. However, Rangvid (2001) studies a dynamic cointegration method for France, Germany and U.K. and show that they were increasingly integrated throughout ‘80s and ‘90s. Finally, Aggrawal, Lucey and Muckley (2002) employing cointegration measure show that main 12 EU markets have substantially converged by mid 1998.
In the context of EU Enlargement process there has been a growing attention towards the integration level of Central and Eastern European stock markets with the European Union. Verchenko (2000) studying the potential for portfolio diversification across Eastern European stock markets, prove non-cointegration and accordingly significant diversification possibilities amongst. Yuce and Simga-Mungan (2000) also verify that Eastern European markets are non-cointegrated across each other and with major stock markets including Russia in the period from 09:1994 to 12:1999. Voronkova (2003) introduces a structural break into the model and shows that Central European markets tend to display equilibrium relationships, once controlled for structural change (like financial liberalization dates), with Western European and US counterparts. Meanwhile Brada et al. (2002) use a rolling cointegration approach and analyze real and monetary convergence across EU and first-round candidates; The Czech Republic, Estonia, Hungary, Poland and Slovenia. It is found that real cointegration for the candidates, is much less than it was evident for the recent EU members namely: Austria, Denmark, Portugal, Spain and Sweden. Gilmore and McManus (2002) investigate the short and long-term dynamics between the Central European equity markets and US stock market in the period from July 1995 to August 2001. Neither bilateral nor multilateral cointegration is found. However, causality from Hungarian to Polish market is evidenced. On the other hand, Syriopoulos (2004) presents evidence that Czech Republic, Hungary, Poland, Slovakia, Germany and US stock markets are cointegrated. One cointegrating vector exists in the period from January 1997 to September 2003 and it is found that US stock market has a significant impact on the emerging Central and Eastern European markets. Baele et al. (2004) use a regime-switching shock spillover model to investigate the integration of Central European markets with respect to EU and US stock markets. Results indicate increased economic integration for Hungary and Poland with EU while much less the case is pronounced for Czech Republic and not at all for Slovakia. On the other hand, Floros (2004) presents evidence that Central European markets are cointegrated and unidirectional casual flows are observed between Hungary-Poland and Czech-Poland.
Page 4 of 11EIoP: Text 2006-007: Full Text

In light of the provided literature, it can easily be seen that the integration level of second-round countries with the European Union remains an unstudied but an important issue for international investors.
3. Methodology Cointegration, first introduced by Engle and Granger (1987), is a long-term measure of diversification based on price data. If there exists a linear combination of two nonstationary series integrated of order one [I(1)] that is stationary, these series are called cointegrated series. Cointegration measure answers the question of a long-term common stochastic trend between non-stationary time series. If non-stationary series x and y are both integrated of same order and there is a linear combination of them that is stationary, they are called cointegrated series and the vector of this relationship is called the cointegrating vector. Accordingly, cointegrated series share a common stochastic trend. It follows that these two series will not drift apart too much, meaning that even they may deviate from each other in the short-term, they will revert to the long-run equilibrium. This fact makes cointegration a very powerful approach for portfolio diversification purposes especially for the long-term. Meanwhile, cointegration does not imply high correlation; two series can be cointegrated and yet have very low correlations.
Two basic methodologies are evident for testing cointegration; Engle-Granger and Johansen methodologies. Engle-Granger (1987) building upon the representation theorem of Granger (1983) introduce a two-step procedure where first an ordinary least squares (OLS) regression is estimated on the integrated of order one data and then residuals of the regression are checked for stationarity. Granger (1983) representation theorem suggests that in a bivariate system of I(1) series x and y, if lagged x improves the estimation of y , then x is said to Granger cause y. “Granger causality” suggests a lead-lag relationship between time series and there may be “Granger causality” between asset prices without the presence of a cointegrating vector. However, cointegration implies a Granger (1983) casual flow between the integrated assets.
On the other hand as mentioned by Alexander (2001) it is only valid to regress log asset prices on log prices when these prices are cointegrated, then the regression will define the long-run equilibrium amongst. Yet Engle-Granger (1987) methodology, based on OLS regression, is most suitable for bivariate settings where the choice of the dependent variable is not a question and it can identify only one cointegration vector while there can be more in multivariate analyses. The Johansen (1991) methodology is a maximum likelihood approach for testing cointegration in multivariate autoregressive models. Its objective is to find the linear combination which is most stationary, relying on the relationship between the rank of a matrix and its eigenvalues. The Johansen (1991) methodology provides two statistics to determine the number of cointegrating vectors: Trace and Maximum Eigenvalue statistics. Johansen and Juselius (1990) advise “Trace” statistic which tests the null hypothesis of r cointegrating relations against the alternative of n cointegrating relations, where n is the number of variables in the system for r = 0,1,2…n-1. The Maximum Eigenvalue on the other hand tests the null hypothesis of r cointegrating relations against the alternative of r+1 cointegrating relations for r = 0,1,2…n-1. In some cases Trace and Maximum Eigenvalue statistics may yield different results and Alexander (2001) indicates that results of trace test should be preferred. The critical values are presented by Johansen and Julieus (1990) and Osterwald-Lenum (1992).
4. Data The data of the study consist of the weekly stock market price indexes of Bulgaria (SOFIX), Croatia (CRO), Romania (BET), Turkey (ISE100), Europe (Europe), European Union (EU) and United States (S&P500) for the time period covering October 27, 2000 through August 26, 2005, a total of 252 observations. The chosen indexes for the acceding and candidate countries are the official stock
Page 5 of 11EIoP: Text 2006-007: Full Text

price indexes including the most liquid companies traded in respective stock markets. The Europe index of Morgan Stanley Capital International (MSCI), which includes EU-15, and MSCI EU index, which includes new member states of Czech, Hungarian and Polish stock markets, are chosen to represent European Union portfolio and S&P500 index is used to proxy US equity markets. All indexes are converted to natural logarithms and denominated in local currencies (Voronkova 2003). The objective in using local currencies is to obtain co-integration results just based on movements on asset prices by eliminating the effect of exchange rate changes especially if exchange rate is highly volatile. Considering the countries under examination, Turkey has been through various devaluations which could have distorted the findings. Furthermore, Alexander (2001) stresses the importance of making cointegration analysis in local currencies for detecting asset price co-movements.
The pre-condition for testing cointegration is that series should be integrated of same order. Therefore, first descriptive statistics are provided and then time series properties are explored. Descriptive statistics for weekly index returns (log-relatives) are provided in Table 1.
Table 1
The analysis reveals that accession countries’ indexes had positive means while the developed countries’ indexes had negative means during the investigation period. The maximum return is observed for SOFIX (29%) while the minimum is observed for ISE100 (-30%). Turkish stock market is the most volatile while Croatian is the least. This finding can be attributed to the fact that during the investigation period two stock market crashes following two severe devaluations had been observed in Turkey. All series except BET have negative skewness implying long left tail while all of them have fat tails, suggesting extreme positive or negative observations in the series. Meanwhile, Kolmogorov-Smirnov tests statistic indicate that all series have non-normal distributions, as all significance values are less than 5%. Table 2 reports the correlation coefficients between the emerging and developed markets’ weekly index returns.
Table 2
Examination of the correlations reveal that BET, CRO, ISE100 and SOFIX indices have very low pairwise correlations among each other as well as with their mature counterparts. SOFIX indeed has negative correlation with Europe, EU and S&P500 indexes. As expected Europe and EU index have almost perfect positive correlation, while having 0.80 correlation on average with S&P500 index. Overall, correlations of studied accession and candidate countries’ indicate weak interactions with the developed markets, pointing to portfolio diversification opportunities.
Table 3 presents the results of unit root analyses. The pre-condition of series being integrated of same order is verified with the Augmented Dickey-Fuller (1981) and Phillips-Perron (1988) tests. The tests are applied to levels and first differences where the model includes a constant and a trend. The appropriate lag lengths are chosen according to AIC- Akaike Information Criterion. The critical values are obtained from MacKinnon (1996). For all series presence of a unit root cannot be rejected in levels, while no unit root is found in first differenced series at the 5% level, indicating that all series are integrated of order one.
Table 3
5. Empirical Findings Proven that all series are integrated of order one, the analysis proceeded with the bivariate and multivariate cointegration analysis of Johansen (1991, 1995). Analyses are made under the model with a constant and linear trend in the cointegration vector and the optimal lags are chosen to minimize AIC and set at 2 in first differences while it is also found that results are robust to alternative lags. Integration of acceding and candidate countries’ indexes with the Europe index is
Page 6 of 11EIoP: Text 2006-007: Full Text
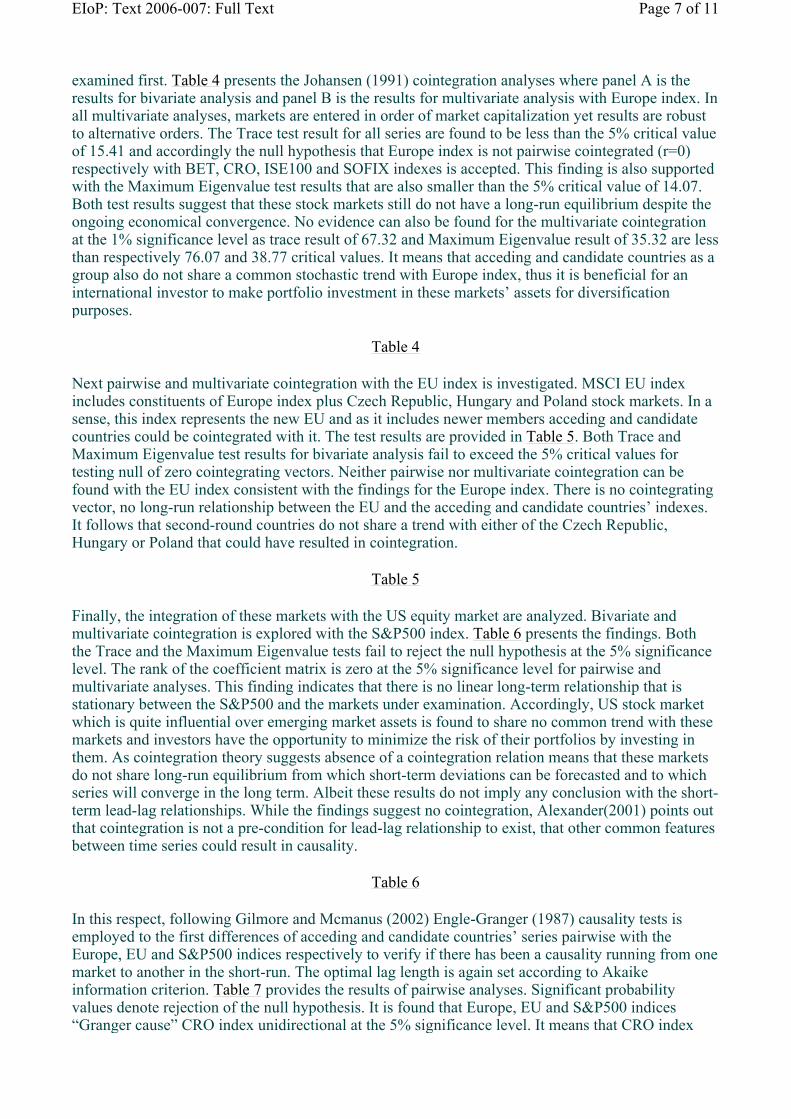
examined first. Table 4 presents the Johansen (1991) cointegration analyses where panel A is the results for bivariate analysis and panel B is the results for multivariate analysis with Europe index. In all multivariate analyses, markets are entered in order of market capitalization yet results are robust to alternative orders. The Trace test result for all series are found to be less than the 5% critical value of 15.41 and accordingly the null hypothesis that Europe index is not pairwise cointegrated (r=0) respectively with BET, CRO, ISE100 and SOFIX indexes is accepted. This finding is also supported with the Maximum Eigenvalue test results that are also smaller than the 5% critical value of 14.07. Both test results suggest that these stock markets still do not have a long-run equilibrium despite the ongoing economical convergence. No evidence can also be found for the multivariate cointegration at the 1% significance level as trace result of 67.32 and Maximum Eigenvalue result of 35.32 are less than respectively 76.07 and 38.77 critical values. It means that acceding and candidate countries as a group also do not share a common stochastic trend with Europe index, thus it is beneficial for an international investor to make portfolio investment in these markets’ assets for diversification purposes.
Table 4
Next pairwise and multivariate cointegration with the EU index is investigated. MSCI EU index includes constituents of Europe index plus Czech Republic, Hungary and Poland stock markets. In a sense, this index represents the new EU and as it includes newer members acceding and candidate countries could be cointegrated with it. The test results are provided in Table 5. Both Trace and Maximum Eigenvalue test results for bivariate analysis fail to exceed the 5% critical values for testing null of zero cointegrating vectors. Neither pairwise nor multivariate cointegration can be found with the EU index consistent with the findings for the Europe index. There is no cointegrating vector, no long-run relationship between the EU and the acceding and candidate countries’ indexes. It follows that second-round countries do not share a trend with either of the Czech Republic, Hungary or Poland that could have resulted in cointegration.
Table 5
Finally, the integration of these markets with the US equity market are analyzed. Bivariate and multivariate cointegration is explored with the S&P500 index. Table 6 presents the findings. Both the Trace and the Maximum Eigenvalue tests fail to reject the null hypothesis at the 5% significance level. The rank of the coefficient matrix is zero at the 5% significance level for pairwise and multivariate analyses. This finding indicates that there is no linear long-term relationship that is stationary between the S&P500 and the markets under examination. Accordingly, US stock market which is quite influential over emerging market assets is found to share no common trend with these markets and investors have the opportunity to minimize the risk of their portfolios by investing in them. As cointegration theory suggests absence of a cointegration relation means that these markets do not share long-run equilibrium from which short-term deviations can be forecasted and to which series will converge in the long term. Albeit these results do not imply any conclusion with the short-term lead-lag relationships. While the findings suggest no cointegration, Alexander(2001) points out that cointegration is not a pre-condition for lead-lag relationship to exist, that other common features between time series could result in causality.
Table 6
In this respect, following Gilmore and Mcmanus (2002) Engle-Granger (1987) causality tests is employed to the first differences of acceding and candidate countries’ series pairwise with the Europe, EU and S&P500 indices respectively to verify if there has been a causality running from one market to another in the short-run. The optimal lag length is again set according to Akaike information criterion. Table 7 provides the results of pairwise analyses. Significant probability values denote rejection of the null hypothesis. It is found that Europe, EU and S&P500 indices “Granger cause” CRO index unidirectional at the 5% significance level. It means that CRO index
Page 7 of 11EIoP: Text 2006-007: Full Text

follow its mature counterparts in the short-run that there exists a lead-lag relationship between them. On the other hand, there is no causality in either direction between these series and BET, ISE100 and SOFIX indices. Although these markets have been open to European Union countries as well as United States, there is no lead-lag relationship. Among the acceding and candidate countries only one-way “Granger causality” running from ISE100 to SOFIX is observed. This finding can be explained by the increasing amount of foreign direct investments from Turkey to Bulgaria in the recent years.
Table 7
6. Conclusion This study focuses on the integration level of second-round acceding and candidate countries with the European Union portfolio during the Accession period and sheds light on the diversification opportunities they provide in the long-term. The Accession period, which involves political, economical convergence and adoption of Community Acquis, demand acceding countries to bring their macro economic fundamentals to EU standards and develop stronger trade linkages with EU-15 towards accession to EMU. In doing so, these countries’ economies and accordingly business cycles become more and more dominated by EU-15. This fact suggest that assets traded in their stock markets will be integrated in time and stock prices will be dominated by common global factors rather than country specific factors. In this respect majority of emerging stock markets are called partially integrated. Harvey (1995) and Mateus (2004) respectively confirm partial integration of emerging and frontier EU accession countries with the world.
The modern portfolio theory says that low correlations between assets result in diversification of portfolio risk. However, recent studies of Erb et al. (1994) prove that correlation is a time-varying short-term measure and portfolios built accordingly may underestimate long term gains and require frequent rebalancing. In fact, risk-return analyses in standard mean-variance approach use return data where long-term trends are lost while price data is differenced. Accordingly, cointegration which is a long term measure of asset price co-movements, is a more reliable approach to portfolio investment decisions. It establishes a long-run equilibrium between asset prices and then short run deviations are estimated, thereby providing dynamic short- and long-run relationships. The analyses start with unit root tests to check that all series are integrated of order one and this precondition is verified at the 5% confidence level. Then the Johansen (1991) cointegration test is employed to weekly stock price indexes of Bulgaria, Croatia, Romania and Turkey on bivarite and multivariate settings. The cointegration analyses reveal that second-round accession and candidate countries are not cointegrated with the MSCI Europe as well as with the US portfolio. Furthermore the results for the MSCI Europe portfolio do not change when the first-round major accession countries namely Czech Republic, Hungary and Poland are added to the Europe portfolio. While the results of Johansen (1991) methodology suggest non-cointegration, Engle-Granger (1987) causality tests reveal a casual flow from Europe, EU and S&P500 indices to CRO index suggesting a short-run lead-lag relationship amongst. It is also observed that second-round countries are not cointegrated as a group while a casual flow from ISE100 index to SOFIX index is found. These findings point out significant diversification opportunities for international investors within Bulgaria, Croatia, Romania and Turkey not only in the short-run, as low correlations imply, but also in the long-run.
However, absence of cointegration does not exclude the negative effect of a possible local crisis within these markets on the portfolio diversification opportunities because stock prices are still dominated by country specific factors. These countries are still characterized as emerging markets and limited market depth, high country risk and contagion continue to be the major sources of risk for portfolio investment decisions in respective stock markets. Nonetheless the diversification benefits of these countries’ can be further investigated within the Mean-Variance framework as inclusion of these indexes to the Europe portfolio could result in significant risk reduction for a given level of return. These results also suggest that Bulgaria and Romania’s integration with the European
Page 8 of 11EIoP: Text 2006-007: Full Text
Union stock markets is not complete despite the completion of accession negotiations which bring these economies closer to each other. Croatia needs to take several steps to re-start negotiations with the EU.
This research basically provides evidence that second-round countries are not cointegrated with their mature European Union and US counterparts within 10:2000-08:2005 covering the majority of the accession period. However portfolio investment decisions should be made combining the implications of cointegration and causality tests with the mentioned risks that still prevail in these emerging markets.
References Aggrawal, R., Lucey, B. and Muckley, C. 2002. Time varying equity market integration in Europe. Draft paper.
Alexander, C. 2001. Market Models: A guide to financial data analysis. John Wiley & Sons Ltd.
Arshanapalli, B. and Doukas, J. 1993. International stock market linkages: evidence from the pre- and post-October 1987 period. Journal of Banking and Finance 17: 193–208.
Baele, L., Crombez, J., and Schoors, K. 2004. Are Eastern European Equity markets integrated? Evidence from a regime-switching shock spillover model. Draft paper.
Bessler, D.A. and Yang, J. 2003. The structure of interdependence in international stock markets. Journal of International Money and Finance 22: 261-287.
Blaszkiewicz, M., and Wozniak, P. 2003. Do Candidate Countries Fit Optimum-Currency- Area Criteria?. CASE — Center for Social and Studies & Analyses No. 290 – A Strategy for EMU Enlargement 53
Brada, J.C., Kutan, A.M. and Zhou, S. 2002. Real and monetary convergence within The European Union and between The European Union and candidate countries: A rolling cointegration approach. Working Paper, Center for European Integration Studies, Bonn. http://www.bus.umich.edu/KresgeLibrary/Collections/Workingpapers/wdi/wp458.pdf
Brzozowski, M. 2003. Exchange Rate Variability and Foreign Direct Investment — Consequences of EMU Enlargement. CASE — Center for Social and Economic Research, Studies & Analyses, No. 258.
Dickey, D. A. and Fuller, W. A. 1981. Likelihood ratio statistics for autoregressive time series with a unit root. Econometrica 49(4): 1057–72.
Engle, R.F. and Granger, C.W.J. 1987. Co-integration and error correction: representation, estimation and testing. Econometrica 55: 251-276.
Erb, C. B., Harvey, C., and Viskanta, T. E. 1994. Forecasting international equity correlations. Financial Analyst Journal. Nov/Dec: 32-45.
Floros, C. 2004. Testing for cointegration between stock prices in the transition markets of Central Europe. Draft paper.
Page 9 of 11EIoP: Text 2006-007: Full Text

Gilmore, C.G. and McManus, G.M. 2002. International portfolio diversification: US and Central European equity markets. Emerging Markets Review 3: 69-83.
Ghosh, A., Saidi, R.,Johnson, K.H. 1999. Who Moves the Asia-Pacific Stock Markets-US or Japan? Empirical Evidence Based on the Theory of Cointegration. The Financial Review, 34 , 159-170
Granger, C.W.J. 1983. Co-integrated variables and error-correcting models. Unpublished UCSD Discussion paper, 83-113.
Harvey, Campbell. R.1995. Predictable risk and returns in emerging markets. Review of Financial Studies 8: 773-816.
Haug, A.A., MacKinnon, J.G. and Michelis, L. 2000. European Monetary Union: A cointegration analysis. Journal of International Money and Finance.
Johansen, S. 1991. Estimation and hypothesis testing of cointegration vectors in Gaussian vector autoregressive models. Econometrica 59(6): 1551–80.
Johansen, S. 1995. Likelihood-Based Inference in Cointegrated Vector Autoregressive Models. Oxford University Press,Oxford.
Johansen, S. and Juselius, K. 1990. Maximum likelihood estimation and inference on cointegration with application to the demand for money. Oxford Bulletin of Economics and Statistics 52: 169–210.
Kasa, K. 1992. Common stochastic trends in international stock markets. Journal of Monetary Economics 9: 95–124.
MacKinnon, J. G. 1996. Numerical Distribution Functions for Unit Root and Cointegration Tests. Journal of Applied Econometrics 11: 601–618.
Masih, R. and Masih, A.M.M. 2004. Common stochastic trends and the dynamic linkages driving European stock markets: evidence from pre- and post-October 1987 crash eras. The European Journal of Finance 10: 00-00.
Mateus, T. 2004. The risk and predictability of equity returns of EU accession countries. Emerging Markets Review 5: 241-266.
Osterwald-Lenum, M. 1992. A note with quartiles as the asymptotic distribution of the maximum likelihood cointegration rank test statistics. Oxford Bulletin of Economics and Statistics 54(3): 461–72.
Phillips, P. and Perron, P. 1988. Testing for a unit root in time series regression. Biometrica 75: 335–46.
Phylaktis, K. and Ravazzolo, F. 2005. Stock market linkages in emerging markets: implications for international portfolio diversification. International Financial Markets, Instýtitutions and Money 15 : 91-106.
Rangvid, J. 2001. Increasing convergence among European stock markets? A recursive common stochastic trends analysis. Economic Letters 71: 383-389.
Rostowski, J. 2002. When Should Central Europeans Join EMU?. CASE — Center for Social and Economic Research, Studies & Analyses, No. 253.
Page 10 of 11EIoP: Text 2006-007: Full Text

Rouwenhorst, K.G. 1998. European Equity Markets and EMU: Are the differences between countries slowly disappearing?. Draft Paper.
Serletis, A. and King, M. 1997. Common stochastic trends and convergence of European Union stock markets. The Manchester School 65: 44-57.
Syriopoulos, T. 2004. International portfolio diversification to Central European stock markets. Applied Financial Economics 14: 1253-1268.
Verchenko, O. 2000. Potential for portfolio diversification across Eastern European stock markets. Dissertation for MA in Economics, National University “Kiev-Mohyla Academy”.
Voronkova, S. 2003. Instability in the long-run relationships: evidence from the Central European emerging stock markets. Discussion Paper, Symposium on International Equity Market Integration, Institute for International Integration Studies, Dublin.
Yuce, A. and Simga-Mugan, C. 2000. Linkages among Eastern European stock markets and the major stock exchanges. Russian and Eastern European Finance and Trade 36: 54-69.
Endnotes
(*) Acknowledgements: I am grateful to Dr. Hakan Aksoy, from Pioneer Inv., for providing me the data and Prof. Dr. Vedat Akgiray for his valuable comments and suggestions.
©2006 by Ceylan Onay formated and tagged by KH, 3.8.2006
Page 11 of 11EIoP: Text 2006-007: Full Text

Table I Descriptive statistics of weekly index returns
Table II Correlation Matrix of stock market index returns
BET CRO EU EUROPE ISE100 SOFIX SP500Mean 0.0092 0.0032 -0.0011 -0.0013 0.0033 0.0078 -0.0005Median 0.0072 0.0026 0.0014 0.0013 0.0078 0.0044 0.0014Maximum 0.1192 0.0752 0.1127 0.1200 0.2578 0.2940 0.0749Minimum -0.1588 -0.1192 -0.0928 -0.0972 -0.3037 -0.1827 -0.1233Std. Dev. 0.0345 0.0270 0.0253 0.0256 0.0621 0.0430 0.0237Skewness -0.3449 -0.4137 -0.1856 -0.0796 -0.2946 1.0388 -0.6290Kurtosis 5.2449 5.4116 5.2535 5.5859 7.3895 12.0778 6.3732Exc. Kurtosis 2.2449 2.4116 2.2535 2.5859 4.3895 9.0778 3.3732Kolmogorov-Smirnov 0.061 0.084 0.068 0.071 0.080 0.098 0.066Significance 0.026 0.000 0.006 0.004 0.000 0.000 0.009Observations 252 252 252 252 252 252 252
BET CRO EU EUROPE ISE100 SOFIX SP500BET 1.000CRO 0.101 1.000EU 0.035 0.235 1.000EUROPE 0.031 0.246 0.988 1.000ISE100 0.189 0.052 0.279 0.255 1.000SOFIX 0.081 0.103 -0.055 -0.054 0.098 1.000SP500 0.044 0.209 0.819 0.802 0.219 -0.023 1.000
AppendixEIoP: Text 2006-007: Full Text

Table III Unit Root Tests
Table IV Johansen Cointegration Analyses with Europe Index
ADF PP levels first differences levels first differences
BET -2.4715 -14.3808 -2.8676 -14.4293CRO -1.7351 -8.8527 -1.7582 -15.1527EU -1.1712 -10.3823 -1.0793 -15.1211EUROPE -1.1474 -10.3306 -1.0702 -15.6139ISE 100 -3.7190 -6.1468 -3.2602 -15.9781SOFIX -3.3814 -17.4670 -3.3699 -17.3922SP500 -1.8718 -4.5388 -1.8174 -16.2752
Panel A: bivariate cointegration with Europe Hypothesis 5% critical values 1% critical values H0 HA Trace test BET CRO ISE100 SOFIXr = 0 r > 1 15.41 20.04 5.625 7.250 10.603 12.324r< 1 r > 2 3.76 6.65 0.003 0.015 4.050 2.053
Maximum Eigenvalue r=0 r=1 14.07 18.63 5.621 7.236 6.553 10.271r<1 r=2 3.76 6.65 0.003 0.015 4.050 2.053Panel B: multivariate cointegration with Europe Hypothesis 5% critical values 1% critical values H0 HA Trace test BET-CRO-ISE100-SOFIX
r = 0 r > 1 68.52 76.07 67.324 r< 1 r > 2 47.21 54.46 31.996 H0 HA Maximum Eigenvalue
r = 0 r=1 33.46 38,77 35.329 r< 1 r=2 27.07 32.24 15.175
AppendixEIoP: Text 2006-007: Full Text
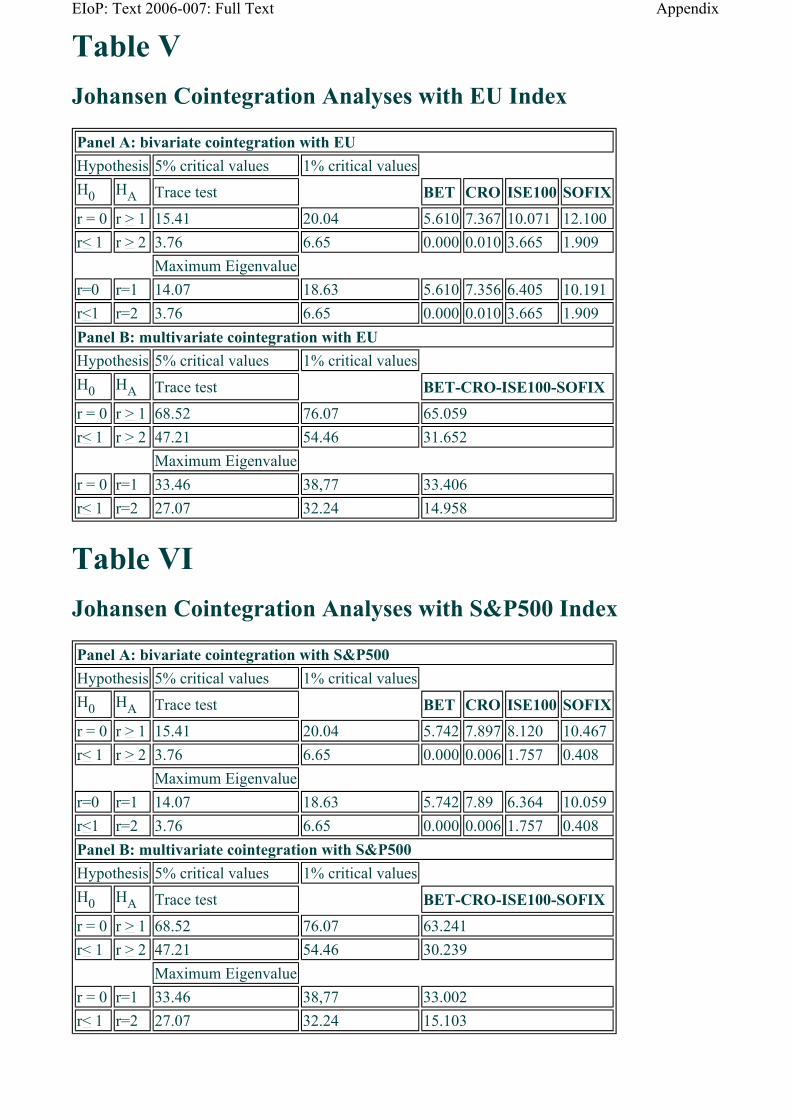
Table V Johansen Cointegration Analyses with EU Index
Table VI Johansen Cointegration Analyses with S&P500 Index
Panel A: bivariate cointegration with EU Hypothesis 5% critical values 1% critical values H0 HA Trace test BET CRO ISE100 SOFIX
r = 0 r > 1 15.41 20.04 5.610 7.367 10.071 12.100r< 1 r > 2 3.76 6.65 0.000 0.010 3.665 1.909
Maximum Eigenvalue r=0 r=1 14.07 18.63 5.610 7.356 6.405 10.191r<1 r=2 3.76 6.65 0.000 0.010 3.665 1.909Panel B: multivariate cointegration with EU Hypothesis 5% critical values 1% critical values H0 HA Trace test BET-CRO-ISE100-SOFIX
r = 0 r > 1 68.52 76.07 65.059 r< 1 r > 2 47.21 54.46 31.652
Maximum Eigenvalue r = 0 r=1 33.46 38,77 33.406 r< 1 r=2 27.07 32.24 14.958
Panel A: bivariate cointegration with S&P500 Hypothesis 5% critical values 1% critical values H0 HA Trace test BET CRO ISE100 SOFIX
r = 0 r > 1 15.41 20.04 5.742 7.897 8.120 10.467r< 1 r > 2 3.76 6.65 0.000 0.006 1.757 0.408
Maximum Eigenvalue r=0 r=1 14.07 18.63 5.742 7.89 6.364 10.059r<1 r=2 3.76 6.65 0.000 0.006 1.757 0.408Panel B: multivariate cointegration with S&P500 Hypothesis 5% critical values 1% critical values H0 HA Trace test BET-CRO-ISE100-SOFIX
r = 0 r > 1 68.52 76.07 63.241r< 1 r > 2 47.21 54.46 30.239
Maximum Eigenvalue r = 0 r=1 33.46 38,77 33.002r< 1 r=2 27.07 32.24 15.103
AppendixEIoP: Text 2006-007: Full Text

Table VII Granger Causality Test Results
Pairwise Granger Causality Tests Panel A: Europe and BET,CRO,ISE100,SOFIX F-Statistic ProbabilityBET does not Granger Cause EUROPE 1.47594 0.23059EUROPE does not Granger Cause BET 0.17095 0.84297
CRO does not Granger Cause EUROPE 0.90294 0.40672EUROPE does not Granger Cause CRO 6.9758 0.00113*
ISE100 does not Granger Cause EUROPE 0.7998 0.45059EUROPE does not Granger Cause ISE100 1.37616 0.25449
SOFIX does not Granger Cause EUROPE 0.89801 0.40872EUROPE does not Granger Cause SOFIX 0.32093 0.72578Panel B: EU and BET,CRO,ISE100,SOFIXBET does not Granger Cause EU 1.1689 0.31244EU does not Granger Cause BET 0.17942 0.83587
CRO does not Granger Cause EU 0.65718 0.51922EU does not Granger Cause CRO 7.56004 0.00065*
ISE100 does not Granger Cause EU 0.45454 0.63528EU does not Granger Cause ISE100 1.53998 0.21645
SOFIX does not Granger Cause EU 1.31242 0.27105EU does not Granger Cause SOFIX 0.51797 0.59638Panel C: S&P500 and BET,CRO,ISE100,SOFIXBET does not Granger Cause SP500 0.99376 0.37167SP500 does not Granger Cause BET 0.35289 0.70301
CRO does not Granger Cause SP500 0.8893 0.41227SP500 does not Granger Cause CRO 3.07396 0.04803*
ISE100 does not Granger Cause SP500 1.34451 0.26258SP500 does not Granger Cause ISE100 2.20273 0.11268
SOFIX does not Granger Cause SP500 1.91024 0.15024SP500 does not Granger Cause SOFIX 0.55465 0.57499Panel D: BET,CRO,ISE100,SOFIXCRO does not Granger Cause BET 0.77879 0.46009BET does not Granger Cause CRO 2.37379 0.09527
ISE100 does not Granger Cause BET 0.01564 0.98448BET does not Granger Cause ISE100 0.04103 0.95981
SOFIX does not Granger Cause BET 0.60435 0.54724
AppendixEIoP: Text 2006-007: Full Text

*significant at 5% level.
©2006 by Ceylan Onay formated and tagged by KH, 3.8.2006
BET does not Granger Cause SOFIX 0.11789 0.88884
ISE100 does not Granger Cause CRO 2.04711 0.13131CRO does not Granger Cause ISE100 0.39028 0.67728
SOFIX does not Granger Cause CRO 0.47562 0.62207CRO does not Granger Cause SOFIX 2.07047 0.12833
SOFIX does not Granger Cause ISE100 1.8326 0.16218ISE100 does not Granger Cause SOFIX 6.63262 0.00157*
AppendixEIoP: Text 2006-007: Full Text