a closer look at bleve overpressure
TRANSCRIPT

HAL Id: hal-02914194https://hal.archives-ouvertes.fr/hal-02914194
Submitted on 8 Jun 2021
HAL is a multi-disciplinary open accessarchive for the deposit and dissemination of sci-entific research documents, whether they are pub-lished or not. The documents may come fromteaching and research institutions in France orabroad, or from public or private research centers.
L’archive ouverte pluridisciplinaire HAL, estdestinée au dépôt et à la diffusion de documentsscientifiques de niveau recherche, publiés ou non,émanant des établissements d’enseignement et derecherche français ou étrangers, des laboratoirespublics ou privés.
A closer look at BLEVE overpressureD. Laboureur, A. M. Birk, J. M. Buchlin, P. Rambaud, L. Aprin, F. Heymes,
A. Osmont
To cite this version:D. Laboureur, A. M. Birk, J. M. Buchlin, P. Rambaud, L. Aprin, et al.. A closer look at BLEVEoverpressure. PROCESS SAFETY AND ENVIRONMENTAL PROTECTION, 2015, 95, pp.159-171.�10.1016/j.psep.2015.03.004�. �hal-02914194�
1
TavcCiUtce
A closer look at BLEVE overpressure
D. Laboureura,∗, A.M. Birkb, J.M. Buchlina, P. Rambauda, L. Aprin c, F. Heymes c, A. Osmontd
a von Karman Institute, Environmental and Applied Fluid Dynamics Department, 72, Chaussée de Waterloo, B1640 Rhode-St-Genèse,
Belgiumb Department of Mechanical and Materials Engineering, Queen’s University, Kingston, Ontario, Canadac Ecole des Mines d’Alès, Laboratoire Génie de l’Environnement Industriel, Alès, Franced CEA, DAM, GRAMAT, F-46500 Gramat, France
Keywords: BLEVE
Blast wave Overpressure
a b s t r a c t
The overpressure produced by the boiling liquid expanding vapor explosion (BLEVE) is still not well understood. Various methods have been published on the overpressure modeling in the far field. They mostly differ by the modeling of the expansion energy, used to scale the distance to the source where the overpressure needs to be calculated. But these meth-ods usually include a experimentally fitted reduction factor, and are mostly overestimating the overpressures. Today there is a growing interest in modeling the BLEVE overpressure in the near field, for studying the blast effect on critical infrastructure such as bridges and buildings. This requires a much better understanding of the BLEVE blast. This paper goes deeper in the understanding of the physical phenomenon leading to the BLEVE blast wave generation and propagation. First, mid-scale BLEVE experiments in addition to new exper-imental data for near field blast from a small scale supercritical BLEVE are analyzed. And second, an analysis method of the shocks observed in the experiments is presented based on fundamental gas dynamics, and allows the elaboration of a new modeling approach for BLEVE overpressure, based on the calculation of the initial overpressure and radius of the blast.
Modeling Moving shock Stationary shock
on thermodynamic equations. The procedure first consists inthe calculation of the expansion energy, which is expressed
. Introduction
he boiling liquid expanding vapor explosion (BLEVE) has beentopic of research since the early 1960s. Research has pro-
ided us with some simple practical methods to estimate theonsequences of these events, resumed in guidelines like theCPS (1994) or the TNO (1997), but also methods of reduc-
ng the likelihood of BLEVE events (Abbasi and Abbasi, 2007).nfortunately, BLEVE still happen nowadays and the descrip-
ion of the physical aspects of the phenomenon is still notlear. In addition, today studies are underway looking into theffects of accidental or intentionally staged events on critical
∗ Corresponding author.E-mail address: [email protected] (D. Laboureur).URL: http://www.vki.ac.be (D. Laboureur).
infrastructure, which requires a more detailed description ofBLEVE hazards, and especially at very close range.
This article focus on one specific hazard of BLEVE: the blastwave. The objectives are to better understand the genera-tion and the propagation of the blast, and to propose a newmodeling approach based on fundamental gas dynamics andthermodynamic principles.
In most of the publications, blast modeling is dedicatedto the prediction of the first peak amplitude, and this over-pressure peak is modeled using generalized methods, based

differently depending on the model. But all the modelsinclude the expansion energy in the calculation of a scaleddistance that is used to evaluate the overpressure from scaledoverpressure curves (CCPS, 1994). In another approach, vanden Berg published new scaled overpressure curves (van denBerg, 2008) from a modeling of expansion controlled shockproduction, based on the assumption that the explosive evap-oration of the liquid is as fast as the inertia of the expandingmixture (van den Berg et al., 2004, 2006).
In parallel to the modeling research, BLEVE experimentshave been conducted over the years, and included a varietyof fluids, vessel shape and scale, heating system, and intru-mentation (Birk et al., 2006a,b; Birk and Vandersteen, 2006;Balke et al., 1999; Davison and Edwards, 2008; Giesbrecht et al.,1981; McDevitt et al., 1988, 1990; Johnson et al., 1991; Stawczyk,2003; Rirksomboon, 1997; van der Voort et al., 2012, 2013). Anexperimental database of BLEVE overpressure measurementsis very important to validate overpressure models, and espe-cially in the near field. But the number of BLEVE experimentsthat measured the overpressure signals remains to scarce, andthe current overpressure models do not allow the completeunderstanding of the physics behind the BLEVE blast effects(Laboureur et al., 2013). It is usually stated that the blast effectcomes from the expanding vapor driving the ambient air likea piston, assuming that the liquid cannot do work on the sur-roundings as the liquid must flash to vapor to do expansionwork. But with the case of a tank filled only with liquid thereis no vapor space, and therefore the blast effect must comefrom phase change. When there is a vapor space then thereis vapor available immediately to produce a blast effect. Doesthis vapor produce the blast or does the flashing liquid alsocontribute? Can they both produce a blast wave?
In this paper we have attempted to predict the blasteffect from selected tests series using fundamental fluid andthermodynamic principles only, trying to avoid any fittingparameter (Genova et al., 2008; Casal, 2008) or numerical mod-eling (van den Berg et al., 2004, 2006). In addition to themid-scale experiments performed by Birk and Vandersteen(2006), a key new data set from Laboureur is used (Laboureur,2012), as the blast effect has been measured above the reser-voir in addition to the usual side overpressure measurements.
First, Section 2 describes the two types of experiments per-formed by the authors, and Section 3 describes the modeling ofboth a stationary shock or a moving shock, based on thermo-dynamic and gas dynamic assumptions. Then the modeling ofthe moving shock is used to develop a new approach to modelthe first peak overpressure generated by a BLEVE as describedin Section 4, together with a summary of the experimentaldata used for comparison with the proposed models discussedin Section 5.
2. BLEVE blast wave analysis based onexperimental results
2.1. BLEVE of 1.9 m3 propane tank
Between 2001 and 2002, a series of BLEVE experiments wereperformed with a 1.9 m3 propane tank (Birk and Vandersteen,2006). Internal pressure, temperature at different positionsinside the reservoir, and overpressures at 10–40 m both at sideand end directions from the reservoir have been measured.
Concerning the experiments used in this paper, the reser-voir was heated by an array of gas burners, and a pressurerelief valve was connected to the reservoir, and set to 1.72 MPa.Among the nine BLEVE recorded, the strongest happened afterthe reservoir failure at 1.9 MPa, and was filled about half withsaturated propane liquid and half with saturated vapor at theinstant of failure. The Fig. 1 illustrates the rupture of the reser-voir, showing two distinct steps. The initial frames show agrowing lobe of fire as the failure grows along the length ofthe vessel. But the vessel does not directly fail catastrophically,and the fire observed in the first three frames is a propane jetfrom the rupture opening. After the third frame, the vessel failscatastrophically and the propane expands explosively out ofthe vessel. The shock wave is not visible on these pictures, butit can be guessed as the last image in the sequence shows acondensation cloud produced by the shock passing throughthe moist atmosphere. The shock is buried in the cloud in the4th frame and emerges out of the propane cloud in the lastframe. Even if the shock is not visible, comparison with theresults of Laboureur can lead to the assumption that the shockis created at a certain distance from the tank surface when thetank fully opens.
The size of this cloud can be estimated by assuming thatthe isentropic expansion energy goes entirely into pushing theatmosphere out of the way. The cloud radius can be calcu-lated from the Eq. (1). In this equation, Eis is the isentropicexpansion energy (defined as the difference in internal ener-gies evaluated before rupture (ui) and after expansion to theatmospheric pressure (uf): Eis = m(ui − uf)) and Patm is the ambi-ent pressure. In this case Eis = 32 MJ, which gives an Rc = 4.3 m.This correlates well with the images of Fig. 1 as the length ofthe reservoir is equal to 2.7 m.
43
�R3c = Eis
Patm(1)
Looking closer at the first step of the BLEVE, a stationaryshock can be observed above the opening of the vessel, asshown in Fig. 2. This shock is initially a semicircular arc orig-inating from the tips of the failure crack. As the crack growsthis arc grows with it. When the flow is dry vapor the flowbefore the shock is clear and condensation takes place afterthe shock. When liquid is entrained into the flow then we seethe white cloud in the middle of the jet before the shock. Whenthe vessel fails catastrophically and opens fully, the standingshock is released and travels into the ambient atmosphere.
The second step, once the reservoir has failed catastroph-ically, produced the blast waves shown in Figs. 3 and 4. Thesefigures show the classic overpressure waveform expected froma BLEVE where both liquid and vapor are present at the instantof failure. In Fig. 3 left, the overpressure measured at 10 mfrom the side of the vessel shows a first overpressure peak,followed by an underpressure of similar magnitude to theoverpressure, caused by an overexpansion of the vapor flow.The underpressure is then followed by a second overpressurefrom the recovery of the vapor flow. A third overpressure isalso observed afterwards, and believed to be caused by theflashing liquid. None of these are strong shocks since theyare all moving only slightly above sonic velocity. In Fig. 3right, we see these same shocks but recorded at 20 m fromthe tank side. The shock fronts are a little steeper and theoverpressures peaks have decayed. An underpressure is alsodeveloping behind the second wave. Notice that the third wavehas steepened.
In Fig. 4 left, the overpressures have decayed further at30 m. It looks like the third wave has caught up and merged

Fig. 1 – BLEVE of 1.9 m3 propane tank, 50% full of liquid, failure pressure 2 MPa (�t between frames: 33 ms).
Fig. 2 – Typical view of two-step BLEVE where failure begins as a small opening in a fire weakened wall. Two phase propanejet visible.
Fig. 3 – Overpressure measured at 10 m (left) and 20 m (right) from side of 1.9 m3 propane tank.
Fig. 4 – Overpressure measured at 30 m (left) and 40 m (right) of 1.9 m3 propane tank.

Fig. 5 – Left: Reservoir dimensions nomenclature. Right: Reservoir configuration and position of temperature measurement
Fig. 6 – P-s thermodynamic diagram, summarizing thetests performed by Laboureur.
points.
with the second wave thereby helping the second wave toalmost maintain the 20 m location overpressure value. Thisfigure also shows data measured from the tank end (in greyin Fig. 4). The overpressure from the end is lower than thatfrom the sides, and can be explained by shielding from theends as the tank opened. The Fig. 4 right shows the data at40 m distance. At this point the overpressures have decayedfurther and the end and side pressures have almost the sameamplitude.
2.2. Catastrophic failure of 95 ml vessel filled withsupercritical fluid
Small scale experiments were recently completed byLaboureur that studied the detailed failure mechanismsof very small cylinders (95 ml) filled entirely with propane,containing 86% of liquid at ambient temperature (Laboureur,2012). The experiments were performed inside a dedicatedsafe facility called Bleve And Boilover ExperimentaL setup(BABELs). The facility consists of a cylindrical chamber of2 m diameter, and 3 m height, made out of steel, with round-shaped flanges, three series of seven optical accesses of0.15 m in diameter, and an elliptical door.
The cylinders were electrically heated from the bottomuntil rupture at pressures between 20 and 45 MPa were super-critical BLEVE were observed. The temperature was measuredin the upper part of the reservoir (position 1 in Fig. 5 right) andin the lower part (position 2 in Fig. 5 right). To ensure an earlyand reproducible failure, the cylinders were mechanicallymachined with an axial defect along the length of the reser-voir and located on top of the reservoir. The cylinder and defectcharacteristics are given in Table 1: d and b being determinedby the tool used to machine the defect, and 2c being variedfrom 10 mm to the longest possible according to the size of thereservoir. Overpressure has been measured above the reser-voir at 0.28 m, and at ground level along the reservoir, at 0.5,0.6, and 0.7 m. High-speed visualization and shadowgraphywere also used. More information about the BABELs facilityand the experimental setup are provided by Laboureur (2012).
From the experiments of Laboureur, the sequences ofimages, illustrated in Figs. 7 and 8, show the initial releaseof the propane. Both cylinders failed at a fluid pressure andtemperature that are supercritical. The white cloud observedcan be described as condensation of the supercritical fluid into
vapor and liquid droplets. The Fig. 7 shows a lower pressureTable 1 – Summary of cylinder geometry.
Fluid m (g) V (ml) Rout (mm) d (mm) 2c (mm) b (mm)
Propane 41 95 40 2 10, 15, 80 0.8
release with a rough cloud shape (blurry cloud) while Fig. 8shows a higher pressure release with a very smooth cloudsurface (dome cloud). The higher pressure release would havecrossed the saturation line on the vapor side of the dome andthe lower pressure failure would have crossed on the liquidside, as observed in Fig. 6. The cloud stops growing when theexpansion energy is used by moving the ambient air out ofthe way. The cloud then quickly disperses. The volume of thecloud before dispersion can be calculated from Eq. (1), as donefor the experiments of Birk. In these experiments, Eis = 7.65 kJ,which gives an Rc = 0.26 m, and correlates well with the imagesas the cylinder length is equal to 0.138 m, and in Fig. 10, thecloud stabilizes around the height of the horizontal bare wherethe pressure transducer is fixed and located at 0.28 m from thereservoir. The two-step BLEVE detailed from the experimentsof Birk has not been observed in this scale and with a super-critical rupture. As it can be observed in Figs. 7 and 8, once thecylinder starts its rupture, it does not stop until complete fail-ure. Therefore, no propane jet preceded by a stationary shockhas been observed.
Overpressure measurements for two groove lengths(2c = 0.04 m and 2c = 0.01 m) are showed in Fig. 9 right for anoverpressure measured at taken at 0.5 and 0.6 m from the sideof the reservoir, and in Fig. 9 left for an overpressure measuredat 0.28 m above the reservoir. The blast wave pressure at a fixedreference distance shows a first peak (A in Fig. 9), followed bya sharp drop with negative part, which is the typical shape ofa blast wave, similarly observed in the measurements of Birk.The value of the overpressure peak also increases when thegroove length decreases, or in other words, when the rupturepressure increases.
On the pressure signal measured above the reservoir, a sec-ond peak is observed (C in Fig. 9 left) for small groove lengths.

Fig. 7 – NTG cylinder, 2c = 0.077 m (rupture pressure: 35 MPa), no smooth dome (�t = 0.28 ms).
Tchvpo
his peak corresponds to the moment when the dome-likeloud touches the pressure sensor (which is located in theorizontal bar, as observed in Fig. 10). Finally, a last peak isisible both on the shadowgraph (E in Fig. 10) and on the
ressure signals (E in Fig. 9), and observed after the rupturef reservoirs with small groove lengths, corresponding to theFig. 8 – NTG Cylinder 2c = 0.015 m, high pressure fai
apparition of the dome-like cloud. In the shadowgraph images(see Fig. 10), this second blast wave appears just after the cloudhas disappeared, that is, evaporated. And as the dome-likecloud vaporizes a lot faster than the blurry cloud due to the
higher rupture pressure and temperature and to the smallerproportion of supercritical fluid that has condensed, this fastlure (44 MPa) with smooth dome (�t = 0.28 ms).

Fig. 9 – Overpressure signal. Left: above the reservoir (0.28 m). Right: at ground level, on the sides of the reservoir (0.5 and
0.6 m).vaporization seems to be the cause of the second blast wavegeneration. Finally, the time scale of the cloud ejection and theblast waves is a lot smaller for the experiments of Laboureurthan for Birk. Indeed, the duration of the first positive andnegative blast overpressure peaks in the measurements ofLaboureur is approximately 35 times smaller than observedin the measurements of Birk.
3. BLEVE shock modeling
As a first modeling approach, the modeling of the differentstates of the fluid during the rupture will be done based onthermodynamic and gas dynamic assumptions. The model-ing is divided in two parts, according to the two types of shockobserved. First, the stationary shock, as observed in the exper-
iments of Birk during the first step of a two-step BLEVE isinvestigated. And second, the moving shock observed bothFig. 10 – Shadowgraph visualization of cloud and blast w
in the experiments of Birk (second step) and Laboureur ismodeled.
3.1. Stationary shock
As observed in Fig. 2 illustrating the experiment of Birk, a sta-tionary shock is formed where the reservoir has just ruptured(Fig. 11). At this step of the reservoir rupture, the opening canbe considered as a sharp edge orifice, which experiences asonic point beyond the exit of the orifice. To correctly modelthis situation, four fluid states are considered, as shown inFig. 11.
• State 0: Before reservoir rupture, fluid at rest.• State 1: The fluid expands isentropically to sonic conditions.
Therefore, the conditions in 1 are found by iteration on P1,such that U1 (the fluid velocity) and a1 (the sound velocity)
ave at five times indicated by letters A–E in Fig. 9.

Fig. 11 – Pressure evolution and stationary shock, during first step of BLEVE observed by Birk.
Table 2 – Governing equations, normal shock.
State P = �RTMass conservation d(�U) = 0Momentum conservation AdP = d(�U2)Energy conservation dh0 = d(h0 + d(U2/2)) = 0
•
•
eacwTTtt
otMtbpai
b
Table 3 – Overexpanded supersonic flow (Birkexperiment).
State P T (◦C) Mach Quality
0 1.9 MPa 55 0 1.01 1.14 MPa 32 1 0.982 9.3 kPa −85 3.18 0.873 101.3 kPa 87 0.4 Superheated
At shock dA = 0
are equal. The velocity U1 is calculated assuming the con-servation of the total enthalpy, and a negligible velocity atrupture. The 1D energy equation, as written in Eq. (2), canbe applied (White, 1986).
U21
2= (h0 − h1) (2)
State 2: The fluid continues to expand until the conditionsbefore the shock (P2, �2, T2). The velocity U2, at P2 is calcu-lated analogous to Eq. (2).State 3: A normal stationary shock is assumed, and the pres-sure after the shock is equal to the atmospheric pressure(P3 = Patm).
To determine the variables in state 2 and 3, the governingquations of a normal shock need to be solved. The fluid isssumed to be an ideal gas, the shock is supposed to have aonstant area, the flow is considered 1D, frictionless, adiabatic,ith no external work and where body forces are negligible.herefore, the system of equations to solve is described inable 2, where P is the pressure, U is the shock velocity, h ishe enthalpy, � is the specific volume, � is the density and A ishe flow area (White, 1986).
As the ideal gas assumption has been considered, this setf equations can be simplified, to give the pressure (P3/P2) andemperature (T3/T2) ratios across the shock, in addition to theach number after the shock (M3), if the Mach number before
he shock (M2) is known. This Mach number M2 can be foundy iteration on P2, providing that P3 is equal to the atmosphericressure. The k (defined as Cp/Cv) is calculated from propanet conditions of state 2, and the sound speeds are determinedn propane vapor. This set of equations is expressed in Eq. (3).
P3
P2= 1
k + 1[2kM2
2 − (k − 1)]
T3
T2= [(k − 1)M2
2 + 2]2kM2
2 − (k − 1)
(k + 1)2M22
M23 = (k − 1)M2
2 + 2
2kM22 − (k − 1)
(3)
The four fluid states as described in this model haveeen applied to the experiment of Birk, whose results were
described in the Section 2.1. This experiment involved a ves-sel of 1.9 m3 filled at 50% with liquid at the moment of rupturethat happened at 1.9 MPa. The calculation here only involvesthe vapor part, and the results are shown in Table 3.
3.2. Moving shock
As observed in Fig. 1 for the experiments of Birk and in Fig. 10for the experiments of Laboureur, when the reservoir failscatastrophically, the cloud of expanding fluid acts like a piston.And at some point, the piston effect creates a shock in the airthat propagates into the surrounding. To correctly model thissituation, four fluid states are considered, as shown in Fig. 12.
• State 0: Before reservoir rupture, fluid at rest.• State 1: The fluid expands isentropically, pushing the ambi-
ent air. Assuming an adiabatic process and assuming theair kinetic energy can be ignored, but the work of the fluidpushing the ambient air is taken into account. The energyconservation is expressed as Eq. (4). In addition, a guessneeds to be made on P1.
−P1(�1 − �0) = u1 − u0 + U21
2(4)
• State 2: The high velocity of the cloud expansion acts likea piston, and compress the ambient air until a pressure P2.The calculations in this state are therefore based on air.
• State 3: A normal moving shock is assumed, and the pres-sure after the shock is equal to the atmospheric pressure(P3 = Patm). Again, the calculations for this state are basedon air.
The governing equations for a stationary shock can also beused for a normal moving shock, by adapting the choice ofthe control volume that moves at the shock speed (called C).This simplification does not affect the thermodynamic prop-erties. The shock appears then fixed from this viewpoint, andthe air appears to have a shock velocity U3 = C on the left and
U2 = C − U1 on the right where U1 is the piston velocity cal-culated from Eq. (2). This gives the normal shock conditions
Fig. 12 – Pressure evolutio
Table 4 – Moving shock following propane expansion(Laboureur experiment), if P1 = 30 kPa.
State P T (◦C) Velocity (m/s) Fluid
0 44.7 MPa 183 0 Propane1 30 kPa −66 482 (piston) Propane2 530 kPa 255 736 (shock) Air3 101.3 kPa 20 0 Air
liq liq
→ �P
�Ps0= f
(R
Rs0
)(5)
as shown in Fig. 13. But in the case of a moving shock, theshock speed C is unknown, which makes impossible the use ofsimplified equations as done for the stationary shock. There-fore, the governing equations expressed in Table 2 were solveddirectly, using the Engineering Equation Solver software (EESsoftware from F-Chart Software).
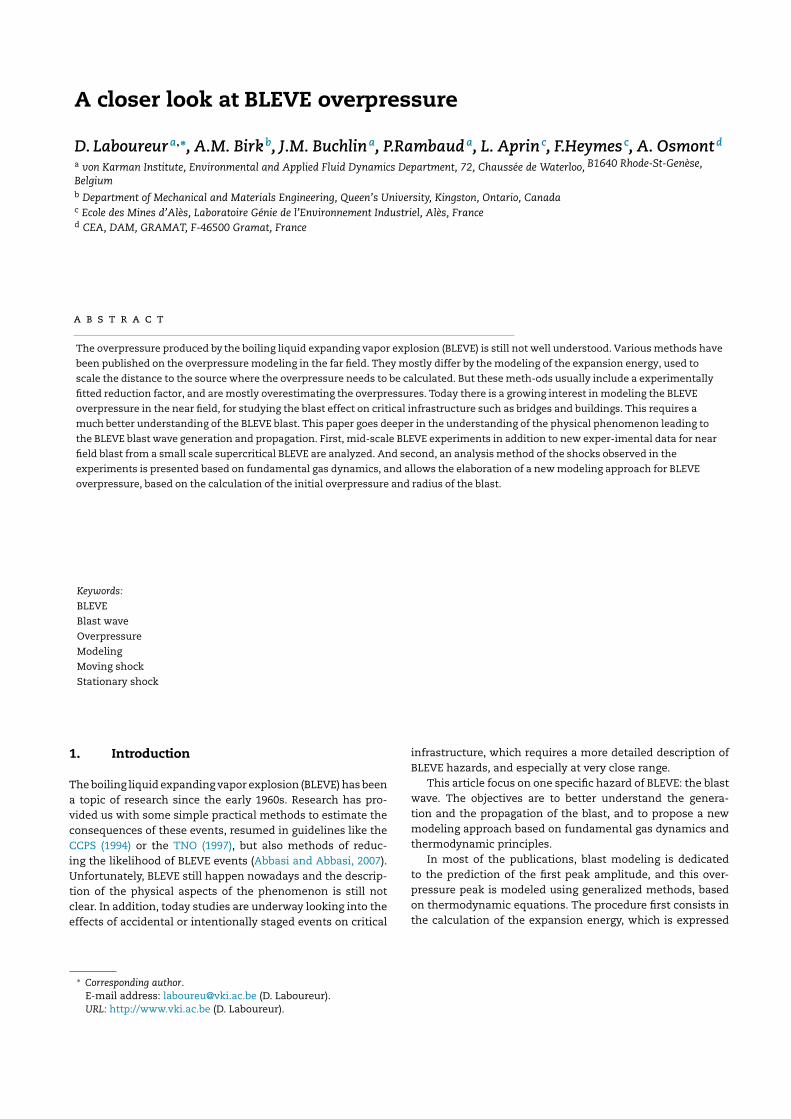
This model has been applied to the conditions of one exper-iment of Laboureur involving a 95 ml reservoir containing 41 gof propane. The cylinder ruptured at 44.7 MPa and a fluid tem-perature of 183 ◦C, which reflects a supercritical state. The onlyunknown in this model is the expanded pressure P1. Therefore,Fig. 14 left shows the relationship between the piston and theshock velocity with the expanded pressure. On the other side,Fig. 14 right shows the velocity of the shock wave and the cloudboundary processed from the shadowgraph images illustratedin Fig. 10, based on the radius evolution. Even if the veloci-ties at the very beginning of the test cannot be determinedfrom the images, it can be interpolated that the cloud initialvelocity lies between 400 and 500 m/s, which corresponds toan expanded pressure range of 20–35 kPa. But this range ofexpanded pressure models the shock velocity between 650 and750 m/s, which seems very high compared to the measuredvalues.
In addition, the different states, providing an overexpanded
pressure of 30 kPa, are illustrated in Table 4.Fig. 13 – From moving to stati
n and moving shock.
4. BLEVE overpressure modeling
To be able to predict the overpressure at any distance fromthe source, and with more physical insight than the usualBLEVE overpressure modeling as described in CCPS (1994), theblast curves developed by van den Berg (2008) are used. vanden Berg studied numerically expansion controlled overpres-sures from BLEVEs. In these numerical simulations, van denBerg assumes that the tank opens instantaneously and therelease is hemispherical, suggesting these assumptions as asafe way to predict BLEVE blast. In addition, van den Bergassumed that the expanding vapor is saturated at the liq-uid temperature (x0 = 1), that is, the vapor separates from theflashing liquid. In the 1D simulation using an Euler code, thecreation of the shock happens very close to the cylinder sur-face, from a source area covering the initial liquid volume.The decay of the overpressure then follows from this startingoverpressure with a 1/Rn relationship, as observed in Fig. 15left.
The curves of van den Berg can be scaled with the initialshock overpressure �Ps0 and the initial position of the shockRs0, using the Eq. (5), so that the function equals (1, 1) at (�Ps0,Rs0), and decreases with an exponent n as the distance fromthe source increases. The coefficient n, fitted for the propanedecay curves of van den Berg, was found equal to n = 1.12,as observed in Fig. 15 right. The coefficient for butane decaycurves was found equal to n = 1.08. But n = 1 fits also very wellthe curves, but considering only R/Rs0 ratio below 10.
�P
Patm= f
(R
m1/3
)→ �P/Patm
�Ps0/Patm= f
(R/m
1/3liq
Rs0/m1/3
)
onary shock formulation.
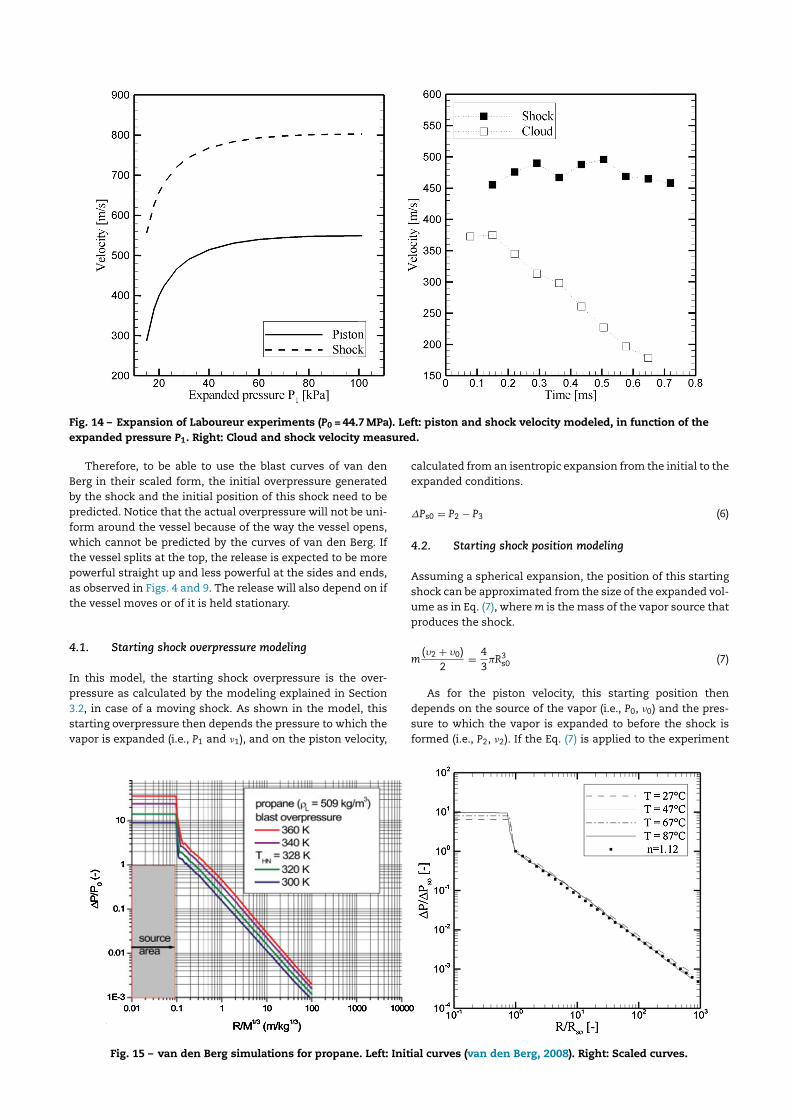
Fig. 14 – Expansion of Laboureur experiments (P0 = 44.7 MPa). Left: piston and shock velocity modeled, in function of thee ured
Bbpfwtpat
4
Ip3sv
xpanded pressure P1. Right: Cloud and shock velocity meas
Therefore, to be able to use the blast curves of van denerg in their scaled form, the initial overpressure generatedy the shock and the initial position of this shock need to beredicted. Notice that the actual overpressure will not be uni-orm around the vessel because of the way the vessel opens,hich cannot be predicted by the curves of van den Berg. If
he vessel splits at the top, the release is expected to be moreowerful straight up and less powerful at the sides and ends,s observed in Figs. 4 and 9. The release will also depend on ifhe vessel moves or of it is held stationary.
.1. Starting shock overpressure modeling
n this model, the starting shock overpressure is the over-ressure as calculated by the modeling explained in Section.2, in case of a moving shock. As shown in the model, this
tarting overpressure then depends the pressure to which theapor is expanded (i.e., P1 and �1), and on the piston velocity,Fig. 15 – van den Berg simulations for propane. Left: Initi
.
calculated from an isentropic expansion from the initial to theexpanded conditions.
�Ps0 = P2 − P3 (6)
4.2. Starting shock position modeling
Assuming a spherical expansion, the position of this startingshock can be approximated from the size of the expanded vol-ume as in Eq. (7), where m is the mass of the vapor source thatproduces the shock.
m(�2 + �0)
2= 4
3�R3
s0 (7)
As for the piston velocity, this starting position thendepends on the source of the vapor (i.e., P0, �0) and the pres-
sure to which the vapor is expanded to before the shock isformed (i.e., P2, �2). If the Eq. (7) is applied to the experimental curves (van den Berg, 2008). Right: Scaled curves.

Table 5 – Ratio between top and side overpressure,based on Laboureur measurements compared with thecurves of van den Berg.
Test 1 Test 2
�Pa (R = 0.28 m) 112.6 160.9�Pb (R = 0.5 m) 19.5 25.8�Pc (R = 0.28 m from VDB with n = 1.12) 37.3 49.4�Pc/�Pa 3 3.26
Fig. 16 – Experimental data and van den Berg
of Laboureur, as presented in Section 3.1 (P0 = 44.7 MPa), theshock is visible at first from the shadowgraph images approx-imately at 0.11 m from the center of the cylinder. The model, ifthe fluid overexpands to 30 kPa gives a position of 0.17 m, andif the fluid expands only to 101.3 kPa, the modeled positiondecreases to 0.12 m from the center of the cylinder.
4.3. Selected experimental data
Published BLEVE blast data is very limited. In almost everypublication, data is recorded on the ground at given distancesfrom the reservoir side or end. But there is almost no dataon the location and strength of the starting shock, neitherfrom the tank top. In addition, the uncertainties about fail-ure conditions and the differences in the failure mechanismsmake their comparison complicated. The source of the energythat generates the shock is still not clear, especially becausein many experiments, the measured overpressure lies belowthe expected value based on energy considerations, probablyas a part of this energy is lost in the opening of the reser-voir. Therefore, only the most powerful BLEVEs observed willbe investigated here. Five different sets of data are discussedin this paper. They have been selected because they covera large range of scales and they show some of the high-est BLEVE overpressures recorded. At first, the experimentsof Laboureur and Birk, as described in Section 2 are used.In addition, the test of Giesbrecht et al. (1981) that involveda 1 m3 vessel with 452 kg of liquid propylene (already usedby van den Berg for comparison of his model (van den Berget al., 2004)), and the blast from a full scale tank car test per-formed by the BAM are also used (Balke et al., 1999). Finally,the last set of experiments comes from a 5.7 m3 test withpropane or butane, performed by British gas (Johnson et al.,1991).
The Table 6 gives a summary of the data considered. Ifseveral tests were performed, only the one that caused thestronger overpressure is presented in the table. For each test,the overpressure measured the closest from the reservoir ismentioned (�Pa, measured at a distance Ra). In addition, thisvalue is compared with the overpressure predicted from theblast curves of van den Berg (�PVDB) if published, as van denBerg did not calculate a BLEVE from propylene, or from super-critical fluids. Then, the initial overpressure is calculated fromEq. (8).
�P
�Ps0=(
R
Rs0
)n
→ �Ps0 = �Pa
(Ra/Rs0)n(8)
In this equation, the measured value and distance �Pa andRa are used. The initial shock position is taken as five times thecylinder radius. Indeed, in the measurements of Laboureur asshown before, the shock appeared at 0.1 m, which is five timesthe cylinder radius. As this is the only position measured,it will be assumed that all reservoirs experience a similarposition ratio. Therefore, Rs0 = 5(D/2). From Eq. (8), �Ps0 caneasily be calculated, using n = 1.12 for propane, and n = 1.08
for butane. Finally, this initial overpressure is scaled back toits value on the top of the reservoir as the experiments ofLaboureur showed a ratio between 3 and 3.5 relating the mea-sured value on top of the reservoir, and the value interpolatedfrom the curves of van den Berg, as calculated in Table 5.nondimensionalization compared (side pressure).
5. Discussion
The Table 6 allowed to calculate the initial overpressure basedon the overpressure measured the closest from the reservoir.But in all the tests, other overpressure measurements weretaken further from the reservoir. The Fig. 16 compares themeasurements divided by the calculated initial overpressureand radius, as explained in Section 4.3, with the fit of van denBerg curves. The initial overpressure is taken as the initial sideoverpressure (no factor 3–3.5), since the further positions ofoverpressure were measured at the side of the reservoir. It canbe observed that the comparison is fairly good between thenumerical simulation and the data. It can therefore be con-cluded that, if the initial overpressure and radius are correctlymodeled, the simulations of van den Berg can correctly modelthe overpressure at further distances.
The comparison between the initial shock overpressurescalculated from the modeling approach described in Section3.2 and the measurements scaled using van den Berg is dividedin several parts, depending on the rupture conditions; if thereservoir contains separate liquid and vapor phases or a super-critical fluid. For each case, an expansion to 101.3 kPa or anoverexpansion to 30 kPa are investigated. Concerning the mea-surements, the data displayed in Figs. 17 and 18 correspond tothe initial overpressure at the top (�Ps0), the error bar indi-cating the range, since the top overpressure is 3–3.5 timesthe side overpressure. The rupture of a reservoir contain-ing saturated liquid and vapor (rupture before the criticalpoint) is investigated in Fig. 17 left that shows the initialshock overpressure variation with the rupture temperature.The Fig. 17 left shows the experimental results of the Britishgas performed with butane as fluid, combined with the initialoverpressures as calculated by van den Berg from its numericalsimulation. The comparison shows that most of the data arefitting well the overexpansion of vapor to 30 kPa. But the datarelated to a reservoir rupture around 100 ◦C show a quite largescatter. Among the five data points, the three centered points
have similar conditions, but the lower point has a fluid masshalved compared to the other tests and the higher point has a
Table 6 – Summary of test considered.
Laboureur Giesbrecht BAM BG Birk
Fluid Propane Propylene Propane Butane PropaneTank volume (m3) 95 × 10−6 1 45 10.8 1.9Tank D (m) 0.04 0.7 2.9 1.2 1Mass liquid (kg) 0.041 452 3308 2083 425Mass vapor (kg) 0 0 2252 38 41Burst pressure (MPa) 45 6 2.5 1.51 1.9Liquid T (◦C) 183 70 68 99.5 55Failure mode Machined flaw and
heatingKnife or explosivecharge
Fire heating Explosive Fire heating
Pressure relief valve No PRV No PRV No PRV No PRV PRV operatedseveral times
�Pa (kPa) 161 65 2.5 6.2 13.1Ra (m) 0.28 (top) 3.9 (side) 100 (side) 25 (side) 10 (side)�PVDB (kPa) 3.3 10 20�Ps0 (kPa) at side 507 159 48.6 66.6 61.8
–560
riteoa
vrtbBatocrnsBnt
�Ps0 (kPa) at top (�Ps0 side × 3–3.5) 507 477
eservoir volume doubled, but with the fluid mass kept sim-lar. Therefore, either the volume taken by the vapor insidehe reservoir, not taken into account in this model, influ-nces the results, or this volume change induces a differentverexpansion. More data should be needed to confirm thesessumptions.
The rupture of a reservoir containing saturated liquid andapor propane is illustrated in Fig. 17 right. The experimentalesults of the British gas experiment performed with propane,he BAM experiment, and the experiments of Birk are com-ined with the initial overpressures as calculated by van denerg from its 1D numerical simulation. At first, a large discrep-ncy can be observed between the stronger test and the otherests experienced by Birk. The stronger overpressure has alsone of the highest rupture temperature and so pressure, whichould explain the discrepancy. When the available energy atupture is not high enough, a too large part of this energy iseeded to open the tank, which decreases the energy of thehock wave. This phenomenon does not concern the tests ofritish gas since they forced the tank opening with a deto-
ation. If only the stronger test of Birk is taken into account,he data are, similarly to the butane results, fitting better theFig. 17 – Predicted starting shock overpressure versus tempe
146–170 200–233 185–216
overexpanded vapor model. Only the BAM test does not fitwith the vapor overexpansion line. But the BAM report alreadystates a screening effect of the pieces of the broken reservoir,that weakened the resulting blast wave, so that the overpres-sure signals recorded were considerably less than expected.
The supercritical ruptures of Laboureur and Giesbrecht arecompared in Fig. 18. From this comparison, the supercriticalresults of Laboureur are well predicted by isentropic expan-sion to somewhere between 101.3 and 30 kPa. In opposite, thesingle data point for Giesbrecht is completely out of rangecompared to the model. But the experiments of Giesbrechthave to be taken with great care, since the exact rupture con-ditions and position of the overpressure measurement arenot clearly stated in the publication. Similarly to the compar-isons of Fig. 17, more data is needed to confirm this analysis.Finally, the initial radius of the blast as modeled in Section 4.2is compared with the initial shock radius as observed in theshadowgraph images performed by Laboureur (2012) in Fig. 18right. This figure shows that the model, whatever the value ofthe expanded pressure, overestimates the initial radius. But
the too small number of data to compare with this modelmakes its validation difficult.rature. Left: saturated butane. Right: saturated propane.

Fig. 18 – Left: predicted starting overpressure versus temperature for supercritical propane and propylene with similarspecific volumes as for the experiments. Right: Initial radius of the blast wave calculated from the model, and comparedwith the experiments of Laboureur.
6. Conclusions
In this paper, two types of pressure reservoir ruptures havebeen experimentally investigated. The mid-scale experimentsshowed a two-step rupture. At first, the reservoir opens onlypartially, leading to a stationary shock as the fluid expandsto the atmosphere, and then ruptures completely, leading toa moving shock. The supercritical small scale experimentsonly experienced a one-step rupture and a moving shock.The shadowgraph images showed that the first peak of themeasured overpressure is due to the shock that followed therupture, and that a second shock follows, due to the fast vapor-ization of the fluid. Both stationary and moving shocks weremodeled with basic gas dynamic and thermodynamic prin-ciples. However, the lack of measured values in the differentsteps of the shock formation makes the validation of thesemodels difficult. In addition, the modeling of the moving shockhas been used to develop a new modeling approach for the firstpeak overpressure generated by a BLEVE. The moving shockmodeling allows to calculate the overpressure of the start-ing shock, which, combined with the initial shock radius, isused to calculate the overpressure at other positions, using thenumerical simulations of van den Berg, nondimensionalized.This new approach has been compared with five sets of exper-iments. However there is not enough data available to validatethe methods, and the data does not allow to clearly decide ifthe moving shock comes effectively from the vapor. Therefore,more experimental data is needed. And preferably, these newexperiments should use propane, for easier comparison withavailable data. The tests should be designed with a very rapidand complete failure to fminimize the effect of the rupture onthe shock generation. The blast should be measured from thetop, the side, and the end of the reservoir, and as close as pos-sible to the reservoir. Preferably, both cases of liquid and vaporand supercritical should be investigated with the same appa-
ratus, and shadowgraph images should be taken to determinethe shock starting position.Acknowledgements
The authors wish to thank the CEA of Gramat which hassupported the experimental results of Laboureur, performedin the frame of a joint research project about source termcharacterization in major hazards, collaborating with the vonKarman Institute and the École des Mines d’Alès.
References
Abbasi, T., Abbasi, S.A., 2007. The boiling expanding vapourexplosion (BLEVE): mechanism, consequence assessment,management. J. Hazard. Mater. 141 (3), 489–519.
Balke, C., et al., 1999. Study of the Failure Limits of a Tank CarFilled with Liquefied Petroleum Gas Subjected to an Open PoolFire Test. Federal Institute for Materials Research and Testing(BAM), Berlin.
Birk, A.M., Vandersteen, J.D.J., 2006. On the transition fromnon-BLEVE to BLEVE failure for a 1.8 m3 propane tank. ASME J.Press. Vessel Technol. 128 (4), 648–655.
Birk, A.M., Poirier, D., Davison, C., 2006a. On the thermal ruptureof 1.9 m3 propane pressure vessels with defects in theirthermal protection system. J. Loss Prev. Process Ind. 19 (6),582–597.
Birk, A.M., Poirier, D., Davison, C., 2006b. On the response of500 gal propane tanks to a 25% engulfing fire. J. Loss Prev.Process Ind. 19 (6), 527–541.
Casal, J., 2008. Evaluation of the Effects and Consequences ofMajor Accidents in Industrial Plants. Industrial Safety Series,vol. 8. Elsevier, Amsterdam, The Netherlands.
CCPS (Ed.), 1994. Guidelines for Evaluating the Characteristics ofVapor Cloud Explosions, Flash Fires, and BLEVEs. AmericanInstitute of Chemical Engineers, New York.
Davison, H., Edwards, M.R., 2008. Effects of fire on smallcommercial gas cylinders. Eng. Fail. Anal. 15 (8), 1000–1008.
Genova, B., Silvestrini, M., Trujillo, F.J.L., 2008. Evaluation of theblast-wave overpressure and fragments initial velocity for aBLEVE event via empirical correlations derived by a simplified
model of released energy. J. Loss Prev. Process Ind. 21 (1),110–117.
G
J
L
L
M
M
R
iesbrecht, H., et al., 1981. Analysis of explosion hazards onspontaneous release of inflammable gases into theatmosphere. Germ. Chem. Eng. 4, 194–206.
ohnson, D.M., Pritchard, M.J., Wickens, M.J., 1991. A Large ScaleExperimental Study of BLEVEs: Contract Report on CECCo-Funded Research Project. British Gas Plc., Research andTechnology Division, Midlands Research Station.
aboureur, D., 2012. Experimental Characterization and Modelingof Hazards: BLEVE and BOILOVER. Universite Libre deBruxelles, Brussels.
aboureur, D., et al., 2013. BLEVE overpressure: multiscalecomparison of blast wave modeling. Process Saf. Prog. 33 (3),274–284, September 2014.
cDevitt, C.A., Steward, F.R., Venart, J.E.S.,1988. Boiling liquidexpanding vapour explosion—an update. In: 5th TechnicalSeminar on Chemical Spills. Pergamon Press, Montreal.
cDevitt, C.A., et al., 1990. Initiation step of boiling liquidexpanding vapour explosions. J. Hazard. Mater. 25 (1), 169–180.
irksomboon, T., 1997. Investigation of Small BLEVE Tests, in
Chemical Engineering. National Library of Canada, Ottawa,Canada, pp. 212.Stawczyk, J., 2003. Experimental evaluation of LPG tank explosionhazards. J. Hazard. Mater. 96 (2), 189–200.
TNO, 1997. Yellow Book: Methods for the Calculation of PhysicalEffects. CPR 14E, 3rd edition. Committee for the Prevention ofDisasters, The Hague.
van den Berg, A.C., 2008. Blast Charts for Explosive Evaporation ofSuperheated Liquid. Process Saf. Prog. 27 (3), 219–224.
van den Berg, A.C., et al., 2004. Expansion-controlled evaporation:a safe approach to BLEVE blast. J. Loss Prev. Process Ind. 17 (6),397–405.
van den Berg, A.C., et al., 2006. BLEVE blast byexpansion-controlled evaporation. Process Saf. Prog. 25 (1),44–51.
van der Voort, M.M., et al., 2012. Blast from explosive evaporationof carbon dioxide: experiment, modeling and physics. ShockWaves 22 (2), 129–140.
van der Voort, M.M., et al., 2013. An experimental study on thetemperature dependence of CO2 explosive evaporation. J. LossPrev. Process Ind. 26 (4), 830–838.
White, F.M., 1998. Fluid Mechanics, Fourth edition. WCBMcGraw-Hill, New York.