a climatology of hurricane eye formation
TRANSCRIPT

VOLUME 140 MONTHLY WEATHER REVIEW 2012
A Climatology of Hurricane Eye Formation
JONATHAN L. V IGH��
NCAR Advanced Study Program and Earth Systems Laboratory,�Boulder, Colorado
Department of Atmospheric Science, Colorado State University, Fort Collins, Colorado
JOHN A. K NAFF
NOAA/NESDIS – Regional and Mesoscale Meteorology Branch, Fort Collins, Colorado
WAYNE H. SCHUBERT
Department of Atmospheric Science, Colorado State University, Fort Collins, Colorado
(Manuscript received 29 April 2011, revised 30 September 2011,in final form 21 November 2011)
ABSTRACT
This paper presents a climatology of the initial eye formations of a broad set of Atlantic tropicalcyclones (TCs) during 1989-2008. A new data set of structure and intensity parameters is synthesizedfrom the Vortex Data Messages transmitted by routine aircraft reconnaissance. Using these datatogether with satellite imagery and other established data sets, the times when each TC achievedvarious stages of eye development are tabulated to form the basis of the climatology. About 60% ofAtlantic TCs form eyes. Most often, aircraft observe the eye structurebefore it appears in IR satelliteimagery. Eyes tend to form in high potential intensity environments characterized by high sea surfacetemperatures and low-to-moderate environmental vertical wind shear.A notable discovery is that most(67%) TCs that form eyes tend to do so within48 h of the cyclone’s reaching tropical storm strength.This suggests the existence of an opportune time window during which a TC can readily form an eye.From the lengths of time taken to reach various stages of eye development,the characteristic timescalefor eye formation is estimated to be about36 h.
1. Introduction
The formation of an eye (and by implication, aneyewall) has long been viewed as the hallmark of atropical cyclone (TC) that has surpassed the minimumthreshold for hurricane intensity [64-kt (33 m s�1)maximum 1-min sustained surface wind speed]. Thecentral calm of the eye, with occasional breaks ofclouds, led early researchers to correctly surmise thatthe eye region must contain descending air (Ballou1892). As knowledge of hurricane thermodynamicsincreased, workers noted that the hydrostatic pressuredecrease caused by condensational latent heating isinsufficient to support the surface pressure dropfound in a hurricane (Palmen 1956; Malkus 1958)
�Corresponding author address:Dr. Jonathan Vigh, NationalCenter for Atmospheric Research, P. O. Box 3000, Boulder, CO80307-3000. E-mail: [email protected]
�The National Center for Atmospheric Research is sponsoredby the National Science Foundation.
— the development of an extreme pressure deficitrequires adiabatic warming by forced subsidence inthe eye (Anthes 1982). Since low surface pressuresare critical to enhancing the surface enthalpy fluxes, aTC cannot intensify beyond a certain point without awarm core. Structurally, the intense warming associatedwith the formation of an eye paves the way for furtherintensification and organization of the TC.
Observationally, the appearance and definition ofan eye figure prominently in the successful DvorakTechnique of estimating TC intensity using satelliteimagery — the eye structure often becomes evident insatellite imagery when the TC slightly exceeds hurricaneintensity (Dvorak 1984). In addition to the observationthat TCs readily form eyes near the hurricane threshold,several researchers have associated the formation ofan eye with a period of rapid intensification (Malkus1958; Yanai 1961; Mundell 1990; Weatherford andGray 1988b; Shapiro and Willoughby 1982; Willoughby1990). These studies suggest that so long as conditions
DOI: 10.1175/2011MWR000.0
c 2012 American Meteorological Society 1

2 MONTHLY WEATHER REVIEW VOLUME 140
remain favorable, a TC can intensify rapidly once aneye has formed. These concepts and observations lendsupport to the idea that hurricane structure and intensityare inextricably linked. Whether eye formation causesintensification, or is merely indicative of a chain ofprocesses that lead to intensification, it behooves usto consider the appearance of an eye as an importantmarker in TC development.
Before undertaking an investigation of the linkagesbetween structure and intensification, we think itprudent to first consider the climatology of hurricaneeye formation by examining the characteristics anddistributions from a large number of events. Severalstudies have touched on this subject, albeit peripherally.Weatherford and Gray(1988b) used aircraft data on the700 mb-flight level from 66 Western Pacific typhoons toexamine several aspects of the relationship between theeye and a TC’s intensity, including the resulting intensitychange and the size of the eye. Eyes were reportedacross a wide range of intensities, but were more oftenobserved in intense TCs than in weak TCs. Also, eyeswere reported more frequently in intensifying TCs thanin weakening TCs. TCs that form eyes early (at lowerintensities, e.g. the tropical storm stage) tend to havesmaller eyes, while TCs that form eyes later (at higherintensities) tend to have larger eyes. Taken together, theirresults suggest that the formation of an eye is associatedwith increasing levels of TC organization.
Kimball and Mulekar(2004) used Extended BestTrack (EBT) data to establish a detailed, quantitativeclimatology of size parameters for Atlantic TCs,including eye radius, radius of maximum winds, andouter size parameters. Analyzing statistics for the firsteye, this study showed that TCs form eyes mostfrequently at the Category 1 hurricane stage. The firsteye is reported less frequently in the Category 2, 3, and4 stages, even less frequently in tropical storms, and notat all in tropical depression and Category 5 stages. Aswe discuss later, the EBT data are less than ideal forstudying the problem of eye formation.
The steady accumulation of thousands of VortexData Messages (VDMs) from routine aircraft recon-naissance missions over the past two decades offersfertile ground from which to grow our knowledge onthe subject of eye formation. While these VDMs containonly basic and summarized data on the inner core kine-matic and thermodynamic characteristics of TCs, theydo contain the essential parameters needed for this study.Most notably, they include a consistent and objectivedetermination of eye presence that has remained fairlyconstant over the past several decades and is unaffectedby the limitations of satellite imagery.
Many basic questions remain as to the detailsof when and where eyes form, the intensities theyform at, their observed sizes upon formation, and the
environmental characteristics present at the time of eyeformation. This paper aims to provide a comprehensiveand robust climatology of the formation of the initialTC eye. The problem of secondary eyewall formationis not treated here (seeKossin and Sitkowski 2009fora climatology of secondary eyewall formation). Therest of the paper is organized as follows. Section2lays out the conditions under which an aircraft eyeis reported. Section3 documents the data used inthis study. Section4 defines the observational stagesof eye development that are used as baselines insubsequent data analysis. Section section5 detailshow cases are selected subject to the availability ofaircraft data and the manner in which cases are furtherstratified for composite analysis. The climatology ofeye formation is presented in section6. A summaryand concluding discussion are given in section7. Anonline supplement accompanies this article to provideadditional supporting materials and background thatmay be helpful to readers.
2. Definition for the aircraft eye
The keystone of this study is the use ofreconnaissance aircraft data to establish whether aneye was present or not. This aircraft-only approach isimportant because reconnaissance aircraft have useda consistent and reliable method for determining eyepresence for the past several decades. Specifically,aneye is only reported if a circular, precipitating, inner-cloud feature subtends at least half of the candidateeye region (Weatherford and Gray 1988b) on theaircraft’s forward-pointing weather avoidance radar. Ifthe eyewall feature completely encircles the eye region,a closed eyeis reported. If the eyewall subtends at least180ı of the eye with no breaks, anopen eyeis reported.If the eyewall feature does not encircle at least half thecentral region, no eye is reported, however the flightmeteorologist may include a mention ofpartial eyewallin the remarks. As also described byWeatherfordand Gray(1988b), to be considered an eyewall, thecircular convective feature must also be distinct fromthe adjacent spiraling bands. If the convection is notseparate from these bands, the descriptorspiral banding(or simplybanding) is often given.
Have differences in radar characteristics leadto differences in eye detection over the years?Probably not. All current U. S. Air Force Reserve(AFRES) WC-130J and NOAA WP-3D aircraft carrysimilar 5-cm (C-band) weather avoidance radarswith comparable operating characteristics (personalcommunication 2009, J. Parish). On this radar, whichis located in the aircraft nose, the 31 dBz reflectivitythreshold is used to identify eyewall structure becausethe next lowest threshold (21 dBz) sometimes includes

2012 VIGH ET AL 3
returns from precipitation aloft or cloud features notpart of the eyewall (personal communication 2009,J. Parish). Flight meteorologists on board the NOAAWP-3D aircraft may also use lower-fuselage radar todetermine eye presence. This C-band radar is morepowerful, has a larger antenna, and can scan a full360-degrees, in contrast to the forward-pointing noserose radar which can only see to the front and sidesof the aircraft. Earlier AFRES aircraft used 3-cm (X-band) nose radars (Weatherford and Gray 1988b) thatwere more more readily attenuated than the newer C-band nose radars. As a practical matter, the eyewallreflectivities are high enough that the differencesbetween the C- and X-band radars, and nose vs. lower-fuselage radars (which can be significant in othercontexts), probably do not change the results here. Thus,though this method of determining eye presence issubjective and relies on the judgment of on board flightmeteorologists using various radars over the years, it ismore consistent than any other method available.
As described in section 2 of the supplement,compared with remote sensing observations or the fullflight level aircraft data, the historical VDM recordsare more complete, are well-suited to studying eyeformation, and offer the greatest number of cases. Asa result of instrumentation upgrades (see supplement),the last twenty years of Atlantic reconnaissance dataare also more accurate than were available to previousstudies (Shea and Gray 1973; Gray and Shea 1973;Weatherford and Gray 1988a,b; Kimball and Mulekar2004; Mundell 1990; Fitzpatrick 1996).
3. Data sources and processing
This study uses several existing data sets, includingthe Best Track, the Extended Best Track, and thedevelopment data set for the Statistical HurricaneIntensity Prediction Scheme (SHIPS), and develops anew data set of TC structure parameters from the VDMs.A subjective analysis of infrared satellite imageryprovides additional information on the timing of eyeformation. This section describes the characteristicsof these data and the processing methods used tosynthesize the VDM data set.
a. Best Track (BT) data set
This study uses NHC’s archive best tracks (b-deckfiles) to establish the best estimates of the TC’s position,maximum sustained wind speed, and minimum sea levelpressure. All BT data are inherently smoothed in time.As observing technologies have advanced and moreplatforms have become available, the quality of the BTdata have generally improved (McAdie et al. 2009).Over the years, changes in operational practice andknowledge of TC structure (e.g.,Franklin et al. 2003)
have also led to epochal variations in the quality ofthe best track TC positions and intensities. Althoughthe b-deck files also contain values for the radius ofmaximum wind, it is very important to realize that theseradius of maximum wind data arenot best tracked —they are simply the operationally-estimated values usedfor each forecast cycle. The BT parameters used in thisstudy are summarized in Table1. Additional details areprovided in section 4 of the supplement.
b. Extended Best Track (EBT) data set
Prior to 2001, NHC’s archive best tracks often lackouter wind radii and radius of maximum wind data.To fill in these missing values, this study supplementsthe b-decks with radius of maximum wind valuesfrom the EBT data set. Like the values for radius ofmaximum wind in the b-decks, the EBT values for thisquantity are obtained from the operational advisories,which are based on operational data sources, includingship and buoy observations, aircraft observations,satellite-derived estimates, and operational analyses.As such, the EBT is a composite data set derivedfrom sources of varying quality, so the additionalEBT size parameters have generallynot benefited fromany post-season analysis (Demuth et al. 2006). Inmost cases, the radii were simply copied from thea-decks (files which contain operational guidance) to theb-decks by the Automated Tropical Cyclone Forecast(ATCF) system (Sampson and Schrader 2000; personalcommunication, B. Sampson 2010). We have uncoveredinconsistencies in the EBT’s radius of maximum windvalues for a number of TCs in the early period of thatdata set. Prior to 2001, plots (not shown, see Appendix Eof Vigh 2010) show many cases of poor correspondencebetween the EBT radii of maximum winds and actualaircraft measurements.
The EBT data set also contains an estimate ofeye diameter and could therefore have been used todetermine eye presence as was done inKimball andMulekar (2004). However, the EBT eye diameters areprovided both when the TC was observed by aircraft andwhen it was observed only by satellite. As a result, theEBT determinations of the presence of an eye and itsdiameter are not consistent throughout that data set.
c. Statistical Hurricane Intensity Prediction Scheme (SHIPS)developmental data set
Since the statistical-dynamical SHIPS intensityforecast aid incorporates a wide array of environmental,satellite, and model-based parameters to make skillfulpredictions of TC intensity (DeMaria and Kaplan 1994,1999; DeMaria et al. 2005), the developmental dataset on which its predictor relationships are developedprovides a convenient way to access information about

4 MONTHLY WEATHER REVIEW VOLUME 140
TABLE 1. A summary of Best Track parameters used in this study. The first column gives the symbolic notationused in this study, the second column gives the parameter description, and the third column gives the native unitsof the parameter in the Best Track data set.
Best Track ParametersParameter Description UnitsBT � Date and time of Best Track point UTCBT � Latitude of Best Track TC center degrees North positiveBT � Longitude of Best Track TC center degrees West positiveBT pmin Best Track minimum sea level pressure mbBT vmax Best Track 1-min maximum sustained surface wind speed ktb-deckrmax Radius of maximum winds at the surface from b-deck (not best tracked) n mi
the changing environmental conditions for past TCs.The SHIPS data set covers all named TCs in the Atlanticand Eastern Pacific basins from 1982 onward; startingin 1989, it also includes unnamed Atlantic tropicaldepressions. For 1982-2000, the predictors were derivedfrom NCEP Reanalysis fields. From 2001 onward, thepredictors have been obtained from the operationalanalyses and forecasts of the real-time runs of theGlobal Forecast System (GFS) model. Approximately50 predictors are available from 0 to120 h at 6-hintervals relative to the time and date of each case. Thisstudy only uses a small subset of these predictors toascertain the favorableness of the TC environment at theanalysis time of the operational model (t D 0 h); nomodel forecasts are used here. Table2 summarizes theSHIPS parameters used.
d. Cooperative Institute for Research in the Atmosphere(CIRA) GOES IR satellite archive
To provide a comprehensive cloud-top view ofthe TC during eye formation, we use IR satelliteimagery generated from the CIRA GOES IR satellitearchive (IR archive hereafter). That archive spans 212Atlantic TCs from 1995 to the present and consists ofdigital brightness temperatures from the IR channel 4(10:7 �m) in a window centered on the moving TCcenter (Zehr and Knaff 2007). From these brightnesstemperature data, images were generated at15 or 30 minintervals and subjectively analyzed according to criteriadescribed in section4.
e. VDM data set
The VDMs contain a wealth of information aboutTC intensity and structure. Each VDM contains dataassociated with a single vortex fix made by theaircraft. Once the fix center has been determined, aVDM is created and transmitted back to the Chief,Aerial Reconnaissance Coordination, All Hurricanes(CARCAH) at NHC in near real-time to provide the
operational forecasters with rapidly updated informationon the TC. An example VDM from Hurricane Rita(2005) is provided in Fig.1. This VDM, taken on the700 mb flight level when Rita was near peak intensity,indicates a maximum flight level temperature in the eyeof 31 ıC. Since the dew point at that location was�3 ıC,the resulting dew point depression was34 ıC. To theauthors’ knowledge, this is the highest eye temperature,the lowest dew point temperature, and the greatest dewpoint depression ever measured in a TC at the700 mbflight level.
From 1989-2008, reconnaissance aircraft made atotal of at least 4954 unique vortex fixes in 205 TCsin the Atlantic, Eastern Pacific, and Central Pacificbasins. Since TCs in the Eastern and Central Pacificbasins do not often threaten land, they are not normallyreconnoitered frequently enough to be of use for thisstudy. Thus, the remainder of this study focuses on the4692 VDMs taken from the 183 TCs that occurred in theAtlantic basin during this period.
Each VDM has been decoded and translated intoparameters describing the structure and intensity ofthe TC. Table3 summarizes the parameters obtaineddirectly from the VDMs. For more details on theVDM format and how the VDM parameters have beendecoded and translated, the reader is referred to section 5of the supplement (Table S2 provides an expandedversion of Table3 that includes additional deriveddynamical quantities). The parameters of the combineddata set utilize a combination of nautical units [knots(kt), nautical miles (n mi), millibars (mb)] and SI units.The native units of each source data set are preservedin this study to allow for the most effective qualitycontrol of these data and to provide results in units thatare familiar to the operational forecasting community(1 kt D 0:5144 m s�1, 1 n mi D 1:852 km, 1 mb D1 hPa, andıC D Kelvins� 273:15).
A summary table (Table S3, supplement) provides acatalog of all 205 TCs that were observed by aircraftreconnaissance in the Atlantic, Eastern Pacific, and

2012 VIGH ET AL 5
TABLE 2. Summary of a subset of the SHIPS environmental parameters. Columns are as in Table1.
SHIPS Environmental ParametersParameter Description UnitsVMPI Maximum Potential Intensity (Bister and Emanuel 1998) ktRSST Reynolds SST ıCE000 1000 mb �E (radial average from 200-800 km) KelvinsD200 200 mb divergence (radial average from 0-1000 km) 10�7 s�1
T200 200 mb temperature (radial average from 200-800 km) ıCSHDC 850-200 mb shear magnitude with vortex removed (radial average from 0-500 km) ktVVAV Average (0-15 km) vertical velocity of a parcel lifted from the surface m s�1
accounting for entrainment, ice phase, and condensate weight(radial average from 200-800 km)
FIG. 1. Example VDM from Hurricane Rita for thevortex fix taken at 0714 UTC on 22 September 2005. Forfurther explanation of the VDM format and contents, seesection 5 of the supplement.
Central Pacific basins from 1989-2008. From the 4924unique VDMs, this table characterizes the observedranges of kinematic and thermodynamic parametersover each TC’s lifetime.
4. Determination of eye development baselines
With the VDM data translated, the next task is todefine meaningful and robust definitions for discrete,
observable stages of eye development. From both aforecasting perspective, and the perspective of thedynamical evolution of a TC, it must be kept inmind that eye formation is a process, not an event.Nevertheless, to achieve the aims of this study it isnecessary to determine the initial point in time that eacheye development stage was observed in a given TC. Wewill refer to these discrete stages aseye developmentbaselines. Likewise, we will refer to the time when a TCwas first observed to manifest these initial eye or pre-eyecharacteristics asbaseline times. Once these baselinetimes have been determined, we then apply selectioncriteria to all eye-forming TCs to identify which TCsshould be included as cases.
a. Eye development baselines observed by aircraft
Following the principles outlined in section2, anaircraft eyeis considered to be present ifeither of thefollowing conditions are met:
� The VDM eyewall completeness descriptorcontains the words ‘open’ or ’closed’, or
� the aircraft reports an eye diameter descriptorandthe eyewall completeness descriptor contains oneof the following: ‘poor’, ‘weak’, or ‘ragged’.
Sometimes the eyewall completeness descriptorsare unclear, so we make several assumptions intreating these. We consider the descriptors ‘broken’,‘breaks’, and ‘semi-circle’ to be synonymous with anopen eyewall and map these accordingly in the dataset. The eyewall definition descriptors ‘poor’, ‘weak’,and ‘ragged’ are indeterminate without additionalinformation, so as long as the eye was defined wellenough that air crews were able to report an eyediameter, we assume that these eyewall descriptorscorrespond to valid ’open’ eyes. If the eye was reportedto be poorly defined but no diameter was given, wedesignate it as a ‘poorly defined eye’. Finally, air crews

6 MONTHLY WEATHER REVIEW VOLUME 140
TABLE 3. Summary of parameters obtained from the VDMs. First column provides the symbolic notation usedin the remainder of this study. Second column contains descriptions of each parameter. Third column gives thecorresponding section of the VDM that this parameter is obtained from (section names use the original phoneticalphabet). Last column gives the native units of the parameter in the VDM data set. The shorthand notation ‘FL’indicates that the observation pertains to flight level.
Directly-obtained VDM ParametersParameter Description VDM section UnitsVDM � Date and time of the vortex fix ALPHA UTCVDM � Latitude of the fixed surface center BRAVO ıNorthVDM � Longitude of the fixed surface center BRAVO ıWestFL SAS Standard atmospheric surface of flight level for current fix CHARLIE mb or ftFL Hmin Minimum height of the flight level SAS observed inside the center CHARLIE msurfacevmax,in Maximum surface wind speed observed during the inbound leg of DELTA kt
current fixsurfacermax Radius of maximum surface winds (range of surfacevmax,in ECHO n mi
from center fix coordinates)surfacevmax,out Maximum surface wind speed observed during the outbound leg remarks kt
of current fixsurfacevmax Combined maximum surface wind speed (see supplement for details)DELTA or remarks ktFL vmax,in Maximum flight level wind speed observed during the inbound leg FOXTROT kt
of current fixFL rmax Radius of maximum flight level winds (range of flight level GOLF n mi
vmax,in from center fix coordinates)FL vmax,out Maximum flight level wind speed from outbound leg of remarks kt
current fixFL vmax Combined maximum flight level wind speed (see supplement for details)FOXTROT or remarks ktVDM pmin Minimum sea level pressure (obtained by extrapolation HOTEL mb
or dropsonde)Tout Maximum flight level temperature observed just outside the INDIA ıC
eyewall or maximum wind bandTeye Maximum flight level temperature observed within5 n mi (9:3 km) JULIET ıC
of center fix coordinatesTsup Supplementary maximum flight level temperature observed more remarks ıC
than5 n mi (9:3 km) from center fix coordinatesTd,eye Dew point temperature observed at same location asTeye KILO ıCdeye Diameter of primary eye MIKE n mi
sometimes reported spiral banding for several fixesbefore a bona fide eye appears; in the data set, we storesuch values separately from eye presence.
Once the eye presence (or non-presence) has beendetermined for each VDM fix, the data for each TC areobjectively screened to determine the first time that anaircraft observed each of the following stages of eyedevelopment:
i. First spiral banding (B): the time of the firstfix that contains the words ‘bands’, ‘banding’, or‘spiral’.
ii. First open aircraft eye (A1): the time of the firstfix for which reconnaissance aircraft reports anopen radar eye.
iii. First closed aircraft eye (A2): the time of thefirst fix for which reconnaissance aircraft reportsa closed radar eye.
iv. First aircraft eye (A): the time of the first fix forwhich reconnaissance aircraft reports any radareye (whether open or closed).
b. Eye development baselines observed by satellite
To determine when theIR eye formed, wesubjectively analyzed the brightness temperatures (Tb,IR)from the IR archive to obtain the first date/timethe TC reached each of the following stages of eyedevelopment:
i. First open warm spot (IR1): the time of theIR satellite image when an open warm spot firstappears near the TC center. The warm spot maybe manifested as a region of warmTb,IR embeddedin a cold cloud shield, or as a larger, central cleararea of warmTb,IR encompassed by surroundingdeep convection. In either case, the warm spot

2012 VIGH ET AL 7
must be at least two-thirds surrounded by cloudtops of colderTb,IR.
ii. First closed warm spot (IR2): the time of theIR satellite image when a closed warm spot firstappears near the TC center. Colder cloud topsmust completely surround the warm spot.
iii. First eye (IR3): the time of the IR satelliteimage when the warmestTb,IR of the closed warmspot first exceeds�50 ıC or is at least15 ıCwarmer than nearby cloud tops of the surroundingconvection. Every point on the surrounding ringof coldestTb,IR must be less than theTb,IR of thewarm spot.
iv. First persistent eye (IR4): the beginning pointof the time period when the TC first maintains aneye (according to the criterion of IR3) for at least6 h.
v. First strong eye (IR5): the first time that thewarmest eyeTb,IR exceeds�30 ıC and is at leastthree-quarters surrounded by a ring of cold cloudtops withTb,IR colder than�70 ıC. In general, theeye should be fairly symmetric to be considered astrong eye.
Due to the transient nature of convection, oursubjective classification is somewhat uncertain for theIR1, IR2, and IR3 stages. The degree of subjectivitydecreases from IR1 to IR5, however. Compared withIR3, the IR4 stage provides a more robust classificationbecause the eye must persist for a testing period (6 h).In some cases, the eye became ill-defined after firstappearing and did not meet the precise definition of aneye for an image or two. As long as the eye generallypersisted and remained at the end of the6 h period,we have classified the case as a persistent eye (IR4).For the IR5 stage, insufficient resolution or an obliqueviewing angle may prevent the eye’s true maximumTb,IR from being observed. These factors may criticallyaffect whether or not a strong eye classification is made,especially for TCs with tiny eyes. As an example,Hurricane Opal (1995) was never classified as attainingIR5 because its pinhole eye1 did not display a pixelwarmer than�30 ıC.
c. Record of eye development baseline times
Using the above criteria, we recorded the date andtime that each aircraft or satellite eye development
1Pinhole eyes are very small eyes which are not well-resolvedby GOES IR satellite imagery (spatial resolution of approximately4 km), but which can be seen in higher-resolution channels such asvisible imagery (Olander and Velden 2007).
baseline was reached for each TC (see Table S4,supplement).
5. Selection of cases
With the initial eye formation times determined, thenext task is to determine which eye formation eventswere sufficiently observed by aircraft to be includedas cases in this climatology. Here we choose to focusentirely on the initial eye development in each TC’s lifecycle; all subsequent reformations are neglected. Thischoice makes our results as applicable as possible toforecasters tasked with predicting TCs that have not yetformed eyes. Thus, each eye-forming TC can only beincluded as one case in this study.
Eye formation can be a rather ephemeral processand the irregular aircraft sampling can make classifica-tion of cases a challenge. To select cases as objectivelyas possible, we require that valid cases satisfy thefollowing dual criteria: at least one aircraft fix musthave been takenprior to the first aircraft fix that reportsan eye, and the time interval between the prior eye-less fix and the first eye fix cannot exceed12 h. Thesecriteria ensure that an eye was not already present bythe time aircraft observations had commenced and thatcases are excluded if the eye could have formed aconsiderable length of time before the fix in which it wasfirst observed. This guideline is a compromise betweenincluding as many cases as possible and minimizingthe uncertainty as to when the eye formed. In fact, theaverage length of time between the eye-forming fix andthe previous fix (4:2 h, with a standard deviation of2:9 h) is much less than12 h.
a. Stratification of cases
To further stratify the eye formations, cases areobjectively classified according to the duration andpersistence of the initial eye (or subsequently reformedeyes) during the 72-h period following the first eyereport by aircraft. We impose this 3-day window toavoid considering cases in which an eye reforms manydays later in a completely different environment. Ourcategories are described as follows (the number of TCsin each case type is shown in parentheses):
i. No aircraft data (127, 87 of these were after1994): 1 or fewer aircraft fixes were taken (nonein most cases).
ii. No observed eye (76, 66 of these were after1994): no aircraft eye was reported in theTC during the period of aircraft observations(although it is possible that an eye could haveformed at some other time).

8 MONTHLY WEATHER REVIEW VOLUME 140
iii. Insufficient data (9): an eye was reported byaircraft for at least part of the TC’s lifetime,but the timing of the eye formation cannot bedetermined because the eye formed after aircraftobservations ceased or because the aircraft fixeswere too infrequent to determine the time offormation to within12 h.
iv. Eye already present (28): the initial eye formedbefore the period of aircraft observations began.
v. Rapid dissipation (17): the initial aircraft eyewas reported for a period of less than24 hand then dissipated without any further aircraftobservations of eye reformation.
vi. Intermittent formation (24) : the sequence ofaircraft fixes indicates that the initial eye haddissipated and subsequently reformed (possiblymultiple times) without any of these eyes lastinglonger than24 h. Such a sequence includes one ormore fixes with an aircraft eye (the initial eye),followed by at least one eye-less fix, followed byone or more additional aircraft eye reports.
vii. Delayed formation (12): the initial aircraft eyeformed and then dissipated, or was intermittentfor a time, but then eventually lasted for at least24 h without subsequent interruption.
viii. Sustained formation (17): the initial aircraft eyeformed and was sustained for at least24 h withoutinterruption.
With all TCs classified according to the durationand persistence of their initial eye formations, themethodological foundation has been laid for theclimatology.
b. Representativeness of cases
The vast majority of Atlantic TCs (240 of 310,or 77%) fall into the first four case types (no aircraftdata, no observed eye, insufficient data, and eye alreadypresent). Since the time of eye formation cannot bedetermined for these cases, they are unusable for thepurposes of this study. Given the limited geographicrange and intermittent nature of aircraft reconnaissanceflights, it is useful to consider how the vagaries ofaircraft sampling affect the selection of cases. Do theremaining eye-forming cases provide a sample thatis representative of the broader set of Atlantic TCs?To answer this question, we analyzed the spatial andtemporal characteristics of the other case types as wellas the median value of the distributions of each case typefor TC longevity, intensity, structure, and environmental
parameters (see Figs. S1-S5 and Table S1, supplement).Highlights of this analysis are discussed in the nextparagraph; for more details, readers are referred tosection S6 of the supplement.
Generally, the TCs in the “no aircraft data” casetype tracked through the central and eastern Atlanticwell beyond the range of aircraft. A smaller subsetof TCs in this group formed very close to land andthen quickly made landfall (e.g. the southern Bay ofCampeche), while yet another subset include a numberof TCs that tracked through the central Atlantic andhigher latitudes. The recurving tracks of the east AtlanticTCs, along with the fact that satellite eyes were observedin many of them, point to the idea that many ofthese cases were Cape Verde hurricanes that simplyrecurved well before threatening land. In contrast, the“no observed eye” cases were constrained to be withinthe domain of aircraft reconnaissance by definition.Many of these TCs originated in the Gulf of Mexicoand had both short tracks and short lifetimes (a medianlongevity of just 54 h). Another cluster of eyelessTCs formed in the eastern portion of the basin, butthen dissipated near the Caribbean, probably due toadverse environmental vertical wind shear [the medianwind shear for this case type is18 kt (9:4 m s�1), thehighest of all the case types]. Not surprisingly, thiscase type has the lowest median intensity and are foundpredominantly at higher latitudes and greater longitudesthan any of the other case types. The “insufficientdata” case type contained too few cases to make anygeneralizations. The tracks of the “eye already present”cases are strongly indicative of Cape Verde hurricanesthat underwent genesis and formed eyes well east of thedomain of aircraft reconnaissance. The median intensityof these cases is much higher [79 kt (40:6 m s�1)], andthe pressure much lower pressure (971:5 mb), than anyof the other case types. These TCs also lasted muchlonger (261 h) than even the sustained formation cases(210 h). In summary, while the geographic constraintsof aircraft reconnaissance limit the numbers of CapeVerde hurricanes, higher latitude TCs in the centralAtlantic, and short-fuse tropical storms in and near theGulf of Mexico, the remaining sample includes amplenumbers of similar systems, so we find no compellingevidence to suggest that this aircraft-only sample is notrepresentative of the broader set of TCs that form eyesin the Atlantic basin. The impact of case selection usingonly aircraft data probably biases our sample towardsTCs that formed eyes over somewhat higher SSTs. Oursample may also be slightly biased towards shorter-lived TCs, owing to the greater preponderance of landmasses in the western half of the basin. Nevertheless, thenext section shows that the remaining eye-forming casesshare many characteristics in common with the broaderset of TCs.

2012 VIGH ET AL 9
6. Results
This section presents a comprehensive climatologyof hurricane eye formation. Of the 310 Atlantic TCsthat occurred from 1989 to 2008, 183 have sufficientdata (at least two center fixes) to be included in theVDM data set. Of these, 70 TCs formed eyes and weresufficiently observed by aircraft data to be selected ascases. The IR archive covers a shorter period from 1995to 2008 and contains 193 TCs with sufficient satellitecoverage. From these data, we compute the frequency ofeye formation and then determine the geographic originof TCs and their distribution in the season. Next weexamine the basic statistics at the time when aircraftfirst reported an eye. The environmental conditionsunder which eyes form are summarized. Eye formationcases are then analyzed throughout the TC life cycle todetermine where and when eye formations occur. Withthese results in hand, we seek to address some remainingquestions such as the timescale for eye formation.
a. Frequency of eye formation
How frequently do eyes form? Table4 showsthe number of TCs and the associated frequencies ofoccurrence for each stage of eye development. Allfrequencies are computed using the above sample sizes(i.e., 183 for aircraft and 193 for IR satellite imagery).Since we seek to estimate the true frequency of eyeformations in the full population of Atlantic TCs, allaircraft data are included whether or not the TC wasregarded as being under aircraft observation at thetime of eye formation (i.e., insufficient data cases areincluded in these frequency computations).
Banding is often noted by aircraft prior toobservation of the actual aircraft eye. In fact, aircraft-observed banding occurred at some point in the lifetimesof 78 of the 183 aircraft-observed TCs (43% of all TCs).Of the 78 TCs that displayed banding, 16 never formedeyes (21% of TCs with banding). Of the remaining 62TCs that did form eyes, the first observation of bandingsometimes occurredafter the eye had already formedand/or dissipated. In just over half the banded TCs (40TC, 51%), the first report of banding preceded the firstreport of an aircraft eye, so banding can indicate thatan eye is in the process of forming. However, sincebanding is not always reported before the eye forms, itsusefulness to forecasters may be somewhat limited.
An aircraft eye (A, open, closed, or poorly defined)was reported in 107 (58.4%) of the 183 systems.Because of the potential undersampling of the VDMdata, this percentage may slightly underestimate the truefrequency. The more consistent temporal sampling ofthe geostationary satellite platform yields a differentfrequency forsatellite eye observation that applies tothe broader population of Atlantic TCs. An IR satellite
TABLE 4. Frequency of eye formation by developmentstage for Atlantic TCs. First group: aircraft-observedTCs displaying banding. Middle group: aircraft-observed TCs for which an eye was reported.Last group: stages of eye development obtainedfrom subjective classification of IR satellite images.Frequencies for aircraft observables are computed usinga base of 183 TCs that had at least 2 fixes. Frequenciesfor satellite observables are computed using a base of193 TCs that had sufficient IR satellite coverage.
Frequency of Eye Formation
# ofCode Observational baseline TCs
Aircraft observations of bandingB1 Banding, no aircraft eye 16 8:7%B2 Banding, aircraft eye observed 62 33:8%
at any pointB3 Banding observedprior to 40 21:9%
aircraft eyeB Any banding (B1[ B2) 78 42:6%
Aircraft observations of eyesPD Poorly-defined aircraft eye 3 1:6%A1 Open aircraft eye 104 56:8%A2 Closed aircraft eye 84 45:9%A Any aircraft eye (PD[ A1 [ A2) 107 58:5%
IR satellite observations of eyesIR1 Open warm spot 176 91:2%IR2 Closed warm spot 147 76:2%IR3 Eye 118 61:1%IR4 Persistent eye 82 42:5%IR5 Strong eye 41 21:2%
eye (IR3) was observed in 118 (61.1%) of all systemswith sufficient satellite coverage. Just 82 (42.5%)of IR-observed systems satisfied the more stringentrequirements for a persistent eye (IR4) however. Giventhe uncertainties in the IR3 classification, it is possiblethat the IR3 proportion somewhat overestimates the truefrequency of eye formation.
During the study period, 126 TCs were observedby both aircraft and IR satellite imagery; this allowsfor a homogeneous comparison of observations fromthe two platforms. Of these dually-observed TCs, anaircraft eye was reported in 73 TCs (57.9%), while asatellite eye (IR3) was reported in 86 TCs (68.3%).An eye was observed by both aircraft and IR satelliteimagery in 69 TCs (54.8%). Accounting for thepotential overestimation of the IR3 classfication and theundersampling of aircraft observations, we estimate thatthe true frequency of eye formation for all TCs in the

10 MONTHLY WEATHER REVIEW VOLUME 140
basin is about 60%. For comparison, 101 (52.3%) of thesatellite-observed TCs became hurricanes.
The results for the remainder of this study excludeTCs that never possessed an aircraft-observed eye (the73 “no observed eye” cases) and TCs for which aircraftdata were insufficient to determine the time of eyeformation (the 37 “insufficient data” cases). This leaves70 data-rich eye-forming TCs out of the 183 aircraft-observed TCs that were available.
b. Geographic origin and seasonal distribution
Where do the eye-forming TCs come from? Fig.2shows the origin of each eye-forming TC, taken tobe the first best track point. Cases are stratified bythe duration and persistence of the eye formationevents. Most TCs that later become major hurricanes[maximum sustained surface winds of at least100 kt(51 m s�1)] form in association with African EasterlyWaves (AEWs). Most of these TCs develop in anarea of the deep tropical Atlantic known as the MainDevelopment Region (MDR,Goldenberg et al. 2001).Of the rapid dissipation cases (Fig.2a), only 35%have their origin in the MDR. Many rapid dissipationcases originated at higher latitudes or in the Gulf ofMexico which is typical of TCs forming in the earlyor late season. In contrast, 67% of the intermittentformation cases (Fig.2b) originated within the MDR.These intermittent formation TCs likely originated fromAEWs but then encountered detrimental environmentalconditions. Meanwhile, 50% of the delayed formationcases (Fig.2c) came from the MDR, but fully 82% ofthe sustained formation cases (Fig.2d) originated in theMDR.
Taken together, these data suggest that TC originhas a significant influence on whether or not thesystem can form a lasting eye. We speculate that thegeographic origin of a TC is closely related to theenvironment it subsequently experiences. If true, thenTCs that form from AEWs in the deep tropics tendto encounter favorable environments, while TCs thatform from subtropical influences tend to have marginalenvironments. More can be learned by considering wheneye formations occur during the season.
Fig. 3 shows the monthly distribution of TCs thatformed eyes compared with the monthly distribution ofTCs that reached minimal hurricane intensity. In thissample, eye formations are relatively frequent duringthe months of July, August, September, and October;eyes formed much less frequently during the month ofNovember, and no aircraft eyes were observed duringthe months from December to June. This is not to saythat eyes cannot form during those months, but merelythat eye formations are relatively infrequent. When theydo happen, they tend not to be observed by aircraft.
Curiously, the monthly distribution of eye forma-tions differs markedly from the distribution of hurri-canes during the months of July and September. InJuly, more TCs form eyes than become hurricanes,while in September, considerably more TCs becomehurricanes than form eyes. July’s eye formation casesexperience rapid dissipation at a higher rate (31%) thanthe other months (21-25%). Our previous analysis of thegeographic origin of cases, shows that many of theseJuly cases form in and near the Gulf of Mexico andthen make landfall. Meanwhile, September’s eye-lesshurricanes might be explained by the fact that that monthfeatures the most favorable environmental conditionsfor genesis and intensification. For whatever reason, asignificant number of September TCs are disrupted tothe point that they cannot form eyes.
c. Basic statistics at time of eye formation
The data offer answers to a number of basicquestions: At what intensities and minimum centralpressures do eyes form at? How fast are TCs movingwhen they form eyes? How large are the eyes when theyform? Table5 provides a statistical summary of severalparameters at the time of the first report of an aircraft eye(for values at each individual eye formation event, seeTable S5, supplement). The number of fixes taken overa TC’s lifetime (2nd column of Table5) can be takenas a rough measure for how well TCs were sampled. Inour sample, this number ranges from 8 to 96 fixes. Themedian of 37 fixes means that most TCs were sampledmany times per day, so we have confidence that most ofour cases were well observed.
1) MINIMUM CENTRAL PRESSURE, pMIN
For comparison, we present minimum centralpressure statistics at the time of eye formation for bothBT pmin (interpolated to the time of the first aircraft eye)and the directly-observed VDMpmin. For the 70 cases inour climatology, the medians are essentially the same:991 and992 mb. We take the first and third quartiles(25% and 75% percentiles) to represent the range oftypical values. (These values contain the central 50%of values.) Thus, most eyes form at minimum centralpressures between997 mb and987 mb.
2) LATITUDE AND LONGITUDE
All TCs in the sample formed eyes between12:3 ıNand 37:3 ıN. More typically, eyes formed within anarrower range of17:3 ıN to 26:9 ıN. Eyes formedacross a wide longitudinal range delimited by thewestern edge of the basin boundary (96:7 ıW) andthe eastern cutoff of routine aircraft reconnaissance

2012 VIGH ET AL 11
FIG. 2. Geographic origin of the 70 eye-forming cases. The origin of the TC is taken to be the first best trackpoint (red dots). The modified Main Development Region (MDR,a box bounded by8 � 20 ıN and20 � 85 ıW) isindicated by the yellow box. Results are paneled for the following case types: a) rapid dissipation, b) intermittentformation, c) delayed formation, d) sustained formation.
FIG. 3. Monthly distribution of eye formations (solid)and TCs which became hurricanes (hatched) for the 70eye-forming cases in this study.
(56:5 ıW). The median longitude of eye formation is76:6 ıW.
3) TRANSLATION SPEED, c
Eyes form over a wide band of translation speeds,ranging from nearly stationary to over10 m s�1. The
median translation speed is4:4 m s�1 with a typicalrange of 2.5 to5:8 m s�1. Given that high translationspeeds cause large and asymmetric boundary layerforcing to the vortex (Shapiro 1983), we are notsurprised to find an upper limit on the translation speedsat which eyes can form. This result is consistent withKnaff et al. (2010), who found that relatively few (<10%) TCs withvmax> 77 kt (40 m s�1) travel faster than14 kt (7:2 m s�1; see their table 1).
4) MAXIMUM SUSTAINED SURFACE WIND SPEED,BT vMAX
What intensities do eyes form at? The medianinterpolated BTvmax value is 58 kt (30 m s�1), witha typical range of 50 to66 kt (26 to 34 m s�1).The minimum intensity at which an aircraft eyewas observed to form was29 kt (15 m s�1). Themaximum observed intensity at eye formation was88 kt(45 m s�1). Clearly, eyes form throughout a large rangeof intensities.In general, the aircraft eye often formsat a lower intensity than the threshold for hurricanestrength.2
5) RADIUS OF MAXIMUM WIND , rMAX
For the purposes of this study, we takermax to bethe distance from the vortex’s surface center out to
2The astute reader may now recognize that the title of this paperis somewhat misleading.

12 MONTHLY WEATHER REVIEW VOLUME 140
TABLE 5. Summary of basic statistics at the time of first aircraft eye report for the 70 Atlantic TCs which werewell-observed during their eye formation periods, 1989-2008. BT quantities have been interpolated to the time ofaircraft eye formation. Columns are as follows: number of fixes taken during the each TC’s lifetime; best trackminimum central pressure (BTpmin), minimum central pressure from extrapolation or dropsonde (VDM pmin),translation speed of the TC computed from best track positions, latitude of fix (VDM�), longitude of fix (VDM�), best track surface wind speed (BTvmax), range of maximum flight level wind (FLrmax), diameter of initial eye(VDM deye).
TC# of BT VDM transl. VDM VDM BT FL VDMfixes pmin pmin speed � � vmax rmax deye.
mb mb m s�1 ıN ıW kt n mi n miMeasures of Central Tendency:Mean 37:0 990:8 992:2 4:52 22:28 76:04 58:1 25:0 18:7
Median 33:0 991:0 992:0 4:43 21:61 76:61 58:0 18:5 18:0
Measures of Spread:Std dev 21:0 7:8 8:0 2:43 6:08 11:72 11:9 20:3 9:8
IQR 29 9 10 3:3 9:6 19:5 16 19 15
Measure of Symmetry:Yule-Kendall 0:0 �0:1 0:0 �0:19 0:10 �0:24 0:0 0:2 �0:1
Additional Measures:No. of records 70 69 70 70 70 70 70 70 69
Maximum 96 1009 1007 10:6 37:3 96:7 88 105 45
75% 48 995 997 5:8 26:9 84:1 66 30 25
25% 19 986 987 2:5 17:3 64:5 50 11 10
Minimum 8 968 969 0:1 12:3 56:5 29 2 2
the radial location of the flight levelvmax,in. Since theeyewall typically slopes outward with height, this FLrmax is typically found at a somewhat larger radius thanthe surfacermax (Jorgensen 1984a,b; Powell et al. 2009;Stern and Nolan 2011). Taking just the data from thefixes at which the aircraft eye was first observed, wefind that the medianrmax is 18:5 n mi (34 km). The meanrmax [25 n mi (46 km)] is considerably higher than themedianrmax because the distribution is skewed towardslarger radii by outliers. At the time of eye formation,rmax typically ranges from 11 to30 n mi (20 to56 km),however eyes have been observed to form both at verysmallrmax [as low as2 n mi (3:7 km)], and at very largermax [up to105 n mi (195 km)]. 3
3Note that the aircraft-basedrmax measurements often fluctuaterapidly in time. This scatter arises due to several factors: (1) TCs donot always possess a sharp peak in tangential wind, and (2) aircraftsample specific azimuths through TCs that are often asymmetric.Because of these factors, thermax statistics taken from the fix of thefirst reported eye probably overstatermax somewhat. A more robustestimate ofrmax at the time of eye formation could be obtained byinterpolating the time-trended lower bound of observedrmax valuesto the time of eye formation. While such an analysis is beyond thescope of the present paper, we plan to present a refined estimate forrmax at the time of eye formation in a follow-up paper.
6) EYE DIAMETER, dEYE
The newly formed eyes typically havediametersatflight level (deye) that are comparable to theradii ofmaximum winds. The mediandeye at formation is foundto be 18 n mi (33 km), which means that the medianeyeradiusof 9 n mi (16 km) is roughly half the medianrmax of 18:5 n mi (34 km) at the time of formation.
Compared to the typical range ofrmaxat the timeof eye formation, the typical range ofdeye is truncatedon the upper end: 75% of eyes form at diameters ofless than25 n mi (46 km). The largest diameter of anewly formed eye was just45 n mi (83 km), which isconsiderably smaller than the largestrmax of 105 n mi(195 km). These results suggest that eyes are normallysmall to moderate-sized when they form. TCs rarelyform large eyes initially and apparently, very large eyesnever form.
d. Variation of parameters for all eye developmentbaselines
To ensure that our eye development baselines aremeaningful, it is instructive to consider the degree ofvariation across the nine eye development baselines forthe medians of several parameters. Table6 presents

2012 VIGH ET AL 13
median values for several parameters for the aircraft(B, A, A1, and A2) and satellite baselines (IR1 throughIR5). For comparison, the medians over the entirelifetimes of all 70 TCs in the sample are presented inthe final column.
For the median latitudes and longitudes, the mediansof the eye development baselines lie further south andwest than the medians taken over all TC lifetimes. Thisresult likely reflects the simple fact that TCs normallydevelop as they move along typical tracks towards thewest and northwest from their genesis location.
The medians of translation speed exhibit little sys-tematic variation across all eye development baselines,except that the medians of all eye development baselinesare slower than the median taken over all TC lifetimes.
The medians of minimum central pressure (pmin)progress strongly from higher to lower pressures asTCs develop better defined eyes. This is especially truefor the satellite baselines: the median BTpmin variesfrom 1004 mb for the first open warm spot (IR1) downto 963 mb for strong eyes (IR5). For comparison, themedianpmin taken over all TC lifetimes is just996 mb.
For intensity, the medians of BTvmax show a strongprogression from lower to higher intensities as eyes formand become better defined. This increases confidencethat our eye development baselines are meaningfulindicators.
The medians of FLrmax show a strong progressionfrom larger to smaller radii as the eye develops. Mostnotably,rmax undergoes a significant contraction fromthe pre-eye development baselines to the time whenthe eye is initially observed. For example, from thetime the aircraft first observes banding (B) to the timethat it first observes an open eye (A1), the medianrmax contracts from31 n mi (57 km) down to 20 n mi(37 km). Similarly, from the time an open warm spot(IR1) is first observed on satellite imagery to thetime that the TC displays the first satellite eye (IR3),rmax contracts from44 n mi (81 km) down to 22 n mi(41 km). This contraction of the eye is consistent withthe theoretical and observational literature on eyewalldynamics from the early 1980s (Smith 1981; Shapiroand Willoughby 1982; Schubert and Hack 1982).
Once the eye forms, both the medianrmax and themedian eye diameters settle into a narrow range withjust a slow decrease even as the eye reaches greaterdefinition (A, A1, A2, and IR3 and IR4). The physicalscale of the inner core becomes smallest when the strongeye (IR5) stage is observed.
e. Environmental statistics
Under what environmental conditions do eyes form?From the multitude of SHIPS parameters, we haveselected a handful of parameters that characterize the
TC environment (see Table2 for descriptions of thesevariables and the radii they are averaged over). Bearin mind that many of these parameters are correlated.For instance, regions of high environmental verticalwind shear often occur in the presence of subsidenceassociated with the shearing upper troughs. It is notour purpose here to conduct a detailed analysis of thechanging environment, but rather to provide a basisfor understanding the basic environments in which TCsform eyes. Table7 provides a statistical summary ofthese parameters at the time the first aircraft eye wasreported (for the values at each individual eye formationevent, see Table S6, supplement).
1) MAXIMUM POTENTIAL INTENSITY, VMPI
VMPI represents the thermodynamic favorablenessof the TC environment, with higher potential intensitiescorresponding to a more favorable environment. For the70 eye formation cases, VMPI is normally distributedabout the median of133:5 kt (69 m s�1). Half of TCsformed eyes at values between 125 and145 kt (64 and74 m s�1). The lowest VMPI at eye formation was70 kt(36 m s�1), which suggests that eyes do not form inTCs when the thermodynamics cannot support at leasta hurricane-strength system.
2) REYNOLDS SEA SURFACE TEMPERATURE, RSST
Eyes tend to form over high SSTs, with a medianvalue of 29:0 ıC. Only 25% of TCs formed eyes atvalues lower than28:5 ıC. To a large degree, this reflectsthe fact that many TCs form their eyes at relatively lowlatitudes in the MDR or in the warm Gulf of Mexico —places where the SST is high. The minimum observedSST of24 ıC shows that high SSTs are not essential toeye formation, although low SSTs probably make it lesslikely.
3) 1000 MB �E , E000
The�E near the surface (E000) provides an estimateof the energy content of the air that surrounds theTC. Generally, high values of E000 are associated withwarm, moisture-rich air — such an environment isconducive to intensification and development of the TC.In contrast, low values of E000 often occur when adeep layer of cool or dry air surrounds the TC. Suchan air mass can lead to downdrafts and cold pools thatdisrupt the convective organization of a TC. A TC mayingest low �E air if it entrains warm, dry air off thecontinent, or if it encounters dry, cool air in associationwith a cold front. TCs in the far eastern Atlantic can alsoingest low E000 air when they pass near areas of marinestratocumulus clouds.
14 MONTHLY WEATHER REVIEW VOLUME 140
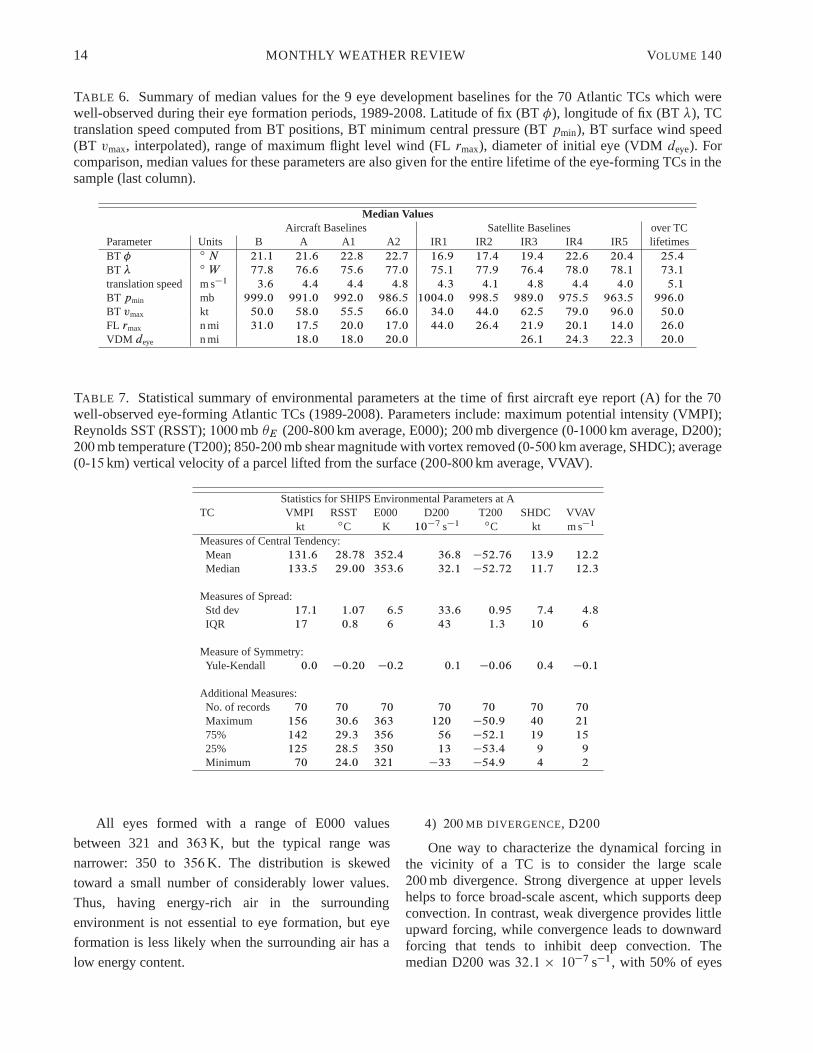
TABLE 6. Summary of median values for the 9 eye development baselines for the 70 Atlantic TCs which werewell-observed during their eye formation periods, 1989-2008. Latitude of fix (BT�), longitude of fix (BT�), TCtranslation speed computed from BT positions, BT minimum central pressure (BTpmin), BT surface wind speed(BT vmax, interpolated), range of maximum flight level wind (FLrmax), diameter of initial eye (VDMdeye). Forcomparison, median values for these parameters are also given for the entire lifetime of the eye-forming TCs in thesample (last column).
Median ValuesAircraft Baselines Satellite Baselines over TC
Parameter Units B A A1 A2 IR1 IR2 IR3 IR4 IR5 lifetimesBT � ı N 21:1 21:6 22:8 22:7 16:9 17:4 19:4 22:6 20:4 25:4
BT � ı W 77:8 76:6 75:6 77:0 75:1 77:9 76:4 78:0 78:1 73:1
translation speed m s�1 3:6 4:4 4:4 4:8 4:3 4:1 4:8 4:4 4:0 5:1
BT pmin mb 999:0 991:0 992:0 986:5 1004:0 998:5 989:0 975:5 963:5 996:0
BT vmax kt 50:0 58:0 55:5 66:0 34:0 44:0 62:5 79:0 96:0 50:0
FL rmax n mi 31:0 17:5 20:0 17:0 44:0 26:4 21:9 20:1 14:0 26:0
VDM deye n mi 18:0 18:0 20:0 26:1 24:3 22:3 20:0
TABLE 7. Statistical summary of environmental parameters at the time of first aircraft eye report (A) for the 70well-observed eye-forming Atlantic TCs (1989-2008). Parameters include: maximum potential intensity (VMPI);Reynolds SST (RSST);1000 mb �E (200-800 km average, E000);200 mb divergence (0-1000 km average, D200);200 mb temperature (T200); 850-200 mb shear magnitude with vortex removed (0-500 km average, SHDC); average(0-15 km) vertical velocity of a parcel lifted from the surface (200-800 km average, VVAV).
Statistics for SHIPS Environmental Parameters at ATC VMPI RSST E000 D200 T200 SHDC VVAV
kt ıC K 10�7 s�1 ıC kt m s�1
Measures of Central Tendency:Mean 131:6 28:78 352:4 36:8 �52:76 13:9 12:2
Median 133:5 29:00 353:6 32:1 �52:72 11:7 12:3
Measures of Spread:Std dev 17:1 1:07 6:5 33:6 0:95 7:4 4:8
IQR 17 0:8 6 43 1:3 10 6
Measure of Symmetry:Yule-Kendall 0:0 �0:20 �0:2 0:1 �0:06 0:4 �0:1
Additional Measures:No. of records 70 70 70 70 70 70 70
Maximum 156 30:6 363 120 �50:9 40 21
75% 142 29:3 356 56 �52:1 19 15
25% 125 28:5 350 13 �53:4 9 9
Minimum 70 24:0 321 �33 �54:9 4 2
All eyes formed with a range of E000 values
between 321 and363 K, but the typical range was
narrower: 350 to356 K. The distribution is skewed
toward a small number of considerably lower values.
Thus, having energy-rich air in the surrounding
environment is not essential to eye formation, but eye
formation is less likely when the surrounding air has a
low energy content.
4) 200 MB DIVERGENCE, D200
One way to characterize the dynamical forcing inthe vicinity of a TC is to consider the large scale200 mb divergence. Strong divergence at upper levelshelps to force broad-scale ascent, which supports deepconvection. In contrast, weak divergence provides littleupward forcing, while convergence leads to downwardforcing that tends to inhibit deep convection. Themedian D200 was32:1 � 10�7 s�1, with 50% of eyes

2012 VIGH ET AL 15
forming in a range of 13 to56� 10�7 s�1. The minimumof �33 � 10�7 s�1 shows that an eye can even formwhen the large scale environment is convergent at upperlevels. Since D200 is averaged over a relatively largearea, this large scale metric may overstate the localconvergence over small storms.
5) 200 MB TEMPERATURE, T200
T200 is a near-tropopause reference temperaturethat impacts a TC’s MPI in similar ways as SST, butreversed in sign (for the same SST, a higher 200-mb temperature results in a lower potential intensity).T200 varies with season, latitude, and synoptic regime.T200 temperatures are typically highest over the deeptropics during summer and lowest at high latitudes orin the cores of cold upper lows and upper troughs.The median T200 for our sample is�52:7 ıC, with atypical range of�53:4 to �52:1 ıC. While the spread(given by the interquartile range) is just1:3 ıC, thisis considerably larger than the spread of RSST, whichis just 0:6 ıC. This difference illustrates the greaterupper tropospheric synoptic variability, as comparedwith the relative homogeneity of the lower tropicaltroposphere (Malkus 1958).
6) 850 � 200 MB SHEAR MAGNITUDE, SHDC
Environmental vertical wind shear can be difficultto quantify over the TC, and the SHIPS data set includesseveral different measures. We chose SHDC, which isa standard measure of the deep shear. In our sample,the median vertical shear at the time of eye formationis 11:7 kt (6:0 m s�1). The Yule-Kendall index, a robustmeasure of the symmetry of the distribution, showsthat the distribution is skewed considerably towardshigh shear values. Indeed, the mean of the distribution[13:9 kt (7:2 m s�1)] is substantially above the median.The middle 50% of TCs form eyes under vertical shearsranging from 9 to19 kt (4.6 to9:8 m s�1).
A bit of caution should be taken in interpreting theextrema of the SHDC distribution. The minimum of4 kt(2 m s�1) should not be taken to mean that eyes cannotform in a zero-shear environment. Rather, this likelyreflects the impact of the large averaging radius. Area-mean shear values lower than this value rarely exist inthe presence of a TC over a radius of this size. Likewise,the maximum value should not be taken to mean thateyes can generally form at vertical shears up to40 kt(21 m s�1) — in such cases, areas of high shear wereundoubtedly occurring within500 km of the TC centerbut it is possible that the high shear did not directlyimpinge on the TC’s inner core. This latter situation canoccur when the TC is smaller than the averaging radius.
7) VERTICAL VELOCITY OF A PARCEL LIFTED FROM
THE SURFACE, VVAV
The last environmental parameter measures theconvective instability of a parcel lifted from the surface.High VVAV values indicate that a lifted parcel isconditionally unstable and could lead to vigorousconvective updrafts. Low VVAV values indicate lowinstability and the potential for just weak updrafts.The eyes in this sample form at a median VVAV of12:3 m s�1, with a typical range of 9 to15 m s�1. Whileeven the maximum value of21 m s�1 may seem lowcompared with midlatitude convection (which can havecalculated updrafts exceeding80 m s�1), these valuessuggest that eyes form when the environment containsair parcels that have a moderate degree of convectiveinstability. The minimum value of2 m s�1 shows thatinstability is not essential, however.
To sum up, Atlantic TCs form eyes in environmentsthat are thermodynamically supportive of moderate tohigh potential intensity [VMPI� 125 kt ( m s�1)]. Suchenvironments typically include high SSTs (RSST�28:5 ıC, energy-rich air in the surroundings that isnot too dry or cool (E000� 350 K), and relativelycolder temperatures at200 mb (T200 � �52:1 ıC).Eye formation is also favored in environments that aredivergent in the upper levels (D200� 13 � 10�7 s�1),environments that are convectively unstable (VVAV�9 m s�1), and environments that are not strongly sheared[SHDC� 19 kt (9:8 m s�1)].
f. Spatial distribution
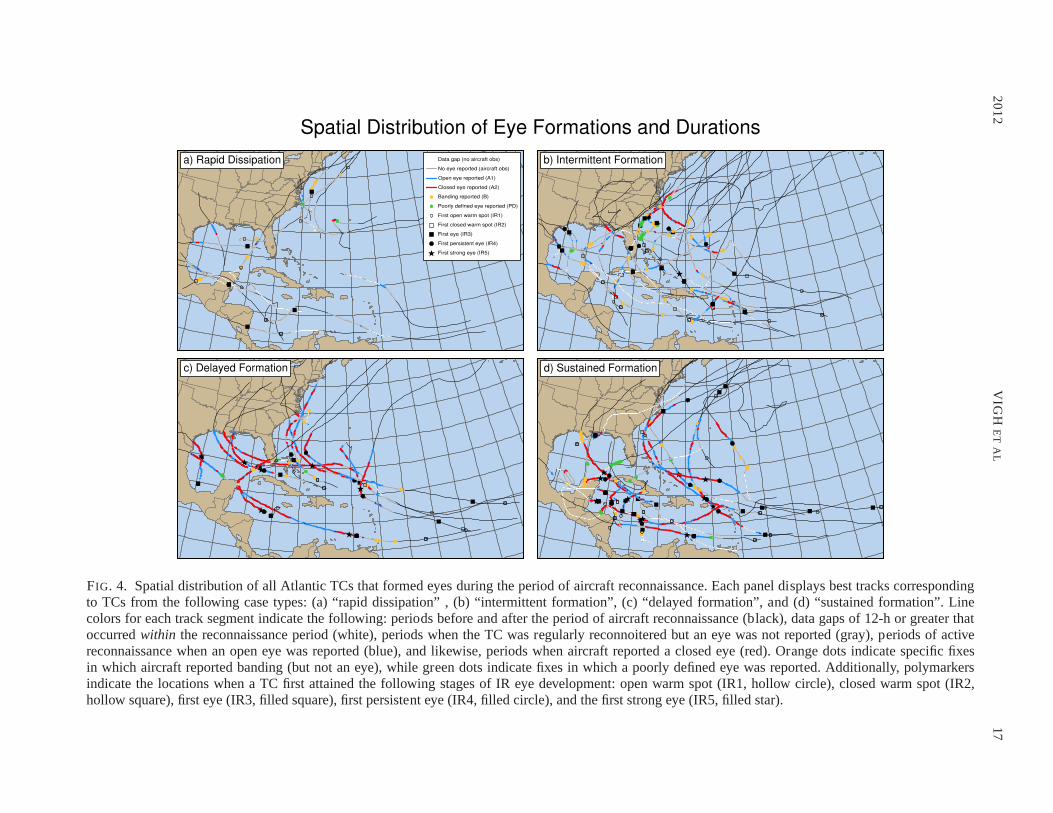
Fig. 4 presents the spatial distribution of eye for-mations stratified by the case types: rapid dissipation,intermittent formation, delayed formation, and sustainedformation. Each panel displays the best tracks corre-sponding to TCs of a particular case type. For reference,Fig.5 provides the storm names for the TCs in each casetype.
Fig. 4a shows the tracks of the 17 rapid dissipationcases. Rapid eye dissipation occurs more frequently inearly and late season TCs. One cluster of irregular,meandering tracks off the U. S. East Coast suggestsTCs of subtropical origin. From a review of the satelliteimagery, these TCs often have well-defined surfacecirculations, but struggle to close off enough deepconvection to meet the definition for an eyewall. Sixof the other rapid dissipation cases formed eyes in theGulf of Mexico, but at least 3 of these TCs had their eyedevelopments arrested by landfall.
Fig. 4b displays the 24 intermittent formationcases. Four of these TCs formed eyes and were likelydeveloping but then hit the Gulf Coast. Another subsetof TCs formed short-lived eyes near the LeewardIslands. The mid oceanic Tropical Tropospheric Upper
16 MONTHLY WEATHER REVIEW VOLUME 140
Trough (TUTT) has a mean summer position in thisarea (Sadler 1976; Fitzpatrick et al. 1995), so the eyeformations of these TCs may have been disrupted byadverse environmental vertical wind shear, subsidence,and higher sea level pressures (Knaff 1997).
Fig. 4c shows the 12 delayed formation cases.The broad, sweeping tracks of these TCs suggesta favorable upper level environment (an absence ofshearing troughs or cold lows) and/or the presenceof a mid-tropospheric ridge. When such a ridge liesto the north of the TC, it provides a consistentsteering environment. Nevertheless, temporarily hostileconditions or disruptive internal dynamics can still leadto setbacks.
Fig. 4d shows the tracks of the 17 TCs withsustained formation. As in the delayed formation cases,many of these TCs have straight-running or broadly-curving tracks, which suggests favorable environments.A significant cluster of TCs originate in the westernCaribbean, however, and have low latitude recurvingtracks. These tracks are from late season TCs (e.g.,Mitch 1998, Michelle 2001, and Paloma 2008) thatrapidly developed and then recurved into the westerlies.
Interestingly, both the delayed formation andsustained formation cases have a distinct absence of theirregular tracks typical of TCs forming in the subtropics.During the subjective analysis of the IR archive, wenoticed that several subtropical systems did form eyesin the Eastern Atlantic, but since these TCs were notreconnoitered by aircraft they do not appear in thepresent climatology.
Landfall does not always prevent eye formation.Fig. 4b shows the track of Fay (2008), which hitsouthwest Florida just after forming an open aircrafteye. While over south Florida, a distinct satelliteeye appeared and persisted until after the TC movedback over water. Several other systems also seem tohave formed their first satellite eyes (IR3) while overland (see filled squares over the Yucatan Peninsula,Nicaragua, and the Mississippi River Delta).
g. Temporal distribution
We now turn our attention to the temporaldistribution of eye development during the TC life cycle.To compare the eye formations of this diverse set ofTCs, it helps to choose a common reference time point.Taking this point to be the time when each TC firstreaches tropical storm intensity [BTvmax > 34 kt(17:5 m s�1)], this reference time has been subtractedfrom the time of each eye development baseline for eachof the 70 eye-forming storms. This allows a timeline tobe constructed for each TC, showing the relative timingof the eye development stages in days since the TC
reached tropical storm status. The resulting montage oftimelines is shown in Fig.5, grouped by case type.
Starting with the 17 rapid dissipation cases, it isimmediately evident that many of these TCs were onlyobserved by aircraft for a few days and that all of theireye formations were brief (this must be the case, by thedefinition of this case type). While many of these TCsdid form satellite eyes (IR3), none of them reached thepersistent eye (IR4) or strong eye (IR5) stages. Whilethis case type does not include reformation cases, thescattered presence of banding (orange dots) indicatesthat some TCs possessed incomplete eye structure forlonger periods of time.
The 24 TCs that experienced intermittent eyeformation generally lasted longer than those in whichthe eye rapidly dissipated, but the vast majority ofthese TCs did not become intense. Some intermittentformation TCs eventually did form eyes that lastedlonger than the24 h criterion, albeit outside of the 3-d time window from the initial aircraft eye report. Inmost of the intermittent formation TCs, aircraft firstreported an open eye (A1) — this suggests that the initialeyes of these TCs were marginally defined. Even thoughthe initial eye formations were intermittent in thesecases, persistent satellite eyes (IR4) were eventuallynoted in 7 of the 17 TCs (41.2%) that had satellitecoverage, while one TC even developed a strong eye(IR5, 5.9%). Taken together, these timelines suggestslowly developing systems that had difficulty forming aneye. Some TCs eventually form sustained eyes long afterthe 3-day window. As an example, Ophelia (2005) tooknearly 8 days from the first hint of an eye (open warmspot, IR1) to IR4. However, few TCs with intermittenteye formation ever become major hurricanes.
The 12 delayed formation cases were longer lived,became more intense, and in some cases, showedsigns of eye development a day or two before aircraftobservations began. Nevertheless, all of these TCs hadtheir eye developments interrupted by some inhibitingfactor. Once this inhibition was removed, the TCsdeveloped consistently and in some cases rapidly.Indeed, some of these TCs took longer to form eyes afterreaching tropical storm intensity (even 3 or 4 days insome cases). This bolsters the view that the environmentor some other factor was initially unfavorable fordevelopment. Of the 9 delayed formation cases withsufficient satellite coverage, all formed IR4 eyes and 7(77.8%) formed IR5 eyes. Nine of the 12 (75%) delayedformation cases become major hurricanes.
In contrast to the delayed formation cases, the 17sustained formation cases often formed eyes withina day of attaining tropical storm strength and 15 ofthem (88%) became major hurricanes. In many of thesecases, the first reported aircraft eye was closed (A2),so not only did these TCs form eyes quickly, but their
20
12
VIG
HE
TA
L17
FIG. 4. Spatial distribution of all Atlantic TCs that formed eyesduring the period of aircraft reconnaissance. Each panel displays best tracks correspondingto TCs from the following case types: (a) “rapid dissipation”, (b) “intermittent formation”, (c) “delayed formation”, and (d) “sustained formation”. Linecolors for each track segment indicate the following: periods before and after the period of aircraft reconnaissance (black), data gaps of 12-h or greater thatoccurredwithin the reconnaissance period (white), periods when the TC was regularly reconnoitered but an eye was not reported (gray), periods of activereconnaissance when an open eye was reported (blue), and likewise, periods when aircraft reported a closed eye (red). Orange dots indicate specific fixesin which aircraft reported banding (but not an eye), while green dots indicate fixes in which a poorly defined eye was reported. Additionally, polymarkersindicate the locations when a TC first attained the followingstages of IR eye development: open warm spot (IR1, hollow circle), closed warm spot (IR2,hollow square), first eye (IR3, filled square), first persistent eye (IR4, filled circle), and the first strong eye (IR5, filled star).

18M
ON
TH
LYW
EA
TH
ER
RE
VIE
WV
OL
UM
E1
40
FIG. 5. Temporal distribution of all Atlantic TCs that formed eyes during the period of aircraft reconnaissance. Conventionsare the same as in Fig.4.

2012 VIGH ET AL 19
eyes were better defined when they appeared. Some ofthese TCs rapidly intensified, progressing all the wayto an IR5 eye within a day of first forming an eye.Of these cases, 14 (82.3%) reached the IR4 stage, and12 (70.6%) continued to the IR5 stage. All of thissuggests that these TCs developed in a very favorableenvironment. All sustained formation cases also formedfrom 1995 onward, an era of more frequent and intensehurricanes (Goldenberg et al. 2001).
Surprisingly, more than half the sustained formationcases displayed open or closed warm spots (IR1 andIR2) and even actual eyes (IR3)beforethe TCs reachedtropical-storm intensity. In our view, these “extra-earlyformers” may represent a special class of eye formationdistinct from normal development. Perhaps the bestexample of an extra-early former is Erin (2001), whichformed an IR3 eye in the far east Atlantic just as itwas designated as a tropical depression. A distinct warmspot surrounded by a ring of curved deep convectionappeared and persisted for several hours before beingobscured by deep convection. Erin continued to displaysome signs of eye structure for several more hours butthen came under hostile vertical wind shear. Almost aweek later, the TC reached the IR4 stage and developedinto a major hurricane.
h. Timing between aircraft and satellite eye detection
Which comes first — the aircraft eye or the satelliteeye? A careful inspection of Fig.5 reveals informationabout the relative timing of the first aircraft eye (A)vs. the first satellite eye (IR3). Since eye structureoften forms beneath an obscuring central dense overcast,we might generally expect that aircraft would detectthe eyebefore it appears in the upper cloud field. Toshow whether the data support this expectation, it isnecessary to remove from consideration any cases forwhich satellite data were unavailable, as well as casesthat were not yet under aircraft surveillance by the timea satellite eye was noted. Of the 43 remaining cases, theaircraft eye was observed first in 36 TCs (83%), whilethe satellite eye was observed first in just 7 TCs (17%).Hence, in an overwhelming majority of cases, the eyewas observed first by aircraft.
i. Time needed to achieve each stage of eye development
By using the time when a TC first reaches tropicalstorm status as a reference point, the length of timeneeded to achieve each eye development baseline iscomputed. Fig.6 displays a histogram summarizing thestatistics of these relative timings. Using the medianvalue to represent the center of the distribution, thefollowing median timings are obtained (each numberin parentheses indicates the median time, in hours, thatthe TC took to reach the designated eye development
baseline since becoming a tropical storm): A1 (35:6 h),IR3 (36:7 h), A2 (45:6 h), IR4 (61:2 h), and IR5 (68:3 h).Fifty percent of TCs form their first aircraft eye within18:8 h to 60:0 h of becoming a tropical storm. In fact,34% of the 70 TCs in this climatology formed an eyewithin the first 24 h of reaching tropical storm status;67% formed eyes by48 h, and 89% formed eyes by72 h. Taken together, these data suggest that there is anopportune time window of approximately a day or twoduring which a young tropical storm can readily forman eye. Very few TCs were observed to form eyes morethan 5 d after becoming a tropical storm. Apparently,after three or more days of eyeless-ness a TC is muchless likely to form an eye.
FIG. 6. Box-and-whisker plot showing the temporalranges of time needed for TCs to achieve each eyedevelopment baseline. Times are given in days since theTC first reached tropical storm intensity [BTvmax >34 kt (17:5 m s�1)]. The center-line of each box givesthe median value, while the upper and lower boxedges correspond to the upper and lower hinges of thedistribution (hinges are nearly the same as the quartilesof the distribution). The endpoints of the whiskerscorrespond to the extreme values of the distribution. Plotrange is truncated to focus on the most common values,but extrema range between -5.8 days and 18.3 days.
j. Characteristic timescale for eye development
What is the characteristic timescale for eyedevelopment? To answer this, it is instructive tocompare the relative timing between the first aircraft

20 MONTHLY WEATHER REVIEW VOLUME 140
eye observation and the appearance of the other eyedevelopment baselines. We obtain this by subtracting thetime when the aircraft eye was first observed (A) fromthe time of the other eye development baselines. Thedistributions of these relative timing data are presentedas a histogram in Fig.7. If these median timings canbe taken to represent a “median TC”, the IR3 eyeappears3:6 h after A, while IR4 and IR5 are reached25:1 h and 30:3 h after A. Banding (B) is typicallyreported11:6 h before A. Accounting for the latencydifference between aircraft (approximately4 h) andsatellite imagery (30 min), the3:6 h difference betweenA and IR3 suggests a 7-h lag between the observation ofan aircraft eye and the appearance of eye-like structure(IR3) in the upper cloud field. Taken together, if thefull development of the eye is considered to include thestages from banding through IR4, then the characteristictimescale for eye development is about36 h.
FIG. 7. As in Fig. 6, but for the relative timingdifferences between each of the eye developmentbaselines and the first aircraft eye (A). Plot range hasbeen truncated.
Further information can be obtained by computingthe empirical cumulative frequency distribution of theelapsed time to eye formation (Fig.8). Only 12% of TCsform eyes18 h after becoming a tropical storm, but by48 h, fully 65% of TCs have formed eyes. Thus, morethan 50% of TCs form eyes between 18 and48 h ofbecoming a tropical storm. The cumulative frequenciescontinue to rise steadily until about72 h when the rate ofincrease slows markedly. This steep initial rise, coupledwith the slow tail-off, give the distribution a distinctconcave-downward shape. This indicates that the data
are skewed towards long elapsed times. That is, a smallnumber of TCs take considerably longer to form eyesthan the vast majority of cases.
FIG. 8. Cumulative frequency distribution of theelapsed time to eye formation. Time is measured relativeto the first point that a system becomes a tropical stormaccording to the best track. The time of eye formation istaken to be the first report of an aircraft eye (A).
We interpret these data to suggest that the initialeye formation depends largely on the TC being ina favorable environment mostly devoid of negativeinfluences. Since many TCs undergo genesis in afavorable environment, they form eyes as soon as theycan so long as conditions remain favorable. A fewTCs take much longer to form their eyes, presumablybecause these TCs encounter hostile environmentsbefore their eyes are able to form. So long as theenvironment remains unfavorable, eye formation may bedelayed (or precluded).
7. Summary and Concluding Discussion
The purpose of this study has been to provide acomprehensive climatology of hurricane eye formation.To accomplish this, we synthesized a new structure andintensity data set from over 4600 VDMs, the BT andEBT data sets, and the SHIPS development data set.Together with the IR archive, we analyzed these datato determine the times at which each eye developmentbaseline was observed. Of the 183 TCs that werereconnoitered in the North Atlantic basin between 1989and 2008, 70 TCs formed eyes and possessed sufficientdata to be included as cases. The major findings of theclimatology are now summarized.

2012 VIGH ET AL 21
i. Banding is a precursor to eye formation:Aircraft reports of banding are fairly common,occurring in 43% of all Atlantic TCs. Of the 62TCs that displayed banding prior to the formationof any eye, 51% later developed an aircraft eye.
ii. About 60% of TCs develop an eye during theirlifetime: An aircraft eye was reported in 59%of reconnoittorred TCs, while 61% of satellite-observed TCs displayed a satellite eye (IR3)eye. As one might expect, closed aircraft eyes(47%) were less frequently observed than openaircraft eyes (58%). Only 43% of TCs developeda persistent eye (IR4), and just 21% achieved astrong eye (IR5). Of the TCs that were observedby both aircraft and satellite, eye structure wasobserved more frequently by satellite (IR3, 67%)than by aircraft (A, 58%). Taking countervailingsampling and detection factors into account, weestimate the true frequency of eye formation to beabout 60% for all TCs across the basin. This issomewhat higher than the total proportion of TCsthat become hurricanes (52%).
iii. Eyes are more likely to be seen first by aircraftthan satellite. It has been generally thought thatthe convective ring of the developing eyewallshould be apparent to aircraft before the eye isobserved by satellite. This was indeed the case:for the TCs observed by both aircraft and satellite,the aircraft eye was reported before the satelliteeye (IR3) in most cases (83%). This suggests thateye structure may develop first at lower levels(where it is more likely to be reported as anaircraft eye). Only later does the eye structureusually become observable in the cloud field (asseen from above). A few TCs (17%) develop eyestructure in the cloud field before it is observedby aircraft. In such cases, it seems that theeye structure developed concurrently through thedepth of the TC.
iv. Aircraft eyes form at intensities that areconsiderably lower than hurricane intensity.Aircraft reported the first eyes at a wide rangeof intensities, but the median BTvmax is58 kt (30 m s�1). This key finding may seemto contravene the conventional wisdom that theappearance of an eye marks the cyclone’s crossingof the hurricane intensity threshold, however thisresult is still broadly consistent with the DvorakTechnique under the interpretation that theformation of a lower tropospheric convective ringlikely occurs well before the upper troposphericsubsidence is strong enough to clear out the eye.
We will give a more detailed discussion of thisissue in a follow-up study on the intensity rangesand changes that occur during the eye formationprocess.
v. Eyes tend to form in environments that areconducive to further intensification of theTC. Eye formation is favored when potentialintensities are large, a situation that occurs withhigh SSTs and correspondingly low upper leveltemperatures. Eye formation is also favored whenthe environmental vertical wind shear is low tomoderate, when the surrounding surface air is nottoo cool or dry, when the large scale environmentfavors moderate to strong divergence aloft, andwhen air parcels are convectively unstable.
vi. TCs that form aircraft eyes tend to doso quickly after reaching tropical stormthreshold. The temporal distribution of observedeye development baselines shows that most(67%) TCs that form eyes tend to do sowithin 48 h of reaching tropical storm strength.This is consistent with the Dvorak model ofdevelopment, in which the typical TC strengthensfrom a T-number of 2.5 to 4.5 over two days[with a corresponding intensity increase from35 kt to 77 kt (18 m s�1 to 40 m s�1)]. Our resultssuggest that there is about a 1 or2 d time windowduring which a TC that has undergone genesis canquickly form an eye. If environmental conditionsare unfavorable so that the initial eye dissipates,the TC may take several more days to reforman eye. However, rapid dissipation of the initialeye is not necessarily detrimental — while asizable subset of TCs form eyes that do not persistinitially, if the eye reforms within a day or so,many of these TCs begin to develop rapidly. Thisbehavior suggests that environmental conditionsplay a key role in the longevity and persistenceof the eye/eyewall structure. If and when adverseconditions improve, development can be rapid.
In closing, we suggest other possible uses of theVDM data set. Besides eye formation, these data couldbe used to study structural changes at other stages ofthe TC life cycle, such as eyewall replacement cycles orpeak intensity. These data could even be used to delveinto the somewhat rare occurrence in which the TC takeson awarm ringstructure, as opposed to the more typicalwarm corestructure (Schubert et al. 2007). For such aproblem, the VDM data can serve as a road map byidentifying warm ring cases; this would facilitate a moredetailed investigation of the full flight level data.
Many real-time applications can be envisaged ifthe aircraft-based structure and intensity parameters are

22 MONTHLY WEATHER REVIEW VOLUME 140
made available in real-time. Such data could supportthe development of statistical-dynamical forecast aidsfor structure and size.Kossin and Sitkowski(2009)developed an empirical method to predict secondaryeyewall formation using environmental and satelliteparameters. While they noted that their predictionmethod could be refined using high temporal frequencyaircraft reconnaissance observations, they did notattempt to do so because these data were not availablein a convenient format. To fill this gap, we areworking to release a development version of the VDM-based structure and intensity data set as well as anupdating real-time component. We believe that theincorporation of these structure data will yield moreaccurate predictions of both intensity and structure.
Acknowledgments.
We owe an enormous debt to the brave flightcrews of the 53rd Weather Reconnaissance Squadronand NOAA’s Aircraft Operation Center who putthemselves at risk each time they collect these vitaldata. Without their dedication and diligence, this studywould not have been possible. We thank Steve Feuer,Barry Damiano, John Pavone, Chris Sisko, ChristopherJuckins, Mark Zimmer, Christopher Landsea, and NealDorst for their assistance in obtaining the many VDMmessages. They, along with Eric Blake, JonathanTalbot, Jack Parrish, and Nicholas Carrasco, graciouslyanswered our many questions about the VDM contents,history, and usage. Buck Sampson and James Franklinprovided information about the ATCF b-decks. Wethank Ray Zehr and Mark DeMaria for their insightfulsuggestions, and Mary Haley and David Brown for theirprogramming advice. Chris Davis, George Bryan, ChrisRozoff, and an anonymous reviewer provided helpfulcomments that lead to improvements in the manuscript.This research was supported by NASA/TCSP GrantNNG06GA54G and by NSF Grants ATM-0332197 andATM-0837932.
REFERENCES
Anthes, R. A., 1982: Tropical Cyclones: Their Evolution,Structure, and Effects. No. 41 in Meteor. Monogr., Amer.Meteor. Soc., 208 pp.1
Ballou, S. M., 1892: The eye of the storm.AmericanMeteorological Journal, 9 (2), 67–84, 121–127.1
Bister, M. and K. A. Emanuel, 1998: Dissipative heating andhurricane intensity.Meteorol. Atmos. Phys., 65, 233–240.5
DeMaria, M. and J. Kaplan, 1994: A statistical hurricaneintensity prediction scheme SHIPS for the Atlantic basin.Wea.Forecasting, 9, 209–220.3
DeMaria, M. and J. Kaplan, 1999: An updated statistical hurricaneintensity prediction scheme (SHIPS) for the Atlantic and easternNorth Pacific basins.Wea. Forecasting, 14, 326–337.3
DeMaria, M., M. Mainelli, L. K. Shay, J. A. Knaff, and J. Kaplan,2005: Further improvements to the Statistical HurricaneIntensity Prediction Scheme (SHIPS).Wea. Forecasting, 20,531–543.3
Demuth, J. L., M. DeMaria, and J. A. Knaff, 2006: Improvement ofAdvanced Microwave Sounding Unit tropical cyclone intensityand size estimation algorithms.J. Appl. Meteor. Climatol., 45,1573–1581.3
Dvorak, V. F., 1984: Tropical cyclone intensity analysis usingsatellite data. NOAA Tech. Rep. NESDIS 11, Washington, D.C., 47 pp.1
Fitzpatrick, P. J., 1996: Understanding and forecasting tropicalcylone intensity change. Dept. of Atmos. Sci. Paper No. 598,Colorado State University, 346 pp. [Available from Dept. ofAtmospheric Science, Colorado State University, Fort Collins,80523.].3
Fitzpatrick, P. J., J. A. Knaff, C. W. Landsea, and S. V. Finley, 1995:Documentation of a systematic bias in the Aviation Model’sforecast of the Atlantic Tropical Upper Tropospheric Trough:Implications for tropical cyclone forecasting.Wea. Forecasting,10, 433–446.16
Franklin, J. L., M. L. Black, and K. Valde, 2003: GPSdropwindsone wind profiles in hurricanes and their operationalimplications.Wea. Forecasting, 18, 32–44.3
Goldenberg, S. B., C. W. Landsea, A. M. Mestas-Nunez, and W. M.Gray, 2001: The recent increase in Atlantic hurricane activity:Causes and implications.Science, 293, 474–479.10, 19
Gray, W. M. and D. J. Shea, 1973: The hurricane’s inner coreregion. II. Thermal stability and dynamic constraints.J. Atmos.Sci., 30, 1565–1576.3
Jorgensen, D. P., 1984a: Mesoscale and convective-scale charac-teristics of mature hurricanes. Part I: General observations byresearch aircraft.J. Atmos. Sci., 41, 1268–1285.12
Jorgensen, D. P., 1984b: Mesoscale and convective-scalecharacteristics of mature hurricanes. Part II: Inner core structureof Hurricane Allen (1980).J. Atmos. Sci., 41, 1287–1311.12
Kimball, S. K. and M. S. Mulekar, 2004: A 15-year climatologyof North Atlantic tropical cyclones. Part I: Size parameters.J.Climate, 17, 3555–3575.2, 3
Knaff, J. A., 1997: Implications of summertime sea level pressureanomalies in the tropical Atlantic region.J. Climate, 10, 789–804. 16
Knaff, J. A., D. P. Brown, J. Courtney, G. M. Gallina, andJ. L. Beven II, 2010: An evaluation of Dvorak technique-based tropical cyclone intensity estimates.Wea. Forecasting, 25,1362–1379, doi:10.1175/2010WAF2222375.1.11
Kossin, J. P. and M. Sitkowski, 2009: An objective model foridentifying secondary eyewall formation in hurricanes.Mon.Wea. Rev., 137, doi:10.1175/2008MWR2701.1.2, 22
Malkus, J. S., 1958: Tropical weather disturbances — why so fewbecome hurricanes.Weather, 13, 75–89.1, 15
McAdie, C. J., C. W. Landsea, C. J. Neumann, J. E.David, E. S. Blake, and G. R. Hammer, 2009: Tropicalcyclones of the North Atlantic, 1851–2006 (6th ed.).Historical Climatology Series 6-2. [Available from theNational Climatic Data Center, 151 Patton Avenue, Room

2012 VIGH ET AL 23
120, Asheville, NC 28801-5001. Also available online at:http://www.nhc.noaa.gov/abouttrackbooks.shtml]. 3
Mundell, D. B., 1990: Prediction of tropical cyclone rapidintensification. M.S. thesis, Dept. of Atmospheric Science,Colorado State University, 186 pp., Fort Collins, Colorado,80523.1, 3
Olander, T. L. and C. S. Velden, 2007: The Advanced DvorakTechnique: Continued development of an objective scheme toestimate tropical cyclone intensity using geostationary infraredsatellite imagery.Wea. Forecasting, 22, 287–298.7
Palmen, E., 1956: Formation and development of tropical cyclones.Paper No. 13, Tropical Cyclone Symposium, Brisbane, 19.1
Powell, M. D., E. W. Uhlhorn, and J. D. Kepert, 2009: Estimatingmaximum surface winds from hurricane reconnaissancemeasurements.Wea. Forecasting, 24, 868–883.12
Sadler, J. C., 1976: A role of the tropical upper tropospheric troughin early season typhoon development.Mon. Wea. Rev., 104,1266–1278.16
Sampson, C. R. and A. J. Schrader, 2000: The automated tropicalcyclone forecasting system (version 3.2).Bull. Amer. Meteor.Soc., 81, 1231–1240.3
Schubert, W. H. and J. J. Hack, 1982: Inertial stability and tropicalcyclone development.J. Atmos. Sci., 39, 1687–1697.13
Schubert, W. H., C. M. Rozoff, J. L. Vigh, B. D. McNoldy, andJ. P. Kossin, 2007: On the distribution of subsidence in thehurricane eye.Quart. J. Roy. Meteor. Soc., 133, 595–605, doi:10.1002/qj.49.21
Shapiro, L. J., 1983: The asynmmetric boundary layer flow undera translating hurricane.J. Atmos. Sci., 40, 1984–1998.11
Shapiro, L. J. and H. E. Willoughby, 1982: The response ofbalanced hurricanes to local sources of heat and momentum.J. Atmos. Sci., 39, 378–394.1, 13
Shea, D. J. and W. M. Gray, 1973: The hurricane’s inner coreregion. I. Symmetric and asymmetric structure.J. Atmos. Sci.,30, 1544–1564.3
Smith, R. K., 1981: The cyclostrophic adjustment of vortices withapplications to tropical cyclone modification.J. Atmos. Sci., 38,2021–2030.13
Stern, D. P. and D. S. Nolan, 2011: On the vertical decay of themaximum tangential winds in tropical cyclones.J. Atmos. Sci.,68, 2073–2094, doi:10.1175/2011JAS3682.1.12
Vigh, J. L., 2010: Formation of the hurricane eye. Ph.D.dissertation, Colorado State University, 538 pp., [Availableonline athttp://hdl.handle.net/10217/39054]. 3
Weatherford, C. L. and W. M. Gray, 1988a: Typhoon structure asrevealed by aircraft reconnaissance. Part I: Data analysis andclimatology.Mon. Wea. Rev., 116, 1032–1043.3
Weatherford, C. L. and W. M. Gray, 1988b: Typhoon structureas revealed by aircraft reconnaissance. Part II: Structuralvariability. Mon. Wea. Rev., 116, 1044–1056.1, 2, 3
Willoughby, H. E., 1990: Temporal changes of the primarycirculation in tropical cyclones.J. Atmos. Sci., 47, 242–264.1
Yanai, M., 1961: A detailed analysis of typhoon formation.J.Meteor. Soc. Japan, 39, 187–214.1
Zehr, R. M. and J. A. Knaff, 2007: Atlantic major hurricanes,1995–2005—characteristics based on best-track, aircraft, andIR images.J. Climate, 20, 5865–5888.4