a citizen’s guide to the washington state...
TRANSCRIPT

A Citizen’s Guide to the Washington State
BUDGET
2011

i
TABLE OF CONTENTS
Subject Page Introduction .............................................................................1
How Big is the State Budget? .................................................2
Where Does this Money Come From?....................................3
How are these Funds Spent by Function? ...............................4
How are these Funds Spent by Object? ..................................6
How Many State Employees are there? ..................................8
What is the State General Fund? ...........................................10
How is State General Fund Money Spent? ...........................12
Why Does the Budget Go Up Year after Year? ....................14
How is the Budget Created? .................................................14
How Does Washington’s Tax Burden Compare to Other States? ...................................................................................17
Why Does the State Borrow Money to Pay for the Capital Budget? ................................................................................20
How Does the 601 Spending Limit Work? ...........................26
Glossary of Commonly Used Budget Terms ........................28


1
INTRODUCTION
The 2011 Citizen’s Guide to the Washington State Budget is offered as a resource for citizens, members of the Senate, their staff, and other interested persons; to provide a clear and simple overview of the state budget and state revenues. It describes the three basic state budgets and their interrelationships, the sources of revenue that support those budgets, how the money is spent, how many staff the state employs, the timeline for budget decisions and information about state debt and the Initiative 601 spending limit.
This guide was developed as a response to requests received by the Senate Ways and Means Committee for a brief and easy-to-understand document that would explain the state budget to the general public. The Legislature produces a number of documents and reports that provide highly-detailed information regarding budget and revenue actions and the many programs and tax sources contained therein. This guide provides a pamphlet-style brief introduction to the state budget and taxes.
The 2011 Citizen’s Guide to the Washington State Budget was prepared by staff of the Senate Ways and Means Committee (within Senate Committee Services) and the Legislative Evaluation and Accountability Program (LEAP) Committee, with invaluable assistance from staff in several state agencies, notably staff of the Budget and Accounting divisions of the Office of Financial Management (OFM). Questions regarding the guide or requests for additional copies should be addressed to:
Senate Ways and Means Committee
311 John A. Cherberg Building Olympia, Washington 98504-0482 Telephone: 360-786-7715 Fax: 360-786-7615 http://www.leg.wa.gov/Senate/Committees/WM/Pages/default.aspx
2
HOW BIG IS THE STATE BUDGET?
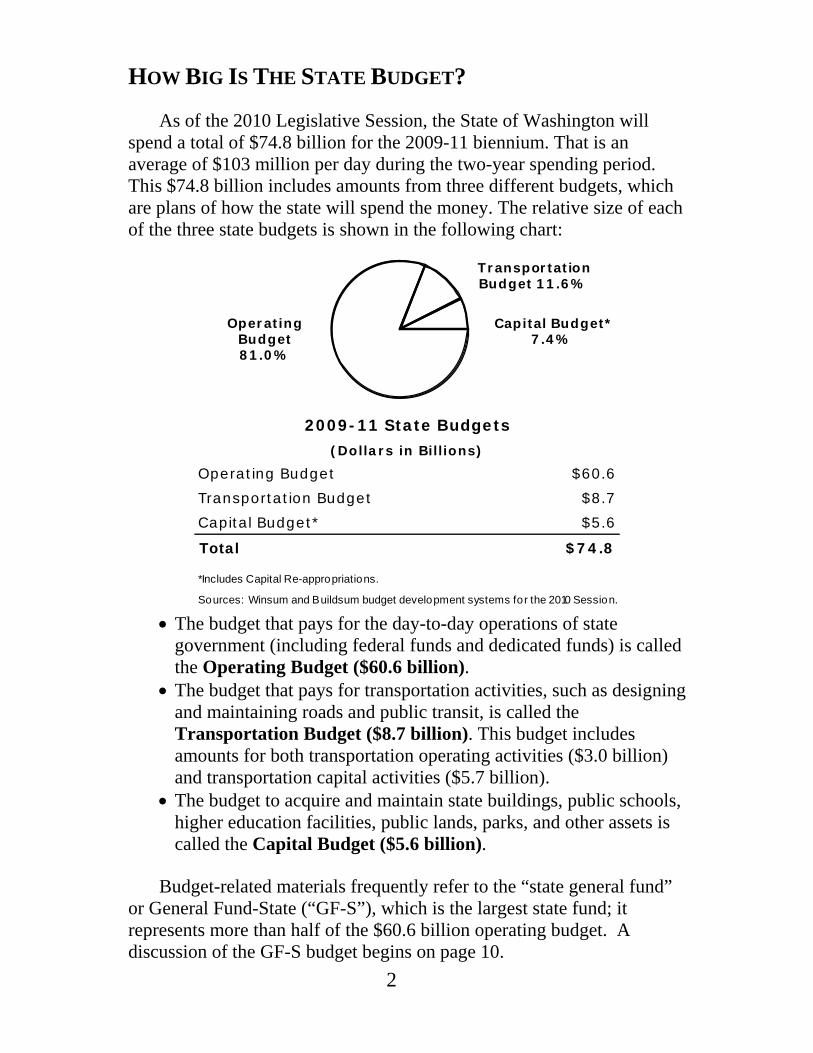
As of the 2010 Legislative Session, the State of Washington will spend a total of $74.8 billion for the 2009-11 biennium. That is an average of $103 million per day during the two-year spending period. This $74.8 billion includes amounts from three different budgets, which are plans of how the state will spend the money. The relative size of each of the three state budgets is shown in the following chart:
The budget that pays for the day-to-day operations of state
government (including federal funds and dedicated funds) is called the Operating Budget ($60.6 billion).
The budget that pays for transportation activities, such as designing and maintaining roads and public transit, is called the Transportation Budget ($8.7 billion). This budget includes amounts for both transportation operating activities ($3.0 billion) and transportation capital activities ($5.7 billion).
The budget to acquire and maintain state buildings, public schools, higher education facilities, public lands, parks, and other assets is called the Capital Budget ($5.6 billion).
Budget-related materials frequently refer to the “state general fund” or General Fund-State (“GF-S”), which is the largest state fund; it represents more than half of the $60.6 billion operating budget. A discussion of the GF-S budget begins on page 10.
2009-11 State Budgets(Dollars in Billions)
Operating Budget $60.6Transportation Budget $8.7Capital Budget* $5.6
Total $74.8
*Includes Capital Re-appropriations.
Sources: Winsum and Buildsum budget development systems for the 2010 Session.
Operating Budget81.0%
Transportation Budget 11.6%
Capital Budget* 7.4%
3
WHERE DOES THIS MONEY COME FROM?
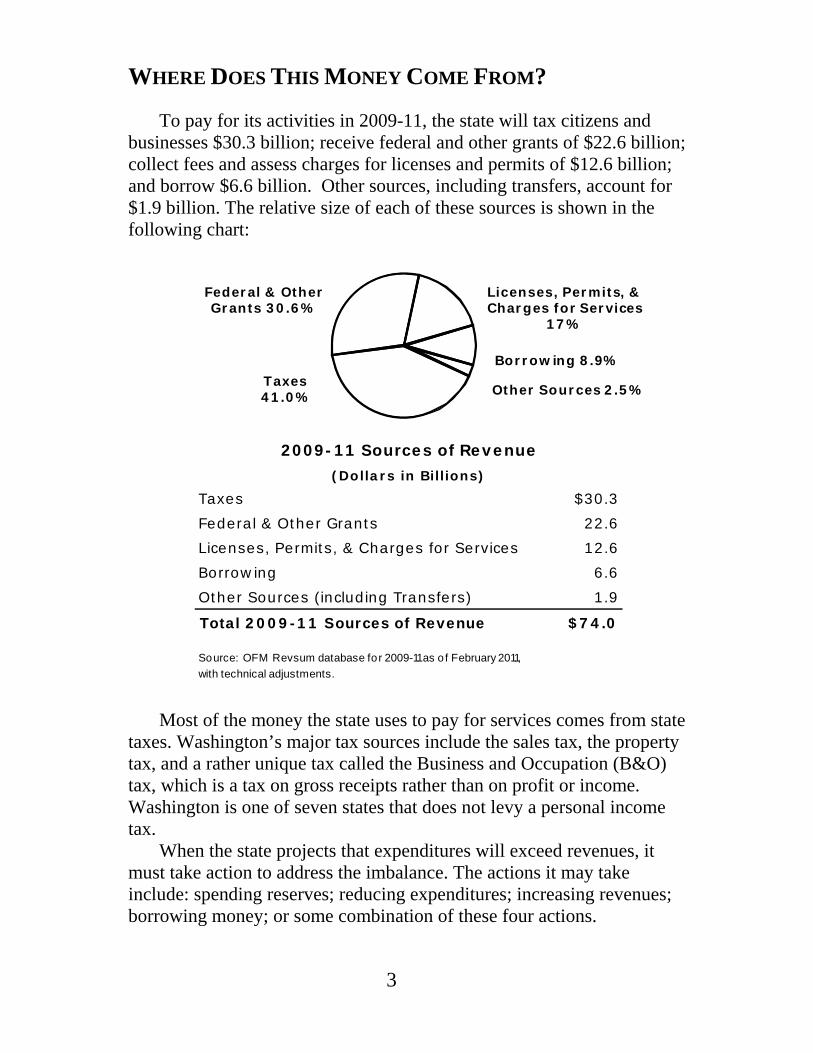
To pay for its activities in 2009-11, the state will tax citizens and businesses $30.3 billion; receive federal and other grants of $22.6 billion; collect fees and assess charges for licenses and permits of $12.6 billion; and borrow $6.6 billion. Other sources, including transfers, account for $1.9 billion. The relative size of each of these sources is shown in the following chart:
Most of the money the state uses to pay for services comes from state taxes. Washington’s major tax sources include the sales tax, the property tax, and a rather unique tax called the Business and Occupation (B&O) tax, which is a tax on gross receipts rather than on profit or income. Washington is one of seven states that does not levy a personal income tax.
When the state projects that expenditures will exceed revenues, it must take action to address the imbalance. The actions it may take include: spending reserves; reducing expenditures; increasing revenues; borrowing money; or some combination of these four actions.
2009-11 Sources of Revenue(Dollars in Billions)
Taxes $30.3Federal & Other Grants 22.6Licenses, Permits, & Charges for Services 12.6Borrowing 6.6Other Sources (including Transfers) 1.9
Total 2009-11 Sources of Revenue $74.0
Source: OFM Revsum database for 2009-11 as o f February 2011,
with technical adjustments.
Taxes41.0%
Licenses, Permits, & Charges for Services
17%
Borrowing 8.9%
Federal & Other Grants 30.6%
Other Sources 2.5%

4
HOW ARE THESE FUNDS SPENT BY FUNCTION?
The following chart shows how the $74.8 billion 2009-11 total funds budget is allocated:
Human Services, such as medical and public assistance, long-term care, other health care, and prisons, represents 35.7% of total budgeted expenditures. Most human services programs are partnerships between the state and the federal government, with the federal government providing about half of the money and the state providing the rest. The state provides human services to one out of every five citizens, including services to over half a million children residing in Washington.
Public Schools--state funding of kindergarten through twelfth grade (K-12) school districts--is the next largest category of total budgeted expenditures at 22.7%, although it represents the majority of the state general fund budget (see page 12).
Higher Education accounts for 14.1% of total budgeted spending. Higher education includes support for state four-year schools and community and technical colleges.
2009-11 All Budgeted Expenditures*(Dollars in Billions)
Human Services $26.7Public Schools $17.0Higher Education $10.5Transportation $8.0Governmental Operations $5.7Natural Resources $3.3Debt Service/Other $3.6
Total $74.8
*Includes Capital Re-appropriations.
Sources: Winsum and Buildsum budget development systems for the 2010 Session.
Human Services 35.7%
Public Schools 22.7%
Higher Education 14.1%
Transportation 10.8%
Gov't Operations 7.6%
Natural Resources 4.4%Debt Service/Other 4.8%

5
Over $8.0 billion is planned to be spent for Transportation services and construction in the 2009-11 biennium. These services and construction include highways, state ferries, and other transportation programs in the Washington State Department of Transportation (DOT); the Washington State Patrol (WSP); and the Department of Licensing (DOL), to name the three largest. Of that $8.0 billion, transportation operating activities account for more than $3.0 billion (4.2% of statewide spending), and transportation capital activities account for $5.7 billion (nearly 7.8% of total spending).
Other major spending categories include Natural Resources (agencies for environmental protection, management, and recreation); Governmental Operations (administrative, judicial, and legislative agencies); and other expenditures, such as the payment of Debt Service (the interest and principle costs of facilities and services funded through general obligation bonds).
6
HOW ARE THESE FUNDS SPENT BY OBJECT?
Another way to look at state spending is to identify what the state purchases. For example, payments to contractors and vendors for services rendered, and to school districts for K-12 education; salaries and benefits for state employees; and payments for buildings and lands, among others. These classifications are called “objects” of expenditure.
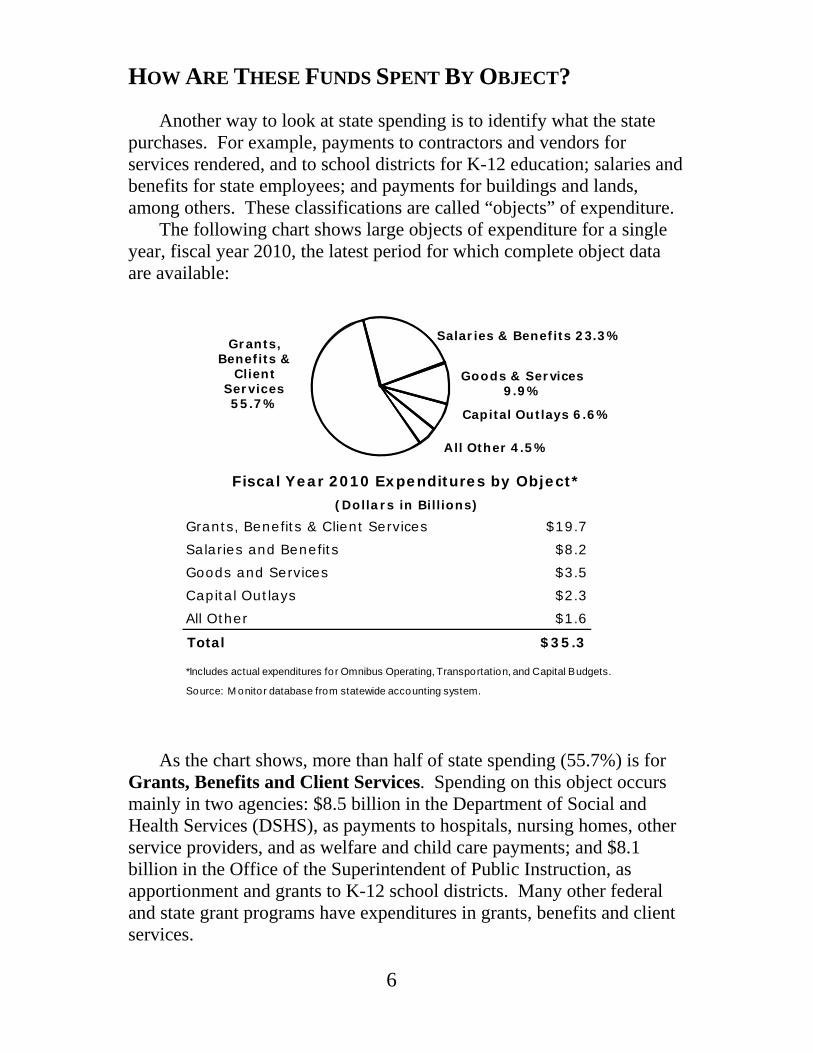
The following chart shows large objects of expenditure for a single year, fiscal year 2010, the latest period for which complete object data are available:
As the chart shows, more than half of state spending (55.7%) is for Grants, Benefits and Client Services. Spending on this object occurs mainly in two agencies: $8.5 billion in the Department of Social and Health Services (DSHS), as payments to hospitals, nursing homes, other service providers, and as welfare and child care payments; and $8.1 billion in the Office of the Superintendent of Public Instruction, as apportionment and grants to K-12 school districts. Many other federal and state grant programs have expenditures in grants, benefits and client services.
Fiscal Year 2010 Expenditures by Object*(Dollars in Billions)
Grants, Benefits & Client Services $19.7Salaries and Benefits $8.2Goods and Services $3.5Capital Outlays $2.3All Other $1.6
Total $35.3
*Includes actual expenditures for Omnibus Operating, Transportation, and Capital Budgets.
Source: M onitor database from statewide accounting system.
Grants, Benefits &
Client Services 55.7%
Salaries & Benefits 23.3%
Goods & Services 9.9%
Capital Outlays 6.6%
All Other 4.5%
7
The $8.2 billion Salaries and Benefits expenditure provided compensation to the nearly 109,000 full-time equivalent (FTE) staff that the state directly employed in FY 2010. In addition to salaries and wages, this amount includes health, life, and disability insurance; Old Age and Survivors Insurance (OASI is sometimes referred to as “Social Security”); retirement and pensions; and other employee benefits.
The $3.5 billion Goods and Services expenditure in FY 2010 paid for things like supplies, medications at state-operated hospitals, food at colleges and universities, and small equipment (valued at under $5,000 per item), as well as services such as data processing, security, rentals and leases, communications, utilities, printing, insurance, training, and vehicle maintenance.
The $2.3 billion Capital Outlays expenditure in FY 2010 paid for highway construction ($983 million), buildings ($308 million), and architectural & engineering services ($303 million), among others. The Washington State Department of Transportation (DOT) accounted for more than half (66%) of these expenditures, while higher education--the four-year institutions and the community and technical colleges--accounted for just over one quarter (23%).
The All Other category of objects includes debt service, personal service contracts, travel, and transfers that total $1.6 billion.

8
HOW MANY STATE EMPLOYEES ARE THERE?
For budget purposes, the state counts its employees in terms of full-time equivalent (FTE) staff. One FTE equals 2,088 paid hours per fiscal year. Generally, one FTE is thought of as one full-time position, although an FTE may be composed of multiple part-time positions. As the following chart shows, for the 2009-11 biennium, the state’s budgets anticipate approximately 109,000 annual FTEs.
Higher Education represents the largest category of state
employees. The budget for the University of Washington includes approximately 19,300 FTEs and there are just over 15,000 FTEs in the budget for the community and technical colleges. The next largest area is Human Services. Nearly 18,400 FTEs work for the Department of Social and Health Services and approximately 9,000 FTEs work for the Department of Corrections.
Three agencies in Transportation employ 99% of the staff in this area of state government: Washington State Department of
Average Annual FTE Staff for 2009-11Higher Education 45,062Human Services 35,586Transportation 11,441Governmental Operations 9,931Natural Resources 6,147Other 820
Total* 108,988
*Includes FTEs from Omnibus Operating, Transportaion, and Capital Budgets.
Sources: Winsum and Buildsum budget development systems for the 2010 Session.
Higher Education
41.3%
Human Services 32.7%
Gov't Operations 9.1%
Transportation 10.5%
Natural Resources 5.6%
Other 0.8%

9
Transportation (7,594 budgeted FTEs), Washington State Patrol (2,422), and the Department of Licensing (1,355).
Similarly, in Natural Resources, the largest employers are the Departments of Fish and Wildlife (1,493 budgeted FTEs), Natural Resources (1,403), and Ecology (1,559).
In the preceding chart, Other includes the Office of the Superintendent of Public Instruction (OSPI) with 320 budgeted FTEs and the Department of Early Learning with 195 budgeted FTEs. They are the only agencies in this category with budgets that exceed 125 FTEs.
Of the nearly109,000 budgeted FTEs, the state general fund will pay for approximately 37%, Higher Education non-appropriated funds will pay for nearly 27%, federal funds, including funds from the American Recovery and Reinvestment Act of 2009, will pay for nearly 15%, and numerous dedicated funds will pay the remaining 23.7%.
The nearly 102,000 FTEs of K-12 local school districts are not included in the FTEs that the state directly employs. Previously, the state paid for approximately 71% of the maintenance and operations budgets of the 295 school districts throughout the state via funds disbursed through the Office of the Superintendent of Public Instruction. In School Year 2009-10, federal stimulus provided $440 million for school districts. Consequently, the state share of school district funding decreased to 66%.
10
WHAT IS THE STATE GENERAL FUND?
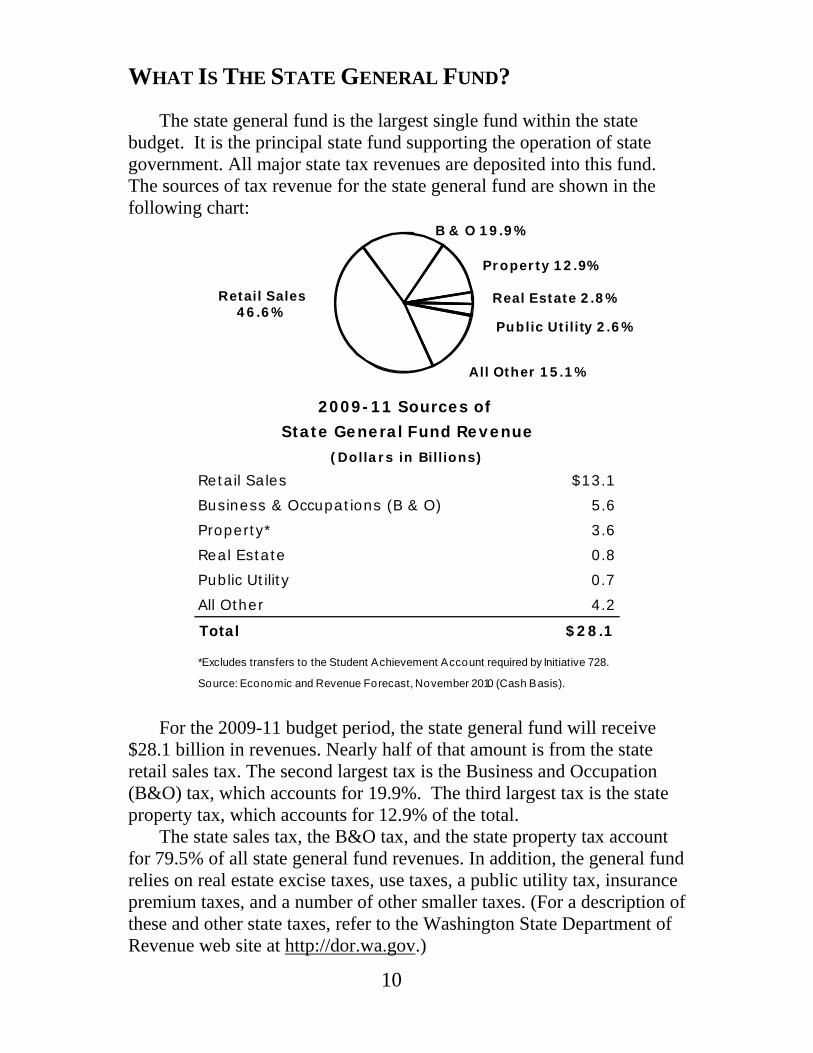
The state general fund is the largest single fund within the state budget. It is the principal state fund supporting the operation of state government. All major state tax revenues are deposited into this fund. The sources of tax revenue for the state general fund are shown in the following chart:
For the 2009-11 budget period, the state general fund will receive
$28.1 billion in revenues. Nearly half of that amount is from the state retail sales tax. The second largest tax is the Business and Occupation (B&O) tax, which accounts for 19.9%. The third largest tax is the state property tax, which accounts for 12.9% of the total.
The state sales tax, the B&O tax, and the state property tax account for 79.5% of all state general fund revenues. In addition, the general fund relies on real estate excise taxes, use taxes, a public utility tax, insurance premium taxes, and a number of other smaller taxes. (For a description of these and other state taxes, refer to the Washington State Department of Revenue web site at http://dor.wa.gov.)
2009-11 Sources of State General Fund Revenue
(Dollars in Billions)
Retail Sales $13.1Business & Occupations (B & O) 5.6Property* 3.6Real Estate 0.8Public Utility 0.7All Other 4.2
Total $28.1
*Excludes transfers to the Student Achievement Account required by Initiative 728.
Source: Economic and Revenue Forecast, November 2010 (Cash Basis).
Retail Sales 46.6%
B & O 19.9%
Property 12.9%
Real Estate 2.8%
Public Utility 2.6%
All Other 15.1%
Retail Sales 46.6%
B & O 19.9%
Property 12.9%
Real Estate 2.8%
Public Utility 2.6%
All Other 15.1%
11
Contrary to popular belief, the state lottery does not pay for a large share of K-12 education. Currently, the lottery brings in approximately $250 million per biennium. (For more information on the Lottery and K-12 funding, see the Citizen's Guide to K-12 Finance.)The total state budget for public schools is approximately $17 billion for 2009-11. The state lottery, even if entirely dedicated to K-12 public schools, would represent only 1.5% of the state budget for K-12 education.
The major difference between the state general fund revenues ($28.1 billion) and the total of all budgeted funds revenues ($74 billion) is the dedication of revenue sources to specific uses. Most of the difference can be attributed to four types of funds:
Federal funds for specific federal programs and federal stimulus ($19.3 billion);
Higher Education-specific funds such as the Grants and Contracts Account, Higher Education Dedicated Local Accounts, the Tuition and Fees Account, and the University of Washington Hospital Account ($7.9 billion);
Bonds for capital purposes ($6.6 billion); and Gas taxes for transportation purposes ($2.4 billion). These four sources account for 79% of the difference between
revenues available for all state government budgets and the state general fund budget.

12
HOW IS STATE GENERAL FUND MONEY SPENT?
Because of the nature of its tax sources, the state general fund receives the most attention during the budget-building process. During the 2009-11 biennium, the state will spend approximately $30.5 billion (or about $42 million per day on average) from the state general fund. The following chart shows how the state general fund budget is allocated:
The largest single state general fund program is Public Schools, which includes state support for K-12 education. Public schools account for 22.7% of total budgeted expenditures, but that share increases to 43.6% when examining only the state general fund. In the 2009-11 biennium, the state will provide public education funding for more than 1,000,000 children.
Human Services state general fund spending consists primarily of the operating budget for the Department of Social and Health Services, the State’s umbrella organization that provides medical, social, and income assistance to citizens in need. It also includes spending for the Department of Corrections and the Department of Health.
2009-11 General Fund-State Expenditures(Dollars in Billions)
Public Schools $13.3Human Services 11.0Higher Education 2.7Governmental Operations 0.8Natural Resources 0.4Debt Service/Other 2.2
Total $30.5
Source: Winsum budget development system for the 2010 Session.
Human Services36%
Public Schools 43.6%
Higher Education 9.0%
Gov't Operations 2.8%Natural Resources 1.2%
Debt Service/Other 7.3%

13
Higher Education spending includes funding for six public universities, and thirty-four community colleges and technical schools serving more than 230,000 FTE students. It also includes state financial aid to more than 75,000 students attending both state supported and private colleges and universities. Expenditures for higher education represent 14.1% of all budgeted funds and 9.0% of the state general fund. In addition to money from the state general fund, higher education receives $7.9 billion of dedicated revenues, principally grants and contracts, and tuition and fees.
Other general fund spending categories include Natural Resources, Governmental Operations, Other Education, Transportation and other expenditures such as the payment of Debt Service.
14
WHY DOES THE BUDGET GO UP YEAR AFTER YEAR?
The budget increases each year because there are either more citizens to serve, those services cost more, and/or because citizens may request new or different services. Public education may be the easiest example of these trends. Article IX, Section 1 of the Washington State Constitution declares
“It is the paramount duty of the state to make ample provision for the education of all children residing within its borders ...” The cost of meeting this constitutional requirement takes nearly half of the state general fund budget. In 1990, there were approximately 800,000 children in Washington state K-12 public schools. In 2009-11, the K-12 system will educate more than 1,000,000 children. The education of these additional 200,000 children costs billions of dollars. Since 1990, the population of the state increased by nearly 2 million people, so there are more taxpayers to shoulder these costs.
Teaching supplies, materials, equipment and energy cost more in 2010 than they did in 1990, so the overall cost of educating each student has increased.
Finally, in 1993, the Legislature passed new requirements for public education. Referred to as “education reform,” these requirements continue to change the cost of education for each child. This too causes the budget to increase.
HOW IS THE BUDGET CREATED?
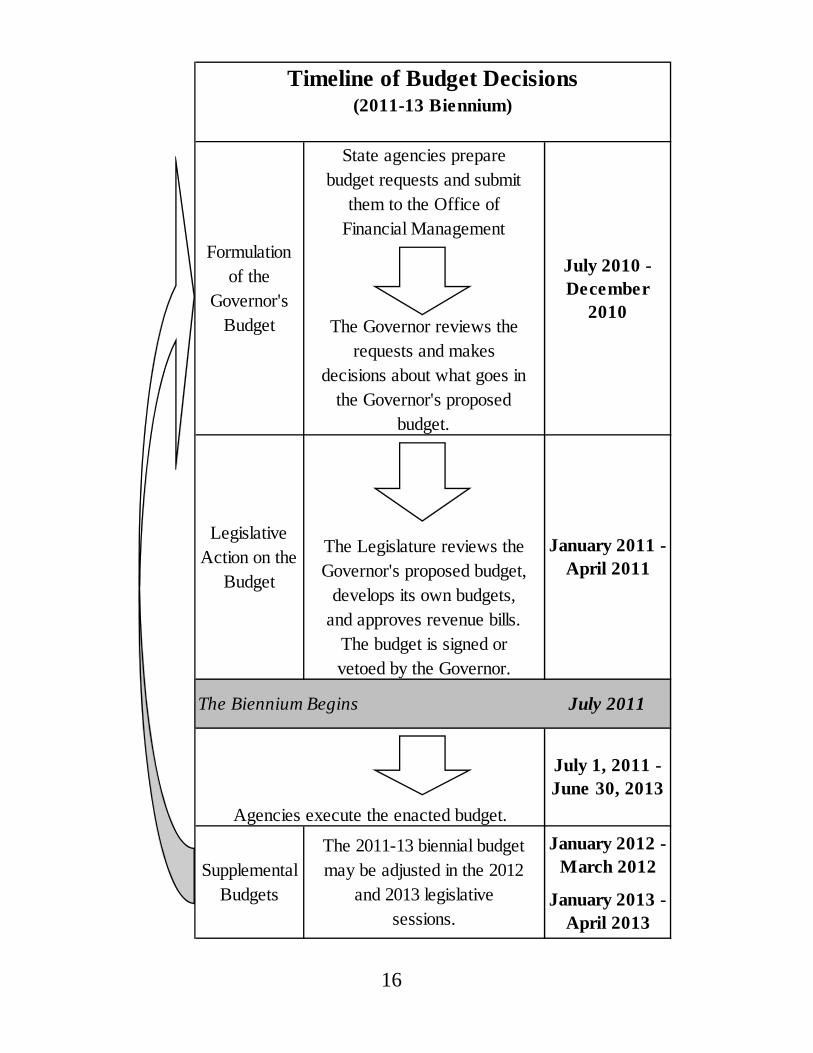
Through the budget process, the Legislature and the Governor decide how much money to raise and spend. State agencies, the Governor, the Legislature, citizens, and interest groups are all involved in this process. Washington State operates on a two-year (biennial) basis, beginning on July 1st of each odd-numbered year. For example, the current budget is for the period July 1, 2011 through June 30, 2013.
Agency Requests - In late summer and early fall of each even-numbered year, state agencies submit budget requests to the Office of Financial Management (OFM). The Governor reviews the requests and makes the final decisions for his or her budget proposal.
15
The Governor’s Budget - By law, as the chief executive officer of the state, the Governor must propose a biennial budget in December of even-numbered years, the month before the Legislature convenes in regular session. The Governor’s budget is his or her proposed spending and taxation plan for the biennium.
The Legislative Budget Process - After receiving the Governor’s budget proposal, the Legislature reviews it and formulates its own budget during the legislative session which begins in January. The chairs of the Senate Ways and Means Committee and House Ways and Means Committee work with their respective members and staffs to analyze the Governor’s budget and develop recommendations and alternative proposals. The transportation portions of the budget are developed by separate committees in the House and Senate. By tradition, the initiation of the budget alternates between chambers each biennium.
After each chamber has passed its version of the budget, the differences between the two must be reconciled in the budget conference process. Generally, six fiscal leaders representing both chambers and both political parties meet as a conference committee to prepare one legislative budget that is submitted to the full Legislature for final passage and then ultimately delivered to the Governor for his or her signature.
The Governor may veto all or part of the budget, thereby eliminating funding for certain activities; however, the Governor cannot add money for an activity for which the Legislature provided no funding. Only after the Legislature passes a budget and the Governor signs it has the state created a real budget.
Supplemental Budgets - Each year, the Legislature considers changes to the biennial budget in what is called a Supplemental Budget. Generally, such changes represent mid-course corrections to the two-year spending plans to account for changes in school enrollments, prison populations, public assistance caseloads, or significant changes in the economy of the state.
16
Timeline of Budget Decisions(2011-13 Biennium)
State agencies prepare budget requests and submit
them to the Office of Financial Management
The Governor reviews the requests and makes
decisions about what goes in the Governor's proposed
budget.
The Legislature reviews the Governor's proposed budget,
develops its own budgets, and approves revenue bills.
The budget is signed or vetoed by the Governor.
July 2011
Agencies execute the enacted budget.
January 2012 -March 2012
January 2013 - April 2013
Supplemental Budgets
The 2011-13 biennial budget may be adjusted in the 2012
and 2013 legislative sessions.
Formulation of the
Governor's Budget
July 2010 - December
2010
Legislative Action on the
Budget
January 2011 - April 2011
The Biennium Begins
July 1, 2011 - June 30, 2013

17
HOW DOES WASHINGTON’S TAX BURDEN COMPARE TO
OTHER STATES? Analysis of state and local taxes per capita provides one comparison of tax burdens among the states. As the following chart shows, for FY 2008 (the most recent year for which all data are available), the amount for state and local taxes per capita for Washington State is $4,290, which is 1% lower than the national average of $4,333.
The components of the tax structure of Washington State differ noticeably from national averages. Washington is one of only seven states that does not impose a personal or corporate income tax; at the same time, Washington has relatively high sales taxes. According to the Washington State Department of Revenue, in FY 2008 Washington ranked 26th in the nation with property taxes per capita of $1,172 (the national average was $1,334).
Source US Census Bureau Data @ http://www.census.gov/
$1,172 $1,334
$1,058 $827
$2,061
$992
$0
$500
$1,000
$1,500
$2,000
$2,500
$3,000
$3,500
$4,000
$4,500
Washington U.S. Average
FY 2008 Per Capita State and Local Taxes
Property Taxes Other Taxes Sales Taxes Income Taxes
$4,290 $4,333
$1,360
18
The chart on page 19 shows the total state and local taxes per capita for Washington compared to the other 49 states and to the U.S. average. This chart shows that Washington ranks 16th in state and local taxes per capita and that 33 states rank below the U.S. average of $4,333.
By comparing taxes to personal income, it should be possible to take into account differences in wealth among states when comparing tax burdens. However in recent years, the incredible increase in Washington State personal income, due in large part to the explosion of stock options during the late 1990s and 2000, distorted this measure and made it less useful as a yardstick of the overall tax burden.

19
South CarolinaAlabamaTennesseeSouth DakotaMississippiIdahoArkansasKentuckyOregonMissouriOklahomaUtahGeorgiaArizonaWest VirginiaTexasMontanaNorth CarolinaIndianaNew HampshireMichiganIowaNew MexicoColoradoFloridaLouisianaOhioNevadaVirginiaNebraskaDelawareKansasPennsylvaniaWisconsin
WASHINGTON $4,354
U.S. Average $4,371
Maine
IllinoisRhode IslandVermontMinnesotaMarylandNorth DakotaCaliforniaMassachusettsHawaii
New JerseyConnecticut
WyomingNew York
Alaska
0 5,000 10,000 15,000
FY 2008 State and Local Taxes(Dollars per Capita)

20
WHY DOES THE STATE BORROW MONEY TO PAY FOR
THE CAPITAL BUDGET?
The capital budget uses borrowed money to fund projects that benefit future tax payers. For example, the benefits of a new higher education facility will last for 30 years or more. Financing that facility with bonds paid off over thirty years spreads the cost over the life of the building and on future tax payers who benefit from it. How Is The Capital Budget Money Spent?
The following chart shows how the 2009-11 total funds capital budget is allocated:
The capital budget funds construction and maintenance of state buildings such as higher education facilities and prisons, provides grants to local school districts to help build new schools, and pays for acquisition and maintenance of public lands, parks and other assets. The
2009-11 Capital Budget, Total Funds(Dollars in Millions)
Higher Education $723Natural Resources 1,054Public Schools 758Corrections 34Other* 815
Total $3,383
Sources: Winsum and Buildsum budget development systems for the 2010 Session.
*Includes agencies in Government Operations, Human Services (excluding Corrections),
Other Education, and some transportation capital pro jects.
Higher Education 21.4%
Other* 24.1%
Natural Resources 31.1%
Corrections 1.0%
Public Schools 22.4%

21
capital budget also provides grants and loans to local governments and community groups for public works projects such as water and sewer systems, environmental projects such as toxic waste clean-up and salmon habitat restoration, and for cultural and recreational projects such as youth athletic fields and community service projects. Where Does Capital Budget Money Come From?
The following chart shows the history of size of the capital budget for bonds and the total appropriation:
Biennium Bonds Total
1985-87 518 6951987-89 604 9881989-91 923 1,8581991-93 1,260 1,8851993-95 1,011 1,7121995-97 809 1,6271997-99 929 1,9741999-01 1,143 2,5082001-03 1,102 2,6412003-05 1,493 2,9792005-07 1,703 3,5562007-09 2,574 4,3102009-11 2,132 3,371
Source: Buildsum budget development system for the 2010 session.
Capital Budget & Bonds(Dollars in Millions)
0
500
1,000
1,500
2,000
2,500
3,000
3,500
4,000
4,500
5,000
$ M
illio
ns
Other
Bonds
22
More than 60% of the money appropriated in the capital budget comes from the sale of bonds. The State Treasurer is responsible for selling and refinancing bonds. The money to pay the debt on these bonds is appropriated in the operating budget. These debt service payments, funded with general taxes, pay for schools, prisons and college facilities authorized and constructed through capital budgets adopted in previous legislative sessions. Bond-funded capital projects authorized in a particular legislative session will be paid for with taxes appropriated in future operating budgets. Other funds in the capital budget include federal grants; loan revolving funds, such as the public works assistance account and the water pollution control revolving account; and trust land revenues for common schools and higher education facilities.
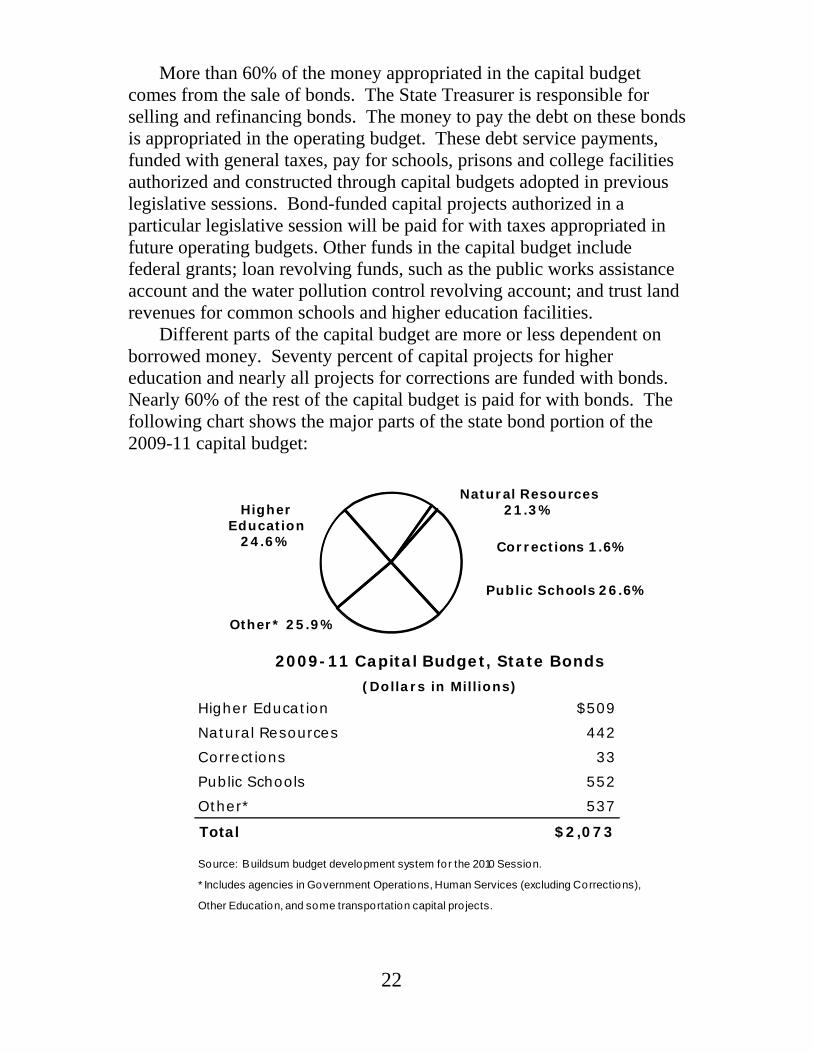
Different parts of the capital budget are more or less dependent on borrowed money. Seventy percent of capital projects for higher education and nearly all projects for corrections are funded with bonds. Nearly 60% of the rest of the capital budget is paid for with bonds. The following chart shows the major parts of the state bond portion of the 2009-11 capital budget:
2009-11 Capital Budget, State Bonds(Dollars in Millions)
Higher Education $509Natural Resources 442Corrections 33Public Schools 552Other* 537
Total $2,073
Source: Buildsum budget development system for the 2010 Session.
* Includes agencies in Government Operations, Human Services (excluding Corrections),
Other Education, and some transportation capital pro jects.
Higher Education
24.6%
Other* 25.9%
Natural Resources 21.3%
Corrections 1.6%
Public Schools 26.6%

23
What is the Debt Limit and How Does it Control the Capital Budget?
The Washington State Constitution indirectly limits the amount of debt the state can incur. Annual debt service payments cannot exceed nine percent of the average general state revenues in the preceding three years. Taxes and fees for specific purposes, such as the gas tax and property tax, are excluded from the definition of general state revenues.
The following chart show the constitutional debt limits and the actual debt service payments.
Debt Limit vs Actual Debt Service Payments(Dollars in Millions)
FiscalYear Limit Actual2001 748 5472002 779 5742003 794 5742004 799 5672005 807 6132006 839 6392007 928 6772008 1,037 7202009 1,135 7892010 1127 8402011 1092 8812012* 1084 9902013* 1157 971
*2012 and 2013 are based on the Governor's proposed budget.
Sources: Debt models from State Treasurer's Office
Constitutional
0
200
400
600
800
1000
1200
1400
$ M
illio
ns
Fiscal Years
Actual Debt Service Subject to Constitutional Limit
9% Constitutional Debt Limit
24
HOW DOES THE 601 SPENDING LIMIT WORK?
In November 1993, the citizens of Washington State passed an initiative to limit the growth in state government spending and taxation. Initiative 601 (I-601) placed a “cap” on state spending for activities funded by the state General Fund. The expenditure cap was based on the amount of state spending in 1990, with annual adjustments for subsequent population growth and inflation. When General Fund revenues grew faster than the I-601 spending limit, the extra revenue could be used to reduce taxes or be put into the “Emergency Reserve Fund,” which could only be used if two-thirds of the Legislature agreed to use it. When revenues grew more slowly during economic recessions, the emergency reserve fund could be used to allow spending up to the state spending limit.
Initiative 601 also requires a two-thirds vote of the Legislature to approve any legislation that increases state taxes. A vote of the people is required if the tax increase will result in spending in excess of the state expenditure limit.
Beginning July 1, 2007, the state General Fund expenditure limit was expanded to include expenditures from five additional state funds: the Health Services Account; the Violence Reduction & Drug Enforcement Account; the Public Safety & Education Account; the Water Quality Account; and the Student Achievement Fund. In addition, the annual adjustment to the state spending limit based on population growth and inflation was replaced by a formula reflecting the ten-year average growth of the state economy as measured by state personal income.
In 2007, the voters of the state abolished the Emergency Reserve Fund and replaced it with the constitutionally established Budget Stabilization Account (commonly known as the "rainy day fund"). Each year, one percent of general state revenues are automatically deposited to the account. Moneys may be appropriated from the Budget Stabilization Account by a majority vote of the Legislature if: (1) annual employment growth in the state is forecasted to be less than 1 percent; or (2) the Governor declares an emergency resulting from a catastrophic event that requires government action to protect life or public safety. Other withdrawals from the Budget Stabilization Account may be made only by a three-fifths vote of the Legislature.

25
In 2007, the voters of the state also approved Initiative 960, which requires an advisory vote of the people if legislative action raising taxes is not subject to a referendum (if it contains an emergency clause, for example). The initiative also requires prior legislative approval before any state agency can impose or increase an administrative fee, and the Office of Financial Management is required to publish a ten-year cost projection for any proposed legislation that increases state fees or taxes.

26
GLOSSARY OF COMMONLY USED BUDGET TERMS
Appropriation - A legislative authorization for an agency or other governmental unit to make expenditures and incur obligations: (1) for specific purposes, (2) from designated funding sources, and (3) during a specified time period.
Biennium - The 24-month period from July 1st of odd-numbered years to June 30th of odd-numbered years, such as the 2009-11 biennium, which runs from July 1, 2009 to June 30, 2011.
Capital Budget - The budget that pays for the construction and renovation of state facilities, including public schools, prisons, state hospitals, higher education institutions, parks, etc. Revenues to support capital spending come primarily from bonds and dedicated cash accounts.
Debt Service - The interest and principle costs of facilities and services funded through general obligation bonds.
Dedicated Funds - The product of reserving certain tax revenues for a specific purpose or purposes. Generally, any fund other than the general fund or a federal fund is referred to as a dedicated fund. There are literally hundreds of dedicated funds in the state treasury. Two of the largest are the Motor Vehicle Account, which receives gas tax revenues and is restricted to roads and highways, and the State Lottery Account, which accounts for revenues from ticket sales and is reserved for the cost of lottery operations and prizes.
Federal Funds – Monies provided by the federal government to support state programs. Major operating budget federal programs include Medicaid and the Social Services Block Grant.
Fiscal Year (FY) - The 12-month period from July 1st to June 30th, expressed in terms of the first six months of the second calendar year. For example, FY 2011 runs from July 1, 2010 until June 30, 2011.
FTE Staff - Full time equivalent (FTE) staff is a way to measure the size of the state’s workforce. One FTE is equivalent to 2,088 hours worked per year, which represents one full-time employee. Total FTE staff does not necessarily represent the total number of state employees because some staff work part-time and are thus classified as a percentage of one FTE.
Governmental Operations - A functional area of state spending which comprises a large number of central service agencies, such as the departments of General Administration, Personnel, Financial Management, Revenue, etc., as well as the legislative and judicial branches of government.
Higher Education - A functional area of state spending that includes the cost of secondary education and workforce training provided through the state’s 34 community and technical colleges, four regional universities, and two research universities.
Human Services - A functional area of state spending which comprises human services agencies such as the Department of Social and Health Services, the Department of Corrections, and the Department of Health.

27
Natural Resources - A functional area of state spending that includes the state’s natural resource agencies such as the departments of Ecology, Fish and Wildlife, Natural Resources, and the State Parks and Recreation Commission.
Object - A state accounting classification used to categorize expenditures. Objects of expenditure in the state operating and capital budgets include: Salaries and Wages; Employ Benefits; Personal Service Contracts; Goods and Services; Travel; Capital Outlays; Grants, Benefits, and Client Services; Debt Service; and various transfer objects.
Operating Budget - The budget which pays for most of the day-to-day operations of state government and constitutes the majority of all state spending is referred to as the operating budget. Revenue to support this budget comes from a variety of taxes and fees that are deposited into more than 200 separate funds and accounts, the largest of which is the state general fund.
Other Education - A functional area of state spending that includes the cost of providing specialized education services at the Schools for the Deaf and the Blind, arts and cultural services provided through the Arts Commission and the two state Historical Societies, and cost of the state Work Force Training, and Education Coordinating Board.
Public Schools - A functional area of state spending that includes the cost of educating the state’s children from grades kindergarten through high school. It also includes the funding for other activities of the public school system. The Superintendent of Public Instruction allocates these funds to 296 school districts, nine educational service districts and other contractors who provide education services.
State General Fund - Often referred to as General Fund-State (GF-S), this fund serves as the principal state fund supporting the operation of state government. All major state tax revenues (sales, business and occupation, property tax, and others) are deposited into this fund.
Transportation Budget - The budget which pays for both the day-to-day operation of state transportation agencies and the construction and preservation of state highways and roads, is called the transportation budget. Most of the revenue that supports the transportation budget comes from the state gas tax.