a child care quality rating system for indiana - state of indiana
TRANSCRIPT

Paths to
A Child Care Quality Rating System for Indiana
What is its Scientific Basis?
James ElickerCarolyn Clawson Langill
Karen RuprechtKyong-Ah Kwon
Center for Families and Department of Child Development & Family Studies


PTQ Validity Report Executive Summary—10/23/07 1
EXECUTIVE SUMMARY
Paths to QUALITY--
Child Care Quality Rating System for Indiana
What is its Scientific Basis?
James Elicker
Carolyn Clawson Langill
Karen Ruprecht
Kyong-Ah Kwon
Child Development & Family Studies
Purdue University
October 23, 2007

PTQ Validity Report Executive Summary—10/23/07 2
Paths to QUALITY—A Child Care Quality Rating System for Indiana:
What is its Scientific Basis?
Executive Summary
Paths to QUALITY is Indiana’s new statewide child care quality rating system, scheduled to
begin implementation in selected regions of the state in 2008 and then continue phased
implementation through 2009. Child care quality rating systems are a relatively recent trend in
the United States.
The main components of most state QRS programs are: 1) a set of quality standards that apply to
home-based and center-based child care; 2) a process for objectively assessing child care quality
and maintaining accountability; 3) a system of training and technical assistance to help child care
providers improve quality; 4) incentives to encourage providers to reach higher levels of quality;
and 5) public information to inform parents about what the QRS is and how to use it when they
make child care decisions. As of January, 2007, 15 states had already implemented a QRS for
child care, and several other states, including Indiana, were planning QRS programs.1
In 2007 Indiana’s Bureau of Child Care, a division of the Family and Social Services
Administration, contracted Purdue University to complete a scientific review of the quality
standards contained in Paths to QUALITY, the proposed quality rating system. The overall goal
of this review was to conduct an external evaluation of the scientific validity of the Paths to
QUALITY standards.
The review focused on the following three questions:
1. What are the known results and effects of the two existing Indiana QRS pilot programs to
date? (Fort Wayne and Evansville areas)
2. Will the proposed Indiana QRS levels and criteria result in increasing the quality of child
care children receive? (What does existing research tell us?)
3. Will the Indiana QRS system improve developmental outcomes for children? (What does
existing research tell us?)

PTQ Validity Report Executive Summary—10/23/07 3
Paths to QUALITY Levels and Criteria
Indiana Paths to QUALITY (PTQ) establishes four levels of quality that apply to licensed child
care centers, licensed family child care homes, and registered child care ministries. Each level
includes specific criteria that must be met in order for that level to be awarded. The quality levels
are labeled:
Level 1 – Health and Safety
Level 2 – Learning Environment
Level 3 – Planned Curriculum
Level 4 – National Accreditation
Paths to QUALITY History
Paths to QUALITY in Indiana
The Paths to QUALITY program was created by the Child Care and Early Education
Partnership, a group of organizations working together in the Northeast Indiana “to develop
awareness of and commitment to the importance of high quality early care and education for all
children in the community.” 2 During 1996 to1999, Paths to QUALITY, a child care quality
indicator system, was created as a strategy to identify high quality early care and education.
Goals of Paths to QUALITY
Paths to QUALITY is a voluntary system created to assist parents in identifying and selecting
quality child care and recognize providers for ongoing efforts to achieve higher standards of
quality that the minimum state licensing requirements. Providers who choose to join PTQ receive
a verification visit, are assessed, and are placed on one of four levels. Providers receive yearly
re-verification visits to determine if they have maintained their current level or achieved a higher
level.
The goals of the Paths to QUALITY as originally conceived were:
1. raise the quality of child care and early education experiences for children,
2. give parents tools to help determine the best quality program for their children, and
3. support and recognize providers for quality care.
Implementation of Paths to QUALITY
In 2000, PTQ was implemented in Allen County in Northeast Indiana by the Early Childhood
Alliance (ECA) Child Care Resource and Referral agency. In 2001, PTQ was implemented in the
surrounding 5 counties of DeKalb, Whitley, Steuben, Noble, and LaGrange.

PTQ Validity Report Executive Summary—10/23/07 4
In 2005, 4C of Southern Indiana implemented the PTQ program in the 11 county service area of
Vanderburgh, Posey, Pike, Dubois, Warrick, Knox, Martin, Daviess, Spencer, Gibson, and Perry
Counties.
Conclusions from PTQ pilot programs in Northeast and Southwest Indiana:
• The dramatic growth in participation rates and increases in levels by providers in both
regions illustrate the success of the program.
• In both regions relationships between providers and child care resource & referral
staff, in particular mentoring services and training opportunities, were reported to be
critical to the success of the programs and advancement in PTQ levels.
• Barriers for providers to advance levels in PTQ included: completing voluntary
certification participation, meeting education and training requirements of staff,
providing accessible, appropriate learning materials, understanding and implementing
a developmentally appropriate curriculum, providing parent/teacher conferences, and
implementing various administrative changes (developing parent contracts, writing
strategic plans, instituting parent surveys and evaluations).
• Increased participation in training and professional development events made the
greatest difference in helping providers advance to higher levels.
• The pilot programs demonstrate that the PTQ system is understandable to child care
providers and provide preliminary evidence that when providers reach higher levels,
they are increasing the quality of care and education they provide for children, as
assessed by objective and valid quality measures.
• The successes of PTQ pilot programs provide encouragement for the development of
a statewide quality rating system using the PTQ levels.

PTQ Validity Report Executive Summary—10/23/07 5
Key Quality Indicators Contained in the Paths to Quality Levels
After reviewing the Paths to QUALITY standards, the Purdue research team identified 10 “key
quality indicators” within the standards: 1) Regulation, 2) Teacher education and specialized
training, 3) Structural quality, 4) Process quality, 5) Assessment, 6) Provisions for children with
special needs, 7) Program policies and procedures, 8) Director professional development, 9)
Parent-teacher communication and involvement, and 10) Accreditation by NAEYC or other
organizations.
We defined a “quality indicator” as something that:
1. is a concrete, observable, or otherwise documentable aspect of child care settings or
practices;
2. has been identified as a “best practice” in national policies or professional position
statements; and
3. has been evaluated specifically in the published scientific early education and child care
literature.
Next, we identified the Paths to QUALITY levels and criteria that include each indicator and
reviewed available evidence for the importance of each indicator and its relation to other
measures of quality and its relationship to children’s development and well-being.
Conclusions: Validity of the PTQ Levels and Criteria
• A thorough review of 10 main quality indicators (including 12 additional sub-indicators)
within the PTQ levels and standards revealed substantial scientific evidence for the validity
of the PTQ quality criteria.
• 75% of the quality indicators we examined had “substantial evidence” for their validity.
• In addition, most of the PTQ quality indicators had significant evidence that they support
children’s development, learning, or well-being in child care.
• Overall, we found significant support for the validity the PTQ quality indicators in the child
development and early education scientific literature.
• In addition, most of the PTQ standards have the support of prominent early childhood
education organizations, which have designated them as “best practices.”

PTQ Validity Report Executive Summary—10/23/07 6
General Conclusions
• Based on our analysis of the PTQ program as developed in regional pilots and upon review
of the evidence for the validity of the proposed PTQ quality standards, we conclude that, if
implemented with diligence, care, and accountability, the PTQ program has the potential to
increase the quality in child care centers, child care ministries, and child care homes in
Indiana.
• Further, if implemented with care, the PTQ system has the potential to help child care
providers increase their support of Indiana young children’s learning, development, and well-
being.
1 National Child Care Information Center. (2007, April). Quality rating systems: Definition and statewide systems.
Retrieved September 21, 2007 from www.nccic.org/pubs/qrs-defsystems.html. 2 Child Care and Early Care Partnership Mission, 1996.

PTQ Validity Report—10/23/07 1
Paths to QUALITY--
A Child Care Quality Rating System for Indiana
What is its Scientific Basis?
James Elicker
Carolyn Clawson Langill
Karen Ruprecht
Kyong-Ah Kwon
Child Development & Family Studies
Purdue University
October 23, 2007

PTQ Validity Report—10/23/07 2
Acknowledgments
The authors wish to thank the staff of the Early Childhood Alliance in Fort Wayne, Indiana,
especially Madeleine Baker, Teresa Reidt, and Pam Leffers, for their assistance in the
compilation of data describing the history and accomplishments of the first Paths to QUALITY
pilot program in Indiana.
We also wish to acknowledge the many contributions of the staff of 4C of Southern Indiana, Inc.,
especially Erin Ramsey and Jennifer Gronotte. In addition to sharing data they collected over the
first two years of the PTQ program, they collaborated with Purdue University in an external
evaluation study funded by the Welborn Baptist Foundation, Inc.
Funding for this report was provided by contract with Purdue University from the Indiana
Bureau of Child Care, a department of the Division of Family Resources, Indiana Family &
Social Services Administration. The Indiana Paths to QUALITY program is directed by
Michelle Thomas, State Child Care Administrator with the Bureau.

PTQ Validity Report—10/23/07 3
Table of Contents
Introduction ..................................................................................................................................4
Overview: Paths to QUALITY Levels and Criteria ...................................................................5
Paths to QUALITY: History........................................................................................................6
Goals of Paths to QUALITY ...............................................................................................6
History of PTQ in Indiana ...................................................................................................7
Implementation of Paths to QUALITY ...............................................................................7
Overview of Results: ECA PTQ Program (Northeast Indiana) ..........................................7
Overview of Results: 4C PTQ program (Southwest Indiana) ..........................................10
General Conclusions: Indiana PTQ Pilot Programs..........................................................12
What Are the Key Quality Indicators in the Paths to QUALITY Levels?.............................13
Paths to QUALITY Indicators: Evidence for Validity............................................................16
Introduction........................................................................................................................16
Regulation ..........................................................................................................................17
Teacher/Caregiver Education & Training..........................................................................19
Structural Quality...............................................................................................................21
Structural Quality: Teacher/Child Ratios..............................................................22
Structural Quality: Group Size…………………………………….......................24
Structural Quality: Program Duration....................................................................26
Structural Quality: Classroom environment ..........................................................27
Process Quality ..................................................................................................................30
Process Quality: Teacher-Child Interactions .........................................................31
Process Quality: Children’s Active Engagement...................................................32
Process Quality: Child-Initiated and Teacher-Directed Activities ........................33
Process Quality: Activities in the Daily Routine ..................................................35
Process Quality: Developmentally- Appropriate Written Curriculum ..................37
Process Quality: Language and Literacy Opportunities ........................................39
Process Quality: Diversity .....................................................................................41
Assessment.........................................................................................................................43
Provisions for children with special needs.........................................................................45
Program policies & procedures..........................................................................................47
Director professional development ....................................................................................49
Parent-Teacher Communication & Involvement ...............................................................51
Accreditation by NAEYC or other organizations..............................................................52
Conclusions: Validity of the PTQ Levels and Criteria............................................................53
Appendix
Quality Indicators Contained in Paths to QUALITY ..........................................................2
Paths to QUALITY Pilot Program: Early Childhood Alliance ........................................12
Paths to QUALITY Pilot Program: 4C of Southern Indiana, Inc .....................................20
PTQ Validity Report—10/23/07 4
Paths to QUALITY—A Child Care Quality Rating System for Indiana:
What is its Scientific Basis?
Introduction
Paths to QUALITY is Indiana’s new child care quality rating system, scheduled to begin
implementation in selected regions of the state in 2008 and then continue phased implementation
statewide through 2009. Statewide child care quality rating systems are a relatively recent trend
in the United States. According to the National Child Care Information Center:
A Quality Rating System (QRS) is a systemic approach to assess, improve, and communicate
the level of quality in early care and education programs. Similar to rating systems for
restaurants and hotels, QRS award quality ratings to early care and education programs that
meet a set of defined program standards. These systems provide an opportunity for States to
(1) increase the quality of care and education for children; (2) increase parents’
understanding and demand for higher quality care; and (3) increase professional development
of child care providers. QRS can also be an effective strategy for aligning components of the
early care and education system for increased accountability in improving quality of care.1
The main components of most QRS programs are: 1) a set of quality standards that apply to
home-based and center-based child care; 2) a process for objectively assessing child care quality
levels and maintaining accountability; 3) a system of training and technical assistance to help
child care providers improve quality; 4) incentives to encourage providers to reach higher levels
of quality; and 5) public information to inform parents about what the QRS is and how to use
when they make child care decisions. As of January, 2007, 15 states had already implemented a
QRS for child care, and several other states, including Indiana, were planning QRS programs.2
In 2007 Indiana’s Bureau of Child Care, a division of the Family and Social Services
Administration, contracted Purdue University to complete a scientific review of the quality
standards contained in Paths to QUALITY, the planned quality rating system. The overall goal
of this review was to conduct an external evaluation of the scientific validity of the Paths to
QUALITY standards, as proposed. The review focused on the following three questions:
1. What are the known results and effects of the two Indiana QRS pilot programs to date?
(Fort Wayne and Evansville areas)
2. Will the proposed Indiana QRS levels and criteria result in increasing the quality of child
care children receive? (What does existing research tell us?)
3. Will the Indiana QRS system improve developmental outcomes for children? (What does
existing research tell us?)
This report summarizes this review of scientific literature supporting the Paths to QUALITY
standards. First, we present an overview of the four Paths to QUALITY levels, including the
criteria child care providers must meet to attain each level. Second, we provide a summary of
the original Paths to QUALITY program in the Fort Wayne area, and its subsequent replication
in southwestern Indiana. We review the accomplishments and the documented impact of these
PTQ Validity Report—10/23/07 5
pilot programs on child care quality in these regions of the state. Third, we summarize our
detailed analysis of 10 important “quality indicators” that are contained in the new Paths to
QUALITY standards. This analysis includes a definition of each quality indicator, a description
of where it appears in Paths to QUALITY levels, and a review of the scientific literature
pertaining to each quality indicator. Fourth, we draw conclusions about the overall scientific
validity of the Paths to QUALITY standards, projecting the program’s impact on Indiana’s child
care quality and the development of its young children.
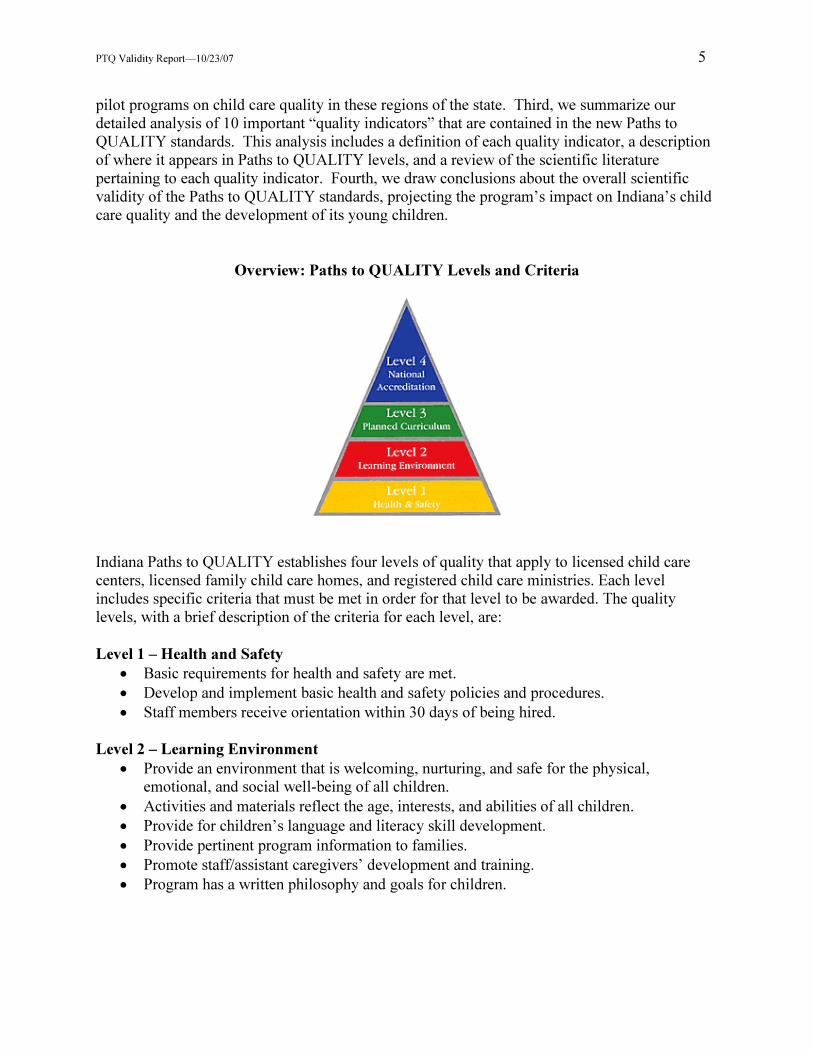
Overview: Paths to QUALITY Levels and Criteria
Indiana Paths to QUALITY establishes four levels of quality that apply to licensed child care
centers, licensed family child care homes, and registered child care ministries. Each level
includes specific criteria that must be met in order for that level to be awarded. The quality
levels, with a brief description of the criteria for each level, are:
Level 1 – Health and Safety
• Basic requirements for health and safety are met.
• Develop and implement basic health and safety policies and procedures.
• Staff members receive orientation within 30 days of being hired.
Level 2 – Learning Environment
• Provide an environment that is welcoming, nurturing, and safe for the physical,
emotional, and social well-being of all children.
• Activities and materials reflect the age, interests, and abilities of all children.
• Provide for children’s language and literacy skill development.
• Provide pertinent program information to families.
• Promote staff/assistant caregivers’ development and training.
• Program has a written philosophy and goals for children.

PTQ Validity Report—10/23/07 6
Level 3 – Planned Curriculum
• A written curriculum and planned program for children reflects developmentally
appropriate practice.
• Program evaluation is completed annually by parents and staff.
• Actively engage in program evaluation and have an action plan for improvement
• Demonstrate professional growth of Director and staff or lead caregiver and assistants in
excess of licensing requirements
• Facilitate family and staff input into the program.
• Program has been in operation for a minimum of one year or lead Caregiver has at least
12 months experience in a licensed or Bureau of Child Care nationally recognized
accredited child care setting as a child care provider.
Level 4 – National Accreditation
• Accreditation is achieved through the National Association for the Education of Young
Children (NAEYC) or the National Association of Family Child Care (NAFCC).
• Professional development and involvement continues including mentoring other
directors/providers.
Paths to QUALITY: History
Goals of Paths to QUALITY
Paths to QUALITY is a voluntary system created to assist parents in identifying and selecting
quality child care and recognize providers for ongoing efforts to achieve higher standards of
quality than the minimum state licensing requirements. Providers who choose to join PTQ
receive a verification visit, are assessed, and are placed on one of four levels. Providers receive
yearly re-verification visits to determine if they have maintained their current level or achieved a
higher level.
The goals of the Paths to QUALITY as originally conceived were:
1. to raise the quality of child care and early education experiences for children,
2. to give parents tools to help determine the best quality program for their children,
and
3. to support and recognize providers for quality care.
Through these goals it was proposed that PTQ would also provide the following benefits:
� Affirm and support the role of parents
� Provide opportunities for all children to develop optimally
� Develop well-trained, qualified child care and early education staff
� Provide experiences which help children succeed in school
� Make affordable, high quality child care available when and where families need it
� Encourage a more stable child care workforce through increased stature,
professionalism, salaries and benefits
� Help children make a smooth transition to kindergarten

PTQ Validity Report—10/23/07 7
History of PTQ in Indiana
The Paths to QUALITY program was created by the Child Care and Early Education
Partnership, a group of organizations working together in the Fort Wayne area “to develop
awareness of and commitment to the importance of high quality early care and education for all
children in the community.”3 In 1996, the Partnership funded a community action plan titled
Child Care & Early Education: Everyone’s Business to address the child care and early
education needs of Allen County. The partnership sought to develop a clear set of objectives for
high quality child care and early education, identify the local assets for and barriers to achieving
those objectives, and establish a plan to build on assets to overcome the barriers of and move the
community toward high quality child care and early education. To develop awareness of and
commitment to the importance of high quality early care and education, the standard for child
care quality and support of quality early care and education were addressed in Northeast Indiana.
During 1996 to1999, Paths to QUALITY, a child care quality rating system, was created as a
strategy to identify high quality early care and education.
Implementation of Paths to QUALITY
In 2000, PTQ was implemented in Allen County in Northeast Indiana by the Early Childhood
Alliance’s (ECA) Child Care Resource and Referral agency. In 2001, PTQ was implemented in
the surrounding 5 counties of DeKalb, Whitley, Steuben, Noble, and LaGrange.
In 2005, 4C of Southern Indiana, Inc. implemented the PTQ program in the 11 county service
areas of Vanderburgh, Posey, Pike, Dubois, Warrick, Knox, Martin, Daviess, Spencer, Gibson,
and Perry Counties.
Overview of Results: Early Childhood Alliance PTQ Program (Northeast Indiana)
The following summary of results is based on a review of annual reports provided by the Early
Childhood Alliance. No external evaluation of the program has been conducted. Each of the 3
main goals of PTQ is addressed in this summary of PTQ outcomes. (For a more detailed
summary report of the ECA Paths program and results, see Appendix 2, “Paths to QUALITY
Pilot Program: Early Childhood Alliance.”)
Table 1 highlights participation levels of each provider type within the Early Childhood Alliance
program from 2001-2007. Participation levels increased steadily each year for each type of
provider. Registered ministries experienced a slight decrease from 2006 to 2007. Part time
preschool programs experienced small variations in participation rate through the six years, but
averaged around 40%.

PTQ Validity Report—10/23/07 8
Table 1. Participation rates for PTQ in Northeast Indiana (% of eligible providers)
2001 2002 2003 2004 2005 2006 2007
All providers registered
with PTQ 28% 42% 47% 47% 52% 53% 60%
Licensed Centers 75% 76% 82% 90% 88% 96% 96%
Family Homes 23% 41% 46% 50% 54% 54% 64%
Registered Ministries 9% 12% 23% 23% 25% 35% 32%
Part time programs 38% 40% 42% 34% 42% 38% 44%
Goal #1: Raise the quality of child care and early experiences for children.
Table 2 presents data about how providers increased in levels once they entered the system:
• Sixty-seven percent of providers increased a minimum of one or more levels of quality.
• By July 2007, 92% (217) of providers on PTQ increased at least one level since they
began the program.
Table 2. Programs and providers initial and current PTQ rating in Northeast Indiana
Initial Rating Current Rating (July 2007)
Level 1 67% 24%
Level 2 9% 15%
Level 3 11% 25%
Level 4 13% 35%
Some of the providers who were receiving mentoring provided by ECA received quality
assessments using one of three measures of classroom quality – the Early Childhood
Environment Rating Scale (ECERS), the Infant Toddler Environment Rating Scale (ITERS), or
the Family Day Care Environment Rating Scale (FDCRS).
• In this small sample of PTQ programs and providers (34 providers), those who had
earned higher PTQ levels exhibited higher levels of assessed quality:
Table 3. Average global (overall) quality for providers at each PTQ level in Northeast Indiana
PTQ Level (# of providers) Global (Overall) Quality
Score (1-7)
Range of Quality Scores
Level 1 (15 providers) 3.8 2.4-4.9
Level 2 (12 providers) 4.7 3.3-5.5
Level 3 (7 providers) 5.1 3.4-6.8
Level 4 (2 providers) 5.7 5.6-5.7

PTQ Validity Report—10/23/07 9
Goal #2: Give parents tools to help determine the best quality program for their children.
• Parents were educated about the PTQ program in the following ways: PTQ brochures,
mass media campaigns, PTQ website, visibility at health, job, or diversity fairs, and
through the Early Childhood Alliance Child Care Resource and Referral.
Goal # 3: Support and recognize providers for quality care.
• Providers’ professional organization membership and participation increased in Northeast
Indiana, providing opportunities for providers to network and be recognized for their
accomplishments in achieving higher levels of quality.
• Family child care home providers in Northeast Indiana created an organization called
United Providers to continue networking and professional development opportunities and
provide stability and professionalism for the participants.
• Incentives such as discounts at training programs and retreats, free resource library cards,
delivery of materials from the Child Care Resource and Referral, discounts on books, and
recognition in a list of Paths To QUALITY participants distributed to parents and
businesses were utilized to encourage child care providers to participate and work toward
higher levels of quality.
Challenges for the PTQ program in Northeast Indiana
• Participation among family child care providers has required the greatest effort to
increase and maintain.
• Offering incentives to providers to participate in PTQ had the greatest impact on
increasing participation.
• Barriers of providers to advancing levels in PTQ included: development of policies,
completing voluntary participation, meeting education and training requirements of staff,
providing accessible appropriate learning materials especially in the area of language and
literacy, providing parent/teacher conferences, understanding and implementing a
developmentally appropriate curriculum, getting parents and advisory board involved in
the program, and the commitment to achieve and maintain accreditation.
• High levels of turnover, changing or increasing regulations, and the cost of providing
staff training were reported obstacles by early education programs in maintaining level
status.
• The most common reason for attrition from PTQ was due to programs closing. In
particular, family child care providers stopped offering care.
• Mentoring of programs and providers and teacher education and training had the greatest
impact on overcoming the barriers to level advancement.
Conclusions from PTQ pilot program in Northeast Indiana
The growth in participation rates and dramatic increases in levels by providers illustrate one
measure of success of the PTQ program. According to Early Childhood Alliance staff, it is
important that a rating system of this nature is a voluntary, strength-based system, and based on
relationship building. Relationships between providers and the child care resource referral staff--
in particular mentoring services and training opportunities-- became critical to the success of the
program. Increased participation in training and professional development events made the

PTQ Validity Report—10/23/07 10
greatest difference in helping providers advance to higher levels. ECA staff also suggested a
strong sense of identity with the PTQ program is important for providers’ sustained participation.
Overview of Results: 4C of Southern Indiana, Inc. Paths to QUAITY program
The following summary of results is based on a review of annual reports provided by 4C of
Southern Indiana, Inc. and by an external evaluation study conducted by Purdue University the
Purdue University Early Child Care Quality Initiative (ECCQI) evaluation study4 and funded by
the Welborn Baptist Foundation, Inc. Each of the 3 main goals of PTQ is addressed in this
summary of PTQ outcomes. (For a more detailed summary report of the 4C of Southern Indiana,
Inc. Paths program and results, see Appendix 3, “Paths to QUALITY Pilot Program: 4C of
Southern Indiana, Inc.”)
Goal #1: Raise the quality of child care and early experiences for children.
• Using informal “word of mouth” advertising techniques, 4C was able to recruit 177
programs registering for PTQ during the first 9 months the program was operational.
• There has been a small increase in the number of family home providers and licensed
centers achieving national accreditation.
• The Purdue University ECCQI evaluation study found that the two most common kinds
of changes programs and providers implemented since joining Paths to QUALITY were:
1) classroom changes, such as adding materials, room arrangements and curriculum
changes, (66%) and 2) program administrative changes, such as parent contracts,
documentation and lesson planning, introducing primary caregiving and continuity of
care, writing strategic plans, instituting parent surveys and evaluations, joining
professional organizations (49%).
Similar to the Northeast Indiana programs, the providers in the 4C region experienced growth in
the number of programs enrolled in PTQ over the 2 ½ years of implementation (Table 4).
Table 4. Participation rates of PTQ in Southwest Indiana (% of providers eligible)
2005 2006 2007
(through
June 2007)
% of providers
registered with PTQ
30% 42% 46%
Licensed Centers 72% 89% 93%
Family Homes 20% 27% 31%
Registered Ministries 57% 71% 75%
Part time programs 36% 64% 67%

PTQ Validity Report—10/23/07 11
Providers often increased their levels in PTQ. During the first year of implementation (2005),
most of the providers entered at Level 1. However, within two years, more than half of the
providers were able to increase their levels.
• Overall in 2006, 36% of the registered programs (54 programs) increased at least one
level and 22% (40 programs) increased more than one level.
Table 5. 4C providers initial and current PTQ rating
Initial Rating Current Rating (July 2007)
Level 0 20% 10%
Level 1 64% 39%
Level 2 9% 23%
Level 3 3% 16%
Level 4 5% 12%
Similar to the Northeast Indiana programs, a small sample of providers in the 4C region also
participated in a mentoring program provided by 4C of Southern Indiana, Inc.. These programs
were part of the Purdue University evaluation of the mentoring program.
• The Purdue University ECCQI study found that providers who had earned higher PTQ
levels did exhibit higher levels of assessed quality:
Table 6. Average global (overall) quality for providers at each Paths to QUALITY level. (n=47)
Paths to QUALITY Level
(# of classrooms observed)
Average Global Quality
Score (1-7)
Range of
Quality Scores
Level 0* (3 classrooms/homes) 3.19 2.78-3.49
Level 1 (28 classrooms/homes) 4.45 3.41-5.26
Level 2 (11 classrooms/homes) 4.64 3.69-5.48
Level 3* (5 classrooms/homes) 4.35 2.88-5.67
*Notes: Level 0 includes only 1 center-based provider, the rest were family child care homes.
Level 3 includes only 2 center-based providers.
Level 4 providers did not participate in the mentoring program, so quality data were not available.
Goal #2: Give parents tools to help determine the best quality program for their children
• Strategies similar to those used in Northeast Indiana (PTQ brochures, visibility at health,
job, or diversity fairs, and through the 4C of Southern Indiana Child Care Resource and
Referral) were utilized to inform parents about PTQ.
PTQ Validity Report—10/23/07 12
Goal #3: Support and recognize providers for quality care
• 4C of Southern Indiana, Inc. hosted annual Leadership Retreats for child care program
directors and family child care providers, in response to providers’ requests to meet and
reflect upon different issues facing child care providers.
• Overall, evaluations of the first retreat were very positive, with 91% to 100% strongly
agreeing or agreeing that by attending the sessions they had obtained the skills and
knowledge necessary begin to bring about change.
• Ten months after the first retreat, while ratings were not as high as those collected
immediately afterwards, many participants still thought the sessions had been useful.
• Incentives such as materials to improve quality, scholarships, special project grants, and
recognition in a list of Paths To QUALITY participants distributed to parents and
businesses were utilized to encourage child care providers to participate and work toward
higher levels of quality.
Challenges for the PTQ program in Southwest Indiana
• The main challenge during the first year of implementation was adequately handling the
high level of interest in the program among child care providers. Staff members were
cross trained to register programs so the demand could be met.
• Some programs in this region were unable to meet Level 1 criteria. A majority of these
programs were registered ministries or part-time preschool programs. 4C staff designated
these programs as “Level 0,” remained committed and assisted them when possible in
achieving a Level 1 status.
• Barriers to providers to advance levels in PTQ included: implementing classroom
changes such as adding materials and room arrangements, implementing or adopting a
curriculum and lesson planning, and implementing administrative changes (developing
parent contracts, writing strategic plans, instituting parent surveys and evaluations),
joining professional organizations, and providing opportunities for more staff training
hours.
• The most common reasons given for attrition from PTQ was programs closing, having
license revoked, or lack of interest in continuing with the program.
• Mentoring, funding for developmentally-appropriate materials, and access to additional
training for the staff had the greatest impact on overcoming the barriers to PTQ level
advancement.
Conclusions from PTQ pilot program in Southwest Indiana
Information from the Purdue University ECCQI evaluation study and the annual reports of 4C of
Southern Indiana, Inc. indicate that the PTQ system has been successful and accepted by many
area child care providers. Because many providers enter Paths to QUALITY at Level 1 and then
progress relatively quickly to Levels 2 and 3, it is important that child care provider training and
support focus on nurturing environments for children, curriculum, staff and parents policies,
planning, and program evaluation, which are Level 2 and Level 3 criteria. However, there was
evidence that some providers may also need consistent support to maintain Level 1 health and
safety standards, so it is important to continue to be vigilant about these issues, even when
training with objectives focused on Level 2 or higher quality criteria.

PTQ Validity Report—10/23/07 13
General Conclusions: Indiana PTQ Pilot Programs
The growth in participation rates and increases in quality levels by providers illustrate the
success of the PTQ program in both regions. Both pilot programs reported similar successes and
challenges. Each found unique solutions to overcoming barriers of participation and
advancement. However, in both regions relationships between providers and the child care
resource & referral staff, in particular the mentoring services and training opportunities, were
reported to be critical to the success of the programs. Increased participation in training and
professional development events made the most difference in providers’ advancement in quality
levels. A strong sense of identity with the PTQ program for those providers participating was
also deemed important. Participation rates are only one indicator of success. An even more
important indicator of success was the quality level improvements that many participating
providers and programs have made.
The successes of PTQ pilot programs in Northeast and Southwest Indiana provide
encouragement for the development of a state wide quality rating system using the PTQ levels.
Based on the experience of these two pilot regions, it is important that a rating system of this
nature be a voluntary, strength-based system, and that it be based on relationship building. If
Paths to QUALITY continues to be successful in attracting broad participation, it will be
important for organizations that offer support and training to child care providers to coordinate
efforts. Paths to QUALITY can become a primary vehicle for motivating child care providers to
seek further education and to improve the quality of their services to children and families. If
quality early care and education is a value held by the larger community, there is a need for all
support organizations to coordinate efforts and invest resources in providers who are enrolled in
Paths to QUALITY.
There were three limitations of the regional PTQ data and this report: 1) the report relied heavily
on historical participation data collected by the PTQ sponsoring agencies; 2) there were
relatively few quality assessments conducted by external observers, which limits conclusions we
can draw about the relation between PTQ quality levels and other objective measures of quality;
and 3) there were no data available to address the question of whether PTQ quality levels
enhance children’s development and learning. These limitations should be addressed in the
evaluation of the statewide PTQ program.

PTQ Validity Report—10/23/07 14
What Are the Key Quality Indicators Contained in the Paths to QUALITY Levels?
In order to evaluate the scientific validity of the Paths to QUALITY standards, it was necessary
to identify key quality indicators or variables that are contained in the proposed standards. We
defined a “quality indicator” as something that:
1. is a concrete, observable, or otherwise documentable aspect of child care settings or
practices;
2. has been identified as a “best practice” in national policies or professional position
statements; and
3. has been evaluated specifically in the published scientific child care and early education
literature.
This was a necessary step in searching the scientific literature for evidence that the PTQ
standards are important aspects of care and education that contribute to children’s development
and learning. We found 10 important main quality indicators in the PTQ standards. For a
detailed summary of the 10 indicators and where they are found in the PTQ levels and criteria,
see Appendix 1., “Quality Indicators Contained in Paths to QUALITY.”
1) Regulation
Minimum standards for centers and family child care homes to legally care for
children. In Indiana this requires centers and homes to have a state child care license
or registration. Indiana also offers the Voluntary Certification Program for registered
ministries. The voluntary program consists of a list of guidelines in Health, Safety,
Food/Nutrition, Infant/Toddler care for registered ministries.
2) Teacher education and specialized training
The level or amount of formal education as well as informal training and workshops
through child care resource and referral offices, professional organizations, child care
resource and referral agencies, related to child development issues, working with
parents.
3) Structural quality
The features of the child care setting that are easily observable and regulatable, such
as teacher-child ratio, group size, and physical features of the classroom or family
child care home.
4) Process quality
The “process” aspects of the child care environment that reflect the child’s everyday
experience, including teacher-child interactions, children’s engagement in activities,
types of activities in the daily routine, the use of a developmentally appropriate
curriculum, language and literacy opportunities, and respect for diversity and
individual children and families.

PTQ Validity Report—10/23/07 15
5) Assessment
Authentic or naturalistic assessment methods are used for both child and program
assessment. Child assessment is a way of keeping track of each child’s progress and
also a way of individualizing teaching to meet each child’s needs. Program
assessment is focused on measuring program trends, quality, or effectiveness.
6) Provisions for children with special needs
The American with Disabilities Act (ADA) and the Individuals with Disabilities
Education Act (IDEA) ensure the civil and educational rights of people with
disabilities. IDEA states that children with disabilities should be provided with
accommodations to participate equally in all educational activities with their typically
developing peers. Accommodations or adaptations in child care include changes in
the physical environment, activities, and time.
7) Program policies and procedures
Program management practices include adequate and timely staff orientation, written
policies and procedures, accurate and updated records, an advisory board, annual
program evaluation by families and staff, strategic planning for the program including
short and long term goals, and teachers’ paid planning time.
8) Director professional development
The director or family child care lead caregiver maintains general skills through
continuing education and training opportunities to keep current with changing
practices in the child care profession. It can also include memberships in professional
organizations and participation in networking and mentoring activities with other
child care professionals.
9) Parent-teacher communication and involvement
Parents and providers share information on a regular basis about the child and the
program. All families are purposefully informed about and involved in program
activities. Families have opportunities to participate in planning and evaluating
curriculum and other activities for their child and the program.
10) Accreditation by NAEYC or other organizations
A voluntary process by which a representative body provides quality criteria
substantially beyond the mandatory requirements of the government (licensing or
registration). The most common accreditation body for child care centers is the
National Association for the Education of Young Children (NAEYC) and for family
child care homes the National Association of Family Child Care (NAFCC).

PTQ Validity Report—10/23/07 16
Paths to QUALITY Indicators: Evidence for Validity
Introduction
This section contains a summary of our analytic review of the 10 main “quality indicators” listed
above that provide a framework of standards for the Paths to QUALITY levels, as they are
addressed in the child care and early education scientific and professional literature. For each
quality indicator, we:
• Define the quality indicator; (What is it?)
• Identify Paths to QUALITY levels and criteria that include this indicator; (What
does Paths to QUALITY require?)
• Review available evidence for the importance of this indicator and its relation to
other measures of quality; (Is it important for child care quality?) and
• Review available evidence for the relation of this quality indicator to children’s
development and well-being. (Is it important for children’s developmental
outcomes?)
When evaluating the amount and quality of scientific evidence for each quality indicator, we use
the following phrases:
• “There is some or limited evidence…”
√ This means that there are at least one or two well-designed research
studies that support this conclusion.
• “There is a moderate amount of evidence…”
√ This means that there are 3 to 5 well-designed research studies that
support this conclusion.
• “There is substantial evidence…”
√ This means that this conclusion has been replicated more than 5 times in
the research literature in well-designed studies.

PTQ Validity Report—10/23/07 17
1) Regulation
What is “regulation”?
Regulation refers to state child care license regulations for family child care home and child care
centers as well as state registry regulations for child care ministries. In Indiana, the Family and
Social Services Administration (FSSA), Division of Family Resources (DFR), Bureau of Child
Care is the governing body that issues child care provider licenses. Child care ministries are
exempt from licensing, but must meet registered ministries regulations also governed by the
FSSA. Child care licensing and registration provide basic standards for centers and family child
care homes to legally care for children. Additionally, Indiana offers a Voluntary Certification
Program for registered ministries. The voluntary program includes a list of guidelines in Health,
Safety, Food/Nutrition, Infant/Toddler care for registered ministries.
Regulation: What does Paths to QUALITY require?
Level 1:
• The license issued by Family and Social Services Administration (FSSA), the
Division of Family Resources (DFR) is current and in good standing.
• The registration issued by the Family and Social Services Administration (FSSA),
the Division of Family Resources (DFR) is current and in good standing.
• The ministry meets all CCDF provider eligibility standards.
Why is regulation important for child care quality?
Regulation, specifically licensing standards, is related to other measures of child care quality
There is a substantial amount of evidence supporting that child care regulation is related to other
measures of child care quality.
� Centers in states with stricter child care licensing regulations provide better caregiver-
child ratios, employ caregivers with more education specific to early childhood, employ
more experienced directors, and have fewer poor quality centers. 5 6 7
� Family child care homes that are more regulated provide higher quality child care than
less regulated providers.8 9
� Family child care caregivers who are licensed provide higher quality care and are more
sensitive to the children in their care than those caregivers who are not licensed.10
� In an Indiana sample of all types of child care, licensed child care was consistently rated
higher in quality than unlicensed care.11

PTQ Validity Report—10/23/07 18
Regulation, specifically stringency of licensing standards is related to child development
outcomes
There is a substantial amount of evidence that child care regulation is related to child outcomes.
� Children cared for in centers in states with more stringent regulations score higher on
tests of school readiness, language comprehension, and social behavior.12
13
� As centers conform to stricter child care regulations, children’s performance on
developmental assessments increases.14

PTQ Validity Report—10/23/07 19
2) Teacher/Caregiver Education & Training
What is “teacher education and training”?
Teacher education and training refers to formal education as well as less formal non-credit
training and workshops through child care resource and referral agencies, professional
organizations, and child care resource and referral agencies. Education and training provide
adults with knowledge and skills required to teach and care for children. The level of education
and specialized training in early childhood education/child development and the hours of annual
teacher training are related and are often included as one dimension of “structural” child care
quality.15
(We discuss other aspects of structural quality below, but devote this section to teacher
education and training, because it is an especially important quality indicator.)
Teacher education and training: What does Paths to QUALITY require?
Level 2:
• 25% of teaching staff have either a Child Development Associate credential (CDA) or
equivalent certificate, OR an early childhood degree or equivalent degree, OR have
completed 45 clock hours of educational training leading to an Early Childhood/Child
Development degree or CDA credential.
• Lead Caregiver will have a current CDA or equivalent certificate, OR an early childhood
degree or equivalent degree OR have completed 45 clock hours of educational training in
early childhood education within the past three years leading to a CDA or an early
childhood/ child development degree.
• Staff/assistants are trained on the Foundations to the Indiana Academic Standards for
Young Children Age Birth to Five.
• At least 50% of teaching staff/caregivers participate annually in a minimum of 15 clock
hours of educational or in-service training focused on topics relevant to early childhood.
Level 3:
• 50% of teaching staff have a CDA or equivalent certificate, an early childhood degree or
equivalent degree, OR completed 60 clock hours of educational training leading to an
early childhood/child development degree or CDA credential.
• Lead Caregiver will have a current CDA or equivalent certificate, OR and early
childhood degree or equivalent degree; OR have completed 60 hours of educational
training leading to an early childhood/child development degree or CDA credential
within the past three years.
• At least 50% of teaching staff/caregivers participate annually in a minimum of 20 clock
hours of educational or in-service training focused on topics relevant to early childhood.
Level 4:
• Lead Caregiver has a current CDA or equivalent or ECE degree or an equivalent degree.

PTQ Validity Report—10/23/07 20
Why is teacher education and training important for child care quality?
Higher levels of teacher education and training are important contributors to high quality
early childhood education programs. There is a substantial amount of evidence supporting
that teacher education and training are related to other measures of child care quality.
• Family child care providers who have more years of formal education 16
and more
training hours provide higher quality of care as measured by the Family Day Care Rating
Scale —a widely used measure of global quality.17
18
19
• Family child care providers who have more years of formal education and have recent
and higher levels of training provide richer learning environments and warmer and more
sensitive care to children. 20
• Formal education (college degree) is a better predictor of high quality than training alone.
Family child care providers without a college degree who reported attending workshops
provided less sensitive and lower quality care than the caregiver with a college degree
who did not report attending workshops.21
• Child care center providers who attended workshops or professional meetings were rated
higher on global quality and caregiver sensitivity than those that did not attend such
workshops. 22
• A baccalaureate degree in early childhood education or related field has been found to be
the best predictor of higher quality caregiver skills 23
• Children whose teachers have at least a baccalaureate degree in early BA in early
childhood education or a Child Development Associate credential, have more creative
activities, higher frequencies of language play and positive management than children
whose teachers have a high school education only. 24
Higher levels of teacher education and training are related to better child development
outcomes.
There is a substantial amount of evidence that teacher education and training are related to child
outcomes.
• Children cared for by family child care providers who have more formal education and
more training scored higher on tests of language and cognitive development. 25
• Higher levels of teacher education are linked to children’s better academic skills.26
• Children whose teachers had more years of education gained more in math skills over the
pre-k year. 27
• Language scores among children in the preschool classes were significantly higher if
their teacher had a college degree in early childhood and attended a training workshop in
the community.28
• Baccalaureate level teachers with specialized training in early childhood education leads
to better outcomes for young children 29
30
31
• Infants and toddlers cared for my providers with specialized training in child
development or early childhood education were rated higher in social-emotional
competence by their parents.32

PTQ Validity Report—10/23/07 21
3) Structural Quality
Structural quality refers to those aspects of the child care environment and practices that are
easily observable or documented and thus are easy to check and regulate. We have already
discussed one important aspect of structural quality: teacher education and training. This
section covers other aspects of structural quality found in the PTQ quality levels: teacher/child
ratio; group size; program duration; and classroom environment features.

PTQ Validity Report—10/23/07 22
3a) Structural Quality: Teacher/Child Ratios
What are teacher/child ratios? What are licensing requirements?
Current Indiana rules require the following teacher/child ratios to meet licensing requirements
for licensed child care centers:
• 1 adult for every 4 infants (birth-12 months)
• 1 adult for every 5 toddlers (1-2 year olds)
• 1 adult for every 5 two year olds
• 1 adult for every 10 three year olds
• 1 adult for every 12 four year olds
• 1 adult for every 15 five year olds
Family child care providers who operate small homes may care for 6 to 11 children, plus 3
school-aged children. The maximum number of infants/toddlers to one provider is six children
under the age of 2, with 2 or more 16 month olds and walking.
In large family child care homes, providers may care for 13-16 children. The maximum number
of children per one provider in large family homes is 4:1 for infants; 6:1 for birth–2-years, with 2
or more 16-month old and walking; 10:1 for birth–6-year olds, with no more than 3 under 16-
months; and 12:1 for 3 year olds and older.
What does Paths to QUALITY require?
• Level 1: Family child care homes and licensed child care centers have their license.
Registered ministries must comply with the Voluntary Certification Program, which
aligns their ratio requirements with licensed centers.
Why are teacher/child ratios important?
There is a substantial amount of evidence supporting that teacher/child ratios are related to other
measures of child care quality.
• The NICHD Early Child Care Study, the most comprehensive national study of children in child
care to date, plus other studies show that caregiver/child ratio is one of the most important
structural characteristic of center-based care, particularly for younger children.33
34
35
• One study of child care centers in three states found that, among several structural
characteristics examined, teacher/child ratios were the only factor other than teacher wages
that predicted the quality of preschool classrooms.36
• Caregivers with fewer children in their care are more sensitive, responsive, warm, nurturing,
and encouraging toward the children; exhibit more positive and less negative affect; exert
less negative control; and provide more varied and developmentally appropriate activities for
the children than caregivers with more children in their care.37

PTQ Validity Report—10/23/07 23
• Lower teacher/child ratios allow caregivers to engage in more educational activities (e.g.,
teaching, promoting problem-solving) with children.38
Lower teacher/child ratios are associated with improved child development outcomes.
There is a substantial amount of evidence that teacher/child ratios are related to child outcomes.
• Lower teacher/child ratios are associated with less distress in toddlers, less apathy and
distress in infants and greater social competence.39
• Lower teacher/child ratios are associated with more verbal communication between
caregivers and children, which appears to foster language development in children.40
PTQ Validity Report—10/23/07 24
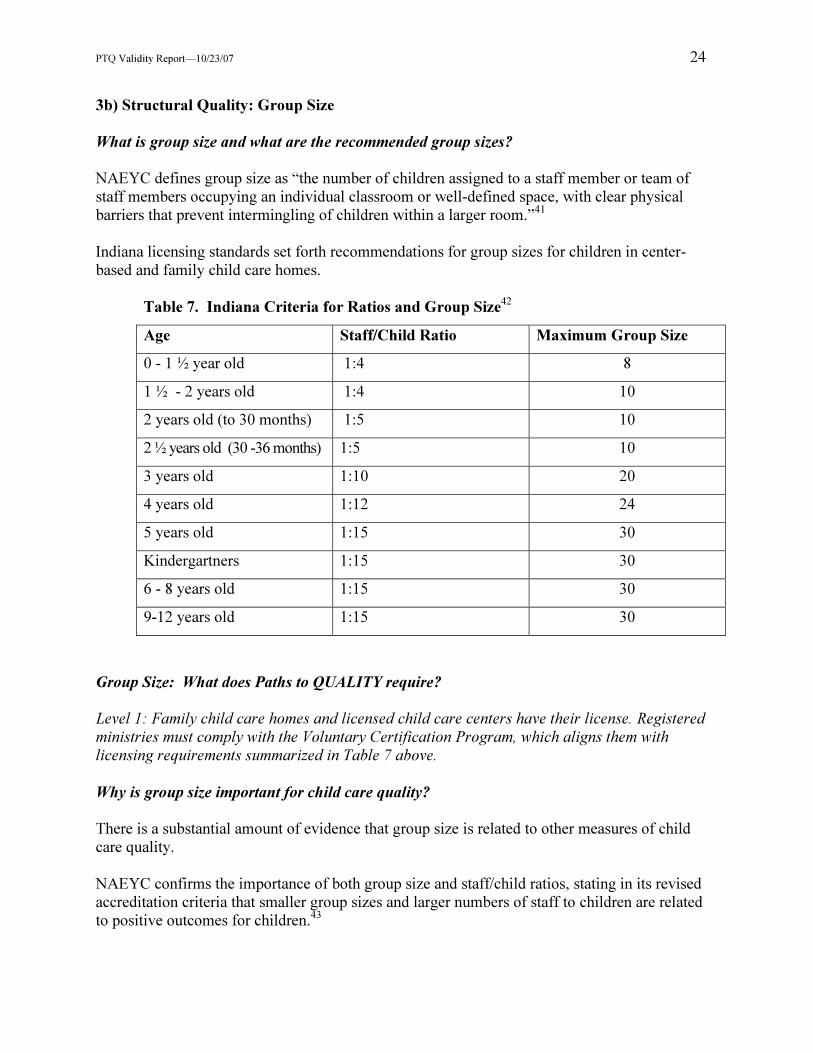
3b) Structural Quality: Group Size
What is group size and what are the recommended group sizes?
NAEYC defines group size as “the number of children assigned to a staff member or team of
staff members occupying an individual classroom or well-defined space, with clear physical
barriers that prevent intermingling of children within a larger room.”41
Indiana licensing standards set forth recommendations for group sizes for children in center-
based and family child care homes.
Table 7. Indiana Criteria for Ratios and Group Size42
Age Staff/Child Ratio Maximum Group Size
0 - 1 ½ year old 1:4 8
1 ½ - 2 years old 1:4 10
2 years old (to 30 months) 1:5 10
2 ½ years old (30 -36 months) 1:5 10
3 years old 1:10 20
4 years old 1:12 24
5 years old 1:15 30
Kindergartners 1:15 30
6 - 8 years old 1:15 30
9-12 years old 1:15 30
Group Size: What does Paths to QUALITY require?
Level 1: Family child care homes and licensed child care centers have their license. Registered
ministries must comply with the Voluntary Certification Program, which aligns them with
licensing requirements summarized in Table 7 above.
Why is group size important for child care quality?
There is a substantial amount of evidence that group size is related to other measures of child
care quality.
NAEYC confirms the importance of both group size and staff/child ratios, stating in its revised
accreditation criteria that smaller group sizes and larger numbers of staff to children are related
to positive outcomes for children.43

PTQ Validity Report—10/23/07 25
• Research on child care classrooms indicates that when groups are smaller, teachers
provide more stimulating, responsive, warm, and supportive interactions. They also
provide more individualized attention, engage in more dialogues with children, spend less
time managing children and more time in educational activities.44
45
Smaller group sizes are related to improved child development outcomes.
There is a substantial amount of evidence that group size is related to child outcomes.
• The increased interaction and communication made possible in smaller classes have been
shown to affect children’s outcomes. Children in smaller groups were more likely to
participate in child-initiated activities are experiences. In addition, when there are fewer
children in the room, teachers can more closely mediate children’s social interaction.46
• In the National Day Care Staffing study, children in smaller classes had greater gains in
receptive language, general knowledge, cooperative behavior, and verbal initiative, and
showed less hostility and conflict in their interactions with others.47

PTQ Validity Report—10/23/07 26
3c) Structural Quality: Program Duration
What is program duration?
Program duration refers to how long the site has been in operation. NAEYC guidelines require
that licensed child care programs have been in operation for at least one year before a center can
become eligible for the accreditation process.48
NAFCC guidelines state that the provider must
have at least 18 months experience as a family child care provider before the observation visit or
12 months experience if home visits are conducted monthly and intensive training is received.49
Program Duration: What does Paths to QUALITY require?
Level 3:
• Program has been in operation for a minimum of one year.
• Lead Caregiver has at least 12 months experience in a licensed or Bureau of Child Care
nationally recognized accredited child care setting as a child care provider.
Why is program duration important?
There is limited and conflicting evidence that program duration, at least as reflected by the child
care provider’s years of experience, is related to other measures of child care quality or child
development outcomes.
• Some research has suggested that child care teachers with more experience are warmer
and more responsive to young children.50 51
• However, other research did not replicate these findings and years of caregiver
experience was not associated with more responsive care for young children.52 53

PTQ Validity Report—10/23/07 27
3d) Structural Quality: Classroom environment
What are classroom environment features?
Classroom environment features refer to the space and materials that children have available and
accessible to them throughout their day in child care.
Classroom Environment Features: What does Paths to QUALITY require?
Level 2: The classroom is arranged and utilizes plentiful materials and activities in order to
provide various age- and developmentally-appropriate interest centers that invite children’s
exploration. Indicators include:
Reading:
• Books, soft washable seating/pillows for use while reading
Writing:
• Writing tools, paper, envelopes, typewriter, letters, numbers
Art:
• Drawing materials (crayons, markers, thick pencils, variety of paper, sizes and types, not
coloring books or dittos/worksheets)
• Painting materials
• Tools (scissors, hole punch, tape), staplers for school-age children
• Three-dimensional materials (play dough, clay with tools)
• Collage materials (catalogs, magazines, paper scraps, fabric pieces, string, yarn, cotton
balls, pipe cleaners, craft sticks)
Blocks:
• Different size/types of blocks and accessories such as small people, animals, vehicles,
road signs, and materials to enhance building, sticks, stones, tape, string, craft sticks,
interlocking blocks.
Dramatic Play:
• Dress-up clothes, such as work boots, high heels, a variety of hats, career
gear/attire/uniforms, purses, billfolds and multi-cultural outfits. Other items would also
include large pieces of fabric/scarves, child-size play furniture, dishes, pots, pans, dolls
(multicultural dolls included), dollhouse or other play-sets, accessories for dolls, and
“props” for different themes.
Math/Numbers:
• Small objects to count/sort/classify, measuring tools (scales, rulers), numbers/shapes,
number games, puzzles and pattern blocks

PTQ Validity Report—10/23/07 28
Music and Movement:
• Audio equipment, variety of tapes/CDs, music boxes, musical toys, and instruments,
dance props such as scarves/streamers.
Nature and Science:
• Collections of natural items (shells, rocks, flowers, bugs), living plants, pets to care for,
science games, toys, magnets, magnifying glasses, cooking opportunities.
.
Small Motor/Manipulative:
• Blocks, puzzles, crayons, pencils, scissors, interlocking blocks and other small building
toys, pegboard and pegs, games, counting materials, sorting or classifying materials and
containers.
Specific Infant/Toddler indicators include:
� Open spaces for exploring and protected play.
� Infants and toddlers are provided a variety of outdoor play experiences.
� Soft, washable elements, such as cuddle toys, soft furniture or cushions.
� Enough materials to avoid problems with children making the same toy choice and
waiting.
� Materials are organized consistently on low, open shelves for independent use by
children.
� Materials are sturdy and in good condition.
� A variety of open-ended, washable toys, such as rattles, teethers/rings, balls, pop beads,
nesting toys, containers, cuddle toys, push/pull toys are available.
� Low, stable furniture is available for children to pull themselves up.
� Furniture adapted for toddlers is available.
Toddler activities include building, pretending, experiencing art materials, enjoying stories and
books, playing with toys, exploring sensory materials, having fun with music and movement.
Why are classroom environment features important?
Features such as books, art materials, music materials, dramatic play, blocks, fine motor
materials, sensory play, math/number, and nature and science activities are all important features
of a quality child care environment that enhance children’s learning. Classroom environments
are important to provide various age- and developmentally-appropriate materials that invite
children’s exploration of their environment.

PTQ Validity Report—10/23/07 29
Classroom environment features have been identified as important dimensions of quality.54
There is substantial evidence that these classroom environment features are central to child care
quality.
• Classroom environmental features weigh heavily in the ECERS-R, ITERS-R, and
FCCERS, which are the child care environmental rating scales used in research to
measure overall child care quality in preschool centers, infant centers, and homes.
• Spacious child care centers appear to be associated with focused solitary play, while the
presence of a variety of age-appropriate materials and the arrangement of the space to
accommodate group size, seems to influence social problem-solving skills.55
• Some research has shown that more stimulating care is associated with centers and homes
with better organized space and more varied materials.56
• The quality of the physical space and materials provided is believed to affect both the
level of children’s involvement and the quality of interactions between children and
adults.57
There is limited evidence that varied and appropriate classroom materials support children’s
development.
• Better cognitive and social skills have been observed in children whose centers were
more orderly, had more varied and stimulating materials, and were organized into activity
areas.58

PTQ Validity Report—10/23/07 30
4) Process Quality
“Process quality” refers to the child’s direct everyday experiences in the child care setting.
Relationships and interactions between children and teachers or caregivers, active engagement in
daily activities, a variety of developmentally-appropriate activities in an organized curriculum,
and attitudes toward diversity are all part of process quality.
PTQ Validity Report—10/23/07 31
4a) Process Quality: Teacher-Child Interactions
What are teacher-child interactions?
Teacher-child interactions are at the heart of relationship-based care. Interactions occur during
routine care, free play and group activities. The amount and type of interactions can impact
young children’s development, and teachers need to be actively involved and sensitive when
interacting with young children.
Teacher-Child Interactions: What does Paths to QUALITY require?
Level 2: Classroom environments are welcoming, nurturing and safe for children to have
interactions and experiences that promote the physical, social and emotional well being of
children. Indicators include:
Why are teacher-child interactions important?
Relationships that young children develop with adults are crucial to early learning and
development. Positive relationships formed through warm, sensitive, and responsive care help
children feel valued and gain more from their learning experiences. Children need positive
relationships so that they feel comfortable and learn how to cooperate with others.
The National Association for the Education of Young Children (NAEYC) suggests that teachers
should "accept responsibility for actively supporting children's development" and that this active
involvement should occur in the context of a solid understanding of children's individual needs
and interests.59
There is substantial evidence that the quality of teacher- child interactions contributes to
quality in early care and education settings.60
• Researchers have demonstrated that sensitive, involved care is related to positive
outcomes for both children and classrooms. Studies have shown that the amount and type
of adult involvement is related to overall classroom quality.61
• Some researchers have found that teacher education (one quality indicator) is related to
more responsive care in both center-based care and family child care providers.62
There is substantial evidence that children with involved and responsive caregivers fare better
on a wide variety of child development measures.
• Children with more involved and responsive caregivers are rated as more sociable and
considerate by parents and teachers63
, display more exploratory behaviors64
, are more
positive65
, engage in more complex play66
, are better adjusted67
and have better peer
relations.68

PTQ Validity Report—10/23/07 32
4b) Process Quality: Children’s Active Engagement
What is active engagement?
Active engagement is providing opportunities for young children to freely choose their activities
to explore their environments and interact with different peers. Children learn best when they are
able to experience the world through a variety of learning materials and when the teacher
expands their learning.
Children’s Active Engagement: What does Paths to QUALITY require?
� Level 3: Children are actively engaged throughout the day in making choices of activities
and materials.
Why is active engagement important for child care quality?
During the preschool years and early primary grades, children learn best through active, engaged,
meaningful experiences. Through these experiences, young children construct their own
knowledge by interacting with their environments and others.69
The National Association for the Education of Young Children confirms the importance of
direct, first-hand, interactive experience in their position statement on developmentally
appropriate practice in early childhood programs.70
• Children under age three learn about themselves and their world by experiencing the
environment with all their senses — seeing, tasting, hearing, smelling, and feeling — and
by moving around their environment as they develop the ability to crawl and walk.71
• Preschool children are active and social individuals who have lots of ideas they want to
try out and share. Preschoolers benefit most when offered a variety of activity choices
such as dramatic play, block building, art, table toys, sand and water, cooking, music and
movement, and a rich selection of books.72
There is a moderate amount of evidence that children who are encouraged to be active
learners develop critical thinking skills and social competence.
• Findings from the Perry Preschool Study demonstrate that when an early childhood
education program emphasizes choice and active learning rather than direct teaching and
drills, children's acquisition of basic skills and their social competence are enhanced.73
• Graduates of the high-quality, active-learning preschool program, who are now in their
late twenties, are significantly more likely to have completed a higher level of schooling,
to be employed, to own their own home, and to be in stable relationships, and
significantly less likely to have needed social services or to have been arrested, than their
peers who attended academically and highly structured preschools.74

PTQ Validity Report—10/23/07 33
4c) Process Quality: Child-Initiated and Teacher-Directed Activities
What Are the Child-Initiated and Teacher-Directed Activities?
• Child-initiated activities are based on Piaget’s theory of development and a belief that a
child should learn through an active process involving exploring the environment.
Children learn concepts and skills through self-directed actions facilitated by a teacher.
Teachers facilitate learning by providing children with a wide variety of experiences and
by encouraging children to choose and plan their own activities. Child-initiated activities
are interesting and engaging, and the difficulty level is suitable for the child.
• Teacher-directed activities are pre-planned and sometimes scripted to assure consistency
in implementation across teachers. Teachers decide what concepts and skills children
need to acquire and deliver what was planned. This approach focuses primarily on
academic instruction, often to practice specific skills used in reading, language, and math.
Child-Initiated and Teacher-Directed Activities: What Does Path to QUALITY Require?
Level 2:
• Daily schedule provides ample time for child-directed choices with activities and
materials that are geared to the age, interests, and abilities of each child.
Level 3:
• Children are actively engaged throughout the day in making choices of activities and
materials.
Why are Child-Initiated or Teacher-Directed Activities Important for Child Care Quality?
There is limited evidence supporting that child-initiated activity is related to global
measures of child care quality.
• At care-oriented centers (low quality), children spend more time in adult-directed group
and non-play activities than children at the educationally-oriented child care centers
(higher quality)75
There is a substantial amount of evidence that child engagement in the child-initiated
activities is related to more favorable child outcomes.
• Preschool children in child-initiated classrooms demonstrate greater mastery of basic
skills that include verbal, math, social skills than children in programs in which
academics are emphasized and skills are directly taught by teachers76
. This trend is
consistent across countries77
.
• Children are more motivated toward tasks78
and more likely to engage in challenging
tasks when the tasks are child-initiated79
.

PTQ Validity Report—10/23/07 34
• There is evidence that the teacher-directed instruction approach produces higher
academic gains for children with disabilities80
. However, other researchers argue that this
effect is temporary and should be weighed in light of evidence for possible negative
consequences for social development.81

PTQ Validity Report—10/23/07 35
4d) Process Quality: Activities in the Daily Routine
What are the activities in the daily routine in child care?
The activities that may be found in the daily routine in child care include the followings82
;
• Games (informal games, games with rules)
• Pretend (transformation of objects, people, events so that their meaning takes precedence
over reality)
• Movement/gross motor activity (large muscle movement, purposeful movement and
cruising)
• Manipulation (mastering and refining of manual skills that require coordination of the
hand/arm and the senses)
• Puzzle/construction (use of materials with design constraints, large- and small-scale
construction)
• Non-involvement (child stands around gazing with no interest in any activity or waiting
for an adult or another child or roaming)
• Domestic activity (lunch and snack time activities, use of the bathroom, changing shoes,
etc.)
• Observation (task-related and non-task-related observation),
• Art and music (singing songs, painting, cutting and pasting, dancing and movement,
drawing, playing instrument)
• Language (reading, writing, story-telling, conversation with peers or teachers, alphabet or
phonological game)
• Math activities (activities involving calculations, number symbols and number concepts).
Activities in Daily Routine: What does Paths to QUALITY require?
Level 2:
• Daily schedule provides ample time for child-directed choices with activities and
materials that are geared to the age, interests, and abilities of each child.
Level 3:
• Children’s physical, cognitive, language, literacy, math, and creative development are
supported.
Why are activities in the daily routine important for child care quality?
There is limited evidence that more and higher level activities in the daily routine are linked to
better quality of child care.
• When children are in classrooms with lower teacher-child ratios (one quality indicator)
the classrooms are also likely to be rated as good or very good in caregiving and
activities. Children in classrooms with smaller group sizes (another quality indicator) are
also more likely to be rated higher in involvement with activities.83

PTQ Validity Report—10/23/07 36
• In child care centers obtaining high scores on global quality measures, children have been
observed participating in more activities associated with early reading, emergent writing,
and active listening. Children in centers rated lower in overall quality participated in
more activities associated with physical and creative development.84
There is substantial evidence that more and higher level activities in the daily routine are
linked to better child development outcomes.
• Children in classrooms rated as good or very good in caregiving are more likely to be
securely attached to teachers. Securely attached children are more competent with peers85
• Child language scores improve when the predominant type of activity in settings is free
choice. Their cognitive performance improves as children spend less time in whole group
activities led by the teacher, more time in small group activities, and the variety of
equipment and materials available increases. These findings are consistent across 10
countries86
• There were significant differences in characteristics of children's speech during free
choice activities, routine activities, and teacher-guided activities. Children spoke
significantly more, used more complex utterance and clauses, and used their language
more frequently in symbolic and regulatory ways during free-choice activities, as
compared to routine and guided activities87
.
• Complex interactions with objects occur more often in dramatic play activities and, when
a teacher was present, in art activities. Complex interactions with peers was rare in
general, but was most likely when children were engaged in activities with one child or
with a group of children. Complex teacher behavior was most probable when children
were alone with a teacher and in dramatic play activities.88
• On the playground, children with or without disabilities are likely to engage in
cooperative play only with other typically developing children during complex activities
(e.g., playing with toys in the sand or talking). Children with or without special needs
tend to engage in more cooperative play in inclusive groups during less complex or low-
demand activities, involving mostly gross motor skills (e.g., running)89
.

PTQ Validity Report—10/23/07 37
4e) Process Quality: Developmentally- Appropriate Curriculum
What is curriculum?
Curriculum contains goals, content, and instructional practices. An effective and
developmentally-appropriate curriculum:
• addresses multiple areas of learning and development
• ensures that children are active and engaged
• has goals that are clear and shared by all teachers
• is evidence-based
• enables children to learn through investigation, play and focused-intentional teaching
• builds on prior learning and experiences
• is comprehensive
• has demonstrated benefits for children.90
Curriculum: What does Paths to QUALITY require?
� Level 3: A written curriculum reflects program philosophy and goals and is based on child
development/appropriate practice. The program demonstrates a planned curriculum that
provides for the various ages, ability levels, and developmental stages of the children.
Why is curriculum important?
“Well- planned, evidence-based curriculum, implemented by qualified teachers who promote
learning in appropriate ways, can contribute significantly to positive outcomes for all children.”91
Developmentally-appropriate curriculum is a hallmark of high quality early childhood
education. There is a substantial amount of evidence that developmentally appropriate
curriculum is related to other measures of child care quality.
• A good, well-implemented early childhood curriculum provides developmentally
appropriate support and cognitive challenges and, therefore is likely lead to positive
outcomes.92
• Quality early childhood curriculums have a statement regarding the guiding philosophy,
goals and objectives, provide guidance about how to arrange the learning environment,
and include provisions for engaging parents.93
Developmentally-appropriate curriculum is associated with improved child development
outcomes. There is a substantial amount of evidence that a developmentally appropriate
curriculum is related to child outcomes.
• Researchers have found that young children with and without disabilities benefit more
from the curriculum when they are engaged or involved. Particularly for younger
children, firsthand learning—through physical, mental, and social activity—is key.94

PTQ Validity Report—10/23/07 38
• At every age from birth through age eight play can stimulate children’s engagement,
motivation, and lasting learning. Learning is facilitated when children can “choose from a
variety of activities, decide what type of products they want to create, and engage in
important conversations with friends”.95
96

PTQ Validity Report—10/23/07 39
4f) Process Quality: Language and Literacy Opportunities
What are the language- and literacy-learning opportunities in child care?
To a great extent, the language used by teachers and children in classrooms determines what is
learned and how learning takes place. The classroom is a unique context for learning and exerts a
profound effect on children’s development of language and literacy skills, particularly in the
early years. Some have argued that children should have significant opportunities to integrate
oral and written language in the classroom, because these experiences support and encourage the
development of literacy.97
Learning requires children’s interaction and engagement in classroom
activities -- engaged children are motivated to learn and have the best chance of achieving full
competence across the broad spectrum of language and literacy skills.
Language- and Literacy-Learning Opportunities: What does Paths to QUALITY require?
Level 2:
• Daily schedule provides ample time for child-directed choices with activities and
materials that are geared to the age, interests, and abilities of each child.
• Children are read to daily and encouraged to explore books and other print materials.
Level 3:
• Children’s physical, cognitive, language, literacy, math, and creative development are
supported.
Why are language-and literacy learning opportunities an important aspect of child care
quality?
There is a moderate amount of evidence that more and higher level language- and literacy-
learning opportunities are more common in higher quality of child care.
• Higher rates of teachers’ pretend talk and “de-contextualized talk” (e.g., relating the topic
to the child’s past experiences) and higher ratings of richness of teacher talk are
associated with higher ratings of teachers’ sensitivity-responsiveness98
.
• Links between some child care quality measures (teacher education level, pedagogical
orientation, and activity settings) and the level of language stimulation teachers provide
to children have been found. More educated teachers, teachers whose pedagogical
orientations strongly support literacy or social development, and teachers who report
spending more time in small group activities engage in more cognitively challenging
conversations with children.99

PTQ Validity Report—10/23/07 40
There is substantial evidence supporting that more and higher level language- and literacy-
learning opportunities in child care are linked to better child development.
• Teacher's questions and responses encourage literary talk. Teacher talk serves to set the
climate for children’s engaged listening, encourages children to engage with the text, and
builds an environment that supports literacy development100
.
• More time spent in emergent code-focused activities is associated with increased scores
on alphabet and letter-word recognition by preschoolers. More time in meaning-focused
activities (e.g., book reading) is related to increased scores on vocabulary101
.
• Head Start teachers were trained to implement strategies about how to increase
opportunities for language and vocabulary development in children during book reading
and other classroom activities. Children in those teachers’ classrooms performed
significantly better than children in control classrooms on standardized vocabulary tests
at the end of the year102
.
• The amount of teachers' math-related talk is significantly related to increased
mathematical knowledge in children over the preschool year.103
• Although previous research suggests that high-level teacher talk is related to high-level
play with objects, the results in one study indicated that high-level teacher talk was
related to lower levels of play with objects and not at all related to play with peers104
.
• Many children from low-income families have limited access to opportunities to develop
language and literacy skills. By the age of 3, children in poverty are already well behind
their more affluent peers in their acquisition of vocabulary and oral language skills105
.
Classrooms serving low-income children often do not provide optimal support for
language and literacy learning106
. Limited access to reading materials and other literacy
opportunities contributes to children from low-income families not being able to acquire
the language and literacy skills needed for early school success107
.

PTQ Validity Report—10/23/07 41
4g) Process Quality: Diversity
What is diversity?
Diversity refers to basic differences among human individuals and more particularly among
those in diverse social-cultural groups. These differences may range from those commonly
labeled biological (e.g., skin color), to those recognized as social (e.g., language, religion, socio-
economic status, etc.)108
.
Diversity has been measured in many different ways in the early childhood literature. Much
child development and child care research on diversity has investigated whether standard
measures of quality relate to child outcomes differently depending on the ethnicity of the child,
the match between the child’s and caregiver’s ethnicity, and the match between parent’s and
caregiver’s beliefs about child-rearing.109
Diversity: What does Paths to QUALITY require?
Level 2:
• Classroom environments are welcoming, nurturing and safe for children to have
interactions and experiences that promote the physical, social and emotional well being
of children.
Level 3:
• The learning environment is developmentally and culturally appropriate and meets any
special needs of the children.
Why respect for diversity is important?
There is substantial evidence that diversity is related to child development and child care
quality.
• The quality of child care is more strongly associated with child outcomes for children of
color110
or children experiencing risk factors (e. g., low parental education, single parent,
and poverty) than for middle-class white children111
. One experimental early intervention
study112
found that high quality child care enhances cognitive development of children at-
risk, and such effects continue to adulthood. This finding supports the general idea that
quality child care quality is especially important when children experience discrepancies
between care at home and at the child care setting.
• However, other studies failed to find evidence for these moderating effects when
controlling for family or child characteristics such as family income and child gender113
.
Some others think that it will be even harmful to child development when children
experience discontinuities between home and child care in child-rearing beliefs and
practice114
.

PTQ Validity Report—10/23/07 42
• Other researchers found that at-risk children from diverse cultural backgrounds benefited
from sensitive and stimulating caregiving measured by standard assessment tools,
especially when child care quality was reflected in practice that is similar to the
children’s ethnic communities115
.
There is limited evidence that respect for diversity is related to child development.
• The findings of an evaluation of a pilot educational program using a variety of activities
that intended to increasing children’s awareness of and respect for diversity indicated that
this program was found to increase the children’s general awareness of and positive
attitude toward diversity and their ability to recognize instances of exclusion116
.
PTQ Validity Report—10/23/07 43
5) Assessment
What is “assessment?”
Assessment is used in two important ways by early childhood educators117
:
� Child assessment is a way of keeping track of each child’s progress in an educational
program and also a way of individualizing teaching to meet each child’s needs. There are
two primary reasons to do child assessment: to improve children’s learning, or to identify
children with special needs.118
� Program assessment is focused on measuring program trends, quality, or effectiveness.
It used to determine whether a child care center or family child care home is providing
the level of quality that is desired, or to determine whether the program is being effective
at meeting it’s goals and objectives. There are three types of program assessment:119
Assessment: What does Paths to QUALITY require?
Level 3:
� Assessment is appropriate to the curriculum and focuses on children’s strengths.
Assessment may include portfolios, conversations, anecdotal notes, and developmental
notes.
� Program evaluation is completed annually by families and staff.
Level 4:
� Accreditation requires centers and homes to have a planned system of developmental
screening, assessment of child development, and an annual plan for program evaluation.
� NAEYC center accreditation standards require that the “program is informed by ongoing
systematic, formal, and informal assessment approaches to provide information on
children’s learning and development. These assessments occur within the context of
reciprocal communications with families and with sensitivity to the cultural contexts in
which children develop. Assessment results are used to benefit children by informing
sound decisions about children, teaching, and program improvement.”120
Why is assessment important in child care?
Developmentally-appropriate assessment is a hallmark of high quality early childhood
education.
� The National Association for the Education of Young Children recommends that “ethical,
appropriate, reliable assessment be a part of all early childhood programs.”121

PTQ Validity Report—10/23/07 44
� High-quality programs are “informed by ongoing systematic, formal, and informal
assessment approaches to provide information on children’s learning and development.
These assessments occur within the context of reciprocal communications with families
and with sensitivity to the cultural contexts in which children develop.”122
There is moderate amount of evidence that developmentally-appropriate assessment is
associated with improved child development outcomes.
� Authentic assessments involving observations of children’s naturally-occurring activities,
such at the Work Sampling System123
, give teachers and parents an accurate picture of
each child’s progress developmentally and in relation to the objectives of the early
childhood curriculum.
� “Research demonstrates that early identification and intervention for children with or at
risk for disabilities can significantly affect outcomes.”124
� “Children with disabilities benefit from in-depth and ongoing assessment, including play-
based assessment, to ensure that their individual needs are being met.”125

PTQ Validity Report—10/23/07 45
6) Provisions for children with special needs
What Are Plans and Accommodations for Children with Disabilities?
The American with Disabilities Act (ADA) and the Individuals with Disabilities Education Act
(IDEA) ensure the civil and educational rights of people with disabilities. The ADA is a
comprehensive civil law protecting individuals with disabilities from discrimination. It prohibits
discrimination in public accommodations that include private programs, family child care homes,
child care centers, and after-school programs for children.
IDEA states that children with disabilities should be provided with accommodations to
participate equally in all educational activities with their typically developing peers. The
accommodations or adaptations include changes in the physical environment, activities, and
time.
Plans and Accommodations for Children with Disabilities: What Does Path to QUALITY
Require?
Level 2:
• Classroom environments are welcoming, nurturing and safe for children to have
interactions and experiences that promote the physical, social and emotional well being
of children.
Level 3:
• The learning environment is developmentally and culturally appropriate and meets any
special needs of the children.
Why Are Plans and Accommodations for Children with Disabilities Important?
There is a moderate amount of evidence that plans and accommodations for children with
disabilities are linked to child care quality.
• Six months after a training program designed to help family child care home providers
work with children with disabilities, caregivers' attitudes toward children with
disabilities, knowledge about programming for children, and utilization of physical space
for enhancing child development improved.126
• Caregivers serving in inclusive child care rate themselves higher on most quality-related
indicators than caregivers in non-inclusive settings. Observed quality was lower in
inclusive family child care homes, but higher in inclusive center-based classrooms for
preschoolers.127

PTQ Validity Report—10/23/07 46
There is substantial evidence that plans and accommodations for children with disabilities are
linked to child development.
• Children with disabilities benefit from participating in inclusive programs because they
are provided with role models to facilitate learning of adaptive skills, such as feeding,
dressing, and toileting, through observation and imitation128
.
• Children with disabilities in inclusive programs have more opportunities to practice
social interaction and develop friendships with typically developing peers, which helps
them prepare to live in the community129
.
• Both parents of children with disabilities and caregivers express concerns about children's
behavioral differences in inclusive care. But they also envision the possibility of
increased social opportunities in inclusive child care for children with disabilities.130
• Decreases in challenging behavior in children with developmental delays were observed
during free choice times. Free choice time was also related to an increase in independent
initiation for children who otherwise seldom initiated activities.131
PTQ Validity Report—10/23/07 47
7) Program policies & procedures
What are “program policies and procedures”?
Child care program policies and procedures include a variety of program management practices
that include adequate and timely staff orientation, written policies and procedures, accurate and
updated records, an advisory board, annual program evaluation by families and staff, strategic
planning including short and long term goals for the program and teachers paid planning time.
Program policies and procedures: What does Paths to QUALITY require?
Level 1:
• Staff members receive orientation within 30 days of being hired.
Level 2:
• Written policies and a child care contract is established and implemented with families.
• An advisory board is in place to provide input and support to the director
Level 3:
• Program evaluation is completed annually by families and staff.
• A strategic plan is completed and includes annual evaluation/ goal setting and long range
planning/goal setting.
At a minimum, the Lead Teacher receives paid planning time.
Why are program policies and procedures important?
In general, program policies and procedures are critical to maintain high quality early
childhood education.
No research has been conducted examining specific program policies and procedures and its
relationship to other measures of child care quality. However, there some evidence that the
implementation of program policies and procedures is related to other measures of quality.
Researchers have concluded that:
• Quality policies and procedures must be in place at the program level to promote and
maintain high quality interactions and learning environments at the classroom level.132
133
• Written policies and procedures are necessary for a program to set and achieve goals for
the program as well as the children and families they serve and in turn provide high
quality care.134
• NAEYC accredited centers tend to have better management and organizational policies
and procedures in place.135

PTQ Validity Report—10/23/07 48
• Improving director’s administrative and organizational skills has a direct impact on
policies and procedures and has a pronounced positive impact on teaching practices in the
classroom (staff-child interactions, classroom curriculum, classroom arrangement, health
and safety practices).136
In general, program policies and procedures are necessary for high quality child development
outcomes
No research has been conducted examining specific program policies and procedures and its
relationship to child development outcomes. However, there some evidence that having program
policies and procedures is related to child development outcomes. Researchers have concluded
that:
• Program management practices in early childhood program are essential for high
quality outcomes for children and families.137
138
139

PTQ Validity Report—10/23/07 49
8) Director professional development
What is “director/family child care lead caregiver professional development”?
Professional development includes maintaining general skills through continuing education and
training opportunities to keep current with changing practices in the child care profession. It can
also include memberships in professional organizations and participation in networking and
mentoring activities with other child care professionals.
Director/family child care lead caregiver professional development: What does Paths to
QUALITY require?
Level 1:
• The director has completed a Child Development Associate credential (CDA) or early
childhood degree or equivalent degree OR the director of the ministry agrees to obtain a
minimum of a CDA within three years of beginning Paths to QUALITY and shows
progression towards completion each year.
• The director of the ministry completes Safe Sleep Training.
Level 2:
• Director/Lead Caregiver receives orientation and trains staff on the Foundations to the
Indiana Academic Standards for Young Children Age Birth to Five.
• Director/lead caregiver is a member of a nationally recognized early childhood
organization.
Level 4:
• Director volunteers to informally mentor a program at a Level 1, 2, or 3.
Why is director/family child care lead caregiver professional development important?
In general, director/family child care lead caregiver professional development is a hallmark
of high quality early childhood education. There is substantial evidence that
director/family child care lead caregiver professional development is related to other
measures of child care quality:
• Advantages of being a member of an early childhood professional group include the
opportunity to network with other providers who are also caring for children, better
access to resources (newsletters, websites, and conferences).140
� Family child care providers who were affiliated with their local state family child care
association or the National Association for the Education of Young Children (NAEYC)
provided higher-quality care than nonaffiliated providers.141
� Family child care caregiver’s professionalism, level of planning, and commitment to the
child care field predicts higher-quality care.142

PTQ Validity Report—10/23/07 50
� The performance of the program director, particularly as it relates to providing leadership
in program functioning at the administration level and providing high quality supervision
and feedback, predicts program quality143
• The director sets the tone and climate of concern that is the hallmark of a quality
program.144
• Research examining mentoring has focused on caregivers rather than directors.
Mentoring programs that have paired caregivers with experienced child care educators
have been very effective in improving the overall quality of the classrooms as well as
making caregivers more sensitive to infants’ needs.145
There is limited evidence that director professional development is related to child
development outcomes.
• Child care directors who have more experience and education are more likely to
appropriately monitor staff, which promotes children’s health.146

PTQ Validity Report—10/23/07 51
9) Parent-teacher communication and involvement
Parents and providers share information daily and in scheduled conferences about the child and
the program. All families are purposefully informed about and involved in program activities:
Families have opportunities to participate in planning and evaluating curriculum and activities
for their child and the program.
Parent-teacher communication/involvement: What does Paths to QUALITY require?
Level 2:
Provide pertinent program information to families
• A system is in place for communicating pertinent information to families, daily and at
an annual family conference.
• Written policies and a child care contract is established and implemented with
families.
Level 3:
Facilitate family and staff/assistant input into the program:
• Program evaluation is done annually by families and staff.
• Families are made aware of the curriculum of the program through parent handbooks,
newsletters, orientation, and/or family meetings.
• All children and their families have equal opportunities to participate in classroom
and program activities.
Why is parent involvement and provider-parent communication important?
There is substantial evidence that parent involvement and parent-provider communication
important for high quality early childhood education.
• Parent involvement at all levels of education is now considered not only desirable but
essential to effective schooling.147
148
149
• The quality of parent-caregiver relationships in early care is associated with other quality
indicators, including caregiver education level and sensitivity with the child.150
There is substantial evidence that parent-involvement is related to child development
outcomes.
• Parent involvement is linked to children's school readiness. Research shows that greater
parent involvement in children's learning positively affects the child's school
performance, including higher academic achievement.151
152
153

PTQ Validity Report—10/23/07 52
10) Accreditation by NAEYC or other organizations
What is “accreditation”?
Accreditation is a voluntary process by which a professional body provides quality criteria that
are above the mandatory requirements of government-supervised licensing or registration. To
achieve accreditation, early childhood education programs volunteer to be measured against
rigorous national standards for education, health, and safety. Programs that participate and pass
the voluntary process are given a certification of accreditation. The most common accreditation
body for child care centers is from the National Association for the Education of Young Children
(NAEYC), and for family child care homes the most common accreditation is from the National
Association of Family Child Care (NAFCC).
Accreditation: What does Paths to QUALITY require?
Level 4:
• Accreditation by a nationally recognized accrediting body, approved by the State, has
been achieved and maintained.
Why is accreditation important?
Accredited child care centers and family child care homes provide higher quality care.
There is a substantial amount of evidence supporting that national accreditation is related to other
measures of child care quality.
� Accredited centers provide better staff-child ratios, employ staff with more education
specific to early childhood, employ more experienced directors, and provide more
developmentally appropriate activities for children than non-accredited centers.154
155
� Accredited centers provide better than average quality of care as measured by the Early
Childhood Environmental Rating Scale—a widely used measure of quality.156
� Accredited family child care caregivers provide higher quality care for children, have
higher education, participate in hours of training, and are more involved in professional
affiliations than non-accredited caregivers 157
158
159
Research has indicated that accredited programs are benefit children’s development.160
161
162
There is a moderate amount of evidence that national accreditation is related to child outcomes.
• National accreditation standards are based on developmentally appropriate practices
promoting better child development outcomes such as academic skills, creativity, and
social emotional outcomes.163
164

PTQ Validity Report—10/23/07 53
Conclusions: Validity of the PTQ Levels and Criteria
The pilot programs in northeast and southwest Indiana demonstrate that the PTQ system is
understandable to child care providers and provide preliminary evidence that when providers
reach higher levels, they are increasing the quality of care and education they provide. The pilot
programs do not provide data that answer the question, “Do children in child care with higher
PTQ levels develop or learn better?”
A thorough review of 10 main quality indicators (including 12 additional sub-indicators) within
the PTQ levels and standards revealed substantial scientific evidence for the validity of the PTQ
quality criteria. In most cases, PTQ key quality indicators were found to be significantly
associated with established measures of child care quality - 75% of the quality indicators we
examined had “substantial evidence” for their validity. In addition, most of the PTQ quality
indicators had significant evidence that they support children’s development. Overall, the PTQ
quality indicators have significant support for validity in the child development and early
education scientific literature. In addition, most of the PTQ standards have the support of
prominent early childhood education organizations, which have designated them as “best
practices.”
Based on this analysis of the results of the PTQ program as developed in its regional pilots and
based on existing evidence for the validity of proposed PTQ quality standards, we conclude that,
if implemented with diligence, care, and accountability in Indiana, the PTQ program has the
potential to increase quality in child care centers, child care ministries, and child care homes.
Further, as child care providers work and learn to increase their PTQ levels, we expect that
Indiana’s young children will benefit through increased support for their learning, development,
and everyday well-being.

PTQ Validity Report—10/23/07 54
Endnotes
1 National Child Care Information Center. (2007, April). Quality rating systems: Definition and statewide systems.
Retrieved September 21, 2007 from www.nccic.org/pubs/qrs-defsystems.html. 2 Ibid. 3 Child Care and Early Care Partnership Mission, 1996. 4 Elicker, J. & Ruprecht, K. (2007). Early Child Care Quality Initiative Final Evaluation Report, January to
December, 2006. Unpublished technical report, Purdue University, West Lafayette, IN. 5 Cost, Quality, and Child Outcome Study Team (1995). Cost, quality, and child outcomes in child
care centers: Technical report. Denver, CO: University of Colorado at Denver. 6 Gormley, W., Jr. (1998). Regulatory enforcement: Accommodation and conflict in four states. Public Administration Review, 58, 285-293. 7 Phillipsen, L, Burchinal, M. R., Howes, C., & Cryer, D. (1997). The prediction of process quality from structural
features of child care. Early Childhood Research Quarterly, 12, 281-303. 8 Galinsky E., Howes, C.,Kontos, S., & Shinn, M. (1994). The study of children in family child care and relative
care. New York: Families and Work Institute. 9 Raikes, H. A., Raikes, H. H., & Wilcox, B. (2005). Regulation, subsidy receipt and provider characteristics: What predicts quality in child care homes? Early Childhood Research Quarterly, 20, 164-184. 10 Burchinal M., Howes, C., & Kontos, S. (2002). Structural predictors of child care quality in child care homes.
Early Childhood Research Quarterly, 17, 87-105. 11 Elicker, J., Clawson, C., Hong, S. Kim, T., Evangelou, D., & Kontos, S. J. (2005). Community Child Care
Research Project Final Report. Child care for working poor families: Child development and parent employment outcomes. West Lafayette, IN: Purdue University. 12 Helburn, S., (Ed.) (1995, June). Cost, quality, and child outcomes in child care centers, technical report. Denver,
CO: Department of Economics, University of Colorado at Denver. 13 Phillips, D. A., Howes, C., & Whitebook, M. (1992). The effects of regulation and auspice on child care quality.
American Journal of Community Psychology, 20, 25-51. 14 Howes, C., Smith, E., & Galinsky, E. (1995). The Florida child care quality improvement study: Interim Report. New York, NY, Families and Work Institute. 15 Cost, Quality, and Child Outcome Study Team (1995). Cost, quality, and child outcomes in child
care centers: Technical report. Denver, CO: University of Colorado at Denver. 16 Raikes, H. A., Raikes, H. H., & Wilcox, B. (2005). Regulation, subsidy receipt and provider characteristics: What
predicts quality in child care homes? Early Childhood Research Quarterly, 20, 164-184. 17 Raikes, H. A., Raikes, H. H., & Wilcox, B. (2005). Regulation, subsidy receipt and provider characteristics: What predicts quality in child care homes? Early Childhood Research Quarterly, 20, 164-184. 18 Bordin, J., Machida, S., Varnell, H. (2000). The relation of quality indicators to provider knowledge of child
development in family child care homes. Child & Youth Care Forum, 29(5), 323-341. 19 Burchinal, M., Howes, C., & Kontos, S. (2002). Structural predictors of child care quality in child care homes.
Early Childhood Research Quarterly, 17, 87-105. 20 Clarke-Stewart, K. A., Vanell, D. L., Burchinal, M., O'Brien, M., & McCartney, K. (2002). Do regulable features of child-care homes affect children's development? Early Childhood Research Quarterly, 17, 52-86. 21 Burchinal, M., Howes, C., & Kontos, S. (2002). Structural predictors of child care quality in child care homes.
Early Childhood Research Quarterly, 17, 87-105. 22 Burchinal, M., Cryer, D., Clifford, R. M. (2002). Caregiver training and classroom quality in child care centers.
Applied Developmental Science, 6(1), 2-11. 23 Whitebook, M. (2003). Bachelor's degrees are best: Higher qualifications for pre-kindergarten teachers lead to
better learning environments for children. Washington, DC: The Trust for Early Education. 24 Howes, C. (1997). Children's experiences in center-based child care as a function of teacher
background and adult-child ratio. Merrill-Palmer Quarterly, 43(3), 404-425. 25 Clarke-Stewart, K. A., Vanell, D. L., Burchinal, M., O'Brien, M., & McCartney, K. (2002). Do regulable features
of child-care homes affect children's development? Early Childhood Research Quarterly, 17, 52-86. 26 National Institute of Child Health and Human Development, Early Child Care Research Network. (2002a). Child-
care structure → Process→ Outcome: Direct and indirect effects of child-care quality on young children’s
development. Psychological Science, 13(3), 199–206.
PTQ Validity Report—10/23/07 55
27 Early, D. M., Bryant, D. M., Pianta, R. C., Clifford, R. M., Burchinal, M. R., Ritchie, S., Howes, C., & Barbarin,
O. (2006). Are teachers' education, major, and credentials related to classroom quality and children's academic gains
in pre-kindergarten. Early Childhood Research Quarterly, 21, 174-195. 28 Burchinal, M., Cryer, D., Clifford, R. M. (2002). Caregiver training and classroom quality in child care centers.
Applied Developmental Science, 6(1), 2-11. 29 Barnett, W.S. (2003a). Better teachers, better preschools: Student achievement linked to teacher qualifications.
Preschool Policy Matters, 2. New Brunswick, NJ: NIEER. 30 Bowman, B., Donovan, M.S. & Burns, S. (Eds.) (2001). Eager to learn: Educating our preschoolers. National
Research Council, Committee on Early Childhood Pedagogy. Washington, DC: National Academy Press. 31 Howes, C. & Brown, J.. (2000). Improving child care quality: A guide for Proposition 10 commissions. In N.
Halfon, E. Shulman, M. Shannon, & M. Hochstein (Eds.), Building community systems for young children. Los
Angeles: UCLA Center for Healthier Children, Families, and Communities. 32 Elicker, J., Clawson, C., Hong, S. Kim, T., Evangelou, D., & Kontos, S. J. (2005). Community Child Care
Research Project Final Report. Child care for working poor families: Child development and parent employment
outcomes. West Lafayette, IN: Purdue University. 33 National Institute of Child Health and Human Development Early Child Care Research Network (2000).
Characteristics and quality of child care for toddlers and preschoolers. Applied Developmental Science, 4, 116-135. 34 deSchipper, E., Rieksen-Walraven, M., & Guerts, S. (2006). Effects of child-caregiver ratio on the interactions
between caregivers and children in child care centers: An experimental study. Child Development, 77, 861-864. 35 Howes, C. (1997). Children’s experiences in center-based child care as a function of teacher background and adult: child ratio. Merrill-Palmer Quarterly, 43, 404 – 425. 36 Clarke-Stewart,K.A.Gruber,C.P.& Fitzgerald,L.M.(1994).Children at home and in day care. Hillsdale, NJ:
Erlbaum. 37 Ghazvini, A., & Mullis, R. L. (2002). Center-based care for young children: Examining predictors of quality. The
Journal of Genetic Psychology, 163, 112 – 125. 38 Palmerus, K., & Hagglund, S. (1991). The impact of children/caregiver ratio on activities and social interaction in six day care centre groups. Early Child Development and Care, 67, 29-38. 39 Phillipsen,L.C.,Burchinal,M.R.,Howes,C.& Cryer,D.(1997).The prediction of process quality from
structural features ofchild care.Early Childhood Research Quarterly,12,281–303. 40 Palmerus, K. (1996). Child-caregiver ratios in day care center groups: Impact on verbal interactions. Early Child
Development and Care, 118, 45 – 57. 41 NAEYC accreditation standards, pp. 45-66. 42 Retrieved online at http://www.nccic.org/statedata/statepro/display.cfm?state=Indiana on September 13, 2007 43 NAEYC accreditation standards. 44 Vandell, D.L.& Wolfe, B. (2002).Child care quality: Does it matter and does it need to be improved? Institute for
Research on Poverty, University of Wisconsin-Madison 45 Phillipsen, L.C., Burchinal, M.R., Howes,C.& Cryer,D. (1997).The prediction of process quality from structural
features of child care. Early Childhood Research Quarterly, 12, 281–303. 46 Bowman, B.T., Donovan, M.S.,& Burns, M.S.(Eds.) (2000). Eager to learn: Educating our preschoolers.
Washington, DC: National Academy Press. 47 Ruopp, R.,Travers,J., Glantz,F.,&.Coelen,C.(1979).Children at the Center: Final Report of the National Day Care
Study. Cambridge,MA: Abt Associates. 48 NAEYC Accreditation Standards. Online at: www.naeyc.org 49 NAFCC Accreditation Standards. Online at: www.nafcc.org/accreditation/accredstandards 50 Dunn, L. (1993). Proximal and distal features of day care quality and children’s development. Early Childhood
Research Quarterly, 8, 167-192. 51 Kontos, S., & Fiene, R. (1987). Child care quality, compliance with regulations, and children’s development: The
Pennsylvania Study. In D.A. Phillips (Ed.), Quality in child care: What does research tell us? (pp. 57-80).
Washington, DC: National Association for the Education of Young Children. 52 Kontos, S. (1994). The ecology of family day care. Early Childhood Research Quarterly, 9, 87-110. 53 NICHD Early Child Care Research Network (1996). Characteristics of infant child care: Factors contributing to
positive caregiving. Early Childhood Research Quarterly, 11, 269-306. 54 Hayes, C.D., Palmer, J. L. & Zaslow, M. J. (1990). Who cares for America’s children? Child care policy in the
1990s. Washington, D.C.: National Academy Press.

PTQ Validity Report—10/23/07 56
55 Colbert, J. (2002). Regulating dimensions of quality in early care and education: A review of the research. St.
Paul, MN: National Association for Regulatory Administration. 56 Moore, K., Manlove, J., Richter, K., Halle, T., Le Menestrel, S., Zaslow, M., Greene, A., Mariner, C., Romano, A., Bridges, L, & West, J. (1999). A birth cohort study: Conceptual and design considerations and rationale. (NCES
Working Paper No. 999-01). Washington, D.C.: U.S. Department of Education. National Center for Education
Statistics (NCES). 57 Ibid. 58 Clarke-Stewart, K.A., Vandall, D., Burchinal, M., O’Brien, M., & McCartney, K. (2002). Do regulatable features
of child-care homes affect children’s development? Early Childhood Research Quarterly, 17(1), 52-86. 59 Bredekamp, S., & Copple, C. (Eds.). (1997). Developmentally appropriate practice in early childhood programs
serving children from birth through age 8 (Rev. ed.). Washington, DC: National Association for the Education of
Young Children. 60 Bowman, B. T., Donovan, M. S., & Burns, M. S. (Eds.). (2001). Eager To Learn: Educating Our Preschoolers.
Washington, DC: Committee on Early Childhood Pedagogy, National Research Council. 61 Howes, C., Phillips, D., & Whitebrook, M. (1992). Thresholds of quality: Implications for the social development of children in center-based child care. Child Development, 63, 449-460. 62 Kontos, S., Howes, C., Shinn, M., & Galinsky, E. (1995). Quality in family child care and relative care. New
York: Teachers College Press. 63 Phillips, D., McCartney, K., & Scarr, S. (1987). Child-care quality and children's social development.
Developmental Psychology, 23, 537-543. 64 Anderson, C. W., Nagel, R. J., Roberts, W. A., & Smith, J. W. (1981). Attachment to substitute caregivers as a
function of centre quality and caregiver involvement. Child Development, 52, 53-61. 65 Clarke-Stewart, K. A. (1987). In search of consistencies in child care research. In D. A. Phillips (Ed.), Quality in
child care: What does research tell us? Washington, DC: National Association for the Education of Young Children. 66 Howes, C., & Matheson, C. C. (1992). Sequences in the development of competent play with peers: Social and
social pretend play. Developmental Psychology, 28, 961-974. 67 Kontos, S.J. (1991). Child care quality, family background, and children's development. Early Childhood
Research Quarterly, 6, 249-262. 68 Howes, C., & Hamilton, C. E. (1992). Children's relationships with caregivers: Mothers and child care teachers.
Child Development, 63, 859-866. 69 J. Helm and G. Gronlund (2000). Linking Standards and Engaged Learning in the Early Years, Early Childhood
Research and Practice, Volume 2, #1, Online: http://ecrp.uiuc.edu/v2n1/helm.html 70 Bredekamp, Sue, & Copple, Carol (Eds.). (1997). Developmentally appropriate practice in early childhood
programs serving children from birth through age 8. (Rev. ed.). Washington, DC: National Association for the
Education of Young Children. 71 Dodge, Diane Trister (1995). The importance of curriculum in achieving quality child day care programs. Child
Welfare, 74, 1171-1188. 72 Ibid. 73 Schweinhart, L. J., Barnes, H. V., & Weikart, D. P. (1993). Significant benefits: The High/Scope Perry Preschool
study through age 27. Ypsilanti, MI: High/Scope Press. 74Ibid 75 Hadeed, J., & Sylva, K. (1999). Behavioral observations as predictors of children’s social and cognitive progress
in day care. Early Child Development and Care, 154, 13-30. 76 Marcon, R. A. (1999). Differential impact of preschool models on development and early learning of inner-city
children: A three cohort study. Developmental Psychology, 35, 358-375 77 Montie, J. E., Xiang, Z., & Schweinhart, L. J. (2006), Preschool experience in 10 countries: cognitive and
language performance at age 7. Early Childhood Research Quarterly, 21, 313-331. 78 Stipek, D., Feiler, R., Daniels, D., & Milburn, S. (1995). Effects of different instructional approaches on young
children’s achievement and motivation. Child Development, 66, 209-223. 79 Hadeed, J., & Sylva, K. (1999). Behavioral observations as predictors of children’s social and cognitive progress
in day care. Early Child Development and Care, 154, 13-30. 80 Gersten, R. (1985). Direct instruction with special education students: A review of evaluation research. Journal of
Special Education, 19, 41-58.

PTQ Validity Report—10/23/07 57
81 Devries, R., Reese-Learned, H., & Morgan, R. (1991). Sociomoral development in direct-intruction, eclectic, and
constructivist kindergartens: A study of children’s enacted interpersonal understanding. Early Childhood Research
Quarterly, 6, 473-517. 82 Sylvia, K., Taggart, B., Siraj-Blatchford, I., Totsika, V., Ereky-Stevens, K., Gilden, R., & Bell, D. (2007).
Curricular quality and day-to-day learning activities in pre-school. International Journal of Early Years Education,
15, 49-65. 83 Howes, C., Phillips, D. A. Whitebrook, M. (1993). Thresholds of quality: Implications for the social development
of children in center-based child care, Child Development, 63, 449-460. 84 Montie, J. E., Xiang, Z., & Schweinhart, L. J. (2006). Preschool experience in 10 counties: Cognitive and language performance at age 7. Early Childhood Research Quarterly, 21, 313-331. 85 Fekonija, U., Umek, L. M., & Kranjc, S. (2005). Free play and other daily preschool activities as a context for
child’s language development. Studia Psychologica, 47, 103-118. 86 Kontos, S. & Keyes, L. (1999). An ecobehavioral analysis of early childhood classrooms, Early Childhood
Research Quarterly, 14, 35-50. 87 Nabors, L., Willoughby, J., & Badawi, M. A. (1999). Relations between activities and cooperative playground interactions for preschool-age children with special needs, Journal of the Multihandicapped Person, 11, 339-352. 88 NAEYC position statement, Early Childhood Curriculum, Assessment, and Program Evaluation. Online:
http://www.naeyc.org/about/positions.asp#where. 89 Ibid. 90 Frede, E.C. 1998. Preschool program quality in programs for children in poverty. In Early care and education for children in poverty: Promises, programs, and long-term outcomes, eds. W.S. Barnett & S.S. Boocock. Buffalo, NY:
State University of New York Press. 91 Dodge, Diane Trister (1995). The importance of curriculum in achieving quality child day care programs. Child
Welfare, 74, 1171-1188. 92 Raspa, M.J., R.A. McWilliam, & S.M. Ridley. 2001. Child care quality and children’s engagement. Early
Education and Development, 12, 209–24. 93 Espinosa, L. 2002. High quality preschool: Why we need it and what it looks like. NIEER Policy Briefs 1. Online:
http://nieer.org/ resources/policybriefs/1.pdf. 94 NAEYC Position Statement, Early Childhood Curriculum, Assessment, and Program Evaluation. Online:
http://www.naeyc.org/about/positions.asp#where 95 Dickinson, D.K., McCabe, A., Anastasopoulos, L., Peisner-Feinberg, E., S., & Poe, M. D. (2003). The
comperehensive language approach to early literacy: the interrelationships among vocabulary, phonological sensitivity, and print knowledge among preschool-aged children. Journal of Educational Psychology, 95, 465-481. 96 Gest, S. D., Holland-Coviello, R., Welsh, J. A., Eicher-Catt, D. L., & Gill, S. (2006). Language development sub-
contexts in Head Start Classrooms: Distinctive patterns of teacher talk during free play, mealtime, and book reading.
Early Education and Development, 17, 293-315. 97 Smith, M. W., & Dickinson, D. K. (1994). Describing oral language opportunities and environments in Head Start
and other preschool classrooms. Early Childhood Research Quarterly. 9, 345-366. 98 Hansen, C. C. (2004). Teacher talk: Promoting literacy development through response to story. Journal of
Research in Childhood Education, 19, 115-129. 99 Connor, C. M., Morrison, F. J., & Slominski, L. Preschool Instruction and Children's Emergent Literacy Growth.
Journal of Educational Psychology. 98, 665-689. 100 Wasik, B., Bond, E. & Hindman, A. (2006). The effects of a language and literacy intervention on Head Start children and teachers. Journal of Educational Psychology, 98, 63-74. 101 Klibanoff, R. S., Levine, S. C., Huttenlocher, J., Vasilyeva, M., & Hedges, L.V., Preschool children's
mathematical knowledge: The effect of teacher "math talk." Developmental Psychology. 42, 59-69. 102 Wilcox-Herzog, A. & Kontos, S. (1998). The nature of teacher talk in early childhood classrooms and its
relationship to children's play with objects and peers. Journal of Genetic Psychology, 159, 30-44. 103 Hart, B., & Risley, T. R. (1995). Meaningful differences in the everyday experience of young American children. Baltimore: Brookes. 104 NICHD Early Child Care Research Network (2000). The relation of child care to cognitive and language
development. Child Development, 71, 960-980. 105 Neuman, S. B., & Celano, D. (2001). Access to print in low-income and middle-income communities: An
ecological study of four neighborhoods. Reading Research Quarterly, 36, 8–26.

PTQ Validity Report—10/23/07 58
106 Bernhard, J. K. (1995). Child Development, cultural diversity, and the professional training of early childhood
educators. Canadian Journal of Education, 20, 415-426. 107 Burchinal, M. R.& Cryer, D. (2003). Diversity, child care quality, and developmental outcomes. Early Childhood Research Quarterly, 18, 401-426. 108 Burchinal, M. R., Peisner-Feinberg, E., Bryant, D. M., & Clifford, R. (2000). Children’s social and cognitive
development and child care quality: Testing for differential associations related to poverty, gender, or ethnicity.
Journal of Applied Developmental Sciences, 4, 149-165. 109 Peisner-Feinberg, E. S., & Burchinal, M. R. (1997). Relations between preschool children, child care
experiences, and concurrent development: The Cost, Quality, and Outcomes Study, Merrill-Palmer Quarterly, 43, 451-477. 110 Campbell, F., & Ramey, C. T. (1994). Effects of early intervention on intellectual and academic achievement: A
follow-up study of children from low-income families. Child Development, 65, 684-698. 111 NICHD Early Child Care Research Network. (2000). The relation of child care to cognitive and language
development. Child Development, 71, 958-978. 112 Garcia-Coll, C., Crnic, K., Lamberty, G., Wasik, B. H., Jenkins, R., Garcia, H. V., & McAdoo, H. P. (1996). An integrative model for the study of developmental competencies in minority children. Child Development, 67, 1891-
1914. 113 Wishard, A. G., Shivers, E. M., Howes, C., & Ritchie, S. (2003). Child care program and teacher practices:
associations with quality and children’s experiences. Early Childhood Research Quarterly, 18, 65-103. 114 Connolly, P., & Hosken, K. (2006). The general and specific effects of educational programs aimed at promoting awareness of and respect for diversity among young children. International Journal of Early Years Education, 14,
107-126. 115 NEGP (National Education Goals Panel). 1993. The national education goals report. Volume one: The national
report. Washington, DC: U.S. Government Printing Office. 116 Shepard, L., S.L. Kagan, & E. Wurtz. 1998. Principles and recommendations for early childhood assessments.
Washington, DC: National Education Goals Panel. Online: www.negp.gov/reports/prinrec.pdf. 117 Ibid. 118 NAEYC. (2007). Standard 4: NAEYC Accreditation Criteria for Assessment of Child Progress. Retrieved from
www.naeyc.org/academy/standards/standard4/ on September 27, 2007. 119 NAEYC. (2003). Early childhood curriculum, assessment, and program evaluation: Building an effective,
accountable system in programs for children birth through age 8. Washington, DC: National Association for the
Education of Young Children. (www.naeyc.org) 120 Commission on NAEYC Early Childhood Program Standards and Accreditation Criteria, 2003, np 121 Meisels, S.J., Liaw,F., Dorfman, A. & Nelson, R.F. (1995). The Work Sampling System: Reliability and
validity of a performance assessment system for young children. Early Childhood Research Quarterly, 10, 277-296. 122 Shonkoff, J.P., & Meisels, S.J. (2000). Handbook of early childhood intervention, 2nd ed. New York:
Cambridge University Press. 123 Ibid. 124 Jones, S. N., & Meisels, S. J. Training family day care providers to work with special needs children. Topics in
Early Childhood Special Education. 7, 1-12. 125 Knoche, L., Peterson, C. A., Edwards, C. P., & Jeon, H. (2006). Child care for children with and without
disabilities: The provider, observer, and parent perspectives. Early Childhood Research Quarterly. 21, 93-109. 126 Wolery, M., & Wibers, J. (1994). Including Children with Special Needs in Early Childhood Programs. National Association for the Education of Young Children. Washington DC. 127 Guralnick M. J. (2001). Early Childhood Inclusion: Focus on Change. Baltimore. MD: Paul H. Brooks
Publishing. 128 Recchia, S. L., & Lee, Y. (2004). At the Crossroads: Overcoming Concerns To Envision Possibilities for
Toddlers in Inclusive Child Care. Journal of Research in Childhood Education. 19, 175-188. 129 Cole, C. L., & Levinson, T. R. (2002). Effects of within-activity choices on the challenging behavior of children with severe developmental disabilities. Journal of Positive Behavior Interventions. 4, 29-37. 130 Bloom, P., J. & Sheerer, M. (1992). The effect of leadership training on child care program quality. Early
Childhood Research Quarterly, 7, 579-594. 131 McCormick Tribune Center for Early Childhood Leadership, National-Louis University. Widening the lens:
Looking at quality from a program administration perspective.

PTQ Validity Report—10/23/07 59
132 Bella, J., & Bloom, P. J. (2003). Zoom: The impact of early childhood leadership training on role perceptions, job
performance, and career decisions. IL: National-Louis University, Center for Early Childhood Leadership. 133 McCormick Tribune Center for Early Childhood Leadership, National-Louis University. Widening the lens: Looking at quality from a program administration perspective. 134 Bloom, P., J. & Sheerer, M. (1992). The effect of leadership training on child care program quality. Early
Childhood Research Quarterly, 7, 579-594. 135 Bloom, P., J. & Sheerer, M. (1992). The effect of leadership training on child care program quality. Early
Childhood Research Quarterly, 7, 579-594. 136 Cost, Quality, and Child Outcome Study Team (1995). Cost, quality, and child outcomes in child care centers: Technical report. Denver, CO: University of Colorado at Denver. 137 Whitebook, M., & Sakai, L. (2004). When directors leave: The causes and consequences of center administrative
changes. Exchange: The early Childhood Leader’s Magazine, 160, 8-11. 138 NAEYC membership benefits. http://www.naeyc.org/membership/benefits.asp. 139 DeBord, K. & Sawyer, J. (1996). The effects of training on the quality of family child care for those associated
with and not associated with professional child care organizations. Child & Youth Care Forum, 25 (1), 7-15. 140 Weaver, R. E. H. (2002)a. The roots of quality care: Strengths of master providers. Young Children 57, (1) 16-
22. 141 Cost, Quality, and Child Outcome Study Team (1995). Cost, quality, and child outcomes in child care centers:
Technical report. Denver, CO: University of Colorado at Denver. 142 Bloom, P., J. & Sheerer, M. (1992). The effect of leadership training on child care program quality. Early Childhood Research Quarterly, 7, 579-594. 143 Fiene, R. (2002). Improving child care quality through an infant caregiver mentoring project. Child & Youth
Care Forum, 31(2), 79-87. 144 Fiene, R. (2002). 13 Indicators of Quality Child Care: Research Update. National Resource Center for Health and
Safety in Child Care, University of Colorado. 145 Comer, J. P., & Haynes, N. M. (1991). Parent involvement in schools: An ecological approach. The Elementary School Journal, 91(3), 271–277. 146 Burchinal, M., Campbell, F., Bryant, D., Wasik, B. & Ramey, C. (1997). Early intervention and mediating
processes in cognitive performance of children of low-income African American families. Child Development, 68,
935-954. 147
Bredekamp, S., & Copple, C. (1997). Developmentally appropriate practice in early childhood programs.
Washington, DC: National Association for the Education of Young Children. 148 Elicker, James; Noppe, Illene C; Noppe, Lloyd D; Fornter-Wood, Cheryl. (1997). The parent-caregiver
relationship scale: Rounding out the relationship system in infant child care. Early Education and Development,
8(1), 83-100. 149
Burchinal, M., Campbell, F., Bryant, D., Wasik, B. & Ramey, C. (1997). Early intervention and mediating
processes in cognitive performance of children of low-income African American families. Child Development, 68,
935-954. 150
Daniels, S. (1995). Can pre-school education affect children's achievement in primary school? Oxford Review of
Education, 21,163-177.
151 Zellman, G. & Waterman, J. (1998). Understanding the impact of parent-school involvement on children's
educational outcomes. The Journal of Educational Research, 91, 370-380. 152
Griffith, J. (1996). Relation of parent involvement, empowerment, and school traits to student academic performance. Journal of Educational Research, 90, 33-41. 153
Lin, Q. (2003). Research Digest: Parent involvement and early literacy. Harvard Family Research Project.
Retrieved from www.gse.harvard.edu/hfrp/projects/fine/resources/digest/literacy.html, September 28, 2007.
154 Apple, P. L. (2006). A developmental approach to early childhood program quality improvement: The relation
between state regulation and NAEYC accreditation. Early Education and Development, 17(4), 535-552. 155 Cost, Quality, and Child Outcome Study Team (1995). Cost, quality, and child outcomes in child care centers: Technical report. Denver, CO: University of Colorado at Denver. 156 Zan, B.(2005). NAEYC accreditation and high quality preschool curriculum. Early Education & Development,
16(1), 85-102 157 Campbell, N. D., Appelbaum, J. C. Martinson, K., & Martin, E. (2000). Be all the we can be: Lessons from the
military for improving our nation’s child care system. ERIC database ED441 582.
PTQ Validity Report—10/23/07 60
158 National Association for Education of Young Children. (2002). Tiered reimbursement systems: States with
systems to pay higher reimbursement rates to programs that are accredited and/or meet other quality standards.
www.naeyc.org/childrens_champions/criticalissues/accred-reimburse/chart1.htm 159 Smith, A.P. & Endsley, R. C. (1996). Comparison of accredited and non-accredited family child care programs
on program quality, provider professionalism, and family support. Child & Youth Care Forum, 25, 353-378. 160 Bowman, B., Donovan, M. & Burns, M. (Eds.). (2001). Eager to learn: Educating our preschoolers.
Washington, DC: National Academy Press. 161 Cryer, D. & Clifford, R. (Eds). (2003). Early childhood and care in the USA. Baltimore: Brookes.; 162 Lombardi, J. (2003). Time to care: Redesigning child care to promote education. Support families, and build communities. Philadelphia: Temple University Press. 163 Charlesworth, R., Hart, C., Burts, D., and DeWolf, M. (1993). The LSU studies: Building a research base for
developmentally appropriate practice. Advances in Early Education and Day Care 5:3–28. 164 National Association for Education of Young Children. (2006). Developmentally appropriate practice in early
childhood programs serving children from birth through age 8. A position statement of the National Association for
the Education of Young Children. http://www.naeyc.org/about/positions/dap1.asp.

PTQ Validity Report Appendix—10/23/07 1
Appendix
1. Quality Indicators Contained in Paths to QUALITY
2. Paths to QUALITY Pilot Program: Early Childhood Alliance
3. Paths to QUALITY Pilot Program: 4C of Southern Indiana, Inc.

PT
Q V
alid
ity R
eport
Appen
dix
—10/2
3/0
7
2
Ap
pen
dix
1:
Qu
ali
ty I
nd
icato
rs C
on
tain
ed i
n P
ath
s to
QU
AL
ITY
Lev
els
an
d C
rite
ria
Qu
ali
ty
Ind
icato
rs
Gen
eral
PT
Q C
rite
ria
Sp
ecif
ic P
TQ
Cri
teri
a
PT
Q L
evel
&
Cri
teri
a N
um
ber
Sta
te c
hil
d c
are
lice
nse
The
lice
nse
iss
ued
by F
amil
y a
nd S
oci
al S
ervic
es A
dm
inis
trat
ion (
FS
SA
), t
he
Div
isio
n o
f F
am
ily
Res
ourc
es (
DF
R),
Bure
au o
f C
hil
d C
are
is c
urr
ent
and i
n g
ood s
tandin
g.
Lev
el 1
.1 (
cente
rs &
ho
mes)
1)
Reg
ula
tion
S
tate
chil
d c
are
regis
trat
ion
The
regis
trat
ion i
ssued
by t
he
Fam
ily a
nd S
oci
al S
ervic
es A
dm
inis
trat
ion (
FS
SA
), t
he
Div
isio
n o
f F
amil
y R
esourc
es (
DF
R),
Bure
au o
f C
hil
d C
are
is c
urr
ent
and i
n g
ood s
tandin
g.
The
min
istr
y m
eets
all
CC
DF
pro
vid
er e
ligib
ilit
y s
tandar
ds.
The
min
istr
y m
eets
Volu
nta
ry C
erti
fica
tion P
rogra
m g
uid
elin
es i
n a
ll f
our
cate
gori
es. If
a f
aci
lity
does
not
serv
e in
fants
and t
oddle
rs, th
e re
mai
nin
g t
hre
e ca
tegori
es m
ust
be
met
.
Level
1.1
(m
inis
trie
s)
Level
1.2
(m
inis
trie
s)
Level
1.3
(m
inis
trie
s)
2)
Tea
cher
ed
uca
tion/
T
rain
ing
Lev
el o
f ed
uca
tio
n/
Spec
iali
zed t
rain
ing i
n
EC
E/C
D
25%
of
teac
hin
g s
taff
hav
e ei
ther
a C
hil
d D
evel
op
men
t A
sso
ciat
e cr
eden
tial
(C
DA
) or
equiv
ale
nt
cert
ific
ate,
OR
an e
arly
chil
dhood d
egre
e or
equiv
alen
t deg
ree,
OR
hav
e co
mple
ted 4
5 c
lock
ho
urs
of
educa
tional
tra
inin
g l
eadin
g t
o a
n E
arly
Chil
dhood/C
hil
d D
evel
op
ment
deg
ree
or
CD
A c
reden
tial
.
50%
of
teac
hin
g s
taff
hav
e ei
ther
a C
DA
or
equiv
alen
t ce
rtif
icat
e, a
n e
arly
chil
dhood d
egre
e or
equiv
alen
t deg
ree
OR
co
mple
ted 6
0 c
lock
hours
of
educa
tio
nal
tra
inin
g l
eadin
g t
o a
n e
arly
chil
dhood/c
hil
d d
evel
op
men
t deg
ree
or
CD
A c
reden
tial
. L
ead C
areg
iver
wil
l hav
e a
curr
ent
CD
A o
r eq
uiv
alen
t ce
rtif
icat
e, O
R a
n e
arly
chil
dhood d
egre
e or
equiv
alen
t deg
ree
OR
hav
e co
mp
lete
d 4
5 c
lock
hours
of
educa
tional
tra
inin
g i
n e
arly
chil
dhood
educa
tion w
ithin
the
pas
t th
ree
yea
rs l
eadin
g t
o a
CD
A o
r an
ear
ly c
hil
dhood/
chil
d d
evel
opm
ent
deg
ree.
Lea
d C
areg
iver
wil
l hav
e a
curr
ent
CD
A o
r eq
uiv
alen
t c
erti
fica
te,
OR
and e
arly
chil
dhoo
d d
egre
e or
equiv
alen
t deg
ree;
OR
hav
e co
mple
ted
60 h
ours
of
educa
tio
nal
tra
inin
g l
eadin
g t
o a
n e
arly
chil
dhood/c
hil
d d
evel
op
men
t deg
ree
or
CD
A c
reden
tial
wit
hin
the
pas
t th
ree
yea
rs.
Lea
d C
areg
iver
has
a c
urr
ent
CD
A o
r eq
uiv
alen
t or
EC
E d
egre
e or
an e
quiv
alen
t deg
ree.
Level
2.5
(ce
nte
rs)
Level
2.6
(m
inis
trie
s)
Lev
el 3
.4 (
cente
rs &
min
istr
ies)
L
evel
2.5
(hom
es)
Lev
el 3
.3 (
hom
es)
Lev
el 4
.2 (
hom
es)

PT
Q V
alid
ity R
eport
Appen
dix
—10/2
3/0
7
3
Hours
of
teac
her
trai
nin
g p
er y
ear
Sta
ff/a
ssis
tants
are
tra
ined
on t
he
Foundati
ons
to t
he
India
na A
cadem
ic S
tandard
s fo
r Y
oung
Chil
dre
n A
ge
Bir
th t
o F
ive.
At
leas
t 50%
of
teac
hin
g s
taff
/car
egiv
ers
par
tici
pat
e an
nual
ly i
n a
min
imum
of
15 c
lock
hours
of
educa
tional
or
in-s
ervic
e tr
ainin
g f
ocu
sed o
n t
opic
s re
levan
t to
ear
ly c
hil
dhood.
At
leas
t 50%
of
teac
hin
g s
taff
/car
egiv
ers
par
tici
pat
e an
nual
ly i
n a
min
imum
of
20 c
lock
hours
of
educa
tional
or
in-s
ervic
e tr
ainin
g f
ocu
sed o
n t
opic
s re
levan
t to
ear
ly c
hil
dhood.
Lev
el 2
.2 (
all)
Lev
el 2
.6 (
cente
rs &
ho
mes)
Level
2.7
(m
inis
trie
s)
Lev
el 3
.5
(cen
ters
&
min
istr
ies)
Lev
el 3
.4 (
hom
es)
a. T
each
er/c
hil
d r
atio
S
tate
lic
ense
and V
olu
nta
ry C
erti
fica
tio
n P
rogra
m
Lev
el 1
.1 (
cente
rs &
ho
mes)
b.
Gro
up s
ize
Sta
te l
icen
se a
nd V
olu
nta
ry C
erti
fica
tio
n P
rogra
m
Lev
el 1
.1 (
cente
rs &
ho
mes)
c. P
rogra
m d
ura
tion
(at
leas
t one
yea
r)
Pro
gra
m h
as b
een i
n o
per
atio
n f
or
a m
inim
um
of
one
yea
r.
Lea
d C
areg
iver
has
at
leas
t 12
month
s ex
per
ience
in a
lic
ense
d o
r B
ure
au o
f C
hil
d C
are
nati
onal
ly
reco
gniz
ed a
ccre
dit
ed c
hil
d c
are
sett
ing a
s a
chil
d c
are
pro
vid
er.
Level
3.2
(ce
nte
rs)
Lev
el 3
.2 (
hom
es)
3)
Str
uct
ura
l
qual
ity
d.
Cla
ssro
om
envir
onm
ent
feat
ure
s (s
pec
ifie
d
qual
ity f
eatu
res)
The
clas
sroom
is
arra
nged
and u
tili
zes
ple
nti
ful
mat
eria
ls a
nd a
ctiv
itie
s in
ord
er t
o p
rovid
e var
ious
age
and d
evel
op
men
tall
y a
ppro
pri
ate
inte
rest
cen
ters
that
invit
e ch
ildre
n’s
explo
rati
on. In
dic
ators
incl
ude:
Rea
din
g:
Books,
soft
was
hab
le s
eati
ng/p
illo
ws
for
use
whil
e re
adin
g
Wri
ting:
Wri
ting t
ools
, pap
er,
envel
opes
, ty
pew
rite
r, l
ette
rs,
num
ber
s
Art
: Dra
win
g m
ater
ials
(cr
ayons,
mar
ker
s, t
hic
k p
enci
ls,
var
iety
of
pap
er,
size
s an
d t
ypes
, not
colo
ring
books
or
dit
tos/
work
shee
ts)
Pai
nti
ng m
ater
ials
Tools
(sc
isso
rs,
hole
punch
, ta
pe)
, st
aple
rs f
or
school-
age
chil
dre
n
Thre
e-dim
ensi
onal
mat
eria
ls (
pla
y d
ough,
clay
wit
h t
ools
)
Coll
age
mat
eria
ls (
cata
logs,
mag
azin
es,
pap
er s
crap
s, f
abri
c pie
ces,
str
ing,
yar
n,
cott
on b
alls
, pip
e
clea
ner
s, c
raft
sti
cks)
Lev
el 2
.10b &
2.1
0c
(cen
ters
)
Lev
el 2
.12b &
2.1
2c
(min
istr
ies)
Lev
el 2
.11b &
2.1
1c
(ho
mes
)

PT
Q V
alid
ity R
eport
Appen
dix
—10/2
3/0
7
4
d.
Cla
ssro
om
envir
onm
ent
feat
ure
s
(spec
ifie
d q
ual
ity
feat
ure
s)-c
onti
nued
Blo
cks:
Dif
fere
nt
size
/types
of
blo
cks
and a
cces
sori
es s
uch
as
smal
l peo
ple
, an
imal
s, v
ehic
les,
road
sig
ns,
and m
ater
ials
to e
nhan
ce b
uil
din
g, s
tick
s, s
tones
, ta
pe,
str
ing,
craf
t st
icks,
inte
rlock
ing b
locks.
Dra
mati
c P
lay:
Dre
ss-u
p c
loth
es,
such
as
wo
rk b
oots
, hig
h h
eels
, a
var
iety
of
hat
s, c
aree
r gea
r/at
tire
/unif
orm
s,
purs
es, bil
lfold
s an
d m
ult
i-cu
ltura
l outf
its.
Oth
er i
tem
s w
ould
als
o i
ncl
ude
larg
e pie
ces
of
fabri
c/sc
arves
, ch
ild
-siz
e pla
y f
urn
iture
, dis
hes
, pots
, pan
s, d
oll
s (m
ult
icult
ura
l doll
s in
clud
ed),
doll
house
or
oth
er p
lay-s
ets,
acc
esso
ries
for
doll
s, a
nd “
pro
ps”
for
dif
fere
nt
them
es.
Math
/Num
ber
s:
Sm
all
obje
cts
to c
ount/
sort
/cla
ssif
y,
mea
suri
ng t
ools
(sc
ales
, ru
lers
), n
um
ber
s/sh
apes,
num
ber
gam
es,
puzz
les
and p
atte
rn b
lock
s M
usi
c and M
ove
men
t:
Audio
equip
men
t, v
arie
ty o
f ta
pes
/CD
s, m
usi
c boxes
, m
usi
cal
toys,
and i
nst
rum
ents
, dan
ce p
rops
such
as
scar
ves
/str
eam
ers.
Na
ture
an
d S
cien
ce:
Coll
ecti
ons
of
nat
ura
l it
ems
(shel
ls,
rock
s, f
low
ers,
bugs)
, li
vin
g p
lants
, pet
s to
car
e fo
r, s
cien
ce
gam
es, to
ys,
mag
net
s, m
agnif
yin
g g
lass
es, co
okin
g o
pport
unit
ies.
.
Sen
sory
Pla
y:
Wat
er,
pla
y d
ough,
sand,
or
sim
ilar
mat
eria
l (s
uch
as
corn
mea
l, r
ice,
bea
ns,
oat
mea
l),
along w
ith
kit
chen
ute
nsi
ls m
easu
ring c
onta
iner
s, s
hovel
, tr
ough, buck
ets,
sm
all
cars
and t
rucks
and, w
ater
-
pla
y a
cces
sori
es f
or
pouri
ng,
mea
suri
ng, sq
uee
zing, an
d b
asti
ng
Sm
all
Moto
r/M
anip
ula
tive
:
Blo
cks,
puzz
les,
cra
yons,
pen
cils
, sc
isso
rs, in
terl
ock
ing b
lock
s and o
ther
sm
all
buil
din
g t
oys,
peg
boar
d a
nd p
egs,
gam
es, co
unti
ng m
ater
ials
, so
rtin
g o
r cl
assi
fyin
g m
ater
ials
and c
onta
iner
s.
Spec
ific
Infa
nt/
Toddle
r in
dic
ators
incl
ude:
�
Open
spac
es f
or
explo
ring a
nd
pro
tect
ed p
lay.
�
Infa
nts
and t
oddle
rs a
re p
rovid
ed a
var
iety
of
outd
oor
pla
y e
xper
ience
s.
�
Soft
, w
ashab
le e
lem
ents
, su
ch a
s cu
ddle
to
ys,
so
ft f
urn
iture
or
cush
ions.
�
Enough m
ater
ials
to a
void
pro
ble
ms
wit
h c
hil
dre
n m
akin
g t
he
sam
e to
y c
hoic
e
and w
aiti
ng.
�
Mat
eria
ls a
re o
rgan
ized
consi
sten
tly o
n l
ow
, open
shelv
es
for
indep
enden
t use
by c
hil
dre
n.
Lev
el 2
.10b &
2.1
0c
(cen
ters
)
Lev
el 2
.12b &
2.1
2c
(min
istr
ies)
Lev
el 2
.11b &
2.1
1c
(ho
mes
)

PT
Q V
alid
ity R
eport
Appen
dix
—10/2
3/0
7
5
d.
Cla
ssro
om
envir
onm
ent
feat
ure
s
(spec
ifie
d q
ual
ity
feat
ure
s)-c
onti
nued
•
Mat
eria
ls a
re s
turd
y a
nd i
n g
ood c
ondit
ion.
•
A v
arie
ty o
f open
-ended
, w
ashab
le t
oys,
such
as
ratt
les,
tee
ther
s/ri
ngs,
bal
ls,
pop
bea
ds,
nes
ting t
oys,
conta
iner
s, c
uddle
toys,
push
/pull
to
ys
are
avai
lable
•
Lo
w,
stab
le f
urn
iture
is
avai
lable
for
chil
dre
n t
o p
ull
them
selv
es u
p.
•
Furn
iture
adap
ted f
or
toddle
rs i
s av
aila
ble
.
•
Toddle
r ac
tivit
ies
incl
ude
buil
din
g, pre
tendin
g, ex
per
ienci
ng a
rt m
ate
rial
s, e
njo
yin
g
stori
es a
nd b
ooks,
pla
yin
g w
ith t
oys,
explo
ring s
enso
ry m
ater
ials
, hav
ing f
un w
ith
musi
c an
d m
ovem
ent
Lev
el 2
.10b &
2.1
0c
(cen
ters
)
Lev
el 2
.12b &
2.1
2c
(min
istr
ies)
Lev
el 2
.11b &
2.1
1c
(ho
mes
)
4)
Pro
cess
Qual
ity
a.
Tea
cher
-chil
d
inte
ract
ions
(spec
ifie
d
types
of
inte
ract
ion)
Cla
ssro
om
envir
onm
ents
are
wel
com
ing,
nurt
uri
ng a
nd s
afe
for
chil
dre
n t
o h
ave
inte
ract
ions
and
exper
ience
s th
at p
rom
ote
the
physi
cal,
soci
al a
nd e
moti
onal
wel
l bei
ng o
f ch
ildre
n.
Indic
ators
incl
ude:
�
Eac
h c
hil
d a
nd h
is/h
er f
amil
y a
re w
arm
ly a
ckno
wle
dged
upon a
rriv
al a
nd d
epar
ture
.
�
Eac
h c
hil
d f
eels
saf
e, a
ccep
ted,
and p
rote
cted
and t
his
is
support
ed b
y g
uid
elin
es t
hat
rei
nfo
rce
resp
ect
for
peo
ple
, fe
elin
gs,
id
eas,
and m
ater
ials
.
�
Chil
dre
n a
re u
nder
adult
super
vis
ion a
t al
l ti
mes
.
�
The
envir
onm
ent
incl
udes
rep
rese
nta
tio
n o
f ea
ch c
hil
d a
nd f
amil
y
(i
ncl
udin
g a
ll a
ge
gro
ups,
abil
itie
s, a
nd c
ult
ure
s),
such
as
books,
pic
ture
s, p
hoto
gra
phs,
musi
c/so
ngs,
gam
es,
toys,
dre
ss-u
p
cloth
es/m
ater
ials
, an
d f
oods.
�
Eac
h c
hil
d’s
indiv
idual
ity a
nd c
ult
ura
l bac
kgro
und i
s val
ued
and r
espec
ted b
y t
he
pro
vid
er.
�
A p
lace
for
stora
ge
of
per
sonal
bel
ongin
gs
and p
oss
essi
ons
is l
abel
ed w
ith c
hil
d’s
nam
e.
�
Tea
cher
s co
mm
unic
ate
wit
h a
nd l
iste
n t
o c
hil
dre
n (
ver
bal
and n
on-v
erbal
mess
ages
) w
ith l
ots
of
one-
on-o
ne
atte
nti
on t
hro
ugho
ut
the
day
and
usu
all
y a
t ey
e-le
vel
, in
clud
ing t
ime
when
the
teac
her
is
do
wn o
n t
he
floor
wit
h t
he
chil
dre
n.
�
Chil
dre
n’s
idea
s, r
eques
ts,
and
ques
tions
are
ackno
wle
dged
wit
h a
ver
bal
res
ponse
or
physi
cal
ges
ture
. �
Chil
dre
n’s
fee
lings
are
ackno
wle
dged
wit
h a
n a
ccep
ting, no
n-c
riti
cal
ver
bal
res
ponse
or
physi
cal
ges
ture
.
�
Tea
cher
s re
frai
n f
rom
neg
ativ
e ver
bal
or
physi
cal
resp
onse
s to
chil
dre
n a
t al
l ti
mes
, su
ch a
s
yel
ling, cr
itic
izin
g, sc
old
ing, th
reat
enin
g, sa
rcas
m,
nam
e ca
llin
g,
yankin
g, pin
chin
g, sq
uee
zing,
or
span
kin
g.
�
Des
truct
ive
or
dis
rupti
ve
beh
avio
r is
addre
ssed
wit
h c
hil
dre
n (
face
-to
- fa
ce r
ather
than
fro
m a
dis
tance
) b
y t
he
teac
her
, ex
pla
inin
g t
he
effe
ct o
f th
e beh
avio
r, s
tati
ng t
he
des
ired
beh
avio
r an
d
redir
ecti
ng, or
hel
pin
g t
he
chil
d m
ake
alte
rnat
e ch
oic
es.
�
Alt
ho
ugh l
imit
s/co
nse
quen
ces
exis
t, t
he
care
giv
er r
efra
ins
from
too m
any r
estr
icti
ons
in t
he
envir
onm
ent
and r
arel
y u
ses
“no”,
exce
pt
in d
anger
ous
situ
atio
ns.
�
Confl
icts
are
res
olv
ed b
y/w
ith c
hil
dre
n t
hro
ugh a
pro
ble
m-s
olv
ing a
ppro
ach (
ackno
wle
dge
feel
ings,
lis
ten t
o c
hil
dre
n s
har
e w
hat
hap
pen
ed,
ask f
or
idea
s or
solu
tions,
and f
oll
ow
thro
ugh).
Lev
el 2
.9 &
2.9
a (c
ente
rs)
Level
2.1
1 &
2.1
1a
(min
istr
ies)
Level
2.1
0 &
2.1
0a
(ho
mes
)

PT
Q V
alid
ity R
eport
Appen
dix
—10/2
3/0
7
6
a. T
each
er-c
hil
d
inte
ract
ions
(spec
ifie
d
types
of
inte
ract
ion)-
conti
nued
�
The
teac
her
pla
ys
inte
ract
ive
gam
es,
and j
oin
s in
chil
dre
n’s
pla
y,
expan
din
g u
pon t
hei
r id
eas.
�
The
clas
sroom
is
gen
eral
ly c
har
acte
rize
d b
y v
aryin
g s
ounds
or
com
fort
able
conver
sati
on a
nd
sponta
neo
us
laughte
r fr
om
hap
py,
involv
ed c
hil
dre
n a
nd a
dult
s. w
hen
cry
ing,
and g
iven
one-
to-
one
atte
nti
on d
uri
ng f
eedin
g a
nd d
iaper
ing.
Spec
ific
Infa
nt/
Toddle
r in
dic
ato
rs i
ncl
ude:
�
Tea
cher
s en
gag
e in
man
y o
ne-
to-o
ne
face
-to
-fac
e in
tera
ctio
ns
wit
h i
nfa
nts
/toddle
rs, in
cludin
g
singin
g a
nd p
layfu
l in
tera
ctio
ns.
�
Tea
cher
s ac
kno
wle
dge
infa
nt/
toddle
r bab
bli
ngs
wit
h a
ver
bal
res
ponse
, voca
l im
itat
ion o
r
physi
cal
ges
ture
.
�
Tea
cher
s en
gag
e in
mea
nin
gfu
l co
nver
sati
ons
wit
h t
oddle
rs.
�
Tea
cher
s giv
e to
ddle
rs s
imple
wo
rds
to u
se t
o e
xpre
ss f
eeli
ngs.
Ver
bal
toddle
rs a
re t
hen
enco
ura
ged
to u
se w
ord
s in
confl
ict
situ
atio
ns.
Lev
el 2
.9 &
2.9
a
(cen
ters
)
Level
2.1
1 &
2.1
1a
(min
istr
ies)
Level
2.1
0 &
2.1
0a
(ho
mes
)
b.
Chil
dre
n’s
act
ive
engag
emen
t in
acti
vit
ies
Chil
dre
n a
re a
ctiv
ely e
ngag
ed t
hro
ugho
ut
the
day
in m
akin
g c
hoic
es o
f ac
tivit
ies
and m
ater
ials
.
Indic
ators
incl
ude:
�
Chil
dre
n s
hould
be
giv
en s
ever
al f
ree
choic
e per
iods
dai
ly.
Chil
dre
n’s
choic
e (i
ndiv
idual
or
smal
l
gro
up p
lay)
occ
urs
at
leas
t o
ne
thir
d o
f th
e ti
me
and i
ncl
udes
indoor
and o
utd
oor
pla
y.
�
The
teac
her
support
s ch
ildre
n’s
dev
elop
men
t th
rough o
bse
rvat
ion a
nd g
ather
ing i
nfo
rmat
ion t
hat
is u
sed t
o g
uid
e le
sson p
lannin
g.
�
The
teac
her
support
s ch
ildre
n’s
pla
y b
y p
rovid
ing a
ddit
ional
mat
eria
ls a
nd e
xper
ience
s th
at
expan
d o
n c
hil
dre
n’s
inte
rest
s an
d s
kil
ls.
�
The
teac
her
exte
nds
lear
nin
g f
or
chil
dre
n b
y t
alkin
g a
bout
what
they a
re d
oin
g a
nd a
skin
g
ques
tions
that
req
uir
e m
ore
than
a “
yes
” or
“no”
resp
onse
, su
ch a
s “W
hat
wo
uld
hap
pen
if…
?”,
“Can
yo
u t
ell
me
about…
?”, “H
ow
could
we
get
that
to w
ork
?”.
�
The
teac
her
fin
ds
way
s to
hel
p c
hil
dre
n l
earn
skil
ls w
hen
they
sho
w a
n i
nte
rest
(zi
ppin
g, ty
ing,
wri
ting n
ame)
.
�
The
teac
her
tak
es a
dvan
tage
of
the
man
y n
atura
l le
arnin
g e
xper
ience
s as
soci
ated
wit
h d
aily
lif
e an
d m
akes
those
“te
achab
le m
om
ents
” opport
unit
ies
for
lear
nin
g.
Lev
el 3
.11 (
cente
rs,
min
istr
ies)
Lev
el 3
. 9 (
hom
es)
4)
Pro
cess
Qual
ity
-conti
nued
c. C
hil
d-i
nit
iate
d
acti
vit
y/t
each
er-
dir
ecte
d a
ctiv
ity
Chil
dre
n’s
physi
cal,
cognit
ive,
lan
guag
e, l
iter
acy,
mat
h,
and c
reat
ive
dev
elop
men
t is
support
ed.
Indic
ators
incl
ude:
�
Man
y o
pport
unit
ies
for
com
munic
atio
n (
all
ages
), i
ncl
udin
g s
har
ing i
nfo
rmat
ion, poin
ting o
ut
logic
al r
elat
ionsh
ips,
and e
nco
ura
gin
g c
hil
dre
n’s
abil
ity t
o r
easo
n, re
adin
g, and w
riti
ng (
for
toddle
r ag
e an
d u
p)
are
pro
vid
ed t
hro
ughout
the
day
.
�
Ever
y d
ay c
hil
dre
n h
ave
man
y e
xper
ience
s an
d m
ater
ials
to e
nco
ura
ge
imag
inat
ion a
nd
crea
tivit
y.
Lev
el 3
.10 (
cente
rs,
min
istr
ies)
Lev
el 3
.8 (
hom
es)

PT
Q V
alid
ity R
eport
Appen
dix
—10/2
3/0
7
7
c. C
hil
d-i
nit
iate
d
/tea
cher
-dir
ecte
d
acti
vit
y-c
onti
nued
�
Chil
dre
n’s
thin
kin
g i
s st
imula
ted t
hro
ugh e
xper
imen
tati
on, ex
plo
rati
on, an
d a
cces
s to
inte
rest
ing
mat
eria
ls a
nd a
dult
support
.
�
Dis
pla
ys
of
chil
dre
n’s
art
are
avai
lable
at
chil
dre
n’s
eye
level
and s
ho
w t
hat
mo
st a
rt w
ork
is
explo
rato
ry a
nd u
niq
ue
to e
ach c
hil
d.
�
Tea
cher
s en
coura
ge
languag
e an
d l
iter
acy d
evel
op
men
t th
rough i
nte
ract
ions,
books,
songs,
finger
pla
ys,
puppet
pla
y,
and w
riti
ng/d
raw
ing o
pport
unit
ies.
�
Mat
h e
xper
ience
s ar
e a
par
t of
ever
yday
act
ivit
ies
and r
outi
nes
(use
of
num
ber
s duri
ng m
eals
,
sett
ing a
tab
le, duri
ng t
ransi
tio
n t
imes
, usi
ng a
tim
er t
o t
ake
turn
s, c
ounti
ng w
ho i
s ab
sent)
.
�
Musi
c ex
per
ience
s in
clude
singin
g,
crea
tive
mo
vem
ent,
a v
arie
ty o
f ty
pes
of
musi
c, a
nd a
var
iety
of
musi
cal
and r
hyth
mic
inst
rum
ents
.
�
Sci
ence
explo
rati
on i
s par
t of
dai
ly a
ctiv
itie
s (e
xam
ple
s in
clude,
coll
ecti
ons
of
nat
ura
l obje
cts,
livin
g t
hin
gs
to c
are
for,
cookin
g, an
d s
imple
exper
imen
ts).
�
The
dai
ly s
ched
ule
pro
vid
es a
bal
ance
of
acti
vit
ies
incl
udin
g:
quie
t/ac
tive,
indiv
idual
/sm
all
gro
up/l
arge
gro
up,
chil
d i
nit
iate
d/a
dult
init
iate
d.
Infa
nts
and t
oddle
rs a
re n
ot
expec
ted t
o
funct
ion a
s a
larg
e gro
up.
�
Lar
ge
gro
up a
ctiv
itie
s ar
e not
exce
ssiv
e fo
r an
y p
art
of
the
dai
ly r
outi
ne.
�
Chil
dre
n, es
pec
iall
y i
nfa
nts
/to
ddle
rs, hav
e a
var
iety
of
senso
ry-a
wakenin
g e
xper
ience
s.
�
Lev
el 3
.10 (
cente
rs,
min
istr
ies)
Lev
el 3
.8 (
hom
es)
4)
Pro
cess
Qual
ity
-conti
nued
d. A
ctiv
itie
s in
dai
ly
routi
ne
(spec
ifie
d t
ypes
and a
mounts
of
acti
vit
ies)
Dai
ly s
ched
ule
pro
vid
es a
mple
tim
e fo
r ch
ild-d
irec
ted c
hoic
es w
ith a
ctiv
itie
s and m
ater
ials
that
are
gea
red t
o t
he
age,
inte
rest
s, a
nd a
bil
itie
s of
each
chil
d.
Indic
ators
incl
ude:
�
The
dai
ly s
ched
ule
is
consi
sten
t an
d p
redic
table
but
rela
xed
and c
an b
e ad
apte
d f
or
indiv
idual
chil
dre
n a
s nee
ded
.
�
The
clas
sroom
is
arra
nged
wit
h a
reas
for
indiv
idual
, sm
all
gro
up,
and l
arge
gro
up a
ctiv
itie
s.
�
Chil
dre
n a
re e
nco
ura
ged
to c
hoose
the
area
in w
hic
h t
hey
wan
t to
par
tici
pat
e, a
nd w
het
her
they
wan
t to
pla
y a
lone,
wit
h o
ne
frie
nd,
or
wit
h s
ever
al.
�
Routi
ne
task
s (s
uch
as
label
ing, so
rtin
g, cl
assi
fyin
g, fo
ldin
g c
loth
es, co
unti
ng w
hil
e cl
eanin
g u
p
or
sett
ing t
he
table
) ar
e vie
wed
as
lear
nin
g o
pport
unit
ies.
�
Tra
nsi
tions
are
gen
eral
ly r
elax
ed
and a
llo
w t
ime
for
pla
y a
nd c
om
ple
ting a
ctiv
itie
s. I
dle
sit
ting
and w
aiti
ng t
ime
are
avoid
ed.
�
Mea
l ti
me
is r
elax
ed,
wit
h n
o s
cold
ing o
r nag
gin
g. C
hil
dre
n a
re e
nco
ura
ged
to s
am
ple
new
foods
but
allo
wed
to e
at t
he
foods
of
thei
r ch
oic
e.
�
Nap
tim
e is
rel
axed
wit
h a
lter
nat
ive
quie
t ac
tivit
ies
avai
lable
for
the
non-n
apper
s. I
ndiv
idual
nap
pin
g s
ched
ule
s ar
e re
spec
ted f
or
infa
nts
/toddle
rs.
�
The
teac
her
has
a s
yst
em f
or
rota
ting t
oys
and m
ater
ials
for
var
iety
so t
hat
unuse
d t
oys
are
store
d a
nd l
ater
rei
ntr
oduce
d.
�
TV
/VC
R/D
VD
, if
use
d, is
pri
mar
ily a
n e
duca
tio
nal
exper
ience
. C
areg
iver
dis
cuss
es
what
is
vie
wed
wit
h c
hil
dre
n, an
d p
rovid
es a
n a
lter
nat
ive
acti
vit
y;
OR
TV
/VC
R/D
VD
is
not
use
d a
t al
l.
Level
2.1
0 &
2.1
0a
(cen
ters
)
Level
2.1
2 &
2.1
2a
(min
istr
ies)
Level
2.1
1 &
2.1
1a
(ho
mes
)

PT
Q V
alid
ity R
eport
Appen
dix
—10/2
3/0
7
8
f. L
anguag
e an
d
lite
racy
opport
unit
ies
�
Pre
schoole
rs a
re p
rovid
ed l
anguag
e m
ater
ials
dai
ly,
in a
ddit
ion t
o b
ooks,
such
as
puppet
s,
flan
nel
boar
ds,
rec
ord
ed s
tori
es,
and p
ictu
re c
ard g
ames
.
�
Books
for
pre
schoole
rs i
ncl
ude
a var
iety
of
imag
inat
ive,
rhym
ing,
and i
nfo
rmat
ional
books.
�
Books
for
school-
age
chil
dre
n i
ncl
ude
a var
iety
of
read
ing l
evel
s an
d t
opic
s, s
uch
as
adven
ture
s,
myst
erie
s, a
nd i
nfo
rmat
ional
books
and m
agaz
ines
.
Spec
ific
Infa
nt/
Toddle
r In
dic
ato
rs i
ncl
ude:
�
Books
are
dura
ble
, w
ith s
imple
pic
ture
s an
d s
hort
sto
ries
about
ever
yday
act
ivit
ies.
�
Stu
rdy,
sim
ple
books
and p
ictu
res
of
real
obje
cts
are
acce
ssib
le t
o t
odd
lers
eac
h d
ay t
o l
ook a
t
on t
hei
r o
wn.
�
Eac
h i
nfa
nt/
toddle
r is
giv
en o
pport
unit
y d
aily
for
at l
east
one
language
acti
vit
y u
sing b
ooks,
pic
ture
s, o
r puppet
s.
�
Toddle
rs a
re e
nco
ura
ged
to s
crib
ble
wit
h c
rayo
ns.
�
Tea
cher
s re
spond t
o s
ounds/
spee
ch, in
cludin
g b
y i
mit
atin
g i
nfa
nts
’ voca
liza
tions
and e
ngag
ing
toddle
rs i
n c
onver
sati
on.
�
Tea
cher
s ta
lk a
bout
obje
cts
and e
ven
ts t
hat
infa
nts
and t
oddle
rs e
xper
ience
. �
Tea
cher
s use
books
or
read
wit
h c
hil
dre
n d
uri
ng q
uie
t, i
ndiv
idual
lap
tim
e.
Level
2.1
1 &
2.1
1a
(cen
ters
)
Level
2.1
3 &
2.1
3a
(min
istr
ies)
Level
2.1
2 &
2.1
2a
(ho
mes
)
4)
Pro
cess
Qual
ity
-conti
nued
g. E
mphas
is o
n
div
ersi
ty a
nd r
espec
t
for
indiv
idual
chil
dre
n
and f
amil
ies
The
envir
onm
ent
incl
udes
rep
rese
nta
tio
n o
f ea
ch c
hil
d a
nd f
amil
y (
incl
udin
g a
ll a
ge
gro
up
s, a
bil
itie
s,
and c
ult
ure
s),
such
as
books,
pic
ture
s, p
hoto
gra
phs,
musi
c/so
ngs,
gam
es,
toys,
dre
ss-u
p
cloth
es/m
ater
ials
, an
d f
oods.
E
ach c
hil
d’s
indiv
idual
ity a
nd c
ult
ura
l bac
kgro
und i
s val
ued
and r
espec
ted b
y t
he
pro
vid
er.
The
lear
nin
g e
nvir
onm
ent
is d
evel
op
men
tall
y a
nd c
ult
ura
lly a
ppro
pri
ate
and m
eets
any s
peci
al n
eeds
of
the
chil
dre
n.
Indic
ators
incl
ude:
�
Chil
dre
n f
eel
a se
nse
of
bel
ongin
g i
n t
he
clas
sroo
m,
by h
avin
g a
lab
eled
spac
e fo
r th
eir
per
sonal
it
ems,
and a
per
sonal
sle
epin
g a
rea.
�
Chil
dre
n a
re t
aught
to b
e co
nsi
der
ate
of
each
oth
er’s
work
and p
oss
essi
ons.
�
Chil
dre
n a
re t
aught
to u
nder
stan
d a
nd r
espec
t oth
ers.
The
teac
her
answ
ers
chil
dre
n’s
ques
tions
about
dif
fere
nce
s in
a r
espec
tful
and f
actu
al w
ay.
�
All
chil
dre
n a
nd t
hei
r fa
mil
ies
hav
e eq
ual
opport
unit
ies
to p
arti
cipat
e in
cla
ssro
om
and p
rogra
m
acti
vit
ies.
�
Spac
e is
arr
anged
to p
rovid
e ch
ildre
n o
f dif
fere
nt
ages
and a
bil
itie
s ac
cess
to m
ater
ials
and
an
opport
unit
y t
o e
ngag
e in
pla
y a
nd p
roje
cts
wit
hout
lim
itat
ion o
r in
terf
erence
fro
m o
ne
ano
ther
.
�
A p
lan i
s in
pla
ce f
or
effe
ctiv
ely w
ork
ing w
ith c
hil
dre
n w
ith s
pec
ial
nee
ds,
inclu
din
g b
ehav
iora
l
nee
ds
and a
dap
tati
on o
f m
ater
ials
and s
pac
e.
The
teac
her
incl
udes
chil
dre
n i
n a
ge-
appro
pri
ate
self
-hel
p a
ctiv
itie
s, s
uch
as
dre
ssin
g, pic
kin
g u
p
toys,
was
hin
g h
ands,
fold
ing c
loth
es, se
rvin
g f
ood, an
d s
etti
ng o
r cl
eanin
g u
p m
eals
.
Level
2.9
(ce
nte
rs)
Lev
el 2
.11
(min
istr
ies)
L
evel
2.1
0 (
hom
es)
Lev
el 3
.12 (
cente
rs,
min
istr
ies)
Lev
el 3
.10 (
hom
es)

PT
Q V
alid
ity R
eport
Appen
dix
—10/2
3/0
7
9
5)
Ass
essm
ent
Use
of
auth
enti
c or
nat
ura
list
ic a
sses
smen
t
met
ho
ds
Ass
essm
ent
is a
ppro
pri
ate
to t
he
curr
iculu
m a
nd f
ocu
ses
on c
hil
dre
n’s
str
ength
s. I
t m
ay i
ncl
ude
port
foli
os,
conver
sati
ons,
anec
dota
l note
s, a
nd d
evel
op
men
tal
note
s.
Lev
el 3
.9 (
cente
rs,
min
istr
ies)
6)
Chil
dre
n w
ith
spec
ial
nee
ds
Pla
ns
and
envir
onm
enta
l
acco
mm
odat
ions
for
chil
dre
n w
ith s
pec
ial
nee
ds
A p
lan i
s in
pla
ce f
or
effe
ctiv
ely w
ork
ing w
ith c
hil
dre
n w
ith s
pec
ial
nee
ds,
inclu
din
g b
ehav
iora
l
nee
ds
and a
dap
tati
on o
f m
ater
ials
and s
pac
e.
Lev
el 3
.12 (
cente
rs,
min
istr
ies)
Lev
el 3
.10 (
hom
es)
Ori
enta
tio
n
Sta
ff m
ember
s re
ceiv
e ori
enta
tion w
ithin
30 d
ays
of
bei
ng h
ired
.
Level
1.6
(m
inis
trie
s)
7)
Pro
gra
m
poli
cies
&
pro
cedure
s
Wri
tten
poli
cies
and
pro
cedure
s R
ecord
s kep
t an
d
up
dat
ed
Wri
tten
poli
cies
and a
chil
d c
are
contr
act
is e
stab
lish
ed a
nd i
mp
lem
ente
d w
ith f
amil
ies.
The
contr
act
should
be
signed
by t
he
par
ent
and s
hould
conta
in:
�
Per
sons
auth
ori
zed t
o p
ick u
p a
chil
d
�
Illn
ess
poli
cies
incl
udin
g r
easo
ns
for
excl
usi
on
�
Guid
ance
and D
isci
pli
ne
poli
cy
�
Med
icat
ion a
dm
inis
trat
ion p
oli
cy
�
Wri
tten
em
ergen
cy p
lan
�
Poli
cy o
n p
aren
t co
nfe
rence
s, v
isit
s an
d o
pen
door
poli
cy
�
Info
rmat
ion o
n t
ransp
ort
atio
n a
nd f
ield
tri
ps
�
Hours
of
care
pro
vid
ed
�
Lat
e pic
k u
p p
oli
cy
�
Pay
men
t an
d f
ee s
ched
ule
�
Vac
atio
n p
oli
cies
reg
ardin
g b
oth
fac
ilit
y a
nd f
amil
y v
acat
ions
�
Sic
k l
eave
poli
cies
for
chil
dre
n’s
ill
nes
ses
�
Alt
ernat
ive
care
/subst
itute
poli
cies
�
Ter
min
atio
n p
oli
cy
�
Chil
d i
nfo
rmat
ion i
ncl
udin
g a
ny s
pec
ial
nee
ds,
fea
rs o
r fo
od p
refe
rence
s/al
lerg
ies
A w
ritt
en e
mer
gen
cy p
lan i
s es
tabli
shed
and i
mple
men
ted. T
he
pla
n i
s sh
ared
wit
h p
aren
ts a
t th
e ti
me
of
enro
llm
ent
and/o
r an
y t
ime
the
pro
vid
er i
nit
iate
s a
chan
ge
in a
ny a
spec
t of
the
pla
n.
The
purp
ose
of
the
wri
tten
em
ergen
cy p
lan i
s to
mak
e al
l em
ergen
cy p
oli
cies
and p
roce
dure
s cl
ear
to p
aren
ts. T
he
pla
n i
s to
be
signed
by t
he
par
ent(
s) t
o i
ndic
ate
thei
r under
stan
din
g a
nd a
ccep
tance
or
the
poli
cies
and
pro
cedure
s. T
he
wri
tten
pla
n w
ill
incl
ude:
(ch
ild c
are
ho
mes
)
Lev
el 2
.10
(min
istr
ies)
L
evel
2.9
(hom
es)
Lev
el 2
.8 (
hom
es)

PT
Q V
alid
ity R
eport
Appen
dix
—10/2
3/0
7
10
Wri
tten
poli
cies
and
pro
cedure
s
Rec
ord
s kep
t an
d
updat
ed-c
onti
nued
�
The
pro
cedure
for
noti
fyin
g p
aren
ts i
n t
he
even
t of
the
pro
vid
er’s
ill
nes
s, t
he
illn
ess
of
a
mem
ber
of
the
ho
use
hold
who
may
be
conta
gio
us
to o
ther
s, o
r an
y e
mer
gen
cy t
hat
pre
ven
ts
chil
dre
n f
rom
bei
ng c
ared
for
in t
he
pro
vid
er’s
ho
me.
�
Any b
ack-u
p p
lan f
or
care
that
the
pro
vid
er w
ill
arra
nge
in t
he
even
t o
f an
em
ergency.
�
The
nee
d f
or
the
par
ent
to h
ave
a bac
k-u
p p
lan f
or
care
in p
lace
, in
the
even
t o
f th
eir
chil
d’s
illn
ess
or
the
pro
vid
er’s
inab
ilit
y t
o c
are
for
chil
dre
n.
�
Excl
usi
on p
oli
cies
per
tain
ing t
o a
chil
d’s
hea
lth.
�
Alt
ernat
ive
conta
cts
and m
edic
al c
are
auth
ori
zati
on a
vai
lable
in c
ase
par
ents
can n
ot
be
reac
hed
in t
he
even
t of
an e
mer
gen
cy.
�
A l
ist,
pro
vid
ed b
y t
he
par
ent(
s),
of
peo
ple
auth
ori
zed t
o p
ick u
p a
chil
d.
�
A p
lan f
or
fire
evac
uat
ion o
r an
y o
ther
type
of
evac
uat
ion.
A p
lan f
or
safe
shel
ter
duri
ng a
torn
ado w
arnin
g o
r an
y o
ther
thre
aten
ing w
eath
er e
mer
gency.
Lev
el 2
.8 (
hom
es)
Cen
ter
advis
ory
boar
d
An a
dvis
ory
boar
d i
s in
pla
ce t
o p
rovid
e in
put
and s
upport
to t
he
dir
ecto
r.
Level
2.8
(ce
nte
rs)
Level
2.9
(m
inis
trie
s)
Annual
pro
gra
m
eval
uat
ion
Pro
gra
m e
val
uat
ion i
s co
mp
lete
d a
nnual
ly b
y f
amil
ies
and s
taff
.
Lev
el 3
.6 (
cente
rs &
min
istr
ies)
Lev
el 3
.5 (
hom
es)
Str
ateg
ic p
lannin
g
A s
trat
egic
pla
n i
s co
mple
ted a
nd i
ncl
udes
annual
eval
uat
ion/
goal
sett
ing a
nd l
ong r
ange
pla
nnin
g/g
oal
set
ting.
Lev
el 3
.7 (
cente
rs &
m
inis
trie
s)
7)
Pro
gra
m
poli
cies
&
pro
cedure
s-co
nti
nued
Tea
cher
s pai
d p
lannin
g
tim
e
At
a m
inim
um
, th
e L
ead T
each
er r
ecei
ves
pai
d p
lannin
g t
ime.
Lev
el 3
.3 (
cente
rs &
min
istr
ies)
Dir
ecto
r/le
ad c
areg
iver
mem
ber
ship
in
pro
fess
ional
org
aniz
atio
n
Dir
ecto
r/le
ad c
areg
iver
is
a m
ember
of
a nat
ional
ly r
ecogniz
ed e
arly
chil
dhood o
rgan
izat
ion.
Lev
el 2
.3 (
all)
Dir
ecto
r’s/
lead
care
giv
er’s
men
tors
hip
of
oth
er p
rogra
ms
Dir
ecto
r/le
ad c
areg
iver
volu
nte
ers
to i
nfo
rmal
ly m
ento
r a
pro
gra
m a
t a
Lev
el 1
, 2,
or
3.
Lev
el 4
.3 (
cente
rs &
min
istr
ies)
Level
4.4
(ho
mes
)
8)
Dir
ecto
r/L
ead
Car
egiv
er
pro
fess
ional
dev
elop
men
t
Dir
ecto
r/le
ad c
areg
iver
educa
tion/t
rain
ing
The
dir
ecto
r has
co
mple
ted a
Chil
d D
evel
op
men
t A
ssoci
ate
cred
enti
al (
CD
A)
or
earl
y c
hil
dhood
deg
ree
or
equiv
alen
t deg
ree
OR
the
dir
ecto
r of
the
min
istr
y a
gre
es t
o o
bta
in a
min
imum
of
a C
DA
w
ithin
thre
e yea
rs o
f beg
innin
g P
aths
to Q
UA
LIT
Y a
nd s
ho
ws
pro
gre
ssio
n t
ow
ards
com
ple
tion e
ach
yea
r.
The
dir
ecto
r of
the
min
istr
y c
om
ple
tes
Saf
e S
leep
Tra
inin
g.
Dir
ecto
r/L
ead C
areg
iver
rec
eives
ori
enta
tion a
nd t
rain
s st
aff
on t
he
Fo
un
da
tio
ns
to t
he
India
na
Aca
dem
ic S
tandard
s fo
r Y
oung C
hil
dre
n A
ge
Bir
th t
o F
ive.
Level
1.4
(m
inis
trie
s)
Level
1.5
(m
inis
trie
s)
Lev
el 2
.2 (
all)

PT
Q V
alid
ity R
eport
Appen
dix
—10/2
3/0
7
11
Syst
em f
or
shar
ing
info
rmat
ion w
ith
par
ents
A s
yst
em i
s in
pla
ce f
or
com
munic
atin
g p
erti
nen
t in
form
atio
n t
o f
amil
ies,
dai
ly a
nd i
n a
n a
nnual
fam
ily c
onfe
rence
.
Lev
el 2
.7 (
cente
rs,
ho
mes)
Level
2.8
(m
inis
trie
s)
9)
Par
ent-
teac
her
com
munic
atio
n
Par
ent/
teac
her
confe
rence
s
A s
yst
em i
s in
pla
ce f
or
com
munic
atin
g p
erti
nen
t in
form
atio
n t
o f
amil
ies,
dai
ly a
nd i
n a
n a
nnual
fam
ily c
onfe
rence
.
Lev
el 2
.7 (
cente
rs,
ho
mes)
Level
2.8
(m
inis
trie
s)
10)
Acc
redit
atio
n
by N
AE
YC
or
oth
er
org
aniz
atio
ns
Acc
redit
atio
n b
y
NA
EY
C o
r oth
er
org
aniz
atio
ns
Acc
redit
atio
n b
y a
nat
ional
ly r
ecogniz
ed a
ccre
dit
ing b
ody,
appro
ved
by t
he
Sta
te,
has
bee
n a
chie
ved
and m
ainta
ined
.
Level
4.2
(ce
nte
rs)
Lev
el 4
.3 (
hom
es)

PTQ Validity Report Appendix—10/23/07 12
Appendix 2. Paths to QUALITY Pilot Program: Early Childhood Alliance
Goals of Paths to QUALITY
Paths to QUALITY is a voluntary system created to assist parents in identifying and selecting quality child care and recognize providers for ongoing efforts to achieve higher standards of quality that the minimum state licensing requirements. Providers who choose to join PTQ receive a verification visit, are assessed, and are placed on one of four levels. Providers receive yearly re-verification visits to determine if they have maintained their current level or achieved a higher level.
The goals of the Paths to QUALITY as originally conceived were:
1. to raise the quality of child care and early education experiences for children,
2. to give parents tools to help determine the best quality program for their children,
and
3. to support and recognize providers for quality care.
Through these goals it was proposed that PTQ would also provide the following benefits:
� Affirm and support the role of parents � Provide opportunities for all children to develop optimally � Develop well-trained, qualified child care and early education staff � Provide experiences which help children succeed in school � Make affordable, high quality child care available when and where families need it � Encourage a more stable child care workforce through increased stature,
professionalism, salaries and benefits � Help children make a smooth transition to kindergarten �
History of PTQ in Indiana
The Paths to QUALITY program was created by the Child Care and Early Education Partnership, a group of organizations working together in the Fort Wayne area “to develop awareness of and commitment to the importance of high quality early care and education for all children in the community.” 1 In 1996, the Partnership funded a community action plan titled Child Care & Early Education: Everyone’s Business to address the child care and early education needs of Allen County. The partnership sought to develop a clear set of objectives for high quality child care and early education, identify the local assets for and barriers to achieving those objectives, and establish a plan to build on assets to overcome the barriers of and move the community toward high quality child care and early education. To develop awareness of and commitment to the importance of high quality early care and education, the standard for child care quality and support of quality early care and education were addressed in Northeast Indiana. During 1996 to1999, Paths to QUALITY, a child care quality indicator system, was created as a strategy to identify high quality early care and education.

PTQ Validity Report Appendix—10/23/07 13
Paths to QUALITY established four levels of quality, individually tailored for licensed child care centers, licensed and exempt family child care homes, registered child care ministries, and part-time early childhood (preschool) programs. Each level includes specific criteria that need to be met in order for that level to be awarded. The levels, with a brief description of criteria for each, are: Level 1 – Health and Safety
• Basic requirements for health and safety are met.
• Orientation addresses interactions with children, child development and learning. Level 2 – Learning Environment
• State requirements for child: staff ratios are maintained.
• Environments are safe and nurturing for children.
• Activities and materials reflect the age, interests, and abilities of all children.
• Written policies and procedures exist for parents and staff. Level 3 – Planned Curriculum
• A written curriculum and planned program for children reflects developmentally appropriate practice.
• Program evaluation is done annually by parents and staff.
• A strategic plan for program improvement/ accreditation readiness is completed. Level 4 – National Accreditation
• Accreditation is achieved through the National Association for the Education of Young Children (NAEYC) or the National Association of Family Child Care (NAFCC).
• Professional development and involvement continues. Implementation of the Paths to QUALITY program
In 2000, PTQ was implemented in Allen County in Northeast Indiana by the Early Childhood Alliance’s (ECA) Child Care Resource and Referral agency. In 2001, PTQ was implemented in the surrounding 5 counties of DeKalb, Whitley, Steuben, Noble, and LaGrange.
In 2005, 4C of Southern Indiana, Inc. implemented the PTQ program in the 11 county service area of Vanderburgh, Posey, Pike, Dubois, Warrick, Knox, Martin, Daviess, Spencer, Gibson, and Perry Counties. PTQ pilot programs
Overview of Results: Early Childhood Alliance PTQ Program (Northeast Indiana)
The following summary of results is based on a review of annual reports provided by the Early Childhood Alliance. No external evaluation of the program has been conducted. Each of the 3 main goals of PTQ are addressed in this summary of PTQ outcomes.
Goal #1 Successes: Raise the quality of child care and early experiences for children
Participation rates, level advancements, and the relationship between PTQ levels and overall quality will be discussed.

PTQ Validity Report Appendix—10/23/07 14
Participation rates
The PTQ program in Northeast Indiana has grown tremendously over the first seven years of implementation. At the end of 2001, after the first full year of implementation, 28% (150) providers were registered with PTQ. This varied by type of care with the largest participation rates among licensed child care centers (75%) and the lowest among registered ministries (9%) During the following year of implementation (2002), participation rates jumped to 42% (174) of all providers with the greatest growth in participation rates among family child care homes (41%). From January 2002, to July 2007, participation rates have grown steadily. In July 2007, 60% (237) of providers were participating in PTQ. See Table 1 for participation rates over the last 7 years if implementation.
Table 1. Participation rates of PTQ in Northeast Indiana (percentage of all providers eligible to enroll in PTQ)
2001 2002 2003 2004 2005 2006 2007
All providers registered with PTQ
28% 42% 47% 47% 52% 53% 60%
Licensed Centers 75% 76% 82% 90% 88% 96% 96%
Family Homes 23% 41% 46% 50% 54% 54% 64%
Registered Ministries 9% 12% 23% 23% 25% 35% 32%
Part time programs 38% 40% 42% 34% 42% 38% 44%
Paths to QUALITY level advancements Most providers entered the program at Level 1 (67%). The remaining entered at Level 2 (9%), Level 3 (11%), and Level 4 (13%). When those rates are compared to the current percentages on PTQ, there are striking differences. As of July 2007, 24% of providers are registered as a Level 1, 15% as Level 2, 25% as Level 3, and 35% as Level 4. After the first year of full implementation (2001), 43% (64) providers had increased a level. However, by the second year (2002), 73% had increased a level since they began the program. This rate has steadily increased. By July 2007, 92% (217) of providers on PTQ have increased at least one level since they began the program. Table 2 compares initial and current ratings of programs and provider participating on PTQ.

PTQ Validity Report Appendix—10/23/07 15
Table 2. Programs and providers initial and current PTQ rating in Northeast Indiana.
Initial Rating Current Rating (July 2007)
Level 1 67% 24%
Level 2 9% 15%
Level 3 11% 25%
Level 4 13% 35%
Decreases in levels
High levels of turnover, changing or increasing regulations, and the cost of providing staff training were obstacles for early education programs in maintaining level status. Data on the total number of programs that have decreased in levels over the course of the 7 years of implementation is not available; however, from January 2006 to July 2007, 21 programs and providers have moved down a level of PTQ, primarily due to lack of maintaining annual training hours. Of those 21 programs 2 refrained from going through the re-accreditation process. ECA continues to work with these programs to ensure they have the mentoring and training opportunities available that will help these programs return to and maintain previous levels of quality.
Relationship between PTQ levels and child care quality
• During 2004-2006 some of the providers have also participated in a mentoring program provided by ECA. As part of this program, scores are available from one of three measures of classroom quality – the Early Childhood Environment Rating Scale (ECERS), the Infant Toddler Environment Rating Scale (ITERS), or the Family Day Care Environment Rating Scale (FDCRS). In a small sample of PTQ programs and providers (n=34), those who had earned higher PTQ levels exhibited higher levels of assessed quality. (See Table 3.)
. Providers who had earned higher PTQ levels did exhibit higher levels of assessed quality. Table 3 presents these data. Table 3. Average global (overall) quality for providers at each Paths to QUALITY level in Northeast Indiana.
PTQ Level (# of providers) Global (Overall) Quality
Score (1-7)
Range of Quality Scores
Level 1 (15 providers) 3.8 2.4-4.9
Level 2 (12 providers) 4.7 3.3-5.5
Level 3 (7 providers) 5.13 3.4-6.8
Level 4 (2 providers) 5.7 5.6-5.7
Goal #2 Successes: Give parents tools to help determine the best quality program for their
children
Parent education was conducted through PTQ brochures, mass media campaigns, visibility at health, job, or diversity fairs, and through the ECA Child Care Resource and Referral. The brochures were displayed at doctors’ offices, libraries, churches, Lamaze classes, healthy family visits, and other places that parents may frequent. Additionally, radio commercials were used to inform parents about PTQ and a PTQ website was established to offer parents information on

PTQ Validity Report Appendix—10/23/07 16
how to select quality child care and provide information on the PTQ criteria. Parents who called the ECA Child Care Resource and Referral for assistance in finding child care were introduced to PTQ and given a Paths to QUALITY Information Tool for Parents brochure. This tool gave parents specific standards to look for when selecting child care. By educating parents, the expected outcomes are that parents will increase their expectations and require a higher level of quality from their child care providers, and parents will be empowered to make good decisions that will benefit their children. Data have not been collected to determine if parents have increased their expectations for child care.
Goal # 3 Successes: Support and recognize providers for quality care
To support and recognize providers for quality care and in turn, promote a stable child care workforce with increase stature, PTQ levels required providers to participate in a professional group or organization. Events such as “Provider’s Night Out” for family child care home providers offered opportunities to network with other providers and be recognized for their accomplishments in achieving higher levels of quality. Consequently, family child care home providers in Northeast Indiana created an organization called United Providers to continue networking and professional development opportunities and provide stability and professionalism for the participants. A variety of incentives were utilized to encourage child care providers to participate and work toward higher levels of quality. They included: discounts at training programs and retreats, free resource library cards and delivery of materials from the Child Care Resource and Referral, discounts on books, assistance in achieving national accreditation, and recognition in a list of Paths to QUALITY participants distributed to parents and businesses. In addition, providers received $250 incentive for renewing National Accreditation. Challenges of the PTQ program in Northeast Indiana
Recruitment challenges
Participation among family child care providers has required the greatest effort to increase and maintain. Efforts were made to follow up with those individuals who attended Orientation trainings, state required trainings for family child care providers interested in licensing. Initially, ECA sent out packets to all potential providers who attended the trainings immediately following the training. It was discovered that many providers lost or forgot about the program during the licensing process and consequently, did not register with PTQ. In 2006, ECA changed its process and waited at least 3 months before sending materials to providers attending this training coinciding with the time it would take a provider to complete the licensing process. This change in procedure did not increase family child care providers participation so in October 2006, ECA began a new process. Mentors visited licensed family child care providers, registered them with PTQ during the visit, and offered new providers a small incentive (developmentally appropriate materials valued at $50) for registering at Level 1 of PTQ. When the providers discovered they were receiving the incentive, they were much more receptive to participating in PTQ. This resulted in an increase in Level 1 providers during the first 6 months of 2007 and an overall increase in participation (from 57% in October 2006 to 71% in July 2007). Consequently, percentages of those providers participating at Levels 2, 3, & 4 have dropped since October due to this increase in participation.

PTQ Validity Report Appendix—10/23/07 17
Barriers of providers to enroll in program
Since Level 1 requirements for licensed family child care homes and license centers includes maintaining a valid license, once licensed programs were recruited in PTQ they were successful in registering in the program at least at Level 1 status. There were significant barriers, however, for license exempt programs to achieve Level 1 status. For registered ministries and part-time programs, those barriers included obtaining a physician’s note of health for each staff, having a fenced-in play yard, implementing an orientation plan, and using positive discipline. To overcome these obstacles, ECA found that fundraising, the Child Development Associate credential (CDA) education for director and staff, and monthly mentoring visits were most helpful.
Barriers of providers to advance levels
Barriers for advancement on PTQ levels varied by level and type of care. Barriers for advancement to Level 2 (learning environment) included: maintaining adult/child ratios, development of policies, completing voluntary participation, meeting education and training requirements of staff, providing accessible appropriate learning materials especially in the area of language and literacy, and providing parent/teacher conferences. To overcome these barriers, mentoring of programs and providers, staff completion of CDAs as well as being able to implement what they learned in their CDA courses in their child care classroom made the biggest impact.
Barriers for advancement to Level 3 (planned curriculum) included: getting teaching staff involved in the PTQ process, meeting training requirements, joining a professional group, understanding and implementing a developmentally appropriate curriculum, and getting parents and advisory board involved in the program. Monthly on-site mentoring and continuing education had the biggest impact on advancing programs and providers to Level 3.
Barrier for advancement to Level 4 (national accreditation) included: training requirements and the commitment to achieve and maintain accreditation. Center based programs that were successful in reaching and maintaining national accreditation standards had enthusiastic directors who developed plans and worked with ECA to go through accreditation process in a thoughtful way. Support from the Indiana Accreditation Project of the Indiana Association for the Education of Young Children (IAEYC) was also very beneficial to these programs. Family child care providers who were successful in achieving and maintaining national accreditation benefited from training and mentoring from ECA and become informal mentors of other providers. Recognition from PTQ and incentives provided additional motivation to family home providers to achieve and maintain national accreditation standards.
Attrition Challenges
Even though participation rates have increased each year, there were still programs and providers who did not continue with the PTQ program. The most common reason for attrition was due to programs closing. In particular, family child care providers stopped offering care. During 2005, an implemented change in state regulations requiring licensed family child care home providers

PTQ Validity Report Appendix—10/23/07 18
to receive their CDA within three years of providing care resulted in a decrease in licensed homes in Northeast Indiana as well as a loss of those participating in PTQ. There were also a number of programs and providers that were not committed to adhering to the standards necessary to ensure the integrity of the PTQ program and others which ECA were unable to schedule re-verification visits. When a provider or program still in operation did not meet the standards of PTQ, ECA continued to communicate and work with them and leave an open door for their later participation. Attrition rates varied from 4 to 9%.
What are the lessons learned?
During the implementation of the PTQ program in Northeast Indiana, some important lessons were learned. ECA concluded that it is important that a rating system of this nature is a voluntary, strength-based system, and based on relationship building. Relationships between providers and the child care resource referral staff became critical to the success of the program. Mentoring services and training opportunities became crucial to the success of PTQ.
Increased participation in training and professional development events made the most difference in providers advancement in levels as well as a strong sense of identity with the PTQ program for those providers participating. It became important to encourage existing providers and programs on PTQ to continue with training required at the higher levels of the system and provide training that was motivating to participants on every level. Conclusions from PTQ pilot program in Northeast Indiana
The growth in participation rates and dramatic increases in levels by providers illustrates the success of the program. It is important that a rating system of this nature is a voluntary, strength-based system, and based on relationship building. Relationships between providers and the child care resource referral staff in particular mentoring services and training opportunities became critical to the success of the program. Increased participation in training and professional development events made the most difference in providers advancement in levels as well as a strong sense of identity with the PTQ program for those providers participating. ECA has proposed that providers, parents, businesses, the community as a whole as benefited from PTQ in the following ways: Providers and programs in Northeast Indiana experienced the following benefits:
• Manageable, attainable steps outlined to assist with quality improvements
• The power to decide what level they want to participate at
• It was a voluntary, not regulatory program
• Assistance to achieve higher levels of quality, whether the program was regulated or not
• Incentives for quality improvements
• Recognition for offering quality child care (decals, annual dinner, certificates, name in newspaper or on list of providers given to businesses)
• Opportunities to network with other providers
• Enhanced professionalism and increased respect in the community
• Marketing tool
• Mentoring support

PTQ Validity Report Appendix—10/23/07 19
Parents in Northeast Indiana experienced the following benefits:
• Questions to ask so they can select quality child care
• Understanding of the child care options available
• Provider professionalism and contracts which lend to increased reliability, dependability and clear expectations regarding policy and procedures
Businesses in Northeast Indiana experienced the following benefits:
• Enhanced recruitment – a quality early education system can help attract and retain young working families
• Decreased provider turnover and reliable child care leading to decreases in absenteeism and productivity issues
• A tangible tool to help employees find quality child care
The community and state of Indiana experienced the following benefits:
• Accountability to funders, providing measurable outcomes of increased quality
• Awareness and commitment to quality early care and education
• A tool used to market the community as an attractive place to live and work
Limitations of data of PTQ in Northeast Indiana
The success of PTQ pilot program in Northeast Indiana gives much encouragement in the development of a state wide quality rating system using PTQ levels. Data from the pilot program suggest that participation and quality of child care have increased over the seven years of the program’s implementation. There were three basic limitations of the data and this report: a) the report relied heavily on historical data that were collected a variety of ways, b) there were very few quality scores for those providers in PTQ which limits the conclusions we can make about the relationship between quality and PTQ levels, and c) there is no data available on PTQ levels and its relationship to children’s development and learning.

PTQ Validity Report Appendix—10/23/07 20
Appendix 3. Paths to QUALITY Pilot Program: 4C of Southern Indiana, Inc.
Overview of Results: 4C of Southern Indiana, Inc. Paths to QUAITY program
The following summary of results is based on a review of annual reports provided by 4C of Southern Indiana, Inc. and by an external evaluation study conducted by Purdue University and funded by the Welborn Baptist Foundation [Purdue University Early Child Care Quality Initiative (ECCQI)] 2.. Each of the 3 main goals of PTQ are addressed in this summary of PTQ outcomes.
Goal #1: Raise the quality of child care and early experiences for children
Participation rates, level advancements, and the relationship between PTQ levels and overall quality will be discussed.
Participation rates
Similar to the Northeast Indiana programs, the providers in the 4C region also experienced growth in the number of programs enrolled in PTQ in the two and half years of implementation (Table 4). One of the successes of the 4C of Southern Indiana, Inc. PTQ program was the successful recruitment of programs and providers. Instead of launching an expensive public awareness campaign, 4C staff distributed the information to the provider community in the following ways:
• Presentations at the 4C Early Childhood Conference,
• Two informational sessions hosted by 4C, with 55 providers in attendance,
• Monthly newsletter that reached 250 providers, and
• Various community presentations, including at the local Step Ahead councils and public and private school committees,
These presentations and “word of mouth” advertising resulted in (30% of 177) programs registering for PTQ in the first 9 months the program was operational. The 4C PTQ program has continued to grow in 2006 and 2007, but at a slower pace. The following table highlights the number of programs that are enrolled in PTQ through July 2007:

PTQ Validity Report Appendix—10/23/07 21
Table 4. Provider participation in PTQ in Southwest Indiana (percentage of all providers eligible to enroll in PTQ)
2005 2006 2007
(through
June 2007)
% of providers registered with PTQ
30% 42% 46%
Licensed Centers 72% 89% 93%
Family Child Care Homes
20% 27% 31%
Registered Ministries 57% 71% 75%
Part time programs 36% 64% 67%
NOTE: Figures include programs that registered, but did not meet Level 1 criteria
During 2006, Purdue University conducted an external review of the 4C pilot program entitled Early Child Care Quality Initiative (ECCQI) evaluation. One aspect of the evaluation focused on examining why providers enrolled in PTQ. Telephone interviews were conducted with 41 providers who had been registered with Paths to QUALITY for at least six months. Of the 41 providers who participated in the survey—
• 33% were licensed child care center directors
• 52% were family child care providers
• 12% were registered child care ministry directors
• 2% were part-time preschool program directors A majority of providers (56%) indicated that they joined PTQ because they wanted to improve the quality of their child care business. The reasons given were fairly evenly split – 15% indicated they joined because of the financial incentives that PTQ offered, 12% joined because they wanted the recognition that they were a quality child care provider, and 12% joined because they believed that parents would feel it was important once they learned more about PTQ. A small group of providers, 5%, stated they joined in order to receive assistance with attaining national accreditation. All of the providers indicated that they learned about Paths to QUALITY from 4C, either through a letter of invitation to join PTQ, a meeting or training session, or through their 4C mentor. No providers reported that they learned about PTQ from other providers. However as the program continues to grow, communication will likely come also from providers who have joined and successfully moved up levels. Paths to QUALITY level participation and advancements During the first year of implementation (2005), most of the providers entered at Level 1. There were a small percentage of providers that were interested in PTQ, but upon the initial visit, it was found that they were not eligible for Level 1. Overall in 2006, 36% of the registered programs

PTQ Validity Report Appendix—10/23/07 22
(54 programs) increased at least one level and 22% (40 programs) increased more than one level. Following is the breakdown by provider on their initial levels and then their subsequent levels (See Table 5)
Table 5. 4C Providers initial and current PTQ rating
Initial Rating Current Rating (July 2007)
Level 0 20% 10%
Level 1 64% 39%
Level 2 9% 23%
Level 3 3% 16%
Level 4 5% 12%
During 2006, there was an increase of family child care providers and licensed child care centers moving from Level 1 to Level 2 or 3. Both types of providers saw a small increase in the number of providers achieving national accreditation. Registered ministries and part-time programs had the largest proportion of providers that initially could not meet Level 1 requirements. In 2006, the proportion of providers that could not meet Level 1 did decrease, but there were still a higher number of providers in these two categories that were still unable to meet Level 1 criteria. The increases for registered ministries and part-time programs were found in moving programs from Level 0 to Level 1 and from Level 1 to Level 2. During 2006, one registered ministry achieved Level 3 rating, and no part time programs had achieved a Level 3 rating, but one part-time program had achieved a Level 4 rating. However, by July 2007, eight part-time programs had achieved a Level 3 rating, and two registered ministries had achieved a Level 3 rating. In response to the number of programs that that had met Level 1 criteria and were now looking to move to Level 2, 4C increased its efforts to offer training around increasing the quality of the learning environment by adding materials and activities.
The Purdue University ECCQI evaluation asked providers about their initial, current, and expected ratings in the PTQ program. At least once per year, or at the request of the child care provider, 4C verifies that the provider has either maintained or changed their Paths level. Table 6 details the findings. Table 6. Interviewed Providers’ PTQ ratings.
Initial Rating Current Rating During Interview (Summer, 2006)
Expected Rating at next visit
Level 1 67% 26% 5%
Level 2 19% 33% 26%
Level 3 5% 29% 33%
Level 4 7% 12% 36%
The findings indicate that in the previous six months, 25 of the providers interviewed had moved up levels. Of the 25 providers who have moved up levels, 15 moved up one level, and 10 moved

PTQ Validity Report Appendix—10/23/07 23
up two levels. The remaining 16 providers maintained current levels from their initial to current rating. A majority of the providers had advanced above Level 1 within the past 6 months. At the time when providers enrolled in PTQ, 67% were at a Level 1, compared to 26% at the time the interviews were conducted. At the initial rating period, only 12% of providers were at Level 3 or 4, but at the time of the interviews, 41% had attained a Level 3 or higher. Part of the Purdue University ECCQI evaluation focused on 25 providers who had advanced in PTQ levels. Providers were asked to describe the kinds of changes they had implemented since initially joining Paths to QUALITY. The two most common changes reported were classroom changes such as adding materials, room arrangements and curriculum changes, (66%) and program administrative changes such as parent contracts, documentation and lesson planning, introducing primary caregiving and continuity of care, writing strategic plans, instituting parent surveys and evaluations, joining professional organizations (49%), followed by staff development changes such as providing opportunities for more staff training hours (19%). The most frequently cited classroom changes made were implementing a curriculum and changing the room arrangements. The most common program administrative changes mentioned were instituting parent surveys. Decreases in levels
Since the 4C of Southern Indiana, Inc. PTQ program is still in the early stages of implementation, data about decreases in levels is not available at the time of this report. Relationship between PTQ levels and child care quality
The Purdue University ECCQI evaluation also examined the relationship between PTQ levels and child care quality. Using valid and objective measures of quality [the Early Childhood Environment Rating Scale (ECERS-R), the Infant Toddler Environment Rating Scale (ITERS-R) and the Family Day Care Environmental Rating Scale (FDCRS], it was found that providers who had earned higher PTQ levels did in fact exhibit higher levels of assessed quality. This was especially true in the transitions from Level 0 to Level 1, and Level 1 to Level 2. While some providers at Level 3 had the highest quality levels, the average quality levels at Level 3 were comparable to for the Level 2 providers we observed. (See Table 7.) Table 7. Average global (overall) quality for MAP providers at each Paths to QUALITY level.
(n=47)
Paths to QUALITY Level
(# of classrooms observed)
Global (Overall)
Quality Score (1-7)
Range of
Quality Scores
Level 0 (3 classrooms) 3.19 2.78-3.49
Level 1 (28 classrooms) 4.45 3.41-5.26
Level 2 (11 classrooms) 4.64 3.69-5.48
Level 3 (5 classrooms) 4.35 2.88-5.67
*Note: Level 0 represents only 1 center-based provider; the rest were family child care homes. Level 3 represents only 2 center-based providers Level 4 providers do not participate in MAP, so quality data were not available.

PTQ Validity Report Appendix—10/23/07 24
Goal #2: Give parents tools to help determine the best quality program for their children
Strategies similar to those used in Northeast Indiana (PTQ brochures, visibility at health, job, or diversity fairs, and information distributed through the 4C of Southern Indiana, Inc. Child Care Resource and Referral) were utilized to inform parents about PTQ. Data have not been collected to determine if parents have increased their expectations for child care. Goal #3: Support and recognize providers for quality care
In August 2005, 4C of Southern Indiana, Inc. hosted its first Leadership Retreat for child care providers who were registered in Paths to QUALITY at the French Lick resort in French Lick, Indiana. The Leadership Retreat was in response to providers’ request an opportunity to meet and reflect upon different issues facing child care providers. Providers had the opportunity to attend workshop sessions focused on 1) managing change; 2) your retirement goals (family child care home providers); 3) marketing you child care center (centers); and 4) leadership. At the conclusion of the retreat, 4C staff conducted a survey of participants that asked whether “this training provided me with the knowledge and skills necessary to begin the process of implementing change related to this topic.” 57 participants completed this 4C survey. Overall, evaluations were very positive, with 91% to 100% strongly agreeing or agreeing that by attending the sessions they had obtained the skills and knowledge necessary begin to bring about change. 4C of Southern Indiana, Inc. has continued to offer the Leadership retreat annually.
A variety of other incentives were utilized to encourage child care providers to participate and work toward higher levels of quality. They included: free resource library cards and delivery of materials from the Child Care Resource and Referral, materials awarded to providers for each level advancements, scholarships for education and training opportunities, assistance becoming accredited, and recognition in a list of Paths To QUALITY participants in local newspapers. Challenges of the PTQ program in Southwest Indiana
Recruitment challenges
One of the main challenges during the first year of implementation was adequately handing the large interest in the program. During the first year, there was a backlog of programs waiting for their initial site visit, and the initial visits were more time intensive than originally planned. One way in which staff at 4C handled this backlog was to cross-train staff members to register programs so that one person was not responsible for registering all programs.
Another challenge was related to the number of programs that were willing to join PTQ but were unable to meet Level 1 criteria. 4C staff remained committed to these programs and assisted them when possible in achieving a Level 1 status. The number of providers enrolling in 2006 and 2007 has tapered off significantly. Part of the reason why numbers have decreased (although overall participation rates continue to increase) is due to the struggle of enrolling family child care home providers. Anecdotally, some family child care providers have used the PTQ system as a friendly competition between providers. However, these numbers reflect a more significant challenge in enrolling family child care providers. Because family child care providers are more likely to be transient than other types of providers, some of the difficulty in enrolling them may have to do with the nature of their business.

PTQ Validity Report Appendix—10/23/07 25
Barriers of providers to enroll in program
Similar barriers existed for providers and programs in Northeast and Southwest Indiana to achieve Level 1 status. Barriers included: obtaining a physician’s note of health for each staff, having a fenced-in play yard, implementing an orientation plan, and using positive discipline.
Barriers of providers to advance levels
The Purdue University ECCQI evaluation also examined barriers to advancing to the next level. Providers indicated in the qualitative interviews that there were few barriers in advancing from Level 1 to Level 2. However, there were barriers when advancing to Level 2 to Level 3, and then from Level 3 to Level 4. Barriers for advancement to Level 2 (learning environment) included: implementing classroom changes such as adding materials and room arrangements. Barriers for advancement to Level 3 (planned curriculum) included: implementing or adopting a curriculum and lesson planning and implementing administrative changes, such as developing parent contracts, writing strategic plans, instituting parent surveys and evaluations, and joining professional organizations. One barrier that transcended all levels was the need to provide opportunities for more staff training hours. For those providers who had already achieved a Level 4, an additional question was asked to ascertain any challenges in maintaining that level. Of the providers that had already achieved Level 4, all mentioned that maintaining the annual 20 hours needed for staff training hours was the biggest challenge. The most frequent obstacle in participating in PTQ providers mentioned was instituting program administrative changes (37%), such as making time for documentation and instituting parent surveys, followed by classroom changes (26%). Money was listed as an obstacle for 16% of the providers. However, 16% felt that there were not any obstacles to moving up to the next level. In order to move up levels, child care providers need assistance, whether it is technical assistance, funding for developmentally appropriate materials, or access to additional training for the staff. A majority of providers – 93% -- indicated that they had received some sort of support from 4C to either progress within the PTQ system or to maintain their current level. Assistance came in the form of informal support through periodic phone calls, and more formal support and training through the mentoring program. Providers also mentioned they received financial incentives from 4C for moving up to the next level, materials from the Resource Library, or they had participated in 4C training. Only a small percentage – 7% -- reported they had not received any assistance from 4C in either maintaining or progressing to the next level. Over one-quarter (27%) indicated they had received support from other organizations, such as the Indiana Child Care Fund, private foundations, Indiana Association for the Education of Young Children (IAEYC), or the Indiana Child Care Health Consultation Program. Nearly three-quarters (73%) indicated that they had not received any additional outside support. Attrition Challenges

PTQ Validity Report Appendix—10/23/07 26
Since 2005, 31 programs that were originally registered on PTQ have decided to no longer participate. The main reason for dropping out of the program was due to the facility closing, having licensure revoked, or lack of interesting in continuing with the program. Of the 31 programs that dropped out, 25 were family child care home providers, four were part-time programs, 1 each were a licensed center and registered ministry.
What are the lessons learned?
Because many providers enter Paths to QUALITY at Level 1 and then progress relatively quickly to Levels 2 and 3, it is important that 4C training and support focus on nurturing environments for children, curriculum, staff and parents policies, planning, and program evaluation, which are Level 2 and Level 3 criteria. However, there was evidence that some providers may also need consistent support to maintain the Level 1 health and safety standards, so 4C should continue to be vigilant about these issues, even when training with Level 2 or higher providers. Also, 4C should continue to develop ways to support providers to achieve and maintain Level 4- national accreditation.
Conclusions about the effectiveness of PTQ in Southwest Indiana
Information from the Purdue University ECCQI study and from 4C of Southern Indiana, Inc. indicates that the PTQ system has been successful and accepted by area programs and providers. The levels seem attainable, and most providers had already progressed to a higher level in the short time the program has been implemented. While all the interviewed providers indicated they needed to make changes to move up to the next level, they seemed to be changes that were manageable with support from 4C and other training/technical assistance organizations. Because many providers enter Paths to QUALITY at Level 1 and then progress relatively quickly to Levels 2 and 3, it is important that training and support focus on nurturing environments for children, curriculum, staff and parents policies, planning, and program evaluation, which are Level 2 and Level 3 criteria. However, there was evidence that some providers may also need consistent support to maintain the Level 1 health and safety standards, so it is important to continue to be vigilant about these issues, even when training with Level 2 or higher providers. Overall child care quality increased as providers attain higher levels in Paths to QUALITY, especially Level 1 and Level 2. It is not clear from these data that overall quality increases between Levels 2 and 3, so more study is needed. Also no quality data were available for Level 4 programs, so they should be included in future studies. It may be that the largest increases in overall quality will be found first in step from Level 1 to Level 2, and then later, when the provider reaches the highest, national accreditation level (4). In terms of where interviewed providers turned for support to enhance quality, 4C was the most frequent source of support. However 25% of those interviewed received training or support from other organizations. If Paths to QUALITY continues to be successful in attracting broad participation, it will be important for organizations that offer support and training to child care providers to coordinate their efforts. Paths to QUALITY can become a primary vehicle for motivating child care providers to seek further education and to improve the quality of their services to children and families. If quality early care and education is a value held by the larger

PTQ Validity Report Appendix—10/23/07 27
community, there is a need for all of these support organizations to coordinate efforts and invest resources in providers who are enrolled in Paths to QUALITY. The Paths to QUALITY program has been successful in attracting volunteer participants representing all types of care. Most providers reported they enrolled in PTQ because they want to improve the quality of care they offer. Financial incentives, public recognition, marketing advantages with parents, and assistance becoming accredited are other important reasons reported by participating providers.
General Conclusions from Pilot Programs
The growth in participation rates and dramatic increases in levels by providers illustrates the success of the PTQ program in both regions. Both pilot programs reported similar successes and challenges with the PTQ program. Each found unique solutions to overcoming the barriers of participation and advancement. However, in both regions relationships between providers and the child care resource referral staff, in particular mentoring services and training opportunities, became critical to the success of the program. Increased participation in training and professional development events made the most difference in providers’ advancement in levels as well as a strong sense of identity with the PTQ program for those providers participating. Participation rates is only one indicator of success, however, a better indicator of success is the quality improvements that providers and programs have made. The successes of PTQ pilot programs in Northeast and Southwest Indiana give much encouragement in the development of a state wide quality rating system using PTQ levels. It is important that a rating system of this nature is a voluntary, strength-based system, and based on relationship building. If Paths to QUALITY continues to be successful in attracting broad participation, it will be important for organizations that offer support and training to child care providers to coordinate their efforts. Paths to QUALITY can become a primary vehicle for motivating child care providers to seek further education and to improve the quality of their services to children and families. If quality early care and education is a value held by the larger community, there is a need for all of these support organizations to coordinate efforts and invest resources in providers who are enrolled in Paths to QUALITY. There were three basic limitations of the data and this report: a) the report relied heavily on historical data that were collected in a variety of ways, b) there were few quality scores for those providers in PTQ which limits the conclusions we can make about the relationship between quality and PTQ levels, and c) there is no data available on PTQ levels and its relationship to children’s development and learning.
Endnotes
1 Child Care and Early Care Partnership Mission, 1996. 2 Elicker, J. & Ruprecht, K. (2007). Early Child Care Quality Initiative Final Evaluation Report January to
December 2006.
