a chievem en t g ap s h ow b lack an d w hite s tu d en ts...
TRANSCRIPT
NCES 2009-495 U.S. DEPARTMENT OF EDUCATION
HIGHLIGHTS
Achievement Gaps How Black and White Students in Public Schools Perform on the National Assessment of Educational Progress

Achievement gaps between Black and White students are featured in every major National Assessment of Educational Progress (NAEP) report card. The report, Achievement Gaps: How Black and White Students in Public Schools Perform in Mathematics and Reading on the National Assessment of Educational Progress, examines achievement gaps more closely, and provides a
detailed portrait of how achievement gaps and Black and White students’ performance have changed over time at both
the national and state levels.
This report uses data from two assessments—main NAEP and Long-Term-Trend (LTT). While both programs assess reading and mathematics, they have three major differences: (1) main NAEP assesses performance of fourth and eighth graders, while LTT assesses performance of 9- and 13-year-olds; (2) main NAEP reports results for both the national and state levels, while LTT reports results for the national level only; (3) main NAEP was fi rst administered in the 1990s, while LTT was fi rst administered in the 1970s. The report uses results from all previous assessments until 2007 for main NAEP and 2004 for LTT.
All results are for public school students. The percentages of Black and White students in individual states vary by state. Data for trends in achievement gaps and trends in scores are reported only for states that have enough Black and White students in the sample to have reportable results.
This highlights document is an overview of the full report, which is available at http://nces.ed.gov/nationsreportcard/studies/gaps/
ABOUT THE STUDY

A difference in scores between Black and White students can only be considered an achievement gap if the difference is statistically signifi cant, meaning larger than the margin of error. There are several ways achievement gaps can change, as seen in the display to the right. Whether a gap narrows depends on the amount of change in the average scores for Black and White students. For example, a gap can narrow if the average scores of both Black and White students improve, but Black students’ scores improve more. If scores for both Black and White students increase at the same rate, the score gap may not change.
NAEP data can be used to identify gaps and report on trends over time but cannot explain why gaps exist or why they change. The NAEP assessments are designed to measure student performance, not to identify or explain the causes of differences in student performance.
In each state, changes in the sizes of gaps could be affected by demographic or population changes, as well as policy changes in the school, district, and state. When reading the results, it is important to consider these factors.
Ways gaps can narrowThe average scores of both groups increase, while the score of the lower performing group increases even more.
The average score of the higher performing group does not change, while the score of the lower performing group increases.The average score of the higher performing group declines, while the score of the lower performing group increases.
The average score of the higher performing group declines, while the score of the lower performing group does not change.The average scores of both groups decline, but the score of the higher performing group declines even more.
AB
AB
AB
AB
AB
Understanding Gaps
ACHIEVEMENT GAP HIGHLIGHTS 1

National Trends in Score Gaps: Long-Term Trend
Since First Assessment Since 1999
Mathematics Age 9 Narrowed !
Mathematics Age 13 Narrowed !
Reading Age 9 ! Narrowed
Reading Age 13 Narrowed Narrowed
Long-Term Trend When comparing score gaps over time in the Long-Term Trend assessment, the gap size in 2004 is compared to the gap in 1978 for mathematics, and 1980 for reading. The Black-White gap for 9- and 13-year-olds in mathematics narrowed compared to the fi rst assessment but not 1999. In reading, however, gaps have narrowed for 13-year-olds compared to both the fi rst assessment and 1999.
National Gap
Main NAEPTo examine gap changes over time, the size of the gaps in the 2007 assessments are compared to the size of the gaps in 2005 and since the fi rst assessment. In mathematics, the fi rst assessment was in 1990. In reading, the fi rst assessment was in 1992.
Nationally, at both grades and in both subjects, Black and White students scored higher in 2007 than in either the early-1990s or in 2005. Even as scores were improving for both groups, the gaps narrowed between Black and White fourth-graders over the longer time period.
National Trends in Score Gaps: Main NAEP
Since First Assessment Since 2005
Mathematics Grade 4 Narrowed !
Mathematics Grade 8 ! Narrowed
Reading Grade 4 Narrowed Narrowed
Reading Grade 8 ! !
! Indicates that there was no signifi cant change in the gap in 2004.
! Indicates that there was no signifi cant change in the gap in 2007.
Gaps by Gender and Family Income
The Black-White achievement gap varies by gender and family income. For example,
compared to 1990, the Black-White gap between female fourth-graders in mathematics
narrowed. The score gap between Black and White female eighth-graders narrowed
between 2005 and 2007. In reading, the score gaps between Black and White male
and female fourth-graders narrowed between 2005 and 2007.
NAEP uses student eligibility for the National School Lunch Program as an indicator
of family income. Based on the availability of data, trend comparisons are only made
back to 2003. In eighth-grade mathematics and fourth-grade reading, the Black-
White score gaps for students eligible for free lunch narrowed in 2007 compared to
2003 and 2005.
2 ACHIEVEMENT GAP HIGHLIGHTS
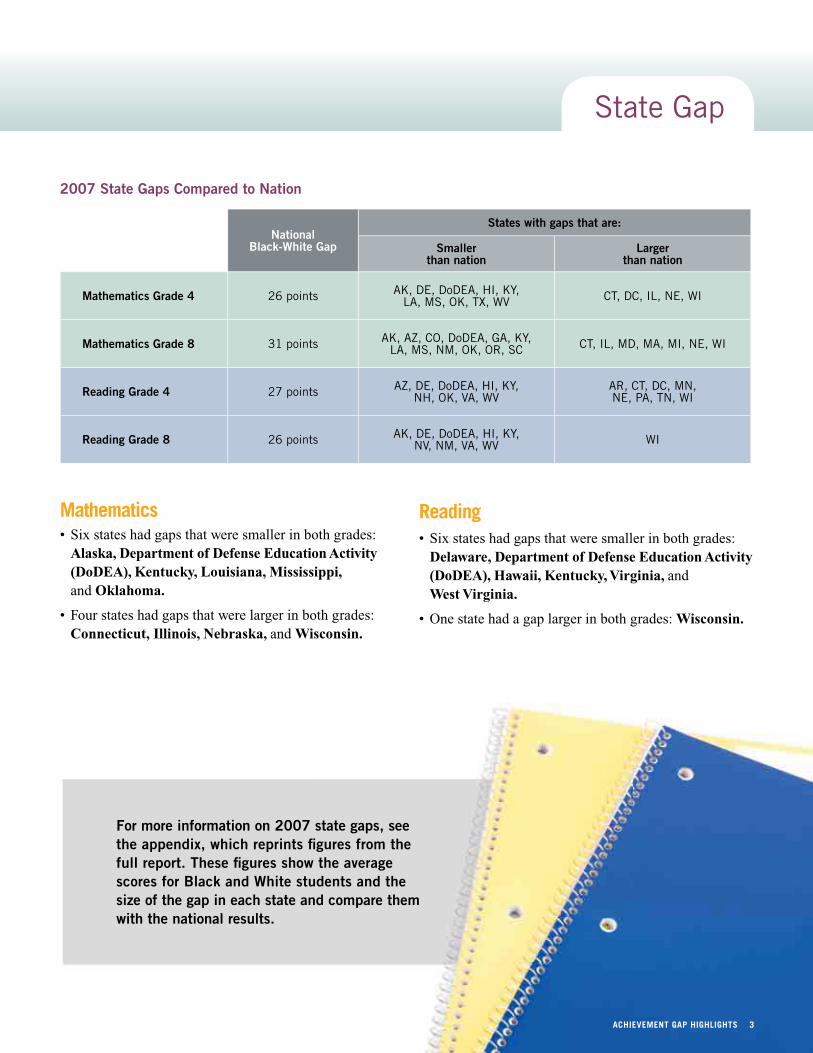
2007 State Gaps Compared to Nation
National Black-White Gap
States with gaps that are:
Smallerthan nation
Largerthan nation
Mathematics Grade 4 26 points AK, DE, DoDEA, HI, KY, LA, MS, OK, TX, WV CT, DC, IL, NE, WI
Mathematics Grade 8 31 points AK, AZ, CO, DoDEA, GA, KY, LA, MS, NM, OK, OR, SC CT, IL, MD, MA, MI, NE, WI
Reading Grade 4 27 points AZ, DE, DoDEA, HI, KY, NH, OK, VA, WV
AR, CT, DC, MN, NE, PA, TN, WI
Reading Grade 8 26 points AK, DE, DoDEA, HI, KY, NV, NM, VA, WV WI
State Gap
Reading• Six states had gaps that were smaller in both grades:
Delaware, Department of Defense Education Activity (DoDEA), Hawaii, Kentucky, Virginia, and West Virginia.
• One state had a gap larger in both grades: Wisconsin.
Mathematics• Six states had gaps that were smaller in both grades:
Alaska, Department of Defense Education Activity (DoDEA), Kentucky, Louisiana, Mississippi, and Oklahoma.
• Four states had gaps that were larger in both grades: Connecticut, Illinois, Nebraska, and Wisconsin.
For more information on 2007 state gaps, see the appendix, which reprints fi gures from the full report. These fi gures show the average scores for Black and White students and the size of the gap in each state and compare them with the national results.
ACHIEVEMENT GAP HIGHLIGHTS 3

Scores increased for Black and White students
Data not available
Score Trends for Black and White Students, Grade 4 Mathematics, 1992-2007
The maps on pages 4-7 show the score changes for Black and White students. In some states, scores for both Black and White students increased while in others, scores increased for only one group. The legends on each map show the different ways scores changed. Trends are shown only for states with results available for both Black and White students.
• In 35 states, scores for both Black and White students increased in 2007 compared to the fi rst assessment in 1992.
Gaps Narrowed
In 15 states, the gap was narrower
in 2007 than in 1992.
CA
CT
DE
DC
FL
GA
LA
MA
MI
MS
NJ
PA
SC
TX
VA
Mathematics Grade 4
4 ACHIEVEMENT GAP HIGHLIGHTS

Scores increased for Black and White students
Scores increased for White students only
Data not available
Score Trends for Black and White Students, Grade 8 Mathematics, 1990-2007
• In 26 states, scores for both Black and White eighth-graders increased in 2007 compared to 1990.
• In two states, scores increased for White students but not for Black students. Gaps Narrowed
In four states, gaps narrowed between 1990 and 2007.
AR
CO
OK
TX
Mathematics Grade 8
ACHIEVEMENT GAP HIGHLIGHTS 5

Scores increased for Black and White students
Score increased for Black students only
Scores increased for White students only
No change
Data not available
• In 13 states, scores for both groups increased from the fi rst assessment in 1992 compared to 2007.
Score Trends for Black and White Students, Grade 4 Reading, 1992-2007
Gaps Narrowed
In 3 states, the gap was narrower
in 2007 than in 1992.
DE
FL
NJ
Reading Grade 4
• In two states, scores increased for Black students but did not change for White students.
• Scores increased for White students but not for Black students in 10 states.
6 ACHIEVEMENT GAP HIGHLIGHTS

Scores increased for Black and White students
Score increased for Black students only
Scores increased for White students only
Scores decreased for Black students only
Scores decreased for White students only
No change
Data not available
Score Trends for Black and White Students, Grade 8 Reading, 1998-2007
No Change in Score Gaps There was no signifi cant change in the gaps for any of the states.
• In one state, scores for both Black and White eighth-graders increased between 1998 and 2007.
• Scores for only Black students in one state increased compared to 1998.
• Scores for only White students increased in two states.
• Scores decreased for only Black students in one state.
• Scores for only White students decreased in one state.
Reading Grade 8
ACHIEVEMENT GAP HIGHLIGHTS 7

Appendix
200 210 220 230 240 250 260 270 280 5000
Scale score
Jurisdictions
WisconsinWest Virginia
WashingtonVirginia
TexasTennessee
South DakotaSouth Carolina
Rhode IslandPennsylvania
OregonOklahoma
OhioNorth Carolina
New YorkNew MexicoNew Jersey
New HampshireNevada
NebraskaMissouri
MississippiMinnesotaMichigan
MassachusettsMaryland
MaineLouisianaKentucky
KansasIowa
IndianaIllinoisHawaii
GeorgiaFloridaDoDEA1
District of ColumbiaDelaware
ConnecticutColorado
CaliforniaArkansas
ArizonaAlaska
Alabama
Nation (public) 248
238247
246245
247249
252249
262246
250246
244248249
245252
238240
243251
257244
252239
245244
243250
255242
251251
250242
241249
242248
245240
253251
248237
250
222
213227
219217218
224220
230209
227225
222230
216224224
226219219
221223
232216
222217218
211219
226232
220225
224225
220219
222219
221221
214230
228222223
212
20*
2926
25
26
2322
2726
2522*22
2623
2624
2623*
23
2828
20*
19*54*
2524
14*
19*26
21*22
29
3122*
32*
32*25
21
2528
23
2633*
38*
26
24
14*
WhiteBlack Gap Jurisdictions
5000
Scale score
240 250 260 270 280 290 300 310 320
West Virginia
South Carolina
Pennsylvania
North Carolina
Massachusetts
Wisconsin
WashingtonVirginia
TexasTennessee
Rhode Island
OregonOklahoma
Ohio
New YorkNew MexicoNew Jersey
NevadaNebraskaMissouri
MississippiMinnesotaMichigan
MarylandLouisianaKentucky
KansasIowa
IndianaIllinois
GeorgiaFlorida
DoDEA1Delaware
ConnecticutColorado
CaliforniaArkansas
ArizonaAlaska
Alabama
290
278294
289282
287296
293294
291289
288291
290288
295282283
300305
285297
279288
291282
298285
290295
291280
289293
284293
282300
296291
271292
259
246271
266254
253272
255265
272259
261253
259257
267257258
265264
244260
251253
240255
264264
258266
258258
272257
250265
254271
268264
250247
WhiteBlack Gap
Nation (public)
3223*
23*
24*38*
29
51*
21*
29
22*
27*
19*
38*
25*25*
41*37
2145*
2826
31
2835
3231
29
28
36*40*
28*34
16*
32
33
3634
2635
27*28
29
Figure 1. The Black-White achievement score gap in mathematics for public school students at grade 4, by state or jurisdiction: 2007
Figure 2. The Black-White achievement score gap in mathematics for public school students at grade 8, by state or jurisdiction: 2007
* Signifi cantly different (p<.05) from the nation (public) when comparing one state to the nation at a time.
1 Department of Defense Education Activity (overseas and domestic schools).
NOTE: States whose Black student population size was insuffi cient for comparison are omitted. Reporting standards not met for Idaho, Montana, North Dakota, Utah, Vermont, and Wyoming.
SOURCE: U.S. Department of Education, Institute of Education Sciences, National Center for Education Statistics, National Assessment of Educational Progress (NAEP), 2007 Mathematics Assessment
* Signifi cantly different (p<.05) from the nation (public) when comparing one state to the nation at a time.
1 Department of Defense Education Activity (overseas and domestic schools).
NOTE: States whose Black or White population size was insuffi cient for comparison are omitted. Reporting standards not met for District of Columbia, Hawaii, Idaho, Maine, Montana, New Hampshire, North Dakota, South Dakota, Utah, Vermont, and Wyoming.
SOURCE: U.S. Department of Education, Institute of Education Sciences, National Center for Education Statistics, National Assessment of Educational Progress (NAEP), 2007 Mathematics Assessment
8 ACHIEVEMENT GAP HIGHLIGHTS

0 180 190 200 210 220 230 240 250 260 500
WhiteBlack Gap
Scale score
Jurisdictions
258
WisconsinWest Virginia
WashingtonVirginia
TexasTennessee
South CarolinaRhode IslandPennsylvania
OregonOklahoma
OhioNorth Carolina
New YorkNew MexicoNew Jersey
New HampshireNevada
NebraskaMissouri
MississippiMinnesotaMichigan
MassachusettsMarylandLouisianaKentucky
KansasIowa
IndianaIllinoisHawaii
GeorgiaFlorida
DoDEA1District of Columbia
DelawareConnecticut
ColoradoCaliforniaArkansas
ArizonaAlaska
Alabama
Nation (public) 230
227228
224226227
234238
233
235232
230227
230226227
229225
220236
241227
231222
226230
224230
238228
234228
231223
222233
227224224
232233
229216
229
203
201207
206195
200210
203213
192218
208205
212201201
205208
203194
208211
197198
195200
194202
215212
208208
202204204
198200
198199
192207
213206
202191
27
26
17*31*
2425
27
2422
2214*
31
22
26
26
2726
2533*
2926
38*
32*
26
28
20*
17*67*
15*29
3033*
21*
36*
2026
2719*
2520*
2313*
22
2434*
WhiteBlack Gap
230 240 250 260 270 280 290 300 3100 500Scale score
Jurisdictions270
261270
269266266
275276
274278
268271
262271
268270
272264264
276278
267273
264270271
263278
265274
270274
266270
272267268
267275
273270
256270
244
236250
248236237
252246
250259
244246
255244
242247
246247
240249
253236
245238
242243
248249
248246
241246
243250
248239
242240
249252
247241
231
26
26
23*30
7*25
24
2627
2831
25
15*
17*
22
2726
29
29
2120*
31
22
19*
17*
25
23
2729
2620*
15*38*
23West Virginia
WashingtonVirginia
TexasTennessee
South CarolinaRhode IslandPennsylvania
OregonOklahoma
OhioNorth Carolina
New YorkNew MexicoNew Jersey
NevadaNebraskaMissouri
MississippiMinnesotaMichigan
MassachusettsMarylandLouisianaKentucky
KansasIowa
IndianaIllinoisHawaii
GeorgiaFloridaDoDEA
DelawareConnecticut
ColoradoCaliforniaArkansas
ArizonaAlaska
Alabama
Nation (public)
Wisconsin
2227
27
2828
29
29
2520
Figure 3. The Black-White achievement score gap in reading for public school students at grade 4, by state or jurisdiction: 2007
Figure 4. The Black-White achievement score gap in reading for public school students at grade 8, by state or jurisdiction: 2007
* Signifi cantly different (p<.05) from the nation (public) when comparing one state to the nation at a time.
1 Department of Defense Education Activity (overseas and domestic schools).
NOTE: States whose Black population size was insuffi cient for comparison are omitted. Reporting standards not met for Idaho, Maine, Montana, North Dakota, South Dakota, Utah, Vermont, and Wyoming.
SOURCE: U.S. Department of Education, Institute of Education Sciences, National Center for Education Statistics, National Assessment of Educational Progress (NAEP), 2007 Reading Assessment
* Signifi cantly different (p<.05) from the nation (public) when comparing one state to the nation at a time.
1 Department of Defense Education Activity (overseas and domestic schools).
NOTE: States whose Black or White student population size was insuffi cient for comparison are omitted. Reporting standards not met for District of Columbia, Idaho, Maine, Montana, New Hampshire, North Dakota, South Dakota, Utah, Vermont, and Wyoming.
SOURCE: U.S. Department of Education, Institute of Education Sciences, National Center for Education Statistics, National Assessment of Educational Progress (NAEP), 2007 Reading Assessment
ACHIEVEMENT GAP HIGHLIGHTS 9

www.ed.gov
“ O U R M I S S I O N I S T O E N S U R E E Q U A L A C C E S S T OE D U C A T I O N A N D T O P R O M O T E E D U C A T I O N A L E X C E L L E N C E
T H R O U G H O U T T H E N A T I O N . ”
The National Center for Education Statistics (NCES), located within the U.S. Department of Education and the Institute of Education Sciences, is the primary federal entity for collecting and analyzing data related to education.
The National Assessment of Educational Progress (NAEP) is a congressionally mandated project sponsored by the U.S. Department of Education and administered by NCES. The Commissioner of Education Statistics is responsible for carrying out the NAEP project. The National Assessment Governing Board is responsible for setting policy for NAEP, including the NAEP achievement levels.
Arne Duncan SecretaryU.S. Department of Education
John Q. EastonDirectorInstitute of Education Sciences
Stuart KerachskyActing CommissionerNational Center for Education Statistics
U.S. DEPARTMENT OF EDUCATION
National Center for Education StatisticsInstitute of Education SciencesU.S. Department of Education1990 K Street, NWWashington, DC 20006-5651
To download the full report and highlights, please visit http://nces.ed.gov/nationsreportcard/studies/gaps/
Contact: Taslima [email protected]
July 2009