a cfd simulation for the ultrasonic flow meter with a …
TRANSCRIPT

Enbin Liu i dr. CFD simulacija za ultrazvučni mjerač protoka sa zaglavljem
Tehnički vjesnik 24, 6(2017), 1797-1801 1797
ISSN 1330-3651(Print), ISSN 1848-6339 (Online) https://doi.org/10.17559/TV-20170331111752
A CFD SIMULATION FOR THE ULTRASONIC FLOW METER WITH A HEADER Enbin Liu, Huan Tan, Shanbi Peng
Original scientific paper Ultrasonic flow meter has been used in natural gas metering for many years, however, the measurement accuracy of the ultrasonic flow meter is affected by the header, which leads to non-perfect fluid state in the flow meter. The objective of this research is to discuss the issues of dual-path ultrasonic flowmeter with a header. Computer fluid dynamic (CFD) method is used to simulate standard turbulent model. It is found that the flow state in the downstream is distorted by the header with secondary turbulence, swirl etc., and the velocity distribution of the gas is asymmetric; the farther the distance between the ultrasonic flow meter and the header, the smaller the distortion and the simulation error. When the downstream straight pipe length is greater than 27 − D (Diameter), the flow state will be steady. With the same diameter of the header, the shorter the meter header the greater the distortion of the gas in the downstream pipe. With the same length of the header, the smaller the diameter, the greater the distortion of the gas in the downstream. These results have a great guiding significance in the optimal design of the flow meter installation structure. Keywords: Pipe manifold; Ultrasonic flow meter; Measurement performance; Indication error CFD simulacija za ultrazvučni mjerač protoka sa zaglavljem
Izvorni znanstveni članak Ultrazvučni mjerač protoka koristi se u mjerenju prirodnog plina dugi niz godina, međutim, na mjernu točnost ultrazvučnog mjerača protoka utječe zaglavlje, što dovodi do nespretnog fluidnog stanja u mjeraču protoka. Cilj ovog istraživanja je raspraviti pitanja dvostruke staze ultrazvučnih mjerača protoka sa zaglavljem. Dinamička metoda računalne tekućine (CFD) je korištena za simulaciju standardnog turbulentnog modela. Nađeno je da je stanje protoka u nizvodnom smjeru izobličeno zaglavljem sa sekundarnom turbulencijom, vrtloženjem itd., a brzina distribucije plina je asimetrična; što je dalje udaljenost između ultrazvučnog mjerača protoka i zaglavlja, to je manja iskrivljenost i simulacijska pogreška. Kada je nizvodno ravna duljina cijevi veća od 27 − D (promjer), stanje protoka će biti stabilno. S istim promjerom zaglavlja, što je kraći mjerač glave, to je veća deformacija plina u nizvodnoj cijevi. S istom duljinom zaglavlja, manji je promjer, ali je veća deformacija plina u nizvodnom smjeru. Ti rezultati imaju veliko značenje u optimalnom dizajnu instalacije mjerača protoka. Ključne riječi: cijevni razvodnik; ultrazvučni mjerač protoka; svojstva mjerenja; pogreška indikacije 1 Introduction
Velocity profile refers to the distribution of velocities in the axial direction in the cross-section of the circular pipe [1]. In natural gas industry, ultrasonic flowmeter is considered to be an important metering method for its accuracy, high repeatability, wide measurement range, simple operation, easy installation and other advantages [2-5]. However, the accuracy of the ultrasonic flowmeter is affected by different inlet velocity distributions caused by pipe configurations upstream such as bends, headers, pressure regulators or diameter changes, resulting in erroneous measurements by up to several percent [6]. For this reason, the research on the accuracy of the ultrasonic flow meter has sparked great interest in flowmeter manufacturers, and much work has been done [7-12], including experimental method, simulation and theoretical analysis. According to experimental methods, Millán et al. have studied the zero-flow offset variation caused by inhomogeneity and nonlinearity of pipe materials. They found that when using nonhomogeneous and nonlinear pipe materials, the measurement error would depend on the acoustic characteristics of the pipe material [13]. In terms of simulation, Byunghad studied the completely velocity distribution of rotating and swirling turbulent flows in circular pipes by using computational fluid dynamics (CFD) simulation to investigate the effect of distorted flow profiles, especially the effect of out-of-plane double bent pipe on ultrasonic flow metering [14]. Luca et al. simulated ultrasonic flow meter by modelling the wave propagation in solids with the equations of linear elasticity and the linearized Euler equations in fluids [15]. As for theoretical analysis, Chen et al. proposed a novel design methodology of continuous
ultrasonic flow meter [16]. Furthermore, some researchers have turned their attention to the application of the ultrasonic flow meters in wet gas. Ramadas presented a finite element study with regard to fundamentally understood ultrasonic transit-time metering principles of wet-gas measurement applications [17]. However, it is not known how the header affects the accuracy of ultrasonic flow meter. The purpose of this study is to assess how the header upstream affects the ultrasonic flow meter by CFD with the standard k-ε turbulent model. The influence of meter header length and diameter on metering is determined. 2 Methods 2.1 The mathematical method
The standard k-ε model is one of the most widely used models in the turbulence simulation for its high stability, economy and accuracy [18÷20]. The model is often used for isotropic uniform turbulent flow. Two basic transport equations need to be solved for this model, the kinetic energy turbulence k, and the turbulent dissipation energy ε [21]:
tk
( )( ) ( )i
i i k i
kuk k Gt x x x
ρ µρ µ ρεσ
∂∂ ∂ ∂+ = + + − ∂ ∂ ∂ ∂
(1)
.)()( 2
21t
kCG
kεC
xxxu
t kiii
i ερεσµ
µρερε
ε++
∂∂
+
∂∂
=∂
∂+
∂∂ (2)
where ρ is density of the fluid, k is kinetic energy turbulence, ε is turbulent dissipation energy, t is time, u is mean velocity, μ is viscosity.

A CFD simulation for the ultrasonic flow meter with a header Enbin Liu et al.
1798 Technical Gazette 24, 6(2017), 1797-1801
The quantity Gk appearing in both equations is a generation term for turbulence. It contains products of velocity gradients, and also depends on the turbulent viscosity.
μt is turbulent viscosity defined by Eq. (3) with the turbulent kinetic energy k and the turbulent dissipation energy ε.
.2
ερµ µ
kCt = (3)
The quantities C1, C2, σk, σε and Cμ are empirical
constants. Cμ = 0.09, C1 = 1.44, C2 = 1.92, σk = 1.0, σε = 1.3 and Cμ = 0.09.
2.2 Modelling
As shown in Fig. 1, the geometry model is set up by Pro/E. The size of header is DN300×4400. The pipeline length from the entrance to the header (L3) is set to three times the diameter (3−D) and the length from the header to the ultrasonic flow meter (L1) is 30−D. The length of metering is 4−D, the diameter of the metering pipeline is DN150.
Figure1 The geometry model for CFD simulations
ANSYS-ICEM is employed to perform all geometry
generation and meshing. As shown in Fig. 2, a suitable
grid density is reached by repeating computations until a satisfactory independent grid is found. The number of mesh used in calculation is 252278.
Figure 2 The grid distribution of computational model
2.3 Boundary conditions
The inlet boundary condition is "Velocity-inlet", the
exit boundary condition is "outflow", and the wall boundary condition is default.
A total of five groups of flow rate are collected from the minimum flow rate to the maximum flow rate, which are 39.71 m3/h, 215.71 m3/h, 558.86 m3/h, 875.73 m3/h and 2131.91 m3/h, respectively. The operating temperature is 12 °C, the operating pressure is set as 0.8 MPa. The gas density is 0.68 kg/m3, and viscosity is 1.603×10⁻⁵ m2/s. The velocity of sound is 340.3 m/s. 2.4 Experimental method
Initially, experiments are carried out at a natural gas station to produce required data for boundary conditions definition and results validation of the CFD simulations. Fig. 3 shows the process flow diagram for metering. The upstream straight pipe length of the meter is 16−D, the diameter of the metering pipeline is 150 mm. The upstream pipe length of the header is 1000 mm, the distance between the header and the ball valve is 1000 mm.
H-1-1
PT PI
DN195
3601
3701
DN150
DN150
3603 3604
DN24
3703 3704
DN24
FT-3601
FT-3701
DN150
DN150
PT TT
PT TT
3602
M
3702
M
H-1-2
V-12 V-13
V-14
V-15
DN50
DN50
Figure 3 The process flow diagram for metering

Enbin Liu i dr. CFD simulacija za ultrazvučni mjerač protoka sa zaglavljem
Tehnički vjesnik 24, 6(2017), 1797-1801 1799
The ultrasonic flow meter used is the parallel path time-of-flight flow meter made by Daniel, whose uncertainty is less than 0.1%, and its metering range is from 35 m3/h to 2210 m3/h.
The flow medium in pipe is natural gas, the temperature is 12 °C, density is 0.68 kg/m3, and viscosity is 1.603×10⁻⁵ m2/s. The operating pressure is 0.8 MPa. The velocity of sound is 340.3 m/s, and the minimum corresponding Reynolds number (Re) is 5802. A total of five groups of flow rate is collected: 39.71 m3/h, 215.71 m3/h, 558.86 m3/h, 875.73 m3/h and 2131.91 m3/h.
The numerical method used in this study has been validated against these experimental results. The flow rate simulated is compared with the real flow rate of the ultrasonic flow meter in the gas station. It is found that the maximum relative error is 3.73%, and the minimum relative error is 0.16%, all within acceptable range. Moreover, the measurement error of simulation and experimental are almost the same.
3 Results and discussion 3.1 The velocity distribution
Fig. 4 and Fig. 5 show the contours of the XY
velocity and the velocity distributions across the cross-section of different length downstream when the flow rate is 39.71 m3/h. As shown in Fig. 4, the profile of the axial flow velocity is distorted by pipe header, and the distortion becomes more serious at pipe interchanges. It can be seen that the flow profile inside the pipe is significantly asymmetric due to the pressure difference. The flow state in the downstream is distorted by the header with secondary turbulence, swirl etc., and the velocity distribution of the gas is asymmetric.
Figure 4 Contours of the XY velocity (Q=39.71 m3/h)
Figure 5 Velocity distributions across the cross-section of different
length downstream (Q=39.71 m3/h)
Fig. 6 represents axial velocity contour plots. It displays the effects of pipe header on average velocity. From the contour plots, it is concluded that the higher the Q value, the greater the axial velocity effect, the greater the distortion. On the other hand, the length downstream needed to recover the gas velocity distribution is not
proportional to flow rate. When the downstream length of the meter header is typically 27 times or more than that of the pipe diameter, the flow state under five different flow rates is stable.
(a) Q=39.71 m3/h
(b) Q=215.71 m3/h
(c) Q=558.86 m3/h
(d) Q=875.73 m3/h
(e) Q=2131.91 m3/h
Figure 6 Contours of the XY velocity with different flow rate
3.2 The influence of meter header length on metering
In order to identify the influence of meter header length on metering, two headers are simulated with the same diameter (DN300), and the lengths are 2.6 m, 4.4 m, respectively. Fig. 7 and Fig. 8 display the indication errors while the meter is located at 5D, 10D, 16D, 20D, 25D and 27D downstream the header in the pipeline, respectively.
As shown in Fig. 7 and Fig. 8, the indication errors of the shorter header vary between −0.26 % and 2.03 %, and the indication errors of the longer header at different location vary between −0.41 % and 1.84 %.
Figure 7 The trends of indication errors at different location
(DN300×2600) With the increase of distance from the flowmeter to
the header, the indication error decreases. This is because
-0.5
0
0.5
1
1.5
2
2.5
0 500 1000 1500 2000 2500
Q,m3/h
Indi
catio
n er
ror,
%
L=5D
L=10D
L=16D
L=20D
L=25D
L=27D
A CFD simulation for the ultrasonic flow meter with a header Enbin Liu et al.
1800 Technical Gazette 24, 6(2017), 1797-1801
the distortion is getting smaller with the longer distance between the ultrasonic flow meter and the header.
It can be seen from Fig.7 and Fig. 8 that the indication errors become smooth when the ultrasonic flow meters are located at 25D, 27D, and the indication errors of DN300×2600 are 0.50 % and 0.47 %, respectively. The indication errors of DN300×4400 are 0.47 % and 0.44 %, respectively.
Figure 8 The trends of indication errors at different location
(DN300×4400) Fig. 9 summarizes the trends of indication errors
while the meter is located at 25D downstream the header in the pipeline, the lengths of the meter headers are 2.6 m, 4.4 m, respectively, and the diameters of the headers are the same (DN300), the flow rate is collected from the minimum flow rate to the maximum flow rate, which are 39.71 m3/h, 215.71 m3/h, 558.86 m3/h, 875.73 m3/h and 2131.91 m3/h. As shown in Fig. 9, the indication error of DN300×2600 is bigger than DN300×4400. It means that the shorter the pipe header, the more distortion in the case of the same diameter.
Figure 9 Indication error with different length of pipe manifold
3.3 Influence of diameter of meter header
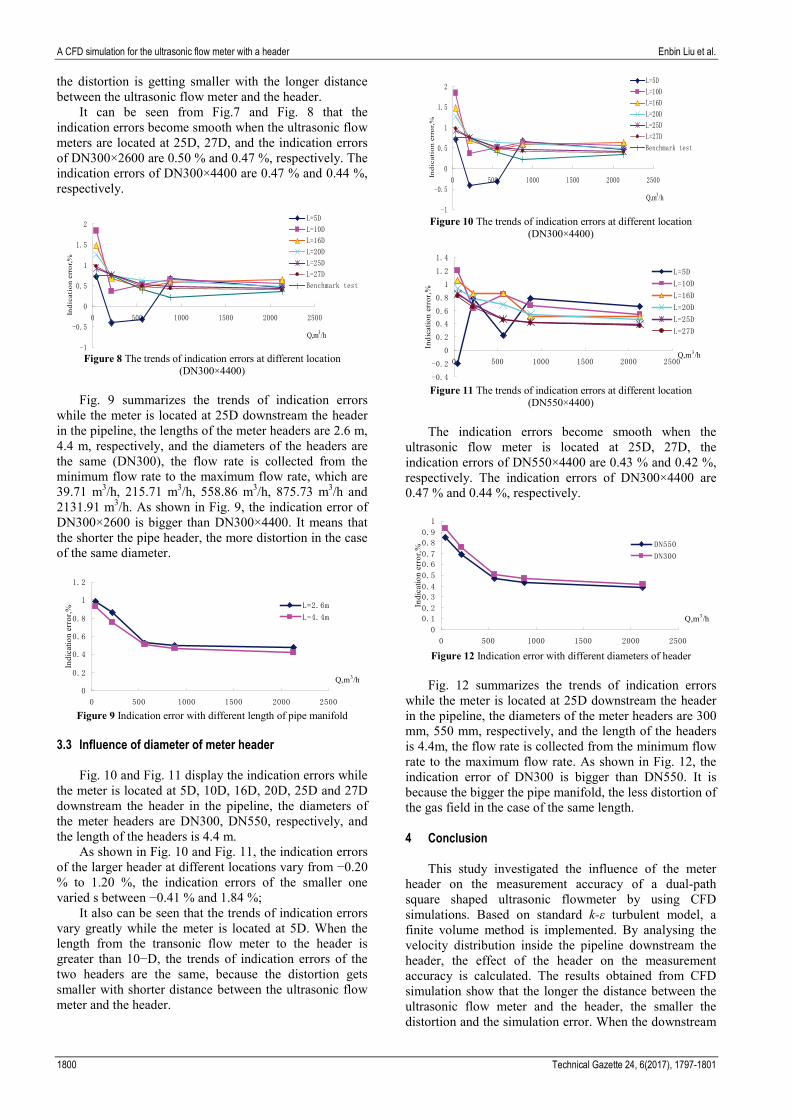
Fig. 10 and Fig. 11 display the indication errors while
the meter is located at 5D, 10D, 16D, 20D, 25D and 27D downstream the header in the pipeline, the diameters of the meter headers are DN300, DN550, respectively, and the length of the headers is 4.4 m.
As shown in Fig. 10 and Fig. 11, the indication errors of the larger header at different locations vary from −0.20 % to 1.20 %, the indication errors of the smaller one varied s between −0.41 % and 1.84 %;
It also can be seen that the trends of indication errors vary greatly while the meter is located at 5D. When the length from the transonic flow meter to the header is greater than 10−D, the trends of indication errors of the two headers are the same, because the distortion gets smaller with shorter distance between the ultrasonic flow meter and the header.
Figure 10 The trends of indication errors at different location
(DN300×4400)
Figure 11 The trends of indication errors at different location (DN550×4400)
The indication errors become smooth when the
ultrasonic flow meter is located at 25D, 27D, the indication errors of DN550×4400 are 0.43 % and 0.42 %, respectively. The indication errors of DN300×4400 are 0.47 % and 0.44 %, respectively.
Figure 12 Indication error with different diameters of header Fig. 12 summarizes the trends of indication errors
while the meter is located at 25D downstream the header in the pipeline, the diameters of the meter headers are 300 mm, 550 mm, respectively, and the length of the headers is 4.4m, the flow rate is collected from the minimum flow rate to the maximum flow rate. As shown in Fig. 12, the indication error of DN300 is bigger than DN550. It is because the bigger the pipe manifold, the less distortion of the gas field in the case of the same length.
4 Conclusion
This study investigated the influence of the meter
header on the measurement accuracy of a dual-path square shaped ultrasonic flowmeter by using CFD simulations. Based on standard k-ε turbulent model, a finite volume method is implemented. By analysing the velocity distribution inside the pipeline downstream the header, the effect of the header on the measurement accuracy is calculated. The results obtained from CFD simulation show that the longer the distance between the ultrasonic flow meter and the header, the smaller the distortion and the simulation error. When the downstream
-1
-0.5
0
0.5
1
1.5
2
0 500 1000 1500 2000 2500
Q,m3/h
Indi
cati
on e
rror
,%
L=5D
L=10D
L=16D
L=20D
L=25D
L=27D
Benchmark test
0
0.2
0.4
0.6
0.8
1
1.2
0 500 1000 1500 2000 2500
Q,m3/h
Indi
catio
n er
ror,%
L=2.6m
L=4.4m
-1
-0.5
0
0.5
1
1.5
2
0 500 1000 1500 2000 2500
Q,m3/h
Ind
icat
ion
err
or,
%
L=5D
L=10D
L=16D
L=20D
L=25D
L=27D
Benchmark test
-0.4
-0.2
0
0.2
0.4
0.6
0.8
1
1.2
1.4
0 500 1000 1500 2000 2500Q,m3/h
Indi
catio
n er
ror,
%
L=5D
L=10D
L=16D
L=20D
L=25D
L=27D
0
0.1
0.2
0.3
0.4
0.5
0.6
0.7
0.8
0.9
1
0 500 1000 1500 2000 2500
Q,m3/h
Indi
catio
n er
ror,%
DN550
DN300

Enbin Liu i dr. CFD simulacija za ultrazvučni mjerač protoka sa zaglavljem
Tehnički vjesnik 24, 6(2017), 1797-1801 1801
straight pipe length is greater than 27-D, the flow state would be steady. The shorter the meter header, the greater the distortion of the gas in the downstream pipe in the case of the same diameter of the header. With the same length of the header, the smaller the diameter, the greater the distortion of the gas in the downstream. This result has a great guiding significance in the optimal design of the flow meter installation structure.
Acknowledgements
This work was supported by the special fund of China’s central government for the development of local colleges and universities - the project of national first-level discipline in Oil and Gas Engineering, and Safety production science and technology project of Sichuan Provincial Safety Supervision Bureau (Sichuan Coal Bureau) (scaqjgjc_stp_20150021).
5 References
[1] Huichao, Z.; Lihui, P.; Tsuyoshi, T. ANN based data integration for multi-Path ultrasonic flowmeter. // IEEE Sensors Journal.14, 2(2013), pp. 362-370. https://dor.org/10.1109/JSEN.2013.2282466
[2] Hilgenstock, A.; Emst, R. Analysis of installation effects by means of computational fluid dynamics-CFD vs experiments. // Flow Measurement & Instrumentation. 7, 3 (1996), pp. 161-171. https://doi.org/10.1016/S0955-5986(97)88066-1
[3] Pamela, I. M.; Gregor, J. B.; Brian, P. S. Ultrasonic transit-time flowmeters. // Meas. Sci. Technol. 11(2000), pp. 1802-1811. https://doi.org/10.1088/0957-0233/11/12/321
[4] Sanehiro, W.; Kenichi, T.; Noriyuki, F. Effect of low-frequency ultrasound on flow rate measurements using the ultrasonic velocity profile method. // Journal of Nuclear Science and Technology. 50, 6(2013), pp. 654-663. https://dx.doi.org/10.1080/00223131.2013.785269
[5] Shanbi, P.; Enbin, L.; Weiwei, X.; Di, W.; Hongbing, Z. Dynamic simulation of an underground gas storage injection production network. // Journal of Environmental Biology. 36, 4(2015), pp. 799.
[6] Bodo, M.; Gudrun, W.; Rainer, K. Systematic investigation of flow profiles in pipes and their effects on gas meter behavior. // Measurement. 22, s1-2(1997), pp. 1-14. https://doi.org/10.1016/S0263-2241(97)00053-5
[7] Jakirlic, S.; Hanjalic, K.; Tropea, C. Modeling rotating and swirling turbulent flows: A perpetual challenge. // Aiaa Journal. 40, 10(2012), pp. 1984-1996. https://doi.org/10.2514/2.1560
[8] Crawford, N.; Spence, S.; Simpson, A. A numerical investigation of the flow structures and losses for turbulent flow in 90° elbow bends. // Proceedings of the Institution of Mechanical Engineers Part E: Journal of Process Mechanical Engineering. 223, 1(2009), pp. 27-44. https://dor.org/10.1243/09544089JPME206
[9] Pellegrini, M.; Endo, H.; Ninokata, H. Numerical investigation of bent pipe flows at transitional Reynolds number. // Progress in Nuclear Energy. 53, 7(2011), pp. 916-920. https://doi.org/10.1016/j.pnucene.2011.02.005
[10] Cordova, L.; Furuichi, N.; Lederer, T. Qualification of an ultrasonic flow meter as a transfer standard for measurements at Reynolds numbers up to 4×10⁶ between NMIJ and PTB. // Flow Measurement and Instrumentation. 45, (2015), pp. 28-42. https://doi.org/10.1016/j.flowmeasinst.2015.04.006
[11] Amri, K.; Juliastuti, E.; Kurniadi, D. Ultrasonic tomographic flowmeter using dual-transducers for the
reconstruction of an asymmetric velocity profile. // In Instrumentation, Control and Automation (ICA), 2016 International Conference on IEEE. (2016), pp. 184-188. https://dor.org/10.1109/ICA.2016.7811498
[12] Rajita, G.; Mandal, N. Review on transit time ultrasonic flowmeter. // In Control, Instrumentation, Energy & Communication (CIEC), 2016 2nd International Conference on IEEE. (2016), pp. 88-92. https://dor.org/10.1109/CIEC.2016.7513740
[13] Millán-Blasco, O.; Salazar, J.; Chávez, J. A.; Turó-Peroy, A.; García-Hernández, M. J. Zero-Flow Offset Variation in Ultrasonic Clamp-On Flowmeters Due to Inhomogeneity and Nonlinearity of Pipe Materials. // IEEE Transactions on Instrumentation and Measurement. 99, (2017), pp. 1-7. https://dor.org/10.1109/TIM.2017.2731018
[14] Byung-Hwan, U.; Thomas, R. H. A CFD model for predicting the flow patterns of viscous fluids in a bioreactor under various operating conditions. // Korean Journal of Chemical Engineering. 25, 5(2008), pp. 1094-1102. https://doi.org/10.1007/s11814-008-0179-y
[15] Luca, A.; Marchiano, R.; Chassaing, J. C. Numerical simulation of transit-time ultrasonic flowmeters by a direct approach. // IEEE transactions on ultrasonics, ferroelectrics, and frequency control. 63, 6(2016), pp. 886-897.
https://doi.org/10.1109/TUFFC.2016.2545714 [16] Chen, Y.; Huang, Y.; Chen, X. Acoustic propagation in
viscous fluid with uniform flow and a novel design methodology for ultrasonic flow meter. // Ultrasonics. 53, 2(2013), pp. 595-606. https://doi.org/10.1016/j.ultras.2012.10.005
[17] Ramadas, S. N.; Harvey, G.; Tweedie, A. Finite element modelling study to explore the possibilities of ultrasonic gas flow measurement in wet-gas applications. // In Ultrasonics Symposium (IUS), 2016 IEEE International. (2016), pp. 1-4. https://doi.org/10.1109/ULTSYM.2016.7728420
[18] Paeng, J. G.; Kyung, H. K. Experimental measurement and numerical computation of the air side convective heat transfer coefficients in a plate fin-tube heat exchanger. // Journal of Mechanical Science and Technology. 23, 2(2009), pp. 536-543. https://doi.org/10.1007/s12206-008-1013-5
[19] Andrew, B. R.; Nauman, A. Underwood and Sean Danaher Development of an ultrasonic airflow measurement device for ducted air. // Sensors. 15, 5(2015), pp. 10705-10722. https://dor.org/10.3390/s150510705
[20] Labed, A.; Moummi, N.; Benchabane, A. Experimental analysis of heat transfer in the flow channel duct of solar air heaters. // International Journal of Heat & Technology. 33, 3(2015), pp. 97-102. https://dor.org/10.18280/ijht.330314
[21] Launder, B. E.; Spalding, D. B. Mathematical models of turbulence. // Academic press. (1972).
Authors’ addresses
Enbin Liu, Associate Professor Southwest Petroleum University No. 8 Xindu Road, Xindu District, Chengdu 610500, China Email: [email protected]
Huan Tan, Engineer Southwest Oil and Gas Field Branch Tianfu Road, Tianfu District, Chengdu 610051, China Email: [email protected]
Shanbi Peng, Associate Professor Corresponding author Southwest Petroleum University No. 8 Xindu Road, Xindu District, Chengdu 610500, China Email: [email protected]