a century of firm – bank relationships: did banking sector
TRANSCRIPT

A Century of Firm – Bank Relationships:
Did Banking Sector Deregulation Spur Firms to Add Banks and Borrow More?
Fabio Braggion CentER - Tilburg University
Department of Finance
PO Box 90153, NL 5000 LE Tilburg, The Netherlands Telephone: +31 13 4668209, Fax: +31 13 4662875
E-mail: [email protected]
Steven Ongena CentER - Tilburg University and CEPR
Department of Finance
PO Box 90153, NL 5000 LE Tilburg, The Netherlands Telephone: +31 13 4662417, Fax: +31 13 4662875
E-mail: [email protected]
This Draft: December 2012
Corresponding author. We would like to thank Liam Brunt, Fabio Castiglionesi, Bob DeYoung, Phil Molyneux, Lyndon Moore, Klaus Schaeck, John Turner, and seminar participants at Erasmus University- Rotterdam, Free University of Bolzano, Université Libre de Bruxelles, Oxford and Tilburg University, and the CESifo – Deutsche Bundesbank Conference, (Munchen), the ESRC Seminar (Bangor), the FDIC – CFR Workshop (Washington DC), the Third Financial History Workshop (Tilburg), the XX Finance Forum (Oviedo), and the 2012 European Banking History Conference (Rotterdam) for comments and suggestions. We gratefully acknowledge financial support from CAREFIN at Bocconi University, the European Banking Center at Tilburg University, the FDIC-CFR, and the Tilburg Center of Finance. Before we included the analysis on firm financing and performance using the Cambridge DTI database, the paper was circulated under the title “A Century of Firm – Bank Relationships: Why the Transition to Multiple Banking?”

A Century of Firm – Bank Relationships:
Did Banking Sector Deregulation Spur Firms to Add Banks and Borrow More?
Abstract
We study how relationships between firms and banks evolved between during the Twentieth
century in Britain and we relate it to firms’ borrowing policies and leverage ratios. We
document and explain a remarkable transition from single to multiple firm-bank relationships
during the last twenty years of the sample period. Larger, global, or transparent companies
with greater needs for bank credit and specialized services were more likely to add a bank,
especially when located in un-concentrating local banking markets. Deregulation and
intensifying competition in the banking sector during the 1970s therefore seemingly spurred
banks to supply credit and services through multilateral arrangements. Firms that add a bank
following deregulation borrow more than similar firms that do not add a bank, and their bank
debt expands while their trade (and other) credit contracts. (131 words)
Keywords: banking sector, competition, multiple banking.
JEL: G21, N23, N24.

I. Introduction
The depth of the recent financial crisis is partly attributed by policymakers and academics
alike to excessively high leverage of corporations and banks. Both were heavily indebted at
the onset of the financial crisis as low interest rates may have promoted cheap debt financing
prior to the crisis, “exacerbating” the well-known structural tax advantages of debt.1 However,
sharp increases of leverage ratios are not a recent phenomenon. Recent work by Graham,
Leary and Roberts (2011) shows that the US corporate leverage doubled from pre-war years
to the 1970s. They explain this phenomenon not only by looking at the changes that took
place in taxation, but also by linking it with fundamental developments in industry
composition, firm characteristics, assets and investments, and ‒ important for our paper ‒
credit supply conditions.
We also take a long term perspective and relate firms’ leverage and debt financing to a key
aspect of financial markets: the secular behaviour of firms-banks relationship. The penchant
of corporates to borrow from multiple banks operating in a competitive banking market may
be an important, yet so far overlooked, driver of the corporate leveraging. Competing banks
may fail for example to fully internalize the consequences of future corporate indebtedness
(Bizer and DeMarzo (1992), Degryse, Ioannidou and Schedvin (2011)), especially when
vying for market share. As a consequence banks may “overlend.”
In this work, we collect data for a large sample of UK firms between 1896 and 1986, and
document that with the onset of banking sector deregulation in 1970 a subsequent and
remarkable shift from bilateral to multilateral relationship banking took place. We then relate
such a shift to firms’ use of debt finance and its effect on leverage ratios.
1 Goodhart and Schoenmaker for example argue that therefore “removing [the] tax advantages of debt is vital” to remove the structural bias towards debt financing that encourages companies to take on debt rather than equity (Financial Times, December 30, 2010).

2
We show that the more transparent and levered firms started to use more (but similar-type)
banks following deregulation, yet that these firms did not necessarily engage more banks
before deregulation. Their leverage and bank debt increased more following deregulation than
that of observably similar firms that did not add banks, while their trade (and other) credit
likewise contracted. Both the decision to approach a new bank and to borrow there are likely
to be driven by common factors that are unobserved to us (i.e., the econometricians): we
address the lurking endogeneity problem by matching firms that add banks to otherwise
(observably) similar firms, and by performing a difference-in-difference analysis (explained
below).
Our paper makes two contributions. First, we provide an alternative channel through which
a relaxation of credit supply constraints can affect firms’ financial policies, i.e., the switch
from bilateral to multilateral relationship lending. In particular, we study if the deregulation
that was intended to promote competition in the banking sector eased firms’ access to
additional banks and consequently changed firms’ borrowing policies. Leary (2009), Sufi
(2009), Lemmon and Roberts (2010) and Rice and Strahan (2010) also investigate if the
relaxation of credit supply constraints affect corporate borrowing. Complementing their work
we analyse ninety years of pertinent corporate information, including firm-bank connections,
for all commercial and industrial listed firms in the UK to document the differential effect of
banking deregulation on relationship banking and the corporate leveraging.
Second, we contribute to the growing literature that studies the evolution of finance over
the very long period of time. Like Rajan and Zingales (2003), Chambers and Dimson (2009),
Frydman and Saks (2010), Graham, Leary and Roberts (2011) and Schularick and Taylor
(2012) we study the long-run development of a financial system to understand if and how the

3
present financial practices are the result of historical processes. In particular we investigate
one of the key components of a financial system, i.e., the interactions between firms and
banks and its role for the corporate leveraging.
Long-run analysis provides us with a unique opportunity to test the validity of various
relationship banking theories and their relevancy for the corporate leveraging in a new and
unexplored context. Our analysis suggests that the transition to multiple banking coincided
with a period of liberalization of the banking sector in the UK that greatly increased the level
of competition among financial institutions and that may have contributed to the dramatic
surge in the corporate leveraging.
The reasons for studying the financial system in Britain are straightforward. Its financial
markets had a preeminent role in the world for many decades and banks played a notable role
in its performance. Yet Britain’s financial system was subject to many changes in its
economic and legal environment. Crucial for our purposes financial information was always
readily available in Britain. We can therefore collect a unique dataset that contains consistent
financial records of all publicly listed firms during a 90-year period from 1896 to 1986,
including key firm-bank relationship information.
We first document a remarkable transition from single to multiple bank relationship in the
second half of the Twentieth century. Many firms had only one bank relationship prior to this
change, demarcating a clean differentiation and possible transition from bilateral to
multilateral banking during the sample years. Indeed, about 85% of companies in our sample
were involved in a single bank relationship between 1906 and 1966. This figure considerably
declines to 71% in 1976 and to 60% in 1986. The transition from single to multiple bank
relationships is even more pronounced for larger companies: 65% of the top 200 companies

4
(in terms of share capital issued) for example had a single relationship between 1906 and
1966. By 1986 this percentage almost halved to 38%. We also find that throughout the
Twentieth century larger firms and firms with bigger administration boards were more likely
to engage with multiple banks. Around and after the Second World War also leverage starts
determining relationship multiplicity.
Our detailed data allows us to more precisely date the acceleration of the transition to
multiple banking in the 1970s. The duration analyses we perform document that especially
larger, global, more transparent, or more levered companies that are not controlled by a parent
company have a higher need for multiple bank relationships. The result on transparency is
especially robust and consistent across various specifications. In particular, we find that firms
with better governance (i.e., in terms of applying the one share - one vote principle), officially
listed firms (i.e., with securities that have direct access to a large market), and firms with
outstanding arms’ length debt (i.e., already under close scrutiny of financial markets) were
more likely to switch to multiple banking after 1966. Transparent firm headquartered in local
banking markets that became less concentrated were even more likely to switch.
In order to obtain additional insights on the drivers of the transition we group the banks
that are added in three groups: clearing banks (which are large banks headquartered in
London, Scotland or Ireland), other British banks, and foreign banks. Most firms maintain one
relationship with a clearing bank and during the transition simply add another one. This
finding per se may suggest that during this period market competition between banks
intensified. Large firms located in the UK were more likely to add a clearing bank, whereas
small firms were more likely to engage another secondary British bank. These results lend
support to Stein (2002) and Berger, Miller, Petersen, Rajan and Stein (2005) for example who

5
suggest that large (hierarchical) banks are better in dealing with hard information transmitted
via formal documents obtainable from large firms, whereas small banks perform better in
processing soft information acquired informally when dealing with small firms (that often do
not have audited statements for example). Our results also show that transparency and good
governance appear to be important drivers for firms to establish a relationship with a foreign
bank Berger, Klapper, Martinez Peria and Zaidi (2008)).
We therefore think that it is a secular increase in firm size and international presence
coupled with a reduction in firm opaqueness through - for instance - the official listing, and
high leverage without access to parent financing that pushed firms to seek multiple banking.
As during this period market competition between banks intensified, the banks’ response
almost inevitably involved boosting their loan to asset ratio by drawing down their security
and cash to asset ratios (Saunders and Wilson (1999)).
Having established the most prominent and likely cause of the striking transition to
multiple banking in the UK during the 1970s, we investigate its effects on the corporate
leveraging. Identifying a causal relationship that runs from multiple relationships to financial
policies is difficult, as unobservable variables that may lead firms to approach an additional
bank may also have a direct effect on firms’ borrowing and leverage ratios. Our identification
strategy relies on a difference-in-difference analysis.
First, we control for time-invariant factors and compare outcomes of the same firm before
and after it adds a bank to the existing relationship. As a result, any unobserved factor that
drives both the decision to switch to multilateral relationship and firms’ borrowing policies
would have to explain both variables before and after a new bank is added.

6
Second, we compare the outcome variable of “adders” with the outcomes of
observationally equivalent “stayers” that maintained a single relationship. In this way, we
control for environmental and regulatory changes that may have an impact on similar firms
beyond the decision of switching to multiple banks.
Third, we exploit the theoretical predictions of relationship lending models which imply
that when the degree of competition in the banking market is fiercer, the adding of a (so-called
“inside”) bank will have a stronger impact on borrowing conditions (Rajan (1992), von
Thadden (2004), see also Fischer (1990), Sharpe (1990)). As a result, we expect that adders
post-1970 will display larger changes of their debt composition and leverage ratios.
Our analysis finds that adders subsequently increase their leverage and bank debt more and
also decrease their trade (and other) credit more than other firms that did not add banks.
Leverage increased by 4 percentage points more, which given a mean leverage of the matched
firms prior to the event of 46 percent implies a semi-elasticity of 7 percent. Bank debt to total
debt ratio increased by 4 percentage points, a 17 percent increase with respect to the matched
firms prior to the event, while trade credit to total debt contracted by 3 percentage points,
corresponding to a decline of 5 percent vis-à-vis the matched firm prior to the event.
In this way we uncover an additional explanation for the increase in corporate leverage,
i.e., one that runs from banking sector deregulation and intensifying competition between
banks, over firm-bank relationship multiplicity, to corporate leverage and bank debt usage.
We discuss these historical developments more in detail in the next section and summarize
all relevant related empirical findings in Section III. Section IV introduces the data. Section V
discusses the variables and results of our empirical analysis of the determinants of multiple
firm-bank relationships prior to the transition. Section VI presents the duration analyses of the

7
determinants of the transition to multiple banking. Section VII analyses the effects of multiple
banking on corporate leverage. Section VIII concludes.
II. UK Banking in the Twentieth Century
A. Consolidation and Cartelization Prior to the 1970s
In 1870 a total of 387 banks were operating in the U.K. (Capie and Rodrik-Bali (1982)).
British banks were mainly commercial banks involved in various types of business activities:
from providing local means of payment to firms, to acting as financial intermediaries by
attracting or offering money on behalf of their clients. Towards the end of the Nineteenth
century the British banking industry experienced considerable growth in merger activity.
Between 1870 and 1921 there were 264 bank mergers. By 1920 only 75 banks were left in the
U.K., of which just 20 were English or Welsh public banks (Capie and Rodrik-Bali (1982),
Braggion, Dwarkasing and Moore (2012)).
While the consolidation process in its beginning may have increased efficiency and
contributed to the development of a national branching network, in the last years and
especially after 1915 it greatly curbed competition in the industry, and gave to the surviving
bank great monopoly power (Braggion, Dwarkasing and Moore (2012)). The result of this
process was the emergence of the `Big Five' banks in Britain by 1918: Barclays, Lloyds,
Midland, National Provincial, and Westminster. These five banks constituted the core of the
so called London Clearing Banks which starting in the 1920 they dominated retail banking in
various parts of the UK.
Despite the concerns of the contemporaries about the lack of competition in the banking
sector, throughout the 1920s and the 1930s the London clearing banks continued to effectively

8
operate a price cartel. London banks fixed the rate on deposits and advances in relation to the
bank rate. For instance, from 1920 the deposit rate was set at 2% below the Bank rate (Collins
(1988), p. 211). A similar price cartel operated also in Scotland.
The government did not interfere with these arrangements. On the one hand, lobbying
activities of the representatives of the banking industry were particularly effective in keeping
the government from trying to break up the cartel (Collins (1988), p. 211). On the other hand,
the management of the UK national debt led British policy makers to actually promote and
defend the existence of a cartel also beyond War World 2 until the 1970s.2 The rise of public
debt during the two wars in fact increased the government’s reliance on banks for the
maintenance of a market in such debt and Treasury bills constituted a large share in banks
portfolios. The authorities also benefitted in the conduct of their monetary policies by being
able to channel policy changes through a small number of large banks who acted in concert.
After 1965, an increasing range of controls over bank lending, interest rates and asset ratios
was applied to the clearing banks.
B. Deregulation and Intensifying Competition in the 1970s
In the late 1970s, the government and the Bank of England recognized the inadequacy of
this arrangement. From 1971 on, the cartel was progressively dismantled and the UK
2 Most of these agreements were informal. The major agreements were: (a) No interest was to be paid by the clearing banks on current accounts and the rate on deposit accounts was to be fixed at 2% below the level of the Bank rate. (b) The minimum rate charged by the clearing banks on advances to 'blue-chip' borrowers was to be fixed at a given margin above the Bank rate. (c) A tacit agreement determined the prices charged for operating current accounts. (d) Uniform opening hours were adopted. (e) Clearing banks lent a certain proportion of call money to the discount houses at a rate of 4% below the Bank rate which was also the minimum rate at which they would buy bills. (f) Clearing banks did not compete on their own account with the discount houses by tendering for Treasury bills at the weekly tender but bought them from the discount houses after they had been held for more than seven days. (g) The clearing banks maintained cash and liquid assets ratios of 8% and 28% respectively. See Saunders and Ward (1976) for further details.

9
authorities promoted greater competition among financial institutions. In particular, both
ceilings on interest rates and direct credit controls were lifted. Such a change in policy
generated strong competition between banks and other financial intermediaries both on the
deposit and loan market. The by-product was a rapid increase of money supply in the first
years of the 1970s. The Bank of England reacted by sharply raising interest rates.
The sharp increase of the money supply together with the sudden rise of short term interest
rates created severe liquidity problems for the small banks (known as secondary banks),
particularly for those involved in the property market (Saunders and Ward (1976)). Although
these banks were relatively small in respect to the rest of the UK financial market, they had a
sizable number of outstanding loans from the London Clearing banks, with the National
Westminster bank being particularly exposed (Reid (1982), Saunders and Ward (1976)). The
Bank of England and the Treasury reacted to the crisis by organizing, with the cooperation of
the clearing banks, a rescue scheme and by reintroducing some forms of control of credit. In
particular lending restrictions were temporarily re-introduced, although such constraints were
especially focused on loans to consumers, property developers and financial firms rather than
the industrial sector. In 1979, a system of statutory bank supervision was established for the
first time in the UK (Saunders and Wilson (1999)).
The 1960s and 1970s also witnessed the rise of London as a centre of international
banking. Especially after 1958, with the return to external convertibility of most Western
currencies, London emerged as the hub for the market in “Eurodollars”, i.e., the practice of
trading time deposits denominated in foreign currency (especially US dollars) (Battilossi
(2009)). As a result, many foreign banks established branches and activities in the City of
London. These movements were reinforced by the abolition of exchange controls in 1979.

10
To conclude, following deregulation and intensifying competition, the UK banking sector
in 1970s started to supply the opportunities for corporations to seek more bank relationships.
This corporate demand is discussed and investigated in the next sections.
III. Related Empirical Findings
Multiple firm-bank relationships are a common feature in many financial systems, but
there is large variation in the average number of bank relationships across firms within a
country and across countries (see Degryse, Kim and Ongena (2009) for a review). Small firms
tend to maintain fewer bank relationships than large firms. For example, US studies using the
NSSBF (National Survey of Small Business Finance) data estimate the mean number of banks
per firm to be two and the median to be one, while the mean for the large US firms in Houston
and James (1996) equals five. The firm size - number of relationships correspondence has
been further documented for France by Dietsch (2003), for Italy by Guiso (2003), for
Germany by Hommel and Schneider (2003), and for Thailand by Menkhoff and Suwanaporn
(2007) for example.
Many studies regress a bilateral/multilateral relationship dummy or the number of
relationships as the dependent variable on a variety of relation, loan, firm, bank, and/or market
characteristics. Though the specifications differ rather dramatically across the many studies
that have been published, a few results seem robust.
As already indicated larger, but also older firms have more bank relationships ceteris
paribus. Less profitable, distressed, low cash flow, intangible and leveraged firms also
maintain more relationships. These findings broadly fit models for example in which firms
signal their low quality through a multilateral financing arrangement, either because multiple

11
creditors have less bargaining power in bankruptcy (Bris and Welch (2005)) or because
multilateral borrowing ensures the firms’ low quality is revealed resulting in accommodation
by their product market competitors for example potentially attracting high-quality and R&D
intensive firms to opt for a single bank (Bhattacharya and Chiesa (1995), Yosha (1995), von
Rheinbaben and Ruckes (2004)).
Of course, these findings could also be due to the lack of willingness of the banks to bear
all the risk of these borrowers (D'Auria, Foglia and Reedtz (1999) for example) and as such
characteristics of the bank that are part of the bank-firm relationship are also often included in
the regressions. An engagement with an older, larger, state, or foreign bank is more likely to
be part of a multilateral arrangement, potentially to reduce the hold-up problem of repeated
borrowing from this type of bank (Rajan (1992), von Thadden (1992)).
One particular aspect in this line of empirical investigation is the strong country effect,
comprehensively documented in Ongena and Smith (2000) and Qian and Strahan (2007).
Firms in the UK, Norway and Sweden maintain relatively few bank relationships - less than
three on average - while firms in Italy, Portugal, and Spain for example maintain on average
ten or more bank relationships. Ongena and Smith (2000) show that these rankings of the
European countries hold after controlling for firm characteristics such as size. In general,
firms located countries with a French or German legal origin, with a lower degree of judicial
efficiency or shareholder protection, have more bank relationships.
One interesting question, which has received only recently some attention, is whether and
how the number of bank relationships varies over the business cycle or over an even longer
time period. The few studies, that do have access to the necessary data, come to interesting
conclusions. There seems some tantalizing evidence of variation, at a business cycle

12
frequency, in the number of relationships maintained by large firms (Lefilliatre (2002),
Sterken and Tokutsu (2003), D'Auria, Foglia and Reedtz (1999)). But overall the number of
relationships seems quite stable, especially for small firms Proust and Cadillat (1996), without
any clear trend emanating. The number of firm-bank relationships actually trends down in
Hommel and Schneider (2003) and up in Dietsch (2003) for example.
But all of these studies have access to only a few decades of relationship information.
Hence such short time windows may be inadequate to investigate the effect of structural
changes such as changes in legislation, monitoring technology or banking market conditions
on the number of bank relationships. It is this gap in the literature this paper addresses by
studying a century-long comprehensive dataset of firm-bank relationships of publicly listed
firms in the UK, to subsequently establish its impact on corporate financing.
Leary (2009), Sufi (2009), Lemmon and Roberts (2010) and Rice and Strahan (2010) also
investigate how crucial developments in credit markets alter the tightness of credit supply
constraints and consequently corporate borrowing. Leary (2009) shows that the 1961
emergence of the market for certificates of deposit and the 1966 Credit Crunch expands,
respectively contracts the leverage ratios of bank-dependent firms relative to firms with bond
market access. Sufi (2009) studies if the introduction of syndicated bank loan ratings in 1995
in the US affected corporate financial and investment policies. He finds that the introduction
led to an increase of debt finance, cash acquisitions and investment in working capital by
firms that obtain a rating. Lemmon and Roberts (2010) investigate how the collapse of Drexel
Burnham Lambert, Inc., the passage of the Financial Institutions Reform, Recovery, and
Enforcement Act of 1989, and the regulatory changes in the insurance industry which acted as
an exogenous contraction in the supply of below-investment-grade credit after 1989 preceded

13
an almost one-for-one decline in net investment and therefore mostly unaffected corporate
leverage ratios. Rice and Strahan (2010) exploit differences in US states' branching
restrictions and find that in states more open to branching small firms borrow at lower interest
rates and relatively more from banks, though not necessarily in larger amounts. We contribute
to this literature by investigating how salient changes in the U.K. banking market through its
impact on the number of bank relationships that were maintained by corporations affected
corporate leverage.
IV. Firm-Bank Relationships during the Twentieth Century
A. Data Source
The main data source is an annual publication known as The Stock Exchange Official
Yearbook. The Yearbook was published first in 1875 with the purpose of providing
information on joint stock limited liability companies quoted at the London Stock Exchange
and it is regarded as the most authoritative source of information on the matter. Between 1896
and 1966 we retrieve our data from nine issues, in particular from the 1896, 1906, 1916, 1920,
1924, 1934, 1938, 1948, and 1958 issues. Starting in 1966 and ending in 1986 we accessed
eleven issues on a bi-annual basis. We will refer to the 1896 – 1986 period as “the Twentieth
century”, and shorthand the 1966 – 1986 period as “the transition period” (because during that
period multiple firm-bank relationships become more common). We collected data for all
companies listed in the yearbook in the sections “Commercial and Industrial” and “Iron and

14
Steel”. With the exception of 1896, we believe we retrieved information for whole the
population of firms quoted in London and belonging to these sectors.3
For each company the Yearbook provides information on the name of the company and its
location; the name of the directors; the total amount of nominal share capital issued by the
company; and various information related to the company’s corporate governance
arrangements such as: Voting rights, directors borrowing powers and amount of share capital
required to be appointed as directors. In some cases also dividend payments information is
provided. After 1948, the Yearbook provides also a summary of the last available balance
sheet. Crucial for our study, the Yearbook also reports the name of the banks trading with the
company. Unfortunately, the Yearbook does not report the nature of the business relationship
between the firm and the bank(s). In other words, we do not know whether the bank granted a
loan to the firm, or the just bank assists the firm with cash management or both.
We complement the data available in the Yearbook with the information provided by two
other data sources: The Cambridge/DTI Databank and the London Share Price Database
(henceforth, LSPD). The Cambridge/DTI Databank offers a wide range of accounting data for
many U.K. publicly quoted companies covering from 1948 to 1990. Like the dataset we
constructed from the Stock Exchange Yearbook, the Databank provides data for firms in the
commercial and industrial sector. It contains detailed balance sheet information, including
tangible and intangible fixed assets, long term debt, trade credit and –very important for our
analysis- the amount of bank debt. The London Share Price database contains information on
share returns since 1955, a piece of information not available in the Stock Exchange
3 Before 1905, the Yearbook provides a sufficient amount of information only for a selection of firms. Usually, the largest and the most traded firms are included. As a result, we suspect our 1896 sample is biased towards large and liquid companies.

15
Yearbook. The LSPD provide returns data for the largest firms quoted at the London Stock
Exchange plus a random 33% of the remaining firms.
We also collect data on the location of bank branches from the Bankers’ Almanac. Each
year, the Bankers’ Almanac lists the location and the address of the branches of each bank
located in the UK. We collect this information at a biannual basis starting in 1964 until 1986.
B. Multiple Firm-Bank Relationships
Using the Yearbook information we create a variable labelled Multiple Firm-Bank
Relationships that equals one if the company maintains multiple firm-bank relationships, and
equals zero otherwise. This is our main dependent variable. We first discuss its relevant
characteristics.
The upper panel in Table 1 presents the number of firm-bank relationships for each year in
our sample. Relationships with a single bank prevail over the period 1900-1966. In these
years, the average number of banks servicing a company is about 1.2, whereas the median is
1. At least 82% firms maintain a single bank relationship between 1906 and 1966. In 1948 and
1950 the percentage of firms with a single bank relationship stands as high as 87%. The figure
looks quite different in 1976: the percentage of firms having only one bank relationships
drops to 71%, whereas 18% of the companies have two relationships and about 11% more
than one relationship. The shares of firms having only one bank relationships further
decreases to 63.6% in 1986, with 20% of the companies displaying two relationships and
about 16% more than one relationship.
[Table 1 around here]

16
These results are similar to the figures presented by Ongena and Smith (2000) for the year
1996. They investigate the number of bank relationship by sampling 138 large companies in
the U.K and they find that only 23% of firms in their sample maintained a single bank
relationship. Moreover, they show that the average number of bank relationship is 2.9 and the
median number is 2; both figures indicate that maintaining multiple bank relationships is more
prevalent during the 1990s. In sum, the number of bank relationships has increased since
1966.
To provide more detail on the transition from bilateral to multilateral banking Table 1
Panel B reports the number of firm-bank relationships bi-annually for the 1966 – 1986 period
for 599 firms that are reporting their relationships during the entire transition period. This
selection of firms ensures that the average number of relationships the table reports is not
affected by changes in the composition of firms on the stock exchange. For example like
Rossi, Franks and Mayer (2009) we observe a decrease of the number of companies quoted on
the London Stock Exchange from 1966 onwards. This can be partially explained by the
increase in merger and acquisition (M&A) activity that took place on the stock exchange since
then. M&As may increase for example the age and size of the firms listed on the stock
exchange, corporate characteristics that are commonly found to positively affect the number
of bank relationships a firm has (Degryse, Kim and Ongena (2009)).4
Either way, the results basically confirm Panel A (but because of selection the statistics in
level differ somewhat from Panel A). The average number of relationships increases in twenty
4 On the other hand, the group of 599 firms will on average get older during the sample period by one year each sample year. Limiting the group of firms to a specific age cohort of 40-50 years (30-40 years) for example, the percentage of the firms that have a bilateral relationship still decreases from 83% (79%) in 1966 to 62.5% (66%) in 1986.

17
years from 1.3 to 1.8. In 1966 84% of firms engage one bank, in 1986 only 61% do. The
decrease in the percentage single-bank firms is especially pronounced in 1972, 1974 and 1976
when the percentage point drop exceeds 2.5% percentage points in absolute value (3.2, 4.0
and 2.8 percentage points, respectively). In sum, there is a fundamental shift from bilateral to
multilateral banking that takes places around the mid-seventies that our subsequent analysis
aims to explain first by analysing the determinants of multiple banking observed during the
Twentieth century prior to the transition period and then by focusing on the determinants of
the switching to multiple firm-bank relationships during the transition period itself.
V. Firm-Bank Relationships Prior to the Transition Period
A. Independent Variables
We now discuss the firm characteristics that we will employ as independent variables in
our analyses of multiple banking prior to the transition period. The upper panel of Table 2 lists
all variable names, units and definitions. As a proxy of size we employ the amount of share
Capital Issued. The Age of a company, and the first independent variable, is defined as a
particular data year minus the company’s registration year.
We proxy the quality of a company’s corporate governance mechanisms with the size of
the board of the directors, labelled Board Size, a variable Borrowing Limit that is defined as
the borrowing limit for the companies officers divided by the book value of assets, and a
dummy variable, One Share - One Vote (0/1), that takes the value of one if company complies
with the one share - one vote principle and zero otherwise. The size of the board is both a
proxy for the monitoring abilities of the boards over the manager (in principle, bigger boards
should monitor better), and the degree of bureaucracy and a board’s lengthy decision making

18
(bigger boards are more bureaucratic), while the relative limit of borrowing by the company’s
officers is a management perk that may the outcome of management self-serving actions.
The one share – one vote dummy is a measure of the quality of governance that also
directly enhances firm transparency. Another variable that captures firm transparency is the
dummy variable Officially Listed (0/1), that equals one if the company had any class of its
outstanding shares officially listed in London and traded on the floor, and equals zero
otherwise. Being officially listed and traded should make a significant difference in the
amount and quality of information that is available about the corporation, especially in the
early years of the Twentieth century (Braggion (2011)).
In some specifications we also include Arm's Length Debt (0/1) that takes the value of one
if the company has bonds or any other form of arm's length debt outstanding, and equals zero
otherwise, and Arm's Length Leverage which equals the amount of bonds or any other form of
arm's length debt outstanding divided by the book value of assets.
[Table 2 around here]
Finally, the Stock Exchange Yearbook does not provide any direct information on
earnings. Following Kaplan and Reishus (1990), we proxy corporate performance with a
dummy variable, Past Dividends (0/1), that takes the value of one if the company paid
dividends in all the previous five years in respect to particular data year and 0 otherwise (i.e.
the company did not pay a dividend in at least one of the previous five years). We don’t have
this variable for all companies.

19
B. Descriptive Statistics
The nine columns in Table 3 present descriptive statistics for the independent variables for
the nine selected Twentieth century years prior to the transition period. From 1896 until 1958
companies became larger and older, from an average total amount of capital issued of 238,591
pounds and an average of 12 years old in 1896, to 1,083,000 pounds in capital and 39 years in
1958. Table 3 presents the nominal amounts of issued capital but this result holds even in real
terms.
[Table 3 around here]
The size of the board increased somewhat throughout the Twentieth century from an
average of 5.1 members in 1896 to an average of 5.7 in 1986. Interesting is the behaviour of
the dummy variable One Share – One Vote. While in earlier years of the Twentieth century
about half of the companies applied the one share – one vote principle this figure declines in
the 1930s, in 1948 and in 1958. This result possibly suggests that the quality of the corporate
governance declined throughout first half of the Twentieth century (it improved again in the
second half it turns out). The borrowing limit for officers declined from 21% in 1896 to only
3% in 1958. Less than one third of the firms were officially listed in 1896, more than two
thirds were in 1958.
The percentage of firms with arm’s length debt decreased from 58% in 1896 to 12% in
1948, but then more than doubled to 26% in 1958. Arm’s length leverage followed a similar
pattern. According to our proxy of companies’ performance, companies registered the second
worst performance in 1924 where only 73% of firms paid a dividend in each of the two
20
previous years. Performance improved towards the transition period: in 1958 90% had paid
dividends.
C. Results
The nine panels Table 4 present the first set of regression results. We treat each year as a
different sample and for each year we run probit models where the dependent variable takes
the value of one if a company displays multiple bank relationships and zero otherwise.5 We
run various specifications where data allowing we control for firm size, age, board size, one
share – one vote, borrowing limit, listing, leverage, and profitability. We also control for an
industry dummy that takes the value of one if the company operated in the Iron and Steel
sector and equals zero otherwise.
[Table 4 around here]
Throughout the years two results appear to be persistent. First, firms’ size is strongly
associated with a higher probability of multiple banks relationships. The coefficient on the
logarithm of capital issued is positive and highly statistically significant in all the years and all
the specifications. Also the economic significance of the variable is quite persistent
throughout the years. Between 1906 and 1950, a company that increases its size by two
standard deviations around the mean increases by almost 15 percentage points the probability
of having multiple relationships. This increase corresponds to a doubling in the probability of
multiple relationships for the average firm (which ranges between 17.6% in 1906 and 12.5%
5 Results are very similar if we run equivalent Poisson count models with the number of firm-bank relationships as the dependent variable.

21
in 1950). Second, companies with larger boards of directors are more likely to have multiple
firm-bank relationships, which is maybe also partly due to the combination of individuals’
bank preferences and consensus decision-making (Ongena, Tümer-Alkan and Vermeer
(2011)).6 The economic significance of the variable, however, also declines somewhat over
time.
The impact of firm age is ambiguous. Young companies are more likely to have multiple
relationships in 1916 and 1920, whereas in the other years older companies are more likely to
have multiple relationships. Other measures of corporate governance quality, transparency,
firm leverage and profitability appear to have no robustly significant impact on firms’ choices
of the number of bank; with the possible exception of the positive coefficients (which are
significant at the ten or lower percent level in at least one specification) for official listing in
1896, 1906, 1924, 1934, and 1938, and arm’s length debt in 1938, 1948 and 1958. However,
overall, firm and board size are the main drivers of relationship multiplicity but seemingly
with a decreasing effect over time (possibly because firm and board size themselves increase).
VI. The Transition to Multiple Banking between 1966 and 1986
A. Duration Analysis of the Transition to Multiple Banking
We now investigate the possible drivers of the transition from single to multiple firm-bank
relationships using a duration analysis on the observed relationships between 1966 and 1986.
As in Farinha and Santos (2002) we define each single relationship as a spell and the
transition to multiple banking as a switch (at which stage the spell ends and the firm exits the
6 We leave a further investigation of the change in board size and composition, and of the presence and the role of bankers on boards (as in Dittmann, Maug and Schneider (2010) for example) for future research.

22
sample). All spells start in 1966 or later and end before or in 1986, because this is the period
for which we collect the bi-annual readings from the Yearbook. Single relationships that do
not change into multiple banking are therefore right-censored in 1986 (or prior to that if the
firm delists). To provide correct inferences the estimator will have to be right-censoring
robust (see Kiefer (1988), Ongena and Smith (2001), and Degryse, Kim and Ongena (2009)
for example for details).
Tables 5 and 6 provide the first glance at the likelihood of the transition to multiple
banking. Table 5 reports the number, percentage and cumulative percentage of single firm-
bank relationships that turn to multiple firm-bank relationships for all single relationships,
those that are observed and initiated prior to or in 1966 and those that are observed and
initiated after 1966. The distributions reported in the table are not adjusted for right-censoring
(i.e., every exit from the spell is considered a transition to multiple banking) and its effect is
especially pronounced for those spells that are initiated after 1966 and for which the right-
censoring boundary in 1986 (or the individual firm delisting) is much more binding.
[Table 5 around here]
In contrast, the Kaplan-Meier survivor function that is calculated in Table 6 is adjusted for
right-censoring. The function suggests that within this transition period after 20 years 41
percent of all firms have made the transition to multiple banking (and not 100 percent as a
non-adjusted function would imply). Hence, the transition to multiple banking is wide-spread
and pursued by many firms that start the transition period with a single relationship.

23
[Table 6 around here]
B. Independent Variables
The determinants of the transition to multiple banking can be multiple. Firm size,
complexity and international presence can lead to larger, more complex and geographically
diverse corporate credit and service demands, necessitating multiple bank relationships. To
proxy for size we employ the logarithm of the firm’s Book Value of Assets. For complexity we
field the logarithm of one plus the Age at Start (we take the age of the firm at the start of the
spell because otherwise firm age may spuriously determine the duration of the spell as
deterministically the longer the spell, the higher the age). For international presence, we
feature the dummy variable British (0/1) that equals one if the headquarters of the firm is
located in Britain, and equals zero otherwise. We expect positive coefficients on all three
variables.
Despite the fact that the bankruptcy legislation was left unchanged for most of the
Twentieth century, it is possible that the liquidation value of companies’ assets may have
increased making multiple bank relationships more desirable. In other words, the increased
liquidation value of the companies, decreased the bankruptcy cost for managers, making
strategic defaults more likely and a higher number of creditors more optimal (Bolton and
Scharfstein (1996)). To proxy for the quality of governance we therefore include again the
logarithm of one plus Board Size.
Firms that are more levered may also need to add bank relationships. A variable Leverage
equals the total amount of mortgages plus debentures plus short-term debt divided by the book
value of the assets.

24
As before we also include two dummy variables capturing firm transparency, i.e., One
Share - One Vote (0/1), Officially Listed (0/1). In the survival analysis we also consider the
dummy Arm's Length Debt (0/1) as a valid measure of a firm’s transparency. Since our
specifications control for total leverage, in principle, this variable should capture only that
firms with outstanding arm’s length debt are already under the close scrutiny of capital
markets (Rajan (1992), Faulkender and Petersen (2006)). A higher degree of firm’s
transparency should reduce banks’ monitoring costs making multiple bank relationships more
desirable (von Thadden (1992)). When monitoring costs are lower, banks find profitable to
lend in multilateral agreements, and, as a result the hold-up problem is alleviated. We
therefore expect positive coefficients on these three dummy variables.
We also include a dummy variable Subsidiary (0/1) that equals one if the company is
controlled by another company, and equals zero otherwise, because internal capital market
financing obtainable through the parent company may alleviate some of the firm’s financing
needs. We expect positive signs on the leverage variable and a negative sign on the subsidiary
dummy.
R&D intensive but high-quality firms may opt for a single bank (Bhattacharya and Chiesa
(1995), Yosha (1995), von Rheinbaben and Ruckes (2004)). Tangibility is property, plant and
equipment divided by the book value of assets, while firm profitability is measured as Past
Returns which is the returns on the firm's stock in the previous two years.
Firms may seek to diversify bank liquidity risk (Detragiache, Garella and Guiso (2000)).
We introduce a dummy variable Relationship Bank is National Westminster in 1974 or 1976
(0/1) which equals one if the firm had a relationship with a secondary bank particularly
affected by the liquidity shortages in the mid-1970s, Relationship Bank Liquidity Ratio which

25
is the cash and marketable securities divided by the book value of assets of the relationship
bank of the firm, and Relationship Bank Capital Ratio which is the total equity capital and
reserves divided by the book value of assets of the relationship bank of the firm. If firms
diversify, we would possibly expect a positive sign on the first variable and negative signs on
the latter two.
Finally, firms are more likely to add a bank in areas where competition intensifies most.
We therefore include a variable called Change in Concentration of Banking Market Where
Firm Has Headquarter, which we calculate as the change in the sum of the banks’ shares in
terms of branch presence in the local banking market where the firm is headquartered (i.e., the
change in the Herfindahl-Hirschman Index based on branch presence).
Table 7 tabulates the descriptive statistics for a maximum of 15,434 relationship – year
observations. The mean (median) firm has 15 (3) million British Pound in book assets and is
62 (63) years old. 93 percent of the firms are headquartered in Britain. The average (median)
firm fields 6 (6) board members, has a 48 percent chance of following a one share – one vote
system, 84 percent are officially listed, 43 percent have arm’s length debt outstanding, with an
overall leverage ratio of 37 (37) percent. 14 percent of all firms are controlled by another
company. The mean (median) firm has a tangibility ratio that equals 36 (33) percent, with a
ROE that equals 24 (23) percent and past returns that equal 1 (1) percent.
Only 4 percent of the firm-years pertain to firms that had a relationship with National
Westminster in 1974 or in 1976, while the liquidity ratio of the relationship bank of the
average (median) firm equals 30 (28) percent while its capital ratio equals 16 (6) percent.7
7 We collected and cross-checked the data with most extensive care hence choose not to winsorize (despite the presence for example in the capital ratio series of one potential outlier). The main results are unaffected however if we do.

26
Finally, one third of the firms have their headquarters in London, while the mean (and
median) change in concentration is close to zero, but with a substantial dispersion across local
banking markets.
[Table 7 around here]
C. Results
In Table 8 we investigate more closely what the determinants are of the transition to
multiple banking.8 The table reports results based on maximum likelihood estimations of the
proportional hazard model using the Cox (1972) proportional hazard function as the baseline
hazard (in unreported robustness exercises we also employ Weibull and exponential
distributions but results are very similar). The independent variables are defined in Table 1.
The number of observations varies between 14,635 and 4,684 according the combination of
variables that is included.
8 In unreported estimations we alternatively define each relationship as a spell and relationship termination as a switch at which stage the relationship spell ends but the firm remains in the sample with other and new relationships as in Ongena and Smith (2001). Consequently, spells start in 1966 or later and end before or in 1986, and relationships that do not terminate are right-censored in 1986 (or prior to that if the firm delists). Our estimates can be summarized as follows: The hazard rate averages around 3 percent per year and the median duration length is around 20 years, comparable in magnitude with findings for Argentina (Bebczuk (2004)), Italy (Castelli, Dwyer Jr. and Hasan (2006)), Norway (Ongena and Smith (2001)), Spain (Hernandez-Canovas and Martinez-Solano (2006)), or Sweden (Sjögren (1994)) for example during similar time periods. Larger or older firms are less likely to terminate a relationship, findings also documented for Belgium (Degryse, Masschelein and Mitchell (2011)), Denmark (Thomsen (1999)), Italy (Herrera and Minetti (2007)) and Norway (Ongena and Smith (2001)) for example. Firms that are British, with larger boards, or that are transparent are also less likely to terminate a relationship. More levered firms or those with more firm-bank relationships already are more likely to seek a new relationship. These results correspond to robust empirical findings for Belgium (Degryse, Masschelein and Mitchell (2011)) and Norway (Ongena and Smith (2001)) for example, and to reasonable priors (i.e., levered firms want to decrease lock-in by switching regularly and the value of each individual relationship should be lower when firms have multiple relationships). Overall, these results are complementary to those found analyzing the switching from single to multiple banking.

27
[Table 8 around here]
Firm size or having the headquarters outside of Britain has a positive impact on the
likelihood of the transition to multiple banking as the estimated coefficients are all both
statistically significant and economically relevant. For example, being a British firm almost
halves the hazard rate in Model IV (i.e., 0.58 = e-0.538).
Transparency matters a great deal. One share - one vote, being officially listed, and arm’s
length debt all speed the transition. Being officially listed for example increases the hazard
rate by more than half in Model IV (i.e., 1.63 = e0.493). More levered firms or firms without a
controlling parent also are more likely to add another bank. Having an illiquid relationship
bank decreases the likelihood of engaging an additional bank (in Model VIII), seemingly in
pointed contrast to a diversification-of-bank-liquidity-risk argument; on the other hand,
having National Westminster as a relationship bank in 1974 or 1976 increases this likelihood,
consistent with the diversification argument.
In Models IX to XVI we add the change in concentration in the local banking market.
Because of multicollinearity we replace British by Firm Has Headquarter in London, and in
Models XIII to XVI also focus on firms outside London where changes in concentration may
even be more meaningful in capturing the changes in the degree of local competition in
banking markets dealing with corporate financing (as in London many foreign banks also
entered to focus on euro dollar business). The estimated coefficient on the change in
concentration in Model IX for example implies that a decrease in concentration by 0.10
increases the probability of adding a bank by 11 percent.

28
In Models X to XII and XIV to XVI we interact the change in concentration with the
transparency variables one share - one vote, being officially listed, and arm’s length debt.
Consistent with our findings so far the estimated coefficients (on the first two variables)
suggest that in local banking markets that become less concentrated it is especially the more
transparent firms that add banks.
We also investigate which type of bank is added. We distinguish between clearing banks
(mostly large London based banks), other British banks and foreign banks. Table 9 lists the
number and percentage of relationship – year observations between 1966 and 1986 by the
type of relationship bank and added bank. Clearing banks account for 96 percent of all
relationship bank observations (85 percent are headquartered in London, 8 percent in Scotland
and 3 percent in Ireland), while other British and foreign bank account for only 2 percent
each.
Surprisingly, given these proportions, many firms add another clearing bank as a second
bank, resulting in 62 percent of the added bank observations. Other (secondary) British banks
account for 13 percent, while foreign banks for more than 25 percent (of which 8 percent to
commonwealth banks and the remainder to other foreign banks). These percentages suggest
that while many firms simply engage another clearing bank possible to increase access to
credit, other firms “trade down” to a (secondary) British bank possibly to obtain a better size
fit, or engage a foreign bank possibly to obtain better trade-related financial services.
[Table 9 around here]

29
In regressions we leave un-tabulated we also investigate more closely what the
determinants are of the adding of a clearing bank, another British bank, or a foreign bank.
Interestingly we find that larger, transparent, levered or independent firms are more likely to
add a clearing bank. Smaller, non-British, listed or independent firms are more likely to add
another British bank, while non-British, one-share-one-vote or listed firms are more likely to
add a foreign bank. The higher the liquidity ratio of the current relationship bank the more
likely a British bank is added.
In sum, it is a straightforward increase in firm size and international presence coupled with
a reduction in firm opaqueness that made levered firms without access to parent financing to
engage multiple banks: Larger and more levered firms simply add another clearing bank,
while non-British or more transparent firms more likely add another British or foreign bank.
Coinciding deregulation and intensifying banking competition therefore likely fostered the
banks’ supply.
D. Other Explanations
On the basis of the precise timing of the transition, we consider some other explanations to
be less likely to be important drivers of the transition to multiple banking. First, it is
improbable that the improvement of creditors’ protections legislation, established with various
Companies acts from 1929 onward, can alone explain our results.9 Improvements in creditor
9 The Twentieth century was characterized by a marked improvement in the U.K. in the legislation regarding investor protections and companies’ disclosure requirements. Originally, the U.K. common law system did not provide minority shareholders and investors with an automatic right of protection. It was the 1948 company Act that established various provisions intended to protect creditors and minority shareholders from managers’ expropriation. For instance, the Act set in voting by proxy, provisions for shareholders to force an EGM with 10% of the voting equity capital, and special resolutions to make it easier for shareholders to remove directors. Further progresses were made in the late 1960s by, for instance, considering managers liable of crimes if they communicate false corporate information.

30
protections and accounting standards may reduce banks’ monitoring costs and increase the
probability of observing multiple banks relationships (Rajan (1992), von Thadden (2004)).10
In the UK, the bulk of the creditor protection and accounting reforms took place in 1948,
twenty years before the transition to multiple relationships started. The improvement of
investor protection makes also less likely that “soft budget constraint” problems and related
strategic default issue are among the driver of the transition to multiple banking. According to
these theories, the improvement of creditor protection should make multiple-relationship
banking less desirable, but in our data we observe that the number of relationship banks
increase during the Twentieth century
Second, we think it is unlikely that the transition from a single to multiple bank
relationships is due to a firms’ need to diversify increased bank liquidity risk (Detragiache,
Garella and Guiso (2000)). British banks were liquid and since the crisis of 1890 (the so-
called “Baring Crisis”) did not experience any major crisis until 2007 (i.e., well beyond the
end of our sample period), with the possible exception of liquidity problems that arose at the
small, secondary banks during the mid-1970s. Duration analyses on bi-annual relationship
data for the 1966 to 1986 time period, suggest that having a relationship in 1974 or 1976 with
National Westminster for example, a bank that was particularly affected by these liquidity
shortages, does not change the probability firms switches from single to multiple banking,
while having a liquid and well capitalized bank in general actually increases the probability
10 Asymmetric information problems between a borrowers and a single lender that get resolved over time in a relationship create an informational advantage for the inside lender that can be exploited to extract rents (Rajan (1992), von Thadden (2004)). Multiple bank relationships may reduce the hold-up problem of relationship lending. When banks’ monitoring costs lower, it becomes more profitable for banks to lend in multilateral agreements with other banks and firms should be more likely to engage multiple banks (von Thadden (1992)).

31
the firm switches. Consequently also the diversification motive does not explain the
remarkable transition to multiple relationships.
Finally, it is similarly implausible that the banks nudged their borrowers to maintain
multiple relationships to diversify their own risk exposure (Carletti, Cerasi and Daltung
(2007)). Investment diversification opportunities increased along the Twentieth century
together with the process of economic development, making multiple lending less necessary.
Moreover, Carletti, Cerasi and Daltung (2007) predicts that a decrease in the monitoring cost
should lead to a decrease of multiple lending,11 exactly the opposite of what we observe in our
data (see also Carletti (2004), Fluet and Garella (2007)).
VII. Multiple Banking and Corporate Financing and Performance
A. Corporate Financing and Performance
We now investigate the impact of the transition to multiple banking on corporate financing,
i.e., leverage, bank debt to total debt, long term debt to total debt, trade credit to total debt,
and the growth in these measures, and on corporate performance, i.e., return on equity, during
a fifteen-years period before and after 1970. Table 10 provides the descriptive statistics for
these corporate characteristics for the entire 1955 – 1986 period, and for the shorter 1968 –
1973 period upon which a pertinent robustness check will be based.
11 In terms of the quality of firm financial information, the Twentieth century was also characterized by constant and gradual improvements. The quality of information presented in published accounts at the turn of the Twentieth century was limited when compared to present day standards. The Companies Act, 1900 required auditors to certify that the accounts reflected a "true and correct view of the state of the Company's affairs". Annual balance sheets were required to be furnished by firms, and although usually provided, annual profit and loss statements were not mandatory by law until 1929 (see Hein (1963)). The 1948 Companies Act introduced disclosure rules for prospectuses and specific penalties for non-disclosure, detailed provisions regarding the content and form of both balance sheets and profit and loss accounts and a requirement that company accounts be prepared on a basis that gives a “true and fair” view of a company’s financial position, a litmus test of company accounts that has been applied to the present day.

32
[Table 10 around here]
B. Methodology
We relate the changes in corporate financing and performance to multiple banking by
judiciously investigating the difference between firms that add banks and otherwise
observably similar firms that did not add banks. Following Angrist and Krueger (1999) and
Lemmon and Roberts (2010), we adopt a difference in difference analysis to understand
whether adding a bank to the existing relationship has an effect on firms’ financial policies.
We then see whether this effect is stronger for firms that added a bank after the 1971 bank
liberalization. While performing the difference in difference analysis we make sure that the
key identifying assumption behind this strategy, usually referred as “parallel trends
assumption” is satisfied. Such an assumption requires similar trends in the outcome variable
during the pre-shock era for both treatment and control groups. In the current context, this
assumption translates into similar growth rates of firms’ aggregates such as leverage or
investment for the treatment and control groups prior to the year in which a firm added a new
bank.
We start by generating a dummy variable which we label EVENT that takes the value of
one if a firm adds a bank and equals zero otherwise. We generate this variable at the biannual
frequency for which we collected the number of bank relationships for each firm.
At a biannual frequency, between 1956 and 1986, we compute the propensity score by
running a probit model where the dependent variable is EVENT. The propensity score is
computed using a comprehensive set of the following firm variables we have access to:
33
ln(1+Age), ln(Book Value of Assets), One Share - One Vote (0/1), Officially Listed (0/1),
Arm’s Length Debt (0/1), ), Tangibility, Net Investment (in Tangible + Intangible +Trade),
Growth of Bank Debt, , Growth of Long Term Debt, Net Share Issues to Book Value of
Assets, Return on Equity, and Industry affiliation. Age and the dummy variables are lagged
for two periods because EVENT, i.e., the adding of a new bank to an existing firm-bank
relationship, is recorded at a biannual basis. All continuous variables are the averages of the
pre-adding period.
We select a matching firm by using the nearest-neighbor method. For each adding firm we
select the nearest neighbor and we take the average values for leverage, bank debt to total
debt, etc., of the matching firms.
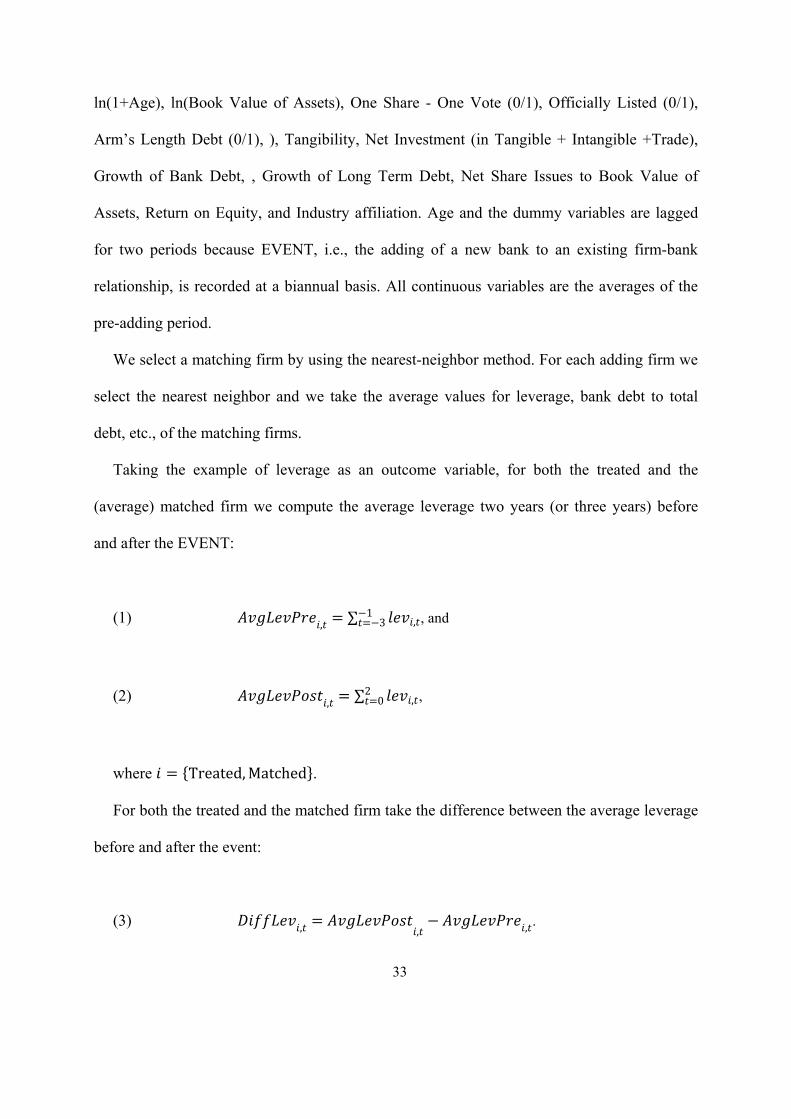
Taking the example of leverage as an outcome variable, for both the treated and the
(average) matched firm we compute the average leverage two years (or three years) before
and after the EVENT:
(1) , ∑ ,13 , and
(2) , ∑ ,20 ,
where Treated,Matched .
For both the treated and the matched firm take the difference between the average leverage
before and after the event:
(3) , , , .

34
As a final step, we take the difference of:
(4) , ,
The results we present (in Table 12) correspond to the average difference-in-difference
analysis for the whole sample, the pre-1970 period (1970 included), and the post-1970 period.
This procedure has two benefits. First, it controls for firm-specific time-invariant factors and
compares the outcomes for the same firm before and after the event of adding a bank to the
existing relationship bank. As a result, any unobserved factor that drives both the decision to
switch to multilateral relationships and the firms’ borrowing policies would have to explain
both variables before and after a new bank is added. As noted by Sufi (2009) such an
approach controls also for other factors related to firm’s investment demand such as market to
book ratio.
Second, the propensity score analysis controls for environmental and regulation changes
that may have an impact on the borrowing of similar firms’ beyond the decision of switching
to multiple banks. For instance, the 1970 bank deregulation could have led large firms to
increase their proportion of bank to total debt, independently of the decision of adding an
extra-bank.
We also obtain additional identification power by exploiting the predictions of the theory
of relationship banking: adding a bank should have a stronger impact on corporate borrowing
when the degree of competition in the banking market is higher. As a result, we expect that
post-1970 adders will display larger changes in their debt composition and leverage ratios.

35
C. Results
Table 11 first reports for the pre- and post-matching samples, the mean (and the standard
deviation) of the matching variables for the firms that did not add banks ("the stayers") and
the firms that add banks ("the adders"), and the difference between the two means. It also
assesses the difference in means between the pre- and post-matching samples, reporting the t-
statistic for a test of the equality of the means assuming equal variances, and the Kolmogorov-
Smirnov test statistic. The testing confirms that matching does generate samples that are
mostly equal in the matching variables (similar to Lemmon and Roberts (2010) and to match
on individual firm growth we employ seven year growth rates or averages of continuous
variables, as indicated; results are robust to further lengthening of this time period while
shortening it decreases matching performance somewhat without affecting our main estimates
of interest).
Table 12 reports the difference-in-difference analysis for the different samples. For the
whole 1956 – 1986 period we find that leverage of firms that add a bank increases more than
otherwise similar firms that did not add a bank. This difference is however only significant in
the period after 1971, when these “adders” are observed to increase bank financing but
decrease trade (and other) credit taken, but have a similar ROE.
[Table 12 around here]
The statistical differences we observe are also economically meaningful. Leverage
increased for example by 3.1 percentage points, with a mean leverage of the matched firms
prior to the event of 41 percent implying a semi-elasticity of 7.4 percent. Similarly, long term

36
leverage increases by 2.0 percentage points, a semi-elasticity of , bank debt to total debt
increased by 3.5 percentage points, a semi-elasticity of 18.2 percent, while trade credit to total
debt contracted by 3.4 percentage points, a semi-elasticity of 5.1 percent.
Finally, in Table 13, and as a set of robustness exercises, we run the corporate financing
and performance variables on firm controls and interaction terms of Post 1970 (0/1), a dummy
that equals one for years after 1970 and equals zero otherwise, with the three variables that
explain the adding of banks, i.e., One Share - One Vote (0/1), Officially Listed (0/1), and
Arm's Length Debt (0/1). We restrict the analysis here to the 1968-1973 period, in order to
have as clean as possible an experiment. In 1967, the company law required businesses to
publish annual information about sales, substantial participations in other companies and
classes of business being carried on (see Cheffins (2008), p. 329). In 1973 the taxation of
dividends was amended and the tax bias against dividends practically removed (Cheffins
(2008), p. 325).
Results broadly confirm that firm transparency which corresponded to more banks being
engaged also involves more corporate leverage and bank financing. The semi-elasticities of
the impact of One Share - One Vote and Arm’s Length Debt after 1970, respectively are on
leverage 2.8 and 7.0 percent, on bank debt over total debt 10 and 13 percent, on long term
debt over total debt 8.3 and 19.4 percent, and on trade credit over total debt -3.5 and -2.7
percent.
[Table 13 around here]

37
In sum, the multiplicity of bank relationships as the outcome of factors on the supply
(deregulation) and demand (firm transparency) side is consistently reflected in higher
leverage.
VIII. Conclusions
In this paper we analyze how relationships between firms and banks have evolved during
the Twentieth century in Britain. We document a remarkable shift from bilateral to
multilateral relationship banking during this period. Our detailed data allows us to more
precisely date the acceleration of the transition to multiple banking in the 1970s. On the basis
of this more precise dating we can rule out a number of possible explanations, such as an
improvement of creditors’ protections legislation, the intended diversification of bank risk
exposure, a variation in the cost of bankruptcy, or the deterioration in bank liquidity.
Using duration analyses on bi-annual relationship data for the 1966 to 1986 time period we
document that larger, global or transparent companies, or companies in greater need of
financing, or located in local banking markets that become less concentrated (especially so
when transparent), have a higher propensity to switch to multiple firm-bank relationships.
Given that we are not aware of any alternative or additional theoretical explanations that fit
the data, we think that it is simply this secular firm level increase in size, international
presence, and transparency coupled with an enhanced financing need that led to multiple
banking. This process of over-time increasing demand for more bank credit and more
sophisticated services may eventually have found its supply during the 1970s because of the
far-reaching deregulation and the intensification of competition in the banking sector that took
place during that period.

38
More than suggestive on this account is the increase in leverage and bank debt taken by
firms that added a bank compared to those that do not. Banking sector deregulation and
intensifying competition may therefore be one of the factors explaining the dramatic increase
in corporate leverage observed in the U.K. and throughout the world during the Twentieth
Century.

39
References
Angrist, J. D., and A. B. Krueger, 1999, "Empirical Strategies in Labor Economics," in O. Ashenfelter and D. Card, eds, Handbook of Labor Economics.
Battilossi, S., 2009, The Eurodollar Revolution in Financial Technology. Deregulation, Innovation and Structural Change in Western Banking in the 1960s-70s, Universidad Carlos III, Madrid.
Bebczuk, R. N., 2004, What Determines the Access to Credit by SMEs in Argentina?, Universidad Nacional de la Plata, Plata.
Berger, A. N., L. F. Klapper, M. S. Martinez Peria, and R. Zaidi, 2008, "Bank Ownership Type and Banking Relationships," Journal of Financial Intermediation 17, 37-62.
Berger, A. N., N. M. Miller, M. A. Petersen, R. G. Rajan, and J. C. Stein, 2005, "Does Function Follow Organizational Form? Evidence from the Lending Practices of Large and Small Banks," Journal of Financial Economics 76, 237-269.
Bhattacharya, S., and G. Chiesa, 1995, "Proprietary Information, Financial Intermediation, and Research Incentives," Journal of Financial Intermediation 4, 328-357.
Bizer, D. S., and M. DeMarzo, 1992, "Sequential Banking," Journal of Political Economy 100, 41-61.
Bolton, P., and D. S. Scharfstein, 1996, "Optimal Debt Structure and the Number of Creditors," Journal of Political Economy 104, 1-25.
Braggion, F., 2011, "Managers and (Secret) Social Networks: The Influence of the Freemasonry on Firm Performance," Journal of the European Economic Association Forthcoming.
Braggion, F., N. Dwarkasing, and L. Moore, 2012, From Competition to Cartel: Bank Mergers in the U.K. 1885 to 1925, Tilburg University, Tilburg.
Bris, A., and I. Welch, 2005, "The Optimal Concentration of Creditors," Journal of Finance 60, 2193 - 2212.
Capie, F., and G. Rodrik-Bali, 1982, "Concentration in British Banking, 1870-1920," Business History 24, 280-292.
Carletti, E., 2004, "The Structure of Bank Relationships, Endogenous Monitoring, and Loan Rates," Journal of Financial Intermediation 13, 58-86.
Carletti, E., V. Cerasi, and S. Daltung, 2007, "Multiple-Bank Lending: Diversification and Free-Riding in Monitoring," Journal of Financial Intermediation 16, 425-451.
Castelli, A., G. P. Dwyer Jr., and I. Hasan, 2006, Bank Relationships and Small Firms’ Financial Performance, Federal Reserve Bank of Atlanta, Atlanta.
Chambers, D., and E. Dimson, 2009, "IPO Underpricing Over the Very Long-Run," Journal of Finance 64, 1407-1443.
Cheffins, B. R., 2008, Corporate Ownership and Control: British Business Transformed, Oxford University Press, Oxford.
Collins, M., 1988, Money and Banking in the UK: A History, Croom Helm, London. Cox, D. R., 1972, "Regression Models and Life Tables," Journal of the Royal Statistical
Society 24, 187-201. D'Auria, C., A. Foglia, and P. M. Reedtz, 1999, "Bank Interest Rates and Credit Relationships
in Italy," Journal of Banking and Finance 23, 1067-1093.

40
Degryse, H., M. Kim, and S. Ongena, 2009, Microeconometrics of Banking: Methods, Applications and Results, Oxford University Press.
Degryse, H., N. Masschelein, and J. Mitchell, 2011, "Staying, Dropping, or Switching: The Impacts of Bank Mergers on Small Firms," Review of Financial Studies 24 1102-1140.
Degryse, H. A., V. Ioannidou, and E. L. v. Schedvin, 2011, On the Non-Exclusivity of Loan Contracts: An Empirical Investigation, CentER - Tilburg University, Tilburg.
Detragiache, E., P. G. Garella, and L. Guiso, 2000, "Multiple versus Single Banking Relationships: Theory and Evidence," Journal of Finance 55, 1133-1161.
Dietsch, M., 2003, "Financing Small Businesses in France," European Investment Bank Papers 8, 93-119.
Dittmann, I., E. Maug, and C. Schneider, 2010, "Bankers on the Boards of German Firms: What They Do, What They Are Worth, and Why They Are (Still) There?," Review of Finance 14, 35-71.
Farinha, L. A., and J. A. C. Santos, 2002, "Switching from Single to Multiple Bank Lending Relationships: Determinants and Implications," Journal of Financial Intermediation 11, 124-151.
Faulkender, M., and M. A. Petersen, 2006, "Does the Source of Capital Affect Capital Structure?," Review of Financial Studies 44, 45-79.
Fischer, K., 1990, Hausbankbeziehungen als Instrument der Bindung zwischen Banken und Unternehmen - Eine Theoretische und Empirische Analyse, Universitat Bonn, Bonn.
Fluet, C., and P. G. Garella, 2007, Relying on the Information of Others: Debt Rescheduling with Multiple Lenders, Université du Québec, Montréal.
Frydman, C., and R. E. Saks, 2010, "Executive Compensation: A New View from a Long-Term Perspective," Review of Financial Studies 23, 2099-2138.
Graham, J. R., M. Leary, and M. Roberts, 2011, A Century of Capital Structure: The Leveraging of Corporate America, Duke University, Durham NC.
Guiso, L., 2003, "Small Business Finance in Italy," European Investment Bank Papers 8, 121-147.
Hein, L. W., 1963, "The Auditor and the British Companies Act," Accounting Review 508-520.
Hernandez-Canovas, G., and P. Martinez-Solano, 2006, "Banking Relationships: Effects on the Debt Terms of the Small Spanish Firms," Journal of Small Business Management 44, 315-333.
Herrera, A. M., and R. Minetti, 2007, "Informed Finance and Technological Change: Evidence from Credit Relationships," Journal of Financial Economics 83, 223-269.
Hommel, U., and H. Schneider, 2003, "Financing the German Mittelstand," European Investment Bank Papers 8, 53-90.
Houston, J., and C. James, 1996, "Bank Information Monopolies and the Mix of Private and Public Debt Claims," Journal of Finance 51, 1863-1889.
Kaplan, S. N., and D. Reishus, 1990, "Outside Directorships and Corporate Performance," Journal of Financial Economics 27, 389-410.
Kiefer, N. M., 1988, "Economic Duration Data and Hazard Functions," Journal of Economic Literature 26, 646-679.
Leary, M. T., 2009, "Bank Loan Supply, Lender Choice, and Corporate Capital Structure," Journal of Finance 64, 1143-1185.
Lefilliatre, D., 2002, La Multibancarite, Banque de France, Paris.

41
Lemmon, M., and M. R. Roberts, 2010, "The Response of Corporate Financing and Investment to Changes in the Supply of Credit," Journal of Financial and Quantitative Analysis 45, 555–587.
Menkhoff, L., and C. Suwanaporn, 2007, "The Rationale of Bank Lending in Pre-crisis Thailand," Applied Economics 39, 1077-1089.
Ongena, S., and D. C. Smith, 2000, "What Determines the Number of Bank Relationships? Cross-Country Evidence," Journal of Financial Intermediation 9, 26-56.
—, 2001, "The Duration of Bank Relationships," Journal of Financial Economics 61, 449-475.
Ongena, S., G. Tümer-Alkan, and B. Vermeer, 2011, "Corporate Choice of Banks: Decision Factors, Process and Responsibility – First Evidence," Journal of Corporate Finance 17, 326-351.
Proust, Y., and D. Cadillat, 1996, "La Multibancarisation de 1992 a 1995," Bulletin de la Banque de France Supplement Etudes 39-51.
Qian, J., and P. E. Strahan, 2007, "How Law and Institutions Shape Financial Contracts: The Case of Bank Loans," Journal of Finance 62, 2803-2834.
Rajan, R. G., 1992, "Insiders and Outsiders: the Choice between Informed and Arm's-Length Debt," Journal of Finance 47, 1367-1400.
Rajan, R. G., and L. Zingales, 2003, "The Great Reversals: The Politics of Financial Development in the 20th Century," Journal of Financial Economics 69, 5-50.
Reid, M., 1982, The Secondary Banking Crisis, 1973-75. Its Causes and Courses, MacMillan Press, London.
Rice, T., and P. E. Strahan, 2010, "Does Credit Competition Affect Small-Firm Finance?," Journal of Finance 65, 861-889.
Rossi, S., J. Franks, and C. Mayer, 2009, "Ownership: Evolution and Regulation," Review of Financial Studies 22, 4009-4056.
Saunders, A., and C. Ward, 1976, "Regulation, Risk and Performance of U.K. Clearing Banks 1965-75," Journal of Industrial Economics 25, 143-159.
Saunders, A., and B. Wilson, 1999, "The Impact of Consolidation and Safety-Net Support on Canadian, US and UK banks: 1893--1992," Journal of Banking and Finance 23, 537-571.
Schularick, M., and A. M. Taylor, 2012, "Credit Booms Gone Bust: Monetary Policy, Leverage Cycles, and Financial Crises, 1870–2008," American Economic Review 102 1029–1061.
Sharpe, S. A., 1990, "Asymmetric Information, Bank Lending and Implicit Contracts: a Stylized Model of Customer Relationships," Journal of Finance 45, 1069-1087.
Sjögren, H., 1994, "Long-Term Financial Contracts in the Bank-Orientated Financial System," Scandinavian Journal of Management 10, 315-330.
Stein, J., 2002, "Information Production and Capital Allocation: Decentralized versus Hierarchical Firms," Journal of Finance 57, 1891-1922.
Sterken, E., and I. Tokutsu, 2003, What Are the Determinants of the Number of Bank Relations of Japanese Firms?, CSOS Centre for Economic Research, Groningen.
Sufi, A., 2009, "The Real Effects of Debt Certification: Evidence from the Introduction of Bank Loan Ratings," Review of Financial Studies 22, 1659-1691.
Thomsen, S., 1999, The Duration of Business Relationships: Banking Relationships of Danish Manufacturers 1900-1995, Copenhagen Business School, Copenhagen.

42
von Rheinbaben, J., and M. Ruckes, 2004, "The Number and the Closeness of Bank Relationships," Journal of Banking and Finance 28, 1597-1615.
von Thadden, E.-L., 2004, "Asymmetric Information, Bank Lending, and Implicit Contracts: the Winner's Curse," Finance Research Letters 1, 11-23.
von Thadden, E. L., 1992, The Commitment of Finance, Duplicated Monitoring and the Investment Horizon, Centre for Economic Policy Research, London.
Yosha, O., 1995, "Information Disclosure Costs and the Choice of Financing Source," Journal of Financial Intermediation 4, 3-20.