a case study of the galactic h ii region m17: implications...
TRANSCRIPT

A Case Study of the Galactic H II Region M17: Implications for the Galactic Star Formation Rate
Ma#hewS.Povich
Ph.D. Thesis
The University of Wisconsin – Madison
2009

Collaborators
• UW–Madison
– EdChurchwell(Ph.D.thesisadvisor)– BarbaraWhitney(co‐advisor)
Affiliated with Space Science InsBtute
– BrianBabler– MarilynMeade
– JenniferStone– EllenZweibel
• Harvard‐SmithsonianCfA
– ThomasRobitaille
• UniversityofVirginia
– RémyIndebetouw
• ManchesterCollege
– ChristerWatson
• UniversityofArizona– JohnBieging– MijuKang– CraigKulesa
• NaSonalRadioAstronomyObservatory– CrystalBrogan– DebraShepherd
• UniversityofCalifornia–Berkeley– MarSnCohen
• UniversityofMaryland– MarkWolfire
• PennsylvaniaStateUniversity– EricFeigelson– LeisaTownsley
• UW–Whitewater– RobertBenjamin
19May2009 2M.S.Povich•ThesisDefense•UniversityofWisconsin–Madison

RelatedquesSons:• What are the easily observable properBes of H II regions in infrared surveys?
How are these properBes related to the underlying structure of H II regions?
• What role do winds from massive stars play in shaping H II region structure? • Is star formaBon triggered by expanding H II regions an important component
of global SFRs?
• Can models of individual young stellar objects be employed to place useful constraints on the ensemble properBes (e.g. total mass, age) of the youngest stellar populaBons?
Motivation and goals Primary goal: Obtain a census of the young stellar population associated with a bright Galactic H II region and compare the derived star formation rate (SFR) with global tracers of ionized gas.
19May2009 3M.S.Povich•ThesisDefense•UniversityofWisconsin–Madison

e Schmidt-Kennicutt “Law”
19May2009 M.S.Povich•ThesisDefense•UniversityofWisconsin–Madison 4
Gassurfacedensity
SFRsurfacede
nsity
ΣSFR(Myr–1kpc–2)α Σgas(Mpc–2) N
“Global”N=1.4±0.15
Kennicutt (1998)
Self‐gravitaSonalcollapsedrivenbylarge‐scaleperturbaSonswithingalaxydisks(e.g.spiraldensitywaves):
Whataboutstarbursts?
IslocaltriggeringofstarformaSonimportant?
MilkyWayN=2.18
Misiriotis et al. (2006)
SFR diagnostics
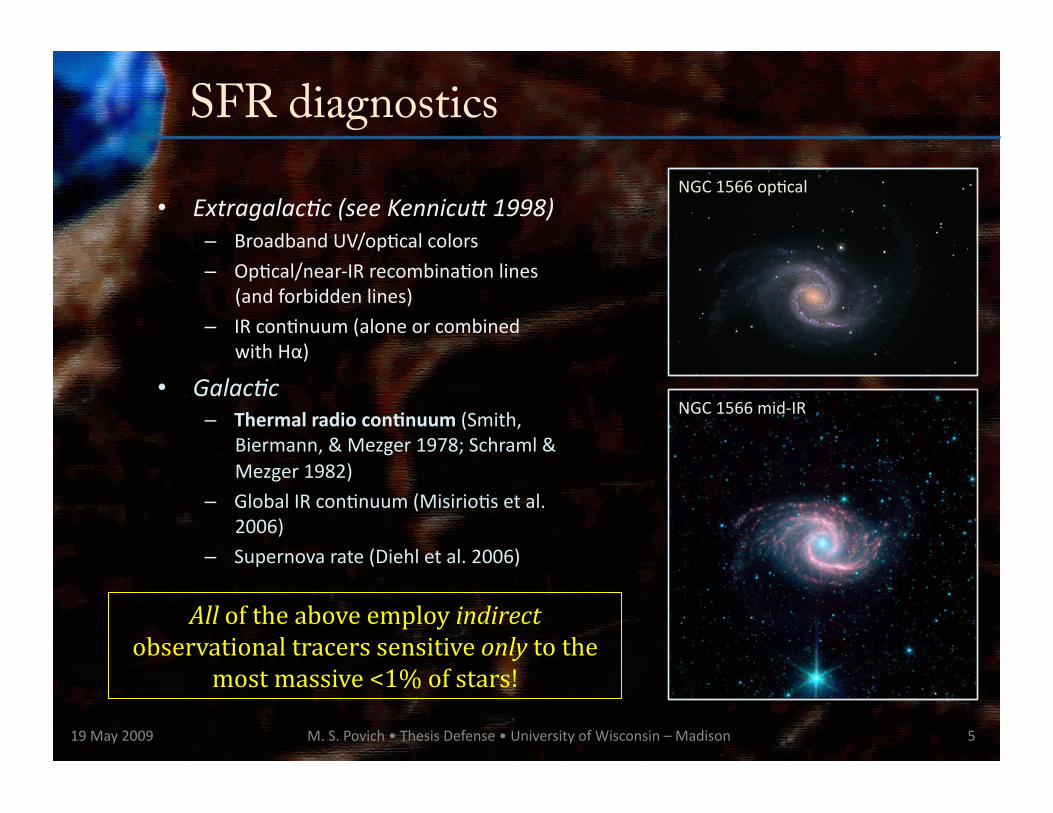
• ExtragalacBc (see KennicuT 1998) – BroadbandUV/opScalcolors
– OpScal/near‐IRrecombinaSonlines(andforbiddenlines)
– IRconSnuum(aloneorcombinedwithHα)
• GalacBc – Thermalradiocon.nuum(Smith,
Biermann,&Mezger1978;Schraml&Mezger1982)
– GlobalIRconSnuum(MisirioSsetal.2006)
– Supernovarate(Diehletal.2006)
19May2009 M.S.Povich•ThesisDefense•UniversityofWisconsin–Madison 5
NGC1566opScal
NGC1566mid‐IR
All of the above employ indirect observational tracers sensitive only to the
most massive <1% of stars!

M.S.Povich•ThesisDefense•UniversityofWisconsin–Madison
Observatories
Spitzer Space Telescope
2MASS Telescope
Midcourse Space Experiment (MSX)
Chandra X-ray Observatory Very Large Array (VLA)
Heinrich Hertz Telescope (HHT)
19May2009 6

M.S.Povich•ThesisDefense•UniversityofWisconsin–Madison
Observatories
Spitzer Space Telescope
19May2009 7

M. S. Povich 819 May 2009 M. S. Povich • Thesis Defense • University of Wisconsin – Madison
GLIMPSE
Poster by T. P. Robitaille

Visible light
(POSS) 0.5 µm
M17
19May2009 9M.S.Povich•ThesisDefense•UniversityofWisconsin–Madison

Near-IR 2MASS J 1.2 µm
M17
19May2009 10M.S.Povich•ThesisDefense•UniversityofWisconsin–Madison

Near-IR 2MASS KS
2.2 µm
M17
19May2009 11M.S.Povich•ThesisDefense•UniversityofWisconsin–Madison

Mid-IR GLIMPSE 4.5 µm
M17
19May2009 12M.S.Povich•ThesisDefense•UniversityofWisconsin–Madison

Mid-IR GLIMPSE 8.0 µm
M17
19May2009 13M.S.Povich•ThesisDefense•UniversityofWisconsin–Madison

Mid-IR GLIMPSE 3.6 µm 4.5 µm 5.8 µm
M17
19May2009 14M.S.Povich•ThesisDefense•UniversityofWisconsin–Madison

Spitzer/IRAC [5.8]/[4.5]
19May2009 M.S.Povich•ThesisDefense•UniversityofWisconsin–Madison 15
15.10 15.05 15.00l (degrees)
!0.74
!0.72
!0.70
!0.68
!0.66
!0.64
!0.62
b (d
egre
es)
a
15.12 15.10 15.08 15.06 15.04 15.02 15.00l (degrees)
0
5
10
15
[5.8]/[4
.5]
b = !0.7062b = !0.6939b = !0.6806
b
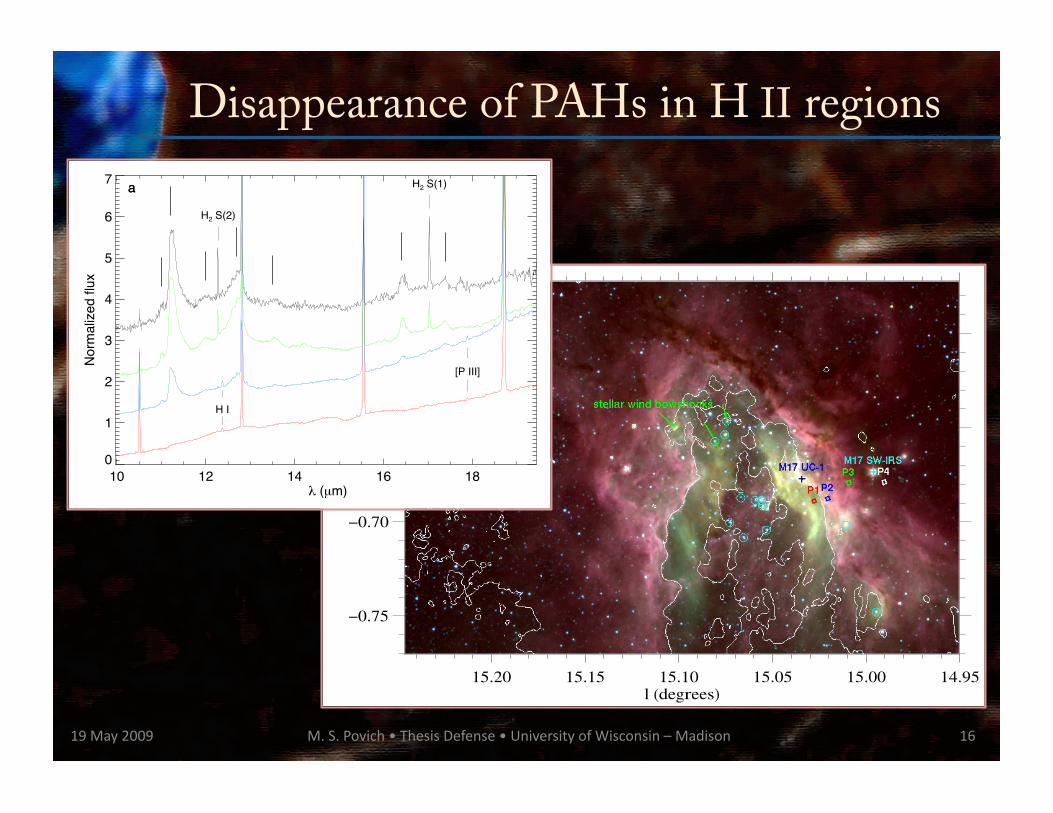
Disappearance of PAHs in H II regions
19May2009 M.S.Povich•ThesisDefense•UniversityofWisconsin–Madison 16
15.20 15.15 15.10 15.05 15.00 14.95l (degrees)
!0.75
!0.70
!0.65
!0.60b (d
egre
es)
b
10 12 14 16 18! (!m)
0
1
2
3
4
5
6
7
No
rma
lize
d f
lux
H2 S(2)
H I
a H2 S(1)
[P III]
a

of 5:7 ! 0:6 kpc (Churchwell et al. 2006). At 1.4 GHz it has anintegrated flux density of 2.8 Jy and an angular radius out to thebackground of 1.50 ("2.5 pc; Helfand et al. 2006). To maintainits ionization, 7:8 ; 1048 ionizing photons s#1 are necessary, equiv-alent to a single O6 V star (MSH05). The radius to the inner faceof the 8 !m shell is 1.20 (2.0 pc), and out to the background levelit is 1.70 (2.3 pc).
N49 has a double-shell structure, the outer traced by 8!memis-sion and the inner traced by 24 !m and 20 cm emission (seeFig. 7).As inN10 andN21, 8!memission encloses both the 24!mand 20 cm emission. The transition between the 8 !m emissionring and the 24 !m and 20 cm emission ring can be clearly seenin the slice at constant latitude in Figure 8. The 20 cm and 24 !memission are coincident, and both have a central cavity. The
24 !m/20 cm dip appears to be the central wind-evacuated cavityexpected around early-O stars.
4. ANALYSIS
We propose the following picture for the IR bubbles: ionizedgas with a hot dust component is surrounded by a PDR contain-ing swept-up interstellar gas, PAHs, and dust. The ionized gas istraced by 20 cm free-free emission, and the hot dust within theH ii region is bright at 24 !m via thermal continuum emission.The IR bubbles are enclosed by a shell of 8!memission dominatedby PAH emission features in IRAC bands 3.6, 5.8, and 8.0 !m.The inner face of the 8 !m shell defines the PAH destructionradius from the central ionizing star(s). In the following sections,we determine the PAH destruction radii and PDR shell thick-nesses based on 5.8 !m/4.5 !m and 8.0 !m/4.5 !m flux densityratios.
4.1. PAH Destruction
Povich et al. (2007) argued that ratios of IRAC bands that con-tain strong PAH emission features (8.0 and 5.8 !m bands) to the4.5 !m band (which contains no PAH feature) can be used to de-termine the PAH destruction radius and define the extent ofPDRs around hot stars. This technique was applied by Povichet al. (2007) to derive both the PAH destruction region in M17and the extent of its PDR because the 8.0, 5.8, and 3.6 !m IRACbands all contain PAH bands, whereas band ratios involving the4.5 !m PAH-free band should be especially sensitive to regionscontaining PAHs. They supported their interpretation of these ra-tios by showing that the 5.8 !m/3.6 !m ratio does not delineatethe PDR boundaries. They also presented IRS spectra that provedthe disappearance of PAH features within the M17 H ii region.Povich et al. (2007) were unable to use the 8.0 !m images ofM17 because the detector was saturated over large regions. Wehave applied this technique to N10, N21, and N49. The quanti-tative ratios are different from those toward M17 because M17is a much more luminous region, but the principle is the same.Since N10, N21, and N49 do not saturate the 8.0!mdetector, weare able to use this band in our analysis as well.
Figs. 9–11 show false-color images of the 5.8 !m/4.5 !m and8.0 !m/4.5 !m band ratios, with accompanying longitude orlatitude cuts (averaged over 20 pixels) for all three bubbles. We
Fig. 7.—N49 24 !m (red ), 8 !m (green), 4.5 !m (blue), and 20 cm (con-tours, bottom panel). The white dashed line in the top panel indicates the loca-tion of the cross-cut in Fig. 8.
Fig. 8.—N49 slice at latitude b $ #0:23%, with 20 cm (solid line, magnified106 times), 24 !m (dotted line), and 8 !m (dashed line, magnified 5 times). Notethat there is no central peak at 24 !m, as there is in N10 and N21.
IR DUST BUBBLES 1345No. 2, 2008
C. Watson, Povich et al. (2008)
Bubble N49
Chandra diffuse soft X-rays (0.5–2 keV)
GLIMPSE 5.8 µm MSX 21.3 µm
M17
Contours: VLA 20 cm continuum
GLIMPSE 4.5 µm GLIMPSE 8.0 µm MIPSGAL 24 µm
19May2009 17M.S.Povich•ThesisDefense•UniversityofWisconsin–Madison

H II regions as mid-IR bubbles GLIMPSE 4.5 µm GLIMPSE 8.0 µm MIPSGAL 24 µm
Nearly 600 “bubbles” (mid-IR shell structures) have been catalogued from the GLIMPSE images (Churchwell, Povich, et al. 2006; Churchwell, D. F. Watson, Povich, et al. 2007). PAH emission in the IRAC 8.0 µm band traces photodissociation regions (PDRs) around H II regions.
19May2009 18M.S.Povich•ThesisDefense•UniversityofWisconsin–Madison

Stellar-wind bow shocks
19May2009 M.S.Povich•ThesisDefense•UniversityofWisconsin–Madison 19

19May2009 M.S.Povich•ThesisDefense•UniversityofWisconsin–Madison 20

M. S. Povich 19 May 2009 M. S. Povich • Thesis Defense • University of Wisconsin – Madison
The bigger picture
Povich et al. (2009) 21

M. S. Povich
HHT CO J(2–1) Map 12CO spectral line map showing molecular gas at v = 19 km/s Bubble is a coherent kinematic structure.
Povich et al. (2009)
Image:GLIMPSE8.0µm
19 May 2009 M.S.Povich•ThesisDefense•UniversityofWisconsin–Madison 22
M. S. Povich
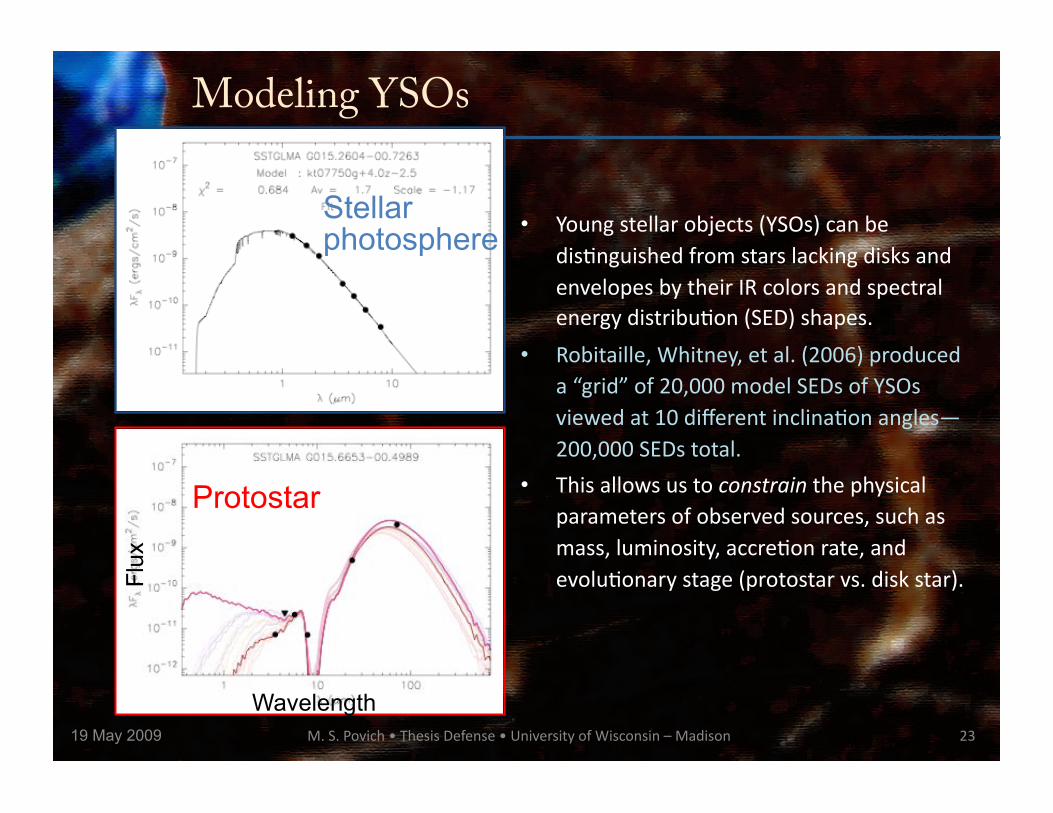
Modeling YSOs
• Youngstellarobjects(YSOs)canbedisSnguishedfromstarslackingdisksandenvelopesbytheirIRcolorsandspectralenergydistribuSon(SED)shapes.
• Robitaille,Whitney,etal.(2006)produceda“grid”of20,000modelSEDsofYSOsviewedat10differentinclinaSonangles—200,000SEDstotal.
• Thisallowsustoconstrainthephysicalparametersofobservedsources,suchasmass,luminosity,accreSonrate,andevoluSonarystage(protostarvs.diskstar).
Stellar photosphere
Protostar
Wavelength
Flux
19 May 2009 M.S.Povich•ThesisDefense•UniversityofWisconsin–Madison 23

M. S. Povich
16.000 15.800 15.600 15.400 15.200 15.000 14.800 14.600
-0.200
-0.400
-0.600
-0.800
-1.000
-1.200
Galactic longitude
Gala
cti
c lati
tud
e
Highly-embedded YSOs (Stage 0/I) YSOs with optically thick disks (Stage II) YSOs with optically thin disks (Stage III) YSOs with ambiguous classifications Candidate AGB stars
Wide-field M17 YSO sample
Povich et al. (2009)
Image:GLIMPSE8.0µm
19 May 2009 M.S.Povich•ThesisDefense•UniversityofWisconsin–Madison 24

M. S. Povich
16.000 15.800 15.600 15.400 15.200 15.000 14.800 14.600
-0.200
-0.400
-0.600
-0.800
-1.000
-1.200
Galactic longitude
Ga
lac
tic
la
titu
de
YSO sample after removing contaminants
Povich et al. (2009)
Image:GLIMPSE8.0µm
Contours:COv=19km/s
Highly-embedded YSOs (Stage 0/I) YSOs with optically thick disks (Stage II) YSOs with optically thin disks (Stage III) YSOs with ambiguous classifications
19 May 2009 M.S.Povich•ThesisDefense•UniversityofWisconsin–Madison 25

M. S. Povich
Concentration of star formation on the rim of M17 EB
MIPS 24 µm • IRAC 8.0 µm • IRAC 4.5 µm • 12CO @ 19 km/s (contours)
O8 V
B0.5 V
Wavelength
Flux
19 May 2009 M.S.Povich•ThesisDefense•UniversityofWisconsin–Madison 26

M. S. Povich
16.000 15.800 15.600 15.400 15.200 15.000 14.800 14.600
-0.200
-0.400
-0.600
-0.800
-1.000
-1.200
Galactic longitude
Gala
cti
c lati
tud
e
Ionizing stars and YSOs ♢ 15 Most massive stars in M17 cluster ♢ 5 Most massive stars ionizing M17 EB ♢ 5 Massive stars with diffuse 24 µm emission
Povich et al. (2009)
Image:GLIMPSE8.0µmContours:COv=19km/s
Highly-embedded YSOs (Stage 0/I) YSOs with optically thick disks (Stage II) YSOs with optically thin disks (Stage III) YSOs with ambiguous classifications
19 May 2009 M.S.Povich•ThesisDefense•UniversityofWisconsin–Madison 27

M. S. Povich
Star formation rate in extended M17 environment
Povich et al. (2009)
62 YSOs detected ~1000 YSOs
predicted
• YSOmassfuncSon(YMF)constructedfrommodels.
• ScalingOrioniniSalmassfuncSon(Muenchetal.2002)tofitYMFforM★ > 3 M gives total stellar mass: 750 ± 50 M.
• AdopSng0.5Myrastheaverageageofanintermediate‐massYSO:SFR=0.0015M yr –1
• This is >15% the SFR in the main M17 H II region.
YMFtechniquepioneeredbyShepherd,Povich,etal.(2007)andhasbeenusedtomeasuretheSFRintheLargeMagellanicCloud(Whitneyetal.2008).
19 May 2009 M.S.Povich•ThesisDefense•UniversityofWisconsin–Madison 28

M. S. Povich
16.000 15.800 15.600 15.400 15.200 15.000 14.800 14.600
-0.200
-0.400
-0.600
-0.800
-1.000
-1.200
Galactic longitude
Gala
cti
c lati
tud
e
Ionizing stars and YSOs ♢ 15 Most massive stars in M17 cluster ♢ 5 Most massive stars ionizing M17 EB ♢ 5 Massive stars with diffuse 24 µm emission
Povich et al. (2009)
Image:GLIMPSE8.0µmContours:COv=19km/s
Highly-embedded YSOs (Stage 0/I) YSOs with optically thick disks (Stage II) YSOs with optically thin disks (Stage III) YSOs with ambiguous classifications
19 May 2009 M.S.Povich•ThesisDefense•UniversityofWisconsin–Madison 29

e X-ray luminosity function (XLF) as SFR tracer
stellar clusters (Corbelli et al. 2005). This effort is subject to a vari-ety of difficulties. One of the major problems is the huge level ofbackground and foreground contamination seen in optical and NIRobservations of most clusters. Statistical correction for contamina-tion using observations of nearby control fields or using Galacticstellar models can give uncertain results. Jiang et al. (2002) usedGalacticmodels of foreground and (extinguished) background stel-lar populations to correct the observedK-band luminosity function(KLF) in regions of the SIRIUS field. The results were satisfactory
in the limited mass range 0:5 M! PM P 2 M!, but uncertaintiesin contamination affected the IMF measurement at higher masses.For example, Jiang et al. found that it was not possible to derive acorrected KLF for region 2C (Fig. 1), where the estimated NIRcontamination was higher than the number of detected stars.
X-ray surveys, on the other hand, suffer relatively little contam-ination (x 2.5), and the statistical link between X-ray luminositiesand masses (x 3) permits an association between the X-ray lu-minosity function (XLF) and the IMF. This idea was recentlyproposed (Feigelson & Getman 2005) and applied to Chandrapopulations in the OMC-1 (Grosso et al. 2005), Cep B/CepOB3b(Getman et al. 2006), and NGC 6357 (Wang et al. 2006) regions.Through their independent analyses, Getman et al. further confirmthe tight connection between the XLF and the IMF.
As the total band luminosity systematically underestimates thetrue emission for obscured objects due to the absence of soft bandphotons, we restrict our analysis to the X-ray luminosities in thehard (2Y8) keVenergy band: the observed luminosityLh and thatcorrected for absorption Lh; c. These quantities are available for"600 of the brighter sources in M17 (x 2.3).
Following the approach taken in Getman et al. (2006) andin x 3.1, we divide the 886 M17 ACIS X-ray sources into 514lightly obscured and 372 heavily obscured samples using athreshold of median energy Emedian # 2:5 keV, correspondingto AV " 10mag. Figure 7 shows the spatial distributions of thesetwo samples and Figure 9 shows the XLF comparison analysisfor these samples using the absorption corrected X-ray lumi-nosity Lh; c. For brevity, the similar analysis using Lh is notdescribed in detail. The "5% contamination due to unrelatedGalactic or extragalactic sources (x 2.5) is ignored in the follow-ing analysis.
The lightly obscured Orion Nebula Cluster (ONC) has boththe XLF and IMF accurately measured (Feigelson et al. 2005;Getman et al. 2006). We assume here, as in Getman et al. (2006)and Wang et al. (2006) that the XLFs of young stellar clusters
Fig. 8.—Spatial distribution ofX-ray selected intermediate-mass stars (2M! PM P 8 M!, small circles) and high-mass stars (M k 8M!, diamonds). TheMSX8 !m contours are overlaid. The pluses mark previously known O stars (x 5 andTable 9); the known O star not marked as high-mass (missing its diamond ) wasdetected (ACIS 433 = OI 345), but no mass estimate is reported in Table 6 due tolarge photometry errors.
Fig. 9.—Hard band X-ray luminosity functions (corrected for absorption) of the lightly obscured (black histogram with error bars, left panel ) and heavily obscured(right panel ) samples of X-ray sources inM17. A calibrationXLF from the OrionNebula Cluster is shown as the gray histogram; luminosities below 1027 ergs s$1 occupythe leftmost bin. Regression lines to the ONCXLF (gray, solid lines) were scaled upward tomatch theM17XLFs (gray, dashed lines). TheONC sample is 100% completedown to "0.1 M! (black dashed line).
CHANDRA STUDY OF M17 371No. 2, 2007
FromBroosetal.(2007)
• Black histogram: XLFofM17X‐raysourceswithIR‐detectedstellarcounterparts.
• Gray histogram:XLFofOrionNebulacluster.
• Dashed lines: RegressionfitstoOrionXLF,scaleduptomatchM17XLF.
19May2009 M.S.Povich•ThesisDefense•UniversityofWisconsin–Madison 30
Broos et al. (2007)

IMF Schematic
19May2009 M.S.Povich•ThesisDefense•UniversityofWisconsin–Madison 31
Kroupa (2001) IMF

M17 “global” SED
19May2009 M.S.Povich•ThesisDefense•UniversityofWisconsin–Madison 32

M17 as an extragalactic star formation region
19May2009 M.S.Povich•ThesisDefense•UniversityofWisconsin–Madison 33
Spitzer/MIPS24µmSFRtracer(Calze=etal.2007)appliedtoaGalac-c HIIregion

3 different diagnostics, 3 different SFRs
• X‐rayluminosityfuncSon(Broosetal.2007)– SFRX~0.008–0.01Myr–1
• 24µmluminosity(Calzeyetal.2007)– SFR24~0.0027Myr–1~SFRX/3
• Thermal(free‐free)radioconSnuum(Smith,Biermann,&Mezger1978)
– SFRff~1.6Myr–1~2SFRX
19May2009 M.S.Povich•ThesisDefense•UniversityofWisconsin–Madison 34
stellar clusters (Corbelli et al. 2005). This effort is subject to a vari-ety of difficulties. One of the major problems is the huge level ofbackground and foreground contamination seen in optical and NIRobservations of most clusters. Statistical correction for contamina-tion using observations of nearby control fields or using Galacticstellar models can give uncertain results. Jiang et al. (2002) usedGalacticmodels of foreground and (extinguished) background stel-lar populations to correct the observedK-band luminosity function(KLF) in regions of the SIRIUS field. The results were satisfactory
in the limited mass range 0:5 M! PM P 2 M!, but uncertaintiesin contamination affected the IMF measurement at higher masses.For example, Jiang et al. found that it was not possible to derive acorrected KLF for region 2C (Fig. 1), where the estimated NIRcontamination was higher than the number of detected stars.
X-ray surveys, on the other hand, suffer relatively little contam-ination (x 2.5), and the statistical link between X-ray luminositiesand masses (x 3) permits an association between the X-ray lu-minosity function (XLF) and the IMF. This idea was recentlyproposed (Feigelson & Getman 2005) and applied to Chandrapopulations in the OMC-1 (Grosso et al. 2005), Cep B/CepOB3b(Getman et al. 2006), and NGC 6357 (Wang et al. 2006) regions.Through their independent analyses, Getman et al. further confirmthe tight connection between the XLF and the IMF.
As the total band luminosity systematically underestimates thetrue emission for obscured objects due to the absence of soft bandphotons, we restrict our analysis to the X-ray luminosities in thehard (2Y8) keVenergy band: the observed luminosityLh and thatcorrected for absorption Lh; c. These quantities are available for"600 of the brighter sources in M17 (x 2.3).
Following the approach taken in Getman et al. (2006) andin x 3.1, we divide the 886 M17 ACIS X-ray sources into 514lightly obscured and 372 heavily obscured samples using athreshold of median energy Emedian # 2:5 keV, correspondingto AV " 10mag. Figure 7 shows the spatial distributions of thesetwo samples and Figure 9 shows the XLF comparison analysisfor these samples using the absorption corrected X-ray lumi-nosity Lh; c. For brevity, the similar analysis using Lh is notdescribed in detail. The "5% contamination due to unrelatedGalactic or extragalactic sources (x 2.5) is ignored in the follow-ing analysis.
The lightly obscured Orion Nebula Cluster (ONC) has boththe XLF and IMF accurately measured (Feigelson et al. 2005;Getman et al. 2006). We assume here, as in Getman et al. (2006)and Wang et al. (2006) that the XLFs of young stellar clusters
Fig. 8.—Spatial distribution ofX-ray selected intermediate-mass stars (2M! PM P 8 M!, small circles) and high-mass stars (M k 8M!, diamonds). TheMSX8 !m contours are overlaid. The pluses mark previously known O stars (x 5 andTable 9); the known O star not marked as high-mass (missing its diamond ) wasdetected (ACIS 433 = OI 345), but no mass estimate is reported in Table 6 due tolarge photometry errors.
Fig. 9.—Hard band X-ray luminosity functions (corrected for absorption) of the lightly obscured (black histogram with error bars, left panel ) and heavily obscured(right panel ) samples of X-ray sources inM17. A calibrationXLF from the OrionNebula Cluster is shown as the gray histogram; luminosities below 1027 ergs s$1 occupythe leftmost bin. Regression lines to the ONCXLF (gray, solid lines) were scaled upward tomatch theM17XLFs (gray, dashed lines). TheONC sample is 100% completedown to "0.1 M! (black dashed line).
CHANDRA STUDY OF M17 371No. 2, 2007
Factors of 2–3 disagreement between various methods!

e rest of the M17 complex
19May2009 35M.S.Povich•ThesisDefense•UniversityofWisconsin–Madison

Conclusions Primary goal: Obtain a census of the young stellar population associated with a bright Galactic H II region and compare the derived star formation rate with global tracers of ionized gas.
19May2009 36M.S.Povich•ThesisDefense•UniversityofWisconsin–Madison
MISSION ACCOMPLISHED?
Well,yes,butthere’ssSllanawfullotle{todo!

Conclusions Primary goal: Obtain a census of the young stellar population associated with a bright Galactic H II region and compare the derived star formation rate with global tracers of ionized gas.
19May2009 37M.S.Povich•ThesisDefense•UniversityofWisconsin–Madison
MISSION ACCOMPLISHED?
Well,yes,butthere’ssSllanawfullotle{todo!
ThisthesishasproducedadirectcomparisonoftheSFRinM17withglobalSFRtracersappliedtotheMilkyWayandothergalaxies.
OneregiondoesnotacalibraSonmake!Future work: Carryoutasimilaranalysisof10–20regionsandsynthesizeanewGalacScSFRdiagnosSc.

RelatedquesSons:• What are the easily observable properBes of H II regions in infrared surveys?
How are these properBes related to the underlying structure of H II regions?
– PAH emission from PDRs (primarily IRAC 8.0 µm band) – Mid‐IR continuum from heated dust in H II regions (MIPS 24 µm band)
• What role do winds from massive stars play in shaping H II region structure?
– Stellar winds dominate the structure of H II regions ionized by one or more early O stars.
• Is star formaBon triggered by expanding H II regions an important component of the global star formaBon rate? – Maybe. If regions like M17 can be triggered locally, then “Yes.”
• Can models of individual young stellar objects be employed to place useful constraints on the ensemble properBes (e.g. total mass, age) of the youngest stellar populaBons? – Yes! But care must be taken to deal with contamination.
Conclusions
19May2009 38M.S.Povich•ThesisDefense•UniversityofWisconsin–Madison