a case study of petroleum transportation logistics: a
TRANSCRIPT

African Journal of Business Management Vol. 6(11), pp.4350-4361, 21 March, 2012 Available online at http://www.academicjournals.org/AJBM DOI: 10.5897/AJBM11.283 ISSN 1993-8233 ©2012 Academic Journals
Full Length Research Paper
A case study of petroleum transportation logistics: A decision support system based on simulation and
stochastic optimal control
Waleed K. Abduljabbar* and Razman M. Tahar
Technology Management Department, University Malaysia Pahang, Kuantan,26300, Pahang, Malaysia.
Accepted 10 May, 2011
The worldwide economic disturbance has intensified the petroleum industry’s global market constraints in terms of price instability, excess capacity, demand shifts as well as environmental regulation. Petroleum transportation, as the central logistics operation linking the upstream and downstream functions has been paid more attention to. This paper develops a decision support system (DSS) by combining both inventory and transportation operations in petroleum transportation system. It is based upon the integration of discrete event simulation using ARENA software and the stochastic optimal control of the inventory using visual basic applications (VBA)/transportation system. A unifying simulation framework that integrates the simulation model and controller is constructed to simulate the controlled inventory/transportation system. The simulation results provide a useful tool for decision makers to evaluate strategies and policies for the design and operation of the systems, with valuable insights into the behavior of the dynamic and stochastic system. Additionally, it sheds some light on business renovation, the effective utilization of information technology and the role of business process modeling in supply chain integration project in oil industry. Key words: Transportation, inventory system, decision support system, stochastic, oil refinery.
INTRODUCTION The commercial simulation environments that are available today focus primarily on the development of simulation models. They are designed for a single user. They provide animation during the simulation run and in most cases they provide outcomes of the simu-lation run in reports (Edwin et al., 2008). A key problem of a container terminal is the design and integration of the security procedures, such as the containers inspection, in the normal container terminal operations (Longo, 2010).
Due to an increasingly competitive market, transpor-tation operations are usually considered as one of the major bottlenecks in the oil production chain. Thus, petroleum companies are eager to find ways to pursue efficient transportation schedules within their operational *Corresponding author. E-mail: [email protected].
planning so as to organize their activities to achieve better competitive advantages. To efficiently manage the available resources is, in other words, to have their products at the right price, in the right quantity, at the right place and at the right time.
In the operations research and management science, this type of problem is called "inventory routing problem" (IRP), which is one of the core problems that have to be solved when implementing the emerging business practice called "vendor managed inventory replenish-ment" (VMI) (Kleywegt et al., 2000). As recent research focus on refineries food chain modeling reported in the literature only one address of the chain, such as crude logistics using discrete event simulation and optimal control (Neiro and Pinto, 2004; Reddy et al., 2004).
Hughes (1971) sets up a network model to determine where to locate the terminals with respect to customer distribution sites. The efficient ways of loading and unloading into the storage tanks at oil terminals

(Christofides et al., 1980). The transportation costs involved in loading and unloading these storage tanks are not investigated, additionally the article does not address the terminal profits. Simulation-based short-term schedu-ling of crude oil from port to refinery tanks and distillation unit, agent-based crude procurement (Cheng and Duran, 2004; Chryssolouris, 2005; Julka et al., 2002). External the refinery environment (Banks et al., 2002), supply chain management (SCM) simulation studies at Interna-tional business machines (IBM) and Virtual logistics and talk about issues related to strategic and operational SCM, distributed SCM simulation, and commercial packages for SCM simulation (Kleijnen, 2005).
In this paper, the main problems identified in reality include: (1) Overfilling a tank or having too many tanks filled with oil potentially caused a misuse of precious resources (Razman et al., 2010); (2) Inefficient location for production resulted in excess cost being incurred throughout the lifetime of the facility; (3) All oil derivatives were not economically sent from the refineries to the depots, considering high transportation cost under the same oil price around. Therefore, this study is mainly aimed at developing a decision support system to investigate and improve the combined inventory and transportation system in a representative oil refinery supply operation. Through the proposed model, crucial resources for oil terminal operations are identified such as the optimal number of tanks, tank size and truck arrival rate, etc. Accordingly, a user interface window and implementing software applications are also designed based on the simulation model. In this way, it helps to make more rational decisions on optimizing inventory, reducing operating costs and thus maximizing benefits.
The remainder of this study is organized as follows. Subsequently, the study describes the operation systems which consist of Oil refinery terminal operations and oil product transportation from refineries to depots. After which, a brief explanation of adopted research methodology is presented. This was followed by the designed of the structure of the proposed model in the two aforementioned aspects. Then the study applies the model with simulation results provided and discussed behind. Finally, some conclusions are drawn in.
SYSTEM DESCRIPTION
The system deals with the fulfillment/procurement process in a supply chain (SC) that contains the oil refinery company (with multiple oil depots at different locations) and the supplier that transports the oil productions to the oil depots from a few larger warehouses in the refinery terminals.
The main goals are similar to the usual supply chain (SC) goals: To offer good service to the final customer, while keeping: profits high, costs and lead-times low. As both the prices and quality of Oil in Iraq are regulated, the
Abduljabbar and Tahar 4351 main quality indicator is the number of stock-outs. The main cost drivers are therefore: number of stock-outs, stock level at the oil depot and process execution costs (work, transport etc.).
Lead-time is defined as the time between the start (measurement of the stock level) and the end (either the arrival of oil or the decision not to place an order) of the process. The description of the current system was divided into two categories which are oil refinery terminal operations and transportation of oil products to the depots.
Oil refinery terminal operations
When oil is not required for immediate use, it may be stored in large tanks, owned by the oil and gas companies, or rented at a transport company's oil terminal. From a major pipeline, the oil terminal tanks receive regular oil (Figure 1). Oil arrives in batches from the pipeline. It then enters into one of several tanks, each holding up to a maximum capacity. Trucks, each with a fixed capacity, arrive at a certain average rate at the terminal. After arrival to the terminal, trucks will then wait in a central queue until a tank is available for loading oil. Tank availability is defined as having oil, equal to truck capacity, available in the tank and currently, no truck is queued in front of the tank for refueling. If a truck arrives at the terminal and the number of trucks currently queued at the central queue is equal to the queue capacity then the arriving truck balks back to the truck depot. After loading oil, trucks then depart for their destination customer location.
In the event, the terminal will pass downstream and is sold as a lower grade, less profitable product; this will be referred to as discount oil. The difference between regular oil and discount oil is that a quality check is not made on the discount oil. The total cost of maintaining oil in the terminal and the associated truck costs is C per week. The contribution margins derived from sale of regular and discount oil is R per week. The objective of this study is to minimize the total cost C and maximize the average total profit per week, P = R – C.
There are three factors; tank size, truck arrival rate and number of tanks; have been chosen as decision variables that can be manipulated to result in oil terminal profitability. It is suspected that there is a high correlation between these factors and the profit derived from the oil terminal operation.
The number of tanks and their respective tank sizes will determine how much oil the terminal can carry, which in turn determines the total maximum revenue the oil terminal can generate through the sale of regular oil. Truck arrival rate is crucial in determining the terminal profitability, the faster truck can take the oil from the terminal, and more rooms are available for oil storage within the terminal, resulting in less oil being converted

4352 Afr. J. Bus. Manage.
Figure 1. The process model flowchart.
into lower grade discount oil. Transportation of oil products to depots
The stock level is measured manually once a day. The results are faxed to the purchasing department that collects information from all oil depots. It predicts future demand, while taking seasonal and cyclical movements into account. An additional consultation with an oil depot manager is possible.
The needs of several oil depots are merged into one order. Tacit employee knowledge is used to make and optimize orders and transport routes. The analytical department controls possible changes in demand and supply patterns and transport routes. If necessary, it can adjust or cancel orders. After that, the order is sent to the oil transport company, this is also the first information given to the oil transport company about the needs. The order has to be fulfilled with the available fleet, but cannot be modified.
Financial compensation is paid to the transporter for its services based on the number of kilometers driven, oil
production delivered and punctuality of deliveries. While the description focuses on one typical oil depot, the inputs from other depots are also taken into account at
various points in the model. Most importantly, the capacity of each truck is considerably higher than the
needs of one depot so orders from different depots are usually merged into one.
The developed simulation model helps us understand the current problem and also makes them more visible to all decision-makers in both oil companies. Process flowchart was used for visualization of the model. Process flowchart will be used in arena software for modeling and analyzing. One of their main advantages is that the decision maker (employees) can be quickly taught how to develop and validate these models (Chen, 1999). They enable analyses of the costs and time needed for the process (Indihar Stemberger et al., 2004). The animation process with a user interface windows will use; such an interface enables an easy understanding of everything involved in the project(Bosilj-Vuksic et al., 2002); this is especially vital in a SC context as employees from different petroleum companies must understand the developed models.

Abduljabbar and Tahar 4353
Figure 2. The business process modeling (AS-IS model).
Based on the description in the foregoing, the current system model was developed as shown in Figure 2.
METHODOLOGY This section will first provide definitions of some fundamental concepts in the methodologies discrete event simulation. Based on that, we will construct a decision support system to assist decision makers to study and improve the combined inventory and transportation system.
Decision support system Based on the simulation and control of the combined inventory and transportation system, a decision support system is developed to assist decision makers investigating the behavior of the system,
evaluate decisions on the design and control of the system and improve the system performance through systematic approaches.
Given the understanding about and the investigation into the system, a simulation model is formulated to represent the behavior of the real system faithfully. The decision makers then can analyze the performance of the system in different conditions and obtain insight into the characteristics of the system.
Therefore, before actually implementing any design or control decisions, for example, chartering more tankers, the decision makers can evaluate or predict the influence of the decisions on the system performance. Decision makers can also evaluate different control policies and select appropriate plausible policies to implement on the real system. For example, a typical heuristic control police is the so called “order-up-to” policy as illustrated earlier. On the other hand, an optimal control problem can be formulated and solved to find the optimal or near-optimal control policy more systematically and efficiently. Decision makers can use the optimization solutions as a reference and improve the

4354 Afr. J. Bus. Manage. performance of the inventory/transportation system by making more informed decisions.
The real system in practice involves enormous complexity and uncertainty, and it is obviously also changing over time. It is critical to keep updating and validating the simulation model and the optimization model as the real system evolves. As the decision makers interact with and learn from the system, more insightful understanding and accurate information can be obtained to improve modeling of the system, which in return improves the system performance by assisting decision makers make better decisions.
Discrete event simulation
"Simulation is the process of designing a model of a real system and conducting experiments with this model for the purpose either of understanding the behavior of the system or of evaluating various strategies (within the limits imposed by a criterion or set of criteria) for the operation of the system" (Shannon, 1975). In a discrete event simulation model, the state of the system can only change at a discrete set of points in time.
Now, we are going to discuss the discrete event simulation of the controlled inventory/transportation system. A framework to integrate the simulation model, controller and simulation input/output will be presented. Then we will provide some details about the simulation model and controller design. Finally, results of the simulation including graphic animation and simulation reports and examples of analyzing statistical results will be demonstrated.
To provide the decision maker with a decision support system based on simulation, we developed a self-contained framework that integrates the simulation model and controller such that the decision maker is able to manipulate the system model through the controller. The simulation architecture also consists of a simple interface so that users can specify initial conditions and parameters and obtain results during the simulation or at the end of the simulation.
As shown in Figure 3, the simulation model that represents the behavior of the real inventory/transportation system is constructed in Arena, together with ad-hoc and built-in Visual basic for application (VBA) modules.
During the VBA modules, the controller, which is implemented in a visual basic code, can access the state variables in the simulation model during the course of simulation run and can manipulate the simulation by changing the main control variables and sending signals, entity attributes, etc. Another functionality of the VB based controller is that it can automate other desktop applications such as Microsoft® Excel. Therefore, we can automatically create a user input/output (I/O) interface through Excel inside the Arena environment. For example, at the beginning of the simulation run, users can specify the input to the simulation such as parameter value and initial conditions via Excel. When the simulation starts, the real time state of the system can be displayed through Excel and updated as the simulation proceeds. At the end of each replication, the cost information and system statistics collected and calculated by the controller can be stored in an Excel file.
Therefore, a statistical analysis can be conducted at the end of the simulation after all replications are completed.
MODEL CONSTRUCTION Oil refinery terminal operations We define the simulation model for the inventory and transportation system using a process approach, laying out the sequence of activities required to move the entities through the system,
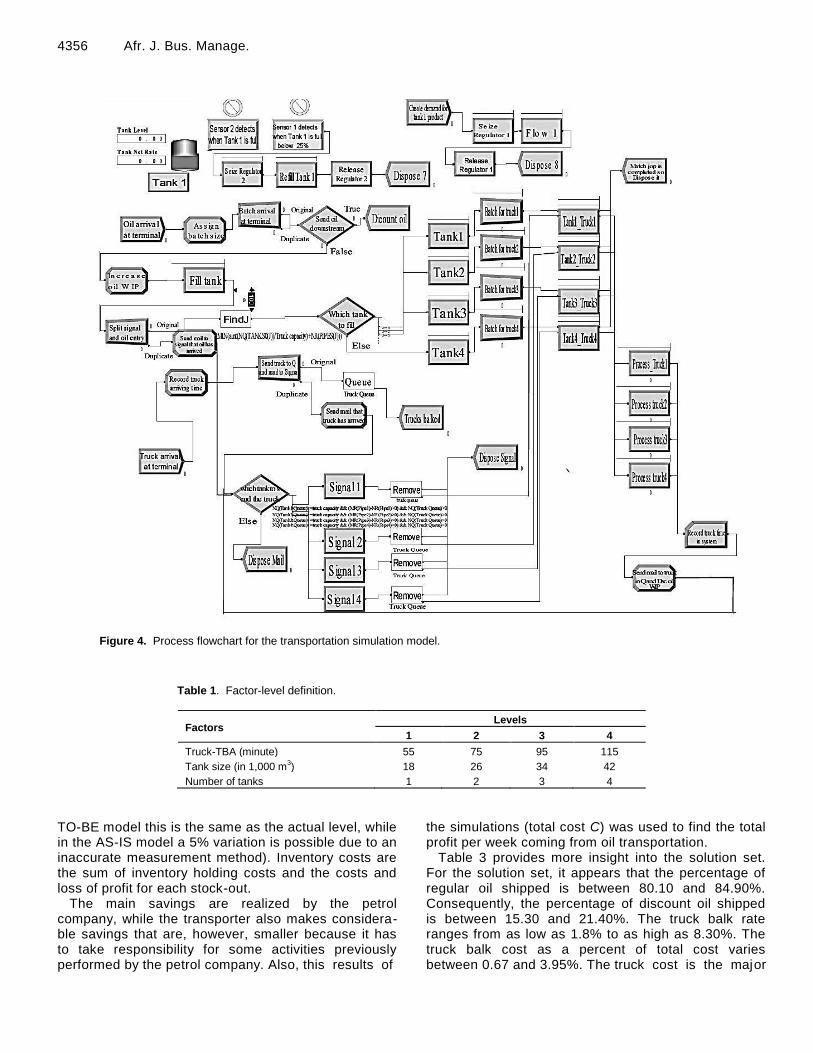
supplying the data required to support entity actions, etc. Figure 4 presents the process flowchart of the simulation model in Arena®. The simulation model is comprised of modules, which are the system and data objects that define the process to be simulated. All the information required to simulate a process is stored in modules (Kelton et al., 1998).
System modules are placed in the modeling window and connected to form a flowchart, describing the logic of the process. For example, the CREATE module represents entities entering the system and can be used to model the generation of new trucks or arrivals of oil supply, etc. Data modules are presented and edited via a spreadsheet interface. For example, the VARIABLE module defines a list of variables with their dimensions and initial values that can be used globally throughout the system.
In the model, an entity of oil is represented as a blue dot, whereas truck entities are identified by truck symbols. Both entities follow a stationary poison arrival process as depicted by the nature of the process, number of events that occur in an interval of time when the events are occurring at a constant rate.
All inter-arrival times are independently and identically distributed exponential random variables with parameter as the average time between arrivals. The simulation model has ten distinct blocks and each block is discussed separately below. The model consists of two arrival nodes to create oil and truck arrivals.
Decide nodes help determine whether or not oil should enter the terminal as regular oil or be sent downstream to be converted into a lower grade fuel, discount oil. Decide nodes are also used to determine to which tank the trucks should be sent for refueling. Find J node helps send oil entity to a tank with the smallest number of truck batches waiting to be loaded. A truck batch equals 2,000 m3 of oil. Process node executes the time required to fill oil into tanks.
Assign nodes assign batch sizes to incoming oil entities and increase or decrease the oil work in process in the terminal to maintain a paper count of oil within the system. Hold nodes represent tanks and hold oil until a signal node sends a message to release oil into trucks. Signal nodes also send message to the remove node, which removes queued truck from the Queue node on a first-come-first-serve (FCFS). A Queue node with queue capacity holds arriving trucks in a central queue. Match nodes help match a truck to a batch of oil before sending it to the process node, which executes the time required to fill oil into trucks. Batch nodes are used to batch oil equal to the truck capacity. Several animated counters are used to help debug the model. The three-factors and four levels are shown in Table 1.
Truck average times between arrival (TBA) levels were carefully chosen to ensure highest profitability per week could be achieved. Using highest and lowest terminal capacity, experiments were run to determine the highest average total profit per week by varying the truck TBA. The graphs of the analysis are shown in Figures 5 and 6.
For highest terminal capacity (168,000 m3), Figure 5 shows that the highest average total profit per week occurs at truck TBA of 75 min. Additionally, the percent truck balked, which is the percent of truck arrivals that balk out of the system, is close to zero. Therefore, truck TBA of 75 min was chosen as one of the levels for this factor.
For lowest terminal capacity (18,000 m3), Figure 6 shows that the highest average total profit per week occurs at truck TBA of 115 min. Therefore, truck TBA of 115 min was chosen as another level for this factor. Transport oil productions to the depots Based on the mentioned problems, several improvements were proposed. The main change is that the processes at the refinery and depots are now integrated and the supplier takes

Abduljabbar and Tahar 4355
Figure 3. The simulation‟s framework.
responsibility for the whole procurement process. The renewed business model is shown in Figure 7.
The main idea is that the transport company takes a strategic role in providing a sufficient inventory level to fulfill the demand of the end customer (Depots). It takes all important decisions regarding orders in order to realize this goal. The proposed model can be modified as follows: 1. The measurement of petrol is now fully automatically; the stock level information is exact. 2. The stock levels from all petroleum depots are instantly available to the transport company. 3. Future demand is predicted using the model based on neural networks. 4. The system at the transport company automatically identifies the current levels of stock, predicted future needs and suggests possible orders and delivery distribution among different petrol stations. 5. The final decision is made daily by an employee in the transport company and is approved by the petrol refinery. 6. Operations research methods (for example, the vehicle routing problem) are used to optimize transportation paths and times (Gayialis and Tatsiopoulos, 2004). 7. In the long-term the locations of the warehouses can also be optimized. The effect of the changes can be estimated with a simulation of business processes (the methodology, advantages and some problems of this approach are presented in depth in Bosilj-Vuksic et al., 2002) and simulations of supply and demand. The results of the simulations enable the measuring of the effects of possible experiments in business process models (Eriksson and Penker, 2000).
Finally, with the first simulation we estimated changes in profit, process execution costs and lead-times. The methodology used does not enable the direct measurement of the quality of the process and/or its outputs. Therefore, a second simulation
was used to estimate changes in the quality and level and costs of stock. Both simulations are especially important as they enable us to estimate the consequences of possible experi-ments. The possible benefits of such changes have to be carefully weighed up against the costs needed to make those changes to find out the business feasibility of such changes (Groznik and Mujkic, 2005).
SIMULATION RESULTS AND DISCUSSION
First, we run the second of both simulation models. In this developed model, it is generated on an hourly basis (the level of stock is checked automatically every hour). Their hourly wages are considered in the model.
In addition, transport vehicle (road tanker) costs are included in the simulations of the model. Also in the model the petroleum depot manager and purchasing worker are no longer time needed. The simulations enable the measuring of both the effects on the SC as a whole and at each Transportation Company and department involved. The cost of each activity or sub-process can also be estimated.
The convincing results are summarized in Table 2. It shows that both refinery and depots can realize important savings; the results can be used to convince them of the justifiability of the project.
This simulation can be used to show the estimate of total inventory-related costs and the number of stock-outs in correlation with the level of stock.
In Figure 8 the relation between reorder point and inventory costs is shown. The reorder point is the perceived level of fuel when the order is placed (in the
4356 Afr. J. Bus. Manage.
Figure 4. Process flowchart for the transportation simulation model.
Table 1. Factor-level definition.
Factors Levels
1 2 3 4
Truck-TBA (minute) 55 75 95 115
Tank size (in 1,000 m3) 18 26 34 42
Number of tanks 1 2 3 4
TO-BE model this is the same as the actual level, while in the AS-IS model a 5% variation is possible due to an inaccurate measurement method). Inventory costs are the sum of inventory holding costs and the costs and loss of profit for each stock-out.
The main savings are realized by the petrol company, while the transporter also makes considera-ble savings that are, however, smaller because it has to take responsibility for some activities previously performed by the petrol company. Also, this results of
the simulations (total cost C) was used to find the total profit per week coming from oil transportation.
Table 3 provides more insight into the solution set. For the solution set, it appears that the percentage of regular oil shipped is between 80.10 and 84.90%. Consequently, the percentage of discount oil shipped is between 15.30 and 21.40%. The truck balk rate ranges from as low as 1.8% to as high as 8.30%. The truck balk cost as a percent of total cost varies between 0.67 and 3.95%. The truck cost is the major

Abduljabbar and Tahar 4357
Perc
ent
Figure 5. Truck TBA analysis – highest terminal capacity.
cost item when compared to the lease cost and ranges from 76.23 to 88.34%. The majority of the truck cost is due to truck trips and truck time spent within the system. Truck trip costs as a percentage of total costs range from 44.45 to 46.95%. Truck in system costs as a percentage of total costs varies between 30.90 and 37.20%.
Truck trips are necessary costs and cannot be avoided. However, truck wait cost in system (other than the time spent refueling) is an avoidable cost and occurs due to variability in the system. The average
truck time in system is between 82.12 and 95.56 min, ideally, the truck should spend 75 min for refueling and 0 min for waiting to be refueled. For example, in the case of 2 tanks with capacity of 34,000 m
3 and with
truck TBA of 75 min, the average truck time in system is 87.23 min, which is 12.23 (= 87.23 - 75) min higher than the time required to refuel. The average total trucks shipped (carrying regular oil) from the system is 20,722.1. Therefore, the additional cost ($) due to truck wait time is equal to:
(1) The percentage of additional cost due to truck wait time = $1.5839/Average total cost = $1.5839/$34.3155 = 4.62%. This cost would be avoided if trucks did not have to wait in the system.
What would the maximum theoretical average profit per week be if trucks did not have to wait in the system
and all oil arrivals were shipped through the regular stream? How effective is the system's overall performance compared to this theoretical maximum average total profit per week? The theoretical maximum profit is calculated by using the following logic:
(2)

4358 Afr. J. Bus. Manage.
Fig 6. Truck TBA analysis – lowest terminal capacity
35 40 45 50 55 60 65 70 75 80 85 90 95 100105110115120125130
Truck TBA
% Truck Balked
Avg total profit/wk
50%
60%
70%Truck TBA Analysis
Lowest Terminal Capacity 70
60
55
40
30
20
10
0
Perc
ent
Figure 6. Truck TBA analysis – lowest terminal capacity.
Fig 7. The renewed business model (TO-BE)
An
aly
tic
Dep
artm
ent
Yes
No
Order
confirmation Is
confirmed?
Acceptance of
delivery End Unloading
Oil
Dep
ot
Tra
nsp
ort
Co
mp
any
Order acceptance
Waiting/ preparation of
delivery
Optimization of
transportation
No Order needed
? Start
Identification of
the needs
(automatic)
Aggregation of
purchasing orders (automatic)
End
Yes
Optimization of
transportation
Informing the
analytic
department Order correction
Figure 7. The renewed business model (TO-BE).

Abduljabbar and Tahar 4359
Table 2. Comparison of simulation results for the real system (AS-IS) and developed system (TO-BE) per department.
Department Total cost real system (AS-IS) $ Total cost developed model (TO-BE) $
Analytic department 62.34 73.25
Petroleum depot 950.50 179.36
Purchasing department 8214.76 0.0
Fuel company( total) 9250.40 243.60
Transport company 19794.87 6894.74
Fig 8. Inventory costs versus reorder point.
Figure 8. Inventory costs versus reorder point.
Solution set's overall effectiveness (low) is equal to:

4360 Afr. J. Bus. Manage. Table 3. Insight into solution set.
Solution set
(sorted by profit/week)
Avg profit/week
($)
Truck TBA
(minutes)
Number of
tanks
Tank size
(1,000 m3)
Terminal capacity (1,000 m3)
Avg % of total
regular oil shipped
Avg % of total
discount oil shipped
Avg truck balk rate
(%)
Avg truck trip cost as a % of total cost
Avg truck in system as a % of total cost
Avg truck balk cost as a % of total
cost
Avg truck cost
as a % of total cost
Avg lease cost
as a % of total cost
Avg truck time in system
(minutes)
180 weeks run, 20 weeks warm up period and
10 runs
17.60 75 2 34 68 82.50 17.20 4.10 44.45 33.10 1.65 80.13 20.12 87.23
17.83 75 2 18 36 80.10 21.40 8.30 46.15 37.20 3.95 88.34 11.24 95.56
17.93 75 3 26 78 84.30 15.40 2.10 44.90 30.90 0.89 76.23 22.86 82.12
18.30 75 2 26 52 83.20 18.20 4.90 46.30 35.24 2.65 83.95 16.32 89.85
18.70 75 4 18 72 84.90 15.30 1.80 45.20 32.56 0.89 79.03 20.95 84.32
19.65 75 3 18 54 83.40 17.60 3.40 46.95 35.15 1.62 83.75 16.43 87.98
Solution set's overall effectiveness (high) (Highest average total profit per week in solution set)/(Theoretical maximum profit per week) = 19.65/31.97 = 61.46% Therefore, using the given model parameters, the solution set's overall effectiveness is between 55.05 and 61.46%. The variability in the oil and truck arrival could be improved to improve the effectiveness of the model. One example of reducing the arrival variability would be to have truck available on demand or have the truck depot located next to the oil terminal. Many suppliers are now co-locating next to their customers to improve responsiveness to service.
Conclusion
To sum up, the case study showed a two-phase approach to estimating the different benefits of business process renovation with the use of simulations. The transfer of information brings important advantages in process costs and lead-times, while the resulting possibility of smaller and more frequent orders means
reduced inventory costs. Meanwhile, the simu- lation results proved that, through the developed decision support system model, decision makers could be able to choose the optimal number of tanks, tank size and truck arrival rate thus to predict, or rather, maximize the average total profit per week for the oil terminal operation.
More significantly, as the main aspects is needed for a successful renovation, integration and operation of SCs were analyzed, the core idea worthy to note is that the successful imple-mentation of SC integration projects is not as much a technological problem but that a thorough study of the current and desired states of business processes involved in most cases of petroleum refineries.
REFERENCES Banks J, Buckley S, Jain S, Lendermann P (2002). “Panel
session: opportunities for simulation in supply chain management. In Proceedings of the, Winter. Simul. Conf., pp.1652-1658.
Bay B, Tang N, Bennett D (2004). “An empirical study of the imperatives for a supply chain implementation project in Seagate Technology International”. Supply Chain Manage. 9(4): 331-40.
Bosilj-Vuksic V, Indihar Stemberger M, Jaklic J, Kovacic A (2002). “Assessment of EBusiness Transformation Using Simulation Modeling”. Simul. 78(12): 731-44.
Burgess R (1998). “Avoiding supply chain management failure: Lessons from business process re-engineering”. Int. J. Logist. Manage., 9(1): 15-23.
Chen M (1999). “BPR Methodologies: Methods and Tools”. In Elzinga J, Gulledge T, Lee C, editors. Business Process Engineering. Kluwer Academic Publishers, Massachusetts, pp. 187-212.
Cheng L, Duran MA (2004). Logistics for world-wide crude oil transportation using discrete event simulation and optimal control. Comput. Chem. Eng., 28: 897-911.
Christofides N, Mingozzi A, Toth P (1980). “Dynamic Loading and Unloading of Liquids into Tanks”. Oper. Res., 28(3): 633-649.
Chryssolouris G, Papakostas N, Mourtzis D (2005). “Refinery short-term scheduling with tank farm, inventory and distillation management: An integrated simulation- based approach”. Europ. J. Oper. Res., 166: 812-827.
Edwin Valentin, Renk Bijlsma A (2008). Vincent de Gast: Empowering decision support with simulation technology - Scenario Navigator. Winter Simul. Conf., pp. 236-244.
Eriksson H, Penker M (2000). “Business Modeling with UML”. Business Patterns at Work. John Wiley & Sons.
Gayialis S, Tatsiopoulos I (2004). “Design of an ITdriven decision support system for vehicle routing and scheduling”. Eur. J. Oper. Res., 152(2): 382-98.
Groznik A, Mujkic E (2005). “Management oskrbovalne verige v naftni industriji”. Uporabna informatika. 13(3): 146-52.
Hughes HO (1971). “Impact of Management Science in Mobil”. Conf. Oper. Res. Q., 22: 19-37.
Indihar Stemberger M, Jaklic J, Popovic A (2004). “Suitability

of process maps for business process simulation in business process
renovation projects”. Proceedings of the 2004 European Simulation Symposium, Budapest. Julka N, Karimi I, Srinivasan R (2002). “Agent-based supply chain management: a refinery application”. Comput. Chem. Eng., 26: 1771-1781.
Kelton WD, Sadowski RP, Sadowski DA (1998). Simulation with Arena, McGraw-Hill,
Kleijnen JPC (2005) “Supply chain simulation tools and techniques: a survey”. Int. J. Simul. Process. Model., 1: 82-89.
Kleywegt AJ, Nori VS, Savelsbergh MWP (2000). "The Stochastic Inventory Routing Problem with Direct Deliveries", Technical Report, School of Industrial and System Engineering, Georgia Institute of Technology.
Longo F (2010). Design and integration of the containers inspection activities in the container terminal operations, Int. J. Prod. Econ., 125(2): 272-283.
Abduljabbar and Tahar 4361
Neiro SMS, Pinto JM (2004). “A general modeling framework for the
operational planning of petroleum supply chains”. Comput. Chem. Eng., 28: 871-896.
Razman TM, Waleed Abduljabbar K (2010). „A simulation and optimization model for the transport refinery products‟, Int. J. Oil, Gas. Coal. Technol., 3(1): 138-143.
Reddy PCP, Karimi IA, Srinivasan R (2004). “ A novel solution approach for optimizing crude oil operations”. AIChE J., 50(6): 1177-1197.
Shannon RE (1975). “Systems Simulation: The Art and Science, Prentice-Hall, Englewood Cliffs.