a case analysis of critiques on high frequency trading
TRANSCRIPT

A case analysis of critiques on high‐frequency trading
June 2016

2
The Netherlands Authority for the Financial Markets
The AFM is committed to promoting fair and transparent financial markets.
As an independent market conduct authority, we contribute to a sustainable financial system and
prosperity in the Netherlands.

3
Executive Summary
In its 2010 report on high‐frequency trading1 (HFT) the AFM stated that HFT does not constitute a
separate trading strategy. Instead, it was argued that HFT implements existing trading strategies
(such as market making or arbitrage) in a technologically sophisticated manner. During the last
few years, the nature of trading strategies undertaken by high‐frequency traders (HFT) has been a
major topic for debate. For example, the book ‘Flash Boys’ has argued that there are specific HFT
trading strategies which are unfairly favoured by the existing market structure in the United
States, and which are detrimental to overall market quality. These critiques build on a wider
ranging debate (in particular amongst buy‐side firms) regarding the impact of HFT on price
formation.
Recently, the AFM undertook an assessment of HFT strategies with a selection of critiques in
mind. These critiques were selected based on a literature review and discussions with buy‐side
representatives. As part of our research we discussed the critiques with several HFT firms and
trading venues, and performed a data‐analysis to discover possible instances of criticized trading
behaviours in our data. The scope of the analysis focused on stocks directly under supervision of
the AFM. In today’s fragmented markets, these stocks are not exclusively traded on Dutch trading
venues but also on several UK Recognized Investment Exchanges (RIEs) and Multilateral Trading
Facilities (MTFs), mainly based in London.
In this paper we will present our findings regarding two relevant and often expressed critiques.
First, HFT is accused of providing ghost liquidity. The AFM discussed the issue of ghost liquidity
with several relevant stakeholders (i.e., buy‐side firms, trading venues and HFT) and we will report
a summary in this paper. Second, it is being argued that HFT strategies can make riskless profits at
the expense of investors, in particular of those that want to execute large orders. This paper
discusses the findings of five case studies analyzed by the AFM. These case studies included a
(fine‐grained) data‐analysis of trading data across multiple trading venues.
Ghost liquidity by high‐frequency traders
A general definition for ghost liquidity is seeing liquidity, but then not being able to trade with it
because it has suddenly vanished. Many market participants we interviewed see this as a major
problem, and they ascribe it mainly to HFT. Some investors experience a situation whereby their
orders remain unmatched when sending them to a single trading venue, even though their
trading software indicated that a match was possible. The targeted liquidity had vanished, and
investors claim that this was because of HFT. Regardless of their speed, HFT are unable to take a
look at an investor’s order (and then react on it) before it is processed by the trading venue. This
is impossible, by design. The existence of an order will only be exposed to the market after it has
been processed. HFT are the first in the marketplace to react on the order, but if the order had
been marketable it would have led to transactions, for example with orders of the HFT.
1 High‐frequency trading: the application of advanced trading technology in the European marketplace, AFM, November 2010

4
It is possible, however, that prices could have changed while the investor’s order was on route to
the trading venue, preventing the order from being matched. It is important to realize that no
market participant can obtain a perfect real‐time view of the market. Because of technological
advancements in market infrastructure, and because of market participants that employ fast
algorithmic trading strategies, order books nowadays can change rapidly. As a consequence,
traders may see an outdated ‘snapshot’ of the market, which may lead them to believe that they
can trade with an order that is no longer there. That does not make this order fake; the market
has changed since that moment.
In the previous example, HFT firms cannot remove liquidity that would otherwise be matched by
the single order of the investor. This changes when an order is broken down into several smaller
orders which are then dispersed over multiple trading venues. For example, buy‐side firms trading
large volumes can decide to trade cross‐market in order to mitigate price impact. Because of the
different matching engine latencies that trading venues have (i.e., the time it takes to get the
order processed), it is possible that a partial execution on one trading venue can trigger HFT to
remove liquidity on others. In this case, HFT firms are triggered by the investor’s order before it is
fully processed. One argument for removing liquidity, as put forward by HFT market‐makers, is
because of their duplicate orders. Potential counterparties of HFT have a wide selection of trading
venues that they can go to. In order to interact with this order flow, HFT market‐makers send in
duplicate orders (i.e., with a similar price and volume) to many different trading venues. When
some of these duplicate orders are matched, as for example by one part of the investor’s order,
HFT market‐makers may decide to cancel or update duplicate orders on other trading venues
before the remaining parts of the investor’s order arrive. HFT market‐makers assert that this
behaviour is essential for running a successful market making strategy, i.e., it prevents them from
building up (overly) large positions and executing losing trades.
The AFM recognizes that measuring liquidity across multiple trading venues in an actionable
manner is complex and can pose practical challenges to market participants, in particular because
HFT can react within split seconds to new market data. For buy‐side firms managing price impact,
this is an import argument to support their critiques that HFT provide ghost liquidity.
The AFM believes that fleeting orders by market‐makers should not be qualified as (a form of)
ghost liquidity but rather that the underlying trading patterns are a logical consequence of the
application of market making strategies in a fragmented marketplace.
The impact of today’s market structure and of its participants on liquidity requires further analysis
by regulators, academics and also by market participants. The AFM welcomes discussions on the
topic of accurately measuring liquidity in a fragmented marketplace (e.g., correcting for ‘less
certain’ orders), so that buy‐side firms can better manage their risk while allowing market‐makers
to continue executing their trading strategies, essentially allowing them to also manage their risk.

5
Liquidity detection strategies by high‐frequency traders
Liquidity detection is commonly understood as a trading strategy whereby HFT respond to partial
executions of an investor´s order. HFT then race to trading venues where they have predicted that
the investor will enter next, and snatch liquidity away before the investor can enter the venue.
Thus, HFT essentially build up a large position which they aim to close at a more favourable price
with the incoming investor as their intended counterparty. This alleged behaviour causes
investors to pay more when buying (or receive less when selling) than would have been the case if
HFT had not been present. In other words, the critique is that HFT profit unfairly from the orders
of large investors.
The AFM has analysed the trading conduct of HFT up to and around the execution of five large
orders across multiple trading venues. In four out of five of the analysed cases, we did not find
evidence of liquidity detection strategies being implemented. We did find one instance of a
trading pattern for HFT that resembled the liquidity detection strategy. However, the trading
pattern in our analyses case differed in several crucial aspects, and this suggests different trading
intentions for the HFT involved (i.e., an arbitrage strategy).
We conclude that we did not find any evidence of HFT executing the liquidity detection strategy in
our case studies. Naturally, we were only able to investigate a finite number of cases that involved
only a subset of HFT present in our marketplace. Therefore, we cannot make any general
statements about liquidity detection as a whole, nor about all HFT actors. Recently the FCA
concluded that liquidity detection does not occur systematically on their market2. Our (fine‐
grained) data‐analyses support this conclusion for the Dutch market situation3 and provide
insights into the trading intention for a selection of HFT.
2 Are high‐frequency traders anticipating order flow, Occasional paper FCA, April 2016 3 It should be noted that the Dutch market situation is similar to that of the United Kingdom (UK). Dutch stocks are not exclusively traded on Dutch trading venues but also on several UK Recognized Investment Exchanges (RIEs) and Multilateral Trading Facilities (MTFs), mainly based in London
6
1. Introduction
There is no encompassing definition for high‐frequency trading (HFT); however some general
qualifications for this class of traders can be made. First of all, HFT can be described as a subset of
algorithmic trading. In this larger set, high‐frequency traders (HFT) distinguish themselves with
low latencies (i.e., they can react within microseconds to market changes and are the fastest in
the marketplace) and a large number of transactions (hence the name high‐frequency trading).
HFT have considerable market shares with respect to traded volume and (especially) the number
of orders. This makes them relevant players on financial markets, and as such they are also
relevant for regulators.
Recently, the nature of the trading strategies undertaken by HFT has been a major topic for
debate. For example, the book ‘Flash Boys’ has argued that specific HFT strategies exist which are
unfairly favoured by the existing market structure in the United States (US) and which are
detrimental to overall market quality. These critiques build on a wider ranging debate (in
particular amongst buy‐side participants) regarding the impact of HFT on price formation. It
should be noted that the US market structure differs from the European one in several key
aspects. The AFM considers it important to evaluate these critiques in the context of Dutch and
European market structure.
However, understanding and analysing trading strategies of HFT is a challenge for regulators,
predominantly because of the sheer size of the data that is involved. As mentioned before, HFT
are extremely active and rapid traders. Additionally, the strategies of HFT may span multiple
trading venues and asset classes. As a consequence, obtaining an encompassing view of HFT
behaviour is challenging but nonetheless necessary to address the critiques. In recent years, the
AFM has explored new ways to tackle this big‐data challenge, in particular in terms of visualizing
large amounts of data. See Figures 1a and 1b for a visualization of trading for the market as a
whole and for one specific HFT firm. Each bar represents an order, from entry into the order book
until the time it was removed. The length of a bar represents the lifetime of an order. One can see
that the orders of the HFT (see Figure 1b) typically have shorter lifetimes as compared with orders
of some other market participants (see Figure 1a). In this report we will use such visualizations to
look into the trading strategies of HFT, and more specifically, those strategies that are deemed as
unfair by some. For our analysis we have used granular, non‐anonymous order data from multiple
trading venues in the Netherlands and in the United Kingdom (UK) to uncover potential instances
of criticised trading behaviours of HFT.
In this report we will present the findings of our analysis. In the coming paragraphs we will go into
more detail with regard to two relevant critiques on HFT. These were selected based on a
literature review and discussions with several buy‐side representatives. More specifically, we will
discuss ghost liquidity and liquidity detection4 by HFT.
4 This is described in the ‘Flash Boys’ book where it was called electronic front‐running.

7
2. High‐frequency traders provide ghost liquidity
The most common critique, expressed both by retail and professional traders, is that HFT provide
ghost liquidity. A general definition for ghost liquidity is seeing liquidity, but then not being able to
trade with it because it had suddenly vanished.
A trader trading on a single trading venue may experience that orders unexpectedly remain
unmatched, even though the trading software had indicated that a match was possible. The
targeted liquidity had vanished, and this was because of ultrafast HFT offering ghost liquidity,
according to the investors.
Market participants trading large sizes across several trading venues also accuse HFT of offering
ghost liquidity. The current marketplace is highly fragmented, and market participants can employ
smart order routing techniques to find liquidity across multiple trading venues in order to mitigate
price impact. However, market participants claim that executing large orders across multiple
trading venues is problematic. The experience is that only parts of the large order are matched,
while liquidity on other trading venues simply vanishes. This is then again described as ghost
liquidity caused by HFT.
Although the common denominator for the above situations is that HFT can somehow remove
liquidity from the order book before others can trade with it, the underlying cause is
fundamentally different. We will now present our findings, based on talks with several relevant
stakeholders, on both of these critiques.
Figure 1a (left) and 1b (right): Visualization of order books over time for one instrument. The image on
the left represents orders for all market participants, whereas the image on the right only shows orders for
one selected HFT. The horizontal axis denotes time, whereas the vertical axis shows the price of the
instrument. The green/red bars represent buy/sell orders from entry (left‐hand side) to their disappearance
(right‐hand side). Orders may disappear because of cancellations, modifications or executions.

8
Figure 2: The number of order book mutations per second, calculated for one day in a Dutch Large Cap on
Euronext Amsterdam. On the horizontal axis we find seven different buckets with respect to the number of
order book mutations, whereas the vertical axis shows the frequency (in percentages).
2.1 Ghost liquidity from a single market perspective
An investor’s order sent to a single trading venue unexpectedly remains unmatched, even though
it was believed that a match was possible. The targeted liquidity had vanished, and this was
because of ultrafast HFT, according to investors. Regardless of their speed, HFT are unable to take
a look at an investor’s order (and then react on it) before it is fully processed by the trading
venue. The existence of an order will only be exposed to the market after it has been processed.
Ultrafast HFT are the first in the marketplace to react on the order, but if the order had been
marketable it would have led to transactions, for example with orders of HFT.
A likely explanation as to why traders are left with unmatched orders is their slow and sparse
access to trading venues and the fact that order books nowadays change very rapidly. Figure 2
tells us that in a Dutch Large Cap, one can expect at least 10 mutations (but often much more) per
second to the order book in half of the times during that trading day.
These frequent changes can in part be contributed to HFT market‐makers. HFT market‐makers
provide passive liquidity to the market, typically on both sides of the market. Being in the order
book is a risky proposition, because the market may move against you. Therefore, HFT market‐
makers continuously update their (overvalued or undervalued) prices based on changing market
situations. For them, speed is a risk management tool.
And because order books change rapidly, it is important to realize that no market participant can
obtain a perfect‐real‐time view of the market. This certainly applies to slower retail and
professional investors (but even to HFT). If some trading software only refreshes price information
occasionally, and it also takes fractions of a second to receive and process updated order book
information and send out an order to a trading venue, then there is a reasonable chance that (the
top of) the order book may have changed. Traders then see an outdated ‘snapshot’ of the market.
Therefore, it may be the case that one expects to trade on orders that are no longer available.
That does not make these orders fake, they were real and marketable, but the market simply
changed before the investor’s order was processed by the trading venue.

9
Figure 3a (left), 3b (middle) and 3c (right): Three hypothetical scenarios of an Amsterdam‐based broker
looking to trade 100,000 shares in a specific instrument. Each figure shows the approximated location of the
four different trading venues (i.e., their matching engines). Per trading venue, we see in red/green the best
offer/bid (both price and number of available shares). The circles represent orders of the broker, also
showing the limit price and desired number of shares.
2.2 Ghost liquidity from a cross‐market perspective
The current marketplace is highly fragmented, and market participants can employ smart order
routing techniques to find liquidity across multiple trading venues. In Figures 3a to 3c we present
hypothetical order books for four different trading venues in one particular instrument. An
Amsterdam‐based broker decides to buy 100,000 shares. If the order is fully routed to Euronext
(and limited at a price of at least €6.26) it is fully matched (see Figure 3a). However, a large
portion of the order was executed on a price that was less favourable than the European best‐bid‐
and‐offer (EBBO). The large order therefore generates a price impact.
In order to mitigate price impact, the broker may decide to split the large order into four partial
orders of 25,000 shares each and route them to the four different trading venues, setting the limit
price at €6.25 (see Figure 3b). Theoretically, the large order will then be fully matched without
generating any price impact i.e., each share is traded on the EBBO. However, when utilizing this
order routing strategy in practice, investors nowadays experience that only parts of the large
order are executed. Figure 3c illustrates the hypothetical situation whereby only one partial order
is matched on Chi‐X. The three remaining partial orders are not matched because the liquidity at
the price of €6.25 has vanished on those trading venues. The new best offer is increased by €0.01
to €6.26. As a result, the investor has now only traded a quarter of the total desired sum. Also, the
investor’s intent to buy a large amount of shares is now exposed to the market. The investor is in
the order book at the best bid for €6.25, as is illustrated in Figure 3c. This arguably could generate
even more price impact, because other market participants may decide to increase prices based
on the newly observed (large) demand.
In the example, liquidity vanishes on three different trading venues, liquidity that large investors
believed they could have traded with. This poses a serious challenge and risk for investors that
need to mitigate price impact for their large orders. In discussions with buy‐side representatives,
many state that executing large orders is more problematic nowadays than it used to be. Many
blame this on the trading conduct of HFT.
B CA
10
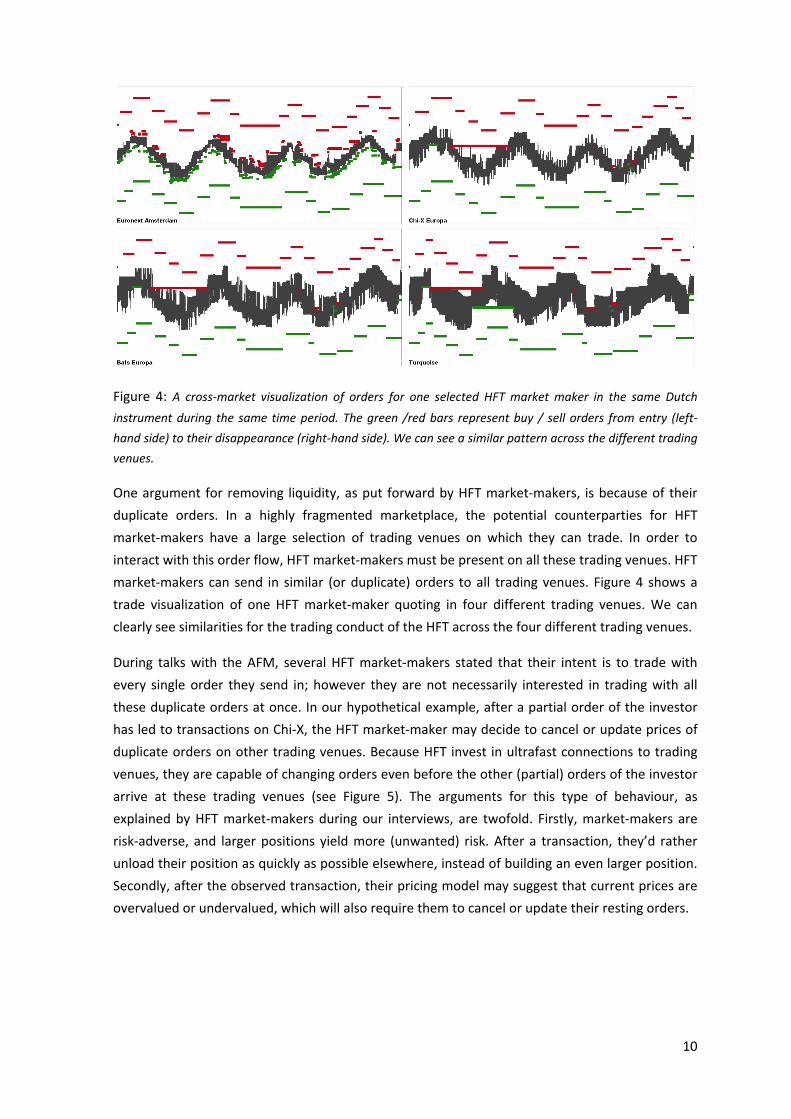
Figure 4: A cross‐market visualization of orders for one selected HFT market maker in the same Dutch
instrument during the same time period. The green /red bars represent buy / sell orders from entry (left‐
hand side) to their disappearance (right‐hand side). We can see a similar pattern across the different trading
venues.
One argument for removing liquidity, as put forward by HFT market‐makers, is because of their
duplicate orders. In a highly fragmented marketplace, the potential counterparties for HFT
market‐makers have a large selection of trading venues on which they can trade. In order to
interact with this order flow, HFT market‐makers must be present on all these trading venues. HFT
market‐makers can send in similar (or duplicate) orders to all trading venues. Figure 4 shows a
trade visualization of one HFT market‐maker quoting in four different trading venues. We can
clearly see similarities for the trading conduct of the HFT across the four different trading venues.
During talks with the AFM, several HFT market‐makers stated that their intent is to trade with
every single order they send in; however they are not necessarily interested in trading with all
these duplicate orders at once. In our hypothetical example, after a partial order of the investor
has led to transactions on Chi‐X, the HFT market‐maker may decide to cancel or update prices of
duplicate orders on other trading venues. Because HFT invest in ultrafast connections to trading
venues, they are capable of changing orders even before the other (partial) orders of the investor
arrive at these trading venues (see Figure 5). The arguments for this type of behaviour, as
explained by HFT market‐makers during our interviews, are twofold. Firstly, market‐makers are
risk‐adverse, and larger positions yield more (unwanted) risk. After a transaction, they’d rather
unload their position as quickly as possible elsewhere, instead of building an even larger position.
Secondly, after the observed transaction, their pricing model may suggest that current prices are
overvalued or undervalued, which will also require them to cancel or update their resting orders.

11
Figure 5: After one partial order of the investor hits Chi‐X and leads to a transaction, the co‐located HFT
then reacts by cancelling duplicate orders on other trading venues. Because HFT have invested in ultrafast
connections to trading venues, these cancellations arrive at these trading venues before the remaining
partial orders of the investor do.
If orders are updated based on an external signal (as was the case in the single market scenario)
there can be no question of ghost liquidity. Orders were marketable at some point, but the
market had changed since then. However, in the case of duplicate orders, the partial footprint of
the larger (split) order enables the HFT to respond and remove liquidity. Can one trade with these
duplicate orders, or in other words, are they fake or real?
In principle, all duplicate orders can be traded with, as long as one uses the appropriate execution
technology (i.e., hit all markets at roughly the same time). Also, the intention of HFT market‐
makers is to trade with every single one of these orders (they do not know at which trading venue
a new order will come in), but not with all duplicate orders at the same time. Therefore, strictly
speaking, these orders cannot be classified as fake, as the intention to trade was present, and in
principle all orders can be traded with.
2.3 Conclusion
There is an obvious conflict of interests between investors seeking large quantities of liquidity and
HFT market‐makers offering liquidity. From an inventory and risk management perspective of a
HFT market‐maker, cancelling duplicate orders (or to put it in more general terms, reacting on
new market information within fractions of a second) makes sense. However, this makes ‘reading
the order book’ more difficult than it used to be, since (top of the book) liquidity is ‘less certain’.
The hypothetical situation given in Figure 3c can have a very negative impact on the trading cost
of buy‐side firms: they only achieve a partial execution, while their trading intention may become
exposed to the market (which can generate even more price impact). Therefore, from the
perspective of buy‐side firms wanting to manage price impact, the critique on duplicate orders
also makes sense.

12
The AFM believes that fleeting orders by market‐makers should not be qualified as (a form of)
ghost liquidity but rather that the underlying trading patterns are a logical consequence of the
application of market making strategies in a fragmented marketplace.
The impact of today’s market structure and of its participants on liquidity requires further analysis
by regulators, academics and also by market participants. The AFM welcomes discussions on the
topic of accurately measuring liquidity in the (fragmented) marketplace (e.g., correcting for ‘less
certain’ orders), so that buy‐side firms can better manage their risk while allowing market‐makers
to continue executing their trading strategies, essentially allowing them to also manage their risk.

13
3. High‐frequency traders prey on large orders
The previous chapter (in particular Figure 5) illustrates the trading conduct of some HFT (market‐
makers) with respect to duplicate orders. The partial footprint of a larger order (split into several
parts) has triggered ultrafast HFT to cancel or modify own orders even before all remaining parts
of the large order have arrived at the various trading venues. Michael Lewis’ ‘Flash Boys’ describes
a similar strategy, in the sense that HFT analyse (parts) of a larger order and then react to it. The
book however gives a completely different interpretation of HFT trading intentions. Namely, the
‘electronic front‐running’ strategy is alleged to actively scan markets for large investor’s orders,
hoping to skim a few cents from them. The AFM immediately notes that the use of the term
‘front‐running’ in this context is unfortunate, given the common legal understanding of the term
which relates to the breach of a fiduciary client relationship (which is quite different from the
behaviour described in ‘Flash Boys’). A more appropriate name for this alleged trading conduct is
liquidity detection.
3.1 Liquidity detection
The hypothesised strategy of Liquidity detection (LD) as described in ‘Flash Boys’ essentially
consists of three steps. We will illustrate the LD strategy using a fictitious example (i.e., the prices
and volumes differ from the examples used in the book).
Step 1: HFT trade with (parts) of the large order and analyse it
In Figure 6a, a Manhattan‐based broker sends out a large sell order for a total of 9100 shares,
fixed at a price of $25. The order is split and routed to four different trading venues. According to
the consolidated order book (accumulating all bids and offers for the four different trading
venues), the larger order should be fully executed, i.e., 9100 shares are to be sold across these
four trading venues. The first partial order arrives on BATS, simply because this trading venue is
geographically closest to the broker. According to Michael Lewis’ ‘Flash Boys’, co‐located HFT
were waiting with small orders on this trading venue, which ensured that they were first in the
marketplace to learn about this news. As a next step, HFT then guess if this order is part of a much
larger order. They also guess how the larger order will be distributed among the various trading
venues. And finally, HFT also guess how much above or below the market price the investor is
willing to go. In the meantime, the remaining investor’s orders are still on route to the other
trading venues.
Step 2: HFT race ahead of the investor’s orders to other trading venues and build a (large) position
‘Flash Boys’ then explains that if HFT believe it is opportunistic, they will race to the other trading
venues and buy or sell accordingly, even before the investor’s orders arrive. For example, in
Figure 6a the HFT observed an incoming sell order, from which they could infer that this seller
may also enter other trading venues. Figure 6b illustrates the situation whereby the HFT decides
to sell large amounts of shares ahead of the investor’s orders. To put it differently: the HFT
snatches away the liquidity that the investor was aiming for.

14
Figure 6a (left), 6b (middle) and 6c (right): An illustration of the three steps of ‘electronic front‐
running’ (or ‘liquidity detection’) as explained in ‘Flash Boys’. For four trading venues, we see the
best bid (‘B’) and offer (‘S’). Red dots represent sell orders, whereas green dots represent buy
orders for either the broker or the co‐located HFT.
Step 3: HFT turn around and close their (large) position
As a final step, HFT aim at closing their large position with the investor as the intended
counterparty. They hope to do so at a more favourable price for them (and therefore less
favourable for the investor). More precisely, in Figure 6b the HFT has just sold 9,000 shares at a
price of $25. Finally in Figure 6c, they have put in a bid for 9,000 shares at a price of $24. If the
investor ‐ which was aiming to sell at $25 ‐ also decides to sell at $24, then the HFT earns a $1
profit per share at the expense of the investor.
These steps can be inferred from the ‘Flash Boys’ book. Steps 2 and 3 (i.e., HFT snatch liquidity
away and then offer it a less favourable price for the investor) are the main arguments for
classifying this strategy as unfair.
3.2 Liquidity detection in Europe
The scenarios discussed in ‘Flash Boys’ were all situated in the United States (US). The US market
structure differs from the European one in several crucial aspects. In particular, the Regulation
NMS requires that orders are routed to trading venues that currently hold the ‘National Best Bid
and Offer’ (NBBO). As a result, larger orders are often split and routed to many different trading
venues, giving ultrafast HFT the opportunity to execute the alleged LD strategy.
The European marketplace does not enforce a ‘European Best Bid and Offer’ (EBBO).
Consequently, it is a legitimate question as to whether LD is a realistic strategy on our markets.
Essentially, in order to successfully execute the LD strategy, there are three requirements: (1) the
presence of (co‐located) HFT, (2) cross‐market trading and (3) different latencies (from broker to
the various trading venues). All these requirements are met in the European case. First, European
trading venues do offer co‐location facilities. Second, based on market shares for the different
European trading venues with respect to equity, one may conclude that firms are trading across
multiple trading venues, even in the absence of an enforced EBBO.
B CA

15
Figure 7a to 7d: Cross‐market trading visualization of one HFT firm. Each box shows the trading conduct of
this HFT on one trading venue. The horizontal axis denotes time and the vertical axis the price (axis values
not shown). The green/red bars represent buy/sell orders from start (left‐hand side) to end (right‐hand side),
whereas the green/red dots represent buy/sell transactions. Larger dots represent larger sized transactions.
We only show orders and transactions for the one HFT. The grey area represents the spread for the entire
market. The blue, vertical lines in each box represent the time at which the HFT performs its first transaction
on that specific trading venue. The orange vertical lines, on the other hand, represent the time of the first
transaction over all trading venues (i.e., the first signal it can react to).
And finally, it can be asserted that latencies differ for each combination of broker and trading
venue, because trading venues have different geographic locations. In theory, all the ingredients
for LD are available in the European marketplace. Recently, the AFM started an investigation into
LD. More specifically, five case studies were done. These case studies included a fine‐grained
data‐analysis of trading data across multiple trading venues. We will present our findings in the
next chapter.
3.3 Analyses of Liquidity detection
The AFM studied the impact of five large orders that were dispersed among different European
trading venues. The focus in our analyses was both on the trading conduct of HFT up to and
around the execution of these large orders, and on the (price) impact for the investor responsible
for the large order. We will now provide an extensive report on two of these studies.
3.3.1 Trading conduct of HFT during the execution of large orders
Figures 7a to 7d show the trading conduct of one HFT around the time that a large investor’s
order was routed to several trading venues. The visualizations are based on trading data in
instruments under supervision of the AFM. Each box visualizes the trading conduct of the HFT on
that specific trading venue.
A B
C D
16
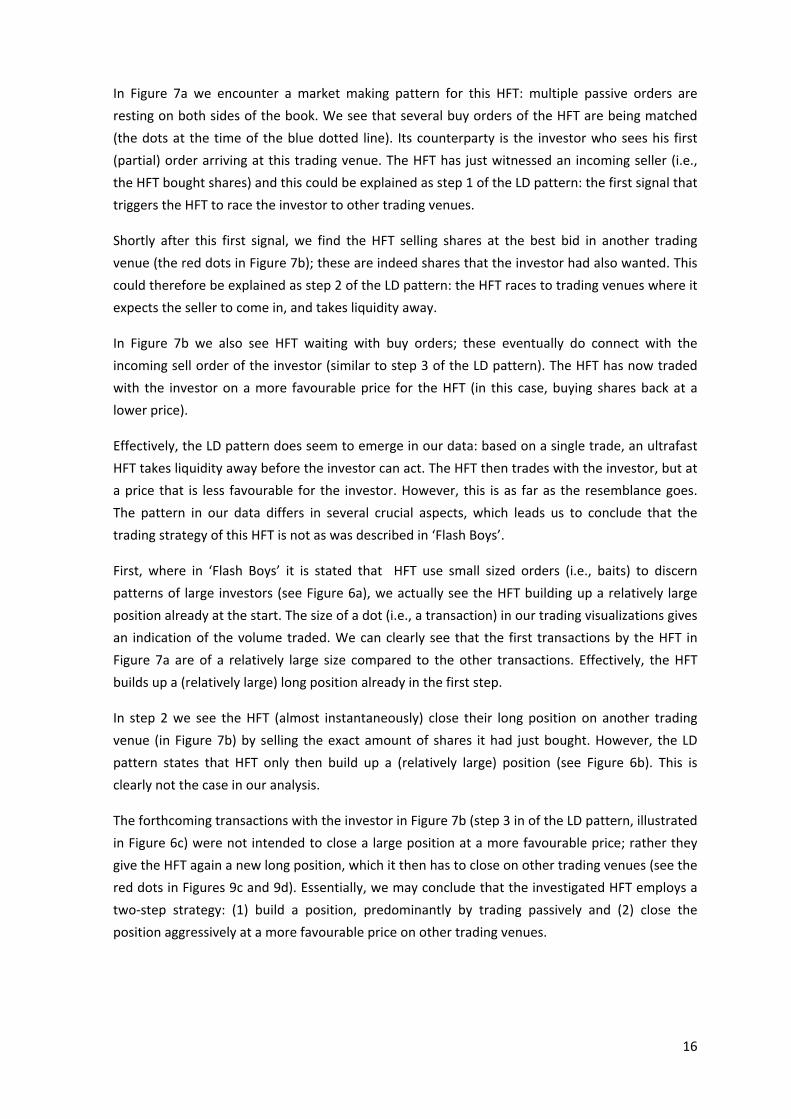
In Figure 7a we encounter a market making pattern for this HFT: multiple passive orders are
resting on both sides of the book. We see that several buy orders of the HFT are being matched
(the dots at the time of the blue dotted line). Its counterparty is the investor who sees his first
(partial) order arriving at this trading venue. The HFT has just witnessed an incoming seller (i.e.,
the HFT bought shares) and this could be explained as step 1 of the LD pattern: the first signal that
triggers the HFT to race the investor to other trading venues.
Shortly after this first signal, we find the HFT selling shares at the best bid in another trading
venue (the red dots in Figure 7b); these are indeed shares that the investor had also wanted. This
could therefore be explained as step 2 of the LD pattern: the HFT races to trading venues where it
expects the seller to come in, and takes liquidity away.
In Figure 7b we also see HFT waiting with buy orders; these eventually do connect with the
incoming sell order of the investor (similar to step 3 of the LD pattern). The HFT has now traded
with the investor on a more favourable price for the HFT (in this case, buying shares back at a
lower price).
Effectively, the LD pattern does seem to emerge in our data: based on a single trade, an ultrafast
HFT takes liquidity away before the investor can act. The HFT then trades with the investor, but at
a price that is less favourable for the investor. However, this is as far as the resemblance goes.
The pattern in our data differs in several crucial aspects, which leads us to conclude that the
trading strategy of this HFT is not as was described in ‘Flash Boys’.
First, where in ‘Flash Boys’ it is stated that HFT use small sized orders (i.e., baits) to discern
patterns of large investors (see Figure 6a), we actually see the HFT building up a relatively large
position already at the start. The size of a dot (i.e., a transaction) in our trading visualizations gives
an indication of the volume traded. We can clearly see that the first transactions by the HFT in
Figure 7a are of a relatively large size compared to the other transactions. Effectively, the HFT
builds up a (relatively large) long position already in the first step.
In step 2 we see the HFT (almost instantaneously) close their long position on another trading
venue (in Figure 7b) by selling the exact amount of shares it had just bought. However, the LD
pattern states that HFT only then build up a (relatively large) position (see Figure 6b). This is
clearly not the case in our analysis.
The forthcoming transactions with the investor in Figure 7b (step 3 in of the LD pattern, illustrated
in Figure 6c) were not intended to close a large position at a more favourable price; rather they
give the HFT again a new long position, which it then has to close on other trading venues (see the
red dots in Figures 9c and 9d). Essentially, we may conclude that the investigated HFT employs a
two‐step strategy: (1) build a position, predominantly by trading passively and (2) close the
position aggressively at a more favourable price on other trading venues.

17
Figure 8a to 8d: A more typical example (compared to the a‐typical one in 7a to 7d) of HFT trading
conduct. In Figure 8a the HFT passively builds up a position with the large investor being the counterparty. It
then closes the position aggressively on other trading venues (Figures 8b to 8d), typically earning a few cents
profit per share. There were no additional trades with the incoming (partial) orders of the investor.
The previously described case, despite some similarities, does not prove the existence of LD on
our markets. This conclusion was strengthened by the fact that in all the other investigated cases
there were no further transactions with incoming orders of the investor following the initial ones.
Therefore we conclude that the HFT involved in our case studies are not ‘racing ahead’ and
‘profiting from’ the large investor’s orders.
A typical trading pattern is shown in Figures 8a to 8d. The HFT initially trades with the investor in
Figure 8a, and then within fractions of a second closes the position on other trading venues. The
hypothesized third step from the LD pattern is lacking, i.e., there were no further interactions
with the investor after the HFT had closed the position. The HFT strategy as illustrated in Figures
8a to 8d can be classified as cross‐market arbitrage. The general opinion towards arbitrage
strategies is positive.
3.3.2 Impact of HFT trading conduct on the investor
In the previous chapter we explicitly looked into the behaviour of HFT. We did not yet cover the
impact on the investor. In all our case studies, investors were confronted with a suboptimal
execution, because latencies between the various trading venues differed. Different latencies
allowed HFT to update their orders and also allowed them to execute transactions before the
investor could act. Figures 9a to 9c illustrate the impact for the investor in one of our studies.
A B
C D
18
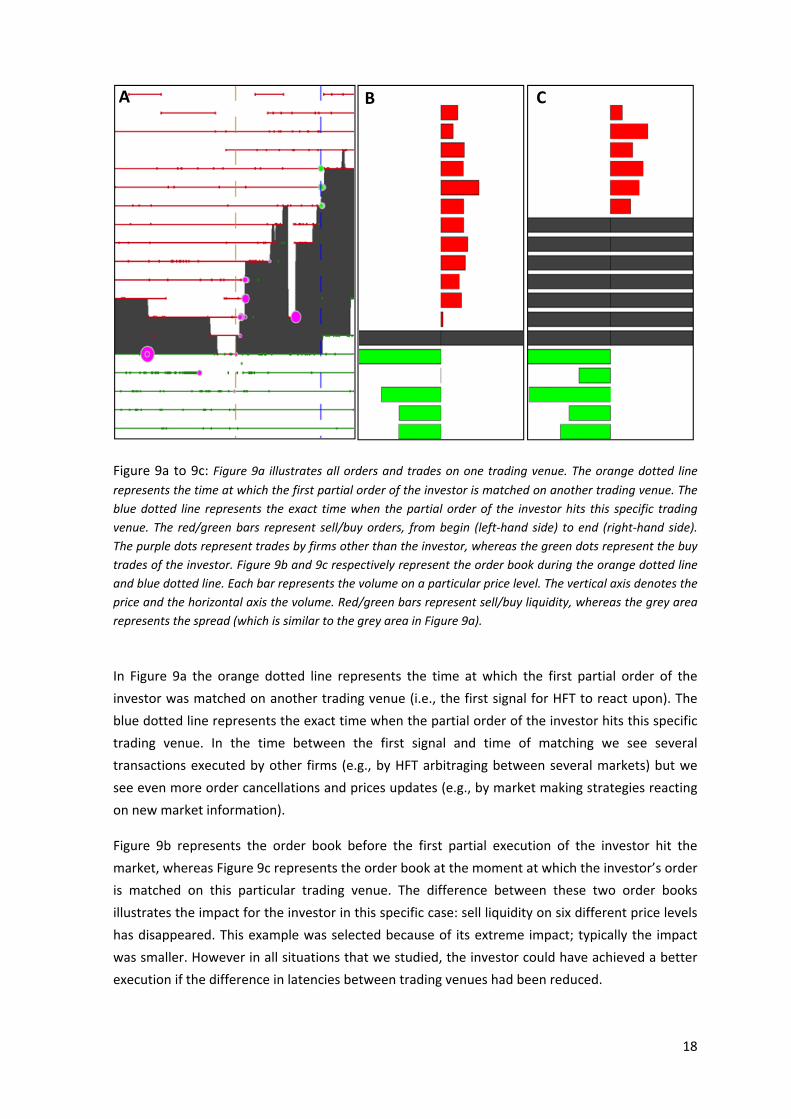
Figure 9a to 9c: Figure 9a illustrates all orders and trades on one trading venue. The orange dotted line
represents the time at which the first partial order of the investor is matched on another trading venue. The
blue dotted line represents the exact time when the partial order of the investor hits this specific trading
venue. The red/green bars represent sell/buy orders, from begin (left‐hand side) to end (right‐hand side).
The purple dots represent trades by firms other than the investor, whereas the green dots represent the buy
trades of the investor. Figure 9b and 9c respectively represent the order book during the orange dotted line
and blue dotted line. Each bar represents the volume on a particular price level. The vertical axis denotes the
price and the horizontal axis the volume. Red/green bars represent sell/buy liquidity, whereas the grey area
represents the spread (which is similar to the grey area in Figure 9a).
In Figure 9a the orange dotted line represents the time at which the first partial order of the
investor was matched on another trading venue (i.e., the first signal for HFT to react upon). The
blue dotted line represents the exact time when the partial order of the investor hits this specific
trading venue. In the time between the first signal and time of matching we see several
transactions executed by other firms (e.g., by HFT arbitraging between several markets) but we
see even more order cancellations and prices updates (e.g., by market making strategies reacting
on new market information).
Figure 9b represents the order book before the first partial execution of the investor hit the
market, whereas Figure 9c represents the order book at the moment at which the investor’s order
is matched on this particular trading venue. The difference between these two order books
illustrates the impact for the investor in this specific case: sell liquidity on six different price levels
has disappeared. This example was selected because of its extreme impact; typically the impact
was smaller. However in all situations that we studied, the investor could have achieved a better
execution if the difference in latencies between trading venues had been reduced.
A B C

19
3.4 Conclusion
The AFM has analysed the trading conduct of HFT up to and around the execution of five large
orders across multiple trading venues. In four out of five of the analysed cases, we did not find
evidence of liquidity detection strategies being implemented. We did find one instance of a
trading pattern for HFT that resembled the liquidity detection strategy. However, the trading
pattern in our analyses case differed in several crucial aspects, and this suggests different trading
intentions for the HFT involved (i.e., an arbitrage strategy).
We conclude that we did not find any evidence of HFT executing the liquidity detection strategy in
our case studies. Naturally, we were only able to investigate a finite number of cases that involved
only a subset of HFT present in our marketplace. Therefore, we cannot make any general
statements about liquidity detection as a whole, nor about all HFT actors. Recently the FCA
concluded that liquidity detection does not occur systematically on their market. Our fine‐grained
data‐analyses support this conclusion for the Dutch market situation and provide insights into the
trading intention for a selection of HFT.

20
The Netherlands Authority for the Financial Markets
T +31(0)20 797 2000 | F +31(0)20 797 3800
PO Box 112723 | 1001 GS Amsterdam
www.afm.nl
The text of this document has been compiled with care and is informative in nature. The findings
presented (for part of this study) are based on five case studies and should not be interpreted as
general conclusions. No rights may be derived from it. Decisions taken at national and
international level may mean that the text is no longer fully up to date when you read it. The
Netherlands Authority for the Financial Markets (AFM) is not liable for any consequences ‐ such as
losses incurred or lost profits ‐ of any actions taken in connection with this text.