a business opportunity and market study of value …cfs.nrcan.gc.ca/bookstore_pdfs/19419.pdf · bdu...
TRANSCRIPT

A BUSINESS OPPORTUNITY AND MARKET STUDY OF VALUE ADDED PAPER MANUFACTURING IN THE
PROVINCE OF ALBERTA
.
Volume I
EKONO Consultants Ltd. l
1987
This is a joint publication of the Canadian Forestry Service
and the Alberta Forest Service pursuant to the
Canada-Alberta Forest Resource Development Agreement
1 Sun Life Place, Suite 1840 10123 - 99th Street
Edmonton, Alberta Canada TSJ 3Hl

DISCLAIMER
The study on which this report is based was funded in part under the Canada/Alberta Forest Resource Development Agreement.
The views, conclusions and recommendations are those of the authors. The exclusion of certain manufactured products does not necessarily imply disapproval nor does the mention of other products necessarily imply endorsement by the Canadian Forestry Service or the Alberta Forest Service.
(c) Minister of Supply and Services Canada 1988 Catalogue No.: FO 42-91/60-1988E
ISBN: 0-662-16609-4
Additional copies for this publication are available at no charge from:
Regional Development Canadian Forestry service
5320 - 122nd Street Edmonton, Alberta
T6H 3S5 Telephone: (403) 435-721
or
Forestry, Lands and Wildlife Forest Industry Development Division
108th Street Building '930, 9942 - 108th Street
Edmonton, Alberta T5K 2J5
Telephone: (403) 422-7011

ABBREVIATIONS AND DEFINITIONS
The following is a list of notations, abbreviations, units and symbols appearing in this report.
AAC annual allowable cut ADt air dry ton (90% dry) BCTMP bleached CTMP BDT bone dry ton BDU bone dry unit, 2400 lbs dry weight BK bleached kraft pulp CAD Canadian dollars CCN clay coated news CGWD coated groundwood cm centimeters CTMP chemithermomechanical pulp dbh tree diameter measured at breast height FBB European type of multilayer folding boxboard g gram, 10- 3 kilogram GJ gigajoule, 109 joules h hour hwd hardwood species IRR internal rate of return kg kilogram kW, kWh kilowatt(s), kilowatt-hour(s) LWC light-weight coated paper m3 cubic meter MTU miscellaneous timber uses MW, MWh megawatt(s), megawatt-hour(s) PGW pressurized groundwood pulp RMP refiner mechanical pulp ROI 100* (operating profit/total capital requirement) SBK semibleached kraft pulp SBS solid bleached sulphate SC supercalandered pulp SGW stone groundwood pulp SUS solid unbleached sulphate swd softwood species tb ton board TDA timber development area TMP thermomechanical pulp ton, t metric ton (1000 kg) Total Capital Requirement fixed investment + change in working capital + interest
tp UBK UGWD USD yr
during construction ton paper unbleached kraft pulp uncoated groundwood U. S. dollars year

1. 1.1 1.2
2. 2.1 2.1.1 2.1.2 2.1.3 2.2 2.2.1 2.2.2
3.
TABLE OF CONTENTS
PREFACE ............................................ . ABBREVIATIONS AND DEFINITIONS ...................... . EXECUTIVE SUKKARY .................................. . INTRODUCTION ....................................... . Background ......................................... . Report Contents .................................... .
STATUS OF RESOURCE ................................. . Fiber Resources .................................... . General ............................................ . Wood Resources ..................................... . Pulp Resources ..................................... . ENERGy ............................................. . General Natural Gas ........................................ .
IDENTIFICATION OF POTENTIAL VALUE ADDED PAPER AND BOARD PRODUCTS ..................................... .
4. HARlCET SURVEY ...................................... . 4. 1 General ............................................ . 4.1.1 Objectives ......................................... . 4. 1. 2 Methodology ........................................ . 4.1.3 Definition of the Market Areas ..................... . 4.2 Uncoated Groundwood Papers ......................... . 4.2.1 Classification of Uncoated Groundwood Papers ....... . 4.2.2 Uncoated Groundwood Paper End Uses ................. . 4.2.3 SC-Paper Classification ............................ . 4.2.4 World SC-Paper Demand/Supply ....................... . 4. 2 . 5 World SC -Paper Trade ............................... . 4.2.6 Domestic SC-Paper Markets .......................... . 4.2.7 Western U.S. SO-Paper Markets ...................... . 4.2.7.1 U.S. West SC-Paper Markets ......................... . 4.2.7.2 U.S. North Oentral SC-Paper Markets ................ . 4.2.7.3 U.S. West South Central SO-Paper Markets ........... . 4.2.7.4 Summary of the Western U.S. SC-Paper Markets ....... . 4.2.8 Pacific Rim SC-Paper Markets ....................... . 4.2.8.1 Japanese SO-Paper Markets .......................... . 4.2.8.2 SC-Paper Markets in the Republic of Korea .......... . 4.2.8.3 SC-Paper Market, in the People" aepublic of ...... . 4.2.8.4 Summary of Pacific aim SO-Paper Markets ............ . 4.2.9 Summary of SC-Paper Markets ........................ .
1 1 1
3 3 3 3 7 8 8 8
11
13 13 13 14 15 18 18 20 34 35 38 39 40 40 44 51 54 54 54 57 58 58 59

TABLE OF CONTENTS (Cont.)
4.3 Coated Groundwood Papers ............................ 61 4.3.1 Classification of Coated Papers..................... 61 4.3.2 U.S. Coated Groundwood Paper End Uses ... ............ 63 ·4.3.3 Light Weight Coated (LWC) Papers ......... ........... 68 4.3.4 World LWC-Paper Demand/Supply.... ........... ........ 68 4.3.5 World Coated Groundwood Paper Trade ................. 70 4.3.6 Domestic LWC-Paper Markets.. ............ .... .... .... 72 4.3.7 Western U.S. LWC-Paper Markets.. .................... 74 4.3.7.1 U.S. West LWC-Paper Markets ......... .......... ...... 74 4.3.7.2 U.S. North Central LWC-Paper Markets......... ....... 76 4.3.7.3 U.S. West South Central LWC-Paper Markets........... 79 4.3.7.4 Summary of the Western U.S. LWC-Paper Markets .... ... 81 4.3.8 Pacific Rim LWC-Paper Markets ... ............ ........ 82 4.3.8.1 Japanese LWC-Paper Markets .............. ............ 82 4.4.8.2 LWC-Paper Markets in the Republic of Korea .. ........ 83 4.3.8.3 LWC-Paper Markets in the People's Republic of ... ... 84 4.3.8.4 Summary of LWC-Paper Markets in the Pacific ........ 84 4.3.9 Summary of LWC-Paper Markets... ....... .............. 85 4.4 Solid Bleached Board ..... ... ..... .... ............... 87 4.4.1 Classification of Bleached Paperboards .. ...... ...... 87 4.4.2 Folding Carton End Uses ..... ............ .... ........ 88 4.4.3 World Folding Carton Trade...... .......... ..... ..... 89 4.4.4 Quality of Folding Carton ... .......... .......... .... 93 4.4.5 Domestic Folding Carton Markets ..... ............ .... 93 4.4.6 U.S. West of Mississippi Folding Carton Markets ..... 94 4.4.6.1 U.S. West Folding Carton Markets .. .............. .... 95 4.4.6.2 U.S. North Central Folding Carton Markets ....... .... 97 4.4.6.3 U.S. West South Central Folding Carton Markets ...... 100 4.4.6.4 Summary of the Western U.S. Folding Carton Markets.. 103 4.4.7 Pacific Rim Folding Carton Market. ... ............... 103 4.4.7.1 Japanese Folding Carton Market. ......... ............ 103 4.4.7.2 Folding Carton Markets in the Republic of Korea ..... 105 4.4.7.3 Folding Carton Market. in the People's Republic 107 4.4.7.4 Summary of Folding Carton Markets in the ........... 108 4.4.8 Summary of Folding Carton Markets .................. , 109 4.5 Newsprint ........................................... 110 4.5.1 World Newsprint Demand/Supply................ .... ... 110 4.5.2. World Newsprint Trade ............................... 112 4.5.3 Newsprint Quality ................................... 115 4.5.4 Domestic Newsprint Markets .......................... 116 4.5.5 Western U.S. Newsprint Markets ...................... 119 4.5.5.1 U.S. West Newsprint Markets ..................... .... 119 4.5.5.2 U.S. North Central Newsprint Markets ................ 123 4.5.5.3 U.S. West South Central Newsprint Markets ........ ... 127 4.5.5.4 Summary of the Western U.S. Newsprint Markets .. ..... 130 4.5.6 Pacific Rim Newsprint Markets ....... ... ............. 130 4.5.6.1 Newsprint Markets in Japan ... ............. .......... 130 4.5.6.2 Newsprint Markets in the Republic of Korea. .... ..... 133

4.5.6.3 4.5.6.4 4.5.7 4.6
5. 5.1 5.2 5.3
5.3.1 5.3.2 5.3.3 5.3.4 5.3.5 5.4 5.5 5.6 5.6.1 5.6.2 5.7 5.7.1 5.7.2 5.8
5.8.1 5.8.2 5.9 5.9.2 5.10
6.
6.1 6.2 6.2.1
6.2.2 6.2.3 6.2.4 6.2.5 6.2.6 6.3 6.3.2 6.3.3 6.3.4 6.3.5
TABLE OF CONTENTS (Cont.)
Newsprint Markets in People's Republic of China .... . Summary of the Pacific Rim Newsprint Market ........ . Summary of Newsprint Markets ....................... . Distribution Channels .............................. .
EVALUATION OF ALBERTA'S COMPETITIVENESS ............ . General ............................................ . Identification of Potential Competitors ............ . Comparison of Unit Prices as Production Cost ...... . Components .......................................... . Wood Raw Material Cost ............................. . Energy Cost ........................................ . Chemicals Cost ..................................... . Purchased Pulps .................................... . Labour Cost ........................................ . Transportation Costs ............................... . Taxes .............................................. . Hanufacturing Cost Comparison of SC Paper ......... . Basic Data ......................................... . Cost Comparison of SC Paper Hanufacturing .......... . Hanufacturing Cost Comparison of LWC Paper ........ . Basic Data ......................................... . Cost Comparison of LWC Paper Manufacturing ......... . Manufacturing Cost Comparison of Newsprint Produc t ion ......................................... . Basic Data ......................................... . Cost Comparison of Newsprint Manufacturing ......... . Manufacturing Cost Comparison of Folding Carton Cost Comparison of Folding Carton Board Production .. Conclusion Based on the Cost Comparison ............ .
ANALYSIS OF A VALUE ADDED PAPER HANUFACTUllING .................................... . Hill Production Level .............................. . Evaluation of the SO Paper Hill .................... . Paper Furnish and Product End Use of the SC Paper Hill.· .............................................. . Production Program for the SC Paper Hill ........... . Process Description of the SC Paper Hill ........... . Operating Cost Estimate ............................ . Investment Cost Estimate ........................... . Profitability of a SC-Paper Hill ................... . Evaluation of the LWC Paper Hill ................... . Process Description of the LWC Paper Hill .......... . Operating Coat Estimate ............................ . Investment Coat Estimate ........................... . Profitability of a LWC-Paper Hill .................. .
135 137 138 139
142 142 142
143 143 145 146 147 148 148 149 151 151 154 156 156 159
161 161 164 166 168 171
172 172 172
172 173 173 176 178 179 183 184 186 188 189
7. BUSINESS OPPORTUNITY ANALySIS...... ... ..... ............. 193

LIST OF FIGURES
Figure F.2.1. ALBERTA FOREST REGIONS 4 Figure F.2.2 FOREST RESOURCE AREAS IN NORTHEASTERN ALBERTA 6 Figure F.2.3. GAS PIPELINES OF ALBERTA 9
Figure F.4.1. DOMESTIC MARKETS 15 Figure F.4.2. WESTERN U.S. MARKETS 16 Figure F.4.3. PACIFIC RIM MARKETS 17 Figure F.4.4. PRINTING AND WRITING PAPER PRODUCERS AND END USERS 20 Figure F.4.5. UNCOATED GROUNDWOOD CONSUMPTION IN MAGAZINES 23 Figure F.4.6. UNCOATED GROUNDWOOD USAGE IN BOOKS 24 Figure F.4.7. UNCOATED GROUNDWOOD USAGE IN BUSINESS FORMS 25 Figure F.4.8. UNCOATED GROUNDWOOD USAGE IN OTHER CONVERTING 26 Figure F.4.9. UNCOATED GROUNDWOOD USAGE IN DIRECTORIES 27 Figure F.4.10. UNCOATED GROUNDWOOD USAGE IN CATALOGS 29 Figure F.4.11. UNCOATED GROUNDWOOD PAPER USAGE IN INSERTS AND
MAILERS 30 Figure F.4.12. UNCOATED GROUNDWOOD USAGE IN OTHER COMMERCIAL
PRINTING 32 Figure F.4.13. BREAKDOWN OF GROWTH IN UNCOATED GROUNDWOOD PAPER
DEMAND GROWTH 33 Figure F.4.14. WORLD REGIONAL SC-PAPER DEMAND AND PRODUCTION 36 Figure F.4.15. WORLD DEMAND/SUPPLY OF SC-PAPERS 37 Figure F.4.16. SCANDINAVIAN AND WESTERN EUROPEAN SC-PAPER SHIPMENTS
IN 1984 38 Figure F.4.17. SC-PAPER PRICE DEVELOPMENT 39 Figure F.4.18. ESTIMATED U.S. WEST SC-PAPER DEMAND/SUPPLY STRUCTURE
IN 1985 41 Figure F.4.19. END USE INDUSTRIES SHARE OF THE TOTAL U.S. SHIPMENTS
IN U.S. WEST 42 Figure F.4.20. SC-PAPER DEMAND IN U.S. WEST 43 Figure F. 4.21. ESTIMATED U.S. NORTH CENTRAL SC-PAPER DEMAND/SUPPLY
STRUCTURE IN 1985 45 Figure F.4.22. END-USE INDUSTRIES SHARE OF THE TOTAL U.S. SHIPMENTS
IN THE U. S. NORTH CENTRAL REGION 47 Figure F.4.23. ESTIMATED U. S. NORTH CENTRAL SC -PAPER DEMAND AND
AND PRODUCTION 48 Figure F.4.24 .. ESTIMATED U.S. WEST SOUTH CENTRAL SC-PAPER
DEMAND/SUPPLY 51 Figure F.4.25. U.S. WEST SOUTH CENTRAL END USE INDUSTRIES SHARE OF
THE TOTAL U.S. SHIPMENTS 52 Figure F.4.26. ESTIMATED U. S. WEST SOUTH CENTRAL SC -PAPER DEMAND 53 Figure F.4.27. SC-PAPER DEMAND/SUPPLY STRUCTURE IN JAPAN IN 1985 55 Figure F.4.28. SC-PAPER DEMAND AND PRODUCTION IN JAPAN 56 Figure F.4.29. COATED GROUNDWOOD USAGE IN MAGAZINES 64 Figure F.4.30. Figure F.4.31. Figure F.4.32.
COATED GROUNDWOOD USAGE IN CATALOGS 65 COATED GROUNDWOOD PAPER USAGE IN INSERTS/MAILERS 66 U.S. COATED GROUNDWOOD PAPER DEMAND 67

Figure F.4.33. REGIONAL COATED GROUNDWOOD PAPER DEMAND/SUPPLY IN 1985 69
Figure F.4.34. WORLD COATED GROUNDWOOD DEMAND/CAPACITY 70 Figure F.4.35. SCANDINAVIAN AND WESTERN EUROPEAN COATED GROUNDWOOD 71 Figure F.4.35a. DOMESTIC MARKETS: ESTIMATED LWC-PAPER DEMAND/SUPPLY
STRUCTURE IN 1985 73 Figure F.4.36. ESTIMATED U.S. WEST LWC-PAPER DEMAND/SUPPLY STRUCTURE 74 Figure F.4.37. U.S. WEST LWC-PAPER DEMAND AND DOMESTIC PRODUCTION 76 Figure F.4.38. ESTIMATED U.S. NORTH CENTRAL LWC-PAPER DEMAND/SUPPLY
STRUCTURE IN 1985 77 Figure F.4.39. U.S. NORTH CENTRAL LWC-PAPER DEMAND AND DOMESTIC 78
PRODUCTION Figure F.4.40. ESTIMATED U.S. SOUTH WEST CENTRAL LWC-PAPER DEMAND
STRUCTURE IN 1985 80 Figure F.4.41. LWC-PAPER DEMAND/SUPPLY STRUCTURE IN JAPAN IN 1985 82 Figure F.4.42. MAJOR BLEACHED BOARD TRADE FLOWS IN 1985 90
Figure F.4.43. WORLD BLEACHED BOARD DEMAND AND CAPACITY 91 Figure F.4.44. FOLDING BOXBOARD PRICES IN THE U.S.A. 92 Figure F.4.45. ESTIMATED U.S. WEST FOLDING CARTON DEMAND/SUPPLY
STRUCTURE IN 1985 95 Figure F.4.46. US WEST FOLDING CARTON DEMAND AND PRODUCTION 96 Figure F.4.47. ESTIMATED U.S. NORTH CENTRAL FOLDING CARTON
DEMAND/SUPPLY STRUCTURE IN 1985 98 Figure F.4.47a. US NORTH CENTRAL FOLDING CARTON DEMAND AND
PRODUCTION 99 Figure F.4.48. ESTIMATED U.S. WEST SOUTH CENTRAL FOLDING
CARTON DEMAND 101 Figure F.4.48a. US WEST SOUTH CENTRAL FOLDING CARTON DEMAND AND 102 Figure F.4.49. FOLDING CARTON DEMAND/SUPPLY STRUCTURE IN JAPAN
(1985) 104 Figure F.4.49a. FOLDING CARTON DEMAND AND PRODUCTION IN JAPAN 105 Figure F.4.50. FOLDING CARTON DEMAND/SUPPLY STRUCTURE IN THE
REPUBLIC OF KOREA IN 1985 106 Figure F.4.51 FOLDING CARTON DEMAND/SUPPLY STRUCTURE IN THE
PEOPLE'S REPUBLIC OF CHINA IN 1985 108 Figure F.4.52. REGIONAL NEWSPRINT DEMAND AND PRODUCTION IN 1986 110 Figure F.4.53. WORLD NEWSPRINT DEMAND AND CAPACITY 111 Figure F.4.54. NORTH AMERICA AND SCANDINAVIA 113 Figure F.4.55 AVERAGE QUARTERLY PRICES OF CANADIAN NEWSPRINT
EXPORTS TO THE U. S. AND FAR EAST 115 Figure F.4.55a. DOMESTIC MARKETS: ESTIMATED NEWSPRINT DEMAND/SUPPLY 117 Figure F.4.55b. U.S. WEST - ESTIMATED NEWSPRINT DEMAND/SUPPLY
STRUCTURE 120 Figure F.4.56 ESTIMATED U.S. WEST NEWSPRNT DEMAND AND DOMESTIC
PRODUCTION 122 Figure F.5.57 U.S. NORTH CENTRAL: ESTIMATED NEWSPRINT
DEMAND/SUPPLY 124 Figure F.4.58. ESTIMATED U.S. NORTH CENTRAL NEWSPRINT DEMAND AND 125 Figure F.4.59. U.S. WEST SOUTH CENTRAL; ESTIMATED NEWSPRINT DEMAND/ 127 Figure F.4.60. ESTIMATED U.S. WEST SOUTH CENTRAL NEWSPRINT 129

Figure F.4.61 Figure F.4.62. Figure F.4.62a. Figure F.4.63.
Figure F.4.64.
Figure F.4.6s.
Figure F. 5.1.
Figure F.s.2.
Figure F.s.3. Figure F.s.4.
Figure F.s.s.
Figure F.s.6.
Figure F.s.7.
Figure F.s.8.
Figure F.s.9.
Figure F.s.10.
Figure F.s.ll.
Figure F.s.12.
Figure F.6.1. Figure F.6.2. Figure F.6.3 Figure F.6.4
NEWSPRINT DEMAND/SUPPLY STRUCTURE IN JAPAN IN 1985 131 NEWSPRINT DEMAND AND PRODUCTION IN JAPAN 132 NEWSPRINT DEMAND/SUPPLY STRUCTURE IN THE REPUBLIC 134 NEWSPRINT DEMAND/SUPPLY STRUCTURE IN PEOPLE'S REPUBLIC OF CHINA IN 1985 136 NEWSPRINT DEMAND AND PRODUCTION IN PEOPLE'S REPUBLIC OF CHINA 137 SHIPMENTS SIZES FOR GROUNDWOOD PAPERS 139
SC PAPER SALES PRICE REQUIREMENT DELIVERED TO LOS ANGELES 155 SC PAPER SALES PRICE REQUIREMENT, DELIVERED TO CHICAGO 155 SALES PRICE REQUIREMENT DELIVERED TO CHINA 156 SALES PRICE REQUIREMENT OF LWC PAPER DELIVERED TO LOS ANGELES 160 SALES PRICE REQUIREMENT OF LWC PAPER DELIVERY TO CHICAGO 160 SALES PRICE REQUIREMENT OF LYC PAPER DELIVERED TO CHINA 161 SALES PRICE REQUIREMENT OF NEWSPRINT DELIVERED TO LOS ANGELES 165 SALES PRICE REQUIREMENT OF NEWSPAPER DELIVERED TO CHICAGO 165 SALES PRICE REQUIREMENT OF NEWSPRINT DELIVERED TO CHINA 166 SALES PRICE REQUIREMENT OF FOLDING CARTON DELIVERED TO LOS ANGELES 170 MANUFACTURING COST OF FOLDING CARTON DELIVERED TO CHICAGO 170 SALES PRICE REQUIREMENT OF FOLDING CARTON DELIVERED TO CHINA 171
BLOCK DIAGRAM OF THE SC·PAPER MILL 175 SENSITIVITY OF IRR FOR A SC PAPER MILL 175,000 TP/YR 182 BLOCK DIAGRAM OF THE LYC PAPER MILL 184 SENSITIVITY OF IRR FOR LYC PAPER MILL 175,000 192 TP/YEAR

Table T.2.1.
Table T.2.2. Table T.2.3.
Table T.2.4.
Table T.2.5. Table T.2.6. Table T.2.7.
Table T. 3.1.
Table T .4.1.
Table T.4.2. Table T.4.3. Table T.4.4. Table T.4.5. Table T.4.6. Table T.4.7 Table T.4.8. Table T.4.9. Table T.4.10 Table T.4.11. Table T.4.12. Table T.4.13 Table T.4.13.A. Table T.4.14. Table T.4.1S Table T.4.1S. Table T.4.16. Table T.4.18. Table T.4.l8.A. Table T.4.l9. Table T.4.20 Table T.4.2l Table T.4.21.A. Table T.4.22. Table T.4.23. Table T.4.23.A. Table T.4.24.
Table T.4.2S. Table T.4.26. Table T.4.27. Table T.4.28.
LIST OF TABLES
Estimated Fiber Needs for Alberta Based Paper and Paper Board Manufacting Alberta Pulpwood Inventory Summary of Annual Allowable Cut and Annual Volume Commitment Annual Allowable Cut in Northestern Alberta Forest
3 4
5
Areas 7 Alberta Woodpu1p Resources 7 Energy Requirements for Producing Paper and Paperboard 8 Alberta Electrical Utilities 9
North American Paper and Board Classification
Uncoated Printing and Writing Paper Classification in Japan Classification of SC-Papers SC-Paper Demand Growth Rates Major U.S. West Printers and Publishers U.S. North Central Domestic SC-Paper Capacity Main Competitors in the U.S. North Central SC-Paper Major U.S. North Central Printers/Publishers Major U.S. West South Central Printers/Publishers Estimated Western U.S. SC-Paper Import Demand Major Japanese SC-Paper Consumers Domestic SC-Paper Capacity in the Republic of Korea SC-Paper Import Demand in the Pacific Rim Countries Main Competitors in the SC-paper Markets in 1985 SC Market Outlook in Selected Market Areas Classification of Coated Papers in North America Classification of Coated papers in Japan Coated Groundwood Demand in the Pacific Rim Markets U.S. West Domestic LWC-Paper Capacity U.S. North Central Domestic LWC Production Capacity Main Competitors in the U.S. North Central LWC-Paper U.S. West South Central Domestic LWC-Paper Capacity Summary of Western U.S. LWC-Paper Import Demand Domestic LWC-Paper Capacity in Japan Domestic LWC-Paper Capacity in Republic of Korea Pacific Rim LWC-Paper Imports Demand Main Competitors in the LWC-Paper Markets LWC Market Outlook in Selected Market Areas Solid Bleached Paperboard Demand/Supply Structure in the U.S. (1985) U.S. Shipments of Folding Cartons by End Use in 1985 U.S. West Major Folding Carton End Users Major U.S. North Central Folding Carton End Users Major U.S. West South Central Folding Carton
12
19 35 37 44 46 49 50 53 54 56 57 58 60 60 61 62 68 75 77 79 81 81 83 84 85 86 88
88 89 97
100

Table T.4.29
Table T.4.30.
Table T.4.3l.
Table T.4.32
Table T.4.32.A.
Table T.4.33 Table T.4.34. Table T.4.34.A. Table T.4.35 Table T.4.36
Table T.4.37 Table T .4.38. Table T.4.39
Table T.4.40. Table T.4.4l Table T.4.42. Table T.4.43 Table T.4.43.A.
Table T.5.l. Table T.s.2. Table T.s.2A Table T.s.3. Table T.5.4. Table T.S.S. Table T.S.6. Table T.S.7
Table T.S.S.
Table T.S.9
Table T.s.10 Table T.s.11
Table T.S.12
Table T.S.13 Table T.S.14 Table T.S.ls Table T.S.16. Table T.S.17
Table T.S.1S
Production Capacity 102 Major U.S. West South Central Folding Carton End Users 103 Folding Carton Demand in the Western U.S. 103
Folding Carton (incl. Recycled) Capacity in the Republic of China Folding Carton Imports Demand in the Pacific Rim Market Folding Carton Market Outlook in Selected
107
109
Market Areas 109 World Regional Growth of Newsprint Demand 112 Domestic Newsprint Producers 118 U.S. West Newsprint Producers 121 Main Competitors in the U.S. West Newsprint Markets 123 U.S. North Central Newsprint Producers Capacity in 1986 124 Main Competitors in the U.S. North Central Newsprint 128 U.S. West South Central Newsprint Producers 128 Main Competitors in the U.S. West South Central Newsprint 129 Main Competitors in the Japanese Newsprint Markets 133 Newsprint Capacity in the Republic of Korea 134 Newsprint Capacity in People's Republic of China 135 Newsprint Import Demand in Some Selected Pacific 138 Newsprint Market Outlook in Selected Market Areas 138
Potential Competitors in the Surveyed Market Areas 142 Alberta Softwood Chip Costs 144 Prices of Wood Raw Materials 145 Energy Prices in the Competing Areas 146 Cost of Chemicals, CADIt chemical 148 Price of Market Pulp 148 Labour Costs 148 Transportation Costs - Alberta Mill Versus Competing Mills 149 Status of Corporate Tax Situation in Canada and Alberta 150 Changes to Capital Cost Allowances and Investment Tax Credits in Canada 150 Furnish for SC-Paper 151 Production, Fiber and Wood Demands for the SC Paper Mill 151 Process Conditions for Production of the Mechanical Pulp Component of SC Paper 152 Main Data for the SC-Paper Mill 153 Comparison of Manufacturing Costs of SC Paper 154 Furnish for LWC Paper 157 Production and Wood Demand for LWC Paper Kill 157 Process conditions for production of the mechanical 158 Pulp Component for LWC Paper Data for the LWC Paper Mill 158

Table T.5.l9. Table T.5.20. Table T.5.2l. Table T.5.22.
Table T.5.23 Table T.5.24.
Table T.5.25. Table T. 5 . 26 .
Table T.s.27.
Table T.5.28. Table T.s.29
Table T. 6. l. Table T.6.2. Table T.6.3. Table T.6.4. Table T.6.s. Table T.6.6. Table T.6.7
Comparison of Manufacturing Costs of LWC -Paper Furnish for Newsprint Production, Fiber and Yood Demand for the Newsprint Process Conditions for Production of the Mechanical Pulp Component of Newsprint Main Data for the Newsprint Mill Manufacturing Costs of Newsprint (TMP based), Delivered to Los Angeles Paper Furnish for Folding Carton, One Side Coated Fiber and Yood Demands for the Folding Carton Board Mill Process Conditions of CTMP Mill Integrated with the Folding Carton Board Mill Main Data for Folding Carton Board Mill Folding Carton Board Manufacturing Costs
Furnishes for SC Paper Operating Cost of SC Paper Manufacturing Estimated Investment Cost Summary of Profitability Calculations Operating Cost of a LYC-Mill Estimated Investment Cost Summary of Profitability Calculations
159 162 162
163 163
164 167
167
167 168 169
172 178 178 181 186 188 191

EXECUTIVE SUMMARY
The Wood Resource
Sufficient uncommitted annual allowable cut (AAC) plus residual chips exist in the three forest areas of northeastern Alberta to support the manufacture of 175,000 ton/yr of supercalandered uncoated groundwood paper (SC), light-weight coated groundwood paper (LWC) or newsprint. Alternatively, a 130,000 ton/yr folding carton boxboard plant could be supported by the same resource base. There is also enough excess fiber to support expansion to other grades of paper and/or a medium sized pulp mill.
Annual Allowable Cut in Northeastern Alberta Forest Areas (a)
Forest Area
Athabasca/Lac La Biche TDA Athabasca Forest Slave Lake Forest Total AAC
Total coniferous
(a)
(b)
Values indicate AAC redirection of chip River development. Residual chips from River.
The Market Study
Uncommitted AAC (thousand m3/yr) Coniferous Chips(b) Deciduous
362.3 709.0 311.0
1382.3
1495.5
113.2
113.2
992.7 785.8 863.4
2641. 9
and chip supply after deducting possible supply, an OSB commitment, and a Peace
Fort McMurray, Hanging Stone and House
The market study focuses on groundwood containing value-added papers because of Alberta's advantage of having abundant high quality wood, especially in coniferous species, and low cost energy. The demand/supply structure in the target market areas, Western Canada, the U.S. West (West of the Mississippi and Ohio Rivers) and the Pacific Rim (Japan, Korea and the People's Republic of China), shows a current and future "import" demand as follows:
Paper Grade
SC-paper LW'C-paper Carton board
"Import" Demand (thousand ton/yr) Current 1992 2000
275 490 960
365 610 995
890 1300
960
Growth %/yr
8.1 6.7 0.0

Clearly, the growth potential is for groundwood containing printing papers, i.e. SC and LWC grades. Furthermore, the market study indicates that the highest potential exists in the U.S. West and in the Pacific Rim areas, particularly California and Japan, respectively.
Comparative Economics
Softwood costs including chipping are estimated to be CAD 29 to 35 per m3 (CAD 79-95 per BDT) delivered to the study millsite of Fort McMurray. This puts the cost of Alberta softwood significantly below that of Scandinavia, but on a par or slightly higher than that of other areas of North America. The availability of residual chips at the current Alberta average delivered price of CAD 60 per BDU (CAD 55 per BDT) tends to keep the total price of wood furnish to the study millsite at a reasonable level.
Energy costs in Alberta are low, particularly electricity at CAD 24 per MWh. Alberta is a major factor in natural gas production. Currently gas is sold in industrial quantities at an estimated CAD 1.BO per GJ.
When direct manufacturing costs (excluding depreciation and other capital charges) are compared for SC-paper, Alberta has an advantage over competitors in the following locations:
Location U.S. Pacific Northwest U.S. North U.S. South
Advantage CAD 40/ton CAD 70/ton CAD BO/ton
Compared to British Columbia, however, SC-paper produced in Alberta costs CAD B/ton more.
The net back sales price requirement (manufacturing costs plus freight costs plus levelized capital charges, including an inputed interest rate) in the Los Angeles area indicates that, due to shorter distances, a Pacific Northwest producer of SC-paper has a distinct advantage over all other producers. Alberta, however, does have an advantage over competitors located in eastern Canada, the U.S. South, the U.S. North and Finland.

1.2
1.1
o.a
o.a
0.7
0.' O.!!
0." 0.3
0.2
0.1
o
Sales Price Requirement, SC Paper Delivered to Los Angeles
Similar results are obtained sales price requirements for produced in Alberta.
when comparing manufacturing costs and LUC-paper grades and folding boxboard
Profitability and Sensitivitv Analysis
A 320 million USD investment in a greenfield 175,000 tonjyr SC-paper facility located at Fort McMurray will yield an IRR of 13% (before financing and taxes) and a simple ROI of 18%.
For a LUC-paper mill, the IRR and ROI are 6% and 12%, respectively. These indicators of potential profitability are considered marginally adequate in the context of the long term strategic development of forest resources in northeastern Alberta and the cost of relatively risk free capital. Furthermore, the profitability is extremely sensitive to changes in production rates or sales revenue, and to a lesser degree, the investment cost. Again, similar results are seen for both LUC and folding boxboard.

.m I I I ~I /'"
v
'" I 1/.-"..--............... 25
..... I I~~ ~ I 20
... 15 ~ u c ... &. TO
o
-'0
I
k' v -$0 -JO
~I
~ -/"" V/(
t'" I I
-'0 10
OIAHct IN vNftAI!JU. JC .. PROCUC'nOH u;vu. X F'tRSOHHU,
, I
---::
I
• "IIEI'I COSTS ., "xm II'Nt::n.t£NT
Sensitivity of IRR to Changes in Selected Variables Manufacturing
Business Opportunities and Risk Factors
SC Paper
It is clear that Alberta's softwood supply is such that it can be utilized to produce very high quality value-added paper grades. As pulping and papermaking technology and paper markets develop, Alberta's massive hardwood inventory can come into play. Furthermore, Alberta's preeminent position in producing, distributing and selling low cost energy enhances a papermaker's ability to produce paper and paperboard cost effectively. Of no little importance, Alberta has a track record of positiveness toward industrial development, especially with regards to the forest products industry.
But this in itself is not enough to attract an investor to Alberta in order to build and operate a value added papermaking facility. Certain risk factors have to be addressed and minimized.
Variations in production rate and sales revenue both have been identified as significantly affecting the profitability of an investment to produce value-added papers. To minimize this risk, any

potential investor must have proven marketing and technical know-how: the first to minimize the time and cost necessary to penetrate markets and to cost effectively produce a paper of a quality that demands high prices and volume.
Such an investor will probably not be interested in a stand alone, one time only, investment in a value-added paper mill. This investor will take a long view of the situation; he will want to plan for growth -to develop a diversified forest products complex. This long view will depend on whether or not wood will be available in the quantity, quality and at a cost that permits paper tonnage increases, entry into new paper markets or even back-integration to a chemical pulping operation. Considering that a bleached softwood kraft mill of a size generally recognized as large enough to produce reasonably priced fiber (360,000 tons/yr), a wood supply of over 2 million m3 annually will be needed. This is 50% more than is currently available in the northeastern Alberta forest areas. Thus to the extent that both Alberta and the investor are desirous of the long term optimal use of forest resources, the province should make the additional wood available at a competitive cost.
A third risk identified in this study is the capital cost of the value-added facility. The investor profiled as being best able to invest in such a project will have large capital resources. He also will most likely have the option of adding onto an existing mill somewhere else than in Alberta. It is generally accepted that exercising such an option would cost 25 to 40 percent less than a greenfield mill. The implication is clear: if an investor is to be attracted to Alberta to build a greenfield mill a subvention by the province may be required to reduce the investor's capital outlay to the point where the profitability is high enough to balance the main risk factors of market price and volume fluctuations.
Finally, freight costs have long been recognized as an impediment to investment in Alberta. This study confirms this, showing the adverse effect of transportation costs on the required net back sales price. To some extent specialty paper grades, e.g. SC and LWC, are believed to be less affected by distance to the consumer than are commodity paper grades, e.g. newsprint. Also, given that specialty paper grades are increasingly marketed on a world wide basis, Alberta is relatively closer to U.S. markets than are Nordic countries. In any case, Alberta should continue its work to find a solution to reduce transportation costs.

1. INTRODUCTION
1.1 Background
The Government of Alberta desires a more efficient utilization of their fiber resources. One way to accomplish this end is to establish, over the short term, a value-added paper and/or paperboard manufacturing facility which would lead to the long term development of a diversified forest products industry.
Currently Alberta produces 480,000 tons/year of bleached and unbleached kraft pulp, all of which is shipped from the province for further value-added processing. Although there have been significant activities toward value-added production processes in Alberta over recent years, paper manufacturing has not yet been part of them.
The intention of this study is to determine whether there is a market for selected paper grades manufactured in Alberta, and whether or not such a facility could be cost effective enough to maintain and support a profitable business operation now and in the future.
Prior to the commencement of the work, it was concluded in discussions between Government representatives and EKONO that the report should exclusively concentrate on the domestic, the Western U.S. and the Pacific Rim markets. Furthermore, a selection of four (4) value added paper and board grades was made: supercalendared uncoated groundwood paper (SC), light weight coated groundwood paper (LWC) and folding carton boxboard, representing special grade products, and newsprint as a commodity grade. These grades were selected based on the acknowledged strengths and weaknesses of potential paper manufacturing in Alberta: The availability of fairly slow growing, good quality wood raw material and inexpensive power as opposed to long distances to potential markets.
1.2 Report contents
Section 2 presents the availability of the current raw material situation in Alberta, explicitly addressing both the availability of fiber from the Athabasca/Lac La Biche, and the Athabasca and Slave Lake Forests, and from existing and planned pulp mills. Also, a discussion of the availability of energy and paper making chemicals is included.
Section 3 briefly addresses the criteria for the selection of the paper and board grades studied.
Section 4 examines the market situation and the potential for market penetration in the selected areas, emphasizing the current and future demand/supply structure, market growth and the effect of technological change on various market segments.
-1-

Section 5 contains the evaluation of Alberta's cost competitive position as a manufacturer of value-added paper.
In Section 6, the cost structure of the two selected alternatives, SCand LWC-paper manufacturing, is linked to the profitability analysis. A feasibility analysis is presented for a greenfield SC-paper mill and a LWC-paper mill.
Section 7 evaluates the business opportunities and identifies the major risk factors in developing a value-added paper manfufacturing facility. It also provides a potential investor profile and lists selected potential investors that in EKONO's opinion fulfills the conditions required for a successful paper manufacturing business operation in Alberta over the long term.
-2-

2. STATUS OF RESOURCE
2.1 Fiber Resources
2.1.1 General
To manufacture paper or paperboard in Alberta will require substantial fiber resources, both from raw wood and chemical pulp. The fiber sources and quantities needed are listed in Table T.2.l for each of the four paper or paperboard grades considered in this study. As will be shown, Alberta can meet these fiber needs, both in quantity and type.
Table T.2.l Estimated Fiber Needs for Alberta Based Paper and Paperboard Manufacturing(l)
Fiber Source
Quantities (tons per year) News(2) UGWD(3) CGWD(4) FBB(5)
Wood Softwood Hardwood
TOTAL WOOD _,, ______ " ____ ~(~m3/yr)
Kraft Pulp Bleached SWD Semibleached SWD
TOTAL PULP
165,000
165,000 452,100
18,500
18,500
109,000
109,000 298,600
30,500
30,500
67,000 67,000
67,000 67,000 183,600 183,690
54,000 21,000 31,600
54,000 52,600
(1) Assumes full integration with mechanical pulping process (2) 175,000 ton/year newsprint (3) 175,000 ton/year uncoated groundwood paper (SC) (4) 175,000 ton/year coated groundwood paper (LWC) (5) 130,000 ton/year folding carton boxboard
2.1. 2 . Wood Resources
The vast forest resources of Alberta can be divided into the five regions depicted in Figure F.2,l. Also shown are the two bleached kraft mills at Grande Prairie and Hinton and the bleached CTMP mill at Whitecourt. The later is currently under construction. Table T.2.2 shows the total resources available for pulpwood utilization in each region. The current annual allowable cut and volume commitments in the five regions are summarized in Table T.2.3.

5
ALBERTA FOREST REC:ONS
• KRAFT PULP MILLS
o CTMP PULP MILL
Figure F. 2 . 1. ALBERTA FOREST REGIONS
Table T.2.2. Alberta Pulpwood Inventory
REGIONS Specie 1 2 3 4 5
(million m3) A. Softwoods (13-24 cm dbh)
Wbite Spruce 14.1 27.8 21. 9 9.6 24.8 Black Spruce 7.1 34.9 15.5 6.1 4.0 Balsam Fir 2.8 7.4 3.4 1.1 0.4 Lodgepole/Jack Pine 60.3 127.0 20.4 13.6 2.9
TOTAL CONIFEROUS 84.2 197.0 61.2 30.4 32.2
B. Hardwoods (13 cm + dbh)
TOTAL DECIDUOUS (1) 35.4 201.9 229.1 87.5 95.3
TOTAL PULP~.roOD 119.6 398.9 290.3 117.9 127.5 (1) 81% aspen, 16% balsam poplar and 3% birch.
·4·
Total
98.1 67.5 15.1
224.3
404.9
649.3
1054.2

Table T.2.3. Summary of Annual Allowable Cut and Annual Volume Commitment (thousand m3/yr)
A. Coniferous Timber Annual Allowable Cut Volume Committed Forest Management Areas Timber Quotas MTU Other
Total Committed Volume Uncommitted Percent Uncommitted
B. Hardwood Timber (Pure and Mixed Wood Stands)
Annual Allowable Cut Volume Committed Volume Uncommitted Percent Uncommitted
C. Total Timber
Annual Allowable Cut Volume Committed Volume Uncommitted Percent Uncommitted
1
1,714
101
1,025 73 o
2
6,409
3,871
1,644 187
21
1,199 5,723 515 686
30.0 10.70
503 283 220
43.7
2,217 1,482
735 33.2
2,765 2,160
605 21. 9
9,174 7,883 1,291
14.1
REGIONS 3 4
2,829
18
1,372 166 508
2,064 765
27.0
4,475 848
3,627 81.1
7,304 2,9l2 4,392
60.1
1,796
o
353 35
8
396 1,400
78.0
1,603
° 1,603 100.0
3,399 396
3,003 88.3
5
1,600
o
942 65 o
1,007 593
37.1
2,088
° 2,088 100.0
3,688 1,007 2,681
72.7
All Regions
14,348
3,990
5,336 526 537
10,389 3,959
27.6
11,434 3,291 8,143
71. 2
25,782 13,680 12,102
46.9
Note: These data provided by the Alberta Forest Service reflect the uncommitted AAC (annual allowabel cut) as of May 12, 1986. Later developments have significantly reduced the uncommitted AAC in Regions 1 and· 2.
Table T.2.3 shows that the resource is enough to support additional pulp and paper operation in Alberta. The scope of this study was limited to the following three areas, namely: Athabasca forest, Athabasca/Lac La Biche TDA and the Slave Lake forest. The annual allowable cut (AAC) in each area is tabulated in T.2.4. Clearly sufficient AAC exists in anyone of the three areas to support anyone of the facilities listed in T.2.1. A value added paper manufacturing
-5-

facility located near Fort McMurray could be adequately supplied wi~h coniferous roundwood from the Athabasca Forest and nearby chips leaving a significant amount of the AAC for future expansion .
•
o
fi ,oaT .... U".AT
• ,aA" JtVUI' 1IIInJ..
o CT"_ IOU
.~ tUn ....... 'O.IIT
"' • ",AI.ICA 'O •• ST
&lU.' A 1M.IAteA I1..AC \.'"' IICM. T .0 ....
Figure F.2.2 FOREST RESOURCE AREAS IN NORTHEASTERN ALBERTA
-6-

Table T.2.4 Annual Allowable Cut in Northeastern Alberta Forest Areas (a)
Uncommitted AAC (m3/yr) Forest Area Coniferous Chips (b) Deciduous
Athabasca /Lac La Biche TDA (c)
Athabasca Forest Slave Lake Forest(c)
Total AAC (c)
Total Softwood (c)
362,316 353,750 (ll3,200)(d)
708,987 369,351 161,310
(310,9962 (02 1,440,654 515,060
(1,382,292) (113,200)
1,955,714 (1,495,499)
992,651
785,842 1,897,905
(863,4052 3,676,398
(2,641,898)
(a) Source: Timber Management Branch of Alberta Forest Service as of May 27, 1987.
(b) Existing chip supply from nearby locations. (c) Values in brackets indicates AAC and chip supply after deducting
possible redirection of chip supply, an OSB commitment, and a Peace River development
(d) Chips from Fort McMurray, Hanging Stone, and House River.
2.1. 3 Pulp Resources
Table T.2.5 shows the current and planned pulp production in Alberta. The Whitecourt mill will produce both SWD and HWD CTMP pulps in separate pulping lines. Comparing fiber requirements in Table T.2.l it is concluded that the value added paper operation will have sufficient chemical/mechanical pulp available within the region.
Table T.2.5. Alberta Woodpulp Resources
Capacity (tons/yr) Company and Location Pulp Current
Procter & Gamble Cellulose Ltd BK 290,000 Grande Prairie (1)
Champion Forest Products Ltd B&UBK 190,000 Hinton
Millar Western Industries Ltd BCTMP (3) Whitecourt
(1) This mill is known to produce some HWD kraft pulp (2) Scheduled for 1988-89 (3) Under construction. Startup late summer 1988
-7-
Planned
290,000
380,000
207,000
(2)
2.2 ENERGY
2.2.1 General
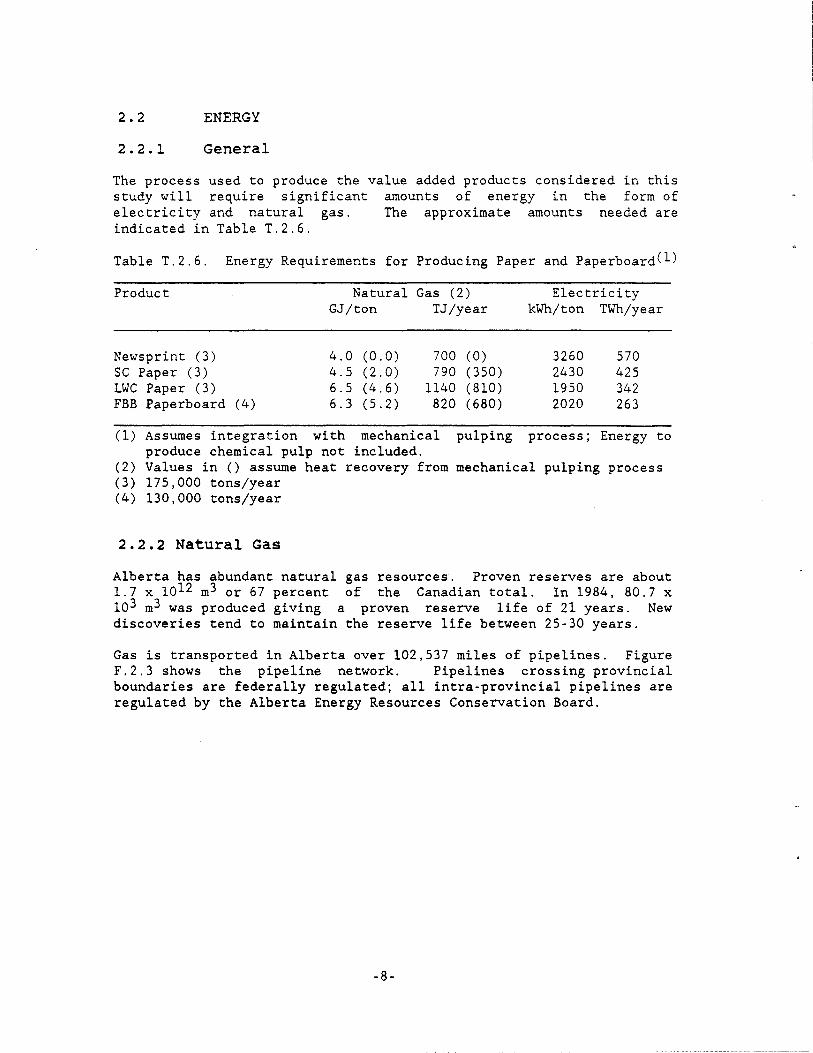
The process used to produce the value added products considered in this study will require significant amounts of energy in the form of electricity and natural gas. The approximate amounts needed are indicated in Table T.2.6.
Table T.2.6. Energy Requirements for Producing Paper and Paperboard(l)
Product
Newsprint (3) SC Paper (3) LWC Paper (3) FBB Paperboard (4)
Natural GJ/ton
4.0 (0.0) 4.5 (2.0) 6.5 (4.6) 6.3 (5.2)
Gas (2) Electricity TJ/year kWh/ton TWh/year
700 (0) 3260 570 790 (350) 2430 425
1140 (810) 1950 342 820 (680) 2020 263
(1) Assumes integration with mechanical pulping process; Energy to produce chemical pulp not included.
(2) Values in () assume heat recovery from mechanical pulping process (3) 175,000 tons/year (4) 130,000 tons/year
2.2.2 Natural Gas
Alberta has abundant natural gas resources. Proven reserves are about 1.7 x 10¹² m3 or 67 percent of the Canadian total. In 1984, 80.7 x 10³ m3 was produced giving a proven reserve life of 21 years. New discoveries tend to maintain the reserve life between 25-30 years.
Gas is transported in Alberta over 102,537 miles of pipelines. Figure F.2.3 shows the pipeline network. Pipelines crossing provincial boundaries are federally regulated; all intra-provincial pipelines are regulated by the Alberta Energy Resources Conservation Board.
-8-

• KRAFT MILLS
o leTMP MILL
Figure F.2.3. GAS PIPELINES OF ALBERTA
2.2.3 Electricity
There are four electric power utilities, two investor-owned (IOU's) and two municipally owned (Public). These utilities and their installed capacities are listed in Table T.2.7.
Table T.2.7. Alberta Electrical Utilities
Utility
Alberta Power Ltd (IOU) Transalta Utilities Corp (IOU)
Edmonton Power (Public) Medicine Hat Power (Public)
-9-
Estimated Capacity (MW)
1300 4000
1300 140

Electric energy production in 1982 totalled 27,112.4 GWh. Of this, 15 percent, 66 percent and 19 percent were supplied by hydro, coal and natural gas, respectively.
All utilities are part of the Alberta interconnected system which is managed as if it had single owner. In this way electricity is delivered to the user with the maximum efficiency and lowest cost.
2.3 Chemical Resources
The existing chemical industry includes sulphur and petroleum industry products, as well as chlor-alkali industry. Alberta is the world's largest exporter of elemental sulphur. In 1984, production was about 5.2 million tonnes and total sales were about 8 million tonnes. Sulphur is produced as a by-product of natural gas production in approximately 50 plants around the Province. Smaller amounts are produced by Alberta's two tar sands plants and several refineries.
Pulping chemicals currently manufactured in Alberta include sulphur chemicals (e.g. sulphur, sulphur dioxide and sulphuric acid) as well as chlor-alkali chemicals (e.g. sodium hydroxide, chlorine). Other pulping chemicals e.g. hydrogen peroxide, saltcake, lime are being "imported".
Essentially no papermaking chemicals are currently being produced within Alberta. Clays and coating materials for a paper mill would have to be imported from the U.S.A. There are plans to commence production of calcium carbonate and clays in Western Canada (calcium carbonate in Eastern British Columbia, clay in Southern Saskatchewan both by Ekatoon Industries of Alberta).
-10-

3. IDENTIFICATION OF POTENTIAL VALUE ADDED PAPER AND BOARD PRODUCTS
Definitions of paper grades and pulping processes are constantly evolving as modifications in the processes occur. In order to clarify the various processes available, the following guidelines will be used in this study:
Chemical pulping: Includes both pure chemical and semichemical (e.g. NSSC) pulping. Yield ranges from 45 percent to about 85 percent. Cooking chemicals and dissolved organic compounds are normally recovered.
Mechanical pulping: Includes a variety of pulping processes: Chemimechanical (CMP) , Chemithermomechanical (CTMP), Thermomechanical (TMP) , Pressurized Groundwood (PGW) , Stone Groundwood (SOW), Refiner Mechanical (RMP) , etc. Yield ranges normally from 85 percent to 96 percent. Normally no recovery of chemicals.
Due to the lack of strong chemical treatment (cooking and bleaching) in the mechanical pulping, the defects found in the wood raw material are readily seen as a lower quality of the final product and as a lower reliability of the paper machine. Thus the availability of high quality wood fiber, especially softwood, is an essential requirement for the production of high quality groundwood papers. The removal of lignin in cooking and bleaching processes makes the chemical pulping less sensitive to the quality of wood.
About 50 percent of wood material is dissolved in the chemical pulping. These dissolved organic compounds are further burnt in a recovery boiler in order to produce steam and electrical power. As a result of this energy recovery, modern chemical pulp mills are selfsufficient regarding fuel and electrical power. On the other hand, mechanical pulping requires significant amounts of external energy, especially in the form of electricity.
From the environmental point of view, the effluents and emissions from a mechanical· pulp mill are easier and less expensive to handle than the ones from a chemical pulp mill.
The two main advantages, high quality wood and low cost energy, that the Province of Alberta could offer to a potential paper maker clearly support the production of paperfboard grades based on mechanical pulp in Alberta.
Newsprint, uncoated groundwood paper, coated groundwood paper and bleached board (including bristols) are the main consumers of mechanical pulp as shown in Table T.3.l. Because the quality characteristics of bristols are close to the ones of bleached board, bristols are here included into bleached board.
-11-

Table T. 3 . 1. North American Paper and Board Classification
Grade
~: - Newsprint
Uncoated groundwood paper Coated paper
Groundwood Freesheet
Uncoated freesheet Bristols
- Cotton paper - Unbleached kraft packaging Paper - Other packaging paper - Special industrial paper - Tissue
~: - Unbleached kraft board - Bleached board
Solid bleached sulfate Folding boxboard
Corrugating medium - Recycled board
% Mech. Pulp
90 55
35 5 5
30
45
% Chem. Pulp
10 20
30 65 95 70
100 100 100 100
100
90 45
100
% Filler & Coat
25
30 30
10 10
In coated and uncoated freesheet papers, as well as in packaging and tissue papers, the portion of mechanical pulp in the fiber furnish is only 0-10 percent. The extensive use of chemical pulp in these grades doesn't emphasize the optimization of the utilization of existing high quality fiber resources in the province. Additionally the production of these grades probably requires the integration of a paper mill with a chemical pulp mill. On the other hand, an economical greenfield integrated paper mill requires extensive capital investment, which is difficult to defend in todays' forest products industry environment. In tissue manufacturing also the bulkiness of the product, which leads to high transportation costs, is a disadvantage for a potential Albertan producers.
Based on the reasons above the four value added paper/board grades selected for a detailed market study are:
* Uncoated groundwood paper * Coated groundwood paper * Bleached board (folding boxboard) * Newsprint
-12-

4. MARKET SURVEY
4.1 General
4.1.1 Objectives
The contents of the market survey part of the study includes the analysis of the demand/supply situation and the structure of the markets for uncoated groundwood paper, coated groundwood paper, bleached board and newsprint in the geographical market areas, namely the domestic, the Western U.S. and the Pacific Rim, selected for the analysis .
The objectives of the market survey are to analyze the markets in the selected three geographical areas by grade. The following information is provided as a base for the analysis:
1. Current market volume and demand/supply structure, including
* .consumption * Domestic production * Exports * Imports by origin of shipment
2. Current domestic production capacity by mill.
3. Announced/planned/assumed supply capacity changes in the market area by the year 2000.
4. Demand development in the market area by the year 2000.
5. Imports demand development by the year 2000.
6. Major end users
7. Identification of main competitors in the market area.
The market survey is structured based on the paper/paperboard grades that initially had been selected as potential value-added products for the Province of Alberta. Those grades are:
* Uncoated groundwood paper * Coated groundwood paper * Solid bleached paperboard * Newsprint
The markets for these paper grades in the selected market areas are discussed in each of the Sections 4.2, 4.3, 4.4 and 4.5 respectively.
-13-

4.1.2 Methodology
The market analysis and the resulting conclusions are based on data from EKONO files and additionally from various sources such as: American Paper Institute (API), Canadian Pulp and Paper Institute (CPPA), Statistics Canada, US Bureau of Census, Pulp and Paper, Resource Information Systems (RISI).
The demand forecasting method used in the study is based on a variety of end use indicators (advertising, housing, production, etc. indexes), on Gross National Product (GNP) and population growth. The technology development in the paper manufacturing and in the graphical arts industry as well as the basis weight development of the products, intergrade price relations and increasing higher quality requirements have also been taken into account in the analysis.
The production capacity forecasting is based mainly on announced or planned new paper machines, machine rebuilds, machine shut downs and grade changes. Based on past experience the capacity increase due to the continuous improvements in the production efficiency has been estimated to be on average one (1) percent/year. The assumed capacity forecast after 1992 is based on a combination of the demand growth, imports demand and the raw material availability in the market area.
-14-

4.1. 3 Definition of the Market Areas
The three selected market areas for the four potential products manufactured in Alberta are:
1. Domestic Markets
The domestic market area is defined to include the provinces of Alberta, British Columbia, Manitoba and Saskatchewan.
PlOUIIII, PER CAPITA PAPIII • 10AIIO CONSUMPTION
(CANADIAN AVERAGE) POPULA TION IN MILLIONS
Figure F. 4 .1. DOMESTIC MARKETS
-15-

2. Western US Markets
The Western U.S. market area is in the study defined as U.S. West: California, Oregon, Washington, Idaho, Nevada, Utah, Arizona, Montana, Wyoming, Colorado, New Mexico, Alaska, Hawaii and U.S. North Central: North Dakota, South Dakota, Nebraska, Kansas, Minnesota, Iowa, Missouri, Wisconsin, Michigan, Illinois, Indiana, Ohio and U.S. West South Central: Oklahoma, Texas, Arkansas and Louisiana.
US WEST 283 kg 41 ••
PlOURII, 'IR CAPITA .. II •• IOARO CONIUM'TtON
CUI AVERAOI) 'O'ULA TlON .N MILLION I
Figure F.4.2.
US WIST SOUTH CeNTRAL 283 ke 23.7
WESTERN U.S. MARKETS
-16-

3. Pacific Rim Markets
The Pacific Rim market area is in this study defined as: Japan, Republic of Korea and People's Republic of China.
PlO'U', •• ,. GMI ...
Figure F.4.3.
'''.0'110''. . .... , ".0
' ... 1.·' .... tor ..
...... "'" ,.1_ "111,,1 •• " ...... !lA1.,.I. TUIl_
SI ... """ 1-,1. .... u .. I. _lullM
PACIFIC RIM MARKETS
-17-
I~,~!::.. ,. '0jIU1 && I. I. 1111110'"
'.S .. .. 111.5 U 1I1.a It.'
••• n.' I .• H .•
u.a ".S 10.1 It .•
111 •• Z.S
'.1 ISS •• lU.l IS •• 111.' U

4.2 uncoated Groundwood Papers
4.2.1 Classification of Uncoated Groundwood Papers
Uncoated groundwood papers are normally considered as valued added newsprint - the printing properties have been enhanced by superior brightness, smoothness, surface finish etc. They are used mainly as an intermediate printing paper between the standard newsprint and coated groundwood papers. The only exception is the groundwood forms paper, which is competing with uncoated freesheet forms. The common nominator for all of the uncoated groundwood papers is that they contain at least 10% mechanical pulp. Filler content varies from 0% in lightweight directory papers to above 30% in high quality supercalendared papers.
In the report uncoated &roundwood is divided into four categories. The first three categories represent specific uncoated groundwood grades with a clear end use sector and a distinctive manufacturing technology. The fourth group includes all the rest of the various uncoated groundwood grades.
1. Category I: Supercalendared Papers
This, mainly European based grade, has high filler content and competes mainly with LYC paper. This grade represents the highest quality uncoated groundwood paper.
2. Category II: Lightweight Groundwood Papers
Into this category fall all the unfilled uncoated groundwood grades with basis weight less than that of standard newsprint (48 g/m2). In the main end use sector, telephone directories, there are no major competing grades to lightweight uncoated groundwood papers.
3. Category III: Groundwood Business Forms
The main end use area of the uncoated computer printing industry. Uncoated competing grade in this market sector.
groundwood forms is the freesheet is the main
4. Category IV: Other Uncoated Groundwood Papers
This category includes all the uncoated groundwood grades not fitting in to the previous categories. The main tonnage is improved news (supernews, rotonews, etc.), which is competing on the same end use markets with standard neWsprint and low quality SC-paper. Also the bulky book paper, which is used in pocket books and comics, is included into this category.
-18-

In Western Europe. uncoated groundwood (i.e woodcontaining) papers are divided into two main categories based on the used manufacturing technology:
* SC-papers (Supercalendared) * MF-papers (Machine Finished)
These two group are further split into smaller subgroups, e.g SC-paper is divided into SC-offset and SC-gravure.
In Japan uncoated printing and writing papers are classified according to the end uses and chemical pulp contents.
Table T.4.1. Uncoated Printing and Writing Paper Classification in Japan
Name of the Grade
Printing paper A
Printing paper B
Printing paper C
Printing paper D
Gravure printing paper
Senka printing paper
Other printing papers
Writing/drawing papers
Gate-roll coated paper
Chemical Pulp
Percent 100
70-99
40-69
0-40
0-40
0-40
70-100
70-100
40-100
End Uses
Books, offset printing, posters, commercial printing
Books, magazines, office uses
Magazines, telephone directories, business forms
Magazines
Rotogravure printing
Comics, paperback books
Dictionaries, security papers, special printing
Writing and drawing papers
Textbooks, brochures magazines, commercial printing
-19-
Corresponding North American Grade Freesheet
Freesheet
Improved news Business forms SC-papers
SC, Rotonews
Bulky papers
Freesheet
Freesheet
Pigmented groundwood

4.2.2 uncoated Groundwood Paper End Uses
Practically all of the uncoated groundwood paper is used for printing and writing purposes. The printing and writing papers on the other hand include a wide variety of products ranging from newsprint and bulky groundwood paper used in paperback books to high rag-content bond used for bill printing. They also include converting papers such as envelopes, tablets and business forms. The structure of printing and writing paper industry is illustrated in Figure F.4.4.
SWING
_---.;. ... MACH .... .._-----. '-1 ___ I.,JIIMCOATlID
IIIWS'''IMT G"OUNDWOOD MACH.II MACH*IS
COUlD
GllOUNGWOOD
MACH*I.
COATlID
""IISH"S MACH.I,
UNCOATlID '''IIIMIIT
MACH'NI'
Figure F.4.4. PRINTING AND WRITING PAPER PRODUCERS AND END USERS
r ;jOUINTiiii' : Q"OUNDWOOD : '- ___ ' __ .J
The lowest quality paper in these markets is basically standard newsprint. About 75% of it is used in daily and weekly newspapers, the balance being used mainly in inserts and mailers.
Most of the lower quality uncoated groundwood paper (rotonews, bulky papers, etc.) machines originally made standard newsprint and later were upgraded to produce groundwood specialties, as they ceased to be competitive in the newsprint industry. These machines are called
-20-

"swing-machines", because they are able to swing between uncoated groundwood paper and standard newsprint depending on the present market demand situation. Currently the swing capacity is estimated to be about 3 million tons, according to API and most of that capacity is located in Canada.
In coated groundwood papers, the fiber furnish contains more than 10 percent mechanical pulp (usually 50 percent mechanical, 50 percent chemical). The two-sided coating represents about 30 percent of the total weight of the finished paper.
As a remark both uncoated and coated freesheet represent the highest quality printing and writing papers. The contents of mechanical pulp in these grades is lower than 10 percent. The European term "woodfree" corresponds to the North-American "freesheet" grade.
The main end use markets books, business forms, catalogs, directories, F.4.4.).
for uncoated groundwood papers are magazines, other converting, inserts and mailers.
and other commercial printing (see Figure
NORTH AMERICAN MARKET END USERS
MAGAZINES
In 1986, U.S. magazine printers consumed about 2.5 million tons of paper and were the second largest user of printing and writing papers. The main economic end use indicator in the magazine publishing industry from the paper demand point of view is the number of advertising pages. This has been closely correlating with the paper demand in the magazine industry after making adjustments for basis weight changes. The major driving force behind the long term growth of the magazine industry is the growth in the number of households in the U.S. which will be stagnating in the late 90's after the baby-boom portion of the population has aged beyond the household formation ages.
The paper demand in the magazine sector will grow about 3.2 percent/year on average to year 2000, when the tonnage is estimated to reach 4 million tons. The main factors behind this growth are:
* Increased advertising ** growth in advertising 3.5 percent/year ** higher level of disposable income ** increasingly competitive nature of consumer goods markets ** the growth of international trade generally with imported goods
seeking to establish positions in foreign markets. ** Prime-time TV advertising is expensive ** TV's prime-time is short ** Magazine advertising is more directed than TV commercials
-21-

* The number of special interest magazines will grow faster than that of general magazines ** Increased circulation figures ** More advertising due to the directed markets
Presently, it seems that the new electronic media will not have any major effect on the magazine markets until year 2000.
Another clear trend in the magazine markets is the development towards higher paper quality. The reasons for this can be found both in the technical development in the printing industry and in consumer habits:
* As previously stated, the growth of general magazines will be lower than the growth of special magazines and traditionally there is a higher paper quality in special magazines.
* The lower circulation of the special magazines and the requirement for flexibility in printing processes will increase the use of offset paper on the cost of gravure. Again, in offset-printing the paper quality requirements are higher than in gravure printing.
As a result of the estimated trends, the fastest growing paper segment in the magazine sector will be high quality SC-offset and LWC-offset paper, both of which could offer good offset print-quality.
Currently both SC- and other (improved news, etc.) uncoated groundwood grades are used in magazines. The demand of SC-paper for magazines was in 1985 about 200,000 tons, which represents 8.1 percent of the total paper demand in the magazine printing. Due to the higher quality requirements the share of SC-paper is estimated to grow by the year 2000 to about 13.5 percent of total, which corresponds to a SCpaper demand of 550,000 tons. At the same time the lower quality uncoated groundwood demand is estimated to decrease from the current 100,000 tons/year level to about 60,000 tons by the year 2000 (Figure F3.5).
The main competitor to uncoated groundwood (SC-paper) in the magazine paper segment is LWC-paper.
-22-

U) z
8
15
o 4 l-II. o U) 3 z o ::; ::4 :I 2
1
SC-PAPER
OTHER UNCOATED GWD
MAGAZINE TOTAL
:::::: :.:.:. ...... ...... ...... ...... . ':':': :.:.: . . :.:.: ...... ...... ...... :.:.:. ...... ......
:.:.:. ....... :.:.:.: ....... !:::!:: ....... !:::::: . ..... . . ..... . . ..... . . ..... . !:::!:: ....... ::::::: ....... :.:.:.: . :.:.: . . ..... . . :.:.: ...... ...... .......
~~L----I'.:::::: . ..... . . ..... . 1185 1111
..... ...... . .... ...... ...... ..... . ..... ..... ..... ..... . .... . . ... .
:~lll . ..... ..... . .... . . ... . ...... . .... ......._....l.:: •• ::
2000
Figure F.4.5. UNCOATED GROUNDWOOD CONSUMPTION IN MAGAZINES
BOOKS
The book printing end use market, 0.95 million tons in 1985, is dominated by uncoated freesheet (market share 50 percent). The growth in the book sector is estimated to be 300,000 tons or 1.8 percent/year by year 2000. The main reasons to the fairly low growth in the book industry are:
* The percentage of population in school ages is decreasing. * The average basis weight of the paper used in books is
decreasing.
A continuation of the very low growth in the paperback book sales and improved efficiency in the high return of paperback books will keep the uncoated groundwood demand at the book end use markets at the current 230,000 tons per year level (Figure F.4.6.).
-23-

5
." 4 z 0 t-"-0 3 ." Z 0 ::;
2 ... i
1
Figure F.4.6.
BUSINESS FORMS
ITIID UNCOATED GROUNDWOOD PAPER(BULKY)
I;:;:;:~ BOOKS TOTAL
....... ....... :::!::: ....... :!::::: ....... ...... . ....... ...... " I'.·. ...... . ...... ...... I'. I, I, ...... .'.' I' . .::::!: . ...... •... I'. ...... . '.' ... ...... . ...... ...... . ......
:.:.:. .:.:. :. .:.:.: :.:.:. : ...... ....... ...... . ...... ...... ,', I, •• · I'.·. . ...... ...... '. '.' . ...... I'.·.· . ...... . ...... ...... .: .:.: . · ..... . ...... · ..... :. :.:.: · ,', .. :.:.:. .' ..... . ......
1985 1991 2000
UNCOATED GROUNDWOOD USAGE IN BOOKS
In 1985 the business forms industry consumed about 2.6 million tons of printing and writing paper consuming 2.3 million tons uncoated freesheet and 0.3 million tons uncoated groundwood. Business forms sales should continue to exceed the rate of growth in gross national product by a wide margin, but the 6.6 percent annual growth during the past decade will probably not be sustained. We have estimated that the sector will grow 4.8 percent/year on average and the tonnage will reach 1.3 million tons in 2000 (Figure F.4.7) The new markets assisted with the mini and micro computers and the new non impact printing technology will be the main driving forces behind the growth of the forms industry.
The growing use of non impact laser printing will raise the average basis weight of forms paper, but it will cut down the use of carbon interlining thin paper or carbon1ess paper. The overall impact of non impact printing on paper shipments to the forms industry will be positive and will be raising the average basis weight and lowering the cost of high-volume forms printing.
-24-

The main quality disadvantages of the groundwood forms are the tendency to loose dimensional stability and the tendency of colour reversion. That is also the reason, why uncoated groundwood forms are currently used mainly in short-living-time internal reporting.
By taking the above mentioned factors into consideration, we have estimated that the groundwood forms will increase their market share in the business forms industry from the current 12.6 percent to about 17 percent by the end of this century.
en z o l-I&. o en z o ::::; ... i
5
3
2
1
ITIII1 UNCOATED GROUND WOOD FORMS
H:::::3 IUSINESS FORMS TOTAL'
. ', . ', ... , .. · .', · .:. · ',' 1885 1891
..... ...... ..... ...... ..... ...... . .... ..... ::: .:.:.:.:.:.:
2000
Figure F.4.7. UNCOATED GROUNDWOOD USAGE IN BUSINESS FORMS
OTHER CONVERTING
This category includes shipments to converters which do not fall into the previous categories of forms, envelopes, or stationary and tablet converters. Converters that fall into this category include for example: check printers, gummed paper converters, foil laminating, gift wrap, adding machine roll converters, wallpaper converters.
-25-

In 1985 the shipments to U.S., of which uncoated percent.
these and
converters were about 670,000 tons in coated freesheet provided for than 80
As a potential uncoated groundwood consumer, this category is of less importance - current consumption totalling 60,000 tons/year of various uncoated groundwood grades.
en z o t-Il. o en z o :::; :t :E
8
4
3
2
1
IIIIIIII UNCOATED GROUNDWOOD (SEVERAL GRADES)
. ,,' . ..... ..... . ..... :.:. :.
1188
OTHER CONVERTING TOTAL
1181 2000
Figure F.4.8. UNCOATED GROUNDWOOD USAGE IN OTHER CONVERTING
DIRECTORIES
The directory markets are dominated by lightweight uncoated groundwood paper, which represents currently about 88 percent of the total paper demand. The remaining 12 percent is uncoated freesheet, the share of which is estimated to be decreased to 8 percent by the year 2000 due to the better cost competitiveness of groundwood papers.
-26-

The growth of white pages in the telephone directories follows closely the growth in U.S. households, which is estimated to be low (1.3 percent/year) for the rest of this century. Yellow pages and special directories are expected to grow much faster during the next few years due to the growth in advertising pages. It is also presumable that electronic media will begin to play an important role in the directory sector in the late 90's. For example in France electronic telephone catalogs are already in use. The orders of telephone directory paper are normally huge (hundreds of thousands of tons) and the big order quantities have created a situation where the competition in the sector is very tough.
We estimate that the growth in the percent/year on average to the uncoated groundwood could increase about 92 percent, the tonnage will to about 710,000 tons in year 2000
directory paper demand will be 1.8 year 2000. Because lightweight its market share by year 2000 to increase from 520,000 tons in 1985
(Figure F. 4.9) .
a LIGHTWEIGHT UNCOATED GROUNDWOOD
a DIRECTORIES TOTAL
fI) 4 z
0 ... u.. 0 3 en z 0 :;
2 ~
i
1
... . . . 1181 1111 2000
Figure F.4.9. UNCOATED GROUNDWOOD USAGE IN DIRECTORIES
-27-

CATALOGS
In the present study the catalogs are defined to be printed products specifically designed to promote sales of products and services. In 1985 the total paper demand in the catalog industry was about 1.65 million tons, the uncoated groundwood share of which was 29 percent or 480,000 tons; 10.5 percent SC-paper, 18 percent lightweight and 0.5 percent other uncoated groundwood grades.
The use of off-shore imported paper in the U.S. catalog industry is remarkable, about 200,000 tons in 1985. The most sizeable penetration rate appears to be with SC-papers, where as much as 60 percent of the demand is coming from off-shore suppliers. The main reason for this being the high quality of European SC paper.
The growth of the catalog industry was extremely fast in the late 70's and early 80's, the average growth rate being more than 14 percent annually. Although the growth of the sector will slow down during the rest of this century due to saturation of large general catalog markets. However, the fast growth experienced by the specialized mail order companies with fairly small catalogs should keep the growth rate at about 4.1 percent.
The growth of special catalog markets will also substantially influence the paper quality trends. Offset-printing, which requires high quality paper, becomes less expensive compared to gravure, when the number of copies is less than about 500,000. It is evident that the reduced circulation and the use of offset-technology as well as the need of better appearance in the final product increases the demand of high quality paper grades.
In addition to the importance of high quality printing properties, the low basis weight is important due to the high mailing costs. Especially in Europe the trend towards ultra light weight grades, basis weight less than 45 g/m2 is evident. (Haindl 40 g/m2).
We do not assume a major effect from electronic media in the catalog industry through this century.
We have estimated that the share of uncoated groundwood paper used in the catalog industry will drop from the current 30 percent level to about 25 percent at the end of the century. However, the use of SCgrade will increase from the current 10.5 percent to 11.5 percent mainly on the expense of lightweight uncoated groundwood. In tonnage terms the SC-paper demand should grow from 110,000 tons/year to about 350,000 tons (Figure F.4.l0).
-28-

U) z o l-I&. o U) z o -..J
== :a
5
4 -
3
2
1 • ~
~ SC-PAPER
E3 LlGHTWIEGHT UNCOATED GROUNDWOOD
I:;:;:;~ CATALOGS TOTAL
--..... ...... ..... ...... ..... ...... . ... . . .... . ..... . .... . . ... . . .... . ..... ..... . .... . . ..... .....
..... ...... ..... ...... .... . ..... . ..... ........... ..... . ..... ...... --J.: ........ . _ .... .. . ... .
~ ..... . ......
1985 I
1991
...... ..... . .....
-...... ...... ..... . ..... ...... ...... ...... ...... ...... ..... ...... ..... . ..... '::::::::::: ~::::::::::: :.:.:.:.:.: .
.- .:.:.:.:.:.: . ..... """~ .:.:.:.:.:.:
I
2000
Figure F.4.10. UNCOATED GROUNDWOOD USAGE IN CATALOGS
INSERTS AND MAILERS
The insert and mailer market includes both inserts that are distributed in newspapers and those mailers that are delivered directly through mail or total market coverage programs. The tonnage of inserts and mailers was in 1985 1.1 million tons, of which almost SO percent or 550,000 tons was uncoated groundwood paper; 18.5 percent SC and the rest mainly improved newsprint. The average annual growth of the insert and mailer industry reached 13 percent in the 70's and early 80's but is expected to grow at a lower average annual rate of 4.4% from here on to the end of the century.
The growth in the insert/mailer industry will vary greatly by segment. The food advertising inserts will be the lowest growth market while the fastest growing segment will be the special store insert business. Correspondingly internal restructuring of the insert/mailer industry is recognized in the paper quality requirements of the industry. Food
-29-

advertising inserts are generally printed on newsprint or on improved newsprint while in special inserts and mailers high quality uncoated groundwood and coated groundwood papers dominate the markets.
We estimated that the share of SC-paper would remain at the current 18.5 percent level while the share of other uncoated groundwood grades, mainly improved news, will drop from the current 30 percent to about 20 percent (Figure F.4.ll). The biggest winner will be the LWC-paper, which will increase its market share from 42 percent to 58 percent by year 2000.
In the insert and mailer industry the share of off-shore imports is remarkable, about 23 percent in 1985. Of the SC-paper consumption within the segment the share was even higher - slightly over 50 percent.
5
= 4 o ... u. o ." Z o
3
:; ::! 2 :.
1
~ SC-PAPER
[1]] OTHER UNCOATED GROUND WOOD GRADESUMPR. NEWS)
INSERT'MAILERS TOTAL
...... ..... ..... . ...•....... ........... .4 • .,iTTm····· ...... .••.•... :.
1185
...... .-.•.. ...... :.:.:.:.:.:. . .... . . .... . ..... . ...._,..."':.:.:.:.:.: . .......•.... .....
.:.':.', ..... .... . ....• ...... ..... ...... . :.:.:.:.: . . .•.•...... :::::::::::
...1IpII ....... :.:.:.:.:.: ..... . .... . . ... . 2000
Figure F. 4.11. UNCOATED GROUNDWOOD PAPER USAGE IN INSERTS AND MAILERS
-30-

OTHER COMMERCIAL PRINTINGS
The category includes shipments of all printing and writing paper to commercial printers, which do not fall into the previous categories of directories, catalogs and inserts/mailers. Typical subgroups of this category are: annual reports, travel brochures, printed tablets, Sunday supplements, etc.
The shipments within the category were in 1985 about 3.7 million tons, which makes it the largest single user of printing and writing papers. It is also obvious that commercial printing industry will continue to be a high growth market due to the expected good performance of the printed media advertising. However, the growth rate will be lower compared to that of catalogs and inserts/mailers. This category is also very diversified and the growth rates vary extensively by segment.
We estimate that "other commercial printing" market will grow by an average annual rate of 3.2 percent during the rest of the century. In tonnage terms this corresponds to an increase from the current 3.7 million tons per year to almost 6 million tons in year 2000. Looking at the uncoated groundwood paper, SC-paper will loose markets to coated papers and the market share will drop from 3.6 percent to 3.4 percent. However, the total SC-paper demand will most likely increase from the current 135,000 tons to about 200,000 tons per year.
The market of other uncoated groundwood grades is currently about 2.7 percent and will decrease to about 1 percent by year 2000. Although a high printing and writing paper total demand, the sector is not a substantial potential consumer of uncoated groundwood paper in the future (Figure F.4.12).
-31-

(I) Z 0 t-Il.. 0 (I) z 0 :::; :::! :IE
5
4
3
2 t-
1-1-
~ SC PAPER
[I]]] OTHER UNCOATED GWD. GRID
,---, OTHER COMM. L...--J PRINTING TOTAL
-..... ...... ...... ...... ..... .
-...... ...... ..... ...... ...... .... . ...... . .... . ...... . ... . ..... . .... . ...... . .... . ...... . .... . ...... . ... . ...... . .... . ...... . ... . ...... . .... . ...... . .... . :.:.:.:.:.:. . .......... . ...... . ... .
....... ...... . ..... . ...... ....... ...... ....... ...... ....... ...... ....... ...... ...... . . ..... ....... ..... . ....... ...... ....... . ..... . . .... . . .... . . ..... . . .... . ....... . ..•.. . ..... . . .... . . ..... . . .... . . ..... . . .... . ....... ...... . ...... . ...... . .... . ...... ..... . ..... . ...... ...... . .... . ...... ...... . ..... . ...... ...... . .... . ...... ..... . ..... . ...... ...... . .... . .................. ...... . ..... . . . . . . . .: .... :.:. .:.:.:.:.:.: . .... ::... :.:.:.:.:.:. '::,'::: ..... ...... . ..... .
...... '.': :'.:'.:'.:'.:'.:. . .... . L~!!_~~::::;;;:::~:::~:: L_...J-s!!!!"_·:::;·::::":::"::L __ ~~~ :::::::::::::
I I I
1885 1991 2000
Figure F.4.l2. UNCOATED GROUNDWOOD USAGE IN OTHER COMMERCIAL PRINTING
SUMMARY OF UNCOATED GROUNDWOOD END USE MARKETS IN THE U.S.
The total uncoated groundwood paper demand will grow from 2.7 million tons in 1985 to about 4.5 million tons in the year 2000, which corresponds to a growth rate of 3.3 percent/year. We have estimated the breakdown of the growth as follows:
Current Growth Grade 1000 tons Percent/year
SC-paper Lightweight Groundwood Paper Groundwood Forms Other
TOTAL
-32-
780 5.0 300 2.1 580 7.0
90 0.7
1750 3.3

The highest percentage growth, 7 percent will be experienced in groundwood business forms. Also the tonnage growth is remarkable, the capacity of at least three large papermachines totally.
The high quality combined with the fairly high growth rate and the diversification of the end uses seems to give the best opportunities from the market point of view for production of SC-paper grades.
2.0 ~--------------------------------------------~
U) z o ~
II. o U)
z o :::; ..I
i
1.5
1.0
0.5
lS'SJ se-PAPER
r:.::::l ~
LIGHTWEIGHT GROUND WOOD PAPER
~. GROUNDWOOD FORM.
1'«'<"<1 ~
OTHER
n85 1111 2000
«< «< «< «< «< «< «< «< «< «< «< «< «< «<
«« «< «< «<
««
Figure F. 4.13. BREAKDOWN OF GROWTH IN UNCOATED GROUNDWOOD PAPER DEMAND GROWTH
PACIFIC RIM MARKET END USERS
Uncoated groundwood papers are not categorized similarly in the Pacific Rim countries as in North America. This is mainly due to the vast variety of both uncoated groundwood and uncoated freesheet paper grades produced in these countries.
-33-

The total uncoated groundwood consumption in 1985 is estimated to be as follows:
Japan Rep. of Korea People's Rep. of China
Total
1000 tons 1640
160 160
1960
Supercalendared paper end use markets are easier to analyze than that of uncoated groundwood. In Japan the end-use markets can be divided into three separate categories: magazines, catalogs/mailers/inserts and other markets. The magazine end-use sector represents currently about 50 percent of the total SC-paper consumption in Japan. This represents about 80,000 tons annually. The advertising business consumes about 30 percent of the total or 50,000 tons/year and the other miscellaneous end users about 20 percent or 30,000 tons of the total SC-paper demand.
The current SC-paper consumption level in the Republic of Korea and in the People's Republic of China is extremely low compared to North American or European figures, only about 1000 tons per year. The main SC-paper consuming industry in these countries is the magazine publishing, especially export oriented magazines.
The SC-paper demand in the Pacific Rim countries is forecasted individually for each country in Section 4.2.8.
4.2.3 SC-Paper Classification
There is no industry wide standard to classify supercalendared papers. In North America the most common method is to divide them into two subcategories: SC-A and SC-B grades. The filler content in SC-Agrade is 15-30 percent and the brightness 66-80 and an extra surface treatment is included to improve the printing properties of the paper. The highest quality SC-A grade is currently imported to the U.S mainly from Central Europe (Table T.4.2). SC-A is moreover divided into SCoffset and SC-gravure grades, from which the SC-offset is the higher quality grade (e.g. Myllykoski, Mets4-Ser1a WSOP).
SC-B grade is produced mainly in normally less than 15 percent and grade.
Canada and its filler content is brightness lower than that of SC-A
In the most recent classification system (Mr. Ruggles, Richard Lewis Paper Co., Chicago) SC-papers are divided into five categories according to their brightness level. This classification is analog to
-34-

the classification systems of coated papers. In Table T.4.2 hereunder, some of the main SC·producers and main competing grades are tabulated based on this classification system.
In Western Europe, Standard SC corresponds to the North American SC·A· grade and Modified SC to the SC·B.
Table T.4.2. Classification of SC·Papers
GE Brightness
SC·A
(Standard SC)
. offset • gravure
SC-B
(Modified SC)
80
75
70
65
Main Producers/Importers
#1
#2
#3
#4
#5
Albruck, Germany
Carmignao, Italy
Albruck, Germany
Finnpap, Finland Champion, USA
Finnpap, Finland Madison, USA
ClP, Canada
Kruger, Canada St. Mary's Paper, Canada
4.2.4 World Se-Paper Demand/Supply
Main Competitors
Coated #3, #4 .Pigment. freesheet MF #1
Coated #4, #5 Pigment. freesheet
MF #1, #2
Coated #5 Pigment. groundwood MF #1, #2
Coated #5 Pigment. groundwood MF #1, #2, #3
MF #2, #3, #4
SC-paper is still mainly an European grade and is produced especially in the Federal Republic of Germany and in Finland (Figure F.4.l4). Currently the North American consumption, about 700,000 tons per year,
-35-

doubles the North American capacity. The remarkable off-shore imports of high quality SC-paper could give good opportunities for potential Albertan producers to penetrate the North American markets.
2.0
1.' 1.' 1.4 ~ SUPPLY
", Z 0 DEMAND 0 1.2 l-I&. 0 1.0 ", Z 0 0.' ::; -' i 0.'
0.4
0.2
o us a SWIDI.. 0'"11 IAS'II" "A.A.. 0'"11
CA .. AOA ...... A .. D WIS'II" IUIO'I .. OIWA' IUIOPI
.... AIIII.C •
Figure F.4.14. WORLD REGIONAL SC-PAPER DEMAND AND PRODUCTION
It is also important to recognize that SC is a value added paper grade that is consumed mainly in the developed countries i.e. Western Europe and North America. The demand figures for South East Asia clearly indicates that there is not an established market for SC-grades in the region.
The world-wide consumption of about 3.2 percent on average. saturated but the growth in (Table T.4.3).
SC-paper is estimated to grow annually The demand in Western Europe is already
the other regions looks fairly healthy
-36-

Table T.4.3. SC-Paper Demand Growth Rates
North America Japan South Korea China Other Regions
TOTAL
Current Demand 1000 tons
750 160
1 1
2330
324Q
Percent/year
5.7 6.0
* *
1.9
3.2
The world SC-paper capacity in 1986 was about 3.4 million tons as shown in Appendix A.4.1. The already announced or planned capacity additions should increase the capacity by 1992 to about 5.1 million tons. This will cause a remarkable reduction of the capacity utilization in the SC-paper industry as illustrated in Figure F.4.15.
• c 0 .. 8 ..
5200 5100 5000 4900 4800 4700 4S00 4500 ...... 00 4300 4200 4100 4000 3900 3800 3700 3800 3500 3400 3300 3200
11J8511J8811J8711J881989 1990 191J119921993199419951998199719981999 2000
'tlr o Demand + CapacIty
Figure F.4.15. WORLD DEMAND/SUPPLY OF SC-PAPERS
-37-

4.2.5 World SC-Paper Trade
The world SC-paper trade is dominated by the Finnish and German companies. Actually those two countries and Norway are the countries together marketing the major part of the worldwide SC-paper (Figure F.4.l6).
Figure F.4.16. SCANDINAVIAN AND WESTERN EUROPEAN SC-PAPER SHIPMENTS IN 1984
-38-

As indicated in Figure F.4.l7 the price development of SC-paper could be considered stable during the past few years. The price has also followed closely the changes in price of No. 5 coated paper with a 150 USD/short ton average lower price level. It is, however, predictable that both No. 5 coated and SC-paper price slightly decrease during the next few years mainly due to the overcapacity of both No. 5 coated and SC-papers. This trend has already concretized in SC- and LWC-paper prices.
z 0 t-t-a: 0 : 0 ...... tit en ::)
4.2.6
1,000 I I -100
800
- NO.8 COAT~ 1\
700
800
J V- i\ Lr ". V--
j SC· ,. J i-
500
400
-V V
V-1-/ STD. NEWSPRINT V '" 300
V ~ .---J
78 71 80 81 82 83 84 88 88
Figure F.4.l7. SC-PAPER PRICE DEVELOPMENT
Domestic SC-Paper Markets
In 1985 the SC-paper demand in Canada is estimated to be about 20,000 tons. About 15,000 tons of this was supplied by the domestic producers - CIP Inc., Trois Rivieres and Consolidated Bathurst Ltd., Grande Mere mills - the remaining 5,000 tons being imported mainly from Finland. Since 1985 the Canadian SC-paper capacity (SC-B) has been increased by 130,000 tons; Abitibi-Price, Kenogami No.6 machine rebuilt in 1985 and
-39-

St. Mary's Paper Inc., Sault Ste. Marie, machines Nos 3 and 4 rebuilt in 1985. Currently the Canadian SC-paper (B-grade) capacity, including swing machines, is about 300,000 tons.
The current SC-paper demand in Western Canada is estimated to be only 4,000 tons. This estimate is based on the Western Canadian printing and publishing industries share of the corresponding total Canadian shipments. The SC-paper end use industry is highly concentrated to the provinces of Ontario and Quebec. Ten largest Canadian publishers are all located in Ontario. Seven out of ten largest commercial printers are located in Ontario, two in Quebec and one, Evergreen Press, in British Columbia. Out of the 600 largest Canadian magazines only about 120 are published in the Prairie provinces or in British Columbia.
The SC-paper demand in Western Canada is estimated to grow to 15,000 tons by 1990 and to 30,000 tons by the year 2000. In the future, most of the Western Canadian SC-paper demand will be supplied by the Eastern Canadian producers.
The following Canadian mills have plans to increase their SC-paper production:
Abitibi-Price Inc., Kenogami, PQ by 64,000 tons in 1987 CIP Inc., Trois Rivieres, PQ by 30,000 in 1987 Consolidated-Bathurst Ltd., Grande Mere, PQ by 180,000 (planned) St. Marys Paper, Sault Ste. Marie, ON by 135,000 (planned)
Saugbruksforeningen has announced that the 200,000 ton SC-machine project at Matane, Quebec is currently on hold. It is probable that the project will not be realized. There are no plans to start SC-paper production in Western Canada.
4.2.7
4.2.7.1
western U.S. SC-Paper Markets
U.S. West SC-Paper Markets
There is no current SC-paper capacity nor any announced or planned projects for SC-production facilities in the U.S. West region. The imports from Canada and Scandinavia are slightly more than 30,000 tons/year and supplies are clearly dominated by Finnish producers. The shipments of SC-paper from the other U.S. regions, such as Minnesota, Maine and New York, are estimated to be about 20,000 tons/year The two biggest U.S. suppliers for the U.S. West are Madison Paper Co. and Champion. The total demand, 50,000 tons, in 1985 is surprisingly low compared to other U.S. regions and indicates that SC-paper has not yet penetrated into the market area (Figure F.4.18).
-40-

CA .. ADA 2
ICA .. DI .. AYIA U
OTHIR UI
~=================::::J 111010 ... ao
Figure F.4.18. ESTIMATED U.S. WEST SC-PAPER DEMAND/SUPPLY STRUCTURE IN 1985.
-41-

50 -
40 -., ... Z III
-:I 30 !: % II)
II) :=
- I~ i <.-:; < to ....
II. 0 20 ~
«< • 1-' < < < .. +
'< « + «< +
+ + < < < to + «< + «< + < < < + + < < < .. + - «< + «< + 10 < < < + + < < < • + «< + «< + «< + + < < < • + -:« + «< + -:: < < .. + «< • + : « + «< + ,« .. + «< • .. o .. " .. "
MAGAZINES CATALOGI
~~ «< .++ «< + «< •• «< + «< • + «< + «< • + «< + «< • + «< + «< • + «< + «< • + .. " INSERTS I MAILERS
-~ • • «< + < < < • + «< + < < < • + «< + < < < • + «< + «< • + «< + «< • +
~~:~ +
+ .. " OTHER COMM. PRINTING
--i ... <~ • • + «<
• + «< + «<
• + «< + «< • + «< + «< • + «<
+ «< . .. " lOOKS
Figure F.4.19. END USE INDUSTRIES SHARE OF THE TOTAL U.S. SHIPMENTS IN U.S. WEST.
We believe that the SC-paper demand relatively fast, about 11 percent/year, base our forecast on the following:
in U.S. during
West is going to grow the next 15 years. We
* SC-paper will continue to penetrate the U.S. West markets and the share of SC-paper in the printing and publishing industry will reach the U.S. average by year 2000.
* The printing and publishing industry in U.S. West will get a larger share of the U.S. total demand.
* The SC-paper end use industry, magazines, inserts/mailers, and catalogs, will grow comparatively fast during the next 10 years.
The forecasted demand of SC-paper in U.S. West is shown in Figure F.4.20.
-42-

• c o ....
S ...
600
500
400
300
200
100
o 19851986198719881989199019911992199319941995 19961997 199819992000
Yair
C Damond + Domestic Production
Figure F.4.20. SC-PAPER DEMAND IN U.S. WEST
For a potential Albertan SC-paper producer, the major competitors in U.S. West are Finnpap from Finland (30,000 tons/year) and the U.S. SCpaper producers: Madison, ME, Champion, MN and NY and Lake Superior, MN.
Potential consumers of SC-paper are the major Westcoast printing houses and publishers, a selective list of which are presented in Table T.4.4.
-43-

Table T.4.4. Major U.S. West Printers and Publishers
1. W.A. Krueger, Scottsdale, AZ * Catalog and magazine printing
2. World Color Press, Merced, CA * Catalog printing
3. Carter Hawley Hale, Los Angeles, CA * Insert/mailer user
4. Safeway Stores, Oakland, CA * Insert/mailer user
5. American Stores Co., Salt Lake City, UT * Insert/mailer user
6. Lucky Stores, Dublin, CA * Insert/mailer user
7. Cemco Dept. Stores, Dublin, CA * Insert/mailer user
8. Price Co., San Diego, CA * Insert/mailer user
9. Treasure Chest, Glendora, CA * Insert printer
10. Albertson's Stores, Boise, 10 * Insert/mailer user
4.2.7.2 u.s. North Central SC-Paper Markets
The North Central region is the largest printing and writing paper consumer in the U.S., because of concentration of large nationwide commercial printers in the Chicago area. The total estimated SC-paper demand was about 200,000 tons/year, of which more than 50 percent was supplied by the domestic producer, Champion. The Canadian shipments to this region were about 30,000 tons/year and mostly supplied from Abitibi-Price, Consolidated-Bathurst and St. Mary's Paper. German and Finnish companies dominated the off-shore imports of SC-paper (Figure F.4.20).
-44-

-S'1-
'(S''1'l etq~l) 'o~e
'sep~~jdn eUlqo~m 'j'e s~uemeAo~dml ~eu snoeu~tteoslm o~ enp OOOZ ~~eA Aq SUo~ 000'0'1 ~noq~ Aq pes~e~oul eq ttlA A~lO~d~o eq~ Att~Ol~lPPV 'aulqoem ~eded-~s NW 'q~ntna '~ol~edns e~V1 Aau eq~ 10 dn-~~~~s aq~ ~a~l~ suo~ 000'0££ o~ es~e~oul ttlA ~nq '(tte~~~s 'uoldmeq~) S86t ul suo~ ooo'OZt 10 t9A9t 9q~ paqo~a~ uOl~onpo~d ~ed~d-~s 0l~semop aql
'S86t NI 3~~n~lS X~ddns/aNVW3a ~dVd-~S ~~lN3~ Hl~ON 's'n a31VWI1S3 'tZ''1'~ e~n!l~
c<c<cc««««««<cccccc«««««««««««««< U
Ot ,NOltlll
.n 81M.&.0
) < t ,
0&
OC YOYNY::I
« ~ ~I "----• ---. -------------... ( (

Table T.4.5. U.S. North Central Domestic SC-Paper Capacity
Capacity in 1986:
Champion, Sartell, MN
Announced capacity changes:
Lake Superior Paper Co., Duluth, MN (1988)
Net Improvements
Total
Estimated capacity year 2000:
1000 tons/year
120
210
40
250
370
The North Central region has lately become less dominant in the printing and writing industry and also economically the importance of this region has been declining. The share of the catalog, insert/mailer printing as well as other commercial printing in the U.S. North Central as a part of the U.S. total is clearly declining as indicated in Figure F.4.22. In the magazine and book printing/publishing the share seems to remain at current level.
-46-

50
,...
... 30 z
III S !: = .. ..
20 ;:) .. 0
-. 10
. " . . <c< .,. <cc . cc< <cc + ccc + • < < < .. + <c< + + <c< <c< <c< + .. < c < + .. <c< + <c< + -:« .. + «< • • <c< + «< + cc< + .. < < < + + <c< + «< + «< + .. <c. .. .. cc< + «" .. <c< + + < c c .. + <c< + <c< + <c< + + <c< • + <:« + cc< + «< + + «< .. + «< + ,« + «< + + <cc • • <cc + <c< + c« + + <c .. .. .. <c< + «< + «< .. + <c< • + c« + c« + «< .. + <c< • .. - «< + «c + «< + + «< .. + <c< .. ~ < < + «< .. + «< .. + «< + <c< + «< .. + «"'= .. .. «< + <cc + «< • + «< · •
40
o UI1 12 11
.. AGAZINEI CATALOGS
,.. • < < ;« ,... <c< ..:« • • -:;. < (. .. ~« • + ;« + : < < • + ~« + : < < • + :::« + : < < • + : < < + :« .. + ~« + . c. • + ~« • :.« .. + : < < + : < < .. + :« + : < < • • ~ < < .. :« • + : < < + !« • .. : < < + : < < .. • : <., + : c • .. , ...::<<. ~
.2 17
INSERTII .. AILIRS
~ «< <c< <c< ,... «< <c< • + «< + <c< .. .. c« + <c< I + ~« + «< .. + «< + <cc .. .. «c + ccc .. .. <c< + «c .. .. «< .. «< .. + «< + «c .. .. «< + «< .. .. ccc + «< .. + c« + «< .. I
U 17
OTHER CO ..... PRINTING
I <c < .. ~« • + c<. + < < < .. + <c< + ,,< < .. .. «< + <c< · + <c< + < < c • + «< .. «< .. + «< + «< · + «< .. <c< .. + c« + «< • + ce. I ...;<~ . U 11
lOOKS
Figure F.4.22. END-USE INDUSTRIES SHARE OF THE TOTAL U.S. SHIPMENTS IN THE U.S. NORTH CENTRAL REGION.
Based on the growth in the major SC-paper end use industry, decline in the importance of the North Central region as a major printing/publishing area and the increased penetration of SC-paper in the U.S. printing industry, we have estimated that the demand of SCpaper will reach annual 500,000 tons per year 2000.
-47-

After the start-up of the new Lake Superior paper machine, this region will be a net exporter of SC-paper in the late 80's and early 90's. However, the demand will exceed the domestic production in the 90's and the estimated imports demand in year 2000 will account for about 200,000 tons/year (Figure F.4.23).
800
500
300
200
100
o 1985198619871988198919901991 199219931994199519961997199819992000
"Ar C Ol~nd + Donn •• Ue ProdueUon
Figure F.4.23. ESTIMATED U.S. NORTH CENTRAL SC-PAPER DEMAND AND PRODUCTION.
-48-

Major importers of SC-paper to the North Central region in 1985 are listed in Table T.4.6.
Table T.4.6. Main Competitors in the U.S. North Central SC-Paper Markets (1985)
1. U.S. North East * Champion, NY * Madison Paper, ME
2. Ontario and Quebec * St. Marys Paper, ON * Abitibi-Price, PQ * Consolidated-Bathurst, PQ
3. Europe * Finnpap, Finland * Haind1, Fe1dmUh1e, Germany F.R.
1000 tons/year 40
30
20
Grade SC-B
SC-B
SC-A SC-B
Major printers and publishers in the U.S. North Central region are shown in Table T.4.7.
-49-

Table T.4.7. Major U.S. North Central Printers/Publishers
1. Meredith, Des Moines, IA * Magazine publisher * Magazine, insert/mailer and catalog printer
2. Penton/I PC , Cleveland, OH * Magazine publisher
3. Hartcourt Brace, Cleveland, OH * Magazine publisher
4. R.R. Donnelly, Chicago, IL * Magazine, catalog, insert/mailer printer
5. World Color Press, Effingham, IL * Magazine, insert/mailer printer
6. Brown Printing, Waseca, MN * Magazine, catalog printer
7. Quad Graphics, Chicago, IL * Magazine printer
8. W.F. Hall, Chicago, IL * Magazine, catalog printer
9. Target Stores, Minneapolis, MN * Insert/mailer user
10. GFV Communications, Livonia, MN * Insert/mailer printer
11. Sears, Chicago, IL * Insert/mailer user and catalog printer
12. Federated Dept. Stores, Cincinnati, OR * Insert/mailer user
13. Dayton Hudson, Minneapolis, MN * Insert/mailer user
14. Montgomergy Ward, Chicago, IL * Insert/mailer user
15. May Dept. Stores, St. Louis, MO * Insert/mailer user
16. The Kroger Co., Cincinnati, OR * Insert/mailer user
17. John Blair, Elk Grove, IL * Catalog printer
18. Webb Co. " Minneapolis, MN * Catalog printer
19. Speigal, Chicago, IL * Catalog printer
20. Fingerhut, Minnetonka, MN * Catalog publisher
21. Lane Bryant, Indianapolis, IN * Catalog publisher
-50-

4.2.7.3 u.s. west South Central SC-Paper Markets
The printing and publishing industry region is currently undeveloped. The GNP was in 1985 estimated to 10 printing/publishing industry only shipments.
in the region's
percent,
U.S. ~est South Central share of the total U.S. but the share of the
6 percent of the total U.S.
SC-paper demand is estimated to be 30,000 tons, of which 25,000 tons were imported from Europe (Figure F.4.24).
> > ~
> > > > ... > > > > > > > > -------; > > >
IURO,. ZI
OTHIR US IIIGIONS
•
Figure F.4.24. ESTIMATED U.S. ~EST SOUTH CENTRAL SC-PAPER DEMAND/SUPPLY STRUCTURE IN 1985.
The end use industry in this region is growing faster than in the U.S. on average as illustrated in Figure F.4.25. However, due to the low total printing paper demand and rather high current penetration of SCPaper, the SC-paper demand is growing remarkably slower than in the U.S. West region. The estimated demand in year 2000 is only about 100,000 tons. There are no plans to start production of SC-paper in this area before the year 2000.
-51-

50 -
40 -It ... Z ... :I A. 30 i -It
It :::I .. 0
~ 20 -
10 - -i < « • .... «<
' .. ~ «< ..
«< < < < ... .. «< .. .. «< .. «< + < < < ... ..
o 12 11 12 11
MAGAZINI!I CATALOGI
-<~ • . .. «< .. • «< .. «<
12 17
INIIRTII MAILlR'
«< .. «< .. .. «< .. «< .. .. «< .. 12 17
OTHIR COMM.
'RINTING
--~ • < < < .. .. «< .. < < < .. .. «< + < < < 1. • «< .. 12 17
lOOK I
Figure F.4.2S. U.S. WEST SOUTH CENTRAL END USE INDUSTRIES SHARE OF THE TOTAL U.S. SHIPMENTS.
-52-

• c: 0 t-O
8 ...
600
500 -
400 -
300 -
200 -
o 198519861987198819891990199119921993199419951996 1997 199819992000
Vur
C Demond + DomestIc: Produc:tlon
Figure F.4.26. ESTIMATED U.S. YEST SOUTH CENTRAL SC-PAPER DEMAND
Currently the largest off-shore exporters of SC-paper to this region are Finnpap from Finland and FeldmUhle from Germany. Lake Superior, Duluth, HN mill will be a strong competitor also in the U.S. West South Central region after the start-up of the new paper machine.
The major users of printing paper in this region are listed in Table T.4.8.
Table T.4.8. Major U.S. West South Central Printers/Publishers
1. The Southland Corp., Dallas, TX * Insert/mailer user
2. wal-Mart Stores, Bentonville, AR * Insert/mailer user
3. T.G. and Y. Stores Co., Oklahoma City, OK * Insert/mailer user
-53-

4.2.7.4 summary of the Western U.s. SC-Paper Markets
A strong competition will appear on the Western U.S. SC-paper markets during the next 5 years. This is caused by the new capacity coming on stream in the U.S. and Eastern Canada, when simultaneously import demand will both in tonnage and percentage wise be healthiest in U.S. West, where the demand is estimated to grow by more than 200,000 tons by the year 2000. As shown in Table T.4.9 by the end of the century import demand of SC-paper will grow in the Western U.S. markets to 0.55 million tons in spite of the new capacity additions.
Table T.4.9. Estimated Western U.S. SC-Paper Import Demandx)
1985 1992 2000 (1000 tons/year)
U.S. West U.S. North Central U.S. West South Central
50 90 30
130 10 60
270 180 100
TOTAL 170 200 550 x) Includes shipments from other U.S. regions.
4.2.8 Pacific Rim se-Paper Markets
4.2.8.1 Japanese Se-Paper Markets
The supply to the Japanese Se-paper markets is dominated by Finnpap from Finland, which accounted for more than 55 percent of the total 160,000 ton demand in 1985 (Figure F.4.27). Another important supplier was West Germany - Fe1dmUhle and Haindl - with 10,000 tons. Currently the only domestic Se-paper producer is Oji Paper in Tokomai with the capacity of 65,000 tons/year.
-54-

"NLAND 10 »»),»,»»»»,»»»»
»»»,»»»»»»»»»,; »»»~»»»»»>,» » ,. »,,) »> »)>~
»> DTNIO 10 ~:~.~:.~--------~~~~~ »,' »> »> »> »> »> •• > > •• » • •• > > •• ••• ••• ••• > ••
"'."'.,-:.~."".,,:,.,,:,. '=" •• ~.:-:.:-:.'I:.~ •• ~I::: : : ';":';";';";''';'''';''..;,' .;,;.;,.; ............. ' : : ,. : : : » )'») ), »,» » >,»> » »»> » »») » )'») ), ,,») ), »») » ,»» .. . •• •• >. >. n
DIWAND 110
•• ::)~~~~~~~~ )",,),),),>,,),»:
Figure F.4.27. SC-PAPER DEMAND/SUPPLY STRUCTURE IN JAPAN IN 1985
Although there are no announced or planned SC-paper capacity additions in Japan, the market demand development could provide for a new 110,000 annual ton machine to come on stream in year 1995. Other miscellaneous domestic net improvements will account for an additional 10,000 tons capacity during the next 13 years.
The catalog and directory business is expected to be the fastest growing SC-paper consuming sector in Japan with an estimated 8 percent/year growth to 1995 and 6-7 percent from 1995 to year 2000. Also the healthy growth in the magazine publishing and printing industry, about 4 percent/year, will effect and support a 6 percent/year growth in SC-paper demand.
-55-

• c: o ....
600
500
400
o 300
8 ...
200
100
o 1985198619871988198919901991 199219931994199519961997199819992000
Ve.t'
C Oemond + Oomestic Production
Figure F.4.28. SC·PAPER DEMAND AND PRODUCTION IN JAPAN
Major SC·paper consumers are listed in Table T.4.l0.
TableT.4.l0 Major Japanese SC·Paper Consumers
Printers: Toppan Printing Dainippon Tosho Printing Kyodo Printing
The net import of SC-grade paper to Japan is estimated to 150,000 tons in 1992 and 120,000 tons after the start-up of the assumed new SC-paper machine.
-56-

4.2.8.2 Se-Paper Markets in the Republic of Korea
The most obvious characteristic of the Korean paper and board industry is its rate of expansion production passed the one-million level in 1974 and reached 2.3 million tons in 1985. Growth in output has slowed down over the past few years but is still faster than in most other papermaking nations.
The raw material situation has been a long term problem in Korea. Pulp imports, 680,000 tons in 1985, have been the major source of supply for many years, thus subjecting the mills to fluctuations in the international pulp business. Partly as a consequence of the dependence of import pulp, the paper industry has turned to using waste paper. Currently imports account for 50 percent of the waste paper consumption, due to the lack of organized waste paper collection.
Paper and board imports, some of which have been restricted by the state, have been gradually increasing over the years, but are still remarkably low. In 1985, the total paper and board imports were 89,000 tons, most of which were kraft liner and special papers (high chemical pulp content). Groundwood printing and writing papers are supplied by domestic producers and for years the imports of uncoated or coated groundwood papers and newsprint have been negligible. Additionally the new Chonju Paper Mfg. Co. Ltd.'s newsprint machine has caused overcapacity in newsprint markets and prompted newsprint mills to allocate greater machine time to the uncoated groundwood paper production.
The SC-type paper demand in Korea is currently estimated to be 120 tons per year for magazines. Hong Won, Chonju and Moorim paper mills are now manufacturing this grade (Table T.4.11).
Table T.4.ll. Domestic SC-Paper Capacity in the Republic of Korea
1. Hong Won Paper Mfg. Co., Ltd., Pyungtaek-Cun 2. Chonju Paper Mfg. Co., Ltd., Chonju 3. Morrim Paper Mfg. Co., Ltd. Daegu
TOTAL
1000 tons/year
46 40 42
(1) Most of the production is freesheet printing and writing paper.
The demand of SC-type printing and writing paper in Korea is estimated to grow to 30,000 tons by the year 2000. However, it is most likely that this will be supplied by domestic producers, and the imports demand will remain at the current very low level.
-57-

4.2.8.3 SC-Paper Markets in the people's Republic of China
The printing and writing paper consumption in the People's Republic of China reached 1,910 million tons in 1985. Only 70,000 tpns of this was imported, mainly from Scandinavia, the rest being produced domestically in many small mills in many cases using also non-wood fibers.
SC-paper demand was only about 1,000 tons in 1985 and it was used mainly for export oriented magazines. The increased demand of magazines will cause the SC-paper consumption to increase to about 40,000 tons by the end of this century. It is assumed that all of this paper will be imported. The major competitors in these SC-paper markets will be the Republic of Korea and the Scandinavian countries (Finland and Norway).
4.2.8.4 Summary of Pacific Rim SC-Paper Markets
Total usage of printing and writing paper in Japan, Republic of Korea and People's Republic of China was about 7 million tons in 1985. The paper markets in these countries are largely self-sufficient, and the countries are net exporters of printing and writing papers - import 160,000 tons and exports 420,000 tons in 1985.
SC-paper is currently consumed mainly in Japan but is a growing grade in the other two countries. The estimated SC-paper imports demand in the selected three countries as well as in the other Pacific Rim countries is summarized in Table T.4.12.
Table T.4.12. SC-Paper Import Demand in the Pacific Rim Countries
Japan Republic of Korea People's Republic of China
TOTAL Australia New Zealand Singapore Hong Kong Malaysia Indonesia Taiwan Thailand Philippines
TOTAL
-58-
1985
100
1
101 SO
2 2 2 5 5
66
1992 1000 tons/year
150
20
170
Not Calc.
2000
120
40
160
Not Calc.

4.2.9 Summary of SC-Paper Markets
Currently the SC-paper markets in the selected market areas are 450,000 tons/year. We have estimated that these markets will grow to 1.4 million tons/year by year 2000. The import demand to the market areas will grow from the current 270,000 tons/year level to 800,000 tons/year. The growth predictions on the markets, both for total growth and imports, are based on the anticipated structure changes of end users for the grade in the regions, a continuing trend of the growth in the previous years and the local production capacity developments including the opportunity by the market for new machines.
Of the market included in the study, the U.S. and Japanese markets provide opportunities for additional capacity, both markets showing a healthy growth trend and an adequate volume for profitable penetration. Both the Chinese and Korean markets can for the time being be neglected due to their small size.
The total demand for the Western U.S. and Japanese markets was in 1985 440,000 tons and 270,000 tons of that was imported. The outlook for year 1992 and 2000 shows an increase in demand to 705,000 tons and 1.33 million respectively. At the same the import demand will grow 330,000 tons in 1992 and 820,000 tons in year 2000, already considering an additional new machine in Japan, capacity 110,000 tons/year, and another one on the Western U.S. market, capacity 200,000 tons/year.
As shown in Table T.4.13, the European SC-paper producers, among them Finnpap and FeldmQhle, distribute their paper worldwide while the North American shipments are directed entirely to the domestic markets.
Major North American producers are Champion, Madison Paper and Great Lakes of the U.S. companies and St. Marys, Consolidated-Bathurst, Abitibi-Price and CIP of the Canadian companies.
-59-

Table T.4.13 Main Competitors in the SC-paper Markets in 1985
Quebec U.S. Finland & North &
Market Area Ontario East Germany (1000 tons/year)
1. Domestic 2 2 2. U.S. West 2 20 30 3. U.S. North Central 30 40 20 4. U.S. West South Central 5 25 5. Japan 90 6. South Korea 7. China 1
TOTAL 34 65 168
Table T.4.13.A. SC Market Outlook in Selected Market Areas
Demand Prod. Import Export (1000 tons/year)
Market Area '85 '92 '00 '85 '92 '00 '85 '92 '00 '85 '92 '00
Domestic 4 15 30 0 0 0 4 15 30 0 0 0 U.S. West 50 110 300 0 0 0 50 110 300 0 0 0 U.S. North
Central 200 310 530 110 330 340 90 0 190 0 20 0 U.S. West
South Centro 30 55 100 0 0 0 30 55 100 0 0 0 Japan 160 230 400 60 65 170 100 165 230 0 0 0 Republic of
Korea 1 10 30 1 10 30 0 0 0 0 0 0 People's Rep.
of China 1 20 40 0 0 0 1 20 40 0 0 0
TOTAL 446 750 1430 171 405 540 275 365 890 0 20 0
-60-

4.3
4.3.1
Coated Groundwood Papers
Classification of Coated Papers
In North America coated papers are generally divided into two main groups depending on whether the paper is coated on one side (ClS) or on two sides (C2S). ClS-paper is generally coated freesheet and used mainly for labels.
C2S papers range in quality downward from a super-premium grade, representing the most expensive and high quality sheet, to No. S coated at the other end of the scale. Super-premium and No. 1 , 2 and 3 coated are essentially based on chemical pulps, while No.4 could contain a large amount of mechanical pulp, and No. 5 contains actually only mechanical pulp. Currently about 55 percent of No.4 coated is groundwood based, the rest being coated freesheet. 97 percent of No. 5 coated is groundwood based. No. 5 is the most important grade in terms of tonnage, and successively each higher quality grade contains a smaller supply than the corresponding lower quality one.
The North American classification system for coated papers is presented here under in Table T.4.l4.
Table T.4.l4. Classification of Coated Papers in North America
% Coated Groundwood Typical
Grade No. Papers End Uses Brightness
Super-premium 0 Annual Reports 88+
No. 1 0 Annual Reports 85-88
No. 2 0 Expensive 78-82 Advertising
No. 3 0 Advertising 79-83
No. 4 55 Magazines 72-78
No. S 97 Directories 68-72 Cataloges, Magazines
-61-

In Western Europe coated groundwood papers are divided as follows:
1. Heavy weight coated (HWC)
2. Medium weight coated (MWC) 73 g/m2 and +
3. Light wei~ht coated (LWC) 46-72 g/m
4. Ultra light weight coated (ULWC) 45 g/m2 and less
The Western European LWC is very close to the No. 5 coated, although a small tonnage of No.5 papers have higher basis weight than 73 g/m2. MWCjHWC grades are related to the North American No.4 coated.
The Japanese classification system differs both from the North American and Western European ones as shown in Table T.4.l5.
Table T.4.15 Classification of Coated papers in Japan
Grade
Art paper (A1)
Standard coated Freesheet (A2)
Groundwood (B2)
Lightweight coated Freesheet (A3) Groundwood (B3)
Other coated grades
Chemical Pulp Percent
90-100
90-100
40-90
90-100 40-90
70-100
End Uses
Annual reports, catalogs other high-quality printing
Advertising materials, illustrated books Catalogs, other commercial printing
Books, brochures, magazines catalogs, Commerical printing
Various purposes
The groundwood based, standard coated B2-grade corresponds to the North American No. 4 coated and groundwood based, lightweight coated (MWC) B3-grade to No.5 coated (LWC).
-62-

4.3.2 u.s. Coated Groundwood Paper End Uses
The end use markets for coated groundwood papers are largely the same printing and writing houses that consume uncoated groundwood papers and coated freesheet grades (Figure F.4.4). At the lower end the most essential competitor is supercalendared (SC) paper, which is an alternative grade to coated groundwood in magazines, catalogs, inserts/mailers, etc. The biggest benefit of SC-paper is its costcompetitiveness, while the high quality is the main advantage of No.5 coated. For the higher quality grades of coated groundwood, mainly in the high quality advertising, the main competitor is No. 3 coated paper. In the future also the pigmented grades will be competing in the same end users.
The main end use segments of coated groundwood papers are:
magazines books other converting catalogs inserts/mailers other commercial printing
These end use sectors are discussed in detail in Section 3.2.2. and the following is only a summary of coated groundwood paper usage in the main end use sectors.
MAGAZINES
The most important market for No. S coated paper (LWC) is magazines, which represents about S6 percent of the total demand of this grade. It means that the trends in the magazine industry dictates the trends in the No. S coated demand. The strongest competition for No. S coated in the future will come from SC-paper. Several magazine publishers have already opted for additional consumption of SC-paper, and the attractive price structure may convert other publishers in the same direction. In high quality special magazines the use of No. 4 and No. 3 coated paper is increasing and that forms threat to No. S grade. In our forecast the market share for No. 5 coated will drop from the current 70 percent level to 68 percent and the share of No. 4 will remain at the current 12.4 percent level. As to tonnage, the demand of No.5 grade will grow from 1.75 million tons in 1985 to about 2.7 million tons by the year 2000, as illustrated in Figure F.4.29.
-63-

8
5 I COATED NO.4
en ~ COATED NO.'
Z '" ~ MAGAZINES TOTAL 0 l-I&. 0 3 cn z 0 ::i 2 :! ::I
1
1985 1991 2000
Figure F.4.29. COATED GROUNDWOOD USAGE IN MAGAZINES
BOOKS
The consumption of high quality coated groundwood paper in books will remain at a comparably low level. The annual demand of No. 5 grade for books is estimated to grow from 60,000 tons/year in 1985 to about 120,000 tons by year 2000 and No. 4 from 120,000 tons to 160,000 tons correspondingly.
OTHER CONVERTING
Also in other converting sectors, which include check printers, gummed paper converters, foil laminating, gift wrap converters, etc., the consumption of No. 5 coated is low, 70,000 tons in 1985 and by the year 2000 the demand is estimated to slightly exceed 100,000 tons/year. The consumption of No.4 grade in these sectors is negligible.
-64-

CATALOGS
The catalog business is an important consumer of both No. 5 and No.4 coated papers and the market shares of these grades in 1985 were 40 percent and 18 percent correspondingly. We have assumed that No.5 coated paper will maintain its 40 percent market share and that No.4 will slightly increase its market share from 18 percent to 19 percent mainly gaining shares from uncoated freesheet. The growth in terms of tonnage is shown in Figure F.4.30. No.5 demand should grow from about 0.7 million tons to 1.2 million tons/year and No.4 should double from the current 0.3 million tons/year by the year 2000.
e
I I COATBD NO.4 8
~ COATED NO. I ., z 4 0
f7L2] .. CATALOGS TOTAL .. 0 ., 3 z 0 ::i
= 2 a
1
1188 1111 2000
Figure F.4.30. COATED GROUNDWOOD USAGE IN CATALOGS
INSERTS/MAILERS
The insert/mailer industry is a medium growing segment, growth 4.4 percent/year. Additionally No.5 coated paper will increase its share from the current 42 percent level to 58 percent by year 2000. In tonnage terms this corresponds to a growth from 470,000 tons to about
-65-

1.2 million tons (Figure F.4.3l). The main reason for the estimated sh are increase of No. 5 coated is the superior printing quality of coated paper compared to uncoated groundwood (improved news). Especially in special advertising, a good appearance is very important.
e
I COATED NO.4 5
~ COATED NO. I
., 4
~ z INSERTS/MAILERS TOTAL 0 t-tl. 3 0 ., z 0 ::::i 2 oJ
i
1
1185 1991 2000
Figure F.4.31. COATED GROUNDWOOD PAPER USAGE IN INSERTS/MAILERS
OTHER COMMERCIAL PRINTING
This category includes all commercial printing grades other than catalog, directory and insert/mailer printing. The segment is the largest user of printing and writing paper in U.S. 3.7 million tons in 1985. From the coated groundwood paper point of view this segment is not very important: in 1985 the share of No. 5 coated was 4 percent and No.4 5.6 percent of the total paper demand and in terms of tonnage 150,000 tons and 210,000 tons correspondingly. By the end of this century the demand of No. 5 is estimated to grow to 360,000 tons/year (6 percent market share) and No.4 to 330,000 tons/year.
-66-

SUMMARY OF COATED GROUNDWOOD MARKETS IN THE U.S.
The summary of U.S. coated groundwood paper demand in 1985, 1992 and 2000 is illustrated in Figure F.4.32.
e
6 I COATED NO.4
bSSj COATED NO. I
CIS .-Z 0 l-II. 0 3 CIS z 0 :::;
2 ..J
i
1
1985 1991 2000
Figure F. 4.32. U. S. COATED GROUNDWOOD PAPER DEMAND
Coated No.5 paper should grow on average 4.8 percent/year from 3.2 million tons in 1985 to about 5.8 million tons in year 2000. The three main end use segments magazines, catalogs and inserts/mailers - is estimated to maintain the 90 percent share of the total demand of the No. 5 grade.
About 55 percent of No. 4 paper output was coated groundwood in 1985 and the ratio should remain unchanged the next 13 years. The demand of No. 4 coated groundwood paper is estimated to grow from the current 520,000 tons to about 860,000 tons by 2000.
-67-

PACIFIC RIM MARKET END USES
In the Pacific Rim market area Japan dominates the coated groundwood markets as shown in Table T.4.l5.
Table T.4.l5a Coated Groundwood Demand in the Pacific Rim Markets
Japan Republic of Korea People's Republic of China
TOTAL
1000 tons/year
600 80 20
700
About 40 percent of B3-grade coated paper (LWC) is consumed in magazine printing, another 40 percent in the advertising business (catalogs, inserts/mailers) and the remaining 20 percent for various other purposes. In the Republic of Korea and in the People's Republic of China almost all of the LWC type paper is used in magazines and export product catalogs.
4.3.3 Light Weight Coated (LWC) Papers
Light weight coated (LWC) paper is selected to represent coated groundwood grades in this study due to the following reason: (note that the term LWC is used also for No. 5 coated in the text following)
* The current markets of LWC-paper are big worldwide * The growth in the LWC-markets is healthy and in volume very large
(2.6 million tons by year 2000). * LWC-paper is a semi-commodity product, and is not as specialized
grade as MWC/HWC-grades.
Quality wise light weight coated paper is basically divided into two subcategories: offset-LWC (40 lb) and gravure-LWC (34 lb). The offset grade is currently the fastest growing sector due to its superior quality and the expansion of end use sector. Especially in Europe which has to be considered as a forerunner in LWC market enhancement, a lot of development has been done to further reduce the basis weight of LWC-paper. Presently for example Burgo in Italy is already producing an Ultra Light Weight Coated paper (40 g/m2).
4.3.4 World LWC-Paper Demand/Supply
World consumption of coated groundwood paper was in 1985 slightly over 7.5 million tons. As shown in Figure F.4.33, about 90 percent of the total consumption resides in the two primary consuming regions - North America and Western Europe. Other major regions include Japan, about 4 percent, and Eastern Europe, about 3 percent.
-68-

4.0
3.1
3.2
2.8
en z 2.4 0 t-U. 2.0 0 en z 0 1.1 ::; -' i
1.2
0.8
0.4
0 v ••
CAIIADA
~ SUPPLY
c::::J DEMAND
JAPAII OCIAlltA LA Till A'lttCA AIiIItICA
Figure F.4.33. REGIONAL COATED GROUNDWOOD PAPER DEMAND/SUPPLY IN 1985
Coated groundwood grades will continue their healthy growth, although the annual growth rate is estimated to drop from 9 percent a year in 1975-1985 to about 5 percent/year in 1985-2000. Regionally the growth rates in North America and Western Europe will be the lowest, 4.5 percent/year and 4.2 percent/year correspondingly, 6.3 percent/year in Japan and slightly over 10 percent/year in the other regions. As shown in Figure F.4.34 the consumption will reach the 10 million ton mark by the year 1991 and will be about 15.5 million tons by 2000.
-69-

• c: 0 I-0
8 ...
14000
13000
12000
11000
10000
9000
8000
198519861987198819891990 19911992 19931994199519961997199819992000 v..r
C Oemand + Copocity
Figure F.4.34. WORLD COATED GROUNDWOOD DEMAND/CAPACITY
The current coated groundwood paper capacity is about 9 million tons per year (Appendix A.4.3) The announced and planned coated groundwood projects account currently for 3.2 million tons, which indicates that the capacity in 1991/92 should be about 12.2 million tons (Appendix A.4.4.) The demand/supply balance indicates that the coated groundwood paper products, especially LWC, are expected to run at 85 percent or lower capacity utilization through the later 80's and early 90's.
4.3.5 World Coated Groundwood Paper Trade
The major coated groundwood paper trade flows in the world in 1984 are illustrated in Figure F.4.35. Similarly as for the SC-paper market, Western Europe represents the key source for the trading tonnage of this grade, with outflows to most world locations.
-70-

Figure F.4.3S. SCANDINAVIAN AND WESTERN EUROPEAN COATED GROUNDWOOD SHIPMENTS IN 1984.
North America is the (240,000 tons), with Within North America between the U.S. and
prime buyer of European coated groundwood paper supplies of 190,000 tons to Asia and Oceania.
close to 50,000 tons of this grade are traded Canada.
The price of No.5 34 lb rotogravure coated groundwood was in 1985 930 USD/short ton and No.5 40 lb offset 840 USD/short ton (Figure F.4.l7). In 1986, the prices were declining and the 3rd quarter list prices were already about 80 USD/short ton lower. In February 1987 Champion International Corp. and Consolidated Papers Inc. reportedly further lowered No.5, 40 lb to 680 USD/short ton.
The prices are estimated to further fluctuate decline due to overcapacity in the LWC-paper supply.
-71-

4.3.6 Domestic LWC-Paper Markets
Miramichi Pulp and Paper Inc., South Nelson mill in New Brunswick that was started up in 1986, is the first paper mill in Canada dedicated to the produciton of LWC-paper. Previously LWC and other coated groundwood grades have been produced by Kruger Inc. at Trois Rivieres in Quebec and by Abitibi-Price Inc., at Thunder Bay in Ontario. The Kruger mill has a capability to produce also LWC while the Abitibi mill produces only other coated groundwood grades. This production structure has also resulted in the low reported consumption of LWCpaper, only 30,000 of LWC tons out of 180,000 tons of coated groundwood papers total in 1985. However, it is probable that the actual consumption of LWC-type paper is higher than 30,000 tons - we have estimated 130,000 tons in 1985. This estimate is based on the coated groundwood paper demand structure in the U.S.: about 75 percent No.5 coated (LWC) and the remaining 25 percent No.4 coated (MWC).
The end useres of LWC-paper, printers and publishers, are highly concentrated to Ontario and Quebec. About 75 percent of magazines publishing industry is located in these two provinces and only about 21 percent in Western Canada. Based on the location of the end use industry, we have estimated that the LWC-paper demand in Western Canada is about 27,000 tons per year. Most of this, 21,000 tons, is supplied by the domestic producers (Figure F.4.35a). The main foreign supplier is the U.S.
-72-

IMPORTS 8
OTHER ,...---------4 CANADIAN
PROVINCES
DEMAND 27
21
Figure F.4.35a. DOMESTIC MARKETS: ESTIMATED LWC-PAPER DEMAND/SUPPLY STRUCTURE IN 1985.
The growth in the LWC-paper demand in Canada, 5 percent per year is higher than in the U.S. One reason for this is the fact that some U.S. retailers and publishers buy more paper in Canada, print their inserts there, and then ship the completed jobs to the U.S. In Western Canada the LWC-paper demand is estimated to grow with the same 5 percent per year rate. In tonnage terms the demand will reach 60,000 tons by 2000.
Makin Pulp and Paper Ltd., has announced plans to built a 135,000 tons per year LWC-paper mill at Britannia Beach area in British Columbia. Originally this machine was planned to start up late 1988. However, the construction has not yet been started and it is probable that the project will be postponed or canceled. There are no other announcements or plans to build LWC-paper capacity in Western Canada.
-73-

4.3.7 western u.s. LWC-Paper Markets
4.3.7.1 u.s. west LWC-Paper Markets
The analysis of the printing and writing paper end uses indicates that the LWC-paper demand in the U.S. West is 430,000 tons per year. James River at West Linn, OR is the only LWC paper manufacturer and produces about 100,000 tons of LWC on one machine. The rest of the demand is supplied mainly by the U.S. producers east of the Rocky Mountains. The off-shore imports of LWC-paper in 1985 was about 20,000 tons as shown in Figure F.4.36.
AAAA~AAAAA~AAAAAAAAAAAAAAAAA
AAAAAA.A"AAAAA"AA"A,.",.A,.,.AA,." AAAAAAA,.A""AAAAAAAA.AAAAAAAAA AAAAAAAAAAAAAAAAA~AAAAAAAAAAA
AAA,. AAA" A It. It. AAAIt. AAAI AAAIt. A It. It. AAA~ AAIt. AAAIt. AAIt. ~AAA AAIt. AAAIt. AAA' AAAIt. AAAI AAAA AAAI AAAIt. "AAI AAI AAAI' AA", AAA 14""1., AAA AA,., AAA AAAI AA", AAA AAA AAA AA ,
AA AA AA. AA. AA loA AA loA loA "A
:~;~' \ ::~A~A~AA~A~A~A~A~A~A~A~A~A~A~A~"~AA~"~A~A~A~A~A~A~TATAATA~A~A~AMAMA~A~A~A~ATA~AA~A~A~AMA;A;A;A~ATA~ AAAAAAAAAAAAAAAAAAAAAAAAAAAAAAAAAAAAAAAAAAAAAAAAAAAAAAIt.
4AAAAAAAA AAAAAAA" AAAAAAAA"""AAA"",A'" It. It
~ .... __ I_~
Figure F.4.36. ESTIMATED U.S. WEST LWC-PAPER DEMAND/SUPPLY STRUCTURE IN 1985.
Although currently there are no plans to increase the LWC-capacity in the U.S. West region, the market demand/supply situation could provide for a new 200,000 ton a machine going on stream in 1992 (Table T.4.16).
-74-

Additionally the regional capacity will increase 1 percent/year or total 20,000 tons by year 2000, due to the continuous trimmings and speed-ups of the existing machines.
Table T.4.16. U.S. West Domestic LWC-Paper Capacity
Capacity in 1985:
James River, West Linn, OR
No announced new capacity Assumed new paper machine Net improvements
Estimated capacity in year 2000
(1992)
1000 tons/year
110
200 20
330
The printing and publishing business is estimated to grow in U.S. West faster than U.S. average. This combined with the substantial growth of the LWC-paper end use segments results in the predicted 5 percent/year growth in LWC-paper demand on up to year 2000 (Figure F.4.37).
-75-

• c: 0 ....
0
8 ..
1500
1400
1300
1200
1100
1000
900
800
700
800
500
400
300
200
100
0
198' 19881987 198819891990 19911992 19931994199519981997 199819992000 YII,.
C Demand + Domestic ProductIon
Figure F.4.37. U.S. WEST LWC-PAPER DEMAND AND DOMESTIC PRODUCTION
The import demand to U.S. West will be about 500,000 tons in 1992 and 700,000 tons year 2000.
The main "exporters" of LWC-paper LWC-paper producers: Consolidated, River, etc. The most important Finland and FeldmUhle from Germany.
to this region are the major U.S. Champion, Weyerhaeuser, Mead, James off-shore sources are Finnpap from
Because LWC-paper competes with SC-paper in the magazine, catalog and insert/mailer business, the main consumers of LWC-paper are basically identical to the potential users of SC-paper listed in Section 4.2.7.1.
4.3.7.2 u.s. North Central LWC-Paper Markets
The U.S. North Central region is currently nearly self-sufficient with regard to LWC-paper (Figure F.4.38). Off-shore imports totalled 10,000 tons in 1985 which is considered negligible or of minor importance compared to the total 1.21 million tons/year demand.
-76-

AAAAAAAA.AAAAAAAAAAAAAAAAAAAAAA AAAAAAAAAAAAAAAAAAAAAAAAAAAAAAAAA AAAAAAAAAAAAAAAAAAAAAAAAAAAAAAAAAA AhAAAAAAAAAAAAAAAAAAAAAAAAAAAAAAAA AhAAAAAAAAAAAAAAAAAAAAAAAAAAAAAAAA AAAAAAAAAAAAAAAAAAAAAAAAAAAAAAAAAA AAAAAAAAAAAAAAAAAAAAAAAAAAAAAAAAAA AAAAAAAAAAAAAAAAAAAAAAAAAAAAAAAAAA AAAAA~AAAAA\AAAAAAAAAAAAAAAAAAAAAA AhAAAAAAAAAAAAAAAAAAAAAAAAAAAAAAAA AhAAAAAAAAAAAAAAAAAAAAAAAAAAAAAAAA AhAAAAAAAAAAAAAAAAAAAAAAAAAAAAAAAA A.A.......... ~AAAAAAAAAAAAA AhAAAAAAAAAA AAAAAAAAAAAA AAAAAAAAAAA AAAAAAAAAAAA A~AAAAAAAAA~ AhAAAAAAAAAA AhAAAAAAAAA AAAAAAAAAAAA AAAAAAAAAAA~ AAAAAAAAAAAA AhAAAAAAAAAA AAAAAAAAAAAA AAAAAAAAAAAA AAAAAAA"AAAA AA"AAAAAAAA'" AAAAAAAAAAAA. AAAAA"AAAAAA AA.AA"AAA"AA". AAAAAAAAAAAA AAAAAAAA"AAA AA~AAAAAAAAA AAAAAAAA"AA" AAAAAAAAAAAA A"AAAAAA AAAAAAAAAAAA '~AAA AAAAAAAAAAAA ~
AAAAAA.AAAAAA AAAA"AAAAAAA AAAAAAAAAAAA A.A.AAA""""A"" "AAIt.""AAAAA" Alt.AA"AA"lt.A"'" AAIt."A""AAAAA
::::::::::::~A~A~'~A~A~A~A~A~'~ AAAAAAAAAAAAAAAAAAAA "AAAAAAAAAAAAAAAAAA "AAAAA"A""""AAA"AAA AAAA"AAAAA"AAAA""A AAA"AAA"AAAAAA"AAA AAAAAAAA""A"A,,"A"" A"AAA"AAAAAAAAAAAA AAA"AAAAA"AA"A"AAAA
.A"A"A"AA""AAAAAA""" AAAAAA"AAAAA"AAAAAAA
AAA"AAAAAAAAAAAAAAA
OFF-SHORI! 10
OTHIII U.IIIOION.
10
Figure F.4.38. ESTIMATED U.S. NORTH CENTRAL LWC-PAPER DEMAND/SUPPLY STRUCTURE IN 1985
The current LWC-capacity as well additions are shown in Table T.4.l8.
as the estimated new capacity
Table T.4.1S. U.S. North Central Dome.tic LWC Production Capacity
Producer
1. Blandin Paper Co., Grand Rapids, MN 2. Champion International, Sartell, MN 3. Consolidated Papers, Wisconsin Rapids, WI 4. Consolidated Papers, Whiting, WI 5. Mead Corp., Escanaba, MI 6. Midtech Paper Corp., Kimberly, WI 7. Pentair Industries Inc, Niagara, WI TOTAL
Capacity 1000 tons/year
170 165 190 190 180 125 190
1,210
Announced/Planned New Capacity
Consolidated Papers, Wisconsin Rapids, WI Mead Corp., Escabana, MI Blandin Paper Co., Grand Rapids, MN Net Improvements TOTAL ESTIMATED TOTAL CAPACITY IN 2000
-77 -
1987 1987 1992
180 20
150 200 550
1.760

The announced capacity additions include two new LYC-paper machines: Consolidated Paper, Wisconsin Rapids, WI mill with start-up in 1987 and Blandin Paper Co., Grand Rapids, MN mill with estimated start-up in 1992. Additional net improvements will increase the capacity by further 220,000 tons, which result in a total 1.76 million tons capacity in year 2000.
Due to the fact that the North Central region is loosing some market share in the U.S. printing and publishing industry the estimated growth in LYC-paper demand is moderate 3.6 percent/year on average to year 2000. As shown in Figure F.4.39 the net import demand will grow from the current 60,000 ton level: 380,000 tons in year 2000.
• c 0 ... 8 ..
2800
2400
2200
2000
1800
1800
1400
1200
1000
800
800
400
200
o 1985 198819871988 1989 1990 19911992 1993 1994199S 19981997 199819992000
Yelr
C Oemond + Dome.tlc Production
Figure F.4.39. U.S. NORTH CENTRAL LWC-PAPER DEMAND AND DOMESTIC PRODUCTION
In addition to the domestic (North Central) producers, the other U.S. regions and European producers are the major competitors in the market area (Table T.4.l8a).
-78-

Table T.4.l8a Main Competitors in the U.S. North Central LWC-Paper Markets
1000 tons/year
l. Other U.S. Regions 50
U.S. South
* Bowater, SC
* Crown Zellerbach, LA
* Weyerhaeuser, MS
U.S. North East
* Boise Cascade, ME
* International Paper, ME
2. Europe 10
* Finnpap, Finland
The major end users of LWC-paper in the North Central region are listed in Section 4.2.7.2.
4.3.7.3 u.s. West South Central LWC-Paper Markets
In 1985 the only LWC-paper producer in the U.S. West South Central region was the James River mill at St. Francisville, LA which produced about 200,000 tons of LWC-paper. The off-shore import to the region accounted for 10,000 tons and were originated from Finland and Germany F.R. (Figure F.4.40).
-79-
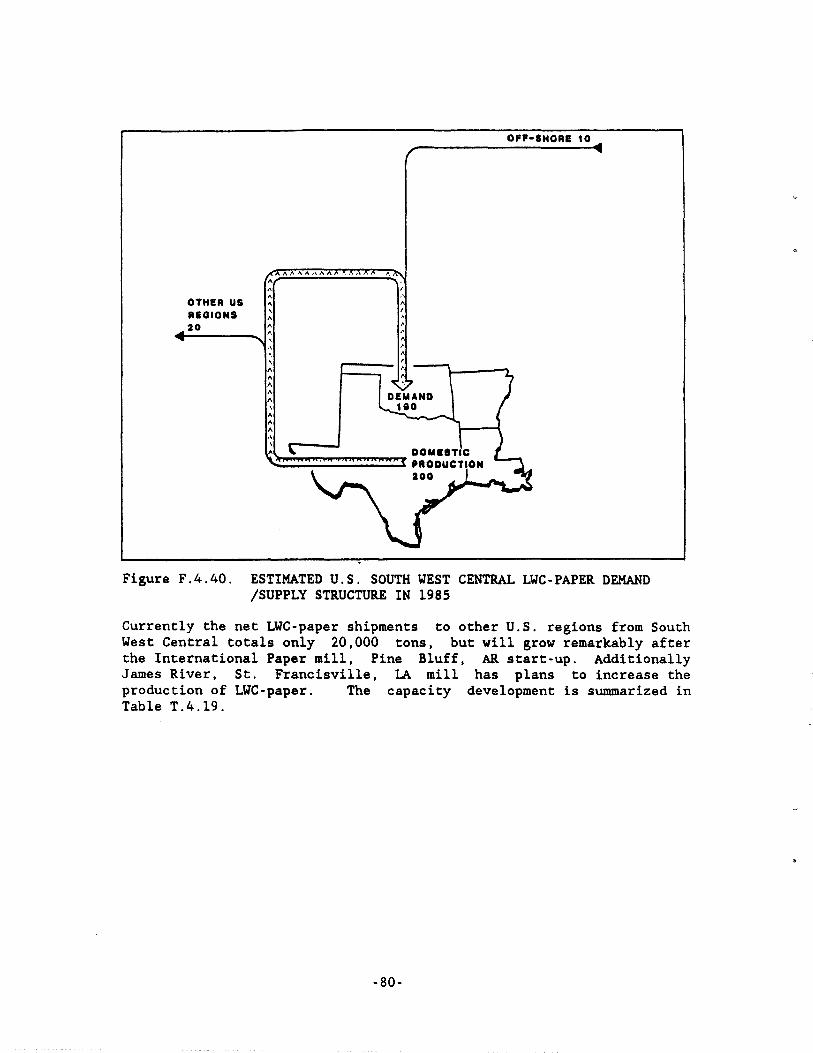
OTHER US REGIONS 20
I ,
OFF-SHORE 10
Figure F.4.40. ESTIMATED U.S. SOUTH WEST CENTRAL LWC-PAPER DEMAND /SUPPLY STRUCTURE IN 1985
Currently the net LWC-paper shipments to other U.S. regions from South West Central totals only 20,000 tons, but will grow remarkably after the International Paper mill, Pine Bluff, AR start-up. Additionally James River, St. Francisville, LA mill has plans to increase the production of LWC-paper. The capacity development is summarized in Table T.4.19.
-80-

Table T.4.19. U.S. West South Central Domestic LWC-Paper Capacity
Capacity in 1986:
James River, St. Francisville, LA
Announced/planned new capacity
International Paper, Pine Bluff, AR James River, St. Francisville, LA Net improvements
Total
TOTAL ESTIMATED CAPACITY IN YEAR 2000
1986 1992
1000 tons/year
220
180 100
50
340
560
Although the printing/publishing sector is growing fast in this region, in terms of tonnage the demand for LWC-paper will remain relatively low: 190,000 tons in year 1985, estimated 290,000 tons in year 1991 and 370,000 tons in year 2000. The net export will grow and amount to 100,000 tons in year 1991 and further to 160,000 tons by year 2000.
In the near future, James River and International Paper, will be the strongest competitors on the U.S. West South Central LWC market.
The major LWC-paper end users are listed in Section 4.2.7.3.
4.3.7.4 Summary of the Western U.S. LWC-Paper Markets
The Western U.S. LWC-paper markets are summarized in Table T.4.20.
Table T.4.20 Summary of Western U.S. LWC-Paper Import Demand
Region 1985 1991 2000 1000 tons/year
U.S. West 330 500 700 U.S. North Central 60 300 380 U.S. West South Central -10 -110 -160
TOTAL 380 690 920
The growth in the import demand on the Western U.S. market area will be about 600,000 tons by the year 2000 and most of it will be experienced in the U.S. West region.
-81-

4.3.8 Pacific Rim LWC-Paper Markets
4.3.8.1 Japanese LWC-Paper Markets
Currently the Japanese coated groundwood consumption is 600,000 tons per year of which 340,000 tons is LYC-type paper (B3-grade). The LYC· paper production capacity is basically higher than the domestic consumption, as shown in Table T.4.2l but because part of the production of other grades than LYC-paper, there is currently a gap between the domestic production and demand. This gap was filled in 1985 by Finnish and German producers (Figure F.4.4l).
~~~
AAAAAAAAAAAAAAAAAAAAA~AA AAA 44AA~AAA.
AA AAA AA AAA AA AA AA AA AA AA ~~ ." •• A • .. •• •• • A •• • A .A ~: A~.~.~ •• ::"lA~.~. 1"I":",,::"l .... ~~"I"~ ... ::"l~:or.+'A.'" AAAAAAAAAAAAAAAAAAAAA.
"NLAND .0
OTHII IUIO'I to
Figure F.4.41. LWC-PAPER DEMAND/SUPPLY STRUCTURE IN JAPAN IN 1985
-82-

Table T.4.21 Domestic LYC-Paper Capacity in Japan
Producer 1000 tons/year
Honshu Paper Mfg. Co. Ltd., Fuji City Jujo Paper Mfg. Co. Ltd., Ishinomaki Kanzaki Paper Mfg. Co. Ltd., Tomioka Maruzumi Paper Mfg. Co. Ltd., Kawanoe
Announced/planned capacity changes:
Sanyo-Kokusaku So. Ltd., Iwakuni Taio Paper Mfg. Co. Ltd., Mishima Net Improvements
Total
TOTAL ESTIMATED CAPACITY IN 2000
1990 1995
5 180 120
65
105 100
80
285
700
The somewhat fast growth especially in the catalog and insert/mailer sector, 7 percent/year during the years 1985-1995, will boost the consumption of LYC-paper. Ye have estimated that the LYC-paper demand will grow 6.3 percent/year up to year 1995 and about 5 percent/year from 1995 to year 2000.
Sanyo-Kokuskau Co. and Taio Paper Mfg. Co. have plans to increase their LYC capacity by about 100,000 tons/year each. Miscellaneous net improvements will further increase the capacity by about 80,000 tons. The average net import demand of LYC-paper seems to remain at the current 100,000 tons/year level.
The main off-shore competitors on the Japanese market are Finnpap from Finland and FeldmUhle from Germany, F.R.
4.4.8.2 LWC-Paper Market. in the Republic of Korea
Currently the annual consumption of LYC-type Korea is 40,000 tons and all of that producers, namely Hong Yon Paper Mfg. Co. Co. (Table T.4.2l).
-83-
paper in the Republic of is supplied by domestic and Shinmoorim Paper Mfg.

Table T.4.21a Domestic LWC-Paper Capacity in Republic of Korea
Current Producers
Hong Won Paper Mfg. Co. Ltd. Shinmoorim Paper Mfg. Co. Ltd.
1000 tons/year
49 60
TOTAL 109 No announced/planned new capacity Domestic capacity and demand is assumed to be in equilibrium
The demand is estimated to grow to about 80,000 tons by year 2000 and will be covered by domestic producers.
4.3.8.3 LWC-Paper Markets in the People's Republic of China
In 1985 the LYC-paper demand in the People's Republic of China was only 5000 tons, all of it imported from Finland. There is no domestic LWCpaper production capacity in China.
The magazine and export oriented advertising industry will most likely be the main driving force behind the future growth of the LYC-paper demand. Ye have estimated that in year 2000 the consumption of this grade will be about 60,000 tons, and it will be supplied by foreign producers.
The main competitors in these markets will be the Finnish and German Lye-paper producers.
4.3.8.4 Summary of LWC-Paper Markets in the Pacific Rim Countries
The net imports demand of Lye-paper in the Pacific Rim countries is summarized in Table T.4.22.
-84-

Table T.4.22. Pacific Rim LYC-Paper Imports Demand
Region 1000 tons/year
1985 1991 2000
Japan 70 110 140 Republic of Korea People's Republic of China 25 25 60
Total 75 135 200
Australia 90 New Zealand 10 Singapore 5 Not Not Hong Kong 5 Calc. Calc. Malaysia 4 Indonesia 2 Taiwan 2 Thailand 2 Philippines 2
TOTAL 197
4.3.9 Summary of LWC-Paper Markets
The imports demand of LWC-paper to the selected market regions will grow from the 400,000 tons/year level to about 1.1 million tons/year by the turn of the century. The major competition in the selected LYCpaper markets is summarized in Table T.4.23.
Table T.4.23. Main Competitors in the LWC-Paper Markets
US US Scandinavia Pacific South & North Germany
Market Area West
1. Domestic x) 2. U.S. West 100 300 20 3. U.S. North Central 50 10 4. U.S. West South Central 200 10 5. Japan 60 6. Korea 7. China
TOTAL 100 550 105 x) The supply to the domestic market originates from East Canada and
Eastern U.S.
-85-

The market supply/demand outlook is presented in Table T.4.23.A for the selected market areas.
Table T.4.23.A. LWC Market Outlook in Selected Market Areas
Demand Prod. Import Export (1000 tons/year)
Market Area '85 '92 '00 '85 '92 '00 '85 '92 '00 '85 '92 '00
Domestic 27 45 60 0 0 0 27 45 60 0 0 0 U.S. West 400 600 1000 100 115 300 320 485 700 0 0 0 U.S. North Central 1210 1500 2050 1150 1630 1670 60 0 380 0 0 0
U.S. West South Centro 190 290 370 200 390 530 10 0 0 20 100 160
Japan 340 550 770 270 500 670 70 50 100 0 0 0 Rep. of Korea 40 60 80 40 60 80 0 0 0 0 0 0 People's Rep. of China 5 30 60 0 0 0 5 30 60 0 0 0
TOTAL 223, 3075 4390 ),770 ,69~ 3,50 49, 6),0 1300 20 230 160
-86-

4.4 Solid Bleached Board
4.4.1 Classification of Bleached Paperboards
Since the terminology between Europe somewhat confusing. a brief description used in this report is given below:
and North America varies and is of the grades and abbreviations
Solids Bleached Sulfate (SBS): A bleached board produced entirely of bleached chemical (virgin) pulp. Commonly SBS is a single-ply board, but in some cases it may have multi-ply construction.
Solids Unbleached Sulfate (SUS): coated.
Unbleached kraft board. normally clay
Foldini Boxboard (FBB): In Europe this term refers to a multi-ply folding boxboard with a mechanical fiber containing middle layer. To avoid confusion. the abbreviations "FBB" in this report refers to this European type boxboard; generally the term "folding boxboard" is used in North America in reference to any boxboard used for the manufacture of folded cartons.
Clay Coated News (CCN): Recycled board with a clay coating on at least the top side.
White Lined Chipboard (WLC): recycled boxboard, which may "white lined chipboard" refers pulp "lining" on the top.
This term is used in Europe in reference to be coated or uncoated. In North America
to uncoated board with a bleached chemical
Based on the end use sector, bleached paperboard is divided into five main categories
1. Bleached linerboard
This small tonnage, 80,000 tons in 1985, is consumed by box-converters in corrugated box production.
2. Folding carton
This end use category includes folding carton type board used both in the food and non-food industry.
-87-

3. Liquor carton
This grade is used in milk and other liquid packaging.
4. Food service board
This category includes heavyweight cups and round vested food containers as well as plate, tray and dish stock.
5. Other bleached board
Into this category fall all the other bleached board grades.
Production and consumption of these grades in the U.S. is shown in Table T.4.24.
Table T.4.24. Solid Bleached Paperboard Demand/Supply Structure in the U.S. (1985)
Category
Bleached linerboard Folding carton Liquid carton Food service board Other Bl. Board
TOTAL
Cons.
80 1,590
590 640 300
3,200
Prod. Imp. 1000 tons/year
80 1,680 10
920 640 300
3,620 10
Exp.
llO 350
460
Folding carton, especially FBB, seems to be the most attractive bleached board grade for a potential Albertan producer due to the following reasons:
* Large market volumes * Non-export oriented product in the U.S. * Possibilities to use mechanical (CTMP) pulp * Opportune markets also in the Pacific Rim countries
4.4.2 Folding carton End Uses
eoth food and non-food end use applications of folding carton are given in Table T.4.25.
-88-

Table T.4.25. U.S. Shipments of Folding Cartons by End Use in 1985 (% of tonnage)
End Use % of total tonnage
Food: Dry food Wet food Beverages Biscuit & crackers, baked goods Canada and confections Food Total
Non-Food: Soap Medical product Hardware, appliances and auto supplies Cosmetics Retail and laundry Paper goods Tobacco Sporting goods and toys Textiles and apparel Other Non-Food Total
GRAND TOTAL
23.5 12.4 12.8 9.8 3.5
6.8 6.1 3.5 2.2 5.1 6.6 4.5 1.2 1.1 0.9
62.0 %
38.0%
100.00\
The fastest growing end use applications are: medical and cosmetics packaging, dry and frozen food packaging and paper goods. The share of applications in the textile, hardware and soap industry are on the other hand declining.
In the Pacific Rim countries the non-food sector dominates the use of folding carton.
4.4.3 World Folding Carton Trade
As shown in Figure F.4.42 world solid bleached board trade is dominated by Scandinavian producers. Net exporters were also the USA and Japan· about 100,000 tons/year each. The main target of the USA export tonnage was Canada, while Japanese shipments were designated to the various Pacific Rim countries.
-89-

Figure F.4.42. MAJOR BLEACHED BOARD TRADE FLOWS IN 1985
The current bleached board capacity (see Appendix A.4.5) in the world is about 12 million tons and the production about 10.5 million tons, i.e. the utilization rate of existing production equipment is 87 percent. The worldwide growth is estimated to be only 1.6 percent/year and regionally as follows:
* North America * Western Europe * Japan * Other regions
1.7 percent/year 1.8 percent/year 1.5 percent/year 1.5 percent/year
Canada is expected to maintain a higher growth rate level, slightly over 4 percent, than the rest of the North American market.
rate for bleached board is the The forecasted demand to year 2000
shown in Figure F.4.43. The capacity the current 87 percent level for the
The main reason for the low growth increasing usage of recycled board. and production capacity to 1991 is utilization is estimated to stay at next five years.
-90-

" c 0 ~
§ ..
13600
13400
13200
13000
12800
12600
12400
12200
12000
11800
11600
11400
11200
11000
10800
10600
10400
198519861987198819891990199119921993199419951996 1997 199819992000
Ylir
o Demand + Domestic Production
Figure F.4.43. WORLD BLEACHED BOARD DEMAND AND CAPACITY
The price development for cartonboard stock in the eastern United States market is depicted in Figure F.4.44. Referring to this figure, the following observations can be made:
* The price of clay coated news (CCN) follows the price of SBS in the U.S., consistently at a 25 percent to 35 percent lower level.
* The price of SBS in the U.S. tends to adjust to the price of market chemical pulp.
* The premium prices of SBS are in the range of US $60/ton to $200/ton higher than that of chemical pulp.
* In the U.S. increases in price of SBS have been less than increases in consumer price index (CPI). During the period of 1977-82 the CPI increased by 60 percent while the price of SBS increased by 53 percent. The difference is even more distinctive during the 1982-87 period, when the CPI increased a modest 13 percent while the price of SBS dropped by 9 percent.
-91-

150
100
550 z 0
500 ~
~ c 450 0
= 0 400 , • 0 = 350
300
250 71 77 78 78 80 81 82 83 84 85 81 87
Figure F.4.44. FOLDING BOXBOARD PRICES IN THE U.S.A.
FBB produced in Alberta would be depending on the business strategy the observation above are.
expected adopted.
to compete with SBS or CCN Some conclusions based on
* FBB price will most likely follow North American CCN and SBS prices.
* FBB will normally to sell at premium to market pulp.
* It is assumed that FBB prices will stay somewhere between those for SBS and CCN. Results from the field surveys indicate that North American converters expect that FBB will sell at a 10-15 percent discount compared to SBS prices.
Current prices for FBB and CCN in the United States are running at usn 660-720 per ton and usn 440/ton, respectively.
-92-

4.4.4 Quality of Folding carton
The main desired characteristics of folding carton are: good printability, high stiffness and good scoring and folding properties. Low density is also a desirable feature, because it results in a board with less substance (basis weight) while still meeting the required properties. Good bonding ability is an additional feature necessary for multi-ply folding boxboard.
The European type of folding boxboard, FBB, is a multi-ply board which normally consists of at least three layers of fiber:
* Chemical pulp for the top layer * Mechanical pulp for the middle layer * Chemical pulp for the back layer
Multi-ply folding boxboards are being produced from virgin fiber in a number of European mills.
Typical examples of producers of top quality FBB are:
* FeldmUhle AG Baienfurt, Y. Germay * Papyrus Kopparsfors AB, Fors, Sweden * MetsA-Ser1a (TAKO) , Tampere, Finland
Some of these producers, especially TAKO and Fe1dmUh1e are fairly well recognized by North American converters.
Examples of top quality producers of solid bleached boards, SBS, are Yestvaco in Covington, VA and AB Iggesund Bruk, Iggesund, Sweden. Most competition for a potential Albertan board would be solid bleached board produced by a number of U.S. manufacturers.
4.4.5 Domestic Folding carton Markets
The current Canadian producers of bleached paperboard are located in Eastern Canada: CIP Inc., at La Tuque, PQ, Fraser Inc. at Edmunds ton , NB and Cascade Industries at Jonquiere, PQ. The Canadian production of folding carton in 1985 was about 90,000 tons - 80,000 tons were shipped to domestic converters and about 10,000 tons were exported. Simultaneously the Canadian imports from the U.S. were about 55,000 tons. The Canadian folding carton consumption in 1985 reached 135,000 tons. However, due to the concentration of the folding carton converting industry to Quebec and Ontario, the demand in the Prairie provinces and in British Columbia was only about 10,000 tons. Most of this demand was supplied by the Southern U.S. producers.
-93-

The total folding carton demand, including solid bleached board and recycled board, is estimated to grow in Canada by 1 percent per year. However, the clear trend away from the recycled board, 1 percent per year decline in consumption, results in a 4 percent growth in solid bleached board demand. In terms of tonnage the folding carton consumption in Canada will reach 240,000 tons by the year 2000. In Western Canada the estimated demand in 2000 is about 20,000 tons. There are no plans to start folding carton production in Western Canada.
The main converters of folding carton in the Western Canada region are:
Ace Productions Ltd., Vancouver, B.C. Lawson Graphics Manitoba Ltd., Winnipeg, MB Lawson Graphics Pacific Ltd., Richmond, BC Sommerville Belkin Industries Ltd., Edmonton, AS
Burnaby and Vancouver, B.C and Winnipeg, MB
Western Paper Co., Ltd., Winnipeg, MB Westfold Cartons Ltd., Edmonton, AS
4.4.6 u.s. West of Mississippi Folding Carton Markets
The following discussion and forecasts have been based on indications and information received from North American cartonboard converters and on end use trends combined with economic growth trends. The following trends are expected:
* An increase of SBS and FBB type board is expected. At the same time
*
the demand for recycled board is diminishing. This is primarily because of higher requirements on both runnability and printability.
Major investments in the consistent quality will provide improved market opportunities. surface is regarded more important than gloss.
of the printing surface The smoothness of the
Additionally supporting a favorable development of the cartonboard market are the facts that
* The cartonboard provides economic space utilization in distribution and shelf-display.
* The cartonboard offers flexibility alternative for packaging.
in design and an economic
* Folded cartons are easier to dispose by the consumer. Competing materials such as plastic cause disposal problems.
-94-

Factors limiting a from plastics and effect the tonnage
faster demand growth are also tendencies toward
growth.
mainly a harder competition lighter grades, which will
4.4.6.1 u.s. west Folding carton Markets
In the U.S. West region about 170,000 tons of folding carton was produced in 1985: about 150,000 tons by Potlatch, Lewiston, ID and the remaining 20,000 tons by Weyerhaeuser Co. Longview, WA, the Weyerhaeuser production being milk carton. Additionally 75,000 tons were shipped to this region from the other regions· mainly U.S. South (Figure F.4.45).
• < e «««<~««««<c««« ««ccce«««<c««««. «< «< «< « «< « «< « «< « <c< <c «c « <c~ « «< « cc< c< <cc cc ccc cc <c< ec. cce c< «~ « c« « «< « <C~ <c «~ « «< « «< "c< «< « cce cc< ::~ DIM AND cc< I •• «< CCe cc< <ce cc' cce ccc
C ~ ~'-""';"'---""'''''''''''''''';'""7 DOMUTIC c < C c c c < c c c c c C C C C C < c < c c c PRODUCTION ~~~~~~~~~~~t70
I----t---r-
OTHER UI RIOION 11
Figure F.4.45. ESTIMATED U.S. WEST FOLDING CARTON DEMAND/SUPPLY STRUCTURE IN 1985.
-95-

The demand is forecasted to grow by 0.8 percent/year and to reach a 270,000 ton level by year 2000 (Figure F4.46). There are no announced or planned new machines coming on stream in the U.S. West. Miscellaneous net improvements will, however, increase the capacity to 210,000 tons by year 2000. The net imports demand is estimated to remain at the current level.
• c 0 l-
S ...
1200
1100
1000
900
800
700
600
500
400
300
200
100
0
--------- -- - - - ---
I I I
198519881987198819891990199119921993199419951996 1997 19981999 2000 V .. ,
C Oemond + Oomestic Production
Figure F.4.46. US WEST FOLDING CARTON DEMAND AND PRODUCTION
Also in the future the U.S. to Potlach and Weyerhaeuser, West market.
South folding carton producers, in addition will be the main competitors on the U.S.
Some of the major folding carton end users are listed in Table T.4.26.
-96-

Table T.4.26. U.S. West Major Folding Carton End Users
Producer Capacity 1000 ton/year
1. Crocker Co. H.S., San Bruno, CA 25 2. Pacific Paperboard Products Inc., San Francisco, CA 20 3. Coast Carton Corp., Industry, CA 10 4. Consolidated/Eureka Paperbox Inc., 10
Gordon Grove, CA 5. Los Angeles Paper Box and Board Mills, 10
Los Angeles, CA 6. Pacific Coast Packaging Corp., Vernon, CA 10 7. Ridgeway Packaging Corp., Redmond, WA 10
End users are clearly concentrated in to California - Los Angeles and San Francisco.
4.4.6.2 U.S. North Central Foldinq Carton Markets
The U.S. North Central region is a large consumer of folding cartons, 60 percent of the U.S. total demand. However, the domestic productions is fairly small, only 140,000 tons in 1985· supplier being International Paper, Moss Point, MI. The main carton flow to this region came from the U.S. South region (Figure F.4.47).
-97-

««~«««<c«« <ecce < ««ccce<<<<<<<<<<<<<<<<<<'<<<'<<<<
«cccccec«cc««<ccc<cc««<<<c<<<c<<<< <eccccce«cc«««c«««c«<c«c««ccccc «cccccecc,<ccc«ccc««,«<c««<c<<<c ««ccce<<<<<<<<c<<<<<<<<<<<<<<<<<<<<<<<<< «ccccce«(c««««ccccccc«C««<<<<<<, ««ccce<<<<<c<<<<<<c<"cccc<<,c<<<ccccc<< ««ccce«(c<,c«c<c«c«««,««c<<<<<c<c e<eccccccccccccccececcc<cc«c<c<ce <cccccccccccccccccccccecccccccccec· «ccccce<<<cc<<c<<<<<<<<<<<<<<<<<<<<c<<<<c<<c «(ccccecc<ccc«ccccccc«««c«cc««c«c «c<ccce«««««c <eecccce««c<<< «c<ccce<c«< ««ccce««<' ««ccce««< ««ccce«« ««ccce««< ««ccce«« ««cccec«« ««ccce«« ««ccce<<<<<< ««ccce«« ««ccce««< ««ccce<cc< :c«ccc«cc<c ««ccce«« ««ccce««« ««ccce«« «c«cce««< ««cccc«cc <c«<cceee«< ccccccceccc< cceccceec«<e '<c<c<cc<c«< «c<ccc<ecccc <c<cc«e< cc<cccceccccc <c<c <cecccccccccc «c<c<cc«c« «<<cccc<c<<e<e <ccccccccee,< <ccceecc<ec« ec<cc«eec«c (ccecccc<ecec < e c c c < c c c < < c < 1..!:.;:::;:;:::;:;;::;~ «ccccccccc c ecc<ccc<cc< "«c<cccc< <ccccccc,c< . c<cccccece< eccccccecc' cccccccecc. ec«<ccc<cce« ccccccccccc ecccccce""e ccccceccccc cccccccccc. cccccccccce ccceecceccc eccccccecc' eccec<ceecc :~:~~~~~~~~~cccccccceccc<cccc<cccccccccec<c<c<ce ecececcccccccecceccecccccc<cccccc<ccc<eec<ccccc «ecccecceeccccceec<cec<c<cccc<cccccccccecceccc «<ccccec,ccc<ccccccccCCCCCCCC<CCCC<CCCCCC«CCC< <c«ceceeccccec««ceecccecceccccc«ec«c«<e< e<ecc<cecccc«ecccccccccceecc«c««c<cc<ecc<e cccccceccCCccccccec<cc<cccccccccccccccccceccec «ccc<cccc<cccc«<c<cccecccccccc<cccc<ccc<cccc c<ecccceecceccccc«ceecececccec<cc<cec<eccc<ccc
<ceccccc<ec«cccccccc<ccc<ccc<ccec<ccc.cc<c<cc<
Figure F.4.47.
~ ,~"" , , " "
ESTIMATED U.S. NORTH CENTRAL FOLDING CARTON DEMAND/SUPPLY STRUCTURE IN 1985.
We have estimated that the 260,000 tons by year 2000 early 90's. Also in the carton demand will be
capacity in the market area will grow to due to the start-up of a new machine in the North Central region the growth in the folding
0.9 percent/year. The imports demand will (Figure F.4.47a).
low remain at the current level
-98-

• c 0 l-
S ...
1200
1100
1000
900
800
700
600
500
400
300
200
100
0
- --- .....
-----
---
I r I I I r I I I
198519861987198819891990199119921993199419951996 1997 199819992000
V •• r
C O.mond + Oomastic: Produc:tion
Figure F.4.47a. US NORTH CENTRAL FOLDING CARTON DEMAND AND PRODUCTION
-99-

Major folding carton end users in the North Central region are listed in Table T.4.27.
Table T.4.27. Major U.S. North Central Folding Carton End Users
Capacity Producer 1000 t/a
1. Jefferson Smurfit Corp., Alton, IL 2. Packaging Corp. of America, Evanston, IL 3. Field Container Corp., Elk Grove Village, IL 4. Green Bay Packaging, Green Bay, WI 5. RPM Board & Carton Corp., Rosemont, IL 6. Handschy Industries, Chicago, IL 7. Golbert Packaging Corp., Melrose Park, IL 8. Colunet Carton Co., South Holland, IL 9. Bud and Fletcher Co., Kansas City, MO 10. The Garber Co., Ashland, OH 11. Velpaco, Batt Creek, MI 12. Vap1an Paper Box Co., East St. Paul, MN 13. Indiana Carton Co., South Bend, IN 14. National Folding Carton, Corp,
North Kansas City, MO
275 (21 plants) 140 (6 plants)
60 25 25 25 10 10 10 10 10 10 10
10
4.4.6.3 u.s. west South Central Folding carton Markets
The U.S. West South Central Region is currently self-sufficient in regard to folding carton. The "domstic" production in 1985 was 140,000 tons -suppliers being Potlach, McGehee, AR and Temp1e-Eastex, Evadale, TX - as illustrated in Figure F.4.48 and that slightly exceeds the demand.
-100-

««<.««««««< «,.----~~~~~ « « « « «
TO OTHER .;<
US REGION ~~ 10 : < .. -----,~~
<, « :c
Figure F.4.48. ESTIMATED U.S. WEST SOUTH CENTRAL FOLDING CARTON DEMAND
International Paper, at its Pine Bluff, AR mill completed its modernization project in 1986 and currently produces about 40,000 tons of folding carton. Additionally we have assumed that a new machine will come on stream in the late 90's (Table T.4.28) and increase the capacity to 350,000 tons by year 2000 (Figure F.4.48a).
-101-

1200
1100 -1000 -900 -
800
700 -• c 600 -0 t-O 500 -8 ...
400 -lOO -200 -
100 -
o I I I I I
19851986198719881989199019911992 1991 1994199519961997199819992000
Yllr
o D.mond + Dom.stlc Production
Figure F.4.48a. US WEST SOUTH CENTRAL FOLDING CARTON DEMAND AND PRODUCTION
Table T.4.28 U.S. West South Central Folding Carton Production Capacity
Capacity in 1986:
Potlach, McGehee, AR Temple-Eastex, Evadale, TX
Total
Capacity additions
International Paper, Assumed new machine Net improvements
Pine Bluff, AR 1997
Total Estimated capacity in 2000
-102-
1000 tons/year
100 70
170
40 120
20 180 350

The demand will grow in this market regions, 4.4 percent/year and will year 2000. However, due to the capacity the region will be a net competitors in the U.S. West South producers Potlach, Temple-Eastex and U.S. South folding carton producers.
area remarkably faster than in other reach the level of 250,000 tons by assumed increase in the production
exporter of folding carton. The main Central region will be the domestic International Paper and the various
A list of major folding carton converters is shown in Table T.4.29.
Table T.4.29 Major U.S. West South Central Folding Carton End Users
Producer
Temple-Inland Inc., Diboll, TX Manville Forest Products Corp.,
West Monroe, LA T.J. Smith Box Co., Fort Smith, AR Southern Paper Box Co., Little Rock, AR Clarke Printing & Packaging, San Antonio, Day Mfg. Co., Sherman, TX
TX
Capacity 1000 tons/year
20 (3 plants-NC, TN,
15 (2 plants-MS, IL) 5 5
<5 <5
WI)
4.4.6.4 Summary of the western u.s. Folding Carton Markets
The demand forecast of folding carton in the Western U.S. markets is shown in Table T.4.30. That information indicates that the net import demand will remain at the current level in the areas.
Table T.4.30. Folding Carton Demand in the Western U.S.
(1000 tons/year) 1985 1991 2000
U.S. West U.S. North Central U.S. West South Central
TOTAL
75 820 -10
885
80 880
o
960
4.4.7 Pacific Rim Folding Carton Markets
4.4.7.1 Japanese Folding Carton Markets
9D 870 -50
910
Japan is a major folding carton producer, 600,000 tons in 1985, and is the most important exporter of that grade in the Pacific Rim market area as shown in Figure F.4.49. Although Japan is a net exporter of folding
-103-

cartons, 30,000 tons were also imported. The main sources of this import was the Pacific Rim region (South Korea, Taiwan, Indonesia), Scandinavia and USA.
ecce ccccccccc~ccccccccccccc, cccccccccccccccccccccccc <ecccccecccccccc««cccccc <cecccceccccc«cccc«c«cc« eccccccecccccc«<<<cccc<<cc <eeccce ececcCe <eccce eeccce
11.0.'1 :::::: :::::: .ao ~::::: ::::::
eeccce <eccce ««ccce<<<ccc <eccce ececce
c eeCCce eeccce eececce (eCCCe ececcce cc ccccccc DIWAND eceCCce {)
~:::::: .0 eeeCCce ( :::::::~<~cc~c~c~c~c~c~<~c~ ecccccce«c«««cccc «cceccecccccccc ecccccccce«ccccc eccccccecccccccc eccceccecccccccc ecccccce«ccccccc,
CC<CCCCCCCCCCCc<
SCANOINAVIA •
USA.
OT" II 20
Figure F.4.49. FOLDING CARTON DEMAND/SUPPLY STRUCTURE IN JAPAN (1985)
Current folding carton producers are:
Kyushu Carton Co. Ltd. Sendai-chi Enshu Seishi KK Ide Paper Mfg. Co. Ltd. Chuetsu Pulp Industry Co. Ltd., Nochamachi Daishowa Paper Mfg. Co. Ltd., Yoshinaga Gojo Paper Mfg. Co. Ltd., Harada Hokuetsu Paper Mills Ltd. Ichikawa
TOTAL
-104-
1000 tons/year
50 70
130 30
200 30
140
650

Folding carcon demand will grow in Japan by 1.5 percenc per year according Co available statistics (Figure 4.49a). This growth, however, will be supplied by domestic production (partly recycled board). The imports is assumed to remain at the currenC 30,000/year ton level. In the high quality folding carton markets the "domestic" producers as well as other U.S. (Westvaco, Covington) and Scandinavian producers (EnsoGuzeit, Finland and Iggesund, Sweden) will be the main competitors.
• c 0 ... § ...
1200
1100
1000
900
800
700
800
500
400
300
200
100
0
---
--
-""
-""
----
r , , 19851988198719881989199019911992199319941995 19ge 1997 199819992000
Yur
a Oemand + Domestic Production
Figure 4.49a. FOLDING CARTON DEMAND AND PRODUCTION IN JAPAN
4.4.7.2 Folding carton Markets in the Republic of Korea
Also in the folding carton sector the Republic of Korea is selfsufficient, except the small 2000 tons/year import from Japan as illustrated in Figure F.4.s0. The major expansion of Serim Paper's PM 1, 70,000 tons/year that went on stream in April 1986 and Shipoong Paper's PM2 (80,000 tons/year) at its pyong Tack mill, which was started up in October 1986 have caused a severe overcapacity in duplex board, which will be recognized also in the folding carton demand/supply structure.
-105-

DEMAND 42
JAPAN Z
Figure F.4.50. FOLDING CARTON DEMAND/SUPPLY STRUCTURE IN THE REPUBLIC OF KOREA IN 1985
Although the demand is growing about 2 percent/year during the next 15 year, the domestic supply will cover the entire demand (Table T.4.31). As a importer of folding carton the Republic of Korea is currently and presumably in the future of minor importance as a potential market area for folding carton products.
-106-

Table T.4.3l. Folding Carton (incl. Recycled) Capacity in the Republic of Korea
1. Daehan Pulp Industries Co. Ltd. 2. Dong Chan Paper Mfg. Co. Ltd. 3. Hangchang Paper Mfg. Co. Ltd. 4. Kukje paper Mfg. Co. Ltd. 5. Serim Paper Mfg. Co. Ltd. 6. Onyang Pulp Co. Ltd. 7. Shipong Paper Mfg. Co. Ltd.
TOTAL INCLUDING SWING CAPACITY
1000 tons/year
70 60 60 40 80 10
160
480
4.4.7.3 Folding Carton Markets in the People's Republic of China
We have estimated that the was about 220,000 tons, of (Figure F.4.51).
folding carton-type board consumption in 1985 which 200,000 tons were produced domestically
-107-

ICAHDIHAVIA 10
JAPAN 10
Figure F.4.Sl FOLDING CARTON DEMAND/SUPPLY STRUCTURE IN THE PEOPLE'S REPUBLIC OF CHINA IN 1985
The demand is estimated to grow about 2 percent/year and growth will be supplied by domestic producers. The import will remain at the current 20,000 tons/year level and the main foreign competitors will be Japan and Scandinavian countries even in the future.
4.4.7.4 Summary of Folding Carton Markets in the Pacific Rim Region
The estimated folding carton imports demand is summarized in Table T.4.32.
-108-

Table T.4.32 Folding Carton Imports Demand in the Pacific Rim Market Area
1000 tons/year 1985 1991 2000
Japan Republic of Korea People's Republic of China
= TOTAL Australia New Zealand Singapore Hong Kong Malaysia Idonesia Taiwan Thailand Philippines
30
20
50 40
5 15 20 15 10 o 5
10
OTHER PACIFIC RIM COUNTRIES TOTAL 120
30
20
50
Not Calc.
4.4.8 Summary of Folding carton Markets
30
20
50
Not Calc.
The demand of folding carton in the selected market areas will grow from 2.1 million tons/year level to about 2.6 million tons/year by the end of this century. However, the capacity increase in the U.S. North Central and U.S. West South Central regions results in the fact that the import demand remains at the current 0.96 million tons/year level (See Table T.4.32.A)
The main competitors in the North American folding carton markets are the U.S. South producers. In the Pacific Rim area, in addition to the U.S. producers, Scandinavian and Japanese mills are also strong competitors.
Table T.4.32.A. Folding Carton Market Outlook in Selected Market Areas
Demand Prod. Import Export (1000 tons/year)
Market Area '85 '92 '00 '85 '92 '00 '85 '92 '00 '85 '92 '00
Domestic 10 15 20 0 0 0 10 15 20 0 0 0 U.S. West 245 255 270 170 180 190 75 75 80 0 0 0 U.S. North
Central 960 1000 1050 140 145 240 820 855 810 0 0 0 U.S. West
South Centro 130 180 250 140 180 300 0 0 0 10 0 50 Japan 500 550 600 600 650 700 30 30 130 130 130 130 Rep. of Korea 42 SO 60 40 SO 60 2 0 0 0 0 0 People's Rep. of China 220 250 300 200 230 280 20 20 20 0 0 0
TOTAL 2107 2300 2550 1290 1435 1770 957 995 960 140 130 180
-109-

4.5 Newsprint
4.5.1 World Newsprint Demand/Supply
Newsprint is the biggest single paper grade produced in the world today and its consumption is much more diversified than that of the value added groundwood papers such as LYC- and SC-papers. Although North America is a net exporter of newsprint (Figure F.4.S2) the huge markets close to Alberta gives good basis for a closer analysis of opportunities to produce newsprint in Alberta.
11
'" z 0 CJ DEMAND to- 10 II. 0
~ SUPPLY
'" z 0 :; = S ::I
Figure F.4.52. REGIONAL NEWSPRINT DEMAND AND PRODUCTION IN 1986
The growth of world newsprint production and capacity has been steady during the past 15 years. The only exceptions have been the major grammage reduction in 1973/74 from 52 g/m2 to 48 g/m2 and the recession on the market in 1981/82 (Figure F.4.53). A swing back to the newspaper advertising, the growth in inserts and mailers as well as the
-110-

introduction of newspapers have been the key factors in the recent healthy growth. In USA about 75 percent of the newspaper is used in regularly appearing sections of daily and weekly newspapers and the remaining, extremely fast growing 25 percent, in newspaper inserts, catalogs and in governmental printing jobs.
g o ..
46000
44000
42000
40000
38000
36000
34000
32000
30000
28000
28000
24000
22000
20000
18000
18000
14000 1970 197.
-- Demond
1978 1982 1986
Vear + Capacity
1990
Figure F. 4.53. WORLD NEWSPRINT DEMAND AND CAPACITY
1994 1998
Advertising index is the most important end use indicator of the newsprint demand and the advertising is accounting for an increasing share of GNP in most of the countries, the growth of newsprint demand the healthy growth is estimated to continue as newspaper advertising is increasing and newspaper is defining its position as an advertising media. The reasons for the growth in advertising are discussed in more detail in Section 4.2.
The world average annual growth rate from 1986 to 1995 is estimated to be 2.6 percent, as shown in Table T.4.33 and Figure F.4.S3. The healthy growth in the developed countries is caused mainly by the increased advertising while in the developing countries also the growth of the newspaper circulation plays an important role.
-111-

Table T.4.33 World Regional Growth of Newsprint Demand
North America Japan Western Europe Other regions
WORLD TOTAL
1000 tons/year
270 060 140 360
830
Percent/year
2.0 2.0 2.1 4.4
2.6
In the late 90's the growth rate is estimated to drop to 2 percent due to saturation of markets in the western world.
From the Albertan point of view, the strong volume growth in the U.S. newsprint demand is important to recognize.
During the recession in 1981/82 many companies upgraded their small newsp rint machines to uncoated groundwood grades (improved news and similar) because they had lost their competitiveness in newsprint production. These upgrades and the unexpectedly high growth in newspaper demand have improved the capacity utilization of newsprint machines during the past few years. Also during the period from 1986 to 1991 the estimated growth in newspaper demand is higher than the expected increase in capacity, which will exagerate further the newsprint capacity utilization. The list of announced/planned newsprint capacity changes clearly indicates the growing role of developing countries as newsprint producers (Appendix A.4.6).
World wide the capacity utilization rate is expected to remain slightly over 90 percent and in North America between 95 percent and 96 percent until year 1991.
The biggest long term threat a potential production of newsprint in Alberta would face is the increasing newsprint capacity in "low cost", countries such as Brazil, Venezuela, Chile, Colombia, etc.
4.5.2. World Newsprint Trade
The newsprint business, as well as other groundwood paper business, is increasingly becoming international and intercontinental. The main net exporters are Canada, Scandinavia and USA as illustrated in Figure F.4.54. On the Western European markets the Scandinavian producers are dominating while the US markets, Canadian producers play the most important role. In the Pacific Rim market, the competition is more diversified, with Canadian producers possessing the largest market share, 590,000 tons/year. In all of the three defined market areas, the main competitors to the Albertan newsprint are clearly other Canadians and Scandinavian companies.
-112-

Figure F.4.54. NORTH AMERICA AND SCANDINAVIA
The internationalization of the newsprint production is most striking in Canada, where the New Zealand company Fletcher Challenge Ltd. controls both British Columbia Forest Products and Crown Forest Industries in British Columbia and additionally Blandin Paper in USA, Oji Paper Co. together with Mitsui Co. and CIP Inc. NBIP Forest Products, and Stora from Sweden the Stora Forest Products mill in Nova Scotia. U.S. companies have the following share of the Canadian newsprint industry:
1. Gaspesia Pulp and Paper Co. Ltd., Chandler, PQ * 49% The New York Times, NY * 51% Abitibi-Price Inc.
2. F.F. Soucy Inc., Riviere-du-Loup, PQ * Bato Co. Ltd., CT
-113-

3. F.F. Soucy Inc. Associates, Riviere-du-Loup, PQ * Jointly owned by
* F.F. Soucy Inc., subs * Dow Jones Newsprint * Rexfor
4. Boise Cascade Canada Ltd. (with mills in Kenora, ON and Fort Francis, ON) * Boise Cascade Corp., ID
* Kenora mill, ON * Fort Frances mill, ON
5. Bowater Newfoundland, Comer Brook, NF * Bowater Inc., CT
6. Bowater Kersey Paper Co. Ltd., Liverpool, NS * 51% Bowater Inc. * 49% The Washington Post
7. Spruce Falls Light & Power Co. Ltd., Kapuskasing, ON * 50.5% Kimberly-Clark, WI * 49.5% The New York Times
8. Ontario Paper Co. Ltd., Thorold, ON * Tribune Co., Chicago
9. Q.N.S. Paper, Baie Lome au , PQ * Tribune Co., Chicago
In USA, Jujo Paper Co. jointly with Weyerhaeuser Co. owns North Pacific Paper Co. in Longview, WA.
For a Albertan newsprint producer, the foreign ownership of the Canadian and U.S. newsprint capacity means that part of the international trade flows are actually intracompany flows and that especially these mills have an excellent marketing network available to sell their products worldwide.
The price of newsprint in the North American and Western European markets has been very stable as illustrated in Figure F3.7. The only exception was the recession in 82/83 when the price level dropped about 70 CAD/ton. On the other hand, the price level in the Pacific Rim markets, especially in Singapore and Malaysia, is very unstable and usually remarkably lower than that of the U.S. market.
-114-

CAD/METRIC TON
700
800
500
400
80
r---"-------r..J USA I
,. -, I
~ : ; :
r-" r---J L.J
. __ r- "·1., ,. ..... r-J
• ,.-4 r·~ ~-~
.J
FAR EAST
81 82 83 84 85 88
Figure F.4.55 AVERAGE QUARTERLY PRICES OF CANADIAN NEWSPRINT EXPORTS TO THE U.S. AND FAR EAST.
The price stability of newsprint on the U.S. market indicates that the main market area for the Albertan newsprint should be in United States.
4.5.3 Newsprint Quality
The standard basis weight for newsprint in the U.S. is currently 48.8 g/m2 although the lower 46.4 g/m2 basis weight is becoming more popular, which is also the standard basis weight in Japan. The trend towards lower basis weight is clear and will provide lower distribution costs, but significant reductions are not likely because of anticipated consumer resistance.
The common printing methods in the newspaper industry are letterpress, gravure and offset. Letterpress has been the most popular method in the U.S., but especially offset has recently gained popularity.
·115·

Rotogravure is preferred for longer runs, while offset printing offers cost efficiency for lower circulation newspaper. Both gravure and offset-printing require high quality paper compared to the letterpress method. In addition to this technological trend in the printing industry also the reduction in basis weight and the use of color printing in newspapers support a trend towards higher newsprint quality.
The use of waste paper in newsprint is a potential threat to the virginfiber newsprint producers. However, the higher quality requirements restrict the competition from waste-paper based newsprint.
4.5.4 Domestic Newsprint Markets
The population in the domestic market area, 7.2 million, is about 29 percent of the total Canadian population. The gross domestic production (GOP) represents, however, almost 32 percent of the total GOP in Canada. The Western Canada newsprint consumption estimate, 330,000 tons in 1985, is based on the per capita consumption in Canada corrected with the higher gross domestic production in Western Canada.
As illustrated in Figure F.4.55a the production of newsprint in 1985 was about 1.68 million tons - 1.53 million tons in British Columbia and 0.15 million tons in Manitoba (Table T.4.34). The main destination for the newsprint produced in BC is the U.S. West region which accounted for 950,000 tons in 1985. The major off-shore buyers of British Columbian newsprint are: Australia 65,000 tons, Europe 60,000 tons, South East Asia 45,000 tons, South and Central America 45,000 tons.
-116-

OTHER ~rrrrrrTTTT~~------------.PROV'NCES
40
OFF-SHORE EXPORTS~================~~~
240
Figure F.4. 55a.
U.S. WEST 110
U.S. NORTH CENTRAL
80
OTHI" U.S. REGIONS
30
DOMESTIC MARKETS: ESTIMATED NEWSPRINT DEMAND/SUPPLY STRUCTURE IN 1985.
About 80,000 tons of the newsprint produced in Kanitoba - Abitibi-Price, Pine Falls mill - is exported to the U.S.; mainly to the U.S. North Central region. The rest, 70,000 tons is shipped to the domestic customers.
-117-

Table T.4.34. Domestic Newsprint Producers
Producer
Abitibi-Price Inc., Pine Falls, MB British Columbia Forest Products Ltd., Crofton, BC Crown Forest Industries, Ltd., Elk Falls, BC MacMillan Bloedel Ltd., Port Alberni, BC MacMillan Bloedal Ltd., Powell River, BC
TOTAL
Capacity Additions
Finlay Forest Industries, McKenzie, BC Crown Investment Corp., Regina, SK Quesnel River Pulp, Quesnel, BC CIP Inc., Gold River, BC MacMillan Bloedel, Powell River, BC British Columbia Forest Products Ltd., McKenzie, BC Miscellaneous Net Improvements
Estimated Capacity Increase ESTIHATED TOTAL CAPACITY IN 2000
Capacity 1000 tons/year
170 440 450 300 470
1830
150 (planned) 175 (planned) 165 (planned)
270
630 2460
(planned) (planned) (planned)
There are no announced major projects to increase the newsprint production capacity in Western Canada. However, a number of companies have plans to move ahead with newsprint expansions if market conditions continue to improve. We have estimated that two out of six planned projects will be realized. These, in addition to the net improvements in the existing machines, will increase the newsprint capacity to almost 2.5 million tons by 2000.
The newspaper demand is forecasted to grow in Canada by 3.7 percent per year on average. In the terms of tonnage the demand in Western Canada will grow from the current 330,000 tla level to about 600,000 tons per year in 2000. In spite of this fairly healthy growth rate the newsprint demand is estimated to grow to almost 1.7 million tons by 2000.
-118-

4.5.5
4.5.5.1
western U.S. Newsprint Markets
U.S. west Newsprint Markets
The estimated newsprint demand in the U.S. West region was about 2.57 million tons in 1985. The same year the corresponding domestic production was about 1.6 million tons, of which 280,000 tons were exported to the Pacific Rim countries (Japan) and to Latin America. The main exporter was North Pacific Paper Co. (Norpac), which is jointly owned by Jujo Paper Co., Japan and Weyerhaeuser Co. The difference between demand and domestic shipments was supplied mainly by Canadian newsprint producers. As illustrated in Figure F.4.55 the biggest net exporter was British Columbia with 950,000 tons, or about 50% of the total newsprint production in the province. Of the other Canadian provinces, Ontario is the second biggest net exporter, with about 80,000 tons. Sweden and Norway, were the biggest Scandinavian exporters to the market area. Only minor net amount of newsprint was shipped to U.S. West from the other U.S. regions.
-119-

I.C. 110 .. .. o. .. .. o. .. .. .. ..
".1.1.11 OIiT AIIO 10 to
QUII.O "'UIITIII CAllAO A ao . 10 loao
::v~rrrrrr~rrvv~~.r;.; •• ~ ~----'--------' wwv •••••••••••••••••••••
v.v. vvvv... ••• o. .. 'CAIID ... A"IA
140 ::\~=========r========. OTH ••
'-______ ~ OV ••• IAI I •
• 1P0n ... 1 .. ~L ____ 4 __ ==4=====+-... OTH •• U" , 1101011
••
Figure F.4.SSb U.S. WEST - ESTIMATED NEWSPRINT DEMAND/SUPPLY STRUCTURE
The U.S. West newsprint production capacity was in 1985 1.68 million tons and the majority of T.4.34a). Some of namely Garden State
located in Oregon and Washington (Table mills used remarkable amounts of waste paper,
Paper, Smurfit Newsprint (Newberg) and Boise Cascade.
that the
was
-120-

Table T.4.34a u.S. West Newsprint Producers
Producer Capacity 1000 tons/year
Boise Cascade, Steilacoom, WA James River, Port Angeles, WA
Wauna, OR Garden State Paper, Pomona, CA Inland Empire, Millwood, WA North Pacific Paper, Longview, WAx) Smurfit Newsprint, Newberg, OR
Oregon City, OR Stone Container, Snowflake, AZ
TOTAL
Capacity Additions
Misc. Net Improvements * Smurfit newsprint * Other
1988
Great Lakes Forest Products, Usk, WA
Assumed New Machine, CA
TOTAL
ESTIMATED TOTAL CAPACITY IN YEAR 2000
170 20
120 120
60 400 330 210 250
1680
10 250
155
175
590
2270
(1991)
(1993)
x) Jointly owned by Weyerhaeuser Co. and Jujo Paper, Japan.
The capacity additions on the U.S. West market are shown in Table T.4.34. We have estimated that two new newsprint machines will be built in the region by year 2000 and the continuous improvements of the existing paper machines will additionally increase the capacity by 250,000 tons/year. The total capacity in year 2000 is thus estimated to be 2.3 million tons (Figure F.4.56).
The demand of newsprint is estimated to grow somewhat faster in U.S. West than in the other u.s. regions. This is caused by the development in setting technology providing the publishing/printing houses to move closer to the newspaper reader. As many intercontinental newspaper have been printed in the East and transported to the Westcoast, the computer technolgy now enables printing at the Westcoast and provides for a relatively faster growing newsprint demand.
-121-

The estimated imports demand of newsprint is about 1.3 million tons in 1992 and 1.S million in 2000.
3700 '3800 3500 3400 3300 3200 3100 3000 2900 2800 2700 2600
III 2500 c:
0 ... 2400 0 2300 0 0 2200 ~
2100 2000 1900 1800 1700 1600 1500
1982 1984 1986 1988 1990 1992 1994 1996 1998 2000
Veor C Production o Demond
Figure F.4.S6. ESTIMATED U.S. WEST NEWSPRINT DEMAND AND DOMESTIC PRODUCTION
-122-

The main competitors on the U.S. West newsprint market are summarized in Table T.4.35. The British Columbia producers clearly dominate the markets.
Table T.4.35 Main Competitors in the U.S. West Newsprint Markets
Producer 1000 tons/year
l. British Columbia 950
* British Columbia Forest Products
* MacMillan Bloedel
* Crown Forest Industries
2. Scandinavia 140
* Follum, Norway
* Norkse Skog, Norway
* Holmens Bruk, Sweden
* SCA, Sweden
3. Ontario 80
* Abitibi-Price
California and especially Los Angeles area is the biggest newsprint consumer in the U.S. West region. The largest daily newspapers are:
Publisher
1. Los Angeles Times, CA 2. San Francisco Cronicle, CA 3. Wall Street Journal, CA
(West edition) 4. San Diego Union, CA 5. Oregonion, Portland, OR 6. Phoenix Republic, AZ 7. Rockey Mountain News, Denver, CO 8. Orange County Register, Santa Ana, CA 9. Mercury News, San Jose, CA 10 Los Angeles Herald-Examiner, CA
Estim. 1000 tons/year
160 80 60
55 50 50 50 45 40 40
4.5.5.2 u.s. North Central Newsprint Markets
The Canadian dominance in the U.S. North Central market area is outstanding - about 85 percent of the 2.6 million newsprint demand is supplied by the Canadian producers as illustrated in Figure F.4.57. Of the Canadian share Ontario and Quebec share the major portion, 1.18 and 0.89 million tons respectively in 1985. About 60,000 tons of newsprint was shipped from the Abitibi-Price, Pine Falls, Manitoba mill to the
-123-

market area. The domestic newsprint is manufactured mainly by F.S.C. Paper Co., Alsip, IL. The overseas imports are of minor importance. About 280,000 tons of newsprint were shipped to the area also from other U.S. regions, mainly from U.S. South .
•• C. 10
PRAIRII to
ONTARIO. 11 to
" yyy YYV yyv 'iVY, YVV yvy yyv vvv VYV VVY vvv ----.....;--....
I I ,
oueuc ATLANTIC CANADA ~IO 40 1110
OVIRIIA. I
OTHeR UI ReGIONI
Ito
Figure F.5.57 U.S. NORTH CENTRAL: ESTIMATED NEWSPRINT DEMAND/SUPPLY STRUCTURE IN 1985.
There are no announced/planned capacity changes in the North Central area before year 2000. The capacity is estimated to increase only by about 25,000 tons to 145,000 tons during the same period.
Table T.4.36 U.S. North Central Newsprint Producers Capacity in 1986
Producer F.S.C. Paper Co., Alsip, IL Manistique Papers Inc., Manistique, MI
TOTAL
Capacity additions: Manistique Papers Inc., Manistique, MI Misc. improvements (--> 2000) Total
TOTAL ESTIMATED CAPACITY IN 2000
-124-
1987
1000 tons/year 100
20
120
20 5
25
145

The newsprint demand growth in compared to the average growth in to reach 2.95 million tons by the growth (Figure F.4.58).
3000
2800
2600
2400
2200
2000
1800
• 1600 c 0 I- 1400 0
8 1200 .. 1000
800
600
400
200
0
the North Central U.S. has been low the U.S. The total demand is estimated year 2000, that is a 1.4 percent annual
1982 1984 1986 1988 1990 1992 1994 1996 1998 2000
Yeor C Production ~ Oemond
Figure F.4.58. ESTIMATED U.S. NORTH CENTRAL NEWSPRINT DEMAND AND DOMESTIC PRODUCTION
The imports of newsprint is estimated to increase from the current 2.47 million tons to 2.6 million tons in 1992 and to 2.8 million tons by year 2000.
-125-

Table T.4.37 summarizes the main competitors in the U.S. North Central newsprint markets.
Table T.4.37 Main Competitors in the U.S. North Central Newsprint Markets
Supplier Imports
1. Ontario * Abitibi-Price * Q.N.S. Paper * Ontario Paper
2. Quebec * Abitibi-Price * CIP * Consolidated-Bathurst
3. U. S. South * Bowater Southern, TN
4. Manitoba * Abitibi-Price
1000 tons/year
1180
890
280
60
The newsprint consumption is concentrated into the Chicago and Detroit areas. The largest daily newspapers in the U.S. North Central region are as follows:
Publishers
1. Chicago Tribune, IL 2. Detroit News, MI 3. Detroit Free Press, MI 4. Chicago Daily Herald, IL 5. Wall Street Journal, IL 6. Cleveland Plan Dealer, OH 7. Minneapolis Tribune, MN 8. St. Louis Post-Dispatch, MO 9. Kansas City Times, MO 10 Des Moines Register, 10
-126-
Estim. Consumption 1000 tons/year
110 100 100
95 80 70 55 50 40 35

4.5.5.3 u.s. West South Central Newsprint Markets
The importance of the U.S. West South Central region as an importer of newsprint is remarkably less than the importance of the two other Western U.S. regions, the total imports, being modestly 260,000 tons in 1985 which represents about 20 percent of the total newsprint demand in the area. In addition to the U.S. South producers, the Canadian producers dominated the imports as shown in Figure F.4.59.
•. C. 1I0
PRAIRI • 10
ONTARIO ao
VV/VVYVVYVVVVVVV VYYVVVVYVVVVYVyyVV vvvv VVVY vvv '11'11'11" VVV "IVY vvv 'IVY 'IVY 'IVY "Ivy 'IVY
wyy 1260
QUEBEC 10
~~~ 0;~!ND ::: ~--~ "". "v .. .. v .. YV" Vy .. •• DO .... TIC '~~~~~~:: PROOUCTION
ItO
ATLANTIC CANADA 10 170
OVERSEAS ao
OTHIR U. '---------~--~-------------------4R.GION •
• 0
Figure F.4.S9. U.S. WEST SOUTH CENTRAL; ESTIMATED NEWSPRINT DEMAND/ SUPPLY STRUCTURE IN 1985.
The production of newsprint in the area is controlled by Boise Cascade and Champion International. Their total current capacity is about 1.03 million tons per year. The only planned new newsprint machine is the announcement by Kenaf International of building a newsprint mill in Southern Texas. We assume that a new machine will start up in 1995 and that the natural increase in existing capacity will be 170,000 tons by year 2000 (Table T.4.38).
-127-

Table T.4.38. U.S. West South Central Newsprint Producers
Suppliers Capacity
Present:
Boise Cascade, De Ridder, LA Champion International, Houston, TX Champion International, Lufkin, TX
Total
Estimated Additions:
Estimated 1 new newsprint machine in 1995
Misc. improvements
Total
ESTIMATED TOTAL CAPACITY IN 2000
1000 tons/year
300 420 310
1030
200
170
370
1.400
As well as the U.S. West region, the U.S. West South Central is a growing newsprint publishing/printing area. Based on the growth in the end use industry, we have estimated that the newsprint demand will reach almost 1.7 million tons by the year 2000 as indicated in Figure F.4.60.
-128-

1700
1600
1500
1400
! 1300 o l-
S 1200 .. 1100
1000
900
1982 1984 1988 1988 1990 1992 1994 1996 1998 2000
Year o Production <> Demand
Figure F.4.60. ESTIMATED U.S. WEST SOUTH CENTRAL NEWSPRINT DEMAND AND PRODUCTION
The imports of newsprint will remain at tons/year in 1991 and also in year 2000.
the current level; 0.4 million
The main competitors in the U.S. West South Central Markets are shown in Table T.4.39.
Table T4.39 Main Competitors in the U.S. West South Central Newsprint Markets
Supplier
1. Quebec * Abitibi-Price
2. Atlantic Provinces * Stora Forest Products
3. U. S. South * Bowater Southern, TN
4. Overseas * SCA, Sweden * Holmens Bruk, Sweden * Mondi, South Africa
-129-
Imports 1000 tons /year 60
50
60 30

The biggest daily newspapers in the U.S. West South Central region are the following:
Publisher
1. Houston Cronicle, TX 2. Dallas News, TX 3. Houston Post, TX 4. New Orleans Times, LA 5. Oklahoman, OK 6. Dallas Times Herald, TX 7. Wall Street Journal, TX
(Southern Edition) 8. San Antonio Express News, TX 9. American Statesman, Austin, TX 10 World, Tulsa, OK
San Antonio Light, TX
Estim. Consumption 1000 tons/year
65 60 50 40 35 35 35
25 25 20 20
4.5.5.4 summary of the western u.s. Newsprint Markets
The total import demand of newsprint to the Western U.S. market, including shipments from other U.S. regions, was in 1985 about 4 million tons. The strongest growth has taken place in the U.S. West region and the future capacity additions are expected to materialize in that area. Of the U.S. Western regions, North Central has the largest volume growth, an estimated capacity level increase of 340,000 tons/year from the present to year 2000.
4.5.6
4.5.6.1
Pacific Rim Newsprint Markets
Newsprint Markets in Japan
The domestic newsprint production dominates the supply on the Japanese market. Also part of the off-shore shipments from USA and Canada are controlled by Japanese companies: Jujo Paper, Oji Paper and Mitsui. Other major exporters to Japan in 1985 were Canada and the Scandinavian countries (Figure F.4.6l).
-130-

"PO'TI 10
.CAIIOIHAV.A aD
OT"I' 40
UIA 170
CAIIADA 100
Figure F.4.61 NEWSPRINT DEMAND/SUPPLY STRUCTURE IN JAPAN IN 1985
The total Japanese newsprint capacity, including the swing machines, is about 3.3 million tons and is produced in a number of small machines (Appendix A.4.7). Although there are no announced or planned new newsprint machines, the capacity is expected to grow with up to 3 million tons by the end of this century due to the continuous improving in efficiency of the existing machines. The demand of newsprint is forecasted to grow faster, about 2.0 percent/year, than the capacity (Figure F.4.62). Newspaper net imports will grow to about 400,000 tons/year during the next five years and will reach 700,000 tons by the year 2000.
-131-

• c 0 I-
0
8 ..
J7(i()
3600
3500
3400
3300
3~00
3\00
J(lOO
2900
28()()
2700
2600
2500 1980 1~2 1~4 1~6 ISS8 1~0 1~2 1~4 1~6 I~a 2000
Vii'
Q D6.~D
Figure F.4.62. NEWSPRINT DEMAND AND PRODUCTION IN JAPAN
The main exporters of newsprint to the Japanese markets are shown in Table T.4.40. The captive newsprint represented 60 percent of the total imports in 1985, which left about 130,000 tons for open market sales. The total capacity of the North Pacific Paper, Longview mill and the NBIP, Dalhousie mill, in which Japanese companies have equity interests is about 700,000 tons annually.
-132-

Table T.4.40. Main Competitors in the Japanese Newsprint Markets
Supplier Imports 1000 tons/year
l. USA 170
* North Pacific Paper Co. (Jujo Paper Co.)
2. Canada 100
* MacMillan Bloedel, BC
* Crown Forest Industries, BC (Fletcher Challenge, New Zealand)
* NBIP Forest Products, NB (Oji Paper Co. and Mitsui Co. )
3. Scandinavia 20
* Finnpap, Finland
Most of the open market sales of newsprint in Japan were handled by the Japanese trading houses, such as: Marubeni and Japan Pulp and Paper Co. Ltd. The two biggest daily Japanese newspapers Yomiuri and Ashahi Shimbu consume together a total of 1.2 million tons of newsprint annually.
4.5.6.2 Newsprint Markets in the Republic of Korea
Republic of Korea is a net exporter of newsprint as illustrated in Figure F.4.62a. The recent start-up of the Chonju Paper Mfg. Co. Ltd. 140,000 ton newsprint machine at Chonju mill will maintain Korea as a net exporter also in the future. After the start-up of the predicted new machine pressure to the export will grow by about 100,000 tons.
-133-

EXPORTS 10
.,
DeMAND 230
DOMI!STIC PRODUCTION
240
Figure F.4.62a. NEWSPRINT DEMAND/SUPPLY STRUCTURE IN THE REPUBLIC OF KOREA IN 1985.
The existing newsprint capacity is listed in Table T.4.4l.
Table T.4.4l Newsprint Capacity in the Republic of Korea
Producer Capacity
Chonju Paper Mfg. Co. Ltd., Chonju Daihan Paper Mfg. Co. Ltd., Seoul Sampoong Paper Mfg. Co. Ltd, Seoul SeDae Paper Mfg. Co., Ltd. Gumsum
TOTAL
-134-
1000 tons/year
160 18 22
146
346

The consumption of newsprint is estimated to grow up to 400,000 tons by the year 2000.
4.5.6.3 Newsprint Markets in People's Republic of China
Many small mills using non-wood fiber, producing several newsprint grades and each surving its immediate market area is currently the backbone of China's newsprint industry. The biggest newsprint producers are listed in Table T.4.42.
Table T.4.42. Newsprint Capacity in People's Republic of China
Supplier Capacity
1. Jiamusi Paper Mill 2. Jianxi Paper Mill 3. Jilin Paper Mill 4. Guangzhou Paper Mill 5. Guilin Paper Mill 6. Liushou Paper Mill 7. Ming Foon Paper Mill 8. Nanning Paper Mill 9. Nauping Paper Mill 10. Qigihar Paper Mill 11. Shixian Paper Mill 12. Yibin Paper Mill 13. Yueyang Paper Mill
TOTAL NEWSPRINT CAPACITY
1000 tons/year
50 40 70
100 39 40
2 39 64 80 60 50 40
647 (Swing Capacity 70)
The capacity utilization degree in the newsprint industry have been rather low and for example the domestic production marketed only 430,000 tons in 1985 (about 90 percent utilization). Of the total demand, 600,000 tons, about 270,000 tons were supplied by Canadian and Scandinavian companies (Figure F.4.63).
-135-

I .. oni \0
" J
YV""V',' Y v v v v v y \' .• ,,' V
DOMESTIC ~~--..~ PRODUCTION
.nO
CANADA 200
ICANOINAYIA .0
Figure F.4.63. NEWSPRINT DEMAND/SUPPLY STRUCTURE IN PEOPLE'S REPUBLIC OF CHINA IN 1985
China is planning to double their paper and board consumption by year 2000. The total paper and board output will be about 20 million tons/year by then. Also the newsprint demand is estimated to double during the same period and should reach about 1.6 million tons by the end of the century.
Machine rebuild participation in interest taken by Chinese market are
programs, purchases of second hand machines, capital ventures outside China and the increasing the international forest products suppliers in the all recent signs of an industry keen to expand.
In the newsprint industry the following capacity changes are already announced:
1. Guangzhou Paper Mill * PM (3) rebuilt (86-89)
2. Jilin Paper Mill * New secondhand machine (1987)
-136-

3. Liuzhou Paper Mill * PM rebuilt (1986)
4. Yueyang Paper Mill * PM rebuilt (1987)
In spite of the several expansion estimated to increase moderately to tons in 2000 (Figure F.4.64).
• c: o .. o 8 ...
1600
l!500
1400
1300
1200
1100
1000
900
800
700
800
!l00
400,
300
programs, the imports of newsprint is 400,000 tons in 1992 and to 800,000
1980 1982 1984 1988 1988 1990 1992 1994 1998 '998 2000
V .. ,.
o Production + Oemand
Figure F.4.64. NEWSPRINT DEMAND AND PRODUCTION IN PEOPLE'S REPUBLIC OF CHINA
The main competitors in the Chinese newsprint market are Canada (B.C. producers), Finland and Sweden.
4.5.6.4 Summary of the Pacific Rim Newsprint Market
In Table T.4.43 the newspaper imports demand is summarized for the Pacific Rim countries. The total net imports to the Pacific Rim, not included in the market survey, was about 590,000 tons in 1985. This was
-137-

supplied mainly by Canada (200,000 tons), Norway (75,000 tons,) Finland (65,000 tons), Sweden (65,000 tons) and USA (50,000 tons).
Table T.4.43 Newsprint Import Demand in Some Selected Pacific Rim Countries
County
Japan Republic of Korea People's Republic
Total
Australia New Zealand Taiwan Hong Kong Philippines Malaysia Thailand Indonesia Singapore
TOTAL
of Korea
1985
250 -10 250
490
180 -170
90 120
100 110
60 100
590
1000
4.5.7 Summary of Newsprint Markets
tons/year 1992
400 -40 400
760
Not Calc.
2000
700
800
1500
Not Calc.
The market supply/demand outlook is presented in Table T.4.43.A for the selected market areas. The Western Canadian producers clearly dominate the exports in these selected market regions while the U.S. West and U.S. North Central regions are the main importers of newsprint. Japan and the People's Republic of China are growing net importers of newsprint in the Pacific Rim area.
Table T.4.43.A. Newsprint Market Outlook in Selected Market Areas
Demand Prod. Import Export (1000 tons/year)
Market Area '85 '92 '00 '85 '92 '00 '85 '92 '00 '85 '92 '00
Domestic 330 450 600 1680 1980 2300 0 0 o 1350 1530 U.S. West 2570 3100 3650 1600 1850 2200 1250 1530 1730 280 280 U.S. North Central 2600 2750 2950 130 140 145 2470 2610 2805 0 0
U.S. West South Centro 1250 1450 1700 990 1040 1300 260 410 400 0 0
Japan 2840 3050 2660 2590 2650 2960 330 400 700 80 0 Rep. of Korea 230 310 410 240 350 410 0 0 0 10 40 People's Rep. of China 660 1000 1600 430 600 830 240 410 780 10 10
TOIAL 10480 l2110 14570 7660 8610 1014~ 4~50 5360 641~ 1730 1860 -138-
1700 280
0
0 0 0
10
1990

4.6 Distribution Channels
Figure F.4.65 shows common shipment sizes for the paper grade of interest. For newsprint and SC-rotogravure, SC-offset and LWCrotogravure the proportion of large shipments dominate while for LWCoffset grade the proportion of small orders is rather high.
NEWSPRINT
SC ROTO
SC OFFSET
LWC ROTO
LWC OFFSET
WF CTD. SHEET
PERCENTAGE OF TONNAGE 0 20 40 60 80 100
~ ~ ~ rzzI D 0-49.9 50-99.9 100-199.9 200-499.9 500-
Figure F.4.65. SHIPMENTS SIZES FOR GROUNDWOOD PAPERS
For reference also the average shipment size of coated freesheet paper is illustrated.
Major North American, newsprint, SC- and LWC-producers normally have distribution channels of their own. In the solid bleached board industry about 60, of the production was shipped directly to the integrated converting plants, the rest being distributed by the company's owned agencies and independent brokers.
-139-

In the following section the printing and writing papers of detail.
Newsprint
most vulnerable segment distribution of off-shore imports is analyzed in more
Of the 330,000 tons of off-shore imported newsprint sold in the U.S, about 90 percent were sold through foreign or independent organizations. These distributions do not normally have any storages in the U.S., although Finnpap has a 30 day warehouse in the Philadelphia region.
The Swedish Stora Gruppen seems to have the greatest number of representatives in the U.S.; Zellerbach Paper Co., Blake Moffit & Town, General National-Gottesman. and Monarch Paper.
In addition to the direct sales channels, SCA from Sweden has its representative in California (Behrens Pulp and paper Co.).
The South-African tonnage is sold primarily by General NationalGottesman, Price and Pierce and Richard Lewis Paper.
Finnish newsprint selling is handled by Finnpap and Madden Corp. , while the Norwegian imports is sold by Nor-News, an organization owned by Norwegian newsprint producers.
SC-Paper
Almost all of the 350.000 tons of SC-paper imported (off-shore) to the U.S. were distributed by foreign or independent sales organizations. Some of the Norwegian and Swedish tonnage was directly sold to Sears and R.R. Donnelly. In the large order business there is no business for merchants. On the other hand it is normal that the sales organizations allow brokers to sell part of the tonnage to their customers.
In addition to FinnpapjMadden Corp. sales part of the Finnish tonnage is sold by Myllykoski and probably by Rauma-Repola after its resignation from Finnpap.
Coated Paper
In 1985, about 380,000 tons of coated paper was imported to the U.S. from off-shore sources. About 50 percent of this was sold by foreign or independent sales organizations. In many cases the remaining 50 percent was imported by the converters in full size and repacked under their own private labels.
The largest importer in 1985 was Madden Corp. The second largest tonnage of off-shore imports from Feldmuhle AG was distributed by Services Merchandise, Meredith-Burda and General National-Gottesman.
-140-

In Japan and Republic of Korea important importers of pulp and the major importers to Japan:
* Japan Pulp & Paper Co. Ltd. * Kanematsu Gosho Ltd. * Koike Sangyo K.K. * Nippon Kores K.K. * Nippon Paper Trading Co. Ltd. * Okamoto Co. Ltd. * Sanko Co. Ltd. * Toyo Pulp Co. Ltd. * Spicers Japan Ltd. * Wiggins Teape Ltd.
the local trading houses are the most paper. The following list summarizes
In the People's Republic of China paper imports are controlled by the government; China National Light Industrial Products Import and Export Corp. and Paper Industry Bureau of the Ministry of Light Industry. To be able to successfully do business in China it is necessary to use agents located in Hong Kong or Singapore or similar.
-141-

5. EVALUATION OF ALBERTA'S COMPETITIVENESS
5.1 General
This section evaluates the competitiveness of Alberta against other major paper producers competing in the same market areas as Alberta. The objective of the evaluation is to provide enough information to select two value added paper products, of the four included in the market survey, for further financial evaluation.
Only new greenfield installations were considered and all were compared on an equal hypothetical basis. The capital charge portion thus is higher than for existing old mills. The operating costs, however, reflect quite well the situation in modern existing mills of this type.
5.2 Identification of Potential Competitors
A summary of the competitors in the surveyed market areas is presented in Table T.S.l.
Table T.S.l. Potential Competitors in the Surveyed Market Areas
Competitor/ Market
B.C. Eastern Canadal )
u.s. US North- Pacific
US South
Scan. & Germany
east Northwest
Domestic News News, FBB, FBB SC, LWC
U.S. West News News, SC, SC News, FBB FBB, LWC News, SC, LWC LWC
US N/C News, SC SC News, FBB News, SC, LWC LWC
US W/S/C News SC News, FBB News, SC LWC LWC
Japan News FBB News, FBB SC, LWC
China News News, FBB SC, LWC
1) Quebec and Ontario
-142-

Competitors in the surveyed market areas are thus:
* British Columbia * Quebec and Ontario (Eastern Canada) * U.S. Northeast (SC paper only) * U.S. Pacific Northwest * U.S. South * Scandinavia (Finland for all grades/Sweden for newsprint only) * Germany
Based on the existing situation geographical mill locations have competitors:
in been
the market areas, the following included as Alberta's potential
1. For all paper grades British Columbia (interior B.C.) Eastern Canada (Ontario and Quebec) U.S. South U.S. Pacific Northwest (U.S. PNW) Finland
2. For SC paper additionally U.S. Northeast
3. For newsprint additionally Sweden
5.3 Comparison of unit Prices as Production Cost Components
5.3.1 Wood Raw Material Cost
Two reasons for locating a pulp and paper operation in Alberta are the vast forest resources available and the reasonable Crown timber dues (stum~age fees). Currently these fees range from CAD 0.18 to CAD 1.22 per m for softwood suitable for pulping. Hardwood fees are somewhat lower than this, about CAD 0.25 to CAD 0.50 per m3 .
Delivered wood costs are heavily dependent mill and the log size. Recent estimates can be delivered at costs ranging from CAD T.5.2 shows a typical breakdown of these the mill site.
-143-
on the haul distance to the show that softwood roundwood
22 to CAD 27 per m3 . Table costs plus chipping costs at

Table T.5.2. Alberta Softwood Chip Costs(l)
Cost Item
Felling/skidding/decking Loading Hauling (2) Road Construction Forest Management Reforestation Stumpage Fees
Subtotal
Chipping at mill site
10.54-12.45 1. 04-1. 22 4.05-4.75 1.70-2.01 1.84-2.19 2.65-3.16 0-18-1.22
22.32-26.88
1.83-2.19
CAD/BDT
28.88-34.11 2.85-3.34
11.10-13.01 4.66-5.51 5.04-6.00 7.26-8.66 0.49-3.34
61.16-73.64
5.01-6.00
TOTAL 24.15-29.07 66.17-79.64 (1) In this study, softwood is assumed to have a density of 370 to 400
kg per green m3 . (2) Average haul of 85 km
The data in T.5.2 are based on a 85 km average haul distance and on experience in western Alberta where there is a well developed logging road system. In the three northeastern forest areas considered in this study. however. the average haul distance will be on the order of 150 km and the cost of constructing roads where none exist will be significantly higher. For the purposes of this study, the following costs for hauling and infrastructure development are assumed:
Hauling Road Construction
This raises the total cost (Fort McMurray) including 79.32-95.l0/BDT).
CAD 7.l5-CAD 8.38/m3 CAD 3.40-CAD 4.02/m3
of softwood chipping to
delivered to the study site CAD 28.95-CAD 34.7l/m3 (CAD
Softwood chips from sawmills are also available in Northeastern Alberta. According to the Alberta Forest Service, the average delivered price for softwood chips in the province averages about CAD 60 per BDU (CAD 55.13 per BDT). Transportation is the biggest factor determining this cost as shown here:
Chip Cost f.o.b. Sawmill Transportation Cost Chip Cost f.o.b. Pulpmill
-144-
CAD 25/BDU CAD 35/BDU CAD 60/BDU

This cost of residual chips seems low in comparison with the cost of chips from roundwood. However, in light of the fact that a typical Alberta Forest Management Agreement obligates a company to utilize chips (otherwise wasted) at the weighted average price received for wood chips of equal quality at producing sawmills in Alberta, the CAD 55/BDT is assumed valid for the purposes of this study.
Hardwood costs in Alberta are also very sensitive to the haul distance to the mill. A recent study showed that delivered hardwood log costs varied from CAD 19.30 to CAD 35/m3 (CAD 53.61 to CAD 99.08 per BDT) for haul distances of 36 to 216 km, respectively. Other studies show the delivered cost of hardwood to range from CAD 71.39 to CAD 88.19 per BDT. Hardwood is not utilized in any of the four paper and paperboard grades studied here.
A comparison of softwood chip costs in the competing areas is summarized in Table T.5.3.
Table T.5.2A. Prices of Wood Raw Materials
Northeast Alberta B.C. Eastern Canada U.S. South U.S. North U.S. Pacific Northwest Finland Sweden
Softwood CAD/BDT Chips
90 64 95 71 80 65
170 150
Note: The price figures are based on raw material available (chips, roundwood) in the specific areas.
Northeastern Alberta is in a favorable position only in comparison with northern Europe and possibly eastern Canada. From a papermaking standpoint, however, the Alberta wood species consisting of lodgepole pine, white spruce, black spruce and balsam fir, are generally superior to U.S. Southern pines and even Pacific Northwest hemlock and douglas fir. Pulping yields for Alberta species are also marginally higher than for southern pines and Pacific Northwest species.
5.3.2 Energy Cost
Table T.5.3 presents the energy regions. In the areas where available (e.g. U.S. Northeast, taken at the actual market price jbbl).
prices for the different competing no "low cost energy" typically is
Scandinavia) the fuel price has been of No. 6 fuel oil (approximately USD18
-145-

Table T.5.3. Energy Prices in the Competing Areas
Heat in Power Fuel Steam CAD/M'Wh CAD/GJ CAD/GJ
Alberta 24 1.8 2.25 B.C. 24 3.2 4.00 Eastern Canada 23 4.2 5.25 U.S. South 55 2.1 2.62 U.S. Northeast 55 3.0 3.75 U.S. Pacific Northwest 30 1.6 2.00 Finland 50 3.0 3.75 Sweden 40 3.0 3.75
5.3.3 Chemicals Cost
The cost of chemicals used in the comparison is summarized in Table T.S.4.
-146-

Table T.S.4. Cost of Chemicals, CADit chemical
Alberca a.c. Ea.carn u.s. u.s. u.s. Finland Swadan Canada So .. th Ptill NOl:th
Mechanlcal p .. lplng cha.ical. Sodluahydroxida, NaON 230 220 300 200 220 220 260 Sodl ....... lphita, N~ ~ 1S0 115 970 940 160 230 930 Hydl:ogan paroxida, H 2 . 1,600 1,600 1,600 1,700 1,700 1,700 1,270 Sodi .... s1l1cat. 320 320 320 320 320 320 320
Papar.aking che.ica1. aetantion aid 1,230 1,230 1,lS0 800 aoo aoo 650 800 A1 .... 230 230 210 210 230 210 290 300 Dafo..an 3,000 3,000 3,000 2,000 2,000 2,000 1,500 2,000 SU.icid. atc, (utiuea) 1,500 1,500 1,500 1,500 1,500 1,500 1.,500 1,500
Calci .... carbonata, Ca~ fillar lrada 228 184 162 175 170 137 coacin8 Irada, No. 1 275 234 220 225 221 165
lCaol1n FUler lrade 250 198 183 128 198 160 112 Coacinl lrada, Ho. 1 294 242 227 144 242 212 Coacing Irada, No. 2 266 214 199 128 214 212 Dal .. tnatad clay 303 251 236 181 251 212
aoain abe 1,230 1,230 1,150 800 100 100 650 100
Starchu Pearl starch 545 555 475 445 500 500 Cacontc lltal:ch 1,041 1,057 911 1,335 1,395 675
Synthetic r •• tn PVAC 2,258 2,270 2,130 1,390 1,390 2,060 5·11 lacex 2,450 2,400 2,000 1,700 1,800 2,000 CKe 5,200 5,200 5,140 4,160 4,220 3,000 Dyu (e.duta) 10,000 10,000 10,000 10,000 10,000 10,000
With regard to the chemicals used in mechanical pulping processes, Alberta is comparable to other locations,
The main paper making chemicals (clays, calcium carbonates, starches and resins), however, must be imported from the U.S. or Eastern Canada. High freight rates increase the cost of these chemicals compared to the competing areas.
5.3.4 Purchased Pulps
The prices of market pulps were taken as those prevailing for the third quarter of 1986. These prices are as shown in Table T.s.s. A separate column shows the actual market pulp prices in Canadian dollars,
-147-

Table T.S.S. Price of Market Pulp, CAD/ADT
Bleached kraft, softwood Semibleached kraft, softwood Bleached CTMP, softwood Bleached CTMP, hardwood
1986/III 640 625 513 493
1987/II 629 614 504 485
The prices are assumed to be similar in all competing areas :n North America.
5.3.5 Labour Cost
The comparisons are based on the labour costs and working hours summarized in Table T.5.6 below. A four shift work schedule is assumed for the North American areas, while the Scandinavian labour costs presume a five shift work schedule.
Table T.5.6. Labour Costs
Operating Maintenance Admin. Average Labour Labour and other, Working
Average Time CAD/h CAD/h CAD/h h/year
Alberta 21 23 29 2000 B.C. 22 24 31 2000 Eastern Canada 22 24 30 2000 U.S. South 23 25 33 2000 U.S. PNW 31 33 39 2000 U.S. North 26 28 33 2000 Finland 21 21 26 1800 Sweden 23 23 30 1800
5.4 Transportation costs
Alberta is at a disadvantage when it comes to moving paper and board products to customers. The reasons for this key mainly on two factors:
* Alberta's relative isolation from major markets compared to its competitors.
* The current rail rate structure in Canada.
-148-

Notwithstanding the generally higher rail rates in Canada, truck rates are about CAD 0.808 per km; U.S. rates are USD 0.808 per km. This gives Canadian trucking a 25 percent cost advantage over U.S. trucking. On a per metric ton basis, paper and paperboard can be shipped for CAD 0.037 per ton-km while in the U.S. it costs CAD 0.049 per ton-km.
Table T.5.7. compares the costs for shipping the four grades considered in this study from competing mills. To develop this table a unique market distribution was selected for each grade and millsite. For example, a mill producing SC in Quebec would ship no paper to Los Angeles or Tokyo, while the same mill in Alberta would ship 50% and 15% to these two areas, respectively. In all cases, the market distribution assumed for each mill and grade was based on the results of the market survey in Section 4 of this report.
Table T.5.7. Transportation Costs - Alberta Mill Versus Competing Mills
Mill Paper/Paperboard Grades Location News SC LWC FBB
CAD/ton
Alberta 148 144 145 156 NE Canada 53 39 109 36 East U.S. * * * 64 South U.S. * * 95 41 SE U.S. 53 * * * NE U.S. * 141 * * NW U.S. 76 71 77 77 Interior B.C. 128 103 132 * Finland 133 124 119 104
* No competing mill assumed for this grade or location.
In all cases transportation costs are higher from a mill in Alberta than from competing mills. As mentioned above, one reason for this is Alberta's location relative to potential markets. Another reason not evident from Table T.S.7 are the currently low ocean freight rates for competitors.
5.5 Taxes
Canada, like other western industrialized countries, is reforming its tax code to broaden the base, to reduce tax preferences, and to enhance overall revenue. Table T.S.8 shows the tax situation in Canada before and after tax reform. Federal tax reform legislation will probably be introduced in June 1987 and implemented in 1988.
-149-

Table T.5.8. Status of Corporate Tax Situation in Canada and Alberta
After fresent Tax Reform
Federal Income tax (1) (%) 28 26 Sur Tax (%) 3 0 Sales Tax (Construction items) (%) 8 0 Sales Tax (Other goods) (2) (%) 12 0 Business Transfer Tax (3) (%) 0 6-8
Alberta Income Tax (4) (%) 9 9 Sales Tax (%) 0 0 Property Tax (5) (%) 3/4 3/4
(1) Present rates are being reduced from 28 percent% in 1987 to 27 percent in 1988, to 26 percent in 1989 and beyond.
(2) Also assessed on all imported manufactured goods. Imported machinery also subject to Canadian tariffs depending on type of machinery.
(3) A value added tax (VAT) applied across-the-board to all goods and services.
(4) Effective April 1, 1987 (5) Estimate only. Applied to capital cost of project including land.
Along with tax rates, depreciation schedules (capital cost allowances) and the investment tax credit (ITC) will be modified as shown in Table T.5.9.
Table T.5.9 Changes to Capital Cost Allowances and Investment Tax Credits in Canada
Allowance Present After Reform
Capital Cost Allowance Manufacturing Equip. (%) (1) 20 (2) Buildings (%) 5 (2) 5 (2) Other Property (%) 20 (2) 20 (2)
Investment Tax Credit Normal (3) (%) 5 0 NW Alberta (4) (%) 40 0
(1) Taken in three consecutive years at rates of 25 percent, 50 percent and 25 percent, respectively, calculated on original investment.
(2) Calculated on declining balance (3) To be reduced to 3 percent in 1988 and 0% in 1989 and thereafter;
a 20 percent credit for R&D expeditures will remain. (4) NW Alberta (north of Edson & Whitecourt and not including Grande
Prairie) is a Special Investment Tax Credit area. Tax reform may eliminate this credit.
-150-

Carry forward of operating tax losses will remain unchanged at seven years.
5.6
5.6.1
Manufacturing Cost Comparison of SC Paper Production
Basic Data
The SC paper manufacturing is based on an integrated production of bleached softwood thermomechanical pulp and purchased bleached kraft softwood pUlp. An alternative concept for Alberta was included, based on integrated TMP production and purchased bleached CTMP and bleached kraft pulp. Table T.5.10 summarizes the furnish used in the comparisons.
Table T.5.10. Furnish for SC Paper
Basis wt g/m2 Furnish
CTMP, swd % TMP, swd % BK, swd % Filler %
TOTAL ,
Alta Alta B.C. Alt. 1 Alt. 2
60
23 40 12 25
100
60
o 58 17 25
100
60
o 58 17 25
100
Canada U.S. U.S. U.S. Finland East South PNW North
60
o 58 17 25
100
60
o 55 20 25
100
60
o 58 17 25
100
60
o 56 17 25
100
60
o 58 17 2S
100
Table T.5.11 summarizes the production and the fiber and wood demands of the SC paper mill.
Table T.5.ll. Production, Fiber and Wood Demands for the SC Paper Mill
Production Fiber demand
TMP (integrated) Purchased CTMP Purchased BK
Clay demand
Wood demand Fiber losses Clay losses
tp/yr
ADt/yr ADt/yr ADt/yr BDT/yr
BDT/yr % %
Alta A1t 1
175,000
73,700 42,400 22,000 42,800
75,000 2 5
-151-
Alta A1t 2
175,000
107,000
31,300 42,800
109,000 2 5
U.S. South
175,000
101,500
37,000 42,800
105,500 2 5
Other Areas
175,000
107,000
31,300 42,800
109,000 2 S

The main data for the integrated mechanical pulp production are summarized in Table T.5.l2. At this stage it is assumed that the wood raw material is 100 percent chips, and the product is pulp in slush form.
Table T.5.l2. Process Conditions for Production of the Mechanical Pulp Component of SC-Paper
Mechanical Pulp Integrated
Wood Raw Mat.
Refining yield % Bleach yield % H202 % Na2Si03 % Refining power demand,
kWh/tp Other power demand
kWh/tp Fiber and wood losses %
Heat recovered %1) to steam
Alta B.C. Can. U.S. U.S. U.S. Finland East South PNW North
TMP TMP SWD S'WD
95 95 98 98
2.5 3 3 3
2450 2500
300 300
5 50
5 50
TMP TMP S'WD S'WD
95 95 98 98
2.5 4 3 3
2450 3020
300 300
5 50
5 50
TMP IMP TMP S'WD SWD SWD
95 95 95 98 98 98
4 3 2.5 333
2500 2400 2400
300 300 300
5 50
5 50
5 50
1) Percent of refining power input.
-152 - .

Table T. 5.13 shows the main data for the SC paper mill.
Table T.S.13. Main Data for the SC paper Mill
I.C. Eastern u.s. u.s. u.s. Finland A1t 1 A1t 2 Canada South PIN North
lIood de .. nd OOf/tp 0.42 0.63 0.63 0.63 0.60 0.63 0.63 0.63 Fiber detUnd
ntP ADt/tp 0.42 0.61 0.61 0.61 0.58 0.61 0.61 0.61 Purchased CTKP ADt/tp 0.24 Purchased lit ADt/tp 0.125 0.18 0.18 0.11 0.21 0.18 0.11 0.18
Clay deund ODt/tp 0.24 0.24 0.24 0.24 0.24 0.24 0.24 0.24 Che.icals k&/tp
H 0 k&/tp 10 14 17 14 21 17 14 14 Ma S10 kl/tp 12 17 17 17 16 17 17 17 Ret. aid k&/tp 4.0 4.0 4.0 4.0 4.0 4.0 4.0 4.0 A1 .. kl/tp 10.0 10.0 10.0 10.0 10.0 10.0 10.0 10.0 Other k&/tp 0.8 0.8 0.8 0.8 0.8 o.a O.S 0.8
Labour Maintenance h/tp 1.3 1.3 1.3 1.l 1.3 1" 1.3 1.3 Operaeinl h/tp 1.6 1.6 1.6 1.6 1.6 1.6 1.6 1.6 Other h/tp 0.46 0.46 0.46 0.46 0.46 0.46 0.46 0.46
Maintenance .. t'le , on 1.5 1.5 1.5 1.5 1.5 1.5 1.5 1.5 tnve.ttUne
Heee Paper M111 CJ/tp 4.5 4.5 4.5 4.5 4.5 4.5 4.5 4.5 He.t recovered
frOli CJ/tp 1.8 2.7 2.7 2.7 3.2 2.7 2.7 2.7 ntP/CTKP .Ul Net heat CJ/tp 2.7 1.8 1.S 1.8 1.l 1.1 1.8 1.8
Pover THP kllh/tp 1,150 1,675 1,710 \,675 1,925 1,710 l,67S 1,675 PH kllh/tp 450 450 450 450 450 450 450 450 Oehar kllh/tp lOO 300 lOO 300 lOO 300 300 300 Total kWh/tp 1,900 2,425 2,460 2,425 2.67S 2,460 2,425 2,425
-153-

5.6.2 cost Comparison of SC Paper Manufacturing
The operating costs were calculated from the process data given in Table T.s.13 and the unit costs defined earlier. Typical industry data for packaging materials, supplies, sales costs and overhead were added to the operating costs.
Fixed capital costs were included based on 15 years depreciation at 10% interest calculated as equal annual payments on the fixed investment.
Because of the significant differences competitors and market areas, Alberta's three destination areas:
Los Angeles Chicago and China (Xing Yang)
in freight costs between the competitiveness is shown for
The costs are summarized in Table T.s.14 (with freight to the Los Angeles area). Corresponding bar charts are shown in Figures F.s.1, F.s.2, and F.5.3 for the different destinations Los Angeles, Chicago and China.
Table T.5.14. Comparison of Manufacturing Costs of SC Paper
Alta. A1t 1
Alta. A1t 2
B.C. Canada U.S. U.S. PNW
U.S. North
Finland
Chips & Purch pulp 237 158
Chemicals 93 102 Energy 51 63 Labour 74 77 Other1) 115 120 Total oper. cost 570 520
Cap. chg 220 237 Freight to L.A. 147 147
TOTAL 937 904
East South (CAD/ton paper)
156 174 170 93 84 81 65 66 149 81 80 84
121 118 118
516 522 602 249 225 222
127 220 150
892 967 974
1) Other includes maintenance materials, supplies, costs and overhead.
-154-
155 165 220 100 82 66
76 139 126 111 85 74 120 120 120
562 591 606 242 238 237
77 250 133
881 1080 976
packing materials, sales

1.2
1.1
0..
0.1
~i 0.7
3: 0.. l
.0
tE- 0.5 tJ 0.4
O~
0.2
0.1
0 AL.B-GIt 1 AUI-GIt 2 ~t.8.c. CAH-EAS1' U.S.SOUTH u.s.PMI U.s.HORTH I'IHI.MO
Figure F.5.1. SC PAPER SALES PRICE REQUIREMENT, DELIVERED TO LOS ANGELES
1.2
1.1
G.I
G.I
0.7
0.1
0.1
Figure F.5.2. SC PAPER SALES PRICE REQUIREMENT, DELIVERED TO CHICAGO
-155-

1.2
1.1
0.1
o.a
~ ... 0.7
81 0.1 ,i ~~ 0.5
0 ••
0.3
Q.2
0.1
0
Figure F.S.3. SC PAPER SALES PRICE REQUIREMENT, DELIVERED TO CHINA
Based on Table T.S.1S and Figures F.S.l, F.S.2 and F.S.3, it can be concluded that only the British Columbia mills should have lower operating costs than the Albertan ones.
With the product delivered to the Los Angeles area, British Columbia and the U.S. Pacific Northwest are in a better position. In the Chicago area the U.S. South and Eastern Canada would have lower costs. In China again only British Columbia would be in a more favorable cost situation.
The differences in total costs between Alberta, British Columbia and the Pacific Northwest are relatively minor with respect to the Los Angeles and China market areas.
5.7
5.7.1
Manufacturing Cost Comparison of LWC Paper Production
Basic Data
The LWC paper manufacturing is based on an integrated production of bleached softwood thermomechanical pulp and purchased bleached kraft softwood pulp. As in the SC paper case an alternative concept for Alberta was included, based on integrated TMP production and purchased bleached CTMP and bleached kraft pulp.
-lS6-

Table T.s.ls. Summarizes the paper furnish used in the comparison.
Table T.s.ls. Furnish for LWC Paper
Alta. Alta. B.C. Canada U.S. U.S. U.S. Finland Alt 1 Alt 2 East South PNW
Basis wt gLm2 60 60 60 60 60 60 60 60 Coating, g/m2/side 10.5 10.5 10.5 10.5 10.5 10.5 10.5 10.5 Furnish (% of paper)
BK swd 22.7 29.3 29.3 29.3 29.3 29.3 29.3 29.3 CTMP hwd 13 0 0 0 0 0 0 0 TMP, swd 29.3 35.7 35.7 35.7 35.7 35.7 35.7 35.7 Coating 35 35 35 35 35 35 35
Table T.5.l6 summarizes the production and the fiber and wood demands of the LWC paper mill.
Table T.5.l6. Production and Wood Demand for LWC Paper Mill
Alberta Other Alt. 1 Alt. 2 Areas
Production tp/yr 175,000 175,000 175,000 Fiber demand
TMP (integrated) ADt/yr 54,000 65,900 65,900 Purchased BCTMP ADt/yr 24,000 Purchased BK ADt/yr 41,900 54,000 54,000 Coating material
demand BDT/yr 60,000 60,000 60,000 Wood demand BDT/yr 55,000 66,500 66,500 Fiber losses % 2 2 2 Clay losses % 5 5 5
The main data for the integrated mechanical pulp production are summarized in Table T.5.l7. At this stage it is assumed that the wood raw material is 100% chips, and the product is bleached TMP pulp in slush form.
-157-
35

Table T.5.l7. Process Conditions for Production of the Mechanical Pulp Component of LWC Paper
Canada U.S. U.S. Alta B.C. East South PNW Finland
Mech. Pulp Integrated TMP TMP TMP TMP TMP TMP Wood raw mat. SWD SWD SWD SWD SWD SWD
Refining yield , 95 95 95 93 95 95 Bleach yield , 98 98 98 98 98 98 H202 , on pulp 2.5 3 2.5 4 3 2.5 Na2Si03 % on pulp 3 3 3 3 3 3 Refining power demand
KWh/Adt 2650 2700 2650 3200 2700 2600 Other power demand
KWh/Adt 300 300 300 300 300 300 Fiber and wood
losses , 5 5 5 5 5 5 Heat recovery
,1) degree 50 50 50 50 50 50
1) Percent of refining power input.
Table T.s.18 summarizes the main data for the LWC paper mill.
Table T.s.18. Data for the LWC Paper Mill
Alberta Alberta I.C. Ea.tem U.S. U.S. Finland A1t 1 A1t 2 Canada South PW
Vooct cte.and ODT/qJ 0.31 0.38 0.38 0.38 0.38 0.38 0.38 Fiber cteunct
TltP ADt/tp 0.31 0.38 0.38 0.38 0.38 0.38 0.38 lurcha.ect CTKP ADt/tp 0.14 lurcha.ed IK ADt/tp 0.24 0.31 0.31 0.31 0.31 0.31 0.31
Coeting uteria1 deund OOt/tp 0.34 0.34 0.34 0.34 0.34 0.34 0.34
ahe.ical. klltp H 0 klltp 10 14 17 14 21 17 14
• Na SiO klltp 12 17 17 17 16 17 17 Ret. aid klltp 5.0 5.0 5.0 5.0 5.0 5.0 5.0 A1u. klltp 15.0 15.0 15.0 15.0 15.0 15.0 15.0 Other klltp 1.0 1.0 1.0 1.0 1.0 1.0 1.0
Labour Haintenance h/tp 1.31 1.31 1.31 1.31 1. 31 1.31 1.31 Operating h/tp 1.7 1.7 1.7 1.7 1.7 1.7 1.7 Other h/tp 0.51 0.51 0.51 0.51 0.51 0.51 0.51
Maintenance ut'1& , on 1.5 1.5 1.5 1.5 1.5 1.5 1.5 Heat
Paper H111 CJ/tp 6.5 6.5 6.5 6.5 6.5 6.5 6.5 Heat recovered fro. CJ/tp 1.5 1.9 1.9 1.9 2.2 1.9 1.9
TKP/CTKP .111 Net heat CJ/tp 5.0 4.7 4.6 4.6 4.3 4.7 4.6
Power TltP kWh/tp 950 1,160 1,180 1,160 1,380 1,180 1,160 PH kWhltp 500 500 500 500 500 500 500 Other kWh/tp 300 300 300 300 300 300 300 Total kWh/tp 1,750 1,960 1,980 1,960 2,180 1,980 1,960
-158-

5.7.2 cost Comparison of LWC Paper Manufacturing
The operating costs were calculated from the process data given in Table T.S.19. Typical industry data for packaging materials, supplies, sales costs and overhead were then added to these costs.
Fixed capital costs were included based on 15 years depreciation time at 10 percent interest calculated as equal annual payments on fixed investment.
As for the SC-paper grade, the competitiveness of Alberta is shown for three destination areas.
Los Angeles Chicago China (Xing Yang)
The costs are summarized in Table T.S.19 with freight to the Los Angeles area. Corresponding bar charts are shown in Figures F.S.4, F.S.S and F.S.6 for the different destinations Los Angeles, Chicago and China.
Table T.S.19. Comparison of Manufacturing Costs of LWC -Paper
Chips and
Alta Alt. 1
Purch. pulp 246 Chemicals 233 Energy 53 Labour 77 Otherl ) 115
Total oper. 724 Capital
chg. 223 Freight
(to L.A.) 147
TOTAL 1094
Alta Alt. 2
227 237
57 80
116
717
230
147
1094
B.C. Canada East
(CAD/ton paper)
224 225
66 83
110
708
242
127
1077
237 199
70 82
115
704
219
220
1142
u.s. South
215 184 133
85 116
733
219
150
1102
u.s. PNW
224 200
68 115 118
725
234
77
1036
Finland
265 189 114
73 113
754
204
133
1091
1) Other includes maintenance materials, supplies, packing materials, sales costs and overhead.
-159-

1.2
1.1
0.' 0 •• ~.)O(',;)(J
0.7
0 ••
O.lt
0.4
0.3
0.2
0.1
o ALI-oIt 1 ALI-oIt 2 ~c. CAN-EAST U.S.SOUTH U.SJONW I'ItUHO
Figure F.S.4. SALES PRICE REQUIREMENT OF LYC PAPER DELIVERED TO LOS ANGELES
1.2
1.1
0..
0.7
·u
0.1
0.3
G.2
o.t
ALB-oIt 1 ALa-ott 2 ~UJ.C. CAH-EAST U.S.SOUTH I'ItUHO
Figure F.S.S. SALES PRICE REQUIREMENT OF LYC PAPER DELIVERY TO CHICAGO
-160-

1.2
1.1
0.'
0.8 .. e ..... 0.7 ,. 3i 0 •• , • 0 ,,~ B .... O.~
0.4
o.;S
0.2
0.1
0
Figure F.S.6. SALES PRICE REQUIREMENT OF LWC PAPER DELIVERED TO CHINA
In the LWC paper case, the operating costs are calculated to be lower both in British Columbia and Eastern Canada than in the Albertan mill. The operating cost differences between the competing areas are less pronounced than in the SC paper case. This is due to the fact that LWC paper uses high amounts of coating materials which are not manufactured in the areas with low energy and/or wood costs.
The bar charts presented in Figures F.S.4, F.S.S and F.S.6. for the major market areas Los Angeles, Chicago and China show again that Alberta can be competitive in the Los Angeles area and the Pacific Rim. Mills in the U.S. South (and also Midwest and Southeast) and Eastern Canada can deliver LWC paper to Chicago area at about 10 percent lower cost than an Albertan mill.
5.8 Manufacturing cost Comparison of Newsprint Production
5.8.1 Basic oat a
The newsprint manufacturing is based on an integrated production of unbleached softwood thermomechanica1 pulp and purchased semibleached softwood kraft pulp. An alternative concept for Alberta was included, based on integrated production of softwood and hardwood CTMP utilizing no purchased pulp. As in all cases the furnishes are indicative only and will have to be proved in trials.
-161-

Table T.5.20 summarizes the paper furnish used in the comparisons.
Table T.5.20. Furnish for Newsprint
Alta Alta B.C. Quebec U.S. U.S. Norscan2) Alt 1 Alt 2 South West
Basis wt, g/m2 48.8 48.8 48.8 48.8 48.8 48.8 48.8 Furnish. %
CTMP, swd 60 0 0 0 0 0 0 CTMP, hwd 40 0 0 0 0 0 0 TMP, swd 0 90 90 90 85 90 90 SBK, swdl ) 0 10 10 10 15 10 10
1) Semibleached kraft pulp 2) Finland and Sweden
Table T.5.21 summarizes the production and the fiber and wood demands of the newsprint mill.
Table T.5.21. Production, Fiber and Wood Demand for the Newsprint Mill
Alta U.S. Other Alt. 1 Alt. 2 South Areas
Production tp/yr 175,000 175,000 175,000 175,000 Fiber demand
TMP (integrated) ADt/yr 0 166,000 157,000 166,000 CTMP, hwd
(integrated) ADt/yr 73,800 0 0 0 CTMP, swd
(integrated) ADt/yr 110,700 0 0 0 Purchased SBK ADt/yr 0 18,500 27,500 18,500
Wood demand, swd BDT/yr 11,000 166,000 158,000 166,000 hwd 75,000
Fiber losses, hwd , 2 2 2 2
The main data for the integrated mechanical pulp production are summarized in Table T.5.22. At this stage, it is assumed that the wood raw material is 100 percent chips, and the product is unbleached mechanical pulp in slush form.
-162-

Table T.5.22. Process Conditions for Production of the Mechanical Pulp Component of Newsprint
Alta Alta B.C. Can. U.S. U.S. Norscan Alt 1 Alt 2 East South PNW (2)
Mech. pulp integrated CTMP CIMP IMP IMP IMP IMP IMP TMP W'ood raw mat. SW'D HW'D SW'D SW'D SW'D SW'D SW'D SW'D
Refining yield % 94 92 95 95 95 93 95 95 Na2S03 % 2.5 3.0 Refining power
demand 2100 1800 2300 2400 2300 2900 2350 2250 Other power
demand 300 300 300 300 300 300 300 300 Fiber and wood
losses % 5 5 5 5 5 5 5 5 Heat recovery
%(1) degree 35 35 50 50 50 50 50 50
(1) Percent of refining power input. (2) Finland and Sweden
Table T.5.23 summarizes the main data for the newsprint mill.
Table T.5.23. Main Data for the Newsprint Mill
Alberu Alberta I.C. ... cern U.S. U.S. Ale 1 Ale 2 Can.da Soueh .tN Horsean1)
Wood deunet OOT/t? 1.06 0.95 0.95 0.95 0.90 0.95 0.95 Fiber deunet
THP (inulneed ADe/tp a 0.95 0.95 0.95 0.90 0.95 0.95 l'urch •• ed IK ADt/tp a 0.10 0.10 0.10 0.15 0.10 0.10 CTHP, bwd
(ineesnted) ADt/t? 0.42 Che.1cala klltp
NaOR klltp 4 0 0 0 0 0 a Na SO 29 0 a 0 0 0 0 be. aid kilt? 2 2 2 2 2 2 2 Alua kllep • • • • • • '.0 OCher kilt? 0.5 0.5 0.5 0.5 0.5 0.5 0.5
Labour Ka1ntenance hIt? 1.3 1.28 1.28 1.28 1.28 1.28 1.28 apene1nl h/ep 1.53 1.5 1.5 1.5 1.5 1.5 1.5 OCher h/ep 0.49 0.49 0.49 0.49 0.49 0.51 0.51
Kaineenance ut'l. , on 1.5 1.5 1.5 1.5 1.5 1.5 1.5 Heac
P.per K111 CJ/t? 4.0 4.0 4.0 4.0 4.0 4.0 4.0 Heae recovered fro. CJ/t? 2.2 4.0 4.0 4.0 4.0 4.0 4.0
THP/CTKP .Ul Het heac CJ/t? 1.8 0 0 0 0 0 0
Power THP kWh/t? 2,160 2,275 2,375 2,275 2,720 2,325 2,225 PH klnl/t? 400 400 400 400 400 400 400 Ocher kWh/tp 2,860 2,975 3,075 2,975 3,420 3,025 2,925
1) F1nland and Sweden
-163-

5.8.2 cost Comparison of Newsprint Manufacturing
The operating costs were calculated T.5.23 and the unit cost defined packaging materials, supplies, sales operating costs.
from the process data given in Table earlier. Typical industry data for costs and overhead were added to the
Fixed capital costs were included based on 15 years' depreciation time at 10 percent interest calculated as equal annual payments on fixed investment.
As for the other paper grades, Alberta's competitiveness is shown for three destination areas:
Los Angeles Chicago China (Xing Yang)
The manufacturing costs for newsprint delivered to the Los Angeles area are detailed in Table T.5.24.
Table T.5.24. Manufacturing Costs of Newsprint (TMP based), Delivered to Los Angeles
Alta. Alta. B.C. Canada U.S. U.S. Finland Sweden Alt 1 Alt 2 East South PNW
(CAD/ton/newsprint)
Chips & Purch pulp 79 130 124 153 155 125 223 210
Chemicals 28 5 5 5 4 4 4 7 Energy 79 77 79 74 198 99 159 117 Labour 77 75 79 78 82 108 71 96 Other 102 98 94 96 95 98 90 90 Total oper. cost 365 385 381 406 534 434 547 520
Fixed Cap. chg 272 253 265 240 235 259 252 250
Freight to L.A. 147 147 127 220 150 77 133 120
TOTAL 784 785 773 866 919 770 932 890
1) Other includes maintenance materials, supplies, packing materials, sales cost and overhead.
-164-

Figure F.S.7.
Figure F.S.S.
I~ --------------------------------------,
1.1
0..
0.1
0.7
0.. o.a
0.4
cu
0.2
0.1
SALES PRICE REQUIREMENT OF NEWSPRINT DELIVERED TO LOS ANGELES AREA
1.2 -,-------------------------....
1.1
o.a o.a 0.7
SALES PRICE REQUIREMENT OF NEWSPRINT DELIVERED TO CHICAGO AREA
-16S-

1.2
1.1
0..
0..
0.7
U
o.a
0.4
O~
0.2
0.1
o ~~~~~~~~~~~~~~~~~~~~
Figure F.s.9. SALES PRICE REQUIREMENT OF NEWSPRINT DELIVERED TO CHINA
Again it is evident that Alberta is competitive mainly in the Los Angeles and Pacific Rim areas. The cost difference between the interior B.C. and U.S. Pacific Northwest is very minor (1-1.5 percent of the total costs).
5.9
5.9.1
Manufacturing Cost Comparison of Folding Carton Production
Basic Data
The folding carton studied here is a multiply board utilizing mechanical pulp produced at the mill site, as well as purchased kraft pulp. The mechanical pulp component can be any mechanical pulp, i.e. groundwood, thermomechanical or chemithermomechanical pulp. In this comparison, bleached CTMP was used as the mechanical pulp.
The carton is a three ply board with bleached kraft pulp as top and backliner, and mechanical pulp and broke as middle layer. The carton in this example is one side coated carton.
Table T.S.2s summarizes the furnish used in the comparison.
-166-

Table T.5.25. Paper Furnish for Folding Carton Board, One Side Coated (Same furnish for all areas)
Basis wt g/m2 240
Bleached CTMP % 49 BK swd % 23 BK hwd % 15 Coat and clay % 12 Size % 1
TOTAL , 100
The mill size was selected to 130,000 t/yr, which was considered justifiable by the available market. The fiber and wood demands are shown in Table T.5.26.
Table T.5.26. Fiber and Wood Demands for the Folding Carton Board Mill
Production tp/yr 130,000 Fiber demand Bleached CTMP, swd, ADt/yr 66,000
integrated Purchased BK hwd ADt/yr 31,500 Purchased BK swd ADt/yr 21,000
Wood demand BDT/yr 67,000
Clay and coating mat'ls BDT/yr 15,000 Size BDT/yr 1,300
The process conditions for the integrated CTMP mill are summarized in Table T.5.27.
Table T.5.27. Process Conditions of CTMP mill integrated with the Folding Carton Board Mill
Alta B.C. Canada U.S. U.S. Finland East South NY
Refining yield , 94 93 93 92 93 94 Na2S03. , on wood 2.5 3 3 4 3 2.5 H202 , on plp 2.5 3 3 4 3 2.5 Na2Si03 , 3 3 3 3 3 3 Refining power kWh/
ADt 2100 2100 2100 2700 2100 2100 Wood and fiber
losses , 5 5 5 5 5 5 Heat recovery , 35 35 35 35 35 35
1) Percent of refiner power input.
-167-

The main data for the folding carton board mill is shown in Table T.s.28
Table T.s.28. Main Data for Folding Carton Board Mill
Alberta B.C. Eaatern U.S. U.S. F1nlan4 Cana4a South PN\I
Wood delland ODT/tp 0.51 0.51 0.51 0.52 0.51 0.50 Fiber delland
TMP ADt/tp 0.61 0.61 0.61 0.58 0.61 0.61 Purchased BK, hw4 ADt/tp 0.18 0.18 0.18 0.21 0.18 0.18 Purchased SK, swd ADt/tp
Clay and coating t/tp 0.11 0.24 0.24 0.24 0.24 0.24 Chem1cals kg/tp
NaOH kg/tp 13 15 15 20 15 13 Ha SO 12 14 14 18 14 12 Ret. a14 kg/tp 3.0 3.0 3.0 3.0 3.0 3.0 All.111 kg/tp 4.0 4.0 4.0 4.0 4.0 4.09 Starch kg/tp 0.7 0.7 0.7 0.7 0.7 0.7
Labour Maintenance b/tp 1.1 1.1 1.1 1.1 1.1 1.1 Operating h/tp 2.5 2.5 2.5 2.5 2.5 2.5 Other h/tp 0.46 0.46 0.46 0.46 0.46 0.46
Maintenance mat'la , on 1.S 1.S 1.S 1.S 1.S 1.5 Heat
Paper HUl GJ/tp 4.5 4.5 4.5 4.5 4.5 4.5 Heat recovered
from GJ/tp 1.1 1.1 1.1 1.1 1.1 1.1 TKP/CTHP lIill Net heat GJ/tp 1.8 1.8 1.8 1.8 1.8 1.8
Power TMP kWh/tp 1,250 1,250 1,250 1,250 1,250 1,250 PH kWh/tp 450 450 450 450 450 450 Other kWh/tp 300 300 300 300 300 300 Total kWh/tp 2,000 2,000 2,000 2,000 2,000 2,000
5.9.2 cost Comparison of Foldinq Carton Board Production
The operating costs were calculated from the process data given in Table T.s.28 and the unit cost defined earlier. Typical industry data for packaging materials, supplies, sales costs and overhead were added to the operating costs.
Fixed capital costs were included based on 15 years depreciation time at 10 percent interest calculated as equal annual payments on fixed investment.
As for the other paper grades, Alberta's competitiveness is shown for three destination areas:
Los Angeles Chicago China (Xing Yang)
-168-

Table T.5.29 summarizes the cost with freight to the Los Angeles area.
Table T.5.29. Folding Carton Board Manufacturing Costs
TOTAL Alberta B.C. Canada U.S. U.S. Finland East South PNW
(CAD/ton)
Chips & purch. pulps 291 288 305 276 289 343
Chemical 102 98 92 87 85 77 Energy 59 68 74 138 66 119 Labour 89 94 93 98 129 79 Other 111 112 112 111 110 111 Total oper. cost 652 660 676 710 679 729 Capital
chg. 247 251 253 244 239 241 Freight to L.A. 147 127 220 195 77 133
TOTAL 1046 1038 1149 1149 995 1103
Figures F.S.IO, F.S.ll and F.S.12 summarize the costs as delivered to Los Angeles, Chicago and China.
-169-

1.2
1.1
0 .•
U .. ~ ... 0.7
81 0..
jl o.s OA
CU
G.2
0.1
0
Figure F.S.l0. SALES PRICES REQUIREMENT OF FOLDING CARTON DELIVERED TO LOS ANGELES AREA
1.2
1.1
O.t
U .. i1 0.7
.! 0.. o.s OA
cu
G.2
0.1
0
Figure. F.S.ll. SALES PRICE REQUIREMENT OF FOLDING CARTON DELIVERED TO CHICAGO AREA
-110-

1.2
1.1
o.t
0.1 .. {'i' 0.7
35 0..
jl o.s D.A
~
0.2
0.,
II
Figure F. 5.12. SALES PRICE REQUIREMENT OF FOLDING CARTON DELIVERED TO CHINA
The operating costs in Alberta are calculated to be the lowest among the competing areas. The disadvantage in freight costs makes Alberta competitive only in the Los Angeles and Pacific Rim areas, as evident from the bar charts shown in Figures F.S.10, F.S.ll and F.S.12.
5.10 Conclusion Based on the Cost Comparison
Based on the cost comparisons undertaken it is evident that one of Alberta's disadvantages is its distance to the market areas. The operating costs are the lowest among the competing areas for all grades but LWC paper. The freight disadvantage, however, results in that Alberta becomes second to British Columbia and U.S. Pacific Northwest for the main market areas, the Los Angeles and Pacific rim area. On the Chicago market Eastern Canada will always have the low freight benefits.
The cost comparison and the market study indicate that Alberta's biggest potential is in SC paper and folding carton production.
In an interim project were recommended by analysis.
meeting on April 3, 1987, these two products EKONO to be selected for further financial
In later discussions it was, however, agreed that the further analysis will be SC paper and LWC paper. grades are evaluated more carefully in Section 6.
-171-
two products for These two paper

6. ANALYSIS OF A VALUE ADDED PAPER MANUFACTURING FACILITY IN ALBERTA
6.1 Mill Production Level
The Albertan paper production is assumed mill. The optimum machine size depends factors:
to start in a single machine in general on the following
* Expected market volume * Cost minimum defined by investment and operating costs
The cost minimum is typically defined by the maximum practical size of a single machine. For a printing paper machine this size is now 170,000-200,000 tp/yr. Based on this and on the market forecast for the SC paper, the production of SC paper has been evaluated at a production level of 175,000.
The capacity of the LYC paper mill was selected at 175,000 tp/yr, which is in the same range as the newest machines installed (170,000 -200,000 tp/yr).
6.2 Evaluation of the SC Paper Mill
6.2.1 Paper Furnish and Product End Use of the SC Paper Mill
Several alternative furnishes can be used to produce SC paper. examples are shown in Table T.6.l.
Table T. 6 .l. Furnishes for SC Paper
Recipe Alternative 1 2 3 4
Component, , of paper SGW 54-64 PGW 50-70 RMP 55-65 TMP 62-75 Bleached kraft 20-30 12-22 15-30 CTMP, hardwood 6-20 Filler 15-27 15-27 15-27 15-27
Important properties for good SC papers include:
1. Good printing properties surface printing ink absorption on offset grade: surface strength (picking resistance)
-172-
Some
5
50-70 5-10
10-20 15-27

2. Sufficient strength for runnability 3. Uniform quality 4. Sufficient brightness and opacity (higher requirements than
on newsprint)
SC papers are used for
1. Newspaper special issues (weekend issues, colored pages) 2. Magazines 3. Advertising leaflets 4. Mail order catalogues
6.2.2 Production Program for the SC Paper Mill
The basis weight range for supercalendared magazine paper (SC) is 55-70 g/m2 and the filler content of the paper is 20-30 percent. The high filler content deteriorates the strength properties of the paper and therefore 15-20 percent of chemical pulp must be used when mechanical pulp (e.g. White Spruce) is produced by the TMP process. The SC paper is finished by supercalender to give the paper a smooth surface and good printing properties. The average basis weight and fiber composition of SC paper, used in the calculations, is as follows:
Basis weight 60 g/m2
Furnish, percent of paper - chemical pulp 17 - TMP 58 - filler 25
The quality of the mechanical pulp must be considerably higher for SC paper than for e.g. newsprint, thus also the specific power consumption is higher. SC papers are often used for color prints, and the requirements of runnabi1ity and printing properties are important.
From a market point of view, it could be advantageous to be prepared to produce other printing grades as well, e.g. newsprint, directory paper, in the SC paper mill. This would require scaling up the wood handling and the TMP plant for the newsprint furnish (90-95 percent TMP and 5-10 percent semib1eached kraft). The machine concept could also be slightly different.
Although these provisions flexibility due to market this evaluation.
could be highly motivated to improve the fluctuations, they are not considered in
6.2.3 Process Description of the SC Paper Mill
A block diagram showing the SC paper mill is included in Figure F.6.l.
-173-

WOOD HANDLING
The integrated mechanical pulp mill will require about 109,000 BDT/yr of softwood chips. Provisions for operating on 100 percent roundwood is included;, the cost calculations however, are based on a roundwood/purchased chips ratio of 62/38 (See also Table T.2.4).
The capacity of the wood handling is 250,000 solid m3/yr or 60 m3jh when operating five days a week in two shifts (16 hid).
The logs arrive at the mill by trucks and are measured and weighed at the scaling station. From there they are transported either to the wood receiving desk or to the wood yard.
From the infeed deck the logs are transported by conveyor to one dry debarking drum. After the drum the logs are sorted. The debarked logs proceed to a chipper. Chips are screened and transported to a chip pile. Purchased chips are weighed on the truck and taken to chip screening and chip pile.
-174-

E:;J-... ------ ..... ,._NUI!
_. BLOCK DIAGRAM OF THE SC-PAPER MILL
Figure F. 6 . 1. BLOCK DIAGRAM OF THE SC PAPER MILL
-175-

TMP PLANT
The screened softwood chips are fed through a chip bin to the chip washer before preheating. High pressure refining is performed in two consecutive stages and the heat from the refiners is recovered for paper drying (approximately 50 percent). After the steam separation from the second refining stage the pulp is discharged to a latency removal tower. After latency removal the pulp is screened, cleaned and dewatered before bleaching. Finally the pulp is bleached with peroxide (H202) and stored in towers for use in the paper mill.
PAPER MILL
The raw materials for the SC paper machine are softwood TMP, purchased bleached pulp and filler clay. The chemical pulp is refined before going through the cleaning system and entering the headbox. The filler clay is mixed into the water in the slushing station before proportioning to the fiber flow. The paper machine is of fourdrinier type with twinwire section. The paper is finished in supercalenders before packaging and transportation to the warehouse.
POWER STATION
Heat is generated from bark and oil and additional heat recovered from TMP refining. There is no in house electrical energy generation.
ENVIRONMENTAL PROTECTION
The effluent loads expected from the mill to external treatment are as follows:
Effluent volume Suspended solids BODS Color
15-20 m3/tp 8 kg/tp
15-24 kg/tp 20-25 kb/tp
The effluent treatment system includes a primary clarifier and biological treatment in an aerated lagoon. It is assumed that no color removal is needed. The aerated lagoon will reduce the effluent BOD load by 70-90%.
6.2.4 Operatinq Cost Estimate
The operating cost estimate is detailed in Table T.6.2 below.
-176-

Table T.6.2. Operating Cost of SC Paper Manufacturing integrated to mechanical pulp mill not integrated to chemical pulp mill
BASIC DATA
Production 1000 t/yr 175 Appx. investment 106 CAD 320 Operating days d/yr 350
Basis wt g/m2 60
Furnish TMP, swd % 58 BK, swd % 17 Filler % 25
OPERATING COST
Unit Unit,t12 CADLYoit CAD'!;12 FURNISH
Chips BOT 0.63 77 48 BK, swd Adt 0.18 640 116 Filler clay BOT 0.27 250 65
Sub-total
CHEMICALS H202 kg 14.19 1600 23 Sodiumsilicate kg 17.03 320 5 Wet end chern. 9
Sub-total
tlnit tlnit,tp CAD,uoit CAD,tp
UTILITIES Steam GJ 1.8 2.250 4 Power kWh 2450.0 0.024 59 Water m3 15.0
Sub-total
PACK MAT'L Core 3" m 3.0 1.00 3 Wrp. pap. m2 30.0 0.25 8
Sub-total
TOTAL VAIIABLE COST
-177-
CAD,t12
229
37
CAD,!;p
63
11
340

lABOUR Unit CAD/unit Ave. working
time h/year Maint. labour Oper. labour Administration
Sub-total
MAINT. MAT'L
SUPPLIES Paper mill TMPmi11
Sub-total
ADMIN. AND SALES OVERHEAD
TOTAL FIXED COST
TOTAL OPER. COST
FREIGHT
2000 pers. 1) 115 pers. 1) 140 pers. 1) 40
% on inv. 1.5
TOTAL OPERATING COST INCL. FREIGHT 1) Total persons working in the mill
6.2.5 Investment Cost Estimate
23 21 29
CAD/tp CAD/tp
30 31 13
77
27
31 9
40
30 12
186
526
144
670
The rough investment estimate is given for a new SC-paper mill below in Table T.6.3.
Table T.6.3. Estimated Investment Cost
Direct Costs Installed equipment, incl. spare parts Site Buildings Freight
TOTAL DIRECT COSTS
Indirect costs Preinvestment studies Engineering Temporary const. facilities Insurance during construction Contingency (6%)
TOTAL CAPITAL COST
-178-
1000 CAD 214,000 12,000 31,000 10,000
267,000
3,000 23,000
8,000 600
18,400
320.000

If the TMP plant and the paper machine are installed in an existing mill, the investment cost is estimated to be about 25 percent lower.
6.2.6 Profitability of a SC-Paper Mill
SALES REVENUE
The sales price for SC paper was taken as the price of third quarter in 1986, which was 1079 CAD/tp. The mill net price, excluding sales commissions and freight will then be
Market price Sales cost (3%) Transportation Mill net price
1079 CAD/tp 32 CAD/tp
145 CAD/tp 902 CAD/tp
During the end of 1986 and the beginning of 1987 the SC paper price has somewhat declined.
PRODUCTION DEVELOPMENT
The start-up curve of the mill is assumed to to be as follows:
Year of operation
1 2 3
Production development , of total
75 90
100
During the start-up period the following quality discounts are calculated to be given to the clients.
Year of operation 1 2 3 4 5-13
SC-paper discount, CAD/tp 30 15 8 o o
OPERATING COSTS
Additional manufacturing costs of fiber, chemicals and energy are also included for the first years of operation due to higher raw material and energy consumptions.
Year of operation 1 2 3-13
Additional Costs, , 2 1
-179-

INVESTMENTS
Split-up of fixed investment is the following:
Year -2
% of Total 35
-1 start-up 60 1 2-13
5
The annual increase in working capital is considered in the calculations. The total working capital is released at the end of the calculation period.
The working capital is reserved for operations one year before startup.
CASH FLOW BEFORE FINANCING AND TAXES
The cash flow calculations are based on the following assumptions:
The calculation period is 15 years including two year construction.
All calculations are made in constant Canadian dollars the cost level being the third quarter of 1986.
The profitability of building a new greenfield SC-paper mill is determined by means of internal rate of return calculated on cash flow before financing. Thus the IRR calculated here indicates the average return gained on the invested capital during the calculation period. Also a ROI calculation was carried out for a typical year of operation. 1)
A summary of the profitability calculations is shown in Table T.6.4.
1) (ROI , 100 x operatini profit ) total capital requirement
-180-

Table T.6.4. Summary of Profitability Calculations
Greenfield SC-paper mill in Northeastern Alberta, 175,000 tla
Production (1000 t)
Ref. Year 6 1000 CAD
SC-paper 175
Total production 175
Sales Revenues - SC-paper
Total Sales Income
Variable Costs Chips Purchased pulp
Filler and Additives Energy Op. supplies and pkg
Total Variable Costs
Contribution Margin
Fixed Costs Personnel Other fixed costs
Total Fixed Costs Total Manufacturing Costs
Operating Profit Operating Profit ,
Capital Fixed investment Change in working capital Interest during construction
Total Capital
ROI ,
IRR before financing'
157,850
157,850
8,430 20,291
17,904 10,990
8,838
66,453
13,550 12,150
25,700 92,153
65,697 41.6
320,000
23,678
26,585
370,262
17.7
13.3
-181-
Per ton of Product CADit
902
902
48 116
102 63 51
380
77 69
147 527
325
1829
135
152
2116
Percent of Sales
100.0
100.0
5.3 12.9
11.3 7.0 5.6
42.1
8.5 7.7
16.3 58.4
41.6
202.7
15.0
16.8
234.6
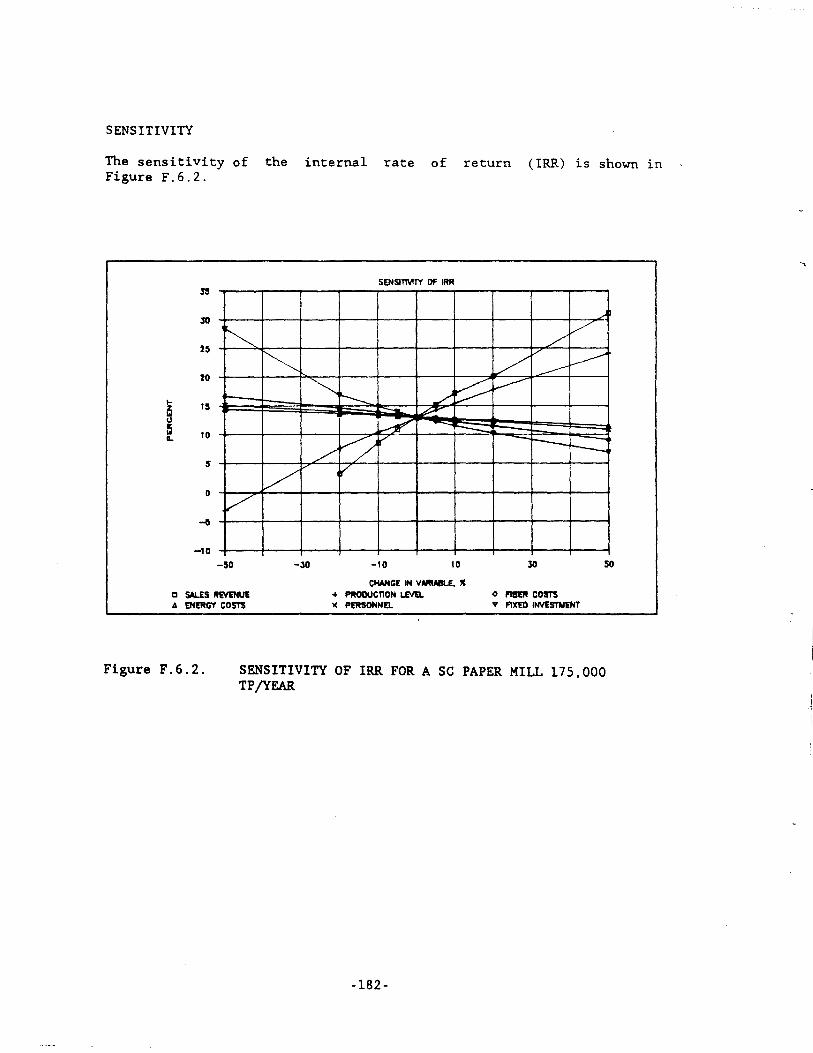
SENSITIVITY
The sensitivity of the internal rate of return (IRR) is shown in Figure F.6.2.
25 ~
20
10
o /'
-10
-50
o SALES ltEYlHut A ENERGY COSTS
~
V
-30
SENSlTMT'I' OF IRR
~ '----.. / ~ L?"
L--£' --...;
~ V
/ 17'
-10 10
CHANG! IN VMlAl!lLE, " ~ PlWDUcnON LEVll. )( PERSONNa
....,J
/' V
/ V ~ ---~
-r--r-
30 so
<I I'1I!1£ft com v 1'11CtO INVtSNENT
Figure F.6.2. SENSITIVITY OF IRR FOR A SC PAPER MILL 175,000 TP/yEAR
-182-

According to our preliminary calculations, a SC paper mill investment in Alberta would show an IRR before financing of 13.3 percent for a 175,000 ton/year unit.
The value of IRR is however very sensitive to changes in main cost components particularly in sales revenue and production level.
The prices of wood raw material and purchased pulp are very important for the profitability of the mill in the long run even if the fiber price doesn't seem to affect the SC- or LYC- mill project profitability so drastically. Competitive prices of raw materials and energy build the basis for all pulp and paper operations. It needs to be pointed out here also that the price of filler or coating is relatively high in Alberta due to high transportation costs.
Building a new SC-paper mill indicates reasonable profitability for operations. The final viability of the mill alternatives will however depend on the cost of financing available for the projects.
6.3
6.3.1
Evaluation of the LWC Paper Mill
Paper Furnish and Product End Use
For several purposes LYC papers are alternative to SC grades. LYC paper gives the possibility to use both offset and rotogravure printing methods depending on the type of the used coating paste. The base paper for LYC papers contains mechanical and chemical pulps and the ratio between them affects the runnability of the base paper. The chemical pulp content is usually near 50 percent of the fiber furnish. For rotogravure printing also the smoothness of the base paper is very important. A certain filler content of 4·6 percent is determined by the broke of the coated paper. The amount of coating in LYC papers is only 9·13 g/m2/side. The properties of the base paper are very important for achieving good quality coating.
Important properties for LYC papers are
1. Sufficient strength for good runnability 2. Printing properties
* high smoothness, especially for rotogravure printing * good printing ink absorption
3. Uniform quality 4. Sufficient brightness and opacity
LYC papers are used for
1. Magazines 2. Catalogues 3. Posters 4. Brochures
-183·

. -.
The furnish used as base for this evaluation is as follows:
Basis weight Furnish percent of paper * chemical pulp (BK) * TMP, bleached * coating
60 g/m2
29 36 35
6.3.2 Process Description of the LWC Paper Mill
A block diagram showing the LWC paper mill is included in Figure F.6.3 .
O-L-----
-Ed .. . ,-,-J _ .
•
BLOCK DIAGRAM OF THE LWC PAPER MILL
Figure F.6.3. BLOCK DIAGRAM OF THE LWC PAPER MILL
-184-
WOOD HANDLING
The wood requirement of the TMP mill integrated with the Lwe machine is about 70,000 BOT/year. This is a relatively small amount; therefore it is assumed that only purchased chips will be used.
The purchased chips are weighed on trucks and screened before taking to the TMP mill.
TMP PLANT
The screened softwood chips are fed through a chip bin to the chip washer before preheating. High pressure refining is performed in two consecutive stages and the heat from the refiners is recovered for paper drying (approximately 50 percent). After the steam separation from the second refining stage the pulp is discharged to a latency removal tower. After latency removal the pulp is screened, cleaned and dewatered before bleaching. The pulp is then bleached with peroxide (H202) and stored in towers for use in the paper mill.
PAPER MILL
The Lwe machine includes the following main process units:
* headbox
* fourdriniers
* press section
* drying section
* calender stack
* reel module
* off machine coater
* rereeler
* super calendar
* winders
* salvage winders
* coating color and additive system
Chemical pulp is refined before going through cleaning to the headbox.
The pre-dried paper sheet is coated in an off machine coater and dried by gas/oil/steam heaters. The paper is finished in supercalendars before packaging and transportation to the warehouse.
POWER STATION
Heat is generated from oil and additional to the heat recovered from TMP refining. There is no in house electrical energy generation.
-185-

ENVIRONMENTAL PROTECTION
The effluent loads expected from the mill to external treatment are as follows:
* Effluent volume * Suspended solids * BODS * Color
15-20 m3/tp 8 kg/tp
12-28 kg/tp 16-22 kb/tp
The effluent treatment system includes primary clarifier and biological treatment in an aerated lagoon. It is assumed that no color removal is needed. The aerated lagoon will reduce the effluent BOD load by 70-90 percent.
6.3.3 Operating cost Estimate
The operating cost estimate is detailed in Table T.6.12 below.
Table T.6.S.
BASIS DATA
Basis wt Coating Furnish
BK, swd TMP, swd Total
Coating Coating loss Fiber loss
Production
Operating Cost of a LWC-Mill * integrated to TMP mill * purchased bleached kraft pulp
g/m2 g/m2/side
% of fib. % of fib. % of fib. kg/tp % %
1000 ton/yr Appx. investment 106 CAD Oper. days d/yr
-186-
60 10.5
45 55
100 350
7 2
175 315 350

COATING MATERIAL COST
Coating Unit Coating Recipe Cost Cost
% CADIt CADIt coat CAD/tp
CaC03 8.00 275 22 Del. clay 70.00 303 212 Ox. starch 13.00 545 71 S-B latex 8.40 2450 206 CKC 0.47 5200 24 Dye 0.13 10000 13 Total 100.00 548
OPERATING COSTS
FIBER FURNISH Unit Unit/tp CAD/unit CAD/tp CAD/tp Chips BDT 0.38 77 30 BK, swd ADt 0.31 640.00 199 Total fiber furnish 229
CHEMICALS
Coating t 0.35 548 194 H202 kg 11.66 1600 19 Sodiumsilicate kg 11.66 320 4 Ret. aid kg 10.00 1230 12 Alum kg 10.00 230 2 defoam. kg 1.00 3000 3 Other kg 2.00 1500 3 Total 237
UTILITIES
Steam GJ 4.95 2.25 11 Power kWh 1915.00 0.024 46 Water m3 20.00 Total 57
PACKAGING MATERIAL
Core 3" m 3.0 1 3 Wrp. pap. m2 30.0 0.25 8 Total 11
TOTAL VARIABLI COST 534
-187-

lABOUR Ave. work. time h/year 2000 Maint. labour pers 1) 115 23 30 Oper. labour pers 1) 145 21 35 Admin. pers 1) 45 29 15 Total 80
MAINT. MAT'L % on inv. 1.5 27 SUPPLIES PM 32 TMP 6 Total supplies 38
ADMIN. AND SALES 33 OVERHEAD 12 TOTAL FIXED OPER. COST 190
TOTAL OPER. COST 724 FREIGHT 145
TOTAL 869 1) Includes all mill personnel.
6.3.4 Investment Cost Estimate
The investment estimate for a new greenfield LWC-paper mill is given below in Table T.6.13.
Table T.6.6. Estimated Investment Cost
Direct Costs Installed equipment, incl. spare parts Site Buildings Freight
·TOTAL DIRECT COSTS
Indirect costs Pre investment studies Engineering Temporary const. facilities Insurance during construction Contingency (6')
TOTAL CAPITAL COST
1000 CAD 211,000 12,000 30,000 10,000
263.000
3,000 22,000
8,000 600
18,400
315.000
If the TMP mill and the with an existing mill, lower.
LWC paper machine are installed in connection the investment demand could be 20-25 percent
-188-

6.3.5 profitability of a LWC-Paper Mill
SALES REVENUE
The sales price for LYC paper was taken as the price of third quarter in 1986, which was 1162 CAD/tp. The mill net price, excluding freight will then be
Market price Sales cost (3 percent) Transportation Mill net price
PRODUCTION DEVELOPMENT
1162 CAD/tp 35 CAD/tp
145 CAD/tp 982 CAD/tp
The production is expected to develop as follows:
Year of operation Production development, % of Total
1 70 2 85 3 95 4-13 100
During the start-up phase, the following quality discounts are considered:
Year of operation
Discount, CAD/tp
OPERATING COSTS
1
30
2
15
3 4 5-13
8 o o
Additional manufacturing costs for fiber, chemicals and energy are calculated during the first years of operating due to the higher raw material and energy consumptions.
Year of operation 1 2 3-13
INVESTMENTS
Additional Costs, % 2 1
Split-up of fixed investment is as follows:
Year of Operation -2 -1 1 start-up 2-13
% of Total 35 60
5
-189-

The annual increase in working capital is considered in the calculation. The total working capital is released at the end of the calculation period.
The working capital is reserved for operations one year before startup.
CASH FLOW BEFORE FINANCING
The following general calculations.
terms are applied for the cash flow
The calculation period is 15 years, including two year construction.
All calculations are made in constant Canadian dollars, cost level being third quarter of 1986.
The profitability of building a new greenfield LWC-paper mill in Northeastern Alberta was determined by means of internal rate of return calculated on cash flow before financing. Also a ROI calculation was carried out for a typical year of operation. 1)
The profitability calculations are summarized in Table T.6.7.
The sensitivity of IRR to changes in the most important cost factors is shown in Figure F.6.4.
We conclude that the profitability of a greenfield LWC-paper mill is scant, being 6% in terms of internal rate of return before financing. Long transportation distances for both end products and consumables and raw materials squeeze the profit to be unbearable for the high capital expenditure requested.
1) (ROI percent - 100 x operating profit ) Total capital requirement
-190-

Table T.6.7. Summary of Profitability Calculations
Greenfield LWC-paper mill in Northeastern Alberta, 175,000 tla
Production (1000 t)
Ref. year 6 Per ton Percent 1000 CAD of Product of Sales
CADit
SC-paper 175
Total production 175
Sales Revenues - SC-paper
Total Sales Income
Variable Costs Chips Purchased pulp Coating, filler and Additives Energy Op. supplies and pkg
Total Variable Costs
Contribution Margin
Fixed Costs Personnel Other fixed costs
Total Fixed Costs Total Ma~ufacturing Costs
Operating Profit Operating Profit ,
Capital Fixed investment Change in working capital Interest during construction
Total Capital
ROI %
IRR before financing %
171,850
171,850
5,184 34,902
41,461 9,993 8,437
99,976
13,990 12,600
26,590 126,566
45,284 26.4
315,000
25.778
26,169
366,947
12.3
6.3
-191-
982
982
30 199
237 57 48
571
80 72
152 723
259
1800
147
150
2097
100.0
100.0
3.1 20.3
24.1 5.8 4.9
41. 9
8.2 7.3
15.5 73.6
126.4
183.3
15.0
15.2
213.5

311
30
211
20
I- III z ~ III 0 I[ ~ III 10 II..
5
0
-5
-10 V
-1I0
D SAI.iS IU.'lEhUE " ENaGY COSTS
~ r--
/
V I'---.. . ~k..... k ~
/' v-' V
V / V
-10 10
CHANGE IN VARIA8I.E. " ... PltOOUCT\ON I.iVEL )( PERSONNEL
/" V
~ v
~ I---"
----r-::::: t- -
JO 50
o Fl8ER COSTS '" "'XI/) ItNlS1VEHT
Figure F.6.4. SENSITIVITY OF IRR FOR LWC PAPER MILL 175,000 TP/yEAR
As for the SC mill the IRR is very sensitive to the sales price of the product and to the production level of the mill.
The current (April 1987) list price for LWC No. 5 paper is about 1000 CADIt or 14 percent lower than the price used in this evaluation.
This price would bring the IRR price for LWC paper is due to and it is difficult to predict the future. The low price of price as well.
of the project close to zero. The low the current overcapacity in LWC paper, which direction the price will take in
LWC is putting pressure on the SC-paper
-192-

7. BUSINESS OPPORTUNITY ANALYSIS
7.1 Wood Resource
One of the fundamental elements for healthy industrial development within the forest products industry is the availability of raw material at reasonable cost. Any serious investor must be convinced that fiber resources are available, both for the needs of today and tomorrow.
The Government of Alberta material for industrial pulp wood is high quality softwood highest quality.
is in a position to provide good raw and paper manufacturing. Much of the suitable for manufacturing paper of the
The Alberta total standing timber volume is 2.5 billion m3 comprised of 63 percent coniferous and 37 percent deciduous species. As of May 1986, the allowable annual harvest is about 25.8 million m3 comprised of 14.4 million m3 coniferous and 11.4 million m3 deciduous species. Of the allowable annual harvest, the committed cut for coniferous and deciduous species is about 10.4 million m3 and 3.3 million m3 respectively. Available uncommitted timber that would be negotiable for processing amounts to 4.0 million m3 of coniferous and 8.1 million m3 of deciduous species.
Areas of potential large scale timber development in eastern Alberta include; the Athabasca forest, Athabasca/Lac La Biche TDA and the Slave Lake forest. Together with the available adjacent wood supply these areas can annually supply a total of 4.6 to 5.6 million m3 , of which 1.5 to 2.0 million m3 is coniferous species and 3.1 to 3.7 million m3 deciduous species. This is sufficient to support valueadded paper production and a medium size (500-600 t/day) bleached softwood kraft mill.
7.2 Markets
It is apparent that with its high per capita paper consumption and with its strong purchasing power, the U.S. market is and will remain for the foreseeable future the most attractive market for Canadian paper manufacturers. In addition, U.S. printers and paper consumers have a growing interest in the high quality paper products which are often imported from Europe. Both SC and LWC papers fit this category. This study indicates that the Western U.S. market is the most important and most viable for Alberta based manufacturers of high quality papers considered from cost effectiveness and from market volume and growth.
-193-

This outlook assumes that Alberta manufactured paper is sold on a market originating from growth in consumption rather than replacing existing capacity. Specifically, the market assessment for SC and LWC papers shows steady growth in the u.S. market, providing opportunities for Alberta in the near future.
7.3 Transportation
A matter of concern is Alberta's location in respect to the major markets and consumers. High freight costs lowers the profitability of Alberta manufactured paper products.
By entering into value-added, non-commodity, paper grade manufacturing, however, the effect of freight costs can be minimized. Since high quality value-added papers are increasingly being sold on a world market, Alberta has the advantage of being nearer to the single largest market, the U.S., than say, Northern Europe.
The freight cost situation has been studied in detail within the province and discussions are currently under way to find solutions to this problem. These efforts should be continued.
7.4 Risk Factors
The financial analyses in this study show taxes to be 13 percent and 6 percent manufacturing in Alberta, respectively. 18 percent for SC-grade and 12 percent for
an IRR before financing and for SC-paper and LWC-paper The corresponding ROI's are LWC-paper.
These values can be compared to a target IRR (before financing and taxes) for pulp and paper projects worldwide of 16-17%. This return covers the average cost of capital available for the project plus a premium for risk. The risk premium depends on local conditions, markets, and the degree of technological innovation. Although this study is based on well developed technology, the remaining risk factors make the IRR's resulting from the analyses only marginally adequate for a stand-alone investment. The challenge for the potential papermaker and Alberta is to mitigate the other risk factors.
The risk elements in a capital investment venture for manufacturing paper in northeastern Alberta are identified below:
-194-

Risk Factor
Market
* Price level development * Market share development * Currency rate fluctuations * Competition * New superior grades
Production
* Production level * Wood availability * Wood cost * Energy cost * Human resources * Improved technology * Production equipment failure
Environment
* Fiscal/legal * Environmental * Financial
High
x X
X X
X
X
Degree of Risk
Medium
X
X
X
Low
X X X X
X
X
The sensitivity analyses show that the profitability of paper manufacturing is most sensitive to price fluctuations and production rates, or more accurately, the utilization of capital equipment. This risk is best answered by the selection of an investor with the technical and market know-how to produce and sell high quality paper and paperboard.
A related risk factor is the susceptibility of the paper industry to the effects of varying exchange rates. Cost competitiveness may shift rapidly and dramatically between countries due to circumstances beyond the control of the individual company.
Another risk factor identified in the sensitivity analyses is the magnitude of the capital investment. New paper production equipment added into an existing mill requires substantially lower investment costs (estimated 25-40 percent lower than for a greenfield mill) due to savings in existing supporting facilities and activities. Doing so will enhance opportunities for higher rates of return on invested capital. This will be more attractive to a potential investor than will a capital intensive greenfield alternative.
-195-

To be able to compete with and show adequate attractiveness compared to an expansion project, the greenfield investment project should receive incentives, financial or other. These incentives would compensate for missing infrastructure in order to bring the potential return on investment up to the level of an "add-on" project.
It has been pointed out above that a stand-alone investment in a value-added paper facility is only marginally adequate. But, as part of a long term development of a forest based industrial complex, it can be. Such a complex might include a world class sized chemical pulp mill to produce the necessary high quality fiber required for paper manufacturing. Given that such a pulp mill producing 1000 tons per day, will consume about 2 million m3 per year, sufficient wood must be made available to the potential investor. An investor with the capability of carrying out a long term development will want nothing less.
7.5 Business Climate
The current business climate in Alberta for producing wood containing paper or board can be assessed as follows:
Industry Attractiveness
* Market size
* Market growth
* Market price level
* Market cyclically
Business Environment
* Legislation
* Technical resources
* Other human resources
* Environmental restrictions
* Raw material availability
* Raw material quality
Market Position
* Domestic market share * Continental market share * Global market share * Market share growth * Competition from locals * Competition from overseas
+ 0 0
0
+
+ +
+
+
o
-196-

Competitiveness * Leadership in quality * Technology * Cost effectiveness * Marketing assistance * Financing capabilities * Leadership in technical back-up * Leadership in logistics
+ Favorable o Average
Unfavorable
+ + +
o
The availability of raw material, inexpensive energy and the existing positive climate for business development provide Alberta with good opportunities to produce high quality paper grades and to sell these products to the Western U.S. market. Any negatives can be partially addressed by Alberta's adopting or adjusting policies that will make value-added paper manufacturing attractive to the potential investor.
Investments in integration of forest products industry improve the overall economy of a wood producing area. Ultimately, however, it is a question of using the available wood resources to manufacture paper more cost effectively and/or with higher quality than the competitors. It is these two factors which give a competitive edge to a mill or company.
7.6 Investor Profile
A key element in a successful capital investment to manufacture value added paper products in Alberta is the selection of proper investors.
In evaluating the potential investors, special attention should be paid to the following aspects:
* Their understanding of managing a forest products business. * Their financial situation and the capability of undertaking large
investment projects. * Their marketing capability, know-how and experience including their
existing marketing organization. * Their knowledge of U.S. and Pacific Rim markets * The availability of technically competent sales back-up personnel. * Their technology and know-how to produce special grade products
such as SC- and LWC- papers.
-197-

A qualified company must have a track period of handling the risks inherent in the pulp and paper business and have the capability to implement new business ideas, to introduce new products, and to improve efficiencies in production and marketing.
The following is a list of potential fulfill most of the above requirements. enclosed in Appendix A.7.
-198-
investors, each of which will Profiles of the companies are

Country/Company Paper Grades
SC LWC FBB News
USA Champion Int'l X X James River X X Mead Corp. X Consolidated Paper X Boise Cascade X X Weyerhaeuser X International Paper X Federal paper X Potlatch X Westvaco X Jefferson Smurfit X Bowater X X
CANADA Abitibi-Price Inc. X X X eIP Inc. X X X Consolidated-Bathurst X X Kruger X X Cascade Industries X Domtar X X BCFP X X Fraser Inc. X X Repap X
FINLAND Myllykoski Oy X X Rauma-Repola Oy X Mets.!l.-Serla X X X United Paper Mills Ltd. X Kymmene Oy X Enso-Gutzeit Oy X X X Tampella Oy X
SWEDEN SCA X Stora X Papyrus X Iggesund X Ho1mens Bruk X X
NORWAY Saugbruksforennigen X Follum X Norke Skog X
-199-

SC LWC FBB
GERMANY Feldmuhle Ag X X X Haindle GmbH X
ITALY Burgo SpA X
SC: LWC: FBB:
Supercalendered Groundwood Containing Papers Light Weight Coated Groundwood Containing Papers Folding Box Board
News: Newsprint
-200-
News