a brief history of sociological - sesync · widely used data collection technique in sociology,...
TRANSCRIPT

Dr. Riley E. Dunlap
Oklahoma State University
A Brief History of Sociological
Research on “Environmental
Concern” (aka Environmental
Attitudes, Beliefs, Opinions
and/or Values)

Early Sociological Response to the Rise of
Environmental Issues in Late 1960s and 1970s
One of the first responses of sociologists to the growing
attention given to environmental problems was to conduct
surveys of awareness and concern about such problems,
preferred solutions to them, and the like.
Surveys were typically done at the state or local level, or
with special populations such as college students or
members of environmental organizations, although some
sociologists gradually used national data from polling
firms.
These efforts reflected the popularity of survey research in
sociology at large.

Survey Research
For several decades survey research has been the most
widely used data collection technique in sociology,
although many other techniques are widely used as well.
Historically face-to-face and mail surveys predominated,
but first telephone and especially in recent years internet
surveys have become more common. Mixed-mode surveys
employing two or more of these methods are also
becoming widely used.
A great source for survey research is Don A. Dillman, et al.,
Internet, Phone, Mail and Mixed-Mode Surveys: The
Tailored Design Method, 4th ed. Wiley, 2014.
Survey AccuracySurveys are popular because if probability sampling is used, then relatively modest-sized samples can provide accurate results for very large and geographically dispersed populations.
Using probability sampling techniques (variations on random sampling), results from a sample of 1000-1100 U.S. adults can provide results with a +/- 3% margin of error (confidence interval) at the .95 confidence level.
Importantly, accuracy depends primarily on sample size and not population size. E.g., to reach the above level of accuracy with samples of Maryland adults and even of Baltimore adults the sizes need be virtually the same as for a nation-wide survey.

Predicting Environmental ConcernA key sociological contribution was to identify characteristics associated with environmental concern (EC), or to identify the “social bases” of concern.
Demographic and political characteristics were the primary variables examined, and typically younger, better educated and politically liberal Americans were found to be significantly more concerned than their counterparts, with urban residents and Democrats often somewhat more concerned. Over time women and non-whites have become more concerned as well, especially regarding environmental risks.
This work continues, but has been supplemented by studies incorporating a wide range of social-psychological characteristics as we will see later.

Environmental Attitudes and Actions
Environmental surveys (by sociologists and others) were
also popular because they were seen as offering insights
for the solution of environmental problems.
Some surveys focused on support for various governmental
policies, and others focused on willingness to take pro-
environmental actions ranging from paying higher taxes to
using less energy to giving money to environmental
organizations.
The implicit and sometimes explicit assumption was that
pro-environmental attitudes would in fact generate pro-
environmental behaviors.
This assumption, while widely held, has always been
problematic.
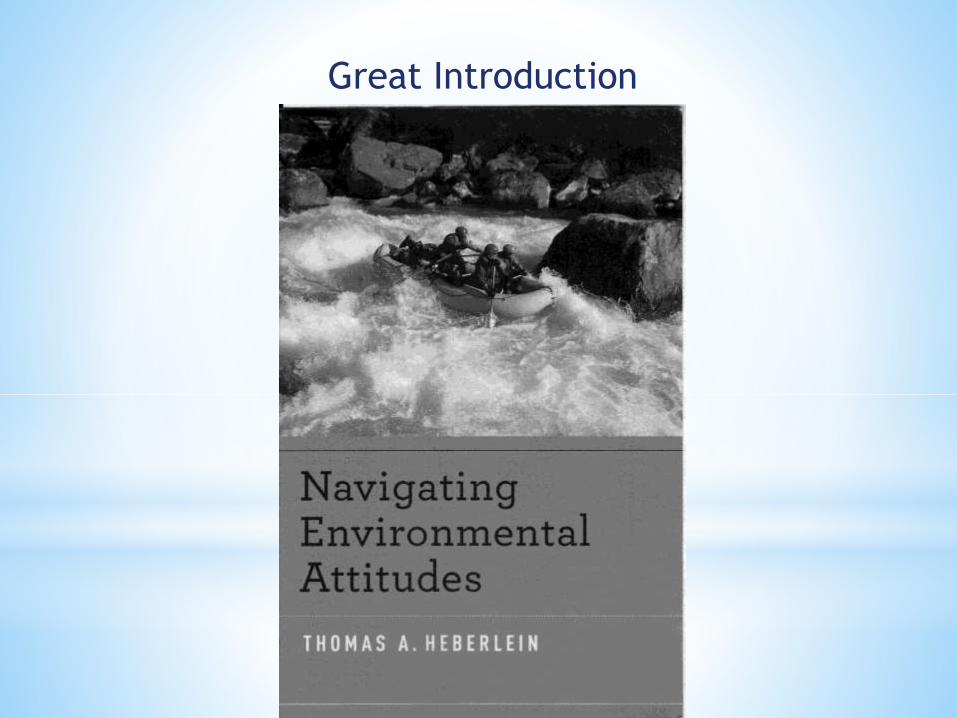
Great Introduction

Attitudes and the Three Fixes for
Environmental Problems (adapted from Heberlein 2012)
Technological Cognitive Structural
What Changes Environment Human Behavior Human Behavior
How Change is
Achieved
Technology
influences the
environment
Information
influences human
behavior
Structure of
the situation
influences human
behavior
Examples re
Global Warming
Proposals to
ameliorate global
warming via geo-
engineering
Proposals to
increase public
awareness of
GW’s threat
Proposals to
institute a carbon
tax
Role of Attitudes Technology must
be consistent with
dominant public
attitudes and
values
Attitudes must be
changed and
attitudes must
influence
behavior
Policies must be
consistent with
dominant public
attitudes and
values

Attitude-Behavior Relationship
While the cognitive fix remains popular, as apparent from
the “information deficit” model which assumes that
increased public understanding of science will stimulate
both personal behavioral changes and support for policies.
However, it seldom works, because (1) it is difficult to
change attitudes and (2) attitudinal change frequently fails
to produce behavioral change.
I refer you to Heberlein’s book for more details, and now
wish to focus on sociological contributions to
understanding environmental attitudes (“concern”) and
developing more sophisticated models of the factors
stimulating it and pro-environmental behaviors.

Clarifying Environmental Attitudes,
Beliefs and Values
“Environmental attitudes … are based on values and
built on beliefs, some of which are knowledge [or
assumed to be] and some of which contain an
emotional component called evaluative beliefs.
Attitudes have horizontal [and vertical] structure,
depending on the number of beliefs and values on
which they are based. They have varying degrees of
consistency and rationality.” Heberlein, 2012, p. 32
Other theorists include a “conative” component
consisting of behavioral intentions, or even behaviors.

Vertical Structure Diagram of Leopold’s
Attitude Toward Pines (Heberlein, 2012)
I am in love with pines.
Trees planted oneself are better.
I planted the
pine myself.The birch
planted itself.
Family security (paternalism)
Vertical
Structure
Attitude
Evaluative Belief
Beliefs
Value
Environment at Attitude Object
“… our understanding of environmental attitudes is limited
because the attitude object ‘the environment’ is, alas,
especially slippery.” Heberlein, 2010, p. 48.
In the suggested reading, Dunlap and Jones (2002), we
note that there are (obviously) two components of
“environmental concern,” the environmental and the
concern components, and both have many facets.
The result is that a bewildering array of items are
employed in measures of EC, leading to ambiguity due to
non-comparability and inconsistent findings.

Environmental Component
For example, various facets of the environment include:
1. Atmosphere, hydrosphere, lithosphere, flora and
fauna--aspects of the biophysical world.
2. Waste repository (pollution), resource depot (natural
resources) and living space (land)—functions for
humans.
3. Resource depletion vs. conservation, pollution
generation vs. abatement, and development vs.
preservation—outcomes of human activities.

Complicating matters, each of these and other facets can
be measured at:
1. Varying levels of specificity--e.g., pollution, air
pollution, acid rain.
2. Differing spatial scales—e.g., local, regional, national
and global.
3. And sometimes with reference to the past, present or
future.
Concern Component
There are two major approaches to measuring the concern
component:
1. Various versions of attitude theory, leading to a focus
on attitudes, beliefs, and behavioral intentions (and
sometimes even values) as the key facets.
2. A more policy-relevant (but less theoretical) approach
that focuses on facets such as the seriousness of
environmental problems, their primary causes,
preferred solutions, and willingness to support various
solutions from governmental regulations to “green”
behaviors.

Resulting Ambiguities
So not only is “environment” a slippery attitude object,
but the attitudes and opinions toward it can be
conceptualized and measured in a huge variety of ways.
The result is that multi-item scales of “environmental
concern” have often included a diverse set of items
tapping both different facets of the environment and
reflecting differing approaches to measuring concern.
For the first couple of decades a number of scales with
weak content validity were employed, and often broke
into distinct “dimensions” with factor analysis reflecting
either major environmental facets, or differing
conceptualizations of concern.

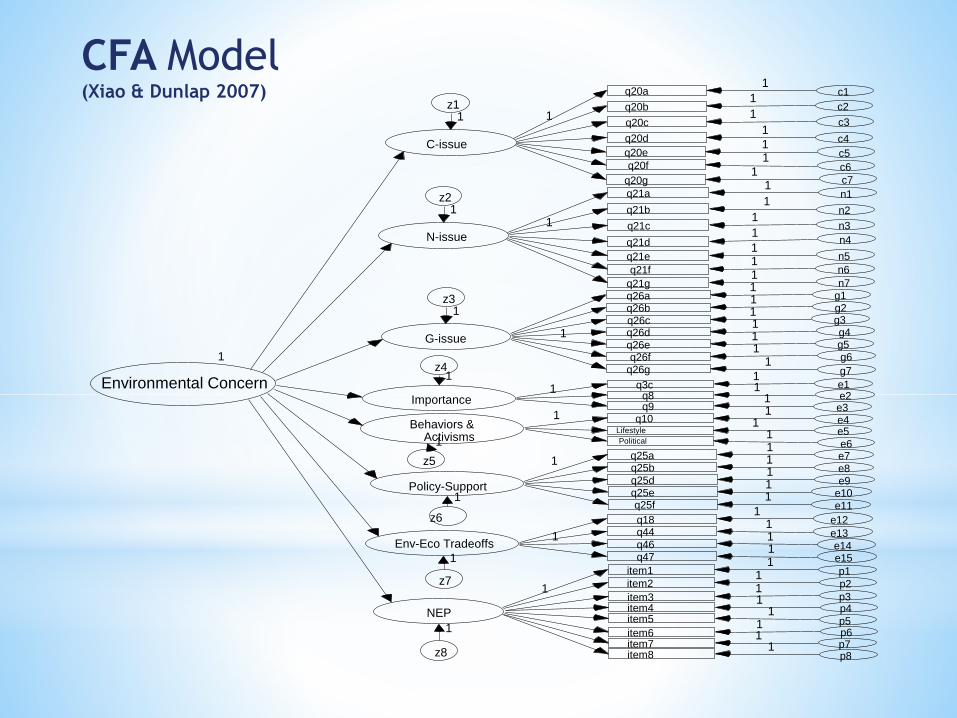
Improved MeasurementMore recently improved methodological techniques, such as confirmatory factor analysis CFA), have allowed for the construction of measures of EC that better capture its complexity.
CFA allows one to hypothesize a measurement model consisting of several multi-item components (facets) all thought to provide indicators of the underlying (latent) construct of EC, and then test it.
Here is an example using items from Gallup’s Health of the Planet Survey, which I designed to tap various policy-relevant facets along with differing geographical facets plus basic beliefs reflecting an ecological worldview (NEP).
Structural equation models (SEM) allow for the inclusion of predictor variables as well.

Facets of Environmental Concern (Xiao & Dunlap 2007)
1. Importance of environmental problems (three items).
2. Support for environmental policies (five items).
3. Environment-economy tradeoffs (four items).
4. Environmental behaviors and activism (two multi-item indexes plus additional item).
5. The New Ecological Paradigm (eight items).
6. Global environmental problems (seven items).
7. National environmental problems (seven items).
8. Local environmental problems (seven items).
CFA Model(Xiao & Dunlap 2007)
item3 p31
item4 p41
item5 p51
item1 p1item2 p2
1
item6 p6item7 p7item8 p8
11
Behaviors &Activisms
q3c e11
q8 e21
q9 e31
q10 e41
Lifestyle e51
Political e61
q18 e121
q44 e131
G-issue
q26a g11
q26b g21
q26c g31
q26d g41
q26e g51 1
q26f g61
q26g g71
q21e n51
q21f n61
q21g n71
C-issueq20e c5q20f c6
q20g c7
11
1
N-issue
q21a n11
q21b n21
q21c n31 1
q21d n41
q20a c1
q20b c2
q20c c3
q20d c4
1
1
1
1
1
NEP
1
Env-Eco Tradeoffs
q25a e71
q25b e81
q25d e91
q25e e101
q25f e111
q46 e141 1
q47 e151
Importance
Policy-Support
1
1
1
1
Environmental Concern
z11
z21
z31
z41
z5
z6
1
z7
1
z8
1
1
1
1

item3 p31
item4 p41
item5 p51
item1 p1
item2 p2
1
item6 p6
item7 p7
item8 p8
1
Behaviors &
Activisms
q3c e11
q8 e21
q9 e31
q10 e41
lifestyle e51
political e61
q18 e121
q44 e131
G-issue
q26a g11
q26b g21
q26c g31
q26d g41
q26e g5
1 1
q26f g61
q26g g71
1
NEP
Env-Eco
Tradeoffs
q25a e71
q25b e81
q25d e91
q25e e101
q25f e111
q46 e141 1
q47 e151
Importance
Policy-
Aupport
1
1
1
General
Concern
1
z11
z21
z3
1
z4
z5
1
z6
1
1
x1
1
Age
Education
Gender
Residence
Social
Class
Political
ldeology
x2
1
1
1
1
SEM Model

Explanatory Models of Environmental Behavior
A few sociologists have gone beyond (1) identifying the
predictors of EC and (2) improving the conceptualization
and measurement of such concern.
Their goal has been to develop explanatory models that
can predict EC and especially pro-environmental
behaviors—models that recognize the complexity of the
link between attitudes and behaviors.
The two crucial efforts are the “norm-activation model”
and its successor, the “value-belief-norm” model.

Norm-Activation Model/NAM(Heberlein, 1972)
Moral Norms
(Golden Rule)
Environmental Norms
Awareness of Consequences (AC)
Ascription of Responsibility (AR)
Pro-Environmental Behaviors
Land Ethic or Golden Rule?
In the process of testing the NAM in a study of yard burning
in Spokane in the mid-1970s, I questioned Heberlein’s
claim that the development of environmental norms was
evidence that Leopold’s “land ethic” was emerging.
In an commentary (with this slide’s title) Van Liere and I
noted that he was measuring primarily human rather than
environmental consequences with his AC items, and only a
powerful effect of the latter would indicated a land ethic.
The debate and distinction between human and
environmental consequences was credited by Stern, Dietz
and colleagues with stimulating the distinction between
biospheric and altruistic values, which has become
increasingly used in current work.

Causal Model of Environmental Behavior (Stern et al. 1995)
Position in social structureInstitutional constraints
Incentive structure
Values
General beliefs
Worldview (NEP)
Specific beliefsSpecific attitudes
Behavioral commitments and
intentions
Behavior

The Value-Belief-Norm Model (VBN) (Stern et
al. 1999)
Altruistic
ValuesEgoistic
Values
Traditional
Values
Openness to
Change Values
NEP
Awareness of
Consequences
Ascription of
Responsibility
Proenvironmental
Personal Norm
Environmental
ActivismEnvironmental
Citizenship
Policy
Support
Private-Sphere
Behaviors

The VBN (sometimes with modifications) has become the
most widely used predictive model for environmental
behavior (or concern, when behavior is not measured).
And, importantly, over time progress has been made in
measuring biospheric values as a separate dimension of
values—especially by Dutch psychologists deGroot and
Steg.
(Other models such as Ajzen and Fishbein’s Theory of
Planned Behavior are also used, especially by
psychologists.)

Egoistic Values:
• Social Power
• Wealth
• Authority
• Influential
• Ambitious
Altruistic Values:
• Equality
• A World at Peace
• Social Justice
• Helpful
Biospheric Values:
• Preventing Pollution
• Respecting the Earth
• Unity with Nature
• Protecting the Environment
Three Value Orientations (deGroot and Steg 2007)

Back to Major Trends in Sociological on EC
In reality, much of the early work by sociologists on
EC consisted of analyses of opinions, not attitudes,
especially when using data collected by public
opinion polling firms like Roper, Cambridge and Gallup
as well as NORC’s General Social Survey (GSS).
This work continues, as sociologists are often forced
to use available data, especially for trend studies.
Attitude theorists like Heberlein tend to view such
work skeptically, especially when it employs single-
item indicators of EC that have limited validity and
reliability.
Nonetheless, we are often forced to use available
data, and I think we can still produce valuable
knowledge.

Opinions
When attitudes have little cognitive structure, they are
weak and often easily changeable. These are opinions.
Attitudes tend to be relatively enduring, but opinions can
change fairly quickly.
“The problem with most polls is that they ask only one
question to measure the like-dislike, favor-oppose
dimensions that opinions share with attitudes. When we
get an answer to one question, it’s much like nibble on a
fishing line…. To determine what’s nibbling our bait, and
determine the attitude’s size and heft, we must ‘set the
hook’ with many questions.”
Heberlein, 2012, p. 31.

Longitudinal Studies of ECA major benefit of using polling data is that we can track the general public’s level of EC over time.
Documenting trends in EC has been a major focus of environmental sociologists, and I, e.g., published several articles employing results from several polls up through 2002.
Unfortunately some firms stopped using their items, and these days the only one we have is the GSS environmental spending item.
Recent studies have become more methodologically sophisticated, employing cohort analysis to provide more in-depth understanding of how levels of EC have changed over time.

Tracking Changes in the Socio-Political Bases
of EC
A key concern has become tracking changes in the
correlates of EC, and the most notable change since the
1970s has been for political orientation.
While ideology was always a significant, but modest (.03 or
less) correlate, party was sometimes not significantly
related.
By the mid-1990s noticeable patterns of polarization began
on both party and ideology, and nowadays they are
typically the two best predictors of EC (with independent
effects despite being strongly correlated), and especially
for climate change.

Percentages of Liberals and Conservatives
Reporting that National Spending on
Environmental Protection Is “Too Little,”
1974-2012 (McCright et. al., 2014)
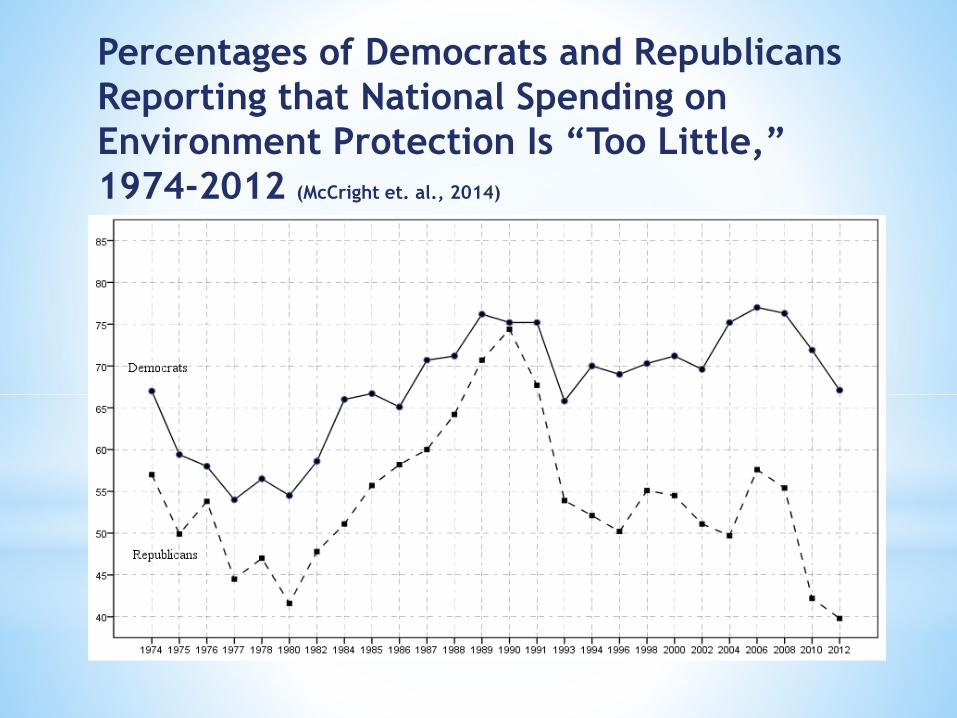
Percentages of Democrats and Republicans
Reporting that National Spending on
Environment Protection Is “Too Little,”
1974-2012 (McCright et. al., 2014)

Percentage of Americans Saying the
Effects of Global Warming Have Already
Begun (McCright & Dunlap, 2011)
4854 53 51 51
5458 60 61
5350
0
10
20
30
40
50
60
70
1997 2001 2002 2003 2004 2005 2006 2007 2008 2009 2010
Total Public

Percentage of Americans Saying the
Effects of Global Warming Have Already
Begun (McCright & Dunlap, 2011)
52
6157
6057
6470 70
76
68 70
48 49 4742 42 41
45 4642
3229
0
10
20
30
40
50
60
70
80
1997 2001 2002 2003 2004 2005 2006 2007 2008 2009 2010
Democrats Republicans

Cross-National Surveys of EC
In the early 1990s a major development occurred, as three
sets of cross-national data on EC became available in quick
succession:
1. Gallup’s 1992 Health of the Planet Survey
2. The ISSP’s 1993 Environmental Module
3. The 19902-93 World Values Survey
For the first time sociologists and other social scientists
could examine EC across 24 (HOP) to 40+ nations.
This led to many tests of competing perspectives on the
sources of international EC.

Post-Materialism and the Affluence Hypothesis
Inglehart’s theory of value change, from “materialist”
values (promoting economic growth, fighting higher prices,
etc.) to “post-materialist” values (e.g., protecting
freedom of speech, giving people more say in decision-
making) values, had proven useful in explaining the rise of
Green Parties and anti-nuclear activism in W. Europe, and
was thus it was widely assumed that EC depended on
growing affluence and P-M values.
It was widely assumed that citizens in poorer nations
would be much less concerned about environmental quality
than their counterparts in wealthy ones.
The assumption was shared by social scientists and policy-
makers like Larry Summers.

Conflicting Results
The HOP and some WVS results showed, however, that
citizens of poor nations were often more environmentally
concerned than those in wealthy nations, setting off a
debate over the role of affluence and P-M values versus
awareness of and exposure to environmental degradation.
Often conflicting results stem from uses of differing
indicators of EC, with items measuring WTP being more
likely (not surprisingly) to be correlated with affluence and
P-M values. I think the bulk of the evidence suggests that
national affluence is not related to levels of EC, but P-M
values still tend to be at the personal level.

Multi-Level Modeling (MLM) and Studies of EC
The growing use of MLM has allowed researchers to examine the relative effects of personal characteristics and contextual factors (e.g., national-level affluence) on EC, now common in cross-national research.
This has enabled researchers to examine a wide-range of factors such as urbanization, inequality, democratization, World Polity position and location in the World System along with personal characteristics in cross-national studies.
And vitally, national-level measures of environmental conditions are sometimes employed as well, at last turning studies of EC into studies of “societal-environmental interactions.” The role of such conditions is thus far ambiguous, given often poor indicators and the huge level of aggregation employed.

MLM and Climate ChangeMLM can be used with contextual data from various spatial
scales, and is increasingly employed to address a crucial
issue—the potential impact of weather/climatological
phenomena on the public’s views of climate change.
In the U.S. studies have examined the weather/climate
variables (e.g., temperature deviations) at the regional,
state, and more localized areas in efforts to see if
experiences/perceptions of “actual” weather/climate
affects individual’s views of climate change.
Those concerned about climate change are very hopeful
that experience with abnormal temperatures and other
extreme weather events will lead to greater public
acceptance of the reality, seriousness and urgency of
climate change.
Reality vs. Ideology
Thus far results supporting this hope are ambiguous to say
the least, as I’ll note in more detail tomorrow.
For example, in a study combining Gallup’s national data
on views of “global warming” with data on statewide
temperature deviations (the abnormally warm 2012 Winter
relative to the 30-year average for each state), colleagues
and I found that actual temperature was strongly related
to residents rating last Winter’s temperature as “warmer
than average.” However, among those who gave this
response, actual temperature deviations were not related
to attributing the warming winter to global warming.
Instead, political party and ideology were the strongest
predictors of this response.

Thanks.

Naïve Views of Public OpinionIt is an exaggeration to say that pollsters can find
whatever they want by wording items in certain ways.
But it is likewise naïve to believe that a single item can
provide an accurate reflection of the state of public
opinion—what Howard Schuman calls the “referendum”
view of polling for two reasons:
1. Using different items can produce somewhat different
results, and
2. Many issues are complex, and require more than a
single item to measure opinions toward them.

Appropriate Uses of Polling Results
Schuman argues that opinion items are best suited for making comparisons:
1. Across differing segments such as males and females, young and old, and
2. Over time with longitudinal data.
Even sophisticated measures like the “Six America’s” segmentation of American’s views of global warming are best used for these two purposes, as the original (and subsequent” distributions of respondents into these six segments would vary a bit if one or two of the 36 items had been deleted or altered.

Yale Climate Change Project’s Six America’s
2014 Results
Alarmed – 13%
Concerned – 31%
Cautious – 23%
Disengaged – 7%
Doubtful – 13%
Dismissive – 13%
Trends show a decline in the Alarmed and Concerned
segments and a rise in the Dismissive and Doubtful
segments from 2008 to 2010, and then relative stability
since then.