a bridge between two worlds – where qual and quant meet: slides from ux australia 2015
TRANSCRIPT
Rosie Handby – Head of Analytics & Insights, U1GroupRenee Farnham – Strategy Lead, The Design Practice, Telstra
two worldsA bridge between
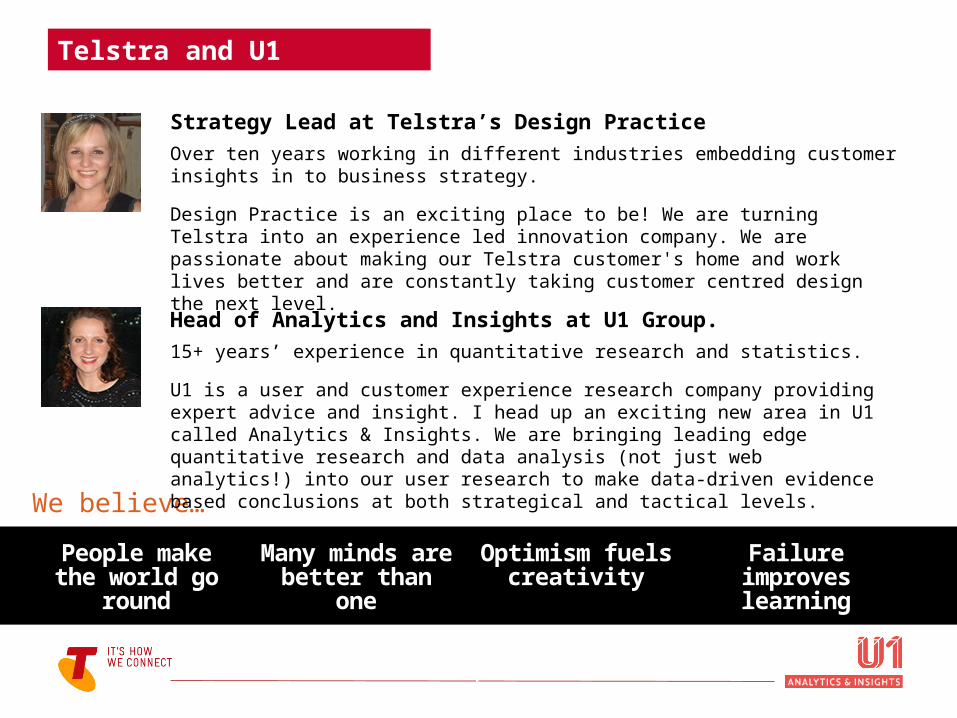
Telstra and U1 Collaboration
People make the world go
round
Many minds are better than
one
Optimism fuels creativity
Failure improves learning
We believe…
Strategy Lead at Telstra’s Design PracticeOver ten years working in different industries embedding customer insights in to business strategy. Design Practice is an exciting place to be! We are turning Telstra into an experience led innovation company. We are passionate about making our Telstra customer's home and work lives better and are constantly taking customer centred design the next level.Head of Analytics and Insights at U1 Group. 15+ years’ experience in quantitative research and statistics.U1 is a user and customer experience research company providing expert advice and insight. I head up an exciting new area in U1 called Analytics & Insights. We are bringing leading edge quantitative research and data analysis (not just web analytics!) into our user research to make data-driven evidence based conclusions at both strategical and tactical levels.
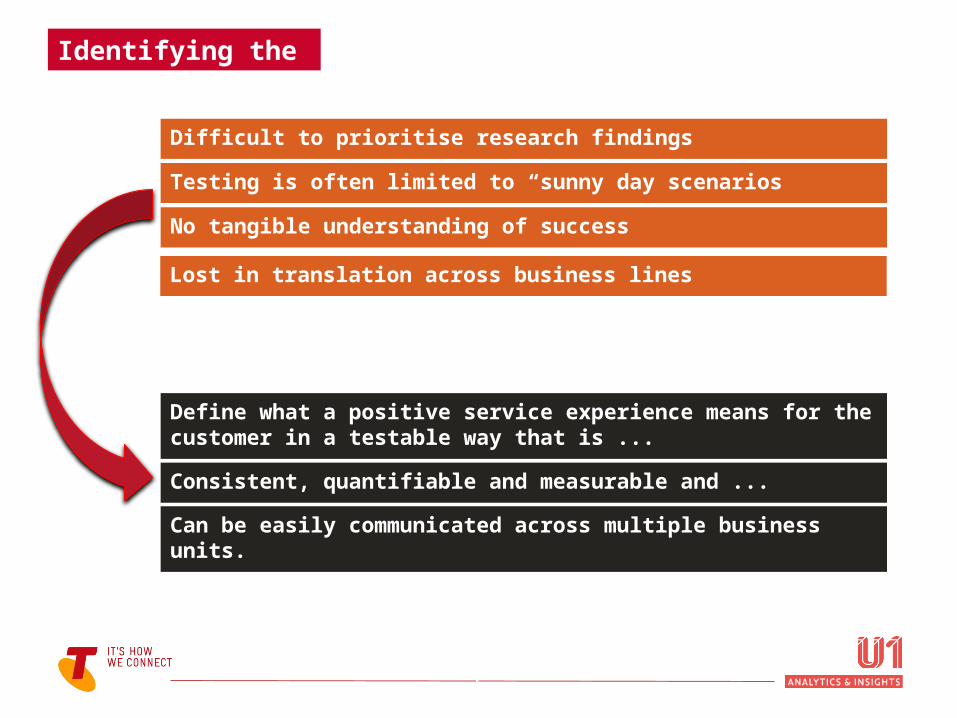
Identifying the need
Consistent, quantifiable and measurable and ...
Can be easily communicated across multiple business units.
Define what a positive service experience means for the customer in a testable way that is ...
Testing is often limited to “sunny day scenarios”
No tangible understanding of success
Difficult to prioritise research findings
Lost in translation across business lines
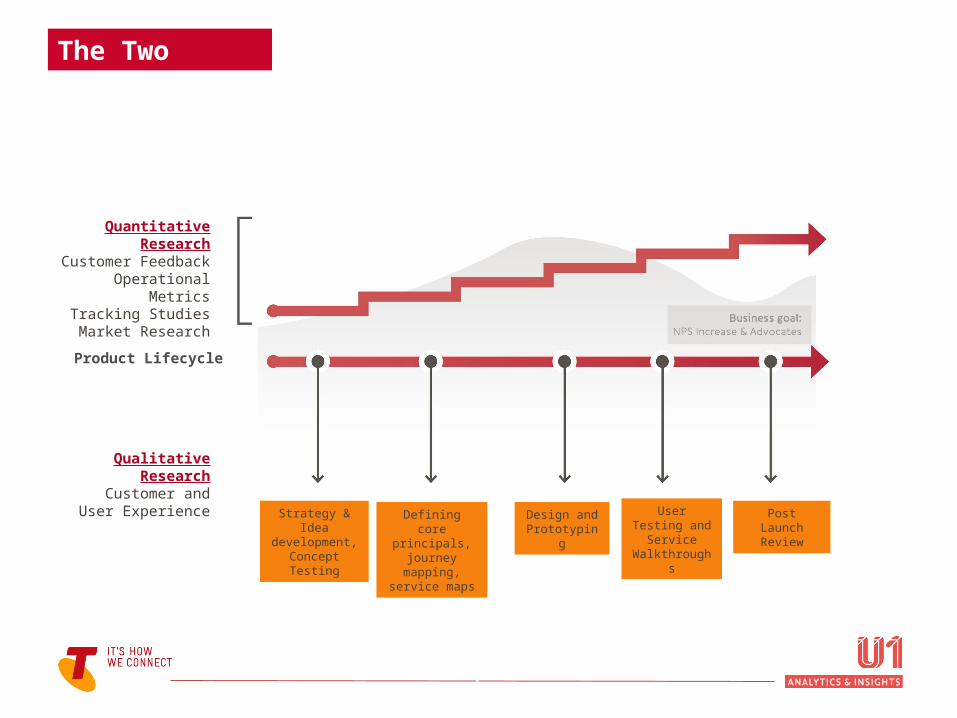
The Two Worlds
Quantitative Research
Customer FeedbackOperational Metrics
Tracking StudiesMarket Research
Product Lifecycle
Qualitative Research
Customer and User Experience Strategy &
Idea development,
Concept Testing
Defining core principals,
journey mapping,
service maps
Design and Prototyping
User Testing and Service Walkthrough
s
Post Launch Review
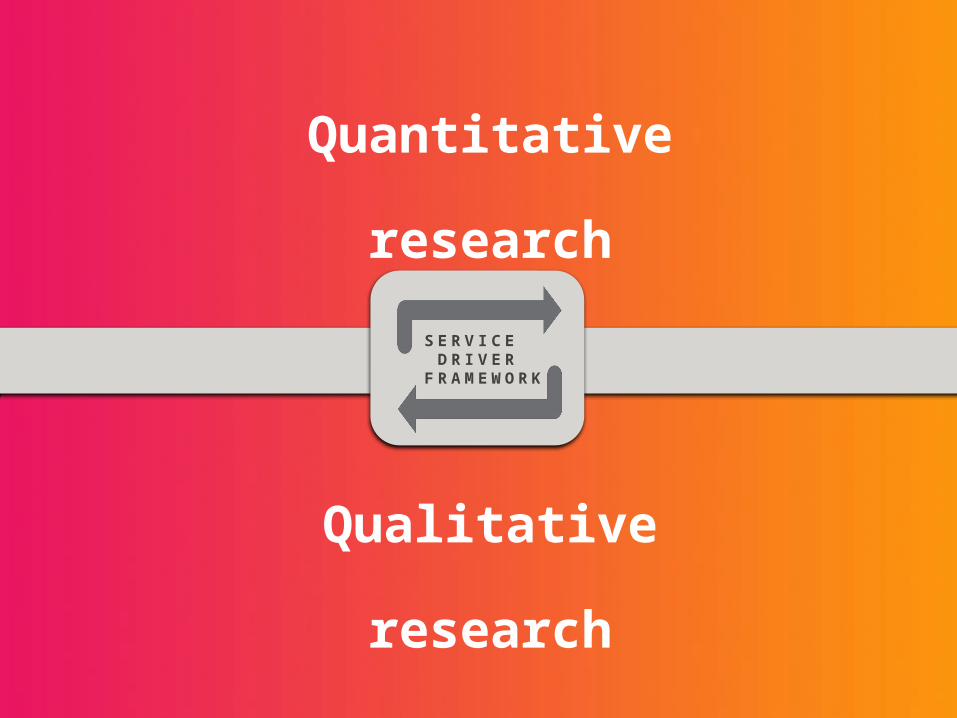
S E R V I C E D R I V E R
F R A M E W O R K
Quantitative
research
Qualitative
research
The Service Driver Framework
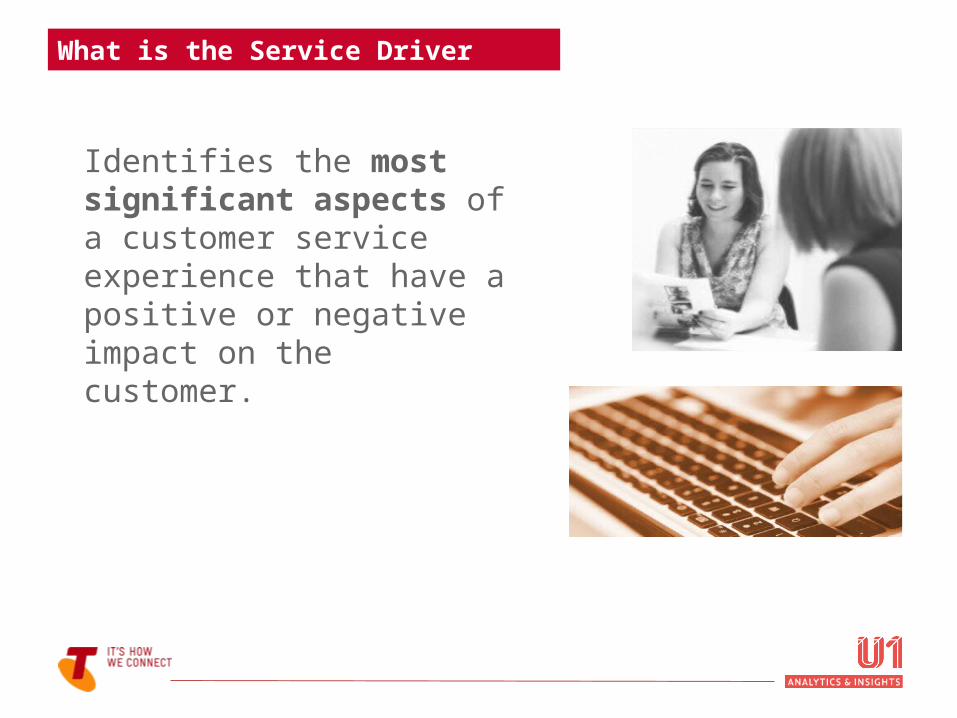
What is the Service Driver Framework?
Identifies the most significant aspects of a customer service experience that have a positive or negative impact on the customer.

Example Service Driver Framework
Theme Service Driver Specific experiences
Reliability & Trust
Resolution Proactive resolution of issues
Keeping Promises Keeping technician appointments, following up on call backs, etc…
Efficiency & Simplicity
Activation Timeframe Overall time taken to activate product.
Simplicity/Customer Effort Simple process to follow for customer
Communication Fully informed Keeping customer informed ongoing
Staff Knowledge Knowledge conveyed to customers about product/services
Staff Attitude Well Mannered Polite, friendly, helpful, courteous, etc...
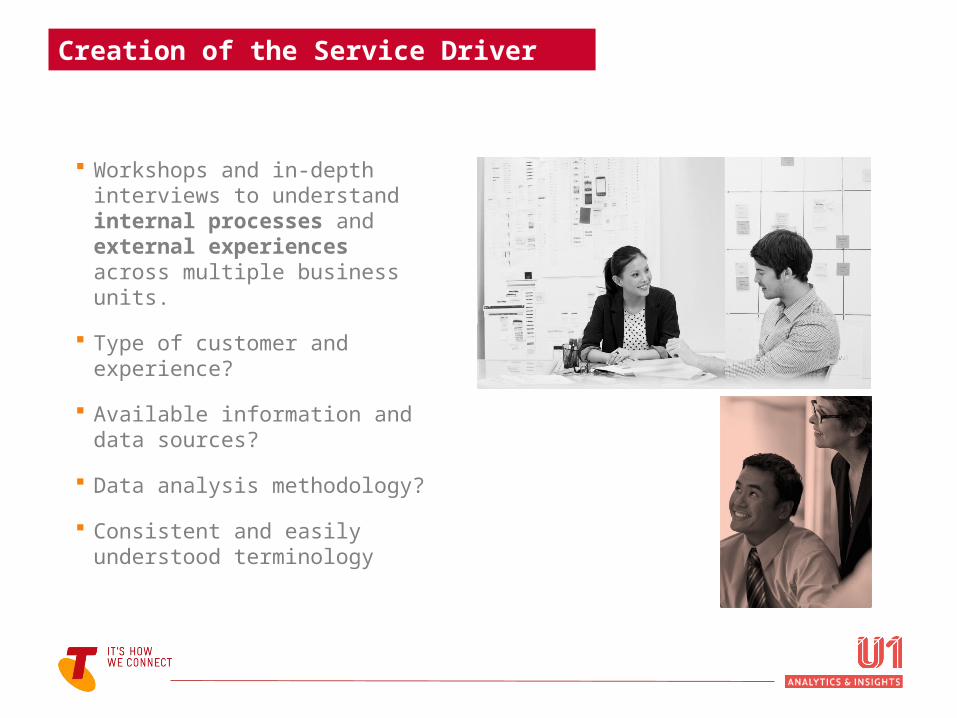
Creation of the Service Driver Framework
Workshops and in-depth interviews to understand internal processes and external experiences across multiple business units.
Type of customer and experience?
Available information and data sources?
Data analysis methodology? Consistent and easily
understood terminology

Collaboration and Shared Language
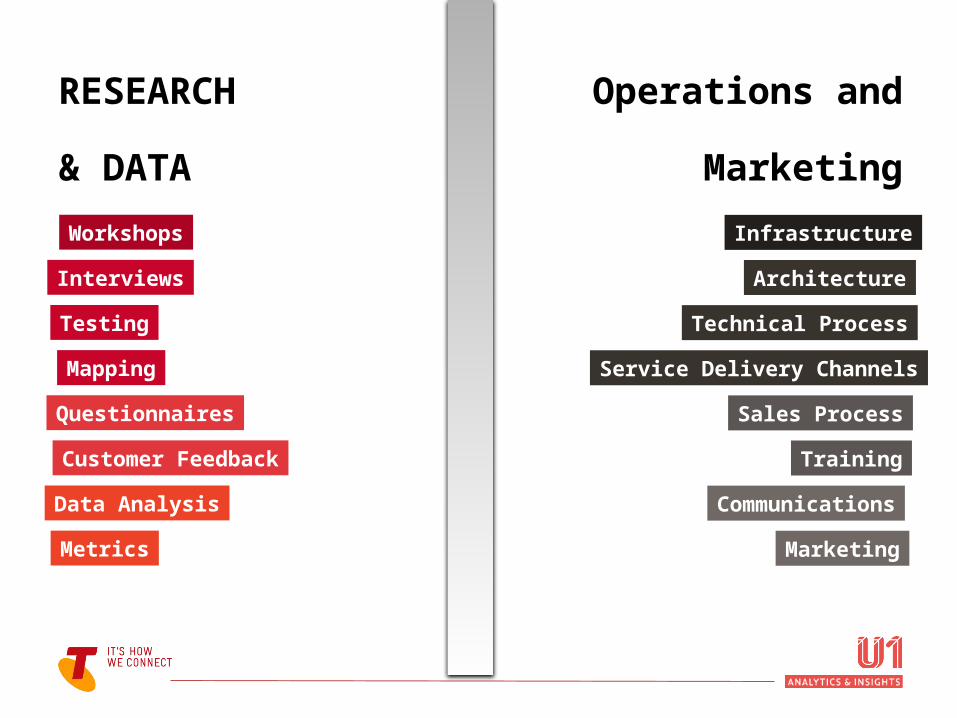
RESEARCH
& DATA
Operations and
MarketingWorkshops
Interviews
Testing
Mapping
Questionnaires
Customer Feedback
Data Analysis
Metrics
Infrastructure
Architecture
Technical Process
Service Delivery Channels
Sales Process
Training
Communications
Marketing
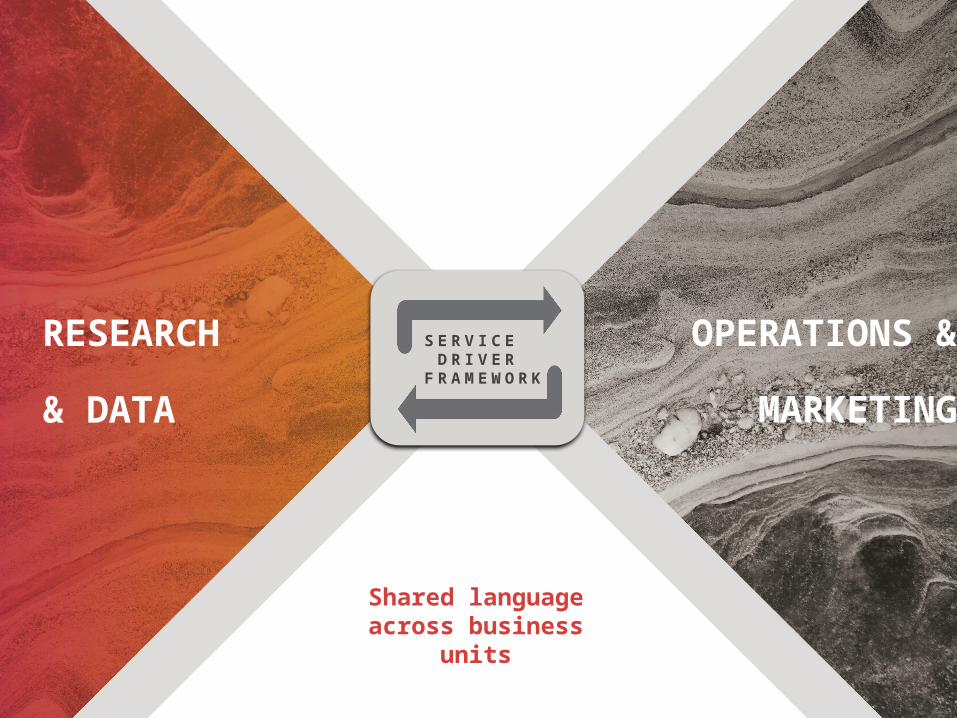
RESEARCH
& DATA
OPERATIONS &
MARKETING
Shared language across business
units
S E R V I C E D R I V E R
F R A M E W O R K
Using the Service Driver Framework
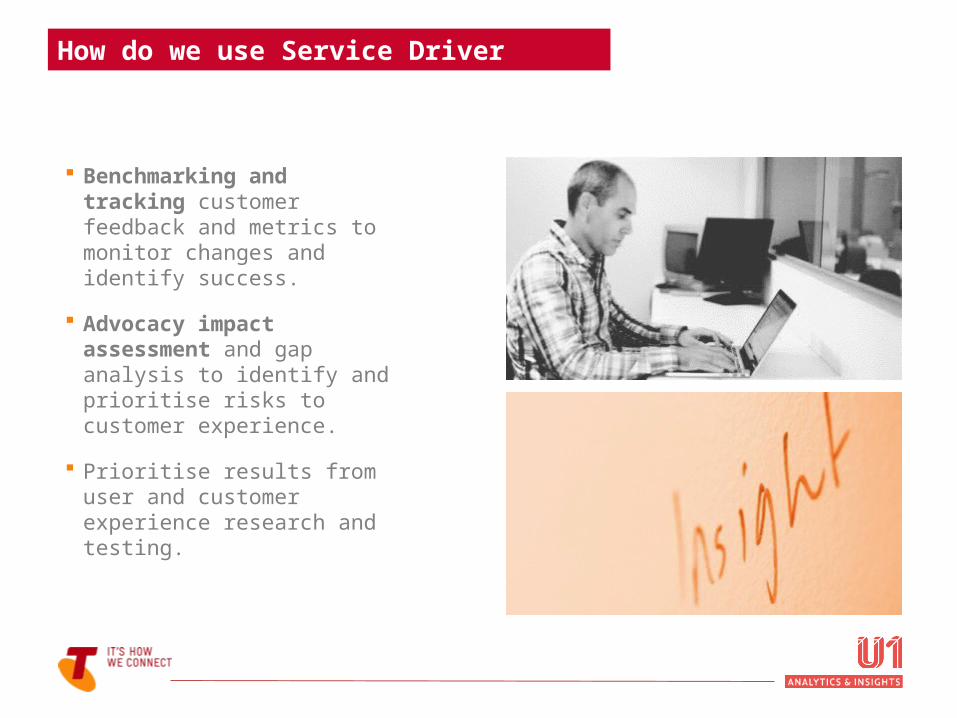
How do we use Service Driver Framework?
Benchmarking and tracking customer feedback and metrics to monitor changes and identify success.
Advocacy impact assessment and gap analysis to identify and prioritise risks to customer experience.
Prioritise results from user and customer experience research and testing.
Practical Application
New process for installing a consumer service.
Objectives
Understand the risk to the customer experience upon implementation of consumer service.
Identify the most significant technical or sales process changes that could potentially impact on advocacy upon launch.
Calculate an advocacy risk score to prioritise the risks.
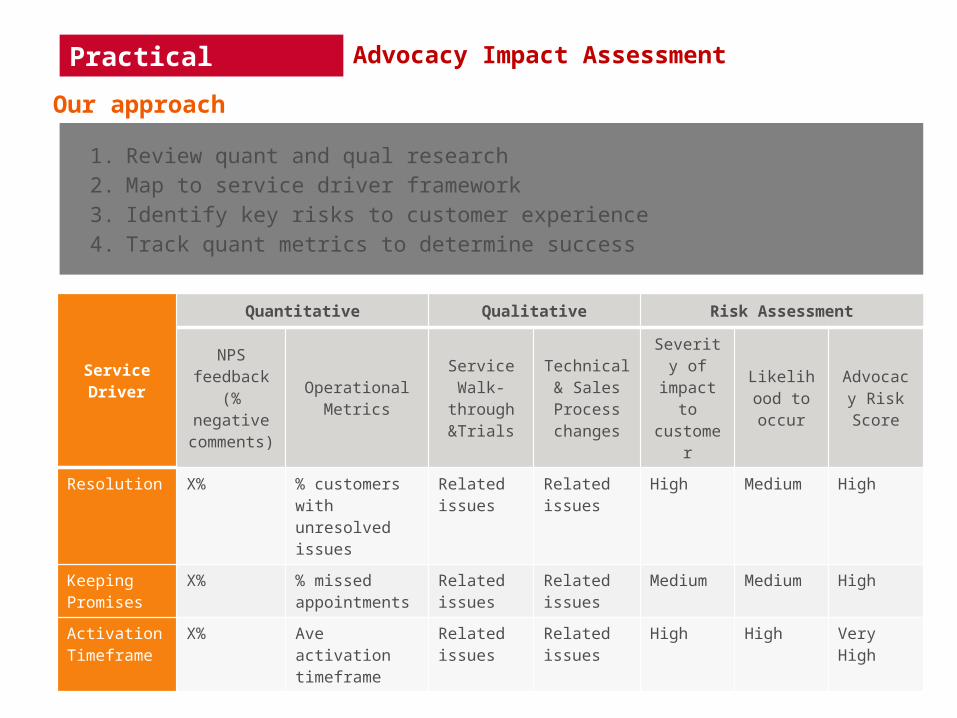
Advocacy Impact Assessment
Practical Application
Service Driver
Quantitative Qualitative Risk Assessment
NPS feedback (% negative comments)
Operational Metrics
Service Walk-
through &Trials
Technical & Sales Process
changes
Severity of impact to customer
Likelihood to occur
Advocacy Risk Score
Resolution X% % customers with unresolved issues
Related issues
Related issues
High Medium High
Keeping Promises
X% % missed appointments
Related issues
Related issues
Medium Medium High
Activation Timeframe
X% Ave activation timeframe
Related issues
Related issues
High High Very High
Our approach
1. Review quant and qual research2. Map to service driver framework 3. Identify key risks to customer experience4. Track quant metrics to determine success
Advocacy Impact Assessment
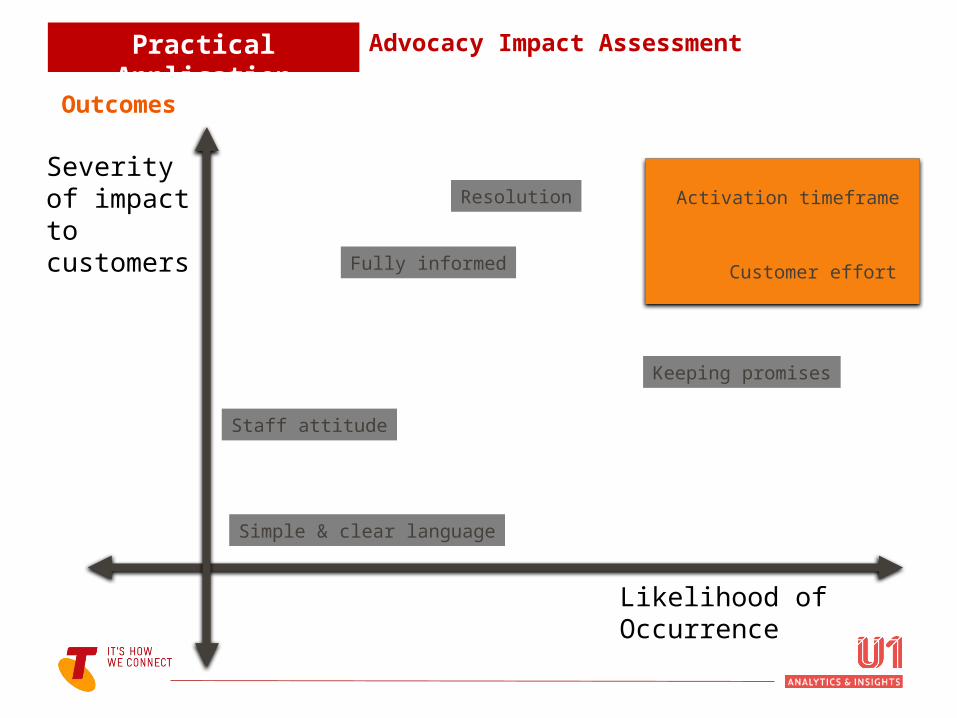
Severity of impact to customers
Customer effort
Keeping promises
Resolution
Staff attitude
Activation timeframe
Likelihood of Occurrence
Fully informed
Simple & clear language
Practical Application
Outcomes
Advocacy Impact Assessment

A Designer’s Perspective
“In discovery we use this to help design our research materials and interview scripts.”
“These drivers become quick ways for us to elicit structured data from our stakeholders”
“When we are defining the problem we are trying to solve, we use this as a catalyst for thinking during stakeholder
workshops.”
“We use this as an existing structure in which to cut down the amount of time we spend doing affinity analyses”

Summing up
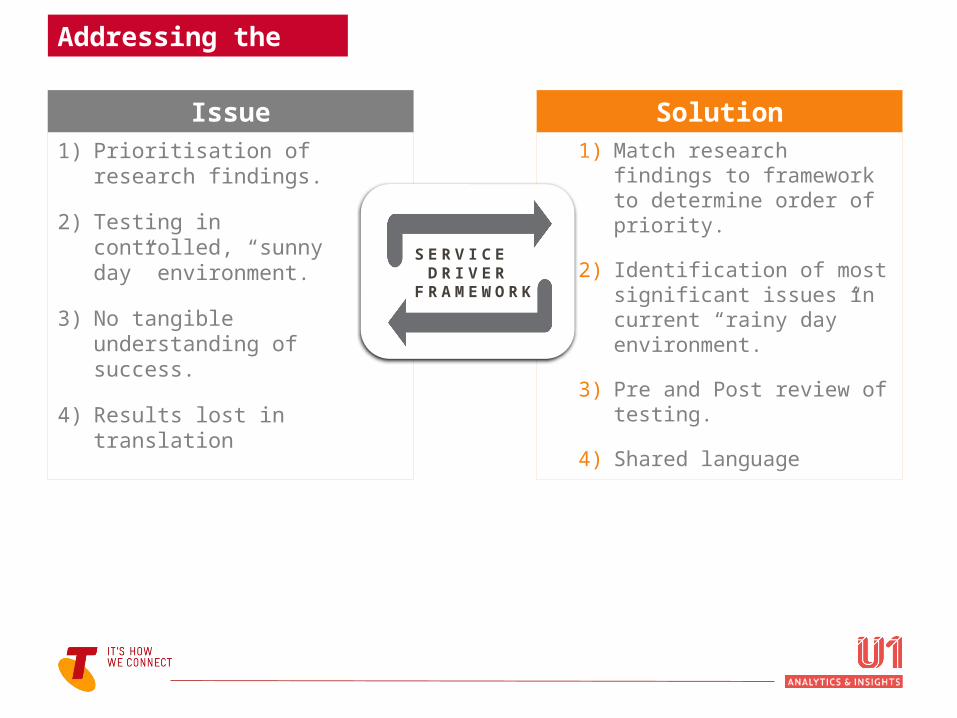
Issue Solution1) Prioritisation of research
findings.
2) Testing in controlled, “sunny day” environment.
3) No tangible understanding of success.
4) Results lost in translation
1) Match research findings to framework to determine order of priority.
2) Identification of most significant issues in current “rainy day” environment.
3) Pre and Post review of testing.
4) Shared language
Addressing the needs
S E R V I C E D R I V E R
F R A M E W O R K

What have we learned?
Linking quantitative with qualitative techniques can significantly improve the ability to understand customers holistically
We can understand our customer needs better than ever. We can improve experiences, and ultimately measure success
We have created a tool to understand existing service environments and prioritise findings on customer experiences
that have the biggest potential to drive change
CONTACT USRENEE FARNHAMStrategy Lead, The Design Practice, Telstra [email protected] | 03 8649 5283
ROSIE HANDBYHead of Analytics & Insights, U1 [email protected] | 03 9684 3470