a blueprint for growth & transformation
TRANSCRIPT
L A S
N E V A D A
DRAFT EXECUTIVE SUMMARY
A Blueprint for Growth & Transformation
OUR OPPORTUNITY
While mobility is key to any economy, it is particularly important to a visitor-based economy like Southern Nevada’s. Here, more than a third of the local economy is dependent on the region’s leisure and hospitality industry — and its 41 million patrons who spend more than $30 billion each year. To this end, Southern Nevada has a vested interest in delivering on the promise of the Las Vegas experience that is our brand.
Las Vegas has a challenge most communities would like as their own: a strong industry in need of greater connectivity. Other communities often invest in infrastructure as a means to lure specific industries, rather than to support growth of the existing economy. Addressing the challenge of building infrastructure to support industry expansion will allow Las Vegas to solidify its regional economy and experience more robust future economic growth.
The Transportation Investment Business Plan invites us to take greater control of our economic future by thoughtfully planning for sustainable growth. By investing in a purposeful, strategic mobility plan with a seamless transportation system at its heart, our community will make a powerful choice to:
• Maintain and grow Southern Nevada’s position as the world’s premier destination for convention business and leisure travel;
• Connect key centers of economic activity to reduce congestion and the cost of movement;
• Position Las Vegas as an attractive place to do business and stimulate our local, regional and state economies; and
• Improve safety for pedestrians and autos alike.
As with any plan that embodies an ongoing course of work and envisions a journey, this plan is intended to be a “living” document. The plan serves as a foundational framework that contemplates and embraces continued exploration and development. I am incredibly proud of our community’s vision for transformational mobility planning. It promises to contribute a new chapter to Las Vegas’ inspiring history…elevating our community as a better place to live, work, play and do business and ensuring our city’s greatness for generations to come. Go Fast. Go Forward. Go Vegas.
Tina Quigley General Manager Regional Transportation Commission of Southern Nevada
DRAFT
3
D R A F T E X E C U T I V E S U M M A R Y • T R A N S P O R T A T I O N I N V E S T M E N T B U S I N E S S P L A N
“A dramatic change is occurring in how metropolitan areas plan for their future. In these places, a dedicated set of civic, corporate, political, and philanthropic leaders are physically remaking their cities and suburbs around the concepts of greater spatial efficiency, improved access to opportunity, and more sustainable urban design. Las Vegas has a generational opportunity to build off its existing assets and dynamic tourism industry by acting with purpose and clarity.”– Robert Puentes and Adie Tomer, Linking Transportation, Planning, and Economic
Growth: Lessons for Metropolitan Las Vegas, Brookings Institution Metropolitan Infrastructure Program.DRAFT
4
D R A F T E X E C U T I V E S U M M A R Y • T R A N S P O R T A T I O N I N V E S T M E N T B U S I N E S S P L A N
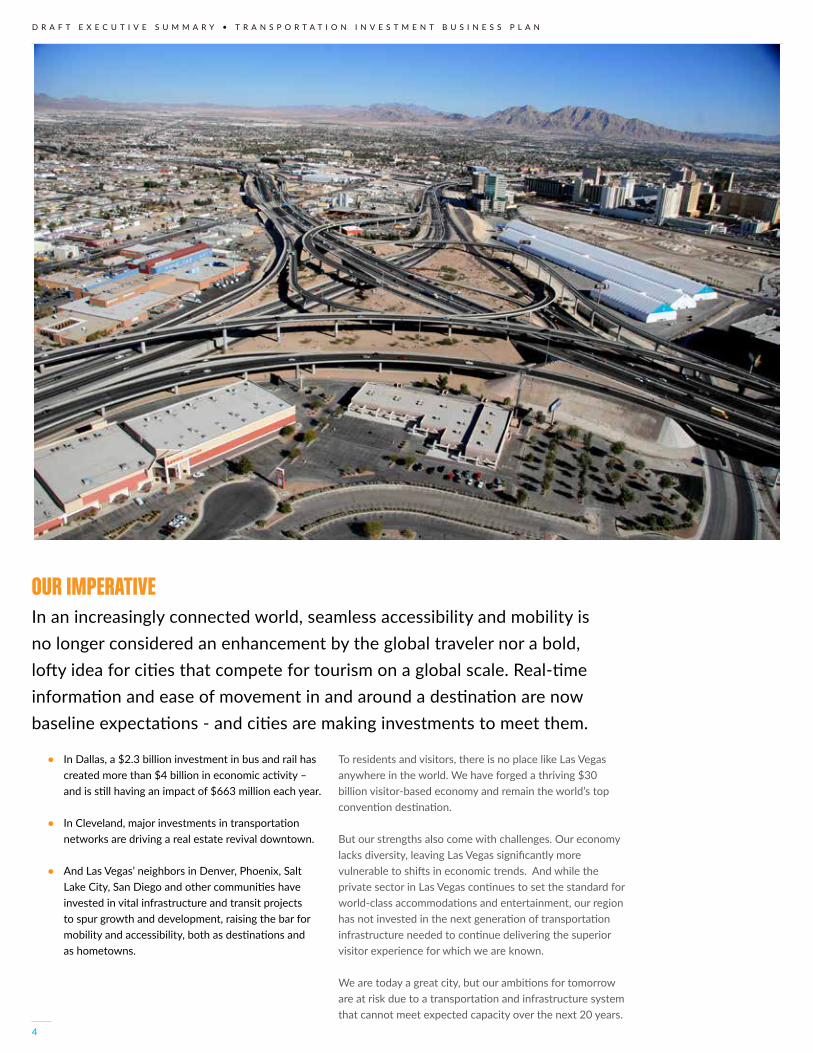
OUR IMPERATIVEIn an increasingly connected world, seamless accessibility and mobility is no longer considered an enhancement by the global traveler nor a bold, lofty idea for cities that compete for tourism on a global scale. Real-time information and ease of movement in and around a destination are now baseline expectations - and cities are making investments to meet them.
• In Dallas, a $2.3 billion investment in bus and rail has created more than $4 billion in economic activity – and is still having an impact of $663 million each year.
• In Cleveland, major investments in transportation networks are driving a real estate revival downtown.
• And Las Vegas’ neighbors in Denver, Phoenix, Salt Lake City, San Diego and other communities have invested in vital infrastructure and transit projects to spur growth and development, raising the bar for mobility and accessibility, both as destinations and as hometowns.
To residents and visitors, there is no place like Las Vegas anywhere in the world. We have forged a thriving $30 billion visitor-based economy and remain the world’s top convention destination.
But our strengths also come with challenges. Our economy lacks diversity, leaving Las Vegas significantly more vulnerable to shifts in economic trends. And while the private sector in Las Vegas continues to set the standard for world-class accommodations and entertainment, our region has not invested in the next generation of transportation infrastructure needed to continue delivering the superior visitor experience for which we are known.
We are today a great city, but our ambitions for tomorrow are at risk due to a transportation and infrastructure system that cannot meet expected capacity over the next 20 years.

5
D R A F T E X E C U T I V E S U M M A R Y • T R A N S P O R T A T I O N I N V E S T M E N T B U S I N E S S P L A N
The Core Area’s existing infrastructure already strains under current demands: key corridors within the Core Area are already 9% to 27% over capacity, and corridors overall are running at 98% of capacity. By 2035, every key corridor save one will exceed its capacity.
We need decisive leadership and public investments to ensure that the visitor experience, which draws millions of tourists to Las Vegas and supports more than 54 percent of our economy, continues to be world-class. Without a modern, seamless transportation system, we risk losing our international stature – particularly in the important meetings and conventions market – to other cities. For no matter what other investments we make – from cultural attractions to great educational facilities to technology hubs – none of it works without mobility.
We can continue to pursue the status quo, as we have historically. We can fail to address the growing need for a multi-dimensional and coordinated transportation system. But these lost opportunities will translate to lost employment for Nevadans, declining revenue for schools and other public works, fewer opportunities for Las Vegas’ small businesses and homegrown companies, and – as we’ve seen – severe consequences for our local economy.
If we choose to take action and invest in transforming mobility in Las Vegas, we will lay the foundation for a dynamic future of more robust economic growth, stronger job creation, greater business development and innovation, increased tourism, and a more livable community – for today’s residents and future generations.
To achieve this bold vision, Las Vegas needs a plan: a clear path forward for our investment and collaboration.
We call it the Transportation Investment Business Plan (TIBP).
*All data reflects 2014 figures. **Direct, indirect and induced for 2014
BEING ONE OF THE WORLD’S FAVORITE DESTINATIONS HAS ITS BENEFITS.*
5.2 million convention visitors 5.2m
41.1 million visitors 41.1m
$29.8B in spending
$29.8b
$13.9B wages and benefits**
$13.9b
$1.5B in tourism-related taxes
$1.5b
54% of regional economic output**
54%
366,000 jobs366k
No matter what other investments we make – from cultural attractions to great educational facilities to technology hubs – none of it works without mobility.
LAS VEGAS’ TRANSPORTATION SYSTEM IS STRAINED
• The average Las Vegas visitor will experience more than 19 minutes in travel delays per trip because of congestion, translating to $241.8 million in lost time and wasted gas.
• The average rush hour commuter in southern Nevada spends 46 hours a year stuck in traffic, and even motorists who don’t drive at peak hours waste 11 hours sitting in traffic annually.
• Peak-hour commuters are calculated to lose over $909 million due to congestion. Off-peak drivers lose $102.7 million.
• Current pedestrian traffic on the strip is between 50,000-67,000. Based on future visitor volumes, pedestrian demand is expected to surge up to 240,000 people per day.
• Should McCarran International Airport reach its maximum capacity of roughly 55 million annual passengers, the streets and highways in and around the Resort Corridor would be utterly incapable of moving those additional visitors through the Core Area.
• The Clark County population will grow to an estimated 2.7 million residents by 2030 and 3.0 million by 2040. The number of visitors, already at a record 41.1 million in 2014, will climb to 53.1 million by 2030 and to 56.3 million by 2040.
THE CHOICE TO DO NOTHING
$8b to $79.8b of Total Economic Loss Over 30 Years

6
D R A F T E X E C U T I V E S U M M A R Y • T R A N S P O R T A T I O N I N V E S T M E N T B U S I N E S S P L A N
OUR PROCESS Initially launched by the Las Vegas Convention and Visitors Authority, a world-leading destination marketing organization, the TIBP is the result of one of the most far-reaching community collaborations in Las Vegas history. Under leadership from the Regional Transportation Commission of Southern Nevada (RTC), the TIBP is a comprehensive blueprint for developing a modern transportation system.
The plan reflects more than 18 months of rigorous research and analysis conducted by local and national experts in engineering, economics, finance, real estate development, transportation, and urban planning. It draws from broad discussions with stakeholders across the region, including business leaders, government officials, resort and destination partners and a variety of community stakeholders.
To develop this plan, TIBP working groups undertook a comprehensive two-tiered evaluation process.
During the Tier 1 analysis, they examined the mobility areas most critical to address, including the travel corridors that currently bear the greatest demand and the mobility bottlenecks that most affect the free flow of people and goods.
In Tier 2, the TIBP consulting team reviewed available travel demand data from transportation providers, existing studies of roadway conditions, transit ridership surveys, household travel surveys, the 2013 RTC Travel Demand Model, and other statistics to identify a range of potential solutions for each mobility focus area.
The TIBP provides transportation and infrastructure recommendations for Las Vegas’ resort corridor and the surrounding areas, anchored by McCarran International Airport, the Las Vegas Strip, the Las Vegas Convention Center, Downtown Las Vegas, the UNLV campus, the Medical District along Charleston Boulevard, and Cashman Center.
THE CORE AREA OF THE TIBP

7
D R A F T E X E C U T I V E S U M M A R Y • T R A N S P O R T A T I O N I N V E S T M E N T B U S I N E S S P L A N
The TIBP is a comprehensive blueprint for developing a modern transportation system.
The overall solutions identified encompass transit, surface street, freeway and pedestrian improvements, in addition to public policy actions to support the most effective use of existing infrastructure. Properly addressing connectivity within a particular mobility focus area involved identifying and compiling solutions from two or more of these categories.
For transit solutions in particular, a rigorous process was undertaken to assess various modes and technologies to determine how effective they would be in addressing each mobility focus area. This analytical process led the TIBP working groups to recommend transit solutions most appropriate to specific needs within each mobility area, as well as those most likely to serve the region’s comprehensive needs now and in the future.
TIER 1EVALUATION
TIER 2EVALUATION RECO
MM
END
ED
ALTERN
ATIVESIdentify corridors with
the highest demand and congestion
Evaluate and narrow potential solutions
Recommend an Initial Range of Viable Modes and Preferred Routing
Systems and Steering Committee input on narrowed list of alternatives
Systems and Steering Committee including Community Stakeholders input on
narrowed list of alternatives
8
D R A F T E X E C U T I V E S U M M A R Y • T R A N S P O R T A T I O N I N V E S T M E N T B U S I N E S S P L A N
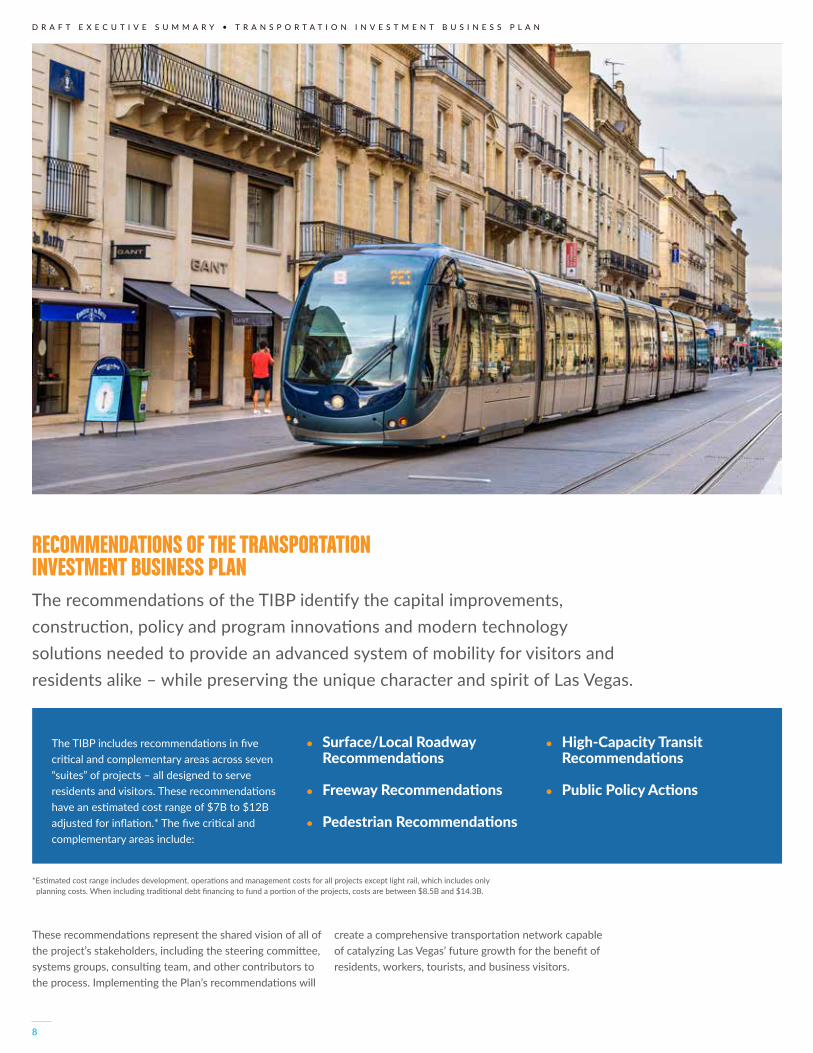
RECOMMENDATIONS OF THE TRANSPORTATION INVESTMENT BUSINESS PLANThe recommendations of the TIBP identify the capital improvements, construction, policy and program innovations and modern technology solutions needed to provide an advanced system of mobility for visitors and residents alike – while preserving the unique character and spirit of Las Vegas.
These recommendations represent the shared vision of all of the project’s stakeholders, including the steering committee, systems groups, consulting team, and other contributors to the process. Implementing the Plan’s recommendations will
The TIBP includes recommendations in five critical and complementary areas across seven “suites” of projects – all designed to serve residents and visitors. These recommendations have an estimated cost range of $7B to $12B adjusted for inflation.* The five critical and complementary areas include:
create a comprehensive transportation network capable of catalyzing Las Vegas’ future growth for the benefit of residents, workers, tourists, and business visitors.
• Surface/Local Roadway Recommendations
• Freeway Recommendations
• Pedestrian Recommendations
• High-Capacity Transit Recommendations
• Public Policy Actions
*Estimated cost range includes development, operations and management costs for all projects except light rail, which includes only planning costs. When including traditional debt financing to fund a portion of the projects, costs are between $8.5B and $14.3B.

9
D R A F T E X E C U T I V E S U M M A R Y • T R A N S P O R T A T I O N I N V E S T M E N T B U S I N E S S P L A N
TIBP RECOMMENDED PROJECT AND POLICY SUITES (ESTIMATED COST RANGE $7B - $12B)
The TIBP recommendations are grouped according to seven “suites” – constellations of interrelated, complementary projects and policies that if
implemented together will have the greatest strategic impact.*
1
3
2
PROJECT SUITE ONE (ESTIMATED COSTS: $2.75B – $3.95B)*
Enhance visitor mobility between McCarran International Airport, the Resort Corridor and Downtown
*Project suite estimated costs include light rail planning and design. Light rail construction, operation and maintenance costs are not included.
PROJECT SUITE THREE (ESTIMATED COSTS: $648M – $712M)
Improve connections between convention and event facilities
High-Capacity Transit Improvements
• Planning for Core Area light rail• Bonneville Transit Center expansion• Light rail extension to Cashman Center• McCarran Multimodal Transportation Center
Pedestrian Improvements
• Pedestrian bridges at Convention Center Dr/Paradise Rd, Sands Ave/Koval Ln, Paradise Rd/Harmon Ave and Tropicana Ave/Koval Ln
• Monorail extension to Mandalay Bay• New monorail station at Sands Expo and
Convention Center• Monorail spur to LVCVA expansion facilities• Monorail extension to future high-speed rail
Surface/Local Roadway Improvements
• Improve passenger loading areas at McCarran International Airport
• Koval/Swenson Express Airport Connector Elevated Couplet
Surface/Local Roadway Improvements
• Giles-Reno-Koval improvements• Koval Ln widening• Paradise/Swenson one-way couplet extension• Harmon Avenue Complete Street• Howard Hughes Parkway extension (Tropicana-
Flamingo connector)• Convention Center Dr/Riviera Blvd Complete Street
(prioritize pedestrians)• Convention Center Dr/Riviera Blvd Complete Street
(prioritize transit/taxis)
PROJECT SUITE TWO (ESTIMATED COSTS: $733M - $1.0B)
Improve pedestrian safety and mobility along Las Vegas Boulevard
• Elevated sidewalks between Caesars Palace and Bellagio, Bellagio and CityCenter, the Flamingo and Venetian, the Plaza (McDonald’s) and Harmon Ave, and in front of Treasure Island and Caesars Palace
• Widen sidewalks to 18 feet, where feasible• Resort Corridor way-finding system
• Iconic circular pedestrian bridge at Las Vegas Blvd/Sahara Ave
• Pedestrian bridges at Las Vegas Blvd/Riviera Blvd, Las Vegas Blvd/Resorts World Dr, LINQ/Las Vegas Blvd, Flamingo/Las Vegas Blvd, Las Vegas Blvd/Bellagio Dr/Paris Dr, and Hard Rock Café/MGM Dr/Las Vegas Blvd
Pedestrian Improvements
*Estimated cost range is adjusted for inflation and includes light rail planning and design. It does not include the construction, operation and maintenance of light rail. While the TIBP recommendations are being considered for further development, the RTC, NDOT and local governments will continue optimizing and enhancing the existing transportation system and infrastructure to maximize their effectiveness in connecting Las Vegas, its residents, and visitors.
10
D R A F T E X E C U T I V E S U M M A R Y • T R A N S P O R T A T I O N I N V E S T M E N T B U S I N E S S P L A N
High-Capacity Transit Improvements
• High-capacity transit on: Maryland Pkwy, Charleston Blvd, North 5th St, Valley View Blvd/US 95, South Las Vegas Blvd, I-215/CC-215
4 PROJECT SUITE FOUR (ESTIMATED COSTS: $1.83B – $4.83B)
Improve connectivity between the Core Area and workforce population centers
5
6
7
PROJECT SUITE FIVE (ESTIMATED COSTS: $601M - $727M)
Improve Core Area access from I-15
PROJECT SUITE SIX (ESTIMATED COSTS: $491M – $762M)
Improve Downtown circulation and access
PROJECT SUITE SEVEN
Support transportation infrastructure coordination and implementation
Freeway Improvements
• I-15 direct access HOV drop ramp to Meade Ave• I-15 direct access HOV drop ramp to Harmon Ave• I-15 direct access HOV drop ramp to Hacienda Ave• I-215 HOV direct airport connection• I-15/Tropicana Ave interchange
Pedestrian Improvements
• Downtown Las Vegas pedestrian bridges
High-Capacity Transit Improvements
• Downtown Circulator Trolley
Surface/Local Roadway Improvements
• Valley View-Harmon connection• MLK Boulevard extension south to Meade Ave• Meade Ave connection to Resorts World Dr
Surface/Local Roadway Improvements
• Intersection improvements at Las Vegas Blvd/Main/St. Louis/Paradise
• MLK Blvd extension to Oakey Blvd• Grand Central Pkwy-Industrial Rd connector
Freeway Improvements
• I-515/City Pkwy interchange• I-515/Maryland Pkwy interchange• I-15/NEON Gateway direct access HOV drop ramp
Public Policy Actions
• Transportation navigation program• Resort Corridor Mobility Association• Connectivity within superblocks• Parking management• Meeting peak demand for private transportation
• Regional park-and-ride facilities• Flamingo Rd transit improvements
11
D R A F T E X E C U T I V E S U M M A R Y • T R A N S P O R T A T I O N I N V E S T M E N T B U S I N E S S P L A N
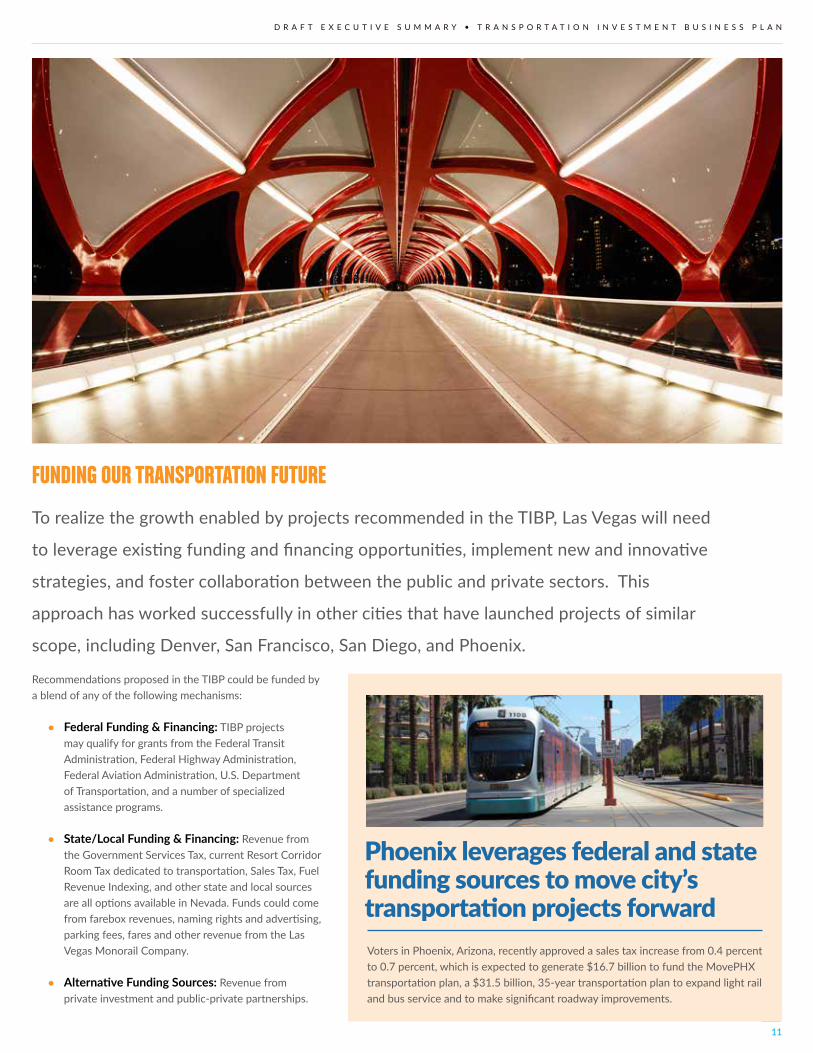
FUNDING OUR TRANSPORTATION FUTURE
To realize the growth enabled by projects recommended in the TIBP, Las Vegas will need
to leverage existing funding and financing opportunities, implement new and innovative
strategies, and foster collaboration between the public and private sectors. This
approach has worked successfully in other cities that have launched projects of similar
scope, including Denver, San Francisco, San Diego, and Phoenix.
Recommendations proposed in the TIBP could be funded by a blend of any of the following mechanisms:
Phoenix leverages federal and state funding sources to move city’s transportation projects forward
• Federal Funding & Financing: TIBP projects may qualify for grants from the Federal Transit Administration, Federal Highway Administration, Federal Aviation Administration, U.S. Department of Transportation, and a number of specialized assistance programs.
• State/Local Funding & Financing: Revenue from the Government Services Tax, current Resort Corridor Room Tax dedicated to transportation, Sales Tax, Fuel Revenue Indexing, and other state and local sources are all options available in Nevada. Funds could come from farebox revenues, naming rights and advertising, parking fees, fares and other revenue from the Las Vegas Monorail Company.
• Alternative Funding Sources: Revenue from private investment and public-private partnerships.
Voters in Phoenix, Arizona, recently approved a sales tax increase from 0.4 percent to 0.7 percent, which is expected to generate $16.7 billion to fund the MovePHX transportation plan, a $31.5 billion, 35-year transportation plan to expand light rail and bus service and to make significant roadway improvements.

12
D R A F T E X E C U T I V E S U M M A R Y • T R A N S P O R T A T I O N I N V E S T M E N T B U S I N E S S P L A N
RETURN ON INVESTMENTThe infrastructure improvements recommended by the TIBP carry a potential cost of between $7B and $12B* at completion, adjusted for inflation. These include planning, development, and construction of all capital projects and operation and maintenance of the entire system through 2046. When including traditional debt financing to fund a portion of the projects, inflation-adjusted costs are between $8.5B and $14.3B.
While the projected cost of the TIBP is not inconsiderable, it pales relative to the size of Southern Nevada’s $95.2 billion economy. Assuming no growth during the next 30 years, cumulative economic output for the region will be approximately $2.9 trillion. Thus, at the high end, the recommended project costs equate to 0.5 percent of total economic output during the 30-year period of the TIBP.
Put another way, Southern Nevada currently attracts 41.1 million visitors annually, each of whom spends approximately $724 per trip. Assuming no increase in visitation and no increase in visitor spending, 1.2 billion visitor trips over the next 30 years will generate approximately $900 billion in spending. Alternatively, if visitor trips decline by 1.6 percent because visitors are deterred by an inability to move easily within the Resort Corridor, the economic loss would essentially equal the $14.3 billion high cost plan estimate.
In other words, the negative economic impact of just a small decline in visitors frustrated by a clogged, inefficient transportation network more than justifies even the highest potential cost of the entire project.
A return-on-investment analysis was conducted as part of the TIBP process and broadly captured both the economic and societal considerations of transportation-related investments, using best practices established by the Transportation Research Board. The economic benefits of implementing this comprehensive program are clear and compelling.
• Southern Nevada could conservatively anticipate an average return of between 2:1 and 4:1, resulting in a combined economic impact of between $56 billion and $178 billion during the 30 years required to implement the entire program of recommended improvements.
• If TIBP-recommended projects reduced the annual rate of congestion growth from a baseline of 3% annually to zero – in other words, completely halt an increase in congestion – the positive economic impact would be $66 billion during the plan’s 30-year implementation.
• Congestion costs in the region today exceed national averages, with traffic delays costing the typical Las Vegas commuter $984 and 46 hours in lost time a year. In 2015 dollars, project costs range from $3.75 billion to $6.3 billion: if TIBP projects significantly succeed in eliminating regional congestion, the projects would all but pay for themselves.
If TIBP projects significantly succeed in eliminating regional congestion, the projects would all but pay for themselves.
At the high end, the recommended project costs equate to 0.5 percent of total economic output during the 30-year period of the TIBP.
The TIBP recommendations will
create jobs and generate significant economic
activity:
$56b- $178b
122,000
$46.1b
Projected cumulative economic impact
Jobs
Projected economic output
*Estimated costs include only planning costs for light rail; development and construction costs for this project are not included.
13
D R A F T E X E C U T I V E S U M M A R Y • T R A N S P O R T A T I O N I N V E S T M E N T B U S I N E S S P L A N
If TIBP projects significantly succeed in eliminating regional congestion, the projects would all but pay for themselves.
$56b- $178b
122,000
$46.1b
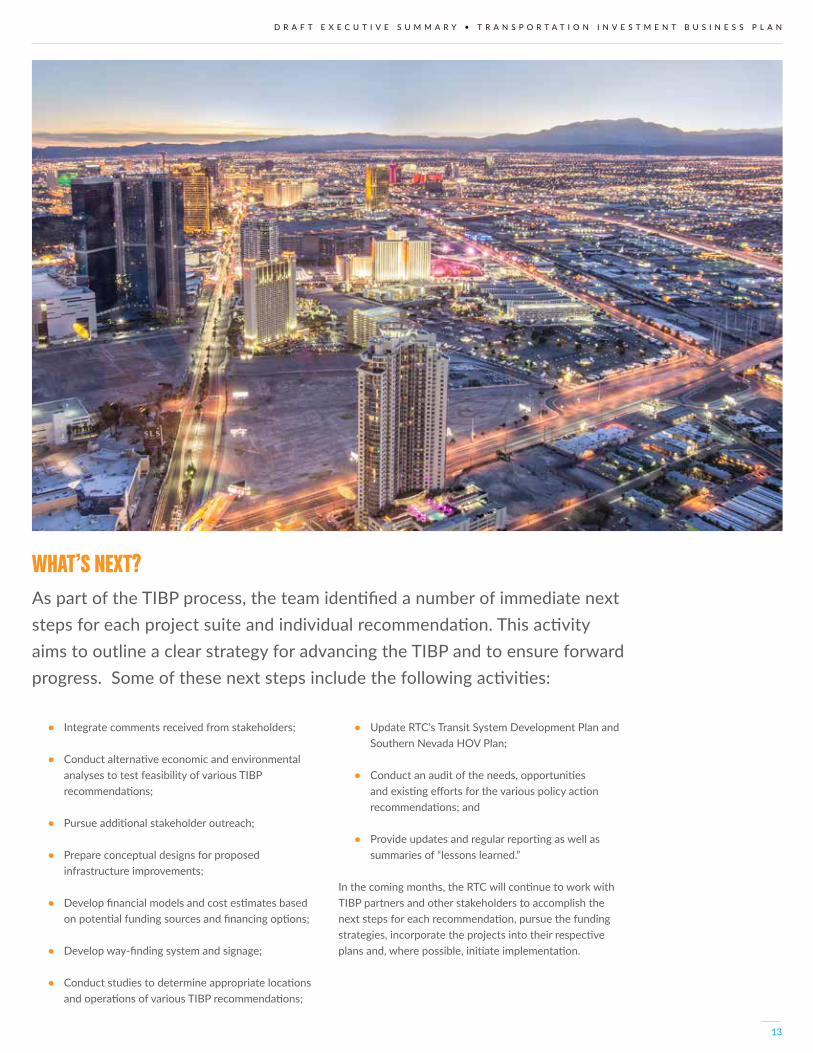
WHAT’S NEXT?As part of the TIBP process, the team identified a number of immediate next steps for each project suite and individual recommendation. This activity aims to outline a clear strategy for advancing the TIBP and to ensure forward progress. Some of these next steps include the following activities:
• Integrate comments received from stakeholders;
• Conduct alternative economic and environmental analyses to test feasibility of various TIBP recommendations;
• Pursue additional stakeholder outreach;
• Prepare conceptual designs for proposed infrastructure improvements;
• Develop financial models and cost estimates based on potential funding sources and financing options;
• Develop way-finding system and signage;
• Conduct studies to determine appropriate locations and operations of various TIBP recommendations;
• Update RTC’s Transit System Development Plan and Southern Nevada HOV Plan;
• Conduct an audit of the needs, opportunities and existing efforts for the various policy action recommendations; and
• Provide updates and regular reporting as well as summaries of “lessons learned.”
In the coming months, the RTC will continue to work with TIBP partners and other stakeholders to accomplish the next steps for each recommendation, pursue the funding strategies, incorporate the projects into their respective plans and, where possible, initiate implementation.

L A S
N E V A D A
View the Draft Transportation Investment Business Plan: RTCSNV.COM/GOVEGAS