a blue revolution in sub-saharan africa?
TRANSCRIPT

A blue revolution in sub-Saharan Africa?
Evidence from Ghana’s tilapia value chain
Catherine Ragasa, Kwaw S. Andam, Doreen Kufoalor, and Sena Amewu
STRATEGY SUPPORT PROGRAM | WORKING PAPER 49 | JUNE 2018

ii
TABLE OF CONTENTS
1. Introduction ....................................................................................................................................................1 2. Data and Methodology ..................................................................................................................................3
2.1. Value chain analysis ............................................................................................................................3 2.2. Data sources and key indicators ..........................................................................................................4
3. Findings .........................................................................................................................................................7 3.1 Tilapia value chain in Ghana .................................................................................................................7 3.2. Profitability of tilapia farming in Ghana ............................................................................................. 11
4. Learning from Other Countries ................................................................................................................... 16 4.1. Government’s commitment for aquaculture ...................................................................................... 17 4.2. Government’s critical role in enabling policies and infrastructure ..................................................... 18 4.3. Lowering feed cost, diversifying feed ingredients, and improving feed quality ................................. 19 4.4. Environmental sustainability at the forefront ..................................................................................... 19 4.5. Accessibility and affordability ............................................................................................................ 20
5. Discussion and Conclusion ........................................................................................................................ 21
LIST OF TABLES Table 2.1: Sources of primary data ....................................................................................................................5 Table 3.1. Number of tilapia producers using cage and pond culture in Ghana, 2009 to 2015 .........................9 Table 3.2. Tilapia market outlet types in Ghana .............................................................................................. 10 Table 3.3. Cost and profits of tilapia cage culture in Lake Volta, Ghana, 2016 .............................................. 12 Table 3.4. Comparison of farmed tilapia production costs, prices, and profit comparisons between Ghana
and selected countries ................................................................................................................................ 13 Table 4.1. Comparison of aquaculture systems and policies in various countries .......................................... 16 Table 4.2. Comparing costs of calorie and protein content from tilapia, chicken meat, and eggs .................. 20
LIST OF FIGURES Figure 1.1. Annual growth rate in aquaculture and tilapia production, for main global regions and selected
African countries, 2006 to 2015 .....................................................................................................................2 Figure 1.2. Production in Ghana from marine capture, inland capture, and aquaculture, 2000 to 2015 ...........3 Figure 2.1. Map showing locations visited and people interviewed for study of tilapia aquaculture in Ghana ..4 Figure 3.1. Aquaculture value chain map for Ghana ..........................................................................................7 Figure 3.2. Cost components of tilapia production in Ghana, by tilapia farm size, percent of total costs ....... 11 Figure 3.3. Cost components and cumulative cost in Ghana to produce one kg of farm-raised tilapia, by farm
size category and quality of production season ......................................................................................... 14

iii
ABSTRACT Global growth in aquaculture is underway – a “blue revolution” featuring rapid increases in demand for fish and a corresponding surge in aquaculture production. This paper describes the fast-growing tilapia value chain in Ghana to demonstrate the features of a nascent blue revolution in sub-Saharan Africa (SSA) and to illustrate its potential for job creation and reducing poverty and food insecurity there. Tilapia production has been growing at 15 percent annually in SSA, but imports are also surging to satisfy the growing appetite for tilapia. This paper illustrates how aquaculture can grow sustainably in SSA within the context of growing demand and global competition. A value chain analysis is conducted using secondary data analysis, desk reviews of experiences and lessons from other countries, interviews with 95 actors in the tilapia value chain in Ghana, and detailed production and profitability data from Ghanaian tilapia farmers.
A profitable farmed tilapia industry has been established in Ghana with the potential to expand supply to satisfy local demand and to export to neighboring countries. Productivity in the industry has grown mainly through reducing the mortality rates of fingerlings and improvements in the supply of locally-produced high-quality fish feed. Feed costs remain high. However, there is potential to reduce those costs by improving the productivity of crops that are used in fish feed, particularly maize and soybean. Reducing local feed costs will have positive spillover effects on both other pond-based aquaculture systems and on the livestock feed sector. Moreover, Ghana can expand it fish feed production to be an important source of feed within SSA.
The industry can further increase aquaculture productivity through the adoption of faster-growing fish strains and better management practices. Ghana’s aquaculture sector could grow even faster by adopting lessons from other countries, including on infrastructure provision, fiscal incentives for the production of fish feed ingredients, and sustainable fish farming practices, particularly through paying close attention to water and feed quality and addressing food safety concerns within the sector.
Keywords: aquaculture, value chain, competitiveness, profitability, Ghana, sub-Saharan Africa

1
1. INTRODUCTION
A dramatic increase in fish demand is occurring globally in tandem with increasing urbanization and changes in the dietary preferences of consumer. Aquaculture is the fastest growing food production sector, contributing to rural livelihoods, relieving pressures on wild fishery resources, and accelerating the development of upstream and downstream sectors (FAO 2016). Several studies have credited the expansion of aquaculture with more balanced diets and better nutrition (Golden et al. 2017; Toufique and Belton 2014; Troell et al. 2014). Moreover, certain types of aquaculture industries have improved the livelihoods of economically disadvantaged people via their development benefits (Dey et al. 2013; Little et al. 2016; Golden et al. 2017; Rashid, Minot and Lemma 2016).
The expansion of the aquaculture sector is often referred to as the “blue revolution”, because it is characterized by the dramatic increases in supply and demand that were similarly experienced in the agronomic “green revolution” and the more recent livestock revolution.1 The blue revolution has led to the expansion of aquaculture-related services and markets, including feed sector development and research on fish breeding technologies to improve growth rates, resistance to disease, tolerance of cold and poor water, and improved fertility.2 The rise in fish consumption has been boosted by growth in modern retail channels, such as supermarkets – in many countries 70 to 80 percent of retail purchases of fish takes place in modern food retail outlets (FAO 2016).
This paper contributes to the growing body of research on aquaculture value chains in the developing world by focusing on prospects for a blue revolution in sub-Saharan Africa (SSA). We document the fast-growing aquaculture sector in Ghana, assess its economic impact to date, identify potential options for supporting the expansion of the sector, and synthesize lessons learned in other countries that have successfully developed their aquaculture sectors. With urbanization, rapid population growth, and expansion of the middle-class in SSA over coming decades, increases in demand for fish can be expected. Extending the blue revolution to SSA would be one way to reduce poverty and food insecurity among farmers. Recognizing this, development agencies are investing in aquaculture (Kaminiski et al. 2018). SSA has relatively high fish consumption at 20 kg/capita/year, compared to 15 kg/capita/year globally (FAO 2016). 3 This paper focuses on tilapia, which is the main fish farmed in Ghana and SSA. Tilapia has a high demand in the global market, is the fastest growing aquaculture subsector globally, and, alongside carp, catfish and salmon, is one of the fish most commonly produced under aquaculture (World Bank 2013b; FAO 2016; Fitzsimmons 2016).
Although SSA was historically the center of origin for tilapia, El-Sayed (2013) points to challenges for growing aquaculture in Africa, such as feed quality and availability, storage, and transport. Addressing these challenges require policy actions informed by an understanding of the value chain, the role of regulation and research, farmers’ and traders’ experiences, and analyses of farm profitability. Nevertheless, the share from Africa (including Egypt) of global production of farmed tilapia is second only to Asia, and has been increasing in recent years. While aquaculture production in general globally grew at 6 percent per year over the last decade, in Africa aquaculture grew at 10 percent annually (Figure 1.1, left panel). Tilapia production in the last decade grew at 15 percent annually in SSA, compared to 10 percent globally
1 For more on the green revolution, see Evenson and Gollin (2003) and Pingali (2012). The livestock revolution (mainly around chicken, pork, and beef) has been documented by Delgado et al. (1999). The term blue revolution has been used more recently by Hishamunda et al. (2009), Ponte et al. (2014) and Rashid, Minot, and Lemma (2016). 2 Breeding programs in tilapia, carp and prawns In Asia have resulted in genetic gains or improved productivity ranging from 8 to 12 percent per generation (Nguyen 2016). Th Genetically Improved Farmed Tilapia (GIFT) breeding program strain gives 18 percent higher body weight at harvest in China to 58 percent higher in Bangladesh (Dey et al. 2000). Recent studies on other species show genetic gains from +39 percent for black tiger shrimp in Australia (Norman-Lopez et al. 2015) and + 65% for turbot to + 900% for trout in harvest weight in Europe (Janssen et al. 2017). 3 This estimate excludes China, where the annual per capita consumption is 38 kg, and an outlier in the global average.

2
(Figure 1.1, right panel). Important countries for aquaculture and tilapia production in Africa, including Ghana, Kenya, Uganda, Nigeria and Zambia, experienced particularly rapid growth between 2006 and 2015. Africa contributed 19 percent of world’s tilapia production in 2015.
Figure 1.1. Annual growth rate in aquaculture and tilapia production, for main global regions and selected African countries, 2006 to 2015
Source: FAO 2017 (FAO FishStatJ database, accessed February 5, 2018)
Some countries in SSA, such as Uganda and Namibia, have started exporting tilapia. But, for others, demand growth is met by increased reliance on imports. In 2015, 110,000 metric tons (mt) of tilapia were imported by SSA, which is a fourth of total production in SSA. We examine the potential for countries in SSA, such as Ghana, to develop a viable local tilapia value chain in order to reduce reliance on imports and to accelerate poverty reduction and food and nutrition security.
Ghana, already a leading aquaculture producer and the fastest growing in SSA, provides a useful case study for this assessment. FAO (2017) estimates that in 2015 Ghana was the 13th largest producer of tilapia in the world and the second largest in SSA after Uganda. As a lower middle-income country with a growing middle-income population, the market for high-value products, including tilapia, is expanding. Fish consumption stands at around 28 kg/capita/day in Ghana, one of the highest consumption levels both in SSA and globally. Fish accounts for 60 percent of the national dietary intake of animal protein in Ghana (Rurangwa et al. 2015), about four times higher than the global average (Hishamunda et al. 2009).
On the production side, the presence in Ghana of one of the largest man-made lakes in the world, Lake Volta, provides an almost-ideal resource for cage aquaculture, comparable only to Lake Victoria in East Africa. Production from capture fisheries in Ghana, both marine and inland, is declining or stagnant (Figure 1.2). Satisfying the demand of Ghanaian consumers for fish can be done through aquaculture. Tilapia cage culture in Lake Volta grew 25-fold over the last decade from 1,500 mt in 2006 to 45,000 mt in 2015, according to official data from the Ministry of Fisheries and Aquaculture Development (MoFAD), although industry experts estimate it to be closer to 35,000 mt.
0
10
20
30
40
Annu
al g
row
th ra
te (%
)
Aquaculture
-10
0
10
20
30
40
Annu
al g
row
th ra
te (%
)
Tilapia

3
Figure 1.2. Production in Ghana from marine capture, inland capture, and aquaculture, 2000 to 2015
Source: Documents from Ghana Fisheries Commission.
For the analysis in this paper, both primary and secondary data are used. The analysis starts by examining actors in different stages of the value chain. Data were then collected and analyzed for different types and scales of fish farms, which typically has not been done in past research on tilapia aquaculture. Third, data on the profitability of the fish farms were collected and analyzed to identify the risk and uncertainties that the industry is facing. Two estimates showing low-yielding and high-yielding seasons for fish farming, respectively, are generated to better understand how profits are affected by external shocks. Last, we extensively review the literature on aquaculture from other countries to draw lessons on how their aquaculture value chains developed in order to propose strategies and policies for Ghana to adopt.
The rest of the paper is structured as follows. Section 2 describes the data sources and study methodology, Section 3 characterizes the tilapia value chain in Ghana and analyzes its profitability and competitiveness, and Section 4 presents key lessons from other countries. Section 5 discusses the policy implications of the findings from this research.
2. DATA AND METHODOLOGY
2.1. Value chain analysis
This study adopts a value chain approach to systematically examine the constraints and opportunities of developing the tilapia sector in Ghana from production to marketing. A value chain is a full range of activities required to bring final products or services from conception to delivery to consumers (El-Sayed et al. 2014; Hellin and Meijer 2006; Kaplinsky and Morris 2000). Value chains can be analyzed in terms of product flows, information flows, and management and control in the different stages of the chain (Taylor 2005). Value chain analysis enables researchers to identify the main actors in the sector, to analyze levels of productivity and profitability, to identify the strengths and weaknesses of the sector, and to evaluate policy options for improving sector performance.
Existing studies of aquaculture in Ghana include technical reports (Asmah 2008; Asmah et al. 2016), value chain studies similar to the one undertaken here (Asiedu et al. 2015; Rurangwa et al. 2015), and a recent evaluation of the impact on household welfare of different types of aquaculture production practiced at different scales (Kassam and Dorward 2017). Rurangwa et al. (2015) relied mostly on secondary data and field data from two large farms in their value chain study. Asmah (2008) provides a detailed financial analysis of tilapia pond culture. Ofori et al. (2009) provide a financial analysis of pilot tilapia cage culture in 2009. However, at that time mortality rates were as high as 80 percent. Since then, hatchery and farming practices have substantially improved. Karikari and Asmah (2016) interviewed 23 tilapia cage
0
100,000
200,000
300,000
400,000
2006 2007 2008 2009 2010 2011 2012 2013 2014 2015
Prod
uctio
n (m
t)
MarineCapture inlandAquaculture

4
farmers to develop insights on their operations and the constraints that they face, but did not examine their profitability and competitiveness.
This paper extends the scope of these previous studies by interviewing a broader range of actors, both in terms of the scale of production and the segments of the value chain in which the actors are involved. It also introduces an analysis of profitability, which has been missing from previous studies, and it includes lessons on tilapia value-chain development drawn from other countries. The farmed tilapia sub-sector in Ghana has faced a significant challenge since 2015 with an outbreak of Streptococcus bacteria in tilapia in Lake Volta. Therefore, this paper provides a timely assessment of the likely impacts of this disease shock.
2.2. Data sources and key indicators
This paper utilizes analysis of primary data collected through interviews, secondary data analysis, and desk review of related literature. The secondary data analyzed includes production data from the Food and Agriculture Organization of the United Nations (FAO) database. Documentation on how other countries developed their aquaculture sectors was examined to synthesize lessons and provide options for Ghana to consider. For the primary data collection, the research team conducted interviews with key actors in the highest tilapia-producing districts of the Eastern and Volta regions of Ghana between June and November 2017. Figure 2.1 maps the locations of the field visits where the value chain actors were interviewed.
Figure 2.1. Map showing locations visited and people interviewed for study of tilapia aquaculture in Ghana
Source: Remote Sensing and Geographic Information Systems Laboratory, University of Ghana. Retrieved 01/05/2017 from http://www.rsgislab.ug.edu.gh/content/data-sharing-app.
Volta Region 1 large-scale farm 2 medium-scale farms 3 small-scale farms 3 micro-scale farms
Eastern Region Fisheries Commission Aquaculture Research Development Centre S-Hoint hatcheries and farms Aller Aqua fish feed West Africa Fish outlet Maleka farms fish outlet Lees’ farm outlet 4 large-scale farms 2 medium-scale farms 7 small-scale farms 3 micro-scale farms
Greater-Accra Region Fisheries Commission Water Research Institute Raanan Fish Feed West Africa Coppens Fish Feed Open markets (Nima, Spintex, Agbogbloshie) Madina wholesale outlet Kaneshie fresh fish market Tema -Lake Volta fresh tilapia Nungua-Venee’s cold store Kasoa -Galilea Market West Africa Fish outlet Max Mart Shoprite (Acrra Mall) Game (Accra Mall)

5
Table 2.1: Sources of primary data Persons interviewed Number interviewed Region Type of interview
First round of interviews conducted from 13 to 20 June 2017 Farmers 4 micro-scale Volta Structured group interviews, with
follow-up phone interviews 1 small-scale Volta In-depth interview 2 medium-scale Volta In-depth interview 1 large-scale Volta Short visit, with phone interview
Feed producers and importers 3 representatives Eastern In-depth interview Hatchery 2 representatives Eastern In-depth interview Industry association 1 representative Eastern In-depth interview Aquaculture Research and Development Centre (ARDEC)
6 representatives Eastern In-depth interview
Ministry of Fisheries and Aquaculture Development; Fisheries Commission
2 representatives Greater Accra Key informant interview
Second round of interviews from 17 October to 15 November 2017 Farmers 2 micro-scale,
2 small-scale Volta Structured group interview, with
follow-up phone interviews 7 small-scale Eastern Self-administered questionnaire,
with follow-up phone interviews 2 medium-scale Eastern Self-administered questionnaire,
with follow-up phone interviews 4 large-scale Eastern Self-administered questionnaire,
with follow-up phone interviews Various actors along value chain 3 farmers, 2 hatchery managers,
2 vaccine suppliers, 3 ministry representatives, 4 representatives of regulatory agencies, 2 Ghana Aquaculture Association executives, 3 researchers, 2 donor representatives
Eastern and Greater Accra
Key informant interviews
Farm-gate sales points, cold stores, outlets and open markets
17 value chain actors Eastern and Greater Accra
Semi-structured interviews
Source: Authors
Table 2.1 provides details on the different types of interviews conducted. We conducted in-depth individual interviews with eight purposively-selected tilapia farmers during the first field visit between 13 and 20 June 2017. These farmers were selected to represent different sizes and types of farms. These interviews were complemented with a combination of structured group interviews (4 farmers) and self-administered questionnaires(13 farmers).4 In all cases, follow-up phone interviews were conducted. The total sample of 25 tilapia farmers was made up of 6 micro-scale (production of less than 10 mt/year; roughly 1 to 3 cages); 10 small-scale farmers (10 to 49 mt/year; 4 to 15 cages); four medium-scale farmers (50 to 100 mt/year; 16 to 40 cages); and five large-scale farmers (production of more than 100 mt/year; more than 40 cages).5
The key indicators measured included production costs per cage and per kilogram, feed conversion ratio, input prices, tilapia (output) prices, and the profit margin. Production costs included those for feed, fingerlings, fuel of boats used for feeding and monitoring, hired labor, salt, medicine, vaccines, yearly depreciation and repairs of cages, electricity, and transportation. The costs of family labor were not included in the production costs – this is usually between 6 and 7 person-months annually for micro and
4 Administered during a seminar organized by Raanan Feeds and the Ministry of Fisheries and Aquaculture Development (MoFAD) on 19 October 2017 at Akosombo. 5 These categories of fish farmers are consistent with those used by the Volta River Authority (2017).

6
small-scale farms. Investors and managers’ salaries also were not included – these cost components are more relevant for medium and large-scale farmers.
In the production cost calculations, the figures on production, costs, and profits are averaged out to give an estimate of a typical, average farm in each size category. Production costs and harvest information were collected for the period 2015 to 2017. Two scenarios are presented based on the differing production under a low-yielding cycle or season, which are those in which disease and extreme weather events adversely affect the farmed fish, and under a high-yielding cycle or season, which represents more normal production conditions.
In drawing lessons from other countries, comparing costs, prices, and profits was challenging given the various definitions and measurements used. We tried to harmonize the various measurements, triangulating them from various sources. Another challenge with cross-country comparisons is the varying time periods and the implications these have on foreign exchange rates. We paid close attention to the relevant exchange rate during the period studies were conducted in other countries. We mainly used more comparable indicators, such as ratios of prices, costs per kg or mt of tilapia produced, and feed conversion ratios (kg feed used/kg fish produced). Another challenge is the difference in aquaculture systems (cage versus pond). While not perfect, we are confident that the country case studies were examined in as comparable a manner as possible.
Profits or gross margins were calculated as total value of harvest less the total costs of production per cage per cycle. One cycle usually is 6 to 7 months. Total harvest per cage per cycle was self-reported by the farmer. We requested figures for the period from 2015 to 2017, asking the farmer to differentiate between low-yielding and high-yielding cycles. Therefore, we have two estimates for each size category, which we call good and bad seasons.
There are different prices for different sizes of tilapia. The farm-gate prices used in the profit calculation is the weighted average price based on the sizes of tilapia produced by the farmer. In general, the overall price received by medium and large firms are significantly higher than those received by micro and small-scale fish farmers, because they typically produce larger tilapia, which command higher prices. Wholesale markets or cold chains are the main outlets for the tilapia harvested. Prices in these markets are averaged out and are referred to as wholesale prices for tilapia. They range from GH₵ 11 to 13 for Regular (200 to 300 g) and Size 1 (300 to 450 g) tilapia, which are most common. Prices at cold stores and roadside outlets in Volta and Accra range from GH₵ 15 to 25 for Regular and Size 1 tilapia, and we refer to these as retail prices, as these are the prices final consuming households would pay for tilapia. Prices can vary widely in supermarkets, and can go as high as GH₵ 40 per kg.
Tilapia sales outlets were identified based on information from tilapia traders, internet searches, and snowball sampling. At these outlets, we collected information on consumer preferences, sales and price trends, and details on tilapia processing. To obtain market data, we visited major sales outlets of tilapia as well as a random selection of shops, supermarkets, and open markets representing various types of markets. In total, four major farmgate sale outlets in the Volta region and 13 major cold stores and sales outlets in Accra were visited (Table 2.1). Our selection of market outlets in Accra provides a balanced representation of prices and market conditions for tilapia in the city.
Thirty-five other key actors along the value chain were interviewed. These included traders, feed millers and importers, hatchery managers, aquaculture researchers, fish breeders, vaccine and other service providers, government agencies, and donors (Table 2.1).

7
3. FINDINGS
3.1 Tilapia value chain in Ghana
In Ghana, the tilapia value chain from inputs to final product is relatively short and simple (Figure 3.1). In this regard, it is similar to those in Egypt (Macfadyen et al. 2012) and Zambia (Kaminksi et al. 2017). The value chain starts with fish hatcheries, feed producers, and other suppliers that sell cage construction materials (nets, poles, and barrels) to farmers. Tilapia farmers in Ghana primarily rear the fish in cages on Lake Volta, but also in concrete ponds. Cage culture is closely governed by regulatory bodies.
Figure 3.1. Aquaculture value chain map for Ghana
Source: Authors’ illustration based on field findings. Note: Broken arrows represent regulatory oversight. Solid arrows represent sale or supply of production inputs (fingerlings, feed, other inputs) or final product (fresh or frozen fish)
Breeding technology
Tilapia farming starts with and depends crucially upon the availability of quality fingerlings. Most farmers in Ghana purchase fingerlings from hatcheries, both public and private. All the large-scale commercial farms produce fingerlings for their own farms and some medium scale and small-scale farmers have also integrated brood-stock production. The Fisheries Commission estimates that there are 47 private hatcheries and three public hatcheries in current operation. Kassam (2014) asserts that the growth in aquaculture production in Ghana has been largely due to the availability of quality fingerlings.
The main breed for farmed tilapia in Ghana is the local Akosombo strain, first developed in the early 2000s and now in its eleventh generation. Akosombo is the only breed officially permitted by local regulatory bodies. Improved strains and conditioning and management of hatcheries in recent years have led to higher productivity and profitability of tilapia farming. Productivity improvements with the current improved Akosombo strain are still possible if issues in the system of producing fingerlings and the extension services are addressed (Ansah, Frimpong, and Hallerman 2014; Frimpong and Anane-Taabeah 2014). Nonetheless, many value chain actors interviewed indicated that Akosombo is reaching its limits in terms of performance and stress resistance.

8
The main alternative to Akosombo is the newer generation of Genetically Improved Farmed Tilapia (GIFT) strain. This is a fast-growing strain developed in 1988 from wild strains in Africa, including strains from Ghana, Egypt and Kenya, continuously developed in various countries under the coordination of WorldFish, a member of the CGIAR consortium of international agricultural research centers. The GIFT strain is currently in use in several countries in Asia and Latin America (Ponzoni et al. 2011). Under the Tilapia Volta Project (TIVO) coordinated by FAO in Ghana between 2009 and 2013, GIFT tilapia were imported to Ghana under special state protocol for a comparative study with local strains at the CSIR-Water Research Institute’s Aquaculture Research and Development Centre (ARDEC). Many farmers interviewed believe that switching to GIFT strain would cut the time to maturity by between 4 to 5 months. Farmers also view the GIFT tilapia as being less susceptible to disease, such as to the bacterial infection that recently began affecting farmed tilapia in Lake Volta.
Earlier impact studies on GIFT tilapia show an 18 to 58 percent higher bodyweight at harvest compared to unimproved strains (Dey et al. 2000). Newer generations of GIFT show additional improvements in productivity. Globally, GIFT is the best documented strain of improved tilapia, with genetic gains in harvest weight ranging between 10 to 15 percent per generation over 10 generations of selection (Khaw 2015).6 However, the introduction of GIFT tilapia in Africa has been slow and greeted with some resistance. GIFT is considered by government and research institutes in many SSA countries as an exotic crossbred species that could pose a risk to the genetic resources of wild tilapia on the continent (Gupta et al. 2004; Brummet and Ponzoni 2009; Ansah, Frimpong and Hallerman 2014). In Ghana, while considerable interest in GIFT tilapia was expressed by most of industry actors interviewed, no risk assessment has been done to assess whether the commercial introduction of the fish strain in Ghana would be prudent.
Feed
While fingerlings and strain quality are important factors in tilapia productivity, feed is the key determinant of the cost-effectiveness and competitiveness of the industry. Feed represents about 80 percent of the cost of production of farmed tilapia. The local feed sector is dominated by one producer, Raanan Fish Feed West Africa.7 Imported feeds, such as Multifeed, Pira, Coppens, and AllerAqua, are 30 percent more costly than local feed (Rurangwa et. al 2015; interviews conducted for this study) and their prices are dependent on the exchange rate. Farmers prefer to use imported feed at early stages of fish production and then continue with the cheaper locally-produced feed from Raanan.
Through improving the availability and reliability of supply, the establishment of a local feed mill has had a positive impact on the growth of the aquaculture sector in Ghana (Kassam 2014). Raanan started operations in 2011 and has grown quickly, increasing its annual production to more than 30,000 mt by 2015. The feed mill has a production capacity of 3,500 mt per month, but is currently producing 2,600 mt. This is due to a drop in demand for fish feed due to the bacterial disease outbreak and farmers exiting from fish farming due to the high costs of production. Raanan feed also exported to several neighboring countries.
The high cost of raw materials is the main issue facing fish feed producers. The ingredients the require include maize, soybean, fish oil, fish meal, groundnut cake, cotton cake, premix, wheat bran, and vegetable oil. Maize makes up 20 percent of feed; soybean, 30 percent; and , depending on the feed formulation, fish meal, between 5 and 10 percent of feed. The tedious and costly process of acquiring certification for fish feed production or for importing raw materials is another challenge highlighted by feed
6 Progift Nile tilapia show a genetic gain of 11 percent per generation (Thodesen et al. 2013); GenomMar Supreme tilapia grows 35 percent faster after 17 generations of selection (GenoMar Breeding Services 2016); and GET-EXCEL strain grows faster by 38 percent compared to unimproved tilapia stocks (Tayamen 2004). 7 Other local producers include Beacon Hill and some Chinese farms that have integrated feed production with aquaculture production. However, these make up a very small portion of the fish feed market in Ghana.

9
producers and importers. High import tariffs and taxes and other fees, estimated at between 20 and 30 percent of feed costs, as well as the depreciation of the Ghanaian currency have made imported ingredients more expensive, resulting in tilapia farmers facing higher costs for fish feed.
Farming
Both cage and pond culture are practiced in Ghana to produce farmed tilapia. However, the vast majority of tilapia farmers practice cage culture and are concentrated on Lake Volta. Cage culture requires lower start-up and operational costs than pond culture.8 While many more farmers are estimated to be involved in tilapia pond culture than in cage culture, the bulk of the farmed tilapia produced in Ghana is from cage culture (Table 3.1). The Fisheries Commission estimates that there are ten large tilapia farms, all of which use cage culture, eight medium size farms (six cage and two pond), and several hundred micro and small-scale farmers. From interviews with industry actors and a listing exercise in main-producing regions,9 our estimates of the number of medium and large-scale farms correspond to the official statistics, but our estimates of the number of small-scale farmers is between 100 and 300. According to key informants, there has been a drop in the number of cage farmers, especially micro and small-scale farmers, mainly due to the Streptococcus disease outbreak, which started in 2015.
Table 3.1. Number of tilapia producers using cage and pond culture in Ghana, 2009 to 2015 2009 2010 2011 2012 * 2014 2015 2016
Number of ponds 4,106 4,288 4,560 4,749 4,872 3,915 4,132 Total surface of pond-based aquaculture, ha 607 617 680 704 711 815 833 Production of pond-based farms, mt ** 864 1,093 1,469 1,772 2,912 2,410 2,714 Number of cages 816 1,148 1,525 2,278 2,562 7,607 8,415 Total volume of cage-based farms, ‘000 m3 97 166 234 280 311 1,699 1,081 Production of cage-based farms, mt 4,912 7,581 16,245 24,249 33,075 40,150*** 47,172 Source: Fisheries Commission documents. Note: * 2013 figures are not available due to logistical challenges faced by the Fisheries Commission at the time. **Includes production from dams and dugouts. *** Industry actors informed research team that true figure is closer to 35,000, due to Streptococcus bacteria losses.
Constraints to fish farming identified by Karikari and Asmah (2016) and Hemanoo (2011), which were also mentioned by farmers interviewed, include high feed costs, poor quality fingerlings, lack of technical skills on fish farming, theft, and extreme weather events such as flood, strong wind, and drought. Moreover, the cost of District Assembly fees and permits and regulatory hurdles were highlighted by medium and large farmers.
In the past, numerous absentee investors provided funds to small-scale farmers to produce tilapia. However, due to poor monitoring and theft, most investors were not able to recover their investments, according to key informants. Tilapia cage culture is an activity best suited for relatively better-off farmers that can contribute their own resources and capital, as failures in the credit market and lack of institutional arrangements to address moral hazards and loan default have been a constant story in the development of
8 While start-up costs for cage culture include nets, poles and barrels, pond culture typically requires concrete construction. The main difference in operational costs between cage and pond culture is that pond farms usually require electricity for aeration. 9 To obtain an updated estimate of the number of tilapia farms, we listed for one month all farmers purchasing feed from Raanan Fish Feed outlets in the country, starting in December 2017. From our interviews it became clear that almost all farmers use this locally-produced feed and, therefore, would be expected to purchase the feed during high-production months, such as December. Raanan fish feed provided a list of distributers located in 36 communities in the Eastern, Volta, Greater-Accra, Western, and Brong Ahafo regions. To ensure that the lists included farmers who did not buy feed during the one month of listing, the research team requested feed distributors to include in the listing the names of regular customers. The list included 110 farmers, most of whom use cage culture.

10
tilapia farms.10 However, the sector provides employment to many rural workers. Our estimate is that 2,000 to 3,000 workers are employed on tilapia farms as divers, cage construction workers, fish monitors and feeders, and to provide security. This is in addition to thousands more who work in hatcheries, feed production, and tilapia trade and marketing.
Marketing and consumption As noted earlier, the tilapia value chain in Ghana is relatively short and simple —this is reflected in the integration of production and sales. Although salted, dried, and smoked tilapia have been traditional sources of protein in the country for decades, consumers now prefer fresh tilapia in Greater Accra, Volta and Eastern regions, where the interviews were conducted.11 Consumers purchase fresh tilapia from markets, typically for home consumption in stews and soups. In roadside restaurants, fresh tilapia is popular as a grilled fish dish served with banku, a fermented maize and cassava meal. Consumers’ preference for fresh tilapia provides locally-farmed tilapia with a natural comparative advantage over frozen imports, which originate mainly from China.12 Some larger local producers with cooling facilities also supply the domestic market with frozen tilapia. One also finds wild caught tilapia in the market, although its availability is declining.
Table 3.2. Tilapia market outlet types in Ghana
Market Description Processing/ packaging
Selling practice
Price per piece Price per kg
Farm-gate in Volta area
Most farmers, especially the micro and small-scale ones, sell their tilapia at farm-gate, picked up by aggregators.
No processing, sometimes degutting
By weight Regular & Size 1: GH₵ 9-11
Sales outlets of medium and large farmers
Medium and large farmers either have their own sales outlets, which are in major towns, or they sell at farm-gate. These are specialized outlets near farms that are fitted with refrigerating systems to keep the fish fresh for a longer period. The main customers are wholesalers and retailers.
No processing, sometimes degutting
By weight Regular & Size 1: GH₵ 10-14
Mobile vans in the Volta area
These mobile vans are fitted with refrigeration systems or ice chests. The vans are branded and are mostly operated by tilapia farms. Their main customers are retailers.
Degutting By weight Regular & Size 1: GH₵ 9-11
Small-scale traders in Volta area
These are roadside sellers who sell from ice chests – for instance, at Weija dam in Accra and Kpong dam in the Eastern Region. Sellers mainly sell fish caught from the wild, but sometimes farmed tilapia.
Degutting and descaling
By piece Regular & Size 1: GH₵ 20 for 3 pieces
Regular & Size 1: GH₵ 18-25
Cold stores and wet markets in Accra
These include specialized markets where wholesalers and retailers obtain their supplies from wholesalers who buy directly from farmers. Prominent examples are Galilea market and Kaneshie market. These markets are controlled by market queens and entry by traders is heavily regulated.
Degutting, descaling and freezing
By weight or by piece
Regular & Size 1: GH₵ 20 for 3 pieces
Regular & Size 1: GH₵ 18-25
10 For small-scale production, a large capital investment of more than GH₵ 8,000 is required for cage construction. Feed and labor requirements for the first months of operation also are high. 11 According to key informant’s interviews, however, in places like the Asante and Brong Ahafo Regions and in some Akan speaking areas of Eastern region, processed tilapia (smoked and salted) is preferred over fresh tilapia. 12 Based on the visits to market outlets , the imported tilapia is packaged and sold by Fujian Jiazhong Biotechnology Development Company Ltd. (http://www.gifoods.ne/En/ProductList.asp; http://www.gifoods.net/En/About.asp), which also exports to the EU, Mexico, USA, Dominica and Africa (e.g. Angola). The tilapia is sold in 10 kg packages containing eight very large pieces of tilapia with individual weights ranging from 1.2 to 2.3 kg.
11
Market Description Processing/ packaging
Selling practice
Price per piece Price per kg
Neighbor-hood stores
Several shops in Accra sell fish from ice chests.
Degutting, sometimes freezing and packaging
By weight Regular & Size 1: GH₵ 18-25
Super-markets in Accra
Some supermarkets, such as Max Mart, Shop and Save, and Game, offer tilapia.
Degutting, packaging, sometimes freezing
By weight Regular & Size 1: GH₵ 29 Size 3: GH₵ 40
Source: Semi-structured interviews with representatives of sales outlets, shops, and open markets
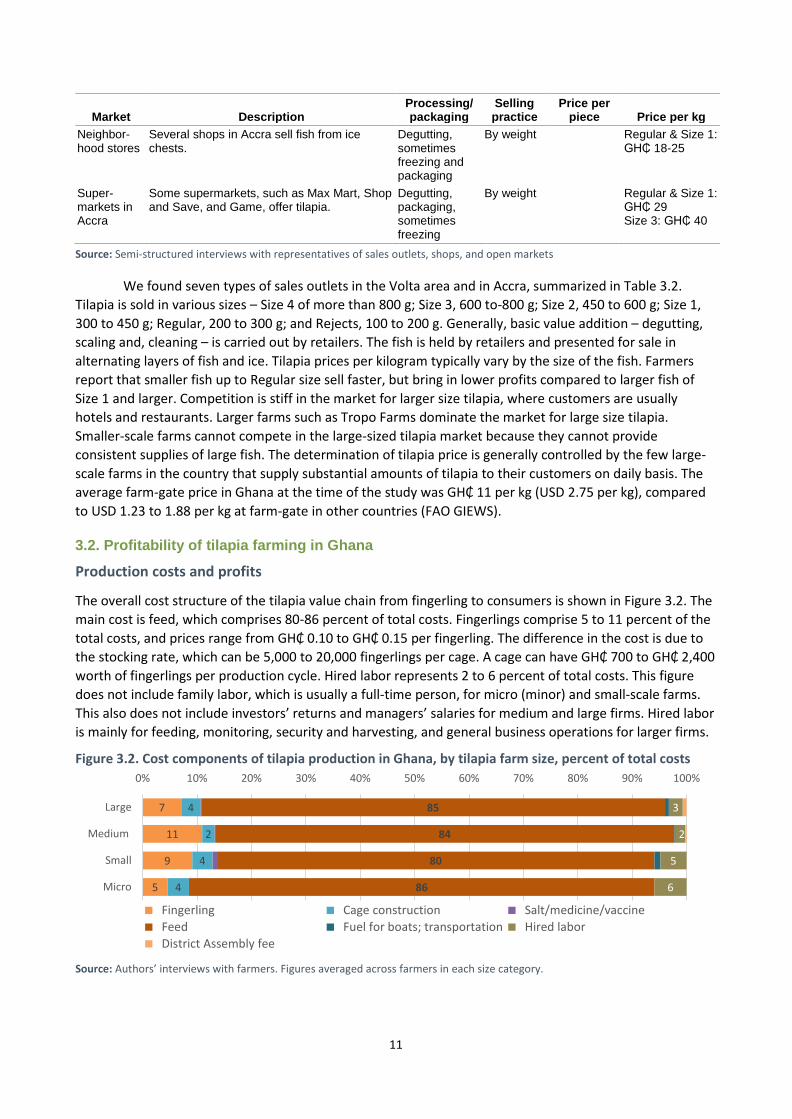
We found seven types of sales outlets in the Volta area and in Accra, summarized in Table 3.2. Tilapia is sold in various sizes – Size 4 of more than 800 g; Size 3, 600 to-800 g; Size 2, 450 to 600 g; Size 1, 300 to 450 g; Regular, 200 to 300 g; and Rejects, 100 to 200 g. Generally, basic value addition – degutting, scaling and, cleaning – is carried out by retailers. The fish is held by retailers and presented for sale in alternating layers of fish and ice. Tilapia prices per kilogram typically vary by the size of the fish. Farmers report that smaller fish up to Regular size sell faster, but bring in lower profits compared to larger fish of Size 1 and larger. Competition is stiff in the market for larger size tilapia, where customers are usually hotels and restaurants. Larger farms such as Tropo Farms dominate the market for large size tilapia. Smaller-scale farms cannot compete in the large-sized tilapia market because they cannot provide consistent supplies of large fish. The determination of tilapia price is generally controlled by the few large-scale farms in the country that supply substantial amounts of tilapia to their customers on daily basis. The average farm-gate price in Ghana at the time of the study was GH₵ 11 per kg (USD 2.75 per kg), compared to USD 1.23 to 1.88 per kg at farm-gate in other countries (FAO GIEWS).
3.2. Profitability of tilapia farming in Ghana
Production costs and profits
The overall cost structure of the tilapia value chain from fingerling to consumers is shown in Figure 3.2. The main cost is feed, which comprises 80-86 percent of total costs. Fingerlings comprise 5 to 11 percent of the total costs, and prices range from GH₵ 0.10 to GH₵ 0.15 per fingerling. The difference in the cost is due to the stocking rate, which can be 5,000 to 20,000 fingerlings per cage. A cage can have GH₵ 700 to GH₵ 2,400 worth of fingerlings per production cycle. Hired labor represents 2 to 6 percent of total costs. This figure does not include family labor, which is usually a full-time person, for micro (minor) and small-scale farms. This also does not include investors’ returns and managers’ salaries for medium and large firms. Hired labor is mainly for feeding, monitoring, security and harvesting, and general business operations for larger firms.
Figure 3.2. Cost components of tilapia production in Ghana, by tilapia farm size, percent of total costs
Source: Authors’ interviews with farmers. Figures averaged across farmers in each size category.
5
9
11
7
4
4
2
4
86
80
84
85
6
5
2
3
0% 10% 20% 30% 40% 50% 60% 70% 80% 90% 100%
Micro
Small
Medium
Large
Fingerling Cage construction Salt/medicine/vaccine Feed Fuel for boats; transportation Hired labor District Assembly fee

12
Table 3.3. Cost and profits of tilapia cage culture in Lake Volta, Ghana, 2016 Micro farm
(up to 3 cages) Small-scale farm
(4 to15 cages) Medium farm
(16 to 40 cages) Large farm
(> 40 cages) Farm sample size 6 10 4 5 Stocking rate, fingerlings/cage 10,000 to 20,000 10,000 to 14,000 10,000 to 20,000 5,000 to 10,000 Season Bad
season Good
season Bad
season Good
season Bad
season Good
season Bad
season Good
season Quantity of harvest (kg/cage) /a 4,000 4,800 2,000 3,500 2,500 4,000 1,500 2,500 Price (GH₵/kg) /b 10 10 10 10 11 11 11 11 Value of production (GH₵) 40,000 48,000 20,000 35,000 27,500 44,000 16,500 27,500 Cost (GH₵)
Fingerling /c 1,400 1,400 1,700 1,700 2,400 2,400 1,000 1,000 Cage construction /d 1,200 1,200 700 700 500 500 500 500 Salt/medicine /e 0 0 150 150 16 16 16 16 Feed /f 26,100 26,100 15,000 20,000 18,500 19,240 12,000 12,000 Fuel/transportation /g 0 0 200 200 50 50 100 100 Hired labor /h 1,800 1,800 900 900 389 389 360 360 Permit /i 0 0 0 0 50 50 100 100
Total costs, GH₵ 30,500 30,500 18,650 23,650 21,905 22,645 14,076 14,076 Computed profit margin, GH₵ /j 9,500 17,500 1,350 11,350 5,595 21,355 2,424 13,424 Computed profit margin, % of
revenue 24 36 7 32 20 49 15 49
Computed Feed Conversion Ratio (FCR)
1.5 1.3 1.3 1.1 2.0 1.3 1.3 1.0
Cost to produce 1 kg of tilapia GH₵ 7.6 6.4 9.3 6.8 8.8 5.7 9.4 5.6 USD (GH₵ 4=USD1; 2016) 1.9 1.6 2.3 1.7 2.2 1.4 2.4 1.4
Source: Authors’ interviews. Figures averaged across farmers in each size category. Note: /a Average harvest across sample farms for low- and high-yielding seasons. Harvest per cage depends on stocking rate and size. /b Weighted average based on size of tilapia produced. Larger farms produce bigger fish (sizes 2-4) that are sold at higher prices. /c Prices range from GH₵ 0.10-0.15 per fingerling. The difference in cost is the stocking rate. /d Cage construction costs are GH₵ 8,000 to 20,000 for micro and small farmers, depending on the size and number of cages. These cages usually last for 2 years (4 cycles) before most are replaced. Yearly minor repair costs are GH₵ 200 to 500. Annual cost for cage depreciation and repair is GH₵ 500 to 2,000 per cage for micro and small farmers. Medium and large firms estimate cage construction costs at GH₵ 2,000. These cages last for 4 years (8 cycles) before major repairs or replacement will be needed. Annual minor repair costs are GH₵ 250 per cage. Annual cost for cage depreciation and repair is GH₵ 500 for medium and large farms. These costs do not include major capital costs for larger farmers for land lease and constructions for roads and electricity. /e Some farms used salt in their cages for disease prevention, according to the farmers. /f All farms mostly used Raanan feeds. The main differences in total feed costs are due to stocking rate and cage size. Large farms in our sample have small cage sizes and lower stocking rates. /g Includes fuel for motorized boats used for feeding and monitoring cages. Micro farmers use manual boats, so no fuel costs. Some medium and large farmers have electricity and transportation costs, which are included here. /h Hired labor does not include family labor, which is relevant for micro and small farms. Generally labor is hired for six months annually. Hired labor does not include investors' and managers' salaries, which is relevant for medium and large farms. /i EPA, WRI, and other permits usually involve one-time fees at the start of business, so are not included here. A recurring substantial fee is for the District Assembly of between GH₵ 100 and 200 per cage per year (GH₵ 50 to 100 per cage per cycle). /j This is the “operating surplus” which is either farmer profits (for smaller farms) or management/owners’ profits (for larger farms). This can also be interpreted as returns to family labor (for smaller farms) or investments (larger farms), which can be compared to other income-generating alternatives.
The fourth cost is cage construction, in which yearly depreciation and repairs comprise 2-5 percent of total costs. The most common sizes of cages are 5, 6, 7, 10, and 12 cubic meters. Total cage construction costs are GH₵ 8,000 to GH₵ 20,000 for micro and small farmers depending on the size and number of cages that they farm. These cages usually last for two years or four production cycles. There can also be between GH₵ 200 and GH₵ 500 minor repair costs yearly. Overall, yearly cost allotted for cage construction

13
depreciation and repair is roughly GH₵ 500 to GH₵ 2,000 per cage for micro and small farmers. Medium and large firms estimate cost to construct per cage to be roughly GH₵ 2,000, which they say would last for four years before major repairs or replacement will be needed. Yearly repair is estimated to be GH₵ 250 per cage. In total, cage construction cost is roughly GH₵ 500 per cage per year for medium and large farms.
Other costs are for fuel for boats for feeding and monitoring the farms. Other farmers use electricity, cold chains, and transportation to their sales outlets. Other farmers put salt in the cages for disease prevention, and there are also some reports of the use of vaccination especially during the season of disease outbreak due to Streptococcus bacteria in 2015. Other substantial costs (reported only by medium and large farms) are the District Assembly fees, which are reported to be between GH₵ 100 and GH₵ 200 per cage per year, or GH₵ 50-100 per cage per cycle (assuming two cycles per year).
Table 3.3 presents detailed production, costs, and profits of tilapia farms, by size category and quality of the production cycle. Overall, profit margins (total harvest value less total costs) were high. Profit margins were between 7 and 24 percent in a low-yielding season, and between 32 and 39 percent in a high-yielding season. The Feed Conversion Ratio (FCR) is the amount of feed required to produce 1 kg of fish. According to Ofori et al. (2009), FCRs in tilapia cage aquaculture systems in Africa is typically between 1.4 and 2.5. The FCR computed for Ghana are on the lower bound of this range, which implies generally more efficient fish production in Ghana. The FCR during low-yield seasons was between 1.3 and 2.0 and during good-yield seasons between 1.0 and 1.3. These are slightly more efficient rates than the 1.6 to 2.0 FCRs observed in earlier studies in Ghana (Karikari and Asmah 2016).
Competitiveness
How do these production and profit figures for tilapia farming in Ghana compare to other countries? Tilapia production in Ghana is generally profitable and seemingly more profitable than tilapia farming in other countries farms during normal high-yielding cycles of production (Table 3.4). An indication of this is the growing number of foreign companies that are investing in fish farming and in both local feed manufacturing and feed imports in Ghana.
Table 3.4. Comparison of farmed tilapia production costs, prices, and profit comparisons between Ghana and selected countries
Parameters Bangladesh pond, 2012
China pond, 2012 and 2014
Egypt pond, 2010
Ghana cage, 2015-17
Status of tilapia production in Ghana
Profit margin (profit as percentage of revenue)
21-37 23-29 28-34 7-24 (low yield); 32-49 (high yield)
Similar to other countries; higher profits during normal high-yielding cycles
Price of feed (USD/kg) 0.22-0.40 0.51-0.76 0.54 0.93-1.09 More expensive feed in Ghana Price of fingerlings
(USD/1,000) na 30 8.14 25-37 Similar to China, higher than
Egypt Production cost per kg
of tilapia (USD/kg) 0.78-1.23 1.09-1.29 0.9-1.25 1.90-2.40 (low yld.);
1.40-1.70 (high yld) More costly to produce 1 kg of
tilapia in Ghana Price of tilapia (USD/kg) 1.23 1.46-1.67 1.45-1.88 2.75 More expensive tilapia (high
value commodity) Feed conversion ratio 1.5-1.7 1.5-1.6 1.5 1.3-2.0 (low yield);
1.0-1.3 (high yield) Similar to other countries; lower
(better) FCR during normal high-yielding cycles
Feed price to tilapia price
0.18-0.32 0.31-0.52 0.38 0.33-0.40 Similar range as China and Egypt; higher than Bangladesh
Fingerling price to tilapia price
an 20 5.71 9.0-13.0 Similar range as Egypt; lower than China
Source: various studies; na = not available.
The cost to produce one kilogram of tilapia in Ghana is between GH₵ 7.60 and GH₵ 9.40 during low-yielding cycles (USD 1.90 to 2.40) and between GH₵ 5.60 and GH₵ 6.80 (USD 1.40 to 1.70) during

14
normal high-yielding cycles. These figures are much higher in Ghana than in other countries, which were roughly USD 0.78 to 1.29 on average. Price of feed is about twice as high in Ghana compared to other major tilapia-producing countries. This is also consistent with the feed prices reported in Macfadyen et al. (2015). The high cost of fish feed is the main factor that drives the cost of production per kilogram of tilapia produced in Ghana.
To examine the cost to produce a kg of tilapia, we break down the costs along the value chain further and by farm sizes and cycle (Figure 3.3). During good harvests, micro farmers incur GH₵ 6.40 in costs to produce 1 kg of tilapia, while during bad harvest, micro farms incur GH₵ 7.60. At a farmgate price of GH₵ 10, micro farmers generally receive between GH₵ 2.40 and 3.60 as a gross margin. Depending on the sales outlet, as much as GH₵ 8 per kg of tilapia is captured by transportation and traders’ margins before it reaches final consumers. Regular and Size 1 tilapias fetch roughly GH₵ 18/kg in most local markets, cold chains, and roadside outlets.
Figure 3.3. Cost components and cumulative cost in Ghana to produce one kg of farm-raised tilapia, by farm size category and quality of production season Micro tilapia farmers, low-yielding season Micro tilapia farmers, high-yielding season
Small tilapia farmers, low-yielding season Small tilapia farmers, high-yielding season
0
5
10
15
20
25
0123456789
GH₵/
kg
cost per stagecumulative cost
0
5
10
15
20
25
0123456789
GH₵/
kg
0
5
10
15
20
25
0123456789
GH₵/
kg
cost per stagecumulative cost
0
5
10
15
20
25
0123456789
GH₵/
kg

15
Medium tilapia farmers, low-yielding season Medium tilapia farmers, high-yielding season
Large tilapia farmers, low-yielding season Large tilapia farmers, high-yielding season
Source: Authors’ interviews with farmers, feed producers and importers, hatcheries, aggregators and market agents in June and October 2017. Note: Prices to final consumers vary widely by market or sales outlet. The prices here are rough middle point prices from across the various markets: GH₵ 18 for smaller tilapia from micro and small-scale farmers and GH₵ 21 per kg for the larger sizes from medium and larger sizes. Farm costs are based on interviews with 6 micro farmers, 10 small farmers, 4 medium farmers, and 5 large farmers. The figures were averaged across farmers in each size category.
For small farmers, the cost to produce 1 kg of tilapia is GH₵ 6.80 during good harvests and GH₵ 9.30 during bad harvests. Compared to micro farmers, small-scale farmers have higher inter-seasonal variability in outputs, making them more prone to very low yields and low profits during bad harvests. For medium farmers, the cost to produce 1 kg of tilapia is GH₵ 5.70 during good harvests and GH₵ 8.80 during bad harvests. Medium farmers’ returns are between GH₵ 2.20 and 5.30. For large farmers, the cost to produce 1 kg of tilapia is GH₵ 4.00 during good harvests and GH₵ 6.60 during bad harvests. Large-scale farmers’ returns range from GH₵ 4.40 to 7.00, and can even go up depending on the market outlet. Overall, tilapia cage culture is profitable and provides good income-generation opportunities along the value chain to traders, transport operators, feed importers, and producers and hatcheries. Despite higher costs of production, attractive tilapia prices ensure that profit margins for tilapia farmers in Ghana are comparable or even higher than those observed for tilapia farmers in other countries.
0
5
10
15
20
25
0123456789
GH₵/
kg
cost per stagecumulative cost
0
5
10
15
20
25
0123456789
GH₵/
kg
0
5
10
15
20
25
0123456789
GH₵/
kg
cost per stagecumulative cost
0
5
10
15
20
25
0123456789
GH₵/
kg

16
Based on the above cost figures, there are several ways to improve the profitability and cost-competitiveness of Ghanaian tilapia farmers.
1. Feed costs clearly have to be reduced for Ghanaian farmers to competitively produce tilapia, given that prices in Ghana are much higher than in other countries. Interviews with the main feed producer indicate that the cost of some ingredients, such as maize and soybeans, are high, thereby leading to a higher overall cost for fish feed. An importer of feed also indicated that 80 percent of the imported feed costs goes to tariffs, taxes, and transportation. This is explored further in the next section.
2. The higher cost per kg of tilapia also indicates lower productivity than other countries, i.e., output or harvests are relatively low. The feed conversion ratios are similar across the focus countries, which indicate that productivity relative to the usage of feeds may not be a major issue in Ghana.
3. Finally, a noticeably high proportion of the price paid by final consumers goes to trade and transportation. Other studies have pointed to the higher handling and transportation costs in Ghana compared to other countries (World Bank 2013a). This can be an area that can be improved in order to lower tilapia prices for consumers, making it more affordable.
4. LEARNING FROM OTHER COUNTRIES
In this section we draw lessons for Ghana from other countries’ experiences in developing aquaculture. We reviewed the experiences of countries that are leaders in tilapia production, including China, Bangladesh, Indonesia, Egypt, and Vietnam. To narrow our literature search, we focused on documents that either provide meta-reviews or are more recent studies from 2012 onwards of aquaculture production in these countries. In Table 4.1, we describe the main aquaculture systems in these countries, policies and strategies adopted, constraints and opportunities. Where relevant, we also have included insights from counties such as Philippines, Thailand, Malaysia, and Myanmar, from where Ghana can learn lessons. Finally, we also reviewed recent studies on aquaculture production in countries in Africa with significant aquaculture, including Nigeria, Uganda, Ivory Coast, Tanzania, Zambia, and Kenya. In this section of the paper, we synthesize some central lessons for aquaculture development and tilapia-farming, including on the enabling role of government; the centrality of the private sector; coordination among various actors in improving feed, the provision of fingerlings, and extension services; stronger attention to environmental sustainability and food safety; and improving access and affordability.
Table 4.1. Comparison of aquaculture systems and policies in various countries
Country
Annual per capita con-sumption
Production/ export
Commodities/ system Policies
Evidence of impact Constraints
China 38 kg Top producer and exporter of aquaculture and tilapia; 61 million mt from aquaculture; 1.8 million mt of tilapia in 2015; 60% of tilapia goes to export
Various species; tilapia is a major component
Export-oriented strategy (zero tax for exportation)
Tilapia is a major industry; impor-tant source of animal protein; major contribu-tions to job creation, rural development
Various challenges including: (1) fluctuating global demand and prices; (2) unstable climate; (3) increasing input and labor costs
Bangladesh 18 kg (urban: 22 kg); fish is second most important food after rice
6th aquaculture producer; 4th tilapia producer globally; 1.6 million tons in 2012/13 from aquaculture (55 percent of total fish); mainly shrimp; aquaculture is mainly for domestic market
Mainly shrimp pond culture; some carp, tilapia, and pangasius. Seasonal fish farming in flooded areas during monsoon season
Mainly private sector-driven; pro-business outlook; enabling policies and infrastructure at early stages
Proven poverty and nutrition impacts; poorest households increased their consumption by 57%, largest among any quintile group
Poor regulatory enforcement; continued informality of the sector; environment issues

17
Country
Annual per capita con-sumption
Production/ export
Commodities/ system Policies
Evidence of impact Constraints
Egypt 22 kg 9th aquaculture producer globally; 3rd tilapia producer; top tilapia producer in Africa; 1.2 million mt farmed fish in 2015 (55% tilapia); mainly for domestic use
Mainly tilapia, with some mullet, catfish, and carp in earthen ponds
Developing feed and hatchery sectors; limited attention to water quality, food safety, and environ-mental sustainability
Major industry; 120,000 employed in the sector; sustained high profits for value chain actors
High feed costs; limited land for expansion; poor management practices; changing consumer prefer-ences – growing hygiene and health concerns; poor handling and lack of processing facilities
Vietnam 18 kg 4th aquaculture producer; 5th tilapia producer globally
Shrimp/prawn traditionally; but converting shrimp ponds to tilapia
Export-oriented.; aquaculture promotion policies include tax holidays
Export-oriented aquaculture has created jobs and rural livelihoods
Sustaining export growth; serious environmental issues
Indonesia 20 kg 2nd largest aqua-culture producer; 2nd largest tilapia producer globally
Mainly fresh-water pond culture; tilapia 24% of total volume; tilapia mainly exported; wide diversity of aquaculture species and systems; dominance of small farmers
National policy to increase fisheries production three-fold; Aquaculture promoting policies include tax holidays and availability of credit
Export-oriented aquaculture creates jobs and rural livelihoods; contributes to nutrition security: 69:100 fish to animal protein ratio – four times world average; stabilizes seafood prices
Small-scale farmers have limited capacity to monitor water quality and employ good feed and other aquaculture practices; poor infrastructure; environmental issues, including soil acidification; water quality degradation from cage farming
Source: Various studies reviewed and synthesized by the authors.
4.1. Government’s commitment for aquaculture
As shown in the countries reviewed in Table 4.1, aquaculture has been an important component in the strategies of many countries for improving livelihoods, food security, or foreign exchange earnings. These countries recognize the potential of commercial aquaculture to stimulate economic growth, alleviate poverty, and contribute to their balance of payments. As seen in the countries studied, livelihoods and foreign exchange continue to be important motivators behind government support to aquaculture. For example, Indonesia’s aquaculture program aims to intensify the farming of species, such as tilapia, shrimp, seaweed, and grouper, that are destined for foreign markets. Indonesia now is the second largest producer of tilapia in the world, overtaking Egypt.
In Ghana, a similar commitment and attention to aquaculture as an engine for economic growth and job creation has not been evident. There has been import restrictions on tilapia for several decades. However, this ban is not actively enforced – there are regular reports of illegal imported tilapia flooding the market. In 2012, government launched the Ghana National Aquaculture Development Plan (GNADP). This plan sought to increase annual aquaculture production from the 2010 baseline level of 10,200 mt to 100,000 mt by the end of 2016, increasing both the market share and value of Ghanaian farmed fish (Ministry of Food and Agriculture Fisheries Commission 2012). The plan outlined an extensive list of constraints in the aquaculture sector that it aimed to address, including issues with fish feed, financing for local production, institutional and regulatory arrangements, and research. Several activities have been implemented under the GNADP, including training sessions for improved fingerling production, zoning of Lake Volta to facilitate site selection for new farmers, setting up of fish disease laboratory, and renovation of the Aquaculture Research and Development Center (ARDEC). However, the GNADP production targets

18
were not achieved by 2016. Much of the shortcomings in the implementation of the plan was due to a lack of commitment from higher levels of government, manifested in lack of sustained investments and impactful policy, institutional, and regulatory reforms. Since then, aquaculture sector actors await a new national strategy to accelerate growth in the sector. A national aquaculture technical working committee made up of experts from different organizations was formed in early 2018 to help address some of the challenges in the sector.
4.2. Government’s critical role in enabling policies and infrastructure
Commitment of a government to aquaculture development is often manifested by the policies put in place to promote aquaculture. In Bangladesh, the government played a role in the early stages of aquaculture value chain development. For instance, the first fish feed mill was established by SABINCO, a joint venture investment company owned by the governments of Saudi Arabia and Bangladesh (Hernandez et al. 2018). Also, government’s investments in infrastructure, such as rural roads, water management schemes, power generation, and telecommunications have proven critical to take-off of aquaculture in Bangladesh and in several other countries studied. The government of Bangladesh also played a role in the hatchery sector, where the Bangladesh Fisheries Research Institute was central to the development of highly productive species. The government also led efforts to aggressively search for and give farmers access to the best available breeds of tilapia and other aquaculture species.
It is quite the opposite in Ghana. Industry players highlight the regulatory hurdles that they have faced in obtaining productive tilapia strains, such as GIFT, approved. Other countries have also used fiscal incentives to encourage private sector growth. A zero-tax policy for the exportation of fish has been adopted by China. In Indonesia, entrepreneurs are eligible for tax holidays. Vietnam provides incentives for aquaculture through land tax exemptions to commercial farmers (Hishamunda et al. 2009). These tax holidays have encouraged investment in aquaculture, mainly by local entrepreneurs. In several of the countries studied, while there is some small foreign investment in aquaculture, the capital for most activities in the sector comes from local entrepreneurs (Hishamunda et al. 2009). This stands in contrast to the case in Ghana where most medium and large tilapia farms are foreign-owned.
The regulatory cost of doing business in Ghana has been a major complaint of these foreign investors. For example, a USD 500,000 minimum investment is required by the Ghana Investment Promotion Council, a level of investment which is considered high and restrictive for those smaller foreign investors who are interested in aquaculture. Foreign aquaculture farmers interviewed mentioned that countries like Zambia, Ethiopia, or Nigeria do not have such restrictions and are generally less bureaucratic than Ghana. Ghana ranks 120th of 190 countries in terms of the ease of doing business index of the World Bank, with a score of 57.2 out of 100. This is slightly above the SSA average of (50.4) and better overall than Ethiopia (47.8), Nigeria (52.0) and Bangladesh (41.0), but worse than Zambia (64.5), Vietnam (67.9), Indonesia (66.5), China (65.3), or Egypt (56.2). Based on this index, Ghana can be expected to be viewed as generally less attractive to both foreign and local investors compared to many of the top aquaculture-producing countries in SSA and elsewhere (see Brummett, Lazard, and Moehl 2008).
Tariffs are considered quite high in Ghana: import duties for imported feeds are 5 percent, but with other taxes and fees, between 20 and 30 percent of feed costs is reported to be the difference in the price of fish feed between its arrival in port and after it leaves the port. One feed importer also mentioned that about 80 percent of imported feed costs goes to tariffs, taxes, and transportation. These high cost components point to the need to review regulations and consider fiscal incentives that would facilitated the development of aquaculture in Ghana, such as the tax holidays or exemption on import duties offered in countries such as Indonesia, Myanmar, and Vietnam.

19
4.3. Lowering feed cost, diversifying feed ingredients, and improving feed quality
The high cost of feed deserves special attention, since feed makes up about 80 percent of tilapia production costs. A strong fish feed sector would be the foundation for a blue revolution in Ghana. In Egypt, increased demand for commercial fish feed resulted in the number of fish feed mills increasing from only five state-owned mills in 1999 to 31 both public and private mills in 2009 producing annually 670,000 mt of conventionally pelleted and extruded feeds (El-Sayed, Dickson, and El-Naggar 2015). In most countries, the high cost of feed is due to the need to import essential ingredients.
In Asia, some countries have used fiscal incentives to protect local feed industries. Indonesia and Malaysia are experimenting with local ingredients rather than imported fish meal (Subasinghe et al. 2002). The two countries and the Philippines are reducing costs by exempting imported ingredients from import taxes. In Egypt, alternative feed ingredients are being explored, including algal meals and insect protein (El-Sayed, Dickson and El-Naggar 2015). In Ghana, some initial research on alternative feed ingredients is now underway, including using the black soldier fly as a protein source.
Most importantly, quality control and inspection procedures need to be put in place to improve feed quality. In the case of Ghana, this will require training of government staff and updated facilities. Once the capacity is built, inspection should include regular testing of feed ingredients and finished feeds, not just proximate analysis on the availability of nutrients in the feed, but also for contaminants, such as mycotoxins and biological hazards, including Salmonella.
4.4. Environmental sustainability at the forefront
Aquaculture in the countries studied gained a quick head start producers were not restricted by environmental, food safety, and certification compliances. When aquaculture became successful and entered a phase of rapid expansion without order, problems of disease and other sustainability concerns caught up with the sector. Governments had to scramble to regulate it.
For Ghana’s tilapia farming, the increasing number of cage farms is of concern, since several studies suggest wastes generated from cage aquaculture can negatively impact water and sediment quality (Beveridge 2004). These impacts are a result of waste from fish feces, uneaten food, and associated bacterial biomass. The feces and food waste have higher contents of carbon, nitrogen, and phosphorus than natural sediments. This causes the lakebed beneath these cage farming systems to have elevated levels of organic matter and nutrients. The intensive fish culture in cages can lead to the eutrophication of water bodies and to the emergence of deleterious effects on water quality, such as blooms of toxic cyanobacteria that are harmful for wildlife and humans. Since the exchange time of freshwater systems is normally much longer than in marine environments, the environmental effects of wastes produced by freshwater cage fish culture can be stronger and longer lasting than those of marine cage farming. In Egypt, cage culture has been substantially scaled down and several projects stopped due to these environmental concerns. Environmental conditions in the Nile are no longer suitable for aquaculture, as the water is polluted to varying degrees by nitrogen and other hazardous chemicals.
In Ghana, annual cage culture production of tilapia is between 35,000 and 45,000 mt.13 Asmah et al. (2016) show no environmental impact of cage aquaculture at current levels, and a key informant14 stated that an ongoing study shows an environmentally-allowable annual limit of cage-produced tilapia in Ghana of 200,000 mt. There remains potential for growth even within this limit.
However, the weak enforcement of aquaculture standards and regulations as they relate to environmental protection, feed quality, fingerling quality, food safety, and public health are a common
13 These estimates are derived from authors’ interviews with value chain actors and MOFAD. This figure does not include production from tilapia pond culture, which is estimated to be much lower at around 2,000 mt in 2015. 14 Dr. Akpalu, University of Ghana-Legon (personal communication).

20
denominator in the countries studied. The challenges are particularly pressing in Ghana. Food safety standards enforcement and regulation are particularly highlighted as key factors constraining further growth in the aquaculture sector in Egypt and Vietnam (Yoshida 2017; Eltholth et al. 2015). In Ghana, value chain actors complain about the weak monitoring and enforcement of regulations for water quality in the Volta river, threatening the sustainability of aquaculture there. On the other hand, value chain actors complained about the lack of capacity, both in terms of skills and equipment, to test, inspect, and certify their production systems, especially in the fast-growing tilapia sector. There is currently no quality control for chemicals in hatcheries, fish farms, and sales outlets. Medium and large-scale farms are required to monitor water and sediment quality, but micro and small-scale farms have little environmental awareness, according to key informant interviews. Antibiotics and vaccine for tilapia against Streptococcus bacteria are currently not regulated. As a result, the misuse of antibiotics in farmed fish (as well as in poultry production) is contributing to rising resistance to the antibiotics in the pathogenic bacteria, constituting a serious public health risk (Donkor et al. 2011; Donkor et al. 2018; Kunadu et al. 2018). In addition, several studies show a high prevalence of disease-causing pathogens, including Salmonella, Listeria, and E. coli O157:H7 both in fish and in other fresh produce, including meat, milk, fruits, and vegetables (Sackey et al. 2001; Donkor et al. 2008; Aboagye 2016; Futagbi et al. 2016; Quansah et al. 2018).
4.5. Accessibility and affordability
While several studies on aquaculture in Bangladesh show that the development of the sector has had a positive impact on poverty and nutrition, Golden et al. (2017) believe there are limits on the extent to which aquaculture systems in countries such as Ghana can contribute to nutrition security. Similarly, a study in Egypt shows that, despite a huge aquaculture industry, many segments of the population do not have access to fish, therefore limiting the impact of aquaculture on national food and nutrition security (Eltholth et al. 2015). Fiscal incentives are used in some countries. For example, Vietnam has offered tax holidays for poorer, small tilapia farmers in some regions. A better distribution system for farmed tilapia will enable wider access to this source of animal protein, especially in countries and areas that are experiencing serious food and nutrition deficiency.
As it is now, tilapia is expensive in Ghana, and mainly consumed by urban middle- and upper-income consumers. Tilapia is 47 percent more expensive than local chicken, and almost three times more expensive than imported chicken (Table 4.2). In terms of the protein equivalent, tilapia is 37 percent more costly than local chicken. Similarly, in terms of kilocalories provided, tilapia is three times more expensive per kilocalorie than is local chicken.
Table 4.2. Comparing costs of calorie and protein content from tilapia, chicken meat, and eggs
Food Energy,
kcal per 100g Protein,
g per 100g Market price, GH₵ per 100g
Energy price, GH₵ per 100
kcal Protein price, GH₵ per 100g
Tilapia, raw 96 20.08 2.20 2.29 10.96 Tilapia, cooked with dry heat 128 26.15 3.20 2.50 12.24 Whole egg, raw 143 12.56 1.40 0.98 11.15 Whole egg, boiled 155 12.58 2.00 1.29 15.90 Whole egg, fried 196 13.61 2.67 1.36 19.59 Chicken, raw 215 18.60 1.50 0.70 8.06 Chicken, roasted 239 27.30 2.27 0.95 8.33 Chicken, raw, dark meat only 237 16.69 0.80 0.34 4.79 Chicken, roasted, dark meat only 205 27.37 5.36 2.61 19.57
Source: Nutrition data are from the USDA Nutrient Database for Standard Reference Release 28 (USDA 2015, available at https://ndb.nal.usda.gov/ndb/)
The potential for growth in tilapia production in Ghana to contribute to more balanced diets and improved nutrition for the poor is currently limited by the high price of tilapia. Ghana is among the top

21
countries considered as nutritionally-vulnerable and with low dietary diversity, with diets that are particularly high in carbohydrates, but with low protein and micronutrient content (Golden et al. 2017). Fish, with its valuable nutritional properties, can play a major role in correcting these dietary imbalances, if it were more affordable to consumers. Investments in processing and infrastructure (better roads and electrification) can address issues around perishability of the product and improve availability. Improvements in cage culture can result in positive spillovers to pond culture. This can encourage investments in other aquaculture systems, potentially increasing production of both tilapia and other species, thereby improving incomes, dampening fish prices, and reducing nutrient deficiencies.
5. DISCUSSION AND CONCLUSION
This paper describes the fast-growing tilapia cage-farm sub-sector in Ghana, a country that is playing a leading role in the expansion of aquaculture now occurring in SSA. The blue revolution in SSA typifies similar conditions at the start of the blue revolution in China, Egypt, Bangladesh, and most of Southeast Asia. Although this study focused on Ghana, the overall findings are in line with and can be considered an update of earlier reviews on the progress of the blue revolution in SSA (e.g., Brummett, Lazard, and Moehl 2008). Demand for fish, particularly tilapia, in SSA is increasing with demand in some countries being among the highest in the world. To satisfy this increasing demand, many countries in SSA are experiencing growth in aquaculture.
To some extent, the other countries in SSA that are developing their aquaculture systems offer lessons for Ghana. For example, Zambia has successfully introduced non-native tilapia species and spurred commercial production (Kaminski et al. 2017). Other countries that are less endowed with lake and river resources, such as Uganda, Zambia, and Nigeria, are using pond culture to successfully develop aquaculture. Some countries, like Uganda and Namibia, have begun to export tilapia. These emerging successes suggest that, regardless of the availability of natural water bodies, the blue revolution in SSA can be accelerated with improvements in strain, fingerlings, feed, and extension services. We focus on these points below.
For Ghana, this exploratory study shows:
1. A profitable farmed tilapia industry with potential for significantly expanding supply to satisfy growing local and West African demand;
2. An improvement in the supply of quality fish feed, but still potential to reduce feed costs;
3. An improvement in hatchery management practices over time, but still potential to improve farm productivity via adoption of good aquaculture practices and improved strains; and
4. The necessity of adopting institutional and regulatory lessons from other countries that have successfully spurred a blue revolution to improve food security and increase farmers’ income.
In this concluding section we highlight the implications of these findings for Ghana more specifically. However, these also mirror the strategies needed to expand tilapia farming in other SSA countries.
On the production side, it is estimated that tilapia production in Lake Volta can grow about four-fold from its current level, based on the lake’s estimated biophysical carrying capacity. Producers can benefit from the high price of tilapia in Ghana. However, the cost of production also is higher in Ghana than in other countries. Therefore, Ghana may not be competitive in exporting tilapia outside of SSA. However, there is an opportunity to export fresh tilapia to West African countries, some of which are currently experiencing a surge of tilapia imports. Ghana is strategically located in the center of West Africa and the presence of Lake Volta gives Ghana a natural comparative advantage as a regional supplier of fish. In addition, Ghanaian consumers’ preference for fresh over frozen tilapia ensures that Ghanaian farmers can continue to supply local markets, with or without import restrictions on frozen tilapia.

22
Overall then, we observe a nascent blue revolution in Ghana with its profitable tilapia value chain, consumers’ growing preference for tilapia, and high tilapia prices. However, this study supports the main constraints to growth identified in earlier studies— fingerlings and feed (Brummet et al. 2008; El-Sayed 2013). With the establishment of the Raanan fish feed factory, the fish feed situation has improved, compared with the situation at the start of the decade when there was no commercial production of pelletized feed in Ghana and farmers had to rely on imported feed alone (El-Sayed 2013). With a more conducive business environment and enabling policies, Ghana has the potential to expand its exports of fish feed to neighboring countries.
One bottleneck in the feed sector is availability of quality maize and soybean. Developing local production for these two key raw materials and exploring alternative sources of protein are possible actions to reduce feed cost. Reducing feed cost would reduce the cost per kg of tilapia, making tilapia cage culture in Ghana more competitive regionally and globally, with substantial spillover effects to pond culture of various fish species, as well as to livestock, especially poultry, the feed for which requires similar inputs as fish feed. The foundation of a strong aquaculture sector is a strong feed sector, and thus, development of the feed sector is paramount.
Perhaps more importantly and more urgently, there is an opportunity to increase farm productivity through adoption of fast-growing breeds such as the newer generation of the GIFT strain of tilapia, along with good aquaculture management practices. GIFT strains have been proven to be highly productive in Asia and Latin America where they were introduced. No study has been completed on the difference of the GIFT strain and the Akosombo strain in fish farms. Akosombo is currently the only strain legally permitted for use in Ghana. Stakeholders’ opinion on GIFT versus Akosombo are mixed, although most actors in the value chain interviewed for our study lean towards GIFT. Until a risk assessment study is completed, the perceived low productivity of the Akosombo strain may not be addressed in the near future.
A simple calculation by Ansah, Frimpong, and Hallerman (2014) shows that Ghana would obtain net gains from GIFT adoption over the next 20 years of between USD 130 million to 650 million, assuming yield gains in GIFT strains that are between 24 and 61 percent higher than realized with the Akosombo strain.15 However, rigorous yield comparisons and economic and risk analysis would first have to be completed to gauge how realistic are these assumptions. In simple terms, if the sector in Ghana could increase farmed tilapia to the estimated allowable limit of 200,000 mt from its current production of 40,000 mt, mainly through employing more productive strains and instituting cost-reducing measures, and assuming a steady tilapia price at GH₵ 10/kg, an additional USD 400 million will be generated in the tilapia value chain overall. Roughly USD 13 million of this added value will come from the sale of fingerlings – revenue for ARDEC and other hatcheries. However, countries like Ghana face the challenge of evaluating new, potentially-higher yielding breeds while at the same time minimizing the biosecurity risk associated with the introduction to the country of new strains of fish. Nonetheless, the government of Ghana has to assertively look for partners to expedite the risk assessment studies to better guide its decision-making around policy and regulation for aquaculture.
Turning to institutions, regulatory oversight, public services, and policy actions, this study’s review of lessons from other countries shows that aquaculture development elsewhere was mainly driven by the private sector, while government supported the process through improving infrastructure and providing an enabling policy environment. Enabling policies can be in the form of easing and facilitation of business processes, tax cuts to promote businesses, and reduction of import duties for key ingredients or equipment needed for local production of farmed fish. These policies go beyond aquaculture and affect businesses and private sector development overall, but lucrative sectors, such as aquaculture, can help push this pro-business agenda forward. General education for greater literacy and numeracy for the aquaculture workforce, improved extension services, and increased capacity within regulatory bodies are possible areas
15 This assumption is based on experiences in Asia.

23
for government intervention, some of which could be done in partnership with the private sector. The importance of such investments is also recognized by Brummett, Lazard, and Moehl (2008) for SSA overall, even in countries at an advanced stage of the blue revolution (Hishamunda et al. 2009 and Rimmer et al. 2013 on Indonesia; El-Sayed, Dickson and El-Naggar 2015 on Egypt). Direct interventions in the tilapia value chain that need attention in Ghana include extension services, market infrastructure (cold stores, markets), and better defining the roles of research and regulatory bodies (research, fingerling production, regulation).
Lastly, as is evident in the case of Bangladesh, government’s general role in promoting enabling policies can be beneficial for aquaculture. These include providing rural infrastructure and minimizing regulatory constraints to enterprise start up and growth. For example, a commonly-cited constraint to fish farming in Ghana, as well as in other countries, is the lack of credit. Providing credit subsidies or allowing more access to capital are often recommended as solutions. However, countries have had mixed results in promoting policies for greater access to capital. In the Philippines and Indonesia, providing loans proved unsuccessful because of the targeting issues and default problems prevalent in many poor and developing countries. Similar experiences have been reported in the aquaculture sector across SSA (Brummett et al. 2008). Ghana has also experienced this in its tilapia sector, where absentee investors have provided loans to fish farmers, only to find that the loans could not be recovered. In consequence, these investors exited the industry, mainly due to weak monitoring and high loan default. The evidence suggests that programs and projects providing or subsidizing credit to fish farmers have also largely failed.
Therefore, institutional arrangements that can reduce moral hazard and loan default to ensure a sustainable flow of funds and profitability to different actors of the tilapia chain will be an important strategy for Ghana and the rest of SSA in promoting aquaculture. We see some investors channeling their funds to farmers’ organizations in Ghana that have established arrangements among their members based on hiring monitors, with a management fee, who are also members of the farmers’ organizations and residents in the fish farming communities. These individuals monitor aquaculture production and, in doing so, reduce default among farmers. Such arrangements seem promising, but would need to be evaluated to determine whether they can be scaled up to other areas.
Based on the diverse set of data and methods used in this exploratory study, we present up-to-date evidence of a fast-growing tilapia value chain in Ghana with potential to grow and supply neighboring countries. However, securing and sustaining the blue revolution in Ghana and SSA will require lower feed costs, improvements in the tilapia strain used, targeted extension services to improve farm management practices, fiscal incentives to attract investments into the sector, closer attention to water and feed quality, and enforcement of food safety regulations.
We propose that a future research agenda to understand and support effective implementation of the above-mentioned strategies in Ghana should address the following questions:
1. Is the industrial policy approach, such as banning tilapia imports to protect local producers, an appropriate policy considering the trade-offs between job creation and lower tilapia prices for consumers?
2. Should foreign strains of tilapia be allowed in the country? What are the productivity differentials between the latest generations of GIFT strains and the Akosombo strain now used? What are the social, economic and environmental costs and benefits of the latest GIFT strains versus the Akosombo strain?
3. What yield improvements can be achieved using the existing Akosombo strain with further improvements in brood stock management and adoption of good management practices at hatcheries and farms?
4. What are the food quality and safety differences between imported and locally produced tilapia?
5. What are the tilapia attributes preferred by consumers? Can locally-produced tilapia compete with cheaper imports?

24
6. Should small farms be encouraged and supported? And if so, what are the best approaches for doing so?
7. What institutional arrangements would work to infuse fish farming with additional capital, reduce moral hazard, and increase loan recovery?
8. How much spillover effects to pond culture fish-farming systems and the livestock sector can be expected from improvements in tilapia cage culture and related services, particularly in reducing the costs of fish feed?
9. What bilateral or West Africa regional trade arrangements can be negotiated and adopted to promote tilapia and feed production in Ghana and promote aquaculture trade within the region?

25
References
Aboagye, E. 2016. Microbial quality of fish along the tilapia, African catfish and sardinella artisanal value chains in Kpong and James Town, Ghana. MS Thesis. Legon, Ghana: University of Ghana.
Amal, M.N.A., and Zamri-Saad, M. 2011. “Streptococcosis in Tilapia (Oreochromis niloticus): A Review.” Pertanika Journal of Tropical Agricultural Science, 34 (2): 195-206.
Ansah, Y., Frimpong, E., and Hallerman, E. 2014. “Genetically-Improved Tilapia Strains in Africa: Potential Benefits and Negative Impacts.” Sustainability, 6 (6): 3697-3721.
Asmah, R., Karikari, A., Falconer, L., Telfer, T.C., and Ross, L.G. 2016. Planning for Improved and Sustainable cage Aquaculture in Lake Volta, Ghana. Accra, Ghana and Stirling, UK: CSIR Water Research Institute and University of Stirling.
Asmah, R. 2008. Development potential and financial viability of fish farming in Ghana. PhD Dissertation. Stirling, UK: University of Stirling.
Beveridge, M.C.M. 2004. Cage Aquaculture. 3rd ed. Hoboken, NJ: Blackwell Publishing. Brummett R. E., Jerome L., and Moehl, J. 2008. “African aquaculture: Realizing the potential.” Food Policy, 33: 371-
385. Brummett, R.E., and Ponzoni, R.W. 2009. “Concepts, alternatives, and environmental considerations in the develop-
ment and use of improved strains of tilapia in African aquaculture.” Reviews in Fisheries Science, 17: 70-77. Delgado, C., Rosegrant, M., Steinfeld, H., Ehui, S. and Courbois, C. 1999. Livestock to 2020: The next food revolution.
Food, Agriculture, and the Environment Discussion Paper 28. Washington, DC: International Food Policy Research Institute.
Dey, M.M., Spielman, D. J., Haque, A.B.M.M., Rahman, M. S., and Valmonte-Santos, R. 2013. “Change and diversity in smallholder rice–fish systems: Recent evidence and policy lessons from Bangladesh.” Food Policy 43: 108-117.
Dey M.M., Eknath A.E., Sifa L., Hussain M.G., Thien T.M., Van Hao N., Aypa S., and Pongthana N. 2000. “Performance and nature of genetically improved farmed tilapia: A bioeconomic analysis.” Aquaculture Economics and Management, 4 (1-2): 83-106.
Dickson, M., Nasr-Allah, A., Kenawy, D., and Kruijssen, F. 2016. “Increasing fish farm profitability through aquaculture best management practice training in Egypt.” Aquaculture, 465 (1): 172-178.
Donkor E.S., Anim-Baidoo I., Fei E., Collins A., Olu-Taiwo M., Nana-Adjei D., Owusu E., and Obeng A.F. 2018. “Occurrence of Antibiotic Residues and Antibiotic-Resistant Bacteria in Nile Tilapia Sold in Some Markets in Accra, Ghana: Public Health Implications.” Journal of Food Research (in press).
Donkor E.S., Lanyo R., Akyeh M.L., Kayang B.B., and Quaye D.A. 2008. “Monitoring enterohaemorrhagic Escherichia coli O157:H7 in the vegetable food chain in Ghana.” Research Journal of Microbiology, 3 (6): 423-428.
Donkor E.S., Newman M.J., and Yeboah-Manu D. 2011. “Epidemiological aspects of non-human antibiotic usage and resistance: implications for the control of antibiotic resistance in Ghana.” Tropical Medicine and International Health, 17 (4): 462-468.
Economist (The). 2013. “Fish farming: The promise of a blue revolution.” The Economist. 7 August 2003 www.economist.com/node/1974103.
El-Sayed, A.F.M., Dickson, M.W., and El-Naggar, G.O. 2015. “Value chain analysis of the aquaculture feed sector in Egypt.” Aquaculture, 437: 92-101.
El-Sayed, A.-F.M. 2013. “Tilapia feed management practices in sub-Saharan Africa.” In On-farm feeding and feed management in aquaculture. M.R. Hasan and M.B. New, eds. FAO Fisheries and Aquaculture Technical Paper no. 583. pp. 377–405.Rome: Food and Agriculture Organization of the United Nations (FAO).
Eltholth, M., Fornace, K., Grace, D., Rushton, J., and Hasler, B. 2015. “Characterisation of production, marketing and consumption patterns of farmed tilapia in the Nile Delta of Egypt.” Food Policy 51: 131-143.
Evenson, R.E., and Gollin, D. 2003. “Assessing the Impact of the Green Revolution, 1960 to 2000.” Science 300 (5620): 758-762.
FAO (Food and Agriculture Organization of the United Nations). 2017a. FAOSTAT database. Accessed February 2018. www.fao.org/faostat/en/#home.
FAO (Food and Agriculture Organization of the United Nations). 2017b. Fishery and Aquaculture Statistics. Global production by production source 1950-2015 (FishstatJ). In: FAO Fisheries and Aquaculture Department [online]. Rome. Updated 2017. www.fao.org/fishery/statistics/software/fishstatj/en
FAO (Food and Agriculture Organization of the United Nations). 2016. The state of world fisheries and aquaculture 2016: Contributing to food security and nutrition for all. Rome: FAO
Figueiredo, H.C.P., Nobrega, N. L.., Leal, C.A.G., Pereira, U.P., and Mian, G.F. 2012. “Streptococcus iniae outbreaks in Brazilian Nile tilapia (Oreochromis niloticus L:) farms.” Brazilian Journal of Microbiology, 43 (2): 576-580.

26
Fitzsimmons, K. 2016. Tilapia Aquaculture 2016 and where will we be in 2026. 11th International Symposium for Tilapia Aquaculture (ISTA), World Aquaculture Society-Asian Pacific Conference, 2016, Surabaya, Indonesia, April 26-29, 2016.
Frimpong, E.A., and Anane-Taabeah, G. 2014. “Social and economic performance of tilapia farming in Ghana.” In Social and economic performance of tilapia farming in Africa; edited by J. Cai, K.K. Quagrainie, and N. Hishamunda. FAO Fisheries and Aquaculture Circular No. 1130. pp. 49-89. Rome: FAO.
Futagbi G., Addo M., Agbeko P., and Donkor E.S. 2016. “Microbial quality of mangoes from selected markets in Accra, Ghana.” New York Science Journal 9 (3).
GenoMar Breeding Services. 2016. Superior sustainable brood-stock, DNA verifiable traceability. http://www.genomar.no Accessed on 2/2/2017.
Golden, C.D., Seto, K.L., Dey, M.M., Chen, O.L., Gephart, J.A., Myers, S.S., Smith, M., Vaitla, B., and Allison, E.H. 2017. “Does Aquaculture Support the Needs of Nutritionally Vulnerable Nations?” Frontiers in Marine Science, 4: 159.
Gupta, M.V., Bartley, D.M., Acosta, B.O. 2004. Use of genetically improved and alien species for aquaculture and conservation of aquatic biodiversity in Africa. Penang, Malaysia: WorldFish Center.
Hamenoo, E. 2011. The Role of the Market in the Development of Aquaculture in Ghana. MS Thesis, Tromso, Norway: University of Tromso.
Hellin, J., and Meijer, M. 2006. Guidelines for value chain analysis. Rome: Food and Agriculture Organization of the United Nations (FAO).
Henriksson, P.J.G., Tran, N., Mohan, C.V., Chan C. Y., Rodriguez, U-P., Suri, S., Mateos, L.D., Utomo, P.B.N., Hall, S. and Phillips, M.J. 2017. “Indonesian aquaculture futures: Evaluating environmental and socioeconomic potentials and limitations.” Journal of Cleaner Production 162: 1482-1490.
Hernandez, R., Belton, B., Reardon, T., Hu, C., and Zhang, X. 2018. The “quiet revolution” in the aquaculture value chain in Bangladesh. Aquaculture, 493 (1): 456-468.
Hishamunda N., Ridler, N.B., Bueno, P. and Yap, W.G. 2009. “Commercial aquaculture in Southeast Asia: Some policy lessons.” Food Policy 34 102-107.
Jagger, P., and Pender, J. 2001. “Markets, marketing and production issues for aquaculture in East Africa: The case of Uganda.” Naga, the ICLARM Quarterly, 24 (1&2): 42-51.
Janssen K., Chavanne H., Berentsen P., and Komen H. 2017. “Impact of selective breeding on European aquaculture.” Aquaculture 472: 8-16.
Kaminiski, A. M., Genschick, S., Kefi, A. S., and Kruijssen, F. 2018. “Commercialization and upgrading in the aquaculture value chain in Zambia.” Aquaculture, 493: 355-364.
Kaplinsky, R., and Morris, M. 2000. A handbook for value chain research. Ottawa: International Development Research Centre.
Karikari, A.Y.and Asmah, R. 2016. “Fish farm surveys.” In: Asmah, R., Karikari, A., Falconer, L., Telfer, T.C. and Ross, L.G. Cage aquaculture in Lake Volta, Ghana: Guidelines for a sustainable future. Accra, Ghana and Stirling, UK: CSIR Water Research Institute and University of Stirling.
Kassam, L. 2014. Aquaculture and food security, poverty alleviation and nutrition in Ghana: Case study prepared for the Aquaculture for Food Security, Poverty Alleviation and Nutrition project. Project Report: 2014-48. Penang, Malaysia: The WorldFish Center.
Khaw, H. 2015. Cooperative and uniform fish?: Social interactions and variability in live body weight in the GIFT strain (Nile tilapia, Oreochromic niloticus) in Malaysia. PhD Thesis. Wageningen, Netherlands: Wageningen University.
Kunadu A.P-H., Holmes M, Miller E.L., and Grant A.J. 2018. “Microbiological quality and antimicrobial resistance characterization of Salmonella spp. in fresh milk value chains in Ghana.” International Journal of Food Microbiology 277: 41-49.
Little, D. C., Newton, R. W., and Beveridge, M. C. M. 2016. “Aquaculture: A rapidly growing and significant source of sustainable food? Status, transitions and potential.” Proceedings of the Nutrition Society 75: 274-286.
Macfadyen, G., Nasr-Alla, A.M., Al-Kenawy, D., Fathi, M., Hebicha, H., Diab, A.M., Hussein, S.M., Abou-Zeid, R. M., and El-Naggar, G. 2012. “Value-chain analysis: An assessment methodology to estimate Egyptian aquaculture sector performance.” Aquaculture 362-363: 18-27.
Moloko, P.M., Kpundeh Mathew D., and Yongming, Y. 2013. “Production and marketing systems of farmed tilapia in China.” International Journal of Fisheries and Aquaculture 5 (2): 12-18.
Norman-Lopez A., Sellars M.J., Pascoe S., Coman G.J., Murphy B., Moore N., and Preston N. 2016. “Productivity benefits of selectively breeding Black Tiger shrimp (Penaeus monodon) in Australia.” Aquaculture Research 47 (10): 3287-3296.
Nguyen N.H. 2016. “Genetic improvement for important farmed aquaculture species with a reference to carp, tilapia and prawns in Asia: Achievements, lessons and challenges.” Fish and Fisheries 17 (2): 483-506.
Ofori, J.K., Dankwa, H.R., Brummett R., and Abban, E.K. 2009. Producing Tilapia in Small Cage in West Africa.
27
WorldFish Center Technical Manual no. 1952. Penang, Malaysia: The WorldFish Center. Pingali, P. 2012. “Green Revolution: Impacts, limits, and the path ahead.” Proceedings of the National Academy of
Sciences, 109 (31): 12302-12308. Ponte, S., Kelling, I., Jespersen, K. S., and Kruijssen, F. 2014. “The blue revolution in Asia: Upgrading and governance in
aquaculture value chains.” World Development, 64: 52-64. Quansah J.K., Kunadu A.P-H., Saalia F.K., Díaz-Pérez J., and Chen J. 2018. “Microbial quality of leafy green vegetables
grown or sold in Accra metropolis, Ghana.” Food Control 86: 302-309. Rashid, S., Minot, N., and Lemma, S. 2016. Does a “blue revolution” help the poor? Evidence from Bangladesh. IFPRI
Discussion Paper 01576. Washington, DC: International Food Policy Research Institute (IFPRI). Rimmer, M., Sugama, K., Rakhmawati, D., Rofiq, R., and Habgood. H.R. 2013. “A review and SWOT analysis of
aquaculture development in Indonesia.” Reviews in Aquaculture 5: 255-279. Sackey BA, Mensah P, Collison E, Sakyi-Dawson E. 2001. “Campylobacter, Salmonella, Shigella and Escherichia coli in
live and dressed poultry from metropolitan Accra”. International Journal of Food Microbiology 71 (1): 21-28. Shoemaker, C, and P. Klesius. 1997. “Streptococcal disease problems and control: A review.” In K. Fitzsimmons (Ed.),
Tilapia aquaculture 2: 671-682. Soliman, N., and Yacout, D. 2016. “Aquaculture in Egypt: Status, constraints and potentials.” Aquaculture International
24: 1201-1227. Tayamen, M.M. 2004. “Nationwide dissemination of GETEXCEL tilapia in the Philippines”. In New Dimensions of
Farmed Tilapia . Edited by Bolivar, R.B., Mair, G.C., Fitzsimmons, K. Proceedings of the Sixth International Symposium on Tilapia in Aquaculture, Manila, the Philippines, pp. 74–88.
Taylor, D. H. 2005. “Value chain analysis: An approach to supply chain improvement in agri-food chains.” International Journal of Physical Distribution & Logistics Management 35 (10): 744-761.
Thodesen, J., Rye, M., Wang, Y.-X., Li, S.-J., Bentsen, H.B., and Gjedrem, T. 2013. “Genetic improvement of tilapias in China: Genetic parameters and selection responses in growth, pond survival and cold-water tolerance of blue tilapia (Oreochromis aureus) after four generations of multi-trait selection.” Aquaculture 396: 32-42.
Toufique, K. A., and Belton, B. 2014. “Is Aquaculture Pro-Poor? Empirical Evidence of Impacts on Fish Consumption.” World Development 64: 600-620.
Troell, M., Naylor, R.L., Metian, M., Beveridge, M., Tyedmers, P.H., Folke, C., and Gren, Å. 2014. “Does aquaculture add resilience to the global food system?” Proceedings of the National Academy of Sciences, 111 (37): 13257-13263.
Volta River Authority. 2017. Framework for Aquaculture Development on the Volta Lake – Implementation Guidelines Accra, Ghana: Volta River Authority.
World Bank. 2013a. Growing Africa: Unlocking the potential of agribusiness. Washington, DC: World Bank. World Bank. 2013b. Fish to 2030: Prospects for Fisheries and Aquaculture, Report no. 83177-GLB. Washington, DC;
World Bank. Yoshida, N. 2017. "Local institutions and global value chains: Development and challenges of shrimp aquaculture
export industry in Vietnam." Journal of Agribusiness in Developing and Emerging Economies, 7 (3): 318-338. Yuan, Y., Dai, Y., and Gong, Y. 2017. “Economic profitability of tilapia farming in China.” Aquaculture International 25:
1253-1264. Yuasa, K., Kamaishi, T., Hatai, K., Bahnnan, M. and Borisuthpeth, P. 2008. “Two cases of streptococcal infections of
cultured tilapia in Asia.” In Diseases in Asian Aquaculture VI. Fish Health Section. Edited by Bondad-Reantaso, M.G., Mohan, C.V., Crumlish, M. and Subasinghe, R.P. pp. 259-268. Manila, Philippines: Asian Fisheries Society.
Zhou, S.M., Xie M.Q., Zhu X.Q., Ma Y., Tan Z.L., and Li A.X. 2008. “Identification and genetic characterization of Streptococcus iniae strains isolated from diseased fish in China.” Journal of Fish Diseases. 31: 869–875.

INTERNATIONAL FOOD POLICY RESEARCH INSTITUTE | 1201 Eye Street, NW | Washington, DC 20005-3915 USA T: +1.202.862.5600 | F: +1.202.862.5606 | Email: [email protected] | www.ifpri.org
IFPRI-ACCRA | c/o IWMI, PMB CT 112 • Cantonments, Accra, Ghana | CSIR Campus (Opposite Chinese Embassy) • Airport Residential Area | T: +233 (0) 302 780 716 • F: +233 (0) 302 784 752 | gssp.ifpri.info
The Ghana Strategy Support Program (GSSP) is managed by the International Food Policy Research Institute (IFPRI) and is financially supported by the United States Agency for International Development (USAID). The research presented here was conducted as part of the CGIAR Research Program on Policies, Institutions, and Markets (PIM), which is led by IFPRI. This publication has been prepared as an output of GSSP and has not been independently peer reviewed. Any opinions expressed here belong to the author(s) and do not necessarily reflect those of IFPRI, USAID, PIM, or CGIAR. Copyright © 2018. Remains with the author(s). All rights reserved.
IFPRI is a CGIAR Research Center | A world free of hunger and malnutrition
About the Author(s)
Catherine Ragasa is a Research Fellow in the Development Strategy and Governance Division (DSGD) of IFPRI, Washington, DC. Kwaw S. Andam is a Research Fellow in DSGD of IFPRI working in the Ghana Strategy Support Program (GSSP), based in Accra. Doreen Kufoalor and Sena Amewu both are Research Officers in DSGD of IFPRI working in GSSP, based in Accra.
Acknowledgments
The authors thank Ministry of Fisheries and Aquaculture Development (MoFAD), Fisheries Commission, Ghana Aquaculture Association (GAA), Water Research Institute, Aquaculture Research and Development Centre, Raanan Fish Feed Limited, farmers, feed distributors, fish traders and other stakeholders who graciously gave us their time for interviews. We also thank Ruby Asmah, Seth K. Agyakwah, Karl Pauw, Noora-Lisa Aberman, and Todd Benson for providing feedback and editing earlier versions of the paper. Much gratitude also goes to participants in the IFPRI Ghana Strategy Support Program (GSSP) Policy Dialogue in September 2017 and in the fish sector seminar in October 2017 for helpful comments. The authors acknowledge the United States Agency for International Development (USAID) for its support for this study under the Ghana Strategy Support Program. The usual disclaimers apply.