a bioengineered approach for sustainable crude oil
TRANSCRIPT
A BIOENGINEERED APPROACH FOR SUSTAINABLE CRUDE OIL POLLUTION
TREATMENT VIA ENTRAPMENT, DISPERSAL AND REMOVAL USING NANO-
CARBOSCAVENGER
BY
ENRIQUE ALEJANDRO DAZA
THESIS
Submitted in partial fulfillment of the requirements
for the degree of Master of Science in Bioengineering
in the Graduate College of the
University of Illinois at Urbana-Champaign, 2015
Urbana, Illinois
Adviser:
Professor Dipanjan Pan

ii
ABSTRACT
Aqueous petroleum contamination continues to threaten life-dependent bodies of water
and surrounding ecosystems including human habitation. It is now well established that most
methods of petroleum remediation are either inefficient or involve highly toxic chemical
dispersants. In this work we adopt a commercially-amenable nanotechnology based approach to
design tunable, biodegradable particles for efficient and safe petroleum remediation.
Exhaustively characterized 100 nm sized hybrid dual-shelled polymeric (PS275-b-PAA50)
and carbon-cored nanoarchitectures (Nano-CarboScavengers or NCS) were derived
predominantly from natural carbohydrate sources and designed for a multipurpose oil
sequestration and dispersion agent that is environmentally undisruptive. NCS distribution on
crude oil contaminated water was found to combine both absorption and dispersion mechanisms
to treat a maximum of 80% of the pollution, while NCS distribution on a petroleum distillate
mixture efficiently treated 91% of the pollution by absorption alone.
NCS exposure to Zebrafish, Vibrio fischeri, and MCF-7 were performed in vitro and
were found to be remarkably un‐inhibitive with LD50: 8 g/L, EC50: 1.28 g/L and IC50: 4 g/L
respectively. This far exceeds expected NCS exposure (ENE) of 1x10⁻⁵
g/L in bodies of water.
Finally, NCS degraded in the presence of human myeloperoxidase (HMPO) and horseradish
peroxidase (HRP), suggesting any incidental biological uptake can be enzymatically digested in
living systems.

iii
Dedicated to my Brother and Fellow Engineer
Brandon Clore
iv
ACKNOWLEDGMENTS
This project would not have been possible without the support of many important and
influential individuals. Many thanks to my adviser, Prof. Dipanjan Pan, who guided my work
and gave me the support I needed to continue powering through this project. Also, thanks to my
project collaborators Dr. Santosh Misra, Nicholas Kolmodin, and Christine Promisel as well as
the rest of the Pan Lab Research Group (MatMed Team) at the University of Illinois, Urbana-
Champaign. Thank you to the University of Illinois Graduate College Fellowship, the Support
for Under-Represented Groups in Engineering (SURGE) Fellowship, and the Institute for
Sustainability Energy and Environment for funding my research endeavors. And finally, thanks
to my mother, my fathers, my sister, my brother, my close friends, and endless caffeine who
offered support through such a challenging feat.
v
TABLE OF CONTENTS
CHAPTER 1: INTRODUCTION ………………………...………………………………………1
CHAPTER 2: CURRENT STATE-OF-THE-ART……………………………………..…….…..4
CHAPTER 3: RESULTS AND DISCUSSION…………………………………………...……..10
CHAPTER 4: CONCLUSION…………………………………………………..………………36
METHODS………………………………………………………………………………………40
REFERENCES………………………………………………………………………………..…48

1
CHAPTER 1
INTRODUCTION
1.1 AN OVERVIEW OF PETROLEUM SPILLS
While petroleum is a necessity in today’s modern world1, its production is not free of
harm. As the demand for petroleum continues to rise, we will see a rise in petroleum
transportation traffic2,3
which will inevitably lead to an increase in the possibility of aqueous
crude oil spills, land spills, and fracking byproduct based pollution.1,4–12
An example was
recently seen with the May 19th
, 2015 Santa Barbara oil spill13
. Oceanic spills in 2014 recorded
a total of 4,000 tons of crude oil lost to the environment14
with cleanup costs ranging from
USD12 million to billions6 due to the complex hydrocarbon makeup of various petroleum
grades, sulfur content, and insoluble dirt15,16
which makes the remediation process difficult.
Many manual large scale recovery tactics, such as skimmers paired with booms and suction,
partially alleviate the issue, but leave residual ecologically hazardous hydrocarbon layers on the
micrometer scale17
. This layer is sufficient to prevent sun rays from penetrating a bulk body of
water and hindering O2 mixing, causing a drastic decrease in respiration and photosynthesis in
aquatic ecosystem5,7
. This hindrance means these types of disasters will continue to cause
environmental harm to flora and fauna‐reliant ecosystems even post mass remediation.

2
1.2 DISPERSANTS
Chemical dispersants are a widely adopted substitute used today to treat aqueous oil spills
in massive quantities which do not leave the aforementioned residual layers of floating
petroleum18,19
. Dispersants are made from a cocktail of chemical surfactants including
emulsifiers and detergents used to lower the surface tension between the petroleum and the water
interface20
. This approach is combined with turbulent wave motion to envelop petroleum into
micrometer sized beads, which can then diffuse into the water column21
(Schematic 1). The
process is essential to stop the surface spread of petroleum from reaching beaches and marine
life or becoming susceptible to igniting20
.
Schematic 1: Schematic representation of the mechanism of dispersants on crude oil.
1
2
3
Oil Slick
Dispersant
Surfactant
Interface Hydrophilic
Hydrophobic
Oil
3
1.2.1 Bacterial Bioremediation Aided by Dispersants
Dispersing petroleum into the water column may seem like a poor alternative, but there
are many strains of petroleum digesting microorganisms, such as Alcanivorax borkumensis22
and
Thalassolituus oleivorans23
, that can turn the pollutant into natural byproducts24–28
. Typically
hydrocarbon-degrading bacteria compose 1% of environmental microbiome, but at the first sign
of crude oil leakage into soil or aquatic environments these organisms exponentially grow up to
10% of the bacterial population24
. At first, the plume of crude oil forms emulsions of large
droplets which take a long time to digest by bacteria due to low surface area to volume ratios, but
dispersed hydrocarbons droplets have reduced water interfacial tension and thus form smaller
droplets for faster digestion. Most strains of hydrocarbon degrading bacteria create their own
bio-surfactants, however not in volumes necessary to disperse large spills. Thus, the ability to
disperse petroleum can yield positive results.
1.2.2 Problems Stemming from Dispersants
Unfortunately, studies have shown that the chemicals used for dispersion cause a
synergistically toxic emulsion as found by many studies29–35
. In 2010, 7 million liters of Corexit
EC9500A, a brand named dispersant, was used at the Deepwater Horizon Oil Spill well head29
.
This raised ethical issues about its use in such large quantities, let alone treated directly at the
well head, and sparked many toxicity studies thus exposing its environmental hazards. Protesters
in Santa Barbara have emphasized the dangers of treating the current spill with chemical
dispersants, but the option has not yet been ruled out36
. Despite the harm caused by chemical
dispersants, the mechanism of crude oil dispersion can be applied towards designing an efficient
and safer alternative.
4
CHAPTER 2
CURRENT STATE-OF-THE-ART
2.1 LARGE SCALE REMEDIATION
As discussed earlier, any kind of petroleum spill can become very costly to clean up due
to resources, machines, and workers, combined with the need to remove pollutants quickly to
prevent spread and wild life contamination6. The first response to an oil spill in a large body of
water is to drag large booms, a floating barrier, across the polluted sites between two boats or
skimmers. This collected petroleum is then scooped or vacuumed out of the water and processed
for industrial use. Any residual petroleum can be chemically dispersed or left for bioremediation.
If the petroleum reaches the shore or originates at a land based well or fracking site, then the
common method for cleanup is to simply scoop the sand or dirt away from inhabited sites and
stored where it cannot pollute ground water37
.
New technologies are being proposed constantly for cheaper, quicker, and more efficient
oil spill remediation. Many porous sorbent materials38–42
, sponges43–47
and meshes48–51
(Table 1)
are used to manually separate the hydrocarbons from waters. Some of these materials have
achieved highly efficient loading capacities and reusability with high durability during use in
harsh environments. Unfortunately, these technologies must be used manually and are not yet
suitable for cleaning up such large volumes of crude oil.

5
2.2 IMPORTANCE OF HYDROPHOBICITY
Apart from large scale treatments and chemical remediation, nanotechnology based
materials have been considered as appropriate substitutes. As such, many novel petroleum
extraction nanomaterials with varying mechanisms exist. This list includes gels52–55
,
nanoparticles56
, nanowires41,57
, and magnetic composites58–61
(Table 1).
Almost all of the previously mentioned technologies are created with a theme designed
around hydrophobicity as a main characteristic. The reason being is that petroleum based
pollution is highly insoluble in water and thus oil absorbing materials must carry hydrophobic
attributes for efficient interactions of target hydrocarbon contaminants, especially in polar
environments such as water. In particular, hydrophobic and superhydrophobic materials are the
main focus of recently developed gels55
, iron particles59,61
, and sponges47
for oil based
absorption. Zhu et al47
. recently developed such a sponge with high durability and high oil
absorption capabilities. The study introduced a super hydrophobic polysiloxane coating to a
porous polyurethane sponge and successfully absorbed purified oils. Although materials such as
these are efficient in vitro, they do not take into account the various compositions and
miscellaneous compounds found in petroleum spills such as dirt, sulfur and the variable chain
length and complexity of hydrocarbons15,16,62–66
. Additionally, many fabrication materials and
methods become costly barriers to commercial translation and are thus hindering its possibility
for oil spill remediation.

6
2.3 NANOSHELLED MATERIALS
A particularly novel technique incorporated into nanomaterials used for oil sequestration
is the use of amphiphilic hybrid core/shell structures which can add additional features such as
aqueous dispersion59–61,67,68
. Wang et al61
. entrapped negatively charged iron microparticles
within micellar arrays and used this nanomaterial for soil washing and removing hydrophobic
organic compounds from media. This particle was very efficient in attracting the tested oils;
however its loading capacity was low. A more sophisticated shelled nanoparticle tested for
crude oil treatment is a self-assembled magnetic/polymer hybrid, which uses cross-linked
superhydrophobic iron oxide nanoparticles for hydrocarbon entrapment or weathered crude oil
and subsequent magnetic recovery. Although these materials have improved nanomaterial
functionality with the introduction of a core/shell structure, cost and fabrication barriers exist.
Additionally, only weathered crude oil (crude oil where corresponding lighter distillate
compositions are allowed to evaporate) was tested in this study, so smaller and lighter chain
interactions were not investigated. In all nanomaterials, such as the previous two examples,
where powder distribution is the method for treatment we must assume a less than 100%
recovery of nanoparticles used and thus quantify its potential environmental impact given that
previous studies have shown hazardous fallout from nanomaterials in ecological habitats69–72
.
This aspect is consistently overlooked with many materials awaiting commercial
translation which emphasizes the need for separation from current toxic substitutes such as
chemical dispersants. Thus, these concerns pose a challenge for the makeup of a nontoxic, cheap
and commercially viable product.

7
Material Scale Mechanism Reference
Porous materials Macro Porous Sorption 38–42
Sponges Macro Absorption 43–47
Meshes Macro, Micro, Nano Filtration 48–51
Gels Macro, Micro Sorption 52–55
Nanoparticles Nano Absorption, Filtration 56
Nanowire Nano Absorption, Filtration 41,57
Magnetic
Composites
Micro, Nano Absorption 58–61
Table 1: List of various macro- and nano- materials used for petroleum pollution
remediation.

8
2.4 THE CURRENT UNMET NEED AND PROPOSED SOLUTION
With such a diverse and fragile ecosystem a clear unmet need is to seek an ecologically
safe and efficient material designed for petroleum treatment. Towards this aim we propose a
nanotechnology-enabled carbon-cored nano-architecture derived predominantly from natural
carbohydrate sources for minimal environmental disruption and an amphiphilic dual shelled
approach for a multipurpose oil sequestration and dispersion agent.
2.4.1 Design
In order to effectively treat petroleum contaminated bodies of water with nanoparticle
technology, we must evaluate the requisites to target such hydrocarbon based pollution on the
molecular level, while keeping environmental impact as a priority. A carbon core with a
hydrophobic/amphiphilic dual-shelled structure was designed (Schematic 2) with required
characteristics for petroleum treatment of various grades, compositions, and distillate varieties.
Recovery of waste by booms after treatment is an essential part to keeping an undisturbed
environment, thus buoyancy and accumulation of particle and its insolubility within polar
environments was considered when choosing materials. Not all of the components of crude oil
can be absorbed within a nanoarchitecture framework, thus the entire particle was also designed
to also act as a dispersant to remove additional remnants of un-absorbed pollutant from the
surface of the water and to counteract any residual hydrocarbon micrometer layers from forming.
To the best of our knowledge a dry form powdered nanodispersant has not yet been explored.
Thus we were motivated to create the first multipurpose solid state/powdered material for crude
oil dispersion by bioengineering the framework of the particle.

9
Schematic 2: Graphical representation of the preparation and treatment of the Nano-
CarboScavenger. Nectar agave is used as the main carbon source to produce a carbon
nanoparticle core. Pentacosadiynoic acid is then thermally crosslinked to the carbon core and
coated with a self-assembling amphiphilic block polymer. The NCS can then be distributed
across oil contaminated surfaces in dried powder form where long chain hydrocarbons are
immediately dispersed into water column and short chained hydrocarbons are absorbed within
NCS. The block length shown has representative numbers, whereas the block length used in
this study is PS275-b-PAA50.
10
CHAPTER 3
RESULTS AND DISCUSSION
3.1 SYNTHESIS AND CHARACTERIZATION
3.1.1 Core and Inner Shell
The carbon core was derived from nectar agave, a bio-based starting material, which is a
common sweetener composed of mainly fructose and other carbohydrate sources73
. This basis
allows for an easily modifiable surface for further addition of functional components, as studied
by Mukherjee et al.74
. As previously mentioned, the hydrophobicity of the entire particle is
necessary to drive absorption for any surrounding complex insoluble hydrocarbons that can be
found in petroleum. Thus, the initial shell surrounding the carbon core must be composed of a
hydrophobic residue. A fatty acid 10, 12-Pentacosadyinoic acid (PCDA) was selected to
compose the initial shell not only for its hydrophobic nature, but also for it’s more common use
as a crosslinker75–77
. PCDA’s crosslinking ability has been characterized as
photopolymerization78–80
, using light energy for polymer bond formation, but its thermal
crosslinking ability has not been studied in depth to the best of our knowledge. The synthesis of
carbon core began by heating agave and water with PCDA until all water evaporated, and we
predicted a stable functionalization of PCDA during particle formation. To analyze PCDA
crosslinking, samples were extracted at several time points during hydrothermal synthesis and
measured using Ultraviolet-visible spectroscopy (UV-VIS) (Figure 1). UV-VIS is a fundamental
technique used to measure absorbance or reflectance across a wavelength gradient in the

11
ultraviolet and visible light spectrum. The increase in absorbance peak intensities indicates
polymerization of PCDA and thus successful crosslinking. Particles are then suspended in
tetrahydrofuran (THF) due to newly acquired hydrophobicity and in preparation for further
functionalization.
Dynamic Light Scattering (DLS) is used to measure size of nanoparticles by using
monochromatic laser light scattering of particles in solution with respect to Brownian motion and
time. The laser light scattering intensity fluctuates with destructive or constructive interference
from surrounding particles which can be analyzed by an autocorrelation function to explain size
on a nano-scale. Thus DLS measurements indicated PCDA shelled carbon cores averaged a
diameter of 8 ± 3 nm with a poly dispersity index (PDI) of 0.39 ± 0.01 (Figure 2). Unfortunately,
this organic suspension made anhydrous state characterization techniques difficult to perform but
suspended techniques such as DLS and UV-VIS more viable.
Figure 1: UV-VIS spectrophotometer absorbance measurements of PCDA thermally
crosslinking on to carbon core.
12
3.1.2 Outer Shell Synthesis and Characterization
The amphiphilic diblock copolymer Poly(Styrene)281-block-Poly(Acrylic Acid)49 (PS275-
b-PAA50) was chosen to compose the outermost shell for its ideal hydrophobic polystyrene block
that would aid self-assembly onto the previously synthesized single shelled hydrophobic carbon
core. The self-assembly of this amphiphilic polymer has been thoroughly studied before81–89
and
thus we assume a uniform coating which was further characterized as discussed below.
Additionally, the long styrene chain serves to increase loading capacity and expansion potential
for hydrocarbon absorption and the low density of styrene also adds to NCS buoyancy needed
for easy recovery and polar insolubility. The residual acrylic acid groups are the source for
dispersion of aliphatic groups that are too large or complex for absorption as is found in
unrefined crude oil62,64
. This amphiphilic group also aids in interactions with subsurface dwelling
petroleum layers within a shallow water column90
.
The polymeric self-assembly of the second shell is performed in an organic (THF) to
polar (carbon filtered water) solution titration of polymer and hydrophobic carbon cores. The
residual THF is removed by rotary evaporation to create particle suspension in a purely polar
solvent. The suspension was measured by DLS to monitor size increase and it was found that
particles grew to 115 ± 25 nm in hydrodynamic diameter (Figure 2).

13
For functional evaluation purposes the NCS suspension was dried in a vacuum desiccator
for four hours and collected for further characterization and petroleum treatment. Further
characterization of the dual-shelled hybrid carbon-cored nano architectures involved various
techniques for a thorough understanding of NCS composition, shape, and surface chemistries.
After hydrodynamic size has been established through DLS, transmission electron microscopy
(TEM) was used to assess anhydrous state morphologies and shape to determine characteristics
of the shells.
TEM exposes samples to a high voltage electron beam and captures the intensity of
electrons transmitted through the sample for a high resolution image at a nano scale. Thus, a
Figure 2: Overlaid number averaged hydrodynamic diameter DLS histograms of NCS in
water and PCDA-coated carbon core measured in THF.

14
TEM image of the NCS (JEOL 2100 Cryo TEM, Gatan UltraScan 2k × 2k CCD) gave a clear
depiction of the shells, which appeared as rings and dense carbon core (Figure 3). The styrene
layer of the block co-polymer coating appears as a bright white ring due to the lower density
followed by a darker outer ring being the slightly denser acrylic acid residues. Additionally,
ImageJ analysis was performed on TEM images as a method of sizing dried particle and
produced diameters (Dah) of 109 ± 21 nm. For TEM measurements, 146 individual particles were
counted out of 5 images.
Tapping mode Atomic Force Microscopy (AFM) is an additional characterization
technique that uses a laser reflecting off of a cantilever to measure in the z axis by tapping the
samples with a micron sized tip oscillating at frequency controlled by piezoelectric material.
Thus, AFM was used to characterize anhydrous state morphologies and height of the NCS
particles. AFM images depict a spherical morphology (Figure 4) with average height (Hav)
measured at 111 ± 25 nm. The TEM and AFM size analyses were found to be slightly smaller
than the hydrodynamic diameter (Dav, DLS), presumably due to the flattening of the bushy
polymer chains on the TEM/AFM grids and attributed to the loss of hydrodynamic size during
the dehydration process.
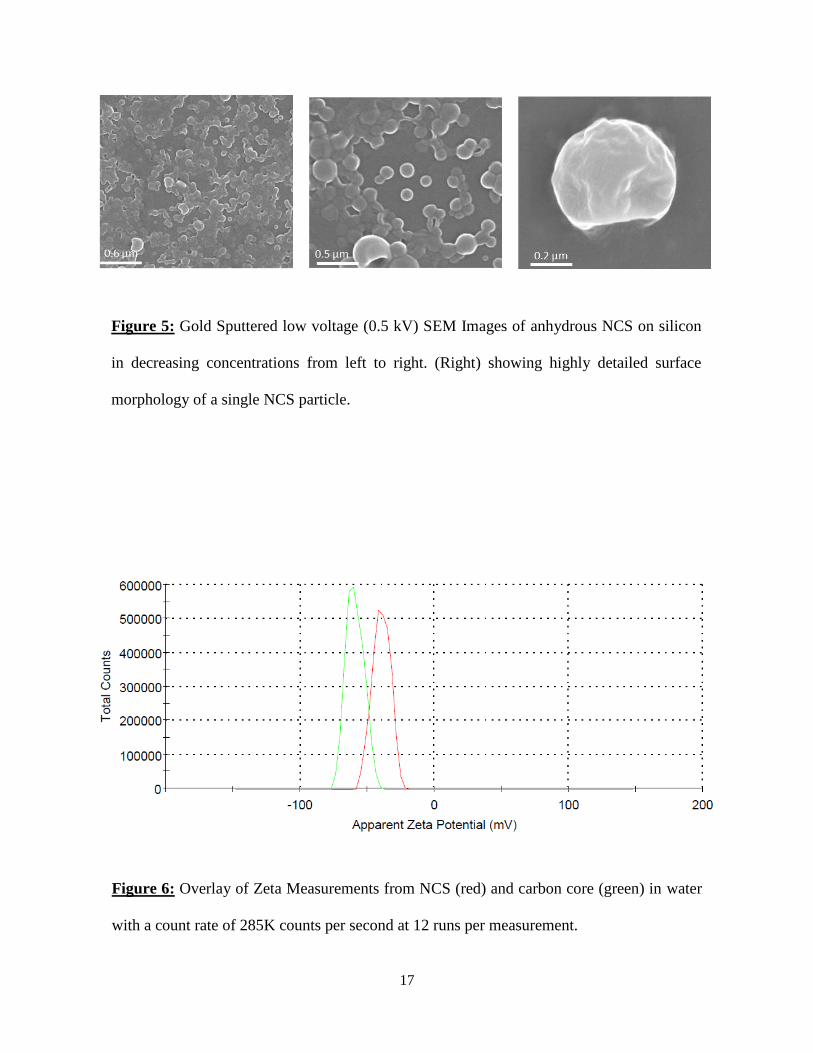
Scanning Electron Microscopy (SEM) is used to measure electron scattering off of
samples through low voltage electron beam exposure and thus is a great technique for visualizing
surface topography of NCS particles. Images were taken after gold sputtering of samples for 30
seconds to increase contrast, which helped to show spherical morphologies amongst a high
concentration of NCS particles (Figure 5).

15
To ensure the PS275-b-PAA50 truly self-assembled with acrylic acid blocks on the outer
surface, we measured the electrophoretic potential (, zeta) of NCS which predicts the electrical
potential around theparticle surface relative to the potential of the dispersion medium. Zeta
measurements on both the carbon core and NCS showed a high negative surface charge (-60 ± 6
mV to -40 ± 6 mV) (Figure 6) confirming the presence of acrylic acid groups. The increase in
negative surface potential from PCDA-coated carbon cores to NCS was possibly due to the
presence of high block chain length of the styrene groups which has uncharged characteristics. It
is known that a high negative Zeta potential reveals great stability and thus shells are assumed to
stay intact during use91,92
.
Energy-dispersive X-ray spectroscopy (EDX) uses X-ray excitation to analytically
determine elemental composition. EDX spectroscopy on both the NCS and carbon core showed
elemental integrity in both samples with significant increase in the oxygen peak post polymer
coating (Figure 7) which can be explained by the addition of oxygen side groups from the PS275-
b-PAA50. UV-VIS analysis on the component groups of NCS showed an additional peak post
coating (Figure 8), which is characteristic of the added block polymer groups.

16
0.5 μm
0.2 μm
Figure 3: TEM Images of NCS on carbon coated TEM grids. (Left) A high voltage (125 kV) image
of NCS with a insert zoomed in to detail shells. (Right) A lower voltage TEM Image (80 kV)
showing higher densities of NCS particles.
Figure 4: Tapping mode AFM Images of anhydrous NCS on freshly cleaved mica. Scale
bar indicates height intensities in nanometers.
17
Figure 5: Gold Sputtered low voltage (0.5 kV) SEM Images of anhydrous NCS on silicon
in decreasing concentrations from left to right. (Right) showing highly detailed surface
morphology of a single NCS particle.
Figure 6: Overlay of Zeta Measurements from NCS (red) and carbon core (green) in water
with a count rate of 285K counts per second at 12 runs per measurement.

18
Figure 7: EDX elemental analysis of carbon core (left), and NCS (right). Orange arrow
shows oxygen peak in both analysis.
Figure 8: A UV-VIS Spectrum analysis (200 nm to 550 nm) of NCS (red), Carbon core
(blue), and PS275-b-PAA50 (black) denoted as BP for block polymer.

19
Figure 9: Wide angle X-ray scattering (WAXS) and small angle X-ray scattering (SAXS)
studies on carbon core and NCS particles. Representative plots of powder WAXS pattern
from (a) NCS and (b) carbon core and SAXS pattern of (c) NCS and (d) carbon core
particles. Variation in d-spacing patterns with change in surface coating in case of carbon
core particles.
20
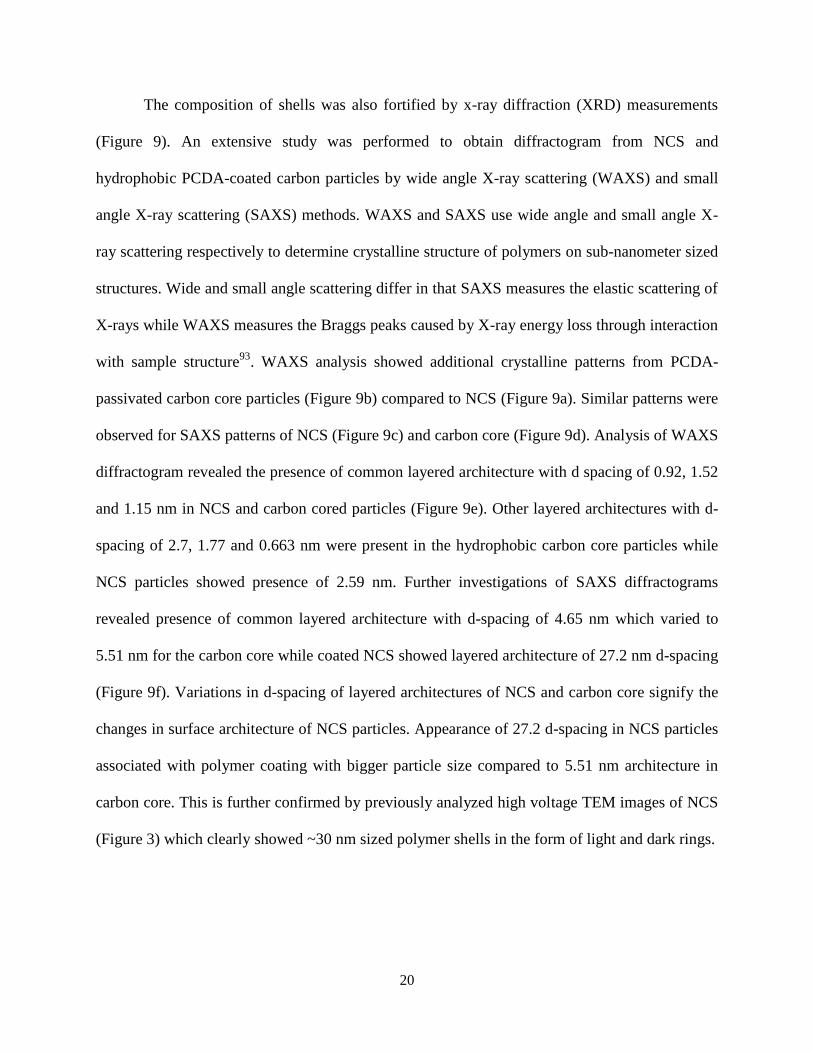
The composition of shells was also fortified by x-ray diffraction (XRD) measurements
(Figure 9). An extensive study was performed to obtain diffractogram from NCS and
hydrophobic PCDA-coated carbon particles by wide angle X-ray scattering (WAXS) and small
angle X-ray scattering (SAXS) methods. WAXS and SAXS use wide angle and small angle X-
ray scattering respectively to determine crystalline structure of polymers on sub-nanometer sized
structures. Wide and small angle scattering differ in that SAXS measures the elastic scattering of
X-rays while WAXS measures the Braggs peaks caused by X-ray energy loss through interaction
with sample structure93
. WAXS analysis showed additional crystalline patterns from PCDA-
passivated carbon core particles (Figure 9b) compared to NCS (Figure 9a). Similar patterns were
observed for SAXS patterns of NCS (Figure 9c) and carbon core (Figure 9d). Analysis of WAXS
diffractogram revealed the presence of common layered architecture with d spacing of 0.92, 1.52
and 1.15 nm in NCS and carbon cored particles (Figure 9e). Other layered architectures with d-
spacing of 2.7, 1.77 and 0.663 nm were present in the hydrophobic carbon core particles while
NCS particles showed presence of 2.59 nm. Further investigations of SAXS diffractograms
revealed presence of common layered architecture with d-spacing of 4.65 nm which varied to
5.51 nm for the carbon core while coated NCS showed layered architecture of 27.2 nm d-spacing
(Figure 9f). Variations in d-spacing of layered architectures of NCS and carbon core signify the
changes in surface architecture of NCS particles. Appearance of 27.2 d-spacing in NCS particles
associated with polymer coating with bigger particle size compared to 5.51 nm architecture in
carbon core. This is further confirmed by previously analyzed high voltage TEM images of NCS
(Figure 3) which clearly showed ~30 nm sized polymer shells in the form of light and dark rings.

21
3.2 EFFICIENCY
Our strategy for assessing oil spill treatment efficiency involves treating crude oil and
petroleum distillate polluted water samples with powdered NCS and assessing particle loading
capacity and any residual dispersed carbon signatures within the water column. The process
involved adding crude oil or petroleum distillates to carbon filtered pure water samples, which
were then treated with NCS by powder distribution at varying masses to visualize gradual
treatment performance. Post exposure to NCS, samples were placed on a rocking platform
(VWR) at 5 rpm for two hours to resemble turbulent surface wave movement in large bodies of
water94,95
. In all cases pristine NCS and crude oil absorbed NCS accumulated into a floating
clump for easy recovery post treatment (Figure 10a), while only in the crude oil sample,
dispersed oil stayed suspended in the water column (Figure 10b). Post recovery, the NCS clump
had visually changed size and color depending on the amount of oil absorbed and composition of
petroleum. The container, NCS clump, and residual water went through a thorough mass balance
to measure absorption and dispersion capabilities. First, NCS mass pre and post treatment was
mass balanced to measure any absorbed petroleum. Then, residual water with dispersed and
solubilized contaminants is underwent Total Organic Carbon (TOC) analysis to measure mg per
ml of organic carbon present. Finally, the difference in container mass pre and post use serves as
a control or “treatable oil” versus “total oil”, which combined with previous mass balancing is
also used to factor out any NCS that may have been solubilized in the water column.
22
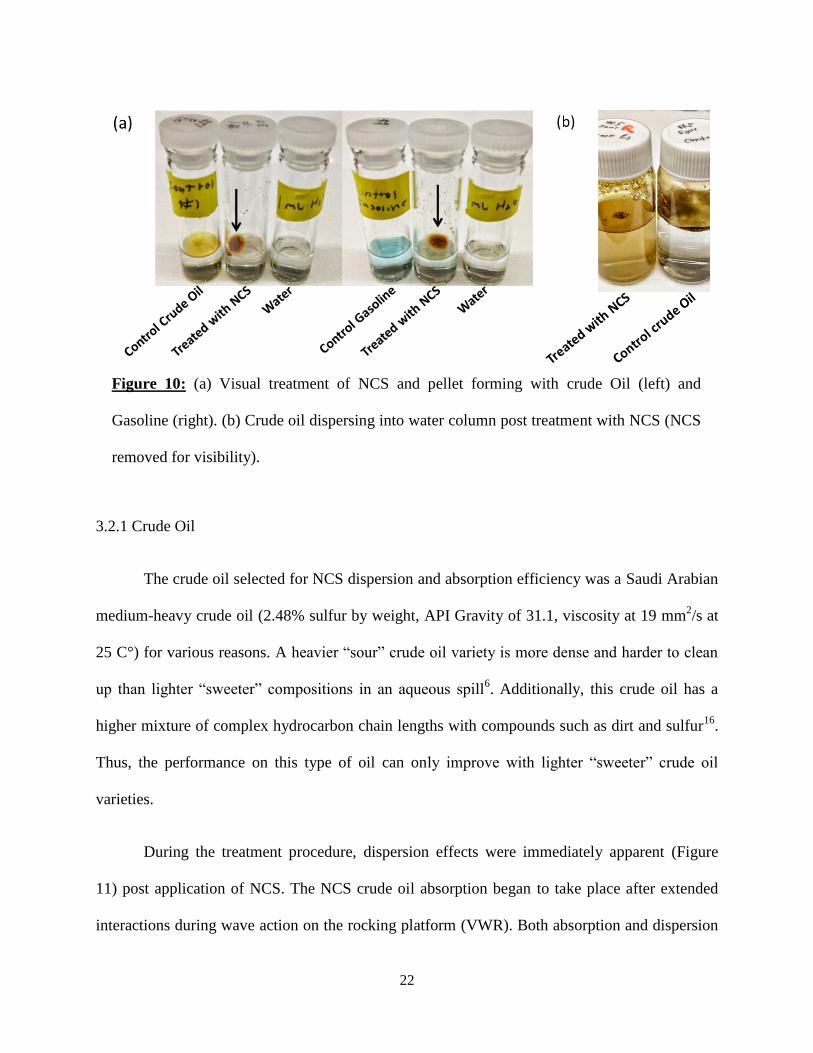
3.2.1 Crude Oil
The crude oil selected for NCS dispersion and absorption efficiency was a Saudi Arabian
medium-heavy crude oil (2.48% sulfur by weight, API Gravity of 31.1, viscosity at 19 mm2/s at
25 C°) for various reasons. A heavier “sour” crude oil variety is more dense and harder to clean
up than lighter “sweeter” compositions in an aqueous spill6. Additionally, this crude oil has a
higher mixture of complex hydrocarbon chain lengths with compounds such as dirt and sulfur16
.
Thus, the performance on this type of oil can only improve with lighter “sweeter” crude oil
varieties.
During the treatment procedure, dispersion effects were immediately apparent (Figure
11) post application of NCS. The NCS crude oil absorption began to take place after extended
interactions during wave action on the rocking platform (VWR). Both absorption and dispersion
Figure 10: (a) Visual treatment of NCS and pellet forming with crude Oil (left) and
Gasoline (right). (b) Crude oil dispersing into water column post treatment with NCS (NCS
removed for visibility).
23
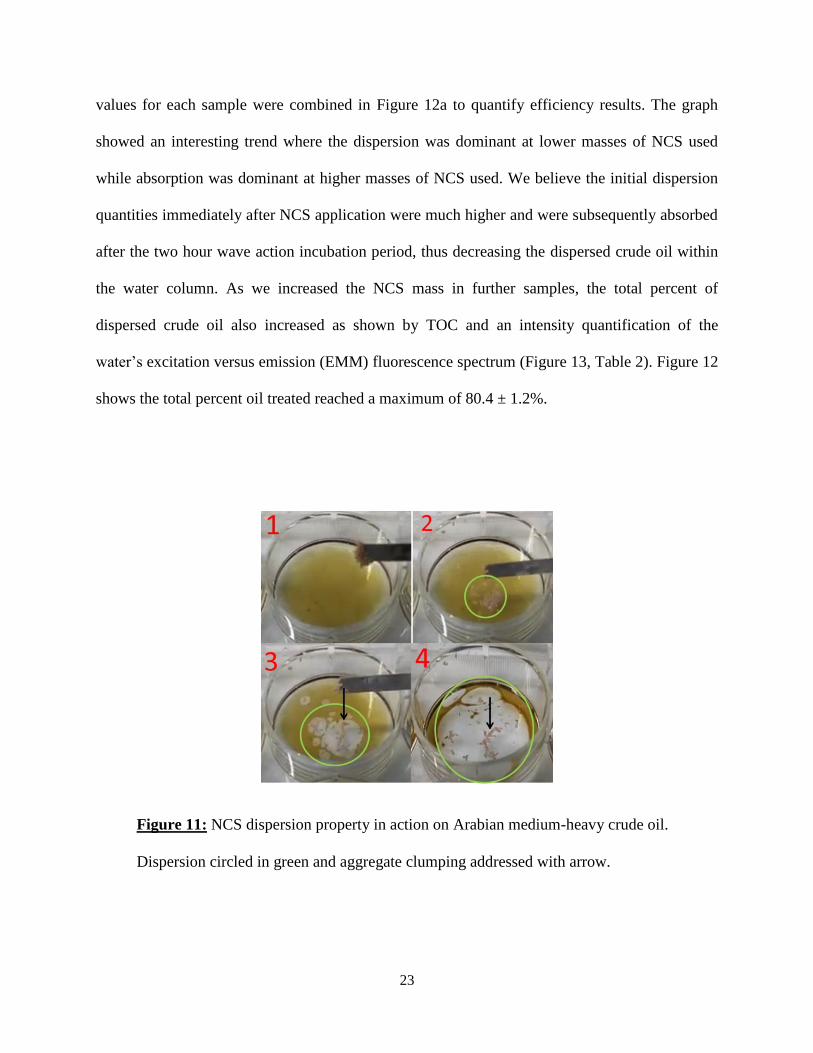
values for each sample were combined in Figure 12a to quantify efficiency results. The graph
showed an interesting trend where the dispersion was dominant at lower masses of NCS used
while absorption was dominant at higher masses of NCS used. We believe the initial dispersion
quantities immediately after NCS application were much higher and were subsequently absorbed
after the two hour wave action incubation period, thus decreasing the dispersed crude oil within
the water column. As we increased the NCS mass in further samples, the total percent of
dispersed crude oil also increased as shown by TOC and an intensity quantification of the
water’s excitation versus emission (EMM) fluorescence spectrum (Figure 13, Table 2). Figure 12
shows the total percent oil treated reached a maximum of 80.4 ± 1.2%.
Figure 11: NCS dispersion property in action on Arabian medium-heavy crude oil.
Dispersion circled in green and aggregate clumping addressed with arrow.

24
(1) (2) (3) (4)
Figure 12: (a) Percentage of crude oil treated by dispersion and absorption. (b) Percent of
total crude oil treated.
250 300 350 400 450 500 550 600 650 700
400
600
800
EM
Wavele
ngth
(nm
)
EX Wavelength (nm)
0.0000.0028870.0057750.0086630.011550.014440.017330.020210.023100.025990.028870.031760.034650.037540.040420.043310.04620
250 300 350 400 450 500 550 600 650 700
400
600
800
EM
Wa
ve
len
gth
(n
m)
EX Wavelength (nm)
0.0000.0028870.0057750.0086630.011550.014440.017330.020210.023100.025990.028870.031760.034650.037540.040420.043310.04620
250 300 350 400 450 500 550 600 650 700
400
600
800
EM
Wa
ve
len
gth
(n
m)
EX Wavelength (nm)
0.0000.0037880.0075750.011360.015150.018940.022730.026510.030300.034090.037870.041660.045450.049240.053030.056810.06060
250 300 350 400 450 500 550 600 650 700
400
600
800
EM
Wavele
ngth
(nm
)
EX Wavelength (nm)
0.0000.0037880.0075750.011360.015150.018940.022730.026510.030300.034090.037870.041660.045450.049240.053030.056810.06060
250 300 350 400 450 500 550 600 650 700
400
600
800
EM
Wa
ve
len
gth
(n
m)
EX Wavelength (nm)
0.0000.0045500.0091000.013650.018200.022750.027300.031850.036400.040950.045500.050050.054600.059150.063700.068250.07280
250 300 350 400 450 500 550 600 650 700
400
600
800
EM
Wa
ve
len
gth
(n
m)
EX Wavelength (nm)
0.0000.0045500.0091000.013650.018200.022750.027300.031850.036400.040950.045500.050050.054600.059150.063700.068250.07280
250 300 350 400 450 500 550 600 650 700
400
600
800
EM
Wavele
ngth
(nm
)
EX Wavelength (nm)
0.0000.0062500.012500.018750.025000.031250.037500.043750.050000.056250.062500.068750.075000.081250.087500.093750.1000
250 300 350 400 450 500 550 600 650 700
400
600
800
EM
Wa
ve
len
gth
(n
m)
EX Wavelength (nm)
0.0000.0062500.012500.018750.025000.031250.037500.043750.050000.056250.062500.068750.075000.081250.087500.093750.1000
Figure 13: EMM Fluorescence images of dispersed crude oil in water with increasing mass
of NCS treatment (left to right). (1) 0 g/L, (2) 1 g/L, (3) 4 g/L, (4) 8 g/L.

25
Figure
13 Image (1) (2) (3) (4)
Area
(a.u.) 1240 3600 5000 5440
Intensity
(a.u.) 336927 1023435 1430561 1530055
3.2.2 Petroleum Distillates
Crude oil can be processed and separated into many gaseous, liquid and solid
compounds66,96,97
such as natural gas, gasoline, lubricating oils, and tar. The various liquid
distillates can pose higher risks in oceanic pollution due to their shorter hydrocarbon chains and
higher solubility in water7,98,99
. Thus a light Louisiana distillate mixture was chosen (0.14%
Sulphur by weight, API gravity 43.2) that included traces of gasoline and naphtha at 32.2 %,
kerosene at 16.3%, gas oil at 11.4%, lubricating distillates at 14.1%, and residuum at 26%.
Post treatment, the absorbed and solubilized quantities of the petroleum distillate were
analyzed (Figure 14a) and unveiled a max loading capacity of 9.9 mg of distillate per mg of NCS
with a max total absorption of treated petroleum at 91.0% (Figure 14b). The higher loading
capacity is thought to come from the lighter and smaller chains present in petroleum distillates
which fit into the polystyrene block segment of the amphiphilic shell. EMM fluorescence
analysis on the treated water also showed a decreasing trend in solubilized hydrocarbon residues
Table 2: Table indicates area and intensity of fluorescent peaks measured by ImageJ in
arbitrary units.

26
which indicates a true removal of contaminants, including subsurface contaminants (Figure 15,
Table 3).
(1) (2) (3) (4)
Figure 14: (a) Loading capacity of NCS measured by mg distillate absorbed per mg of
NCS used, (b) percent of total petroleum distillate treated.
250 300 350 400 450 500 550 600 650 700
400
600
800
EM
Wavele
ngth
(nm
)
EX Wavelength (nm)
0.0000.0061560.012310.018470.024630.030780.036940.043090.049250.055410.061560.067720.073870.080030.086190.092340.09850
Absorbance, 16 mg
250 300 350 400 450 500 550 600 650 700
400
600
800
EM
Wavele
ngth
(nm
)
EX Wavelength (nm)
0.0000.0061560.012310.018470.024630.030780.036940.043090.049250.055410.061560.067720.073870.080030.086190.092340.09850
Absorbance, 16 mg
250 300 350 400 450 500 550 600 650 700
400
600
800
EM
Wavele
ngth
(nm
)
EX Wavelength (nm)
0.0000.0086560.017310.025970.034630.043280.051940.060590.069250.077910.086560.095220.10390.11250.12120.12980.1385
Absorbance, 2 mg
250 300 350 400 450 500 550 600 650 700
400
600
800
EM
Wa
ve
len
gth
(n
m)
EX Wavelength (nm)
0.0000.0086560.017310.025970.034630.043280.051940.060590.069250.077910.086560.095220.10390.11250.12120.12980.1385
Absorbance, 2 mg
250 300 350 400 450 500 550 600 650 700
400
600
800
EM
Wavele
ngth
(nm
)
EX Wavelength (nm)
0.0000.023880.047750.071620.095500.11940.14320.16710.19100.21490.23880.26260.28650.31040.33420.35810.3820
Absorbance, 0.5 mg
250 300 350 400 450 500 550 600 650 700
400
600
800
EM
Wa
ve
len
gth
(n
m)
EX Wavelength (nm)
0.0000.023880.047750.071620.095500.11940.14320.16710.19100.21490.23880.26260.28650.31040.33420.35810.3820
Absorbance, 0.5 mg
250 300 350 400 450 500 550 600 650 700
400
600
800
EM
Wavele
ngth
(nm
)
EX Wavelength (nm)
0.0000.029880.059750.089630.11950.14940.17930.20910.23900.26890.29880.32860.35850.38840.41830.44810.4780
Absorbance control
250 300 350 400 450 500 550 600 650 700
400
600
800
EM
Wa
ve
len
gth
(n
m)
EX Wavelength (nm)
0.0000.029880.059750.089630.11950.14940.17930.20910.23900.26890.29880.32860.35850.38840.41830.44810.4780
Absorbance control
Figure 15: EMM Fluorescence images of solubilized hydrocarbons in water with
increasing mass of NCS treatment (left to right). (1) 0 g/L, (2) 1 g/L, (3) 4 g/L, (4) 16 g/L.
27
Figure
15 Image (1) (2) (3) (4)
Area
(a.u.) 4557 3937 3825 3141
Intensity
(a.u.) 561742 487250 456308 388888
In an effort to further test NCS absorption capabilities of small hydrocarbon chained
petroleum distillates, gasoline was considered because of its high concentration of octane
groups100,101
while being one of the most widely used consumer bought petroleum products102
.
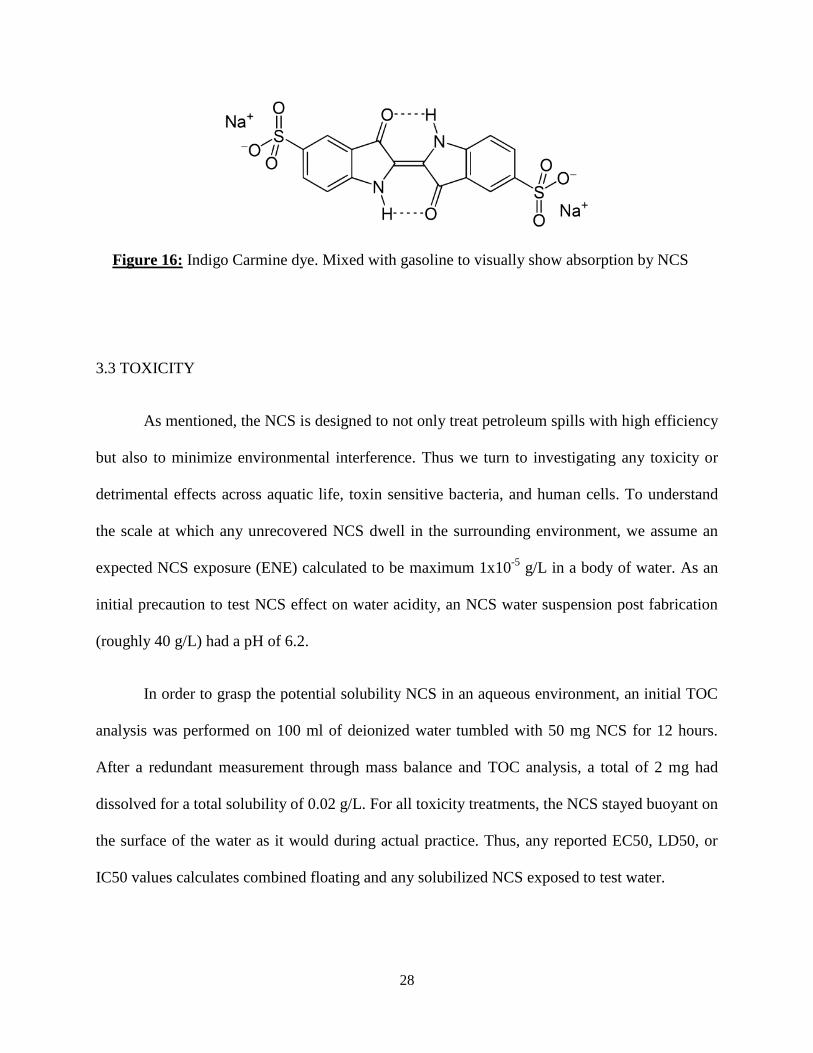
Gasoline was mixed with AmeriColor Blue Oil Dye (Figure 16), a hydrophobic dye, to visualize
any changes on the surface of the sample. The resulting treatment visually demonstrated gasoline
absorption and showed similar clumping as seen with the distillate mixture (Figure 10a).
Hitherto, all samples were tested on carbon purified water, but in order to mimic an
ocean's salinity, a single crude oil, distillate, and gasoline sample experiment were tested on 8 wt
% salt water with the same methods previously mentioned (ratio of 4 mg NCS to 16 mg oil).
Interestingly, this study produced similar results. This is expected since NCS treatment activity
only occurs on the surface of the water and not in the water column.
Table 3: Table indicates area and intensity of fluorescent peaks measured by ImageJ in
arbitrary units.
28
3.3 TOXICITY
As mentioned, the NCS is designed to not only treat petroleum spills with high efficiency
but also to minimize environmental interference. Thus we turn to investigating any toxicity or
detrimental effects across aquatic life, toxin sensitive bacteria, and human cells. To understand
the scale at which any unrecovered NCS dwell in the surrounding environment, we assume an
expected NCS exposure (ENE) calculated to be maximum 1x10⁻⁵
g/L in a body of water. As an
initial precaution to test NCS effect on water acidity, an NCS water suspension post fabrication
(roughly 40 g/L) had a pH of 6.2.
In order to grasp the potential solubility NCS in an aqueous environment, an initial TOC
analysis was performed on 100 ml of deionized water tumbled with 50 mg NCS for 12 hours.
After a redundant measurement through mass balance and TOC analysis, a total of 2 mg had
dissolved for a total solubility of 0.02 g/L. For all toxicity treatments, the NCS stayed buoyant on
the surface of the water as it would during actual practice. Thus, any reported EC50, LD50, or
IC50 values calculates combined floating and any solubilized NCS exposed to test water.
Figure 16: Indigo Carmine dye. Mixed with gasoline to visually show absorption by NCS
29
3.3.1 Vibrio Fischeri
Acute bacterial toxicity testing was performed by a Microtox assay. The procedure
utilizes bioluminescent bacteria, Vibrio fischeri, and measures toxicity based on the reduction of
light produced by the bacteria exposed to sample materials. This procedure is a standard method
for acute toxicity testing and is desirable due to high throughput, it’s sensitivity to a wide range
of compounds, and its comparability to other toxicity tests103–105
. Multiple samples were
measured at varying concentrations between 8 g/L and 1 g/L of NCS. Each sample was
subsampled at 0%, 9%, 36%, 63%, and 90% of starting concentration with a 5 minute exposure
time before light measurements were performed. The effective concentration which produces
50% maximum response, EC50, was calculated by linear regression and found to be 1.28 g/L.
3.3.2 Safety profile of NCS in 2D-Human Cell Culture
The protocol of NCS uses leads to possibility of leaving traces of NCS in water body and
nearby areas to reach natural drinking water sources. To evaluate the probable effects of such
NCS traces on human health and particularly human cells, a 2D-culture of MCF-7 was exposed
to various concentrations of NCS. Cytotoxicity was measured by MTT reduction assay using
plate reader (Synergy HT, Bio-Tek). IC50 was calculated from percent cell viability at various
concentrations of both the particle formulations was calculated 8 g/L for polymer coated NCS
while for uncoated carbon cores it was found to be ~1 g/L indicating a huge surge in cell
viability upon surface protection of single shelled carbon core particles. These levels were at
least ~ 2x 10⁴ times to be generally used in oil treatment experiments and the ENE (Fig 17a-f),
while at least 105 times higher than the probable amount reaching to water sources. It revealed

30
the highly safe profile of these particles even on being left in traces around the treated water
body and reaching in very drinking water sources.

31
Figure 17. Morphological and growth density variations in human cell culture. Cell toxicity
experiment was performed in MCF-7 cells, plated at a density of 10,000 cells/well in a 96-
well plate. Cells were incubated for 48 h with NCS and hydrophobic carbon core samples at
concentration of 0.0035 to 4.0 mg/ml. Cell density and morphology of treated cells were
visualized by bright field imaging (a-f). Cell toxicity was quantified by MTT assay (g) and
used for calculating IC50 values (h).

32
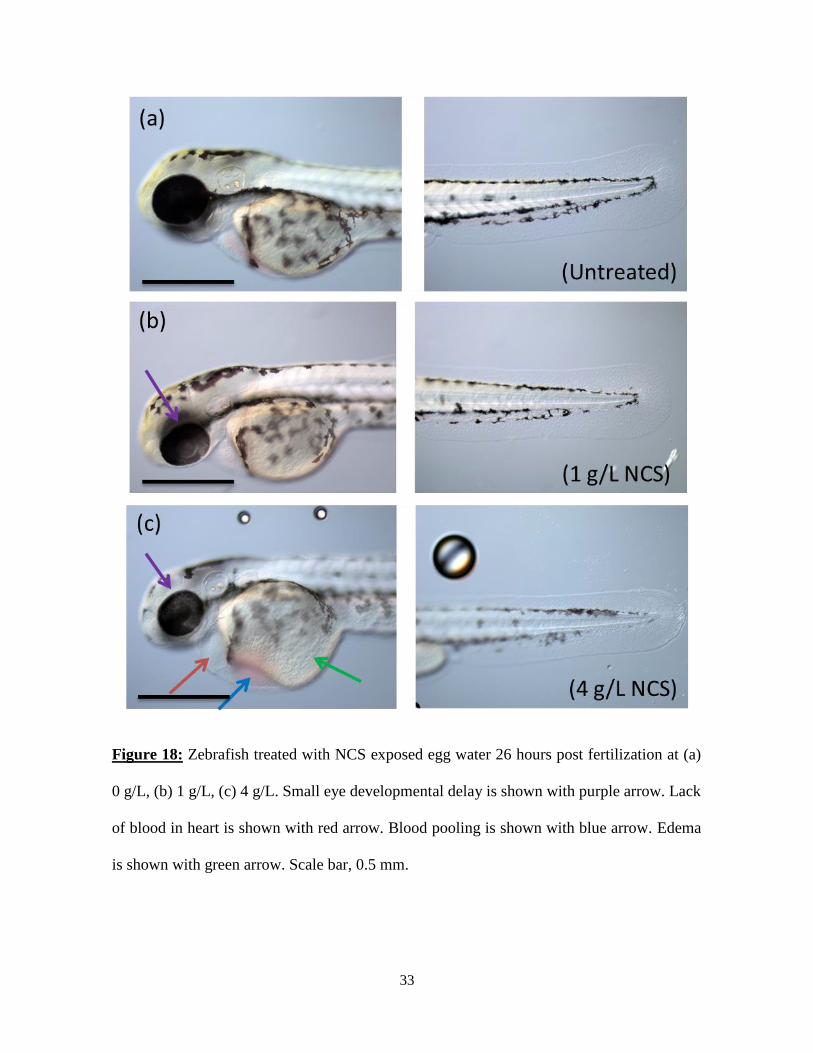
3.3.3 Zebrafish Toxicity Assay
Zebrafish (Danio Rerio) was chosen as a model organism for toxicity testing. This
species has shown to reproduce and develop quickly with transparent characteristics for internal
organ analysis only hours post fertilization106–108
. The zebrafish model is also an ideal vertebrate
aquatic organism, thus any toxic exposure to NCS will closely resemble that of a realistic marine
environment. The egg water (growth media) used to culture zebrafish was exposed to various
concentrations of NCS with an exposure time of 24 hours. Five sets of fifteen wild type embryos
26 hours post fertilization were treated with 5 ml of NCS exposed egg water for 24 hours. Issues
such as hatch inhibition, developmental delay, edema, and blood pooling did not begin to show
until ENE was far exceeded (Figure 18a-c). The LD50 was indicated when 50% of embryo
contained severe symptoms and is calculated at 4 g/L (Figure 18c).
33
Figure 18: Zebrafish treated with NCS exposed egg water 26 hours post fertilization at (a)
0 g/L, (b) 1 g/L, (c) 4 g/L. Small eye developmental delay is shown with purple arrow. Lack
of blood in heart is shown with red arrow. Blood pooling is shown with blue arrow. Edema
is shown with green arrow. Scale bar, 0.5 mm.
34
3.4 ENZYME DEGRADATION
The NCS is designed to be buoyant for easy surface recovery but 100% efficiency in
recovering nanoparticles is quite difficult. Thus, we must assume nanoparticle in pristine state
and/or post interaction with petroleum will stray into unwanted territories. As part of this aim to
create a truly safe nanomaterial, we must consider the possibility of direct interaction with
surrounding flora and fauna and any accidental digestion. Hence, we look at plant and human
enzymatic digestion of NCS.
3.4.1 Degradation in presence of Horse Radish Peroxidase (HRP)
Any disruption in aquatic plant life can lead to a disturbance in the rest of the surrounding
ecology since many organisms and herbivores are dependent on plants as a source of food and
shelter, thus we turn to a common plant digestion enzyme horseradish peroxidase (HRP) and
look at its interactions with NCS, specifically at its potential to be degraded. HRP has been
shown to digest single-walled carbon nanotubes109,110
and thus our procedure follows suit. Due to
the slow nature of HRP enzyme activity, 1 mg/ml of NCS was suspended with 0.5mg/ml HRP in
5 ml of Dulbecco’s phosphate buffered solution and 80 μM of hydrogen peroxide and then
statically incubated at 4 C in the dark. Five samples were prepared to measure control and 1, 2,
4, and 8 week time points.
The molecular morphology of NCS is predicted to break down as carbon structures
become oxidized and transitions associated with sp2 bonds of fresh NCS would reduce. To
measure this change samples were drop-casted onto glass slides and analyzed by Raman
spectroscopy observed between 120 and 2700 nm wavelengths which carry the characteristic G
and D bands found on carbon structures111
. After graphical analyses we found a significant

35
decrease within both of these peaks over extended exposure of enzyme activity indicating
degradation leading to sp2 and sp
3 carbon bond oxidation (Figure 19a).
3.4.2 Degradation in Presence of Human Myeloperoxidase
In the case of residual NCS particles emerging in human food sources we must evaluate
degradation by a human digestion enzyme. We investigated the lysosomal enzyme human
myeloperoxidase (HMPO). Our methods involved preparing five suspensions of 1 mg/ml NCS in
Dulbecco’s phosphate buffered solution and 200 μM of hydrogen peroxide. 100 μg of HMPO
enzyme (activity > 50 units/mg Protein, Sigma) was added to four of the five samples and then
statically incubated at 37 C in the dark. Samples were collected at 6, 12, 24, 168 hours and drop
casted on glass slides for Raman analysis (120 to 2700 nm). Similarly to the HRP degradation,
we found that both the G and D band significantly decreased in intensity indicating a dramatic
change in the NCS sp2 and sp3 bond morphology (Figure 19b).
Figure 19: Enzyme degradation of NCS by HRP (a) and HMPO (b) between 120 and 2700
nm. Operated at 2% laser power for 1 min with a 532 nm laser.

36
CHAPTER 4
CONCLUSION
4.1 CONCLUSION
Here we have disclosed a compelling nanoparticle-based approach to oil spill
remediation, which excels in treatment efficiency while maintaining environmental stability.
These highly characterized NCS have the capability to treat a broad spectrum of petroleum and
corresponding distillate based pollution in salt or non-salt aqueous environments. Post powder
based distribution methods, the NCS was found to selectively absorb short chained hydrocarbons
present in many common petroleum distillates with a high loading capacity. When presented to
crude oil contamination, the NCS was found to initially disperse the pollutant rapidly and then
consecutively absorb it after wave action interactions. Additionally, molecular shells and
powdered application were designed for increased handling during large scale oil spill
remediation that lead to material clumping post treatment for simple recovery by nets or booms
without leaving residual signatures in the aqueous environment.
In any oil spill treatment where nanomaterials are used, any unknown consequential
effects must be carefully studied. As a result, we have extensively considered the potential
interactions and effects caused by NCS with biological organisms if recovery is not 100% in
treated areas. Zebrafish was our first model organism tested for the reason that it is a
characteristic vertebrate marine animal. Exposure of zebrafish egg water to different
concentration of NCS showed an LD50 of 4 g/L. The next step was to test V. fischeri, a standard

37
model bacteria used for acute toxicity testing, in order to quantify effects on smaller biological
organisms. Microtox tests at different NCS concentrations for a 24 hour exposure time showed
an EC50 of 8 g/L. An additional toxicity test was performed on the human breast cancer cell line
MCF-7 for details on NCS safety profile in case of mammalian ingestion. Various concentrations
of NCS were exposed to cultured cells and cells were counted 48 h post exposure. The calculated
IC50 was found to be 8 g/L. In all toxicity tests the effective concentration that caused a 50%
toxic effect, either inhibition or death, far exceeded the ENE and thus we can conclude NCS to
be remarkably un‐inhibitive.
The resulting NCS offers a cheap, non-toxic, and easy to produce material for complex
hydrocarbon cleanup in aqueous environments. Overall treatment effectiveness surpass other
nanoparticle based treatments, as confirmed by TOC analysis, fluorescence studies and other
analytical means, making the NCS a superior substitute.
38
4.2 FUTURE AIMS
The continued research in nanotechnology based petroleum spill treatments has great
potential to improve the efficiency and environmental impact of these novel nanomaterials.
There are still many necessary steps that need to be addressed in depth before commercialization
of the NCS, which will further improve its ability to revolutionize the way we treat our
petroleum contamination. The next studies should focus on optimization of particle design,
material, and treatment efficiency. Simulation studies of small chain hydrocarbon interactions
with several candidate block polymers will help identify the best candidate for dispersion and
absorption during treatment of several types or composition of petroleum pollution. The
crosslinker used as the primary shell for adding hydrophobicity to the carbon core should be re-
investigated for maximizing pull on water insoluble material. A stronger hydrophobic or even
oleophilic, interaction would aid in increasing loading capacity per milligram of NCS. Finally,
the source used to make the carbon core should navigate to a material with high nitrogen and
phosphorous content. A particle with this composition can double as a material used for
bioaugmentation. This is a process used to supply extra nutrients to hydrocarbon degrading
bacteria which enhances bioremediation of petroleum micelles. A great candidate for such a
carbon core can be biomass derived carbon particles, such as algae or biochar112
.
Moreover, the recyclable properties of NCS post recovery will be analyzed for reusability
and retrieving excess petroleum. Recovered powdered NCS and petroleum can lead to an overall
increase of waste material. Thus any refining, processing or redistributing of post treated
petroleum will be investigated such as repurposing as tar such as roofing or asphalt, since they
share similar compositions113
.

39
Currently, meshes44,48–50
are highly reusable and highly efficient for separating oil from
water with low oil contamination, thus increasing the possibility to use recovered petroleum for
industrial processing. In future studies, we will attempt to incorporate the NCS into a mesh for
handheld or scale up use.
Finally, we will explore the possible multi-functionality in aqueous pollution treatment
by testing improved NCS against many types of pollutants. This includes petroleum based
pollution such as fracking water waste, land spill contamination, and even crude oil
compromised animals. We would also expand the pollution cleaning capabilities to separating
bacteria, or other microorganisms from drinking water. And finally, we would like to investigate
NCS ability as a chelator for harmful heavy metal contamination in water and in biologicals.

40
METHODS
Unless stated otherwise, all material and reagents were purchased from Sigma–Aldrich, St.
Louis, MO and were used without further purification. Solvents were used as received and
without further purification.
NCS Synthesis:
The carbon core of the NCS was produced by a hydrothermal method of controlled heating a
suspension of 250 mg/ml of nectar agave (HoneyTree’s Organic Agave Nectar, Onsted, MI) and
37.5 mg/ml of pentacosadiynoic Acid (Sigma-Aldrich, St. Louis, MO) in nanopure water (0.2
um) at 250 degrees C° for 45 minutes or until all water evaporates and product turns black mass.
This residue was then soaked in THF overnight then resuspended by sonication (Q700, Qsonica
Sonicators, Newtown, CT) in an ice bath (to prevent evaporation) for 8 minutes at 1 amplitude
with intervals of 5 seconds on and 3 seconds off. The suspension was filtered through a 0.45 µm
and 0.22 µm PTFE membranes. The suspension was dried out to produce a residue. This residue
and (PS275-b-PAA50) at a 10:2 mass ratio respectively, were resuspended in THF. The volume of
THF used is the minimum required to fully dissolve solutes. Water was then added rapidly at
twice the volume of THF to produce the block polymer coated nanoparticles known as the NCS.
This suspension was placed in a vacuum to dry and then scarped/grinded into powder form.
PCDA Crosslinking:
In a 20 mL scintillation vial, agave nectar (HoneyTree’s® Organic Agave Nectar, Onsted, MI)
and 10,12-pentacosadiynoic acid were mixed in water (4 mL) at concentrations of 250 mg/ml
and 37.5 mg/ml, respectively. The sample was bath sonicated (Branson 1510) for 10 minutes at

41
room temperature and then mechanically mixed (Benchmark Bench Vortex Mixer). The
agave/PCDA that did not dissolve was separated from the suspension. The scintillation vial was
then placed on a hot plate at 250 oC and samples were collected at 0, 4, 5, 6, 8, 9, and 10
minutes. The crosslinking was monitored using a UV-VIS Spectroscopy (GENESYS 10S). To
measure the samples collected, a 1 to 20 dilution of the heated sample was prepared in deionized
water for each UV-VIS measurement where a stock solution agave in water at the same
concentration was used as a blank
Efficiency Quantification:
For dispersion quantification of heavy crude oil we used Saudi Arabian medium-heavy crude oil
(2.48% sulfur by weight, API Gravity of 31.1, Viscosity at 19mm2/s at 25
Celsius, ONTA). One
hundred and twenty microliters of the crude oil was pipetted onto 50 ml of carbon filtered water.
The crude oil surface layer was treated with NCS and the container was then placed on a rocking
platform (VWR) at 5 rpm for two hours. The NCS aggregates were removed and weighed while
the water layer was extracted from the crude oil layer for TOC analysis.
For NCS absorption quantification of petroleum distillates, we purchased a Louisiana
distillate sample (0.14% Sulphur by weight, API gravity 43.2, ONTA) with traces of gasoline
and naptha at 32.2 %, kerosine at 16.3%, gas oil at 11.4%, lubricating distillates at 14.1%, and
residuum at 26%. Fifty microliters of the distillate sample was pipetted onto the surface of 10 ml
of water. The sample was then treated with NCS at varying masses. The clump formed by the
CarboScavenger was removed and weighed, while the extracted water was analyzed by TOC.
42
HRP Degradation:
One mg/ml of NCS was suspended with 0.5mg/ml HRP (Thermo Scientific) in 5 ml of
Dulbecco’s phosphate buffered solution and an excess of 80 μM of hydrogen peroxide and then
statically incubated at 4 C in the dark as previously reported
109. At one week, two weeks, four
week, and eight week time points, the suspensions were removed from incubation, centrifuged at
10k RPM for 30 seconds and the supernatant was replaced with Nanopure water to halt any
residual enzyme reaction. The suspension was drop casted onto glass slides for Raman analysis
(120 to 2700 nm at 0.2% laser power for 60 seconds).
HMPO Degradation:
Our methods involved making 5 suspensions of 1 mg/ml NCS in Dulbecco’s phosphate buffered
solution and 200 μM of hydrogen peroxide. One hundred μg of HMPO enzyme (activity > 50
units/mg Protein) was added to four of the five samples and then statically incubated at 37 C in
the dark. Hydrogen peroxide was added every five hours to maintain a 200 uM concentration and
to keep enzyme activity constant as previously reported114
. The treated and control samples were
incubated at 37℃ for 24 hours. At 6, 12, 24, 168 hours, samples were removed from incubation
and placed in 4℃ environment for 4 hours to halt enzyme activity. Samples were then collected
and drop casted on glass slides for Raman analysis (120 to 2700 nm at 2% laser power for 60
seconds).
Total Organic Carbon Analysis:
Total Organic Carbon analysis was performed at the Illinois Sustainable Technology Center.
Carbon measurements were performed with a Shimadzu TOC-V analyzer. The instrument was
43
operated in non-purgeable organic carbon mode with addition of 2M hydrochloric acid and a
sparge time of 1.5 minutes. The instrument was calibrated daily by serial dilutions of a potassium
hydrogen phthalate stock solution over a range of 1 mg/L to 100 mg/L. Three to five injections
were made on each sample with a reproducibility target setting of 0.1 maximum standard
deviation.
Fluorescence Imaging:
Fluorescent measurements were performed at the Illinois Sustainable Technology Center. EEM
measurements were performed with a Horiba Aqualog scanning
spectrophotometer/spectrofluorometer. The samples were scanned over an excitation range of
240 nm to 700 nm and an emission range of 246 nm to 828 nm. The integration time was set at
0.1 seconds and the wavelength scan increments were set for 3nm and 5nm, excitation and
emission respectively. All samples were blank subtracted with data obtained from analysis of a
deionized water blank. Post processing of the fluorescence data included inner-filtering
correction with data obtained by simultaneous absorbance measurements and Rayleigh masking
of signals produced as a result of light scattering of water. In addition, all emission intensities
were normalized to a 1 mg/L quinine sulfate solution that was analyzed prior to each assay.
RAMAN Spectroscopy:
All Raman measurements were taken on a Nanophoton Raman instrument (Materials Research
Building, UIUC) with a 532 nm wavelength laser for one min at 0.2% laser power using a 20x
objective. For each spectrum a grating (600 l mm-1
) scan was taken over the range 120 - 2700
cm-1
. An average of 20 spectra was recorded and averaged for every sample.

44
Dynamic Light Scattering Measurements:
Hydrodynamic diameters were determined using a Malvern Zetasizer ZS90 particle size
analyzer, while scattered light was collected at a fixed angle of 90°. A photomultiplier aperture
of 400 mm was used, with the incident laser power adjusted to obtain a photon counting rate
between 200 and 300 kcps. Measurements for which the measured and calculated baselines of
the intensity autocorrelation function agreed to within +0.1% were used for diameter values.
Hydrodynamic diameter was analyzed using number distribution in accordance with various
previous reports115
. All determinations were made in multiples of 3 consecutive measurements
with 15 runs each.
Determination of Surface Zeta Potential:
Zeta potential (ζ) values for NCS was determined with a nano series Malvern Zetasizer zeta
potential analyzer. Data were acquired in the phase analysis light scattering (PALS) mode
following solution equilibration at 25 °C when calculation of ζ from the measured
electrophoretic mobility (μ) employed the Smoluchowski equation: μ = εζ/η (where ε and η are
the dielectric constant and the absolute viscosity of the medium, respectively). Measurements of
ζ were reproducible to within ± 6 mV of the mean value given by 3 determinations of 15 data
accumulations.
UV-VIS Measurements:
The absorption spectra for NCS and PCDA crosslinking were acquired in a Genesys 10S
UV−VIS Spectrophotometer (Thermo Scientific, Rockford, IL).

45
Transmission electron microscopy measurements
A drop of CarboScavenger suspension was placed on a carbon coated TEM grid. The TEM
images were acquired on a JEOL 2100 Cryo TEM machine and imaged by Gatan UltraScan 2k ×
2k CCD.
Atomic Force Microscopy:
A Digital Instruments Dimension 3000 series AFM (from MRL facility, UIUC) was used for
scanning the samples using standard Veeco tapping mode silicon probes with a platinum–iridium
(PtIr) coating. In a typical experiment, suspended NCS samples were dried in a desiccator on
freshly cleaved mica. Dried samples were placed on the AFM platform and scanned. Pertinent
scanning parameters were fixed as follows: Example of tip velocity: 4 m/s for 2 m, 15 m/s for 5
m, 30 m/s for 10 m; resonant frequency (probe): 60–80 kHz. Aspect ratio: 1:1; resolution: 512
samples/line, 256 lines. 2.10.
Scanning Electron Microscopy and EDX Analysis:
Scanning electron microscopic studies were performed on coated NCS to evaluate surface
properties of their clusters. Additional Energy dispersive X-ray (EDX) spectrum analysis was
also performed to demonstrate the presence of elements in addition to C and O in particle
preparations. Samples were prepared on metal stubs decorated with Si block. Suspension of
particles were used to drop cast on carbon tape and allowed to air-dry before putting in vacuum
for 5 h.
SEM images were taken on Hitachi S-4700 High Resolution SEM machine with
capabilities of high resolution low voltage imaging and connected to cold field emission gun (2.5

46
nm resolution at 1kV, 1.5 nm resolution at 15 kV) while EDX was performed on ISIS EDS X-
ray Microanalysis System (Oxford Instruments) using in build software.
Wide and Small angle X-ray diffraction studies:
WAXS/SAXS measurements were carried out on x-ray diffraction machine with Pilatus 300K
areal detector (172 μm pixel). The Cu Kα radiation (λ = 1.54 Å) was collimated with x-ray
mirror and two pairs of scatter less slits and passed through the evacuated path of 1600 mm from
source of Cu Kα radiation to sample holder. The 2D-patterns were recorded on an image plate
and processed using software. All the measurements were made in the transmission mode. The
sample to detector distance was 1400 mm for SAXS and 136 mm for WAXS, respectively.
Powdered NCS and carbon core samples were used for the analysis.
Zebrafish Toxicity Tests:
Zebrafish toxicity testing was performed at Northwestern University with Professor Jacek
Topczewski. The egg water was exposed to concentrations of NCS (0.5, 1, 2, 4 g/L) for 24 hours.
Five sets of fifteen wild type embryos 26 hours post fertilization were treated with 5 ml of NCS
exposed egg water for 24 hours. Embryo viability were then analyzed under a light microscope
and imaged.
Microtox Assay:
Microtox was performed at the Illinois Sustainable Technology Center. The acute toxicity
reagent, reconstitution solution and diluent were obtained from Modern Water. The phenol stock
material was obtained from Alfa Aesar (99.5% purity) and sodium chloride was obtained from
Fisher Scientific (99.9% purity). Sodium chloride was used to adjust the osmotic pressure of

47
each test sample and reference material to approximately 2% NaCl. Each sample was assayed at
0%, 9%, 36%, 63%, and 90% concentrations. The measurements were performed with an Azur
Environmental M500 Microtox analyzer. The test organism was incubated at 15oC for 10
minutes before exposure. The exposure time was 5 minutes and light measurements were
performed before and after exposure to test materials. The effective concentration which
produces 50% maximum response, EC50, was calculated by linear regression of the difference of
pre-exposure and post exposure light emission versus concentration of test solution. A phenol
reference material was also analyzed with each run as quality control. The known EC50, for
phenol with 5 minute exposure is in the range of 13 to 26 mg/L116
. Therefore for the test to be
considered valid, assay of phenol reference material was required to produce results within this
range.
48
REFERENCES
1. Barron, M. G. Ecological impacts of the deepwater horizon oil spill: implications for
immunotoxicity. Toxicol. Pathol. 40, 315–20 (2012).
2. Pick Your Poison For Crude -- Pipeline, Rail, Truck Or Boat. at
<http://www.forbes.com/sites/jamesconca/2014/04/26/pick-your-poison-for-crude-
pipeline-rail-truck-or-boat/>
3. Exxon Denied Request to Use Fleet of Tankers to Transport Crude Oil Through Santa
Barbara County | KTLA. at <http://ktla.com/2015/06/10/exxon-denied-request-to-use-
fleet-of-tankers-to-transport-crude-oil-through-santa-barbara-county/>
4. Understanding Oil Spills and Oil Spill Response. at
<http://www4.nau.edu/itep/waste/HazSubMap/docs/OilSpill/EPAUnderstandingOilSpills
AndOilSpillResponse1999.pdf>
5. Ozhan, K., Parsons, M. L. and Bargu, S. How Were Phytoplankton Affected by the
Deepwater Horizon Oil Spill? Bioscience 64, 829–836 (2014).
6. Montewka, J., Weckström, M. and Kujala, P. A probabilistic model estimating oil spill
clean-up costs--a case study for the Gulf of Finland. Mar. Pollut. Bull. 76, 61–71 (2013).
7. Jiang, Z. et al. Advance in the toxic effects of petroleum water accommodated fraction on
marine plankton. Acta Ecol. Sin. 30, 8–15 (2010).

49
8. Guo, M., Xu, Y. and Chen, Y. D. Fracking and pollution: can China rescue its
environment in time? Environ. Sci. Technol. 48, 891–2 (2014).
9. Howarth, R. W., Ingraffea, A. and Engelder, T. Natural gas: Should fracking stop? Nature
477, 271–5 (2011).
10. Mooney, C. The Truth about Fracking. Sci. Am. 305, 80–85 (2011).
11. Mackay, D. and Matsugu, R. S. Evaporation rates of liquid hydrocarbon spills on land and
water. Can. J. Chem. Eng. 51, 434–439 (1973).
12. Ayotamuno, M. J., Kogbara, R. B., Ogaji, S. O. T. and Probert, S. D. Bioremediation of a
crude-oil polluted agricultural-soil at Port Harcourt, Nigeria. Appl. Energy 83, 1249–1257
(2006).
13. Santa Barbara oil spill - LA Times. at <http://www.latimes.com/local/california/la-me-
santa-barbara-oil-spill-20150520-storygallery.html>
14. Statistics - ITOPF. at <http://www.itopf.com/knowledge-resources/data-
statistics/statistics/>
15. Lewis, R. H. and Welborn, J. Y. REPORT ON THE PHYSICAL AND CHEMICAL
PROPERTIES OF PETROLEUM ASPHALTS OF THE 50-60 AND 85-100
PENETRATION GRADES. Public Roads at <http://trid.trb.org/view.aspx?id=95104>
16. H. G. Thode, J. M. Sulfur-Isotope Geochemistry of Petroleum, Evaporites, and Ancient
Seas. 71, 367–377 (1965).

50
17. Identification of Oil on Water: Aerial Observation and Identification Guide. at
<https://www.amsa.gov.au/forms-and-publications/Publications/AMSA22.pdf>
18. In Gulf oil spill, how helpful – or damaging – are dispersants? - CSMonitor.com. at
<http://www.csmonitor.com/USA/2010/0515/In-Gulf-oil-spill-how-helpful-or-damaging-
are-dispersants>
19. Oil Spill Response: A Global Perspective. (Springer Netherlands, 2008). doi:10.1007/978-
1-4020-8565-9
20. Lessard, R. . and DeMarco, G. The Significance of Oil Spill Dispersants. Spill Sci.
Technol. Bull. 6, 59–68 (2000).
21. Delvigne, G. A. L. and Sweeney, C. E. Natural dispersion of oil. Oil Chem. Pollut. 4,
281–310 (1988).
22. Yakimov, M. M. et al. Alcanivorax borkumensis gen. nov., sp. nov., a new, hydrocarbon-
degrading and surfactant-producing marine bacterium. Int. J. Syst. Bacteriol. 48 Pt 2,
339–48 (1998).
23. McKew, B. A., Coulon, F., Osborn, A. M., Timmis, K. N. and McGenity, T. J.
Determining the identity and roles of oil-metabolizing marine bacteria from the Thames
estuary, UK. Environ. Microbiol. 9, 165–76 (2007).
24. Atlas, R. M. Bioremediation of petroleum pollutants. Int. Biodeterior. Biodegradation 35,
317–327 (1995).

51
25. McKew, B. A. et al. Efficacy of intervention strategies for bioremediation of crude oil in
marine systems and effects on indigenous hydrocarbonoclastic bacteria. Environ.
Microbiol. 9, 1562–71 (2007).
26. Hazen, T. C. et al. Deep-sea oil plume enriches indigenous oil-degrading bacteria. Science
330, 204–8 (2010).
27. Sorkhoh, N. A., Al-Hasan, R. H., Khanafer, M. and Radwan, S. S. Establishment of oil-
degrading bacteria associated with cyanobacteria in oil-polluted soil. J. Appl. Bacteriol.
78, 194–199 (1995).
28. Groudeva, V. I., Groudev, S. N. and Doycheva, A. S. Bioremediation of waters
contaminated with crude oil and toxic heavy metals. Int. J. Miner. Process. 62, 293–299
(2001).
29. Almeda, R., Hyatt, C. and Buskey, E. J. Toxicity of dispersant Corexit 9500A and crude
oil to marine microzooplankton. Ecotoxicol. Environ. Saf. 106, 76–85 (2014).
30. Burridge, T. R. and Shir, M.-A. The comparative effects of oil dispersants and
oil/dispersant conjugates on germination of the marine macroalga Phyllospora comosa
(Fucales: Phaeophyta). Mar. Pollut. Bull. 31, 446–452 (1995).
31. Hemmer, M. J., Barron, M. G. and Greene, R. M. Comparative toxicity of eight oil
dispersants, Louisiana sweet crude oil (LSC), and chemically dispersed LSC to two
aquatic test species. Environ. Toxicol. Chem. 30, 2244–52 (2011).

52
32. George-Ares, A., Clark, J. R., Biddinger, G. R. and Hinman, M. L. Comparison of test
methods and early toxicity characterization for five dispersants. Ecotoxicol. Environ. Saf.
42, 138–42 (1999).
33. De Soysa, T. Y. et al. Macondo crude oil from the Deepwater Horizon oil spill disrupts
specific developmental processes during zebrafish embryogenesis. BMC Biol. 10, 40
(2012).
34. George-Ares, A. and Clark, J. R. Aquatic toxicity of two Corexit dispersants.
Chemosphere 40, 897–906 (2000).
35. Bandele, O. J., Santillo, M. F., Ferguson, M. and Wiesenfeld, P. L. In vitro toxicity
screening of chemical mixtures using HepG2/C3A cells. Food Chem. Toxicol. 50, 1653–9
(2012).
36. Protesters warn against using chemicals in Santa Barbara County oil spill clean-up - LA
Times. at <http://www.latimes.com/local/lanow/la-me-ln-santa-barbara-county-oil-spill-
20150524-story.html>
37. Response Techniques - ITOPF. at <http://www.itopf.com/knowledge-
resources/documents-guides/clean-up-techniques/>
38. Wu, D. et al. Oil sorbents with high sorption capacity, oil/water selectivity and reusability
for oil spill cleanup. Mar. Pollut. Bull. 84, 263–7 (2014).
39. Lin, J. et al. Nanoporous polystyrene fibers for oil spill cleanup. Mar. Pollut. Bull. 64,
347–52 (2012).

53
40. Zhu, H., Qiu, S., Jiang, W., Wu, D. and Zhang, C. Evaluation of electrospun polyvinyl
chloride/polystyrene fibers as sorbent materials for oil spill cleanup. Environ. Sci.
Technol. 45, 4527–31 (2011).
41. Radetic, M. et al. Efficiency of recycled wool-based nonwoven material for the removal
of oils from water. Chemosphere 70, 525–30 (2008).
42. Teas, C. et al. Investigation of the effectiveness of absorbent materials in oil spills clean
up. Desalination 140, 259–264 (2001).
43. Wang, C.-F. and Lin, S.-J. Robust superhydrophobic/superoleophilic sponge for effective
continuous absorption and expulsion of oil pollutants from water. ACS Appl. Mater.
Interfaces 5, 8861–4 (2013).
44. Wang, F. et al. Superhydrophobic Cu Mesh Combined with a Superoleophilic
Polyurethane Sponge for Oil Spill Adsorption and Collection. Ind. Eng. Chem. Res. 53,
7141–7148 (2014).
45. Pan, Y. et al. Evaluation of Hydrophobic Polyvinyl-Alcohol Formaldehyde Sponges As
Absorbents for Oil Spill. ACS Appl. Mater. Interfaces 6, 8651–8659 (2014).
46. Zhu, Q., Pan, Q. and Liu, F. Facile Removal and Collection of Oils from Water Surfaces
through Superhydrophobic and Superoleophilic Sponges. J. Phys. Chem. C 115, 17464–
17470 (2011).
47. Zhu, Q. et al. Robust superhydrophobic polyurethane sponge as a highly reusable oil-
absorption material. J. Mater. Chem. A 1, 5386 (2013).

54
48. Wang, F., Yu, S., Xue, M., Ou, J. and Li, W. A superhydrophobic and superoleophilic
miniature mesh box for oil spill clean up. New J. Chem. 38, 4388 (2014).
49. Song, J. et al. Self-Driven One-Step Oil Removal from Oil Spill on Water via Selective-
Wettability Steel Mesh. ACS Appl. Mater. Interfaces 6, 19858–19865 (2014).
50. Wen, Q., Di, J., Jiang, L., Yu, J. and Xu, R. Zeolite-coated mesh film for efficient oil–
water separation. Chem. Sci. 4, 591–595 (2013).
51. Xue, Z. et al. A Novel Superhydrophilic and Underwater Superoleophobic Hydrogel-
Coated Mesh for Oil/Water Separation. Adv. Mater. 23, 4270–4273 (2011).
52. Basak, S., Nanda, J. and Banerjee, A. A new aromatic amino acid based organogel for oil
spill recovery. J. Mater. Chem. 22, 11658 (2012).
53. Calcagnile, P. et al. Magnetically driven floating foams for the removal of oil
contaminants from water. ACS Nano 6, 5413–9 (2012).
54. Cong, H.-P., Ren, X.-C., Wang, P. and Yu, S.-H. Macroscopic multifunctional graphene-
based hydrogels and aerogels by a metal ion induced self-assembly process. ACS Nano 6,
2693–703 (2012).
55. Korhonen, J. T., Kettunen, M., Ras, R. H. A. and Ikkala, O. Hydrophobic nanocellulose
aerogels as floating, sustainable, reusable, and recyclable oil absorbents. ACS Appl. Mater.
Interfaces 3, 1813–6 (2011).

55
56. Brown, P. S. and Bhushan, B. Mechanically durable, superoleophobic coatings prepared
by layer-by-layer technique for anti-smudge and oil-water separation. Sci. Rep. 5, 8701
(2015).
57. Yuan, J. et al. Superwetting nanowire membranes for selective absorption. Nat.
Nanotechnol. 3, 332–6 (2008).
58. Chu, Y. and Pan, Q. Three-dimensionally macroporous Fe/C nanocomposites as highly
selective oil-absorption materials. ACS Appl. Mater. Interfaces 4, 2420–5 (2012).
59. Zhu, Q., Tao, F. and Pan, Q. Fast and selective removal of oils from water surface via
highly hydrophobic core-shell Fe2O3@C nanoparticles under magnetic field. ACS Appl.
Mater. Interfaces 2, 3141–6 (2010).
60. Pavía-Sanders, A. et al. Robust magnetic/polymer hybrid nanoparticles designed for crude
oil entrapment and recovery in aqueous environments. ACS Nano 7, 7552–61 (2013).
61. Wang, P. et al. Magnetic permanently confined micelle arrays for treating hydrophobic
organic compound contamination. J. Am. Chem. Soc. 131, 182–8 (2009).
62. Maguire-Boyle, S. J. and Barron, A. R. Organic compounds in produced waters from
shale gas wells. Environ. Sci. Process. Impacts 16, 2237–48 (2014).
63. England, W. A. and Mackenzie, A. S. Some aspects of the organic geochemistry of
petroleum fluids. Geol. Rundschau 78, 291–303 (1989).

56
64. Westlake, D. W. S., Jobson, A., Phillippe, R. and Cook, F. D. Biodegradability and crude
oil composition. Can. J. Microbiol. 20, 915–928 (1974).
65. King, R. W. Petroleum: its composition, analysis and processing. Occup. Med. 3, 409–30
(1988).
66. Petroleum Chemistry And Refining. (CRC Press, 1997). at
<https://books.google.com/books?hl=en&lr=&id=qaMXFpEflbwC&pgis=1>
67. O’Reilly, R. K., Joralemon, M. J., Hawker, C. J. and Wooley, K. L. Facile syntheses of
surface-functionalized micelles and shell cross-linked nanoparticles. J. Polym. Sci. Part A
Polym. Chem. 44, 5203–5217 (2006).
68. Joralemon, M. J., O’Reilly, R. K., Hawker, C. J. and Wooley, K. L. Shell click-
crosslinked (SCC) nanoparticles: a new methodology for synthesis and orthogonal
functionalization. J. Am. Chem. Soc. 127, 16892–9 (2005).
69. Harper, B. et al. Comparative hazard analysis and toxicological modeling of diverse
nanomaterials using the embryonic zebrafish (EZ) metric of toxicity. J. Nanopart. Res. 17,
250
70. Harper, S. L. et al. Systematic evaluation of nanomaterial toxicity: utility of standardized
materials and rapid assays. ACS Nano 5, 4688–97 (2011).
71. Schrand, A. M., Dai, L., Schlager, J. J. and Hussain, S. M. Toxicity testing of
nanomaterials. Adv. Exp. Med. Biol. 745, 58–75 (2012).

57
72. Nel, A. et al. Nanomaterial toxicity testing in the 21st century: use of a predictive
toxicological approach and high-throughput screening. Acc. Chem. Res. 46, 607–21
(2013).
73. White, J. S. Misconceptions about high-fructose corn syrup: is it uniquely responsible for
obesity, reactive dicarbonyl compounds, and advanced glycation endproducts? J. Nutr.
139, 1219S–1227S (2009).
74. Mukherjee, P. et al. Tunable Luminescent Carbon Nanospheres with Well-Defined
Nanoscale Chemistry for Synchronized Imaging and Therapy. Small (2015).
doi:10.1002/smll.201500728
75. Polydiacetylene Vesicles: Direct Biosensors with a Colorimetric Response. at
<http://www.chem.wisc.edu/areas/organic/studsemin/schmitt/schmitt-abs.pdf>
76. Rhodes, D. G., Xu, Z. and Bittman, R. Structure of polymerizable lipid bilayers. V:
synthesis, bilayer structure and properties of diacetylenic ether and ester lipids. Biochim.
Biophys. Acta - Lipids Lipid Metab. 1128, 93–104 (1992).
77. Bruehl, R. E. et al. Polymerized Liposome Assemblies: Bifunctional Macromolecular
Selectin Inhibitors Mimicking Physiological Selectin Ligands †. Biochemistry 40, 5964–
5974 (2001).
78. Araghi, H. Y. and Paige, M. F. Deposition and photopolymerization of phase-separated
perfluorotetradecanoic acid-10,12-pentacosadiynoic acid Langmuir-Blodgett monolayer
films. Langmuir 27, 10657–65 (2011).

58
79. Saito, A., Urai, Y. and Itoh, K. Infrared and Resonance Raman Spectroscopic Study on the
Photopolymerization Process of the Langmuir−Blodgett Films of a Diacetylene
Monocarboxylic Acid, 10,12-Pentacosadiynoic Acid. Langmuir 12, 3938–3944 (1996).
80. Mino, N., Tamura, H. and Ogawa, K. Photoreactivity of 10,12-pentacosadiynoic acid
monolayers and color transitions of the polymerized monolayers on an aqueous subphase.
Langmuir 8, 594–598 (1992).
81. Liu, F. and Eisenberg, A. Preparation and pH triggered inversion of vesicles from
poly(acrylic acid)-block-polystyrene-block-poly(4-vinyl pyridine). J. Am. Chem. Soc. 125,
15059–64 (2003).
82. Zhang, L. and Eisenberg, A. Crew-cut aggregates from self-assembly of blends of
polystyrene-b-poly(acrylic acid) block copolymers and homopolystyrene in solution. J.
Polym. Sci. Part B Polym. Phys. 37, 1469–1484 (1999).
83. Zhang, L. and Eisenberg, A. Thermodynamic vs Kinetic Aspects in the Formation and
Morphological Transitions of Crew-Cut Aggregates Produced by Self-Assembly of
Polystyrene- b -poly(acrylic acid) Block Copolymers in Dilute Solution. Macromolecules
32, 2239–2249 (1999).
84. Misra, S. K., Ye, M., Kim, S. and Pan, D. Highly efficient anti-cancer therapy using
scorpion ‘NanoVenin’. Chem. Commun. (Camb). 50, 13220–3 (2014).
59
85. Misra, S. K., Kim, B., Chang, H.-H. and Pan, D. Defying symmetry: a ‘flowery’
architecture with augmented surface area from gold coated polymeric ‘nanoblooms’. RSC
Adv. 4, 34303 (2014).
86. Misra, S. K., Kus, J., Kim, S. and Pan, D. Nanoscopic poly-DNA-cleaver for breast cancer
regression with induced oxidative damage. Mol. Pharm. 11, 4218–27 (2014).
87. Misra, S. K., Jensen, T. W. and Pan, D. Enriched inhibition of cancer and stem-like cancer
cells via STAT-3 modulating niclocelles. Nanoscale 7, 7127–32 (2015).
88. Misra, S. K., Ye, M., Kim, S. and Pan, D. Defined nanoscale chemistry influences
delivery of peptido-toxins for cancer therapy. PLoS One 10, e0125908 (2015).
89. Jaffray, D. A., Siewerdsen, J. H., Wong, J. W. and Martinez, A. A. Flat-panel cone-beam
computed tomography for image-guided radiation therapy. Int. J. Radiat. Oncol. 53,
1337–1349 (2002).
90. Valentine, D. L. et al. Fallout plume of submerged oil from Deepwater Horizon. Proc.
Natl. Acad. Sci. U. S. A. 111, 15906–11 (2014).
91. Hanaor, D., Michelazzi, M., Leonelli, C. and Sorrell, C. C. The effects of carboxylic acids
on the aqueous dispersion and electrophoretic deposition of ZrO2. J. Eur. Ceram. Soc. 32,
235–244 (2012).
92. O’Brien, R. W., Midmore, B. R., Lamb, A. and Hunter, R. J. Electroacoustic studies of
moderately concentrated colloidal suspensions. Faraday Discuss. Chem. Soc. 90, 301
(1990).
60
93. Gierke, T. D., Munn, G. E. and Wilson, F. C. The morphology in nafion perfluorinated
membrane products, as determined by wide- and small-angle x-ray studies. J. Polym. Sci.
Polym. Phys. Ed. 19, 1687–1704 (1981).
94. Eibl, R., Werner, S. and Eibl, D. Bag bioreactor based on wave-induced motion:
characteristics and applications. Adv. Biochem. Eng. Biotechnol. 115, 55–87 (2009).
95. Kalmbach, A. et al. Experimental characterization of flow conditions in 2- and 20-L
bioreactors with wave-induced motion. Biotechnol. Prog. 27, 402–9
96. Gary, J. H., Handwerk, G. E. and Kaiser, M. J. Petroleum Refining: Technology and
Economics, Fifth Edition. (CRC Press, 2007). at
<https://books.google.com/books?hl=en&lr=&id=ocbLBQAAQBAJ&pgis=1>
97. Cancer, I. A. for R. on. Occupational exposures in petroleum refining: crude oil and major
petroleum fuels. at <http://bases.bireme.br/cgi-
bin/wxislind.exe/iah/online/?IsisScript=iah/iah.xis&src=google&base=WHOLIS&lang=p
&nextAction=lnk&exprSearch=9283212452&indexSearch=ID>
98. Adams, J., Sweezey, M. and Hodson, P. V. Oil and oil dispersant do not cause synergistic
toxicity to fish embryos. Environ. Toxicol. Chem. 33, 107–14 (2014).
99. Jiang, Z., Huang, Y., Chen, Q., Zeng, J. and Xu, X. Acute toxicity of crude oil water
accommodated fraction on marine copepods: the relative importance of acclimatization
temperature and body size. Mar. Environ. Res. 81, 12–7 (2012).
61
100. Production of high octane gasoline. (1987). at
<https://www.google.com/patents/US4676887>
101. Chica, A. and Corma, A. Hydroisomerization of Pentane, Hexane, and Heptane for
Improving the Octane Number of Gasoline. J. Catal. 187, 167–176 (1999).
102. Top 16 uses of petroleum. at <http://gasoilenergy.com/2010/04/top-16-uses-of-
petroleum/>
103. Standard Methods for the Examination of Water and Wastewater, Volume 2. (American
Public Health Association., 1915). at
<https://books.google.com/books?hl=en&lr=&id=Ql5FAQAAIAAJ&pgis=1>
104. De Zwart, D. and Slooff, W. The Microtox as an alternative assay in the acute toxicity
assessment of water pollutants. Aquat. Toxicol. 4, 129–138 (1983).
105. Munkittrick, K. R., Power, E. A. and Sergy, G. A. The relative sensitivity of microtox®,
daphnid, rainbow trout, and fathead minnow acute lethality tests. Environ. Toxicol. Water
Qual. 6, 35–62 (1991).
106. Scholz, S. et al. The zebrafish embryo model in environmental risk assessment--
applications beyond acute toxicity testing. Environ. Sci. Pollut. Res. Int. 15, 394–404
(2008).
107. Hill, A. J., Teraoka, H., Heideman, W. and Peterson, R. E. Zebrafish as a model vertebrate
for investigating chemical toxicity. Toxicol. Sci. 86, 6–19 (2005).

62
108. Sprague, J. et al. The Zebrafish Information Network: the zebrafish model organism
database. Nucleic Acids Res. 34, D581–5 (2006).
109. Allen, B. L. et al. Biodegradation of single-walled carbon nanotubes through enzymatic
catalysis. Nano Lett. 8, 3899–903 (2008).
110. Allen, B. L. et al. Mechanistic Investigations of Horseradish Peroxidase-Catalyzed
Degradation of Single-Walled Carbon Nanotubes. J. Am. Chem. Soc. 131, 17194–17205
(2009).
111. Characterizing Carbon Materials with Raman Spectroscopy. at
<http://www.thermoscientific.com/content/dam/tfs/ATG/CAD/CAD
Documents/Application and Technical Notes/Molecular Spectroscopy/Raman/Raman
Instruments/D19504~.pdf>
112. Biochar for Environmental Management: Science and Technology. (Routledge, 2012). at
<https://books.google.com/books?hl=en&lr=&id=iqrksC-PT1kC&pgis=1>
113. Brown, R. L. and Branting, B. F. Composition of Tar from Low–Temperature
Carbonization of Utah Coal–I 1. Ind. Eng. Chem. 20, 392–396 (1928).
114. Kagan, V. E. et al. Carbon nanotubes degraded by neutrophil myeloperoxidase induce less
pulmonary inflammation. Nat. Nanotechnol. 5, 354–9 (2010).
115. Wu, L. et al. Surface passivation of carbon nanoparticles with branched macromolecules
influences near infrared bioimaging. Theranostics 3, 677–86 (2013).
63
116. Kaiser, K. L. E. and Ribo, J. M. Photobacterium phosphoreum toxicity bioassay. II.
Toxicity data compilation. Toxic. Assess. 3, 195–237 (1988).