a behavioral analysis of learning curve strategy
TRANSCRIPT


•S^^^C^o'^^
Z lUBKAHESl 5


HD28.M41A
A Behavioral Analysis of Learning CurveStrategy
John D. Sterman, Rebecca Henderson, Eric D.
Beinhocker and Lee I. Newman
WP#3864 -95-MSA October, 1995
DEWEY

Jj\H ^3 1995
D-4354
A BEHAVIORAL ANALYSIS OF LEARNING CURVE STRATEGY
John D. Sterman*, Rebecca Henderson*,
Eric D. Beinhocke^^ and Lee I Newman^
Abstract
Prior research on firm strategy in the presence of learning curves suggests that if learning is
highly appropriable, early entrants can achieve sustained competitive advantage by rapidly building
capacity and by pricing aggressively to preempt competition. However these studies all presume
(1) rational actors and (2) equilibrium, implying markets clear at all points in time. We consider
the robustness of the aggressive strategy in the presence of (1) boundedly rational agents and (2) a
capacity acquisition lag. Agents are endowed with high local rationality but imperfect
understanding of the feedback structure of the market; they use intendedly rational heuristics to
forecast demand, acquire capacity, and set prices. These heuristics are grounded in empirical study
and experimental test. Using a simulation of the duopoly case we show the aggressive learning
curve strategy becomes suboptimal when the market is dynamically complex. When capacity
cannot be adjusted instantaneously, forecasting errors leading to excess capacity can overwhelm
the cost advantage conferred by the learning curve. We explore the sensitivity of the results to the
feedback complexity of the market and the rationality of the agents' decision making procedures.
The results highlight the danger of extrapolating from equilibrium models of rational actors to the
formulation of strategic prescriptions and demonstrate how disequilibrium behavior and bounded
rationality can be incorporated into strategic analysis to form a 'behavioral game theory' amenable
to rigorous analysis.
' Sloan School of Management, Massachusetts Institute of Technology
^ McKinsey & Company
Please direct correspondence to John Sterman at the MIT Sloan School of Management, 50Memorial Drive, E53-351, Cambridge, MA 02142, or to <[email protected]>.
27 October 1995


D-4354 1
1. Introduction
Learning curves have been identified in a wide variety of industries (Dutton and Thomas,
1984), and an extensive theoretical literature has explored their strategic implications. A learning
curve creates a positive feedback loop by which a small initial market share advantage leads to
greater production experience, lower unit costs, lower prices and still greater market share
advantage. In general, the literature suggests that in the presence of learning curves - and when
learning is privately appropriable - fmns should pursue an aggressive strategy in which they seek
to preempt their rivals, expand output and reduce price below the short-run profit maximizing level
(Spence, 1981; Fudenberg and Tirole, 1983, 1986; Tirole, 1990). Intuitively, such aggressive
strategies are superior because they increase both industry demand and the aggressive firm's share
of that demand, boosting cumulative volume, reducing future costs and building sustained
competitive advantage until the firm dominates the market. The desirability of aggressive strategies
in industries with learning curves has diffused widely in business education, the popular business
literature, management texts, and public policy debates (Rothschild 1990, Hax and Majluf 1984;
Oster, 1990; Porter, 1980; Krugman, 1990). and learning curve strategies appear to have led to
sustained advantage in industries such as synthetic fibers, bulk chemicals and disposable diapers
(Shaw and Shaw 1984; Lieberman 1984, Ghemawat 1984, Poner 1984).
However in many industries, including televisions, VCRs, semiconductors, toys and
games, lighting equipment, snowmobiles, hand calculators, tennis equipment, bicycles, chain
saws, running shoes and vacuum cleaners, aggressive pricing and capacity expansion have led to
substantial overcapacity and price wars that have destroyed industry profitability (Beinhocker,
1991; Salter, 1969; Porter, 1980; Saporito, 1992; The Economist, 1991; Business Week, 1992).
Existing models that consider the competitive imphcations of the learning curve utilize the
traditional assumption that markets clear at all points in time. Market clearing in turn implies that a
firm's production capacity and other resources can be adjusted instantaneously to equilibrium
levels, or, if there are capacity adjustment lags, that firms have perfect foresight such that they can
forecast their capacity requirements far enough in advance to bring the required capacity on line just

D-4354
as it is needed. Neither assumption is valid: it takes time to build new factories, expand existing
ones, and decommission obsolete ones (Mayer 1960, Jorgenson and Stephenson 1967), and
forecasting over typical planning horizons remains difficult and error-prone (Armstrong 1985,
Makridakis et al. 1982, Makridakis et al. 1993). The presumption in the literature is that capacity
adjustment and forecast error correction are fast relative to the dynamics of the learning curve so
that the assumption of perfect market clearing is a reasonable approximation.
In this paper we show that relaxing the assumptions of instantaneous market clearing and
perfect foresight leads, in a variety of plausible circumstances, to competitive dynamics
significantly different from those predicted by much of the existing literature. We begin with a
review of the literature on strategy in the presence of learning curves. We then develop a model in
which the assumptions of market clearing and rationality are replaced by a disequihbrium,
behavioral framework in which fums face lags in adjusting capacity and use boundedly rational
decision heuristics to set prices and forecast demand. We use the model to explore the impact of an
aggressive learning-curve strategy in a variety of environments.
When the dynamics of the market are sufficiently slow, delays in information acquisition,
decision making, and system response are sufficiently short, and the cognitive demands on the
firms are sufficiently low, behavioral theory yields predictions observationally indistinguishable
from those of equilibrium models. However in more dynamic environments, in which boundedly
rational forecasting techniques become less accurate, the aggressive learning curve strategies
prescribed in the game theory literature become inferior, as aggressive expansion leads to excess
capacity. We close with implications for the study of strategic competition in general, arguing that
the neoclassical assumptions of equilibrium and rationality may in many realistic circumstances
prove to be a dangerous guide to action and a weak basis for empirical research.
2. Models of Learning Curve Strategy
Learning curves are a familiar phenomena. Numerous empirical studies have documented
their existence in a wide variety of industries, as Hax and Majluf (1984, 1 12) note, "ranging from
broiler chickens to integrated circuits" (see Dutton and Thomas 1984 for a review).

D-4354
Spence (1979) examines the effect of competitive asymmetries on investment decisions in
growth markets where there are learning effects. He notes that learning curves allow for creation of
asymmetric advantage and thus create an incentive to preempt rivals. Spence (1981) further
quantifies optimal production policy under a learning curve, finding that if finns can perfectly
appropriate all the benefits of learning, and if they can be sure of a first mover position, then they
should expand output beyond the short-run profit maximizing level in order to capture learning-
induced cost advantage. Fudenberg and Tirole (1986) and Tirole (1990) present a dynamic
analysis of a duopoly with a learning curve. Under quantity competition they find that an
aggressive strategy always dominates. Under price competition the aggressive strategy succeeds in
deterring rival entry and in causing rival exit, but when two existing players prefer accommodation
there is no clearly dominant strategy a priori.
Other studies have examined the sensitivity of these results to differing demand conditions
and appropriability assumptions. Majd and Pindyck (1989) show that uncertainty in future prices
reduces the optimal expansion of output beyond the static equilibrium level. Ghemawat and
Spence (1985) show that when the effects of learning spill over to competitors the incentives to
expand output are also reduced. Similar conclusions are found in the literature on the effects of
learning on international trade (Krugman, 1987).
Kalish (1983) addresses the interaction between learning and product diffusion dynamics
(word of mouth, saturation). Word of mouth creates a shadow benefit of current sales that
reinforces the incentive to cut price and expand production as current output builds the installed
base of customers who in turn convey information on the benefits of the product to those who have
not yet purchased, accelerating product adopfion.
In sum, the literature suggests that if learning is appropriable, if price is not highly
uncertain, and if rivals can be relied on to behave rationally, then firms should pursue an
aggressive strategy of preemption, higher output and lower prices. This recommendation has
diffused widely in business education, the popular business literature, and public policy debates
(Oster, 1990; Krugman, 1990). All these models assume equilibrium and market clearing so that

D-4354
the firm's capacity is always equal to demand, implying either that there are no capacity adjustment
delays or that firms have perfect foresight so that they can forecast demand sufficiently far in
advance to ensure that they always have exactly the correct capacity.
3. A Boundedly Rational, Disequilibrium Model
To explore the robustness of the learning curve literature to the assumptions of perfect
foresight and instantaneous market clearing, we developed a disequilibrium, behavioral model of
competitive dynamics in the presence of learning. Following Kalish (1983), we assume that the
market goes through a life-cycle of growth, peak, and saturation. In contrast to the literature, we
assume capacity adjusts with a lag, and that firms have only a limited ability to forecast future
sales. These assumptions are consistent with a long tradition of experimental and empirical
evidence (Brehmer 1992, Collopy and Armstrong 1992, Diehl and Sterman 1995, Kampmann
1992, Mahajan et al. 1990, Paich and Sterman 1993, Parker 1994. Rao 1985, Sterman 1989a,
1989b, 1994). In models assuming instantaneous market clearing and perfect foresight, the market
clearing price can be derived as a necessary property of equilibrium, given the capacity decision.
However in disequilibrium settings, both price and capacity targets must be determined. Here we
draw on the literature cited above and the well-established tradition of boundedly rational models,
and assume that firms set prices with intendedly rational decision heuristics (Cyert and March,
1963/1992; Forrester 1961; Simon 1976, 1979, 1982; Morecroft 1985).
The model is formulated in continuous time as a set of nonlinear differential equations.
Since no analytic solution to the model is known, we use simulation to explore its dynamics'
While the model portrays an industry with an arbitrary number of firms i = { 1 , ..., n }, we restrict
ourselves to n = 2 in the simulation experiments below. We begin by laying out the equations
describing the dynamics of demand. These are based on the standard Bass diffusion model (Bass,
1969; Mahajan et al. 1990). We then describe the physical and institutional structure of the firm,
including order fulfillment, revenue and cost, the capacity acquisition lag, and the learning curve.
Finally we discuss firm strategy. This section is the heart of the model and contains the key
behavioral assumptions regarding demand forecasting, target capacity, and pricing.
D-4354
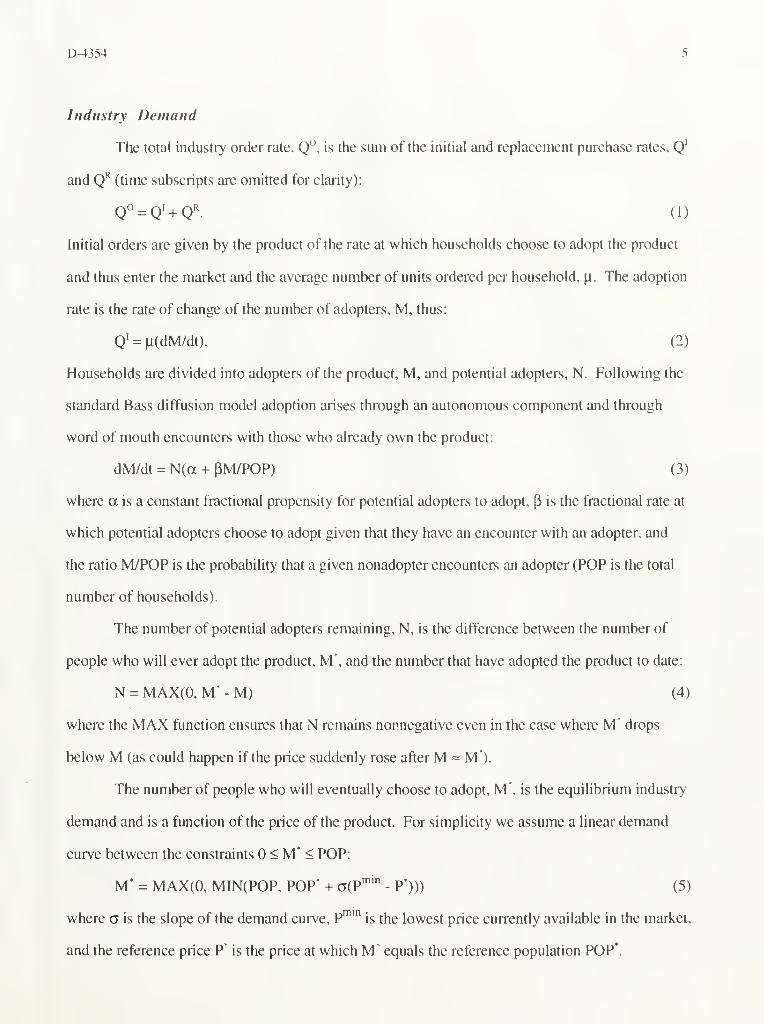
Industry Demand
The total industry order rate, Q", is the sum of the initial and replacement purchase rates, Q'
and (^ (time subscripts are omitted for clarity):
qo = Q' + Q«. (1)
Initial orders are given by the product of the rate at which households choose to adopt the product
and thus enter the market and the average number of units ordered per household, |J. The adoption
rate is the rate of change of the number of adopters, M, thus:
Q' = |i(dM/dt). (2)
Households are divided into adopters of the product, M, and potential adopters, N. Following the
standard Bass diffusion model adoption arises through an autonomous component and through
word of mouth encounters with those who already own the product:
dM/dt = N(a + pM/POP) (3)
where a is a constant fractional propensity for potential adopters to adopt, (3 is the fractional rate at
which potential adopters choose to adopt given that they have an encounter with an adopter, and
the ratio N4/POP is the probability that a given nonadopter encounters an adopter (POP is the total
number of households).
The number of potential adopters remaining, N, is the difference between the number of
people who will ever adopt the product, M*, and the number that have adopted the product to date:
N = MAX(0, M* - M) (4)
where the MAX function ensures that N remains nonnegative even in the case where M* drops
below M (as could happen if the price suddenly rose after M = M*).
The number of people who will eventually choose to adopt, M', is the equilibrium industry
demand and is a function of the price of the product. For simplicity we assume a linear demand
curve between the constraints < M* < POP:
M* = MAX(0, MIN(POP, POP' + a(P"''" - P'))) (5)
where a is the slope of the demand curve, P"^'" is the lowest price currently available in the market,
and the reference price P' is the price at which M* equals the reference population POP*.

D-4354
The replacement order rate, Q"^, is the discard rate of old units, D. summed over all firms in
the industry. For simplicity we assume exponential discards from the installed base of each finn:
Q' = li Di. (6)
Di = 5li (7)
where I, is the installed base of firm i's product and 5 is the fractional discard rate. The installed
base is increased by shipments, Qj, and decreased by discards:
li = 1(Q. - D,)dt + lio. (8)
Each firm receives orders O, equal to a share of the industry order rate. The firm's order
share. S^j, is determined by a logit model in which product attractiveness. A, depends on both
price and availability. Availability is measured by the firm's average delivery delay, given (by
Little's Law) by the ratio of backlog, B, to shipments, Q):
Oi = S°i Q° (9)
SOi = Ai/IjAj (10)
Ai= [EXP(epPi/P*)][EXP(ea(Bi/Q,)/T )). (11)
Both price and delivery delay are normalized by reference values (P* and x', respectively) in the
determination of attractiveness. The parameters Ep and £a are the sensitivities of attractiveness to
price and availability, respectively. Note that because this is a disequilibrium model, orders and
shipments need not be equal. Market share, defined as each firm's share of industry shipments.
Si = Q/Z,Qj, will in general equal the firm's order share only in equilibrium.
The Firm
Firm profits are revenue, R, less total cost, C (the firm index i is deleted for clarity). Total
cost consists of fixed cost Cf plus variable costs Cy:
7i = R-(Cf + Cv). (12)
Because it takes time to process and fill orders, the price of the product may change between the
time customers place an order and receive the product. We assume customers pay the price in
effect at the time they place their order. Revenue is thus the product of the quantity shipped and the
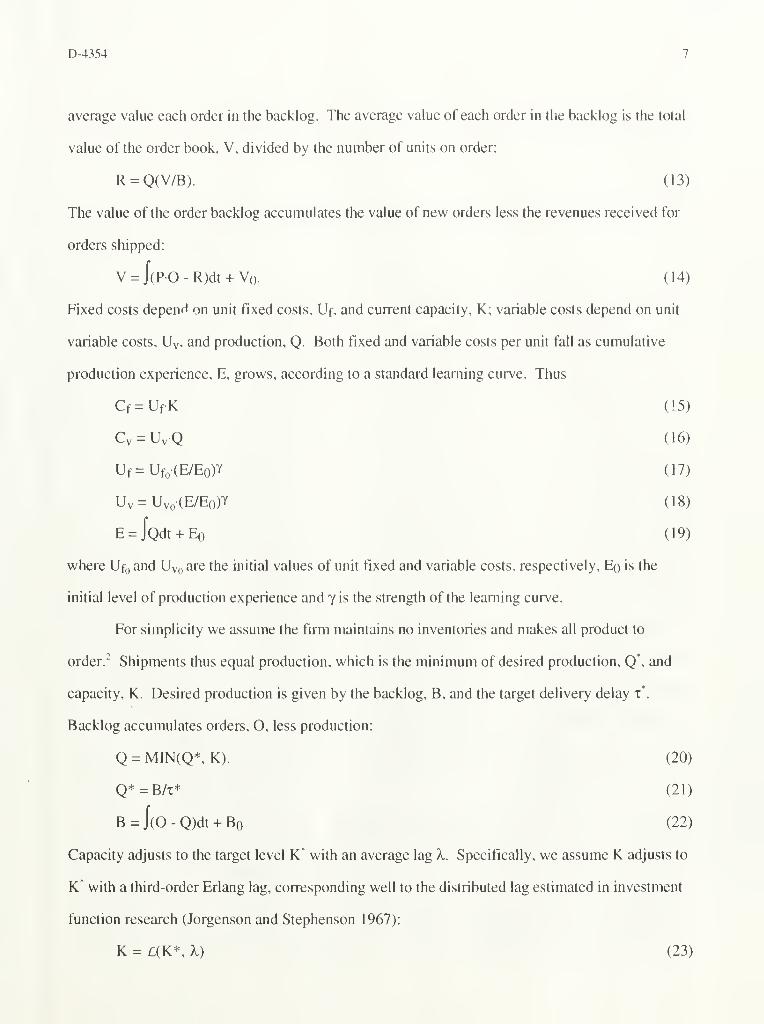
D-4354
average value each order in the backlog. The average value of each order in the backlog is the total
value of the order book, V. divided by the number of units on order:
R = Q(V/B). (13)
The value of the order backlog accumulates the value of new orders less the revenues received for
orders shipped:
V = l(PO-R)dt + Vo. (14)
Fixed costs depend on unit fixed costs, Uf, and current capacity, K; variable costs depend on unit
variable costs, Uy, and production, Q. Both fixed and variable costs per unit fall as cumulative
production experience, E, grows, according to a standard learning curve. Thus
Cf=UfK (15)
Cv = UvQ " (16)
Uf-Ufo(E/Eo)T^ (17)
Uv = Uvo(E/E())y (18)
E = lQdt + Eo (19)
where Ufo and Uvo are the initial values of unit fixed and variable costs, respectively, Eq is the
initial level of production experience and y is the strength of the learning curve.
For simplicity we assume the firm maintains no inventories and makes all product to
order." Shipments thus equal production, which is the minimum of desired production, Q', and
capacity, K. Desired production is given by the backlog, B, and the target delivery delay x*.
Backlog accumulates orders, O, less production:
Q = MIN(Q*, K). (20)
Q* = B/x* (21)
B = J(0 - Q)dt + Bo (22)
Capacity adjusts to the target level K* with an average lag X. Specifically, we assume K adjusts to
K' with a third-order Erlang lag, corresponding well to the distributed lag estimated in investment
function research (Jorgenson and Stephenson 1967):
K = £(K*, X) (23)
D-4354
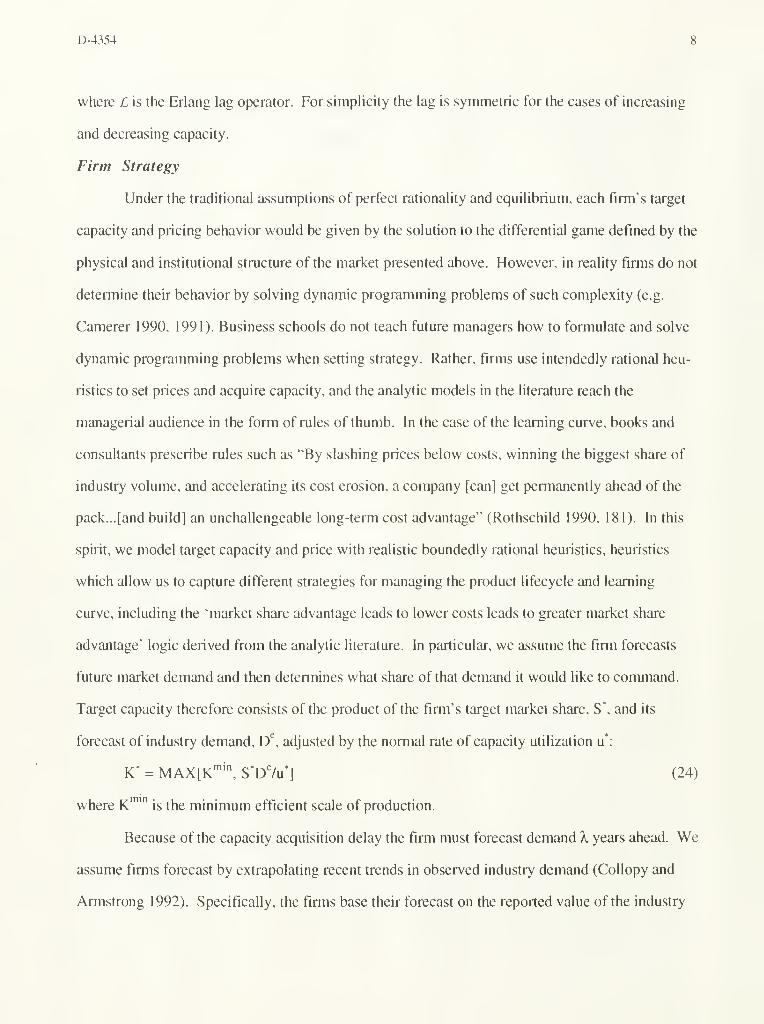
where £ is the Erlang lag operator. For simplicity the lag is symmetric for the cases of increasing
and decreasing capacity.
Firm Strategy
Under the traditional assumptions of perfect rationality and equilibrium, each firm's target
capacity and pricing behavior would be given by the solution to the differential game defined by the
physical and institutional structure of the market presented above. However, in reality firms do not
determine their behavior by solving dynamic programming problems of such complexity (e.g.
Camerer 1990, 1991). Business schools do not teach future managers how to formulate and solve
dynamic programming problems when setting strategy. Rather, firms use intendedly rational heu-
ristics to set prices and acquire capacity, and the analytic models in the literature reach the
managerial audience in the form of rules of thumb. In the case of the learning curve, books and
consultants prescribe rules such as "By slashing prices below costs, winning the biggest share of
industry volume, and accelerating its cost erosion, a company [can] get permanently ahead of the
pack. ..[and build] an unchallengeable long-term cost advantage" (Rothschild 1990, 181). hi this
spirit, we model target capacity and price with realistic boundedly rational heuristics, heuristics
which allow us to capture different strategies for managing the product lifecycle and learning
curve, including the 'market share advantage leads to lower costs leads to greater market share
advantage' logic derived from the analytic literature. In particular, we assume the firm forecasts
future market demand and then determines what share of that demand it would like to command.
Target capacity therefore consists of the product of the firm's target market share, S*, and its
forecast of industry demand, D'^, adjusted by the normal rate of capacity utilization u':
K* - MAX[K"'", S*D7u*] (24)
where K""" is the minimum efficient scale of production.
Because of the capacity acquisition delay the firm must forecast demand A. years ahead. We
assume firms forecast by extrapolating recent trends in observed industry demand (CoUopy and
Armstrong 1992). Specifically, the fimis base their forecast on the reported value of the industry

D-4354
order rate, D^ aivd exponentially extrapolate the recent growth in industry orders, g^ over the
forecast horizon X^:
D' = D'EXP(?ifg') (25)
d(D')/dt = (O - D'Vx" (26)
g' = ln(D',/D',.;,.)/?i^ (27)
where X^ is the historical horizon used to compute the expected growth rate in demand G^. The
instantaneous, current value of industry orders is not available to firms because it takes time to
collect and report the data, so the forecast is based on the reported order rate, given here by first-
order exponential smoothing of actual industry orders with a smoothing time of x^ (Sterman 1987
provides empirical evidence consistent with such forecasting procedures for both long-term energy
demand forecasts and short-term inflation forecasts).
The firm's target market share, S*, depends on its strategy. We consider two strategies,
'aggressive' and 'conservative'. In the aggressive strategy, the firm follows the recommendation
of the learning curve literature by seeking a market share large enough to move the firm down its
learning curve faster than its rivals. In contrast, the conservative firm seeks accommodation with
its rivals and sets a modest market share goal.
We also assume firms monitor the actions of their competitors. The aggressive strategy
seeks to exploit the learning curve not only by setting an aggressive market share goal but also by
taking advantage of fimidity, delay or underforecasting on the part of its rivals by opportunisfically
increasing its target when it detects sufficient uncontested demand. The conservative strategy
seeks accommodation with its rivals, but fears overcapacity and will cede addifional share to avoid
it. Thus target share is given by
{
MAX(S""", S") if Strategy = Aggressive
S* = < (28)
^j^^gmax gu^jj: Strategy = Conservative
where S"^'" and S"'''" are the minimum and maximum acceptable market share levels for the
aggressive and conservative strategies, respectively, and S" is the share of the market the firm

D-4354 10
expects to be uncontested. Expected uncontested demand is the difference between the firm's
forecast of industry demand and their forecast of competitor capacity. Expected uncontested
market share is given by the expected uncontested demand, D", as a fraction of the projected
industry demand:
S" = MAX(0, D"/D'). (29)
The MAX function maintains nonnegativity for S" even when there is excess industry capacity.
Expected uncontested demand is the firm's forecast of industry demand less the sum of the fmn's
estimates of expected competitor capacity, K*^, adjusted by the normal capacity utilization rate u*:
D" = D' - u*Sj K'j, j^i. (30)
In the base case we make the strong assumption that firms accurately monitor their competitor's
capacity plans. However, we assume there is a short delay of x'^ years required for the firm to
carry out the competitive intelligence required to estimate the competitor's target capacity
(exponential smoothing is assumed), so expected competitor capacity K^ evolves as:
d(K'j)/dt = (K*j - K'j)/x'. (31)
To model the price decision, we assume that due to administrative and decision making
lags, price, P. adjusts to a target level P*, with an adjustment time x'':
dP/dt = (P* - P)/x^ (32)
The price setting rule assumes the firm does not have the ability to determine the optimal price and
instead must search for an appropriate price level. We assume firms use the anchoring and
adjustment heuristic to form the target price. The current price forms the anchor, which is then
adjusted in response to considerations of cost, demand/supply balance, and market share, forming
a hill-climbing heuristic in which the firm searches for better prices in the neighborhood of the
current price, using costs, demand/supply balance, and market share to assess the gradient. For
simplicity we assume the target price is a multiplicatively separable function of the various
adjustment factors, and that each adjustment is linear in the input variables. Finally, the furn will
never price below unit variable cost U^,. Thus
P* = MAX{Uv, P[(l+a'^^((P^/P)-l))(l+a''((QV(u*K))-l))(l+aXS*-S))]},

D-4354 11
a' > 0; a' > 0; a' < 0. (33)
The three adjustment terms capture the firm's response to unit costs, the adequacy of its
capacity to meet demand, and its market share relative to its target share. The adjustment
parameters a determine the sensitivity of price to each adjustment pressure. The first term, the
adjustment for unit costs, moves target price towards a base price P*^ given by unit costs and the
normal profit margin m*:
P^ = (l+m*)(Uv +Uf). (34)
The firm also responds to the adequacy of its current capacity, measured by the desired rate
of production Q* divided by 'normal production', defined as the production rate given by current
capacity and the normal capacity utilization fraction u*. When this ratio exceeds unity, the firm has
insufficient capacity and increases price above the current level; excess capacity creates pressure to
lower price.
Finally, the firm attempts to price strategically in support of its capacity goals by adjusting
prices when there is a gap between its target market share S* and its current share S. When the
firm finds it desires a greater share than it currently commands, it will lower price; conversely if
market share exceeds its target it will increase price, trading off the excess market share for higher
profits and signaling rivals its desire to achieve a cooperative equilibrium.
The price formulation is consistent with the behavioral model of price in Cyert and March
(1963/1992), experimental evidence (Kampmann 1992), and econometric evidence from a similar
model of interest rate setting behavior (Hines 1987). Paich and Sterman (1993) created a product
lifecycle simulation microworld similar to the present model as an experimental system, and
estimated a similar model for pricing which captured the pricing behavior of the subjects well.'
4. Results
We begin by confirming that under condifions of perfect foresight and instantaneous market
clearing the model reproduces the conclusions of the existing literature. We then explore the
effectiveness of the learning curve strategy as these assumptions are gradually relaxed by exploring
the performance of the model in increasingly dynamic markets.

D-4354 12
For the base case the model is calibrated to capture the dynamics of typical consumer
electronics items such as camcorders (table 1 ). As scaling parameters we set the initial price at
$1000/unit, and the potential size of the market at the initial price to 60 million households, each
seeking [i = 1 unit. The product is assumed to be durable, with a 10%/year replacement rate. We
assume a 70% learning curve (costs fall 30% for each doubling of cumulative production), a
typical value for a wide range of products. The ratio of fixed to variable costs is 3: 1 . The
sensitivity of order share to price is high (Ep - -8), implying products are only moderately
differentiated by non-price factors, an a fortiori assumption that favors the effectiveness of the
learning curve strategy. We assume short delays of only one quarter year for the reporting of
industry orders and the estimation of competitor target capacity. In general these parameters favor
the success of a learning curve strategy (we present sensitivity analysis below).
We examine the behavior of the market for values of the word of mouth parameter .5 < (3<
2.5. This range generates product lifecycle dynamics that span much of the variation in observed
diffusion rates (Parker 1994, Klepper and Graddy 1990). For illustration, we define three
scenarios for the evolution of industry demand: Fa.st, Medium, and Slow, defined by values of (3 =
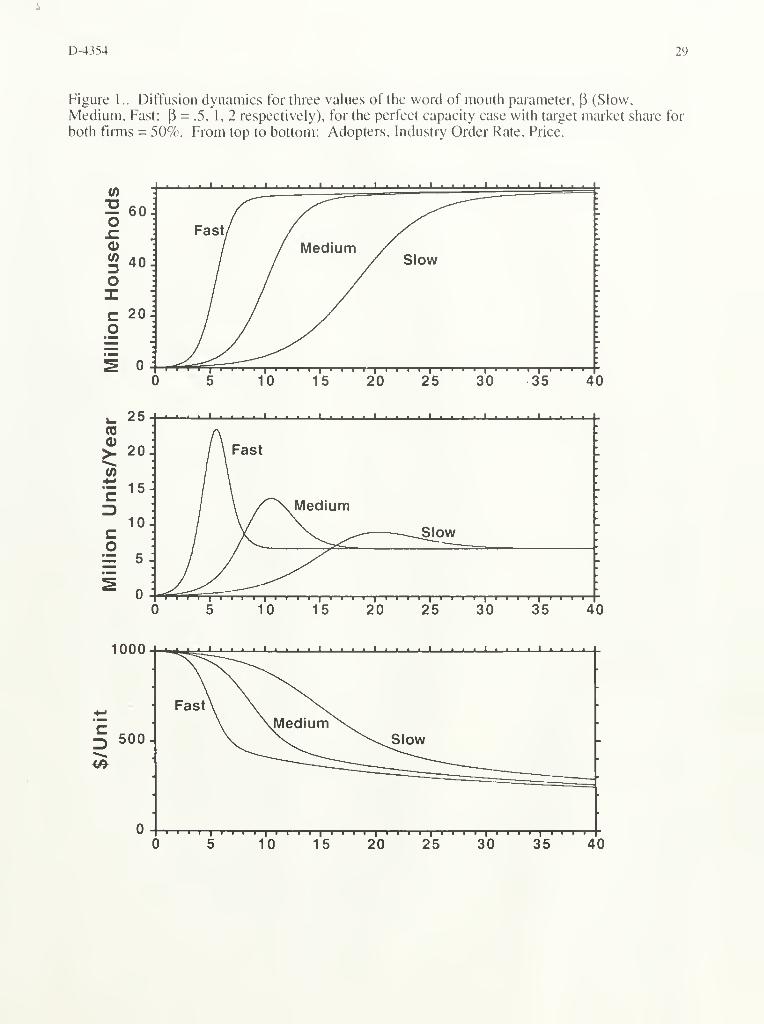
2, 1, and .5, respectively. Figure 1 shows the evolution of the industry order rate generated by the
demand sector of the model for each scenario, assuming no capacity constraints and assuming that
prices follow unit costs down the learning curve (the target market shares for both firms = .5). All
exhibit a period of rapid growth followed by a peak and decline to the equilibrium, replacement rate
of demand. The stronger the word of mouth feedback, the greater the dynamic complexity of the
market: the faster the growth, the earlier and higher the peak rate of orders, and the larger the
decline from peak to equilibrium demand. Demand in the slow scenario peaks after about 20
years, while in the fast scenario, the peak comes at about year 6. Even faster dynamics have been
documented, such as black and white televisions, calculators, and many toys and games, often
with only a few years from boom to bust.
For each of the three market scenarios identified above we test the effectiveness of the
Aggressive (A) and Conservative (C) strategies. For ease of comparison, both firms have identical

D-4354 13
parameters and initial conditions, so the playing field is level. Only the strategy each uses for
capacity planning and pricing may differ. Note in particular that the forecasting procedure used by
each firm is identical, so the two fimis have consistent beliefs about industry demand and
competitor capacity. In the aggressive strategy, the firm seeks at least 80% of the market, large
enough to provide the firm with a significant advantage in cumulative production and drive the
learning curve in its favor yet not so large as to invite antitrust action (the aggressive player will
increase its market share goal above 80% if it perceives there is additional uncontested demand).
The conservative player is willing to split the market with its rival, but will cede if it perceives a
50% share would result in excess capacity.
To test whether the model reflects the competitive dynamics analyzed in the existing
literature, we begin by assuming that capacity can instantly adjust to the level required to provide
the target rate of capacity utilization at all times:
K = Q7u*. (23')
The 'perfect capacity' case corresponds to the equilibrium assumption that the market always
clears, either because capacity can be adjusted instantly, or because agents have rafional
exf)ectations and perfect foresight so that they can perfectly anticipate the capacity acquisition lag.
The market always clears with no unintended backlog accumulations, and capacity utilization
always equals the target rate. Prices thus respond only to unit costs and the gap between the firm's
target and actual market share. The price rule yields behavior consistent with the recommendations
in the literature: the aggressive player will respond to the initial gap between target and actual
market share by reducing price below the short-term equilibrium.
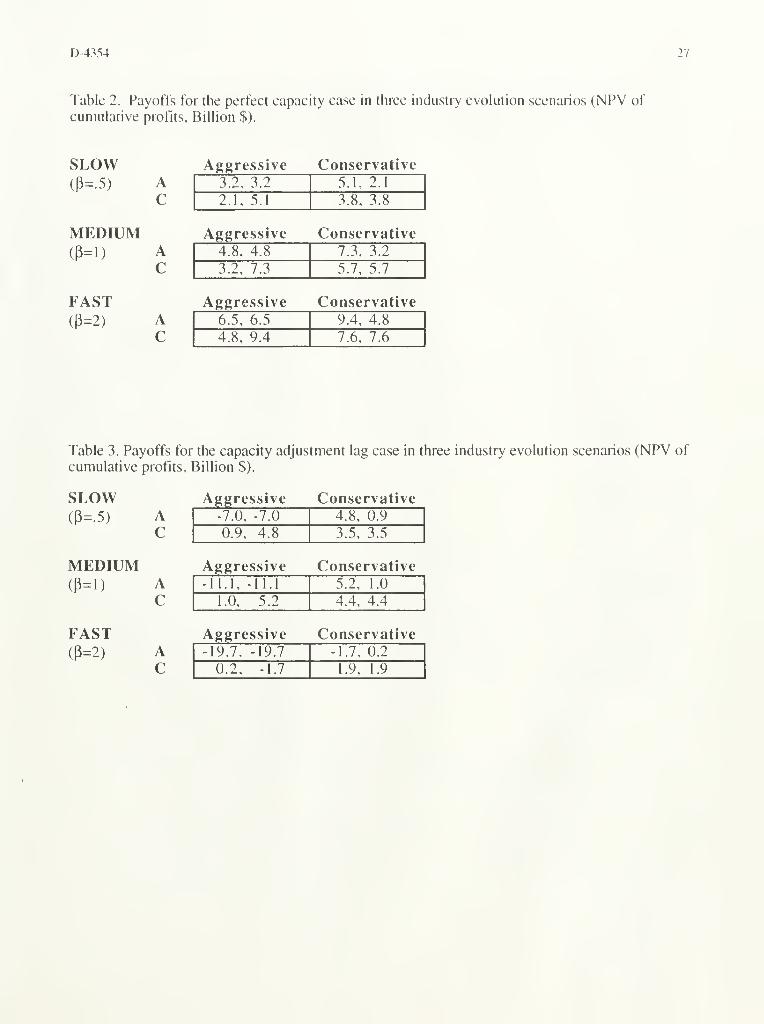
Table 2 shows discounted cumulative profits for the three market scenarios. (Throughout
the paper we use a discount rate of 4%/year and simulate the model for 40 years. The results are
robust to rates from to at least 20%/year.) In all cases the result is a prisoner's dilemma. Even
though the payoff to the cooperative, conservative strategy [C, C] maximizes the net present value
of cumulative profit for both the individual firms and the industry, each player has a strategic
incentive to defect to exploit the learning curve if they believe the other player will cede and

D-4354 14
continue to play the conservative strategy. However, a firm that finds itself playing conservative
while the other pursues the learning curve strategy would improve their position by defecting, so
[A, A] is the dominant strategy. Aggressively exploiting the learning curve is the dominant
strategy if firms must irrevocably and independently choose their strategy at the beginning of the
industry, if the firm can credibly commit to the aggressive strategy and persuade its rival to
acquiesce, or if the first mover gains sufficient advantage before rivals can respond.
The faster the dynamics of the market unfold, the greater industry profits are for any
strategy combination (figure 2 shows the relative payoffs in the market clearing case as functions
of the word of mouth parameter [3). Stronger word of mouth brings people into the market sooner,
hence boosting cumulative profit. Consistent with Kalish (1983), the advantage of the aggressive
strategy, and thus the strategic incentive to defect, increases with the speed of the product lifecycle.
Similarly, sensitivity analysis shows that the stronger the learning curve, the greater is the strategic
incentive to play the aggressive strategy.
These results show the model conforms to the game-theoretic result when we assume
instantaneous and perfect capacity adjustment. An appropriable learning curve makes it optimal to
expand capacity and price below the short-run profit maximizing level. The stronger the learning
curve, the greater the incentive to pursue the aggressive strategy. Likewise, the faster the growth
of the market, the greater is the advantage of the aggressive strategy.
We now examine the case where the firm faces the capacity adjustment lag and must
therefore forecast industry demand and competitor responses, as specified by the behavioral rules
in equations 23-34. Figure 3 shows the payoffs as they depend on the word of mouth parameter;
table 3 shows the payoff matrices for the different scenarios. The capacity adjustment lag and
behavioral decision rules dramatically alter the payoffs to the different strategies. As long as the
market dynamics are sufficiently slow, the firm's capacity forecasts are accurate enough and the
aggressive strategy dominates. However, for market dynamics faster than those given by a critical
value of the word of mouth parameter, P*^'^^=1.3, the conservative strategy dominates the
aggressive strategy, contrary to the prescription of the equilibrium models. Neither firm has any
D-4354
incentive to defect, and [C, C] becomes the unique Nash equiUbrium. Note the penalty imposed
when both firms play the aggressive strategy is much greater than in the market clearing case.
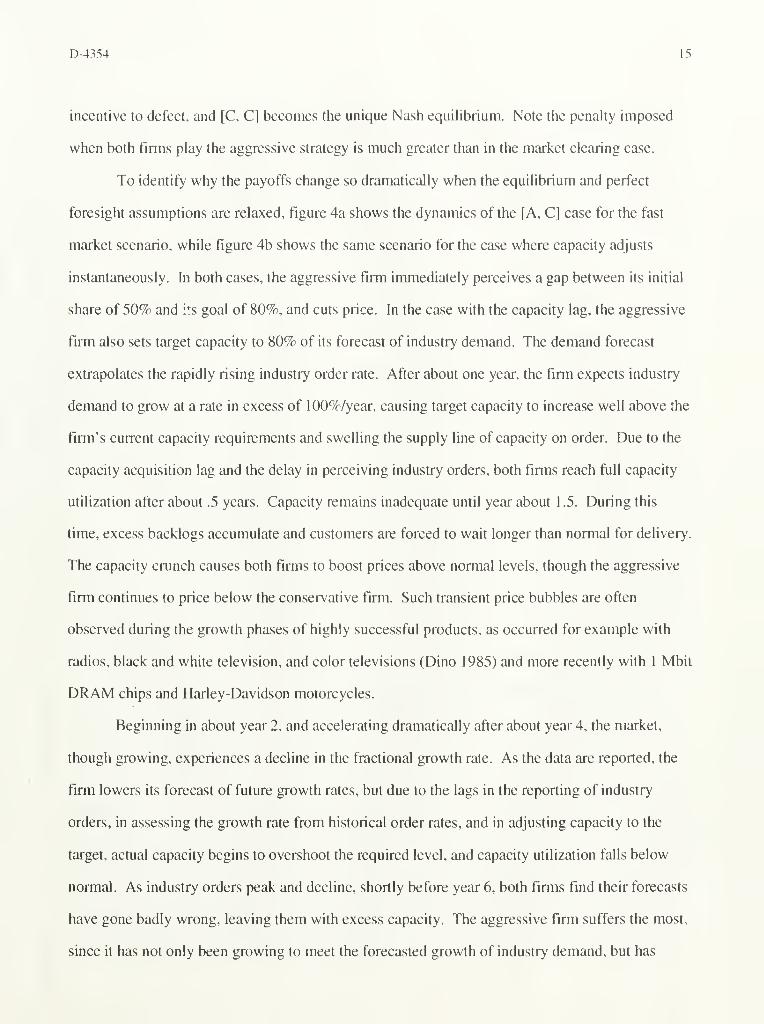
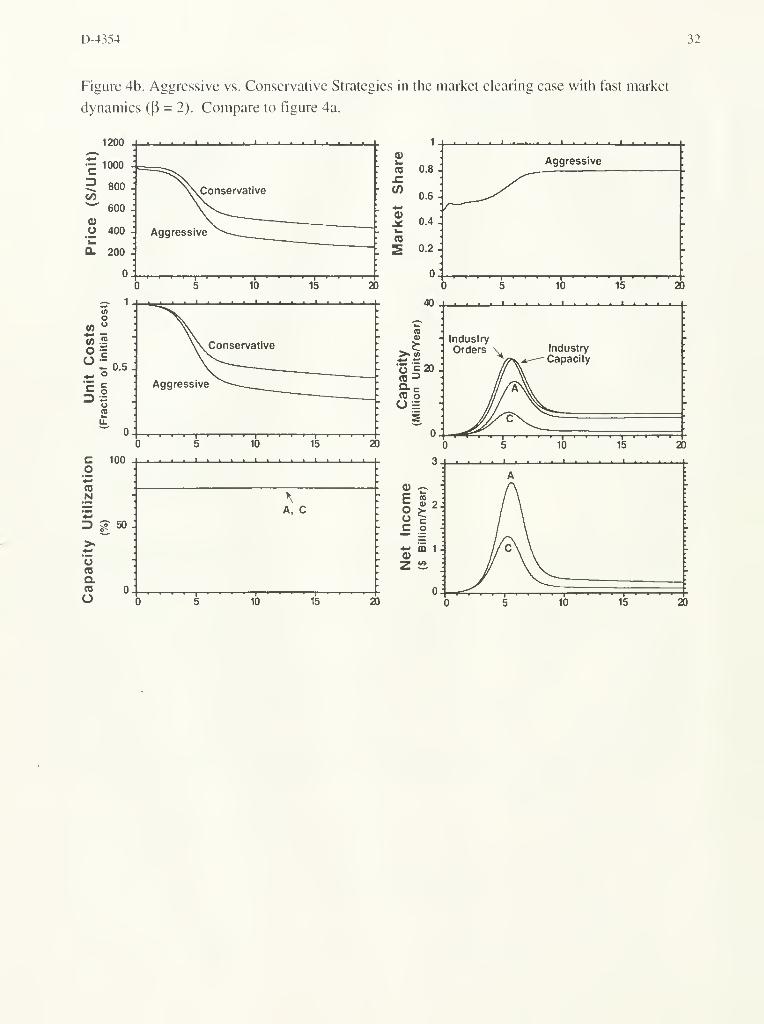
To identify why the payoffs change so dramatically when the equilibrium and perfect
foresight assumptions are relaxed, figure 4a shows the dynamics of the [A, C] case for the fast
market scenario, while figure 4b shows the same scenario for the case where capacity adjusts
instantaneously. In both cases, the aggressive firm immediately perceives a gap between its initial
share of 50% and its goal of 80%, and cuts price, hi the case with the capacity lag, the aggressive
firm also sets target capacity to 80% of its forecast of industry demand. The demand forecast
extrapolates the rapidly rising industry order rate. After about one year, the firm expects industry
demand to grow at a rate in excess of 100%/year, causing target capacity to increase well above the
firm's current capacity requirements and swelling the supply line of capacity on order. Due to the
capacity acquisifion lag and the delay in perceiving industry orders, both firms reach full capacity
utilization after about .5 years. Capacity remains inadequate until year about 1.5. During this
time, excess backlogs accumulate and customers are forced to wait longer than normal for delivery.
The capacity crunch causes both firms to boost prices above normal levels, though the aggressive
firm continues to price below the conservative firm. Such transient price bubbles are often
observed during the growth phases of highly successful products, as occurred for example with
radios, black and white television, and color televisions (Dino 1985) and more recently with 1 Mbit
DRAM chips and Harley-Davidson motorcycles.
Beginning in about year 2, and accelerating dramatically after about year 4, the market,
though growing, experiences a decline in the fractional growth rate. As the data are reported, the
firm lowers its forecast of future growth rates, but due to the lags in the reporting of industry
orders, in assessing the growth rate from historical order rates, and in adjusting capacity to the
target, actual capacity begins to overshoot the required level, and capacity utilization falls below
normal. As industry orders peak and decline, shortly before year 6, both firms find their forecasts
have gone badly wrong, leaving them with excess capacity. The aggressive firm suffers the most,
since it has not only been growing to meet the forecasted growth of industry demand, but has

D-4354 16
during the same period been growing at an additional rate to increase its market share (note that the
aggressor's capacity peaks later as well as higher than that of the conservative firm). As boom
becomes bust, the aggressive fimi finds capacity utilization drops below 50%. The conservative
firm also experiences excess capacity, but the magnitude and duration of the problem is signifi-
cantly less since the conservative player has been steadily giving up market share during the
growth phase, partially offsetting its excessively optimistic forecasts. The pattern of capacity
overshoot is widespread in maturing industries (Porter 1980), and was frequently observed in
Paich and Sterman's (1993) experimental product lifecycle task, even when subjects had experi-
ence with the dynamics. As a result of the excess capacity generated by the saturation of the
market, both firms experience a period of losses as revenues drop below fixed costs. The losses
of the aggressive firm, however, are substantially larger than those of the conservative firm. The
aggressor generates a net loss of more than $2 billion per year as industry sales peak around year
6. Though the aggressive firm earns superior profits after year 8 these fail to compensate for its
earlier losses, leaving it with discounted cumulative profits of -$1 .7 billion by year 40.
The failure of the aggressive strategy when the market dynamics are rapid is not due to the
failure of the learning curve to confer cost advantage on the aggressive firm. As in the perfect
capacity case, the aggressive strategy achieves its intended goal: low prices and rapid expansion
quickly give the aggressor a cost advantage which steadily widens as the industry moves through
its lifecycle. Indeed, at the end of the simulation, the aggressive firm has unit costs only 42% as
great as its rival, a larger advantage than it enjoyed in the perfect capacity case. The failure of the
aggressive strategy is due entirely to the combination of the capacity adjustment lag with a bound-
edly rational forecasting heuristic.
When capacity adjusts perfectly the aggressive strategy always dominates the conservative
strategy and faster market evolution increases the advantage of the aggressive strategy (figure 2).
In contrast, when firms face a capacity adjustment lag, the costs of excess capacity induced by
forecast error increase with the speed of the product lifecycle. Eventually, the costs of excess
capacity overwhelm the cost advantage of the learning curve, and the aggressive strategy becomes

D-4354 17
inferior (figure 3). As the dynamic complexity of the market environment grows, or as the
capacity acquisition lag increases, the likelihood of significant capacity overshoot grows, and an
aggressive strategy becomes significantly less profitable than the conservative strategy even if a
firm is able to commit to an aggressive strategy secure in the knowledge that its rival will cede.
Sensitivity Analysis
Before drawing any general conclusions from the results it is important to explore the
degree to which they are sensitive to assumptions. Despite substantial variations in key parameters
(table 4), the critical value of the word of mouth parameter above which the learning curve strategy
becomes inferior, P^"^'^, remains in the range from 2.0 to less than .5, corresponding to sales
peaks from five to twenty years after product launch, well within the range documented for
numerous real products (Parker 1994).
We have made a number of assumptions that reduce the attractiveness of a learning curve
strategy. First, to the extent capacity can be used to make follow on products the costs of capacity
overshoot will be mitigated. Second, we assume there are no economies of scope allowing
follow-on or related products to share in the benefits of learning. To the extent learning can be
passed on to other products, thereby conferring advantage to them, the costs of capacity overshoot
are offset even if capacity is not fungible with successor products. Third, we assume there are no
returns to scale or other positive feedback processes such as network externalities. Additional
positive feedbacks or other sources of increasing returns favor the aggressor just as a stronger
learning curve increases the advantage of the aggressive strategy (see e.g. Arthur 1989). Fourth,
we assume there is no growth in the underiying pool of potential customers. This too would
reduce the severity of the saturation peak. Fifth, we assume a durable product. More frequent
repurchases reduces the dynamic complexity of the market and the magnitude of the decline from
peak to replacement sales rates.
One of our key behavioral assumptions is that firms forecast industry demand by
extrapolating past demand and have no advance knowledge of the market's saturation point. In the
case of durable goods, extrapolative methods necessarily overshoot as growth gives way to

D-4354
saturation. Clearly, better forecasting would favor the aggressive learning curve strategy, as
shown by the results of the market clearing case. The evidence is not encouraging. In Paich and
Sterman's (1993) experimental version of the present model, subjects consistently failed to forecast
the sales peak, leading to excess capacity and large losses similar to those simulated here - even
after extensive experience with the task. Outside the laboratory, a wide range of new product
diffusion models have been developed which, in principle, allow forecasting of the sales peak
(Parker 1994 and Mahajan et al. 1990 review the extensive literature). In practice, diffusion
models often miss the turning point as well, since, as Mahajan et al. (1990) write, "by the time
sufficient observations have developed for reliable estimation, it is too late to use the estimates for
forecasting purposes." Rao (1985) examined the ability often popular models to predict sales of
typical durable goods. Mean absolute percent forecast errors averaged more than 40% across all
models and products. The extrapolative models generally outperformed the diffusion models.
On the other hand a number of our assumptions tend to increase the advantage of an
aggressive strategy. We assume learning is perfectly appropriable, increasing the ability of firms to
gain sustained cost advantage. We assume market share is quite elastic so that modestly lower
prices bring significant share advantage, strengthening the positive feedbacks created by the learn-
ing curve. We also assume that production adjusts instantaneously at constant marginal cost (until
capacity utilization reaches 100%), and that capacity can be adjusted continuously with an average
lag ofjust one year, less than the typical lags estimated in the literature. There are no capacity
adjustment costs or exit costs. A longer capacity lag or more realistic adjustment costs would sig-
nificantly increase the magnitude and cost of forecast errors. We omit balance sheet considerations
and thus the risk of bankruptcy: aggressive firms that ultimately do well might not survive the
losses of the transition from boom to bust, again favoring the aggressive strategy. The information
on which the firm bases its decisions is free of noise, measurement error, bias, or other distortion.
We assume firms can base their forecasts on industry orders, reported with only a one-quarter year
lag, when in most industries order data are unavailable and firms must rely on estimates of industry
revenues or shipments for forecasting, introducing an additional delay and also confounding

D-4354 19
demand (orders) with capacity (which may constrain shipments below the rate of incoming orders
during periods of rapid demand growth). Most importantly, we assume that the competitor's
planned capacity target is fully known with only a short delay. Relaxing any of these assumptions
strengthens our results and causes the aggressive strategy to be dominated by the conservative
strategy at lower rates of market growth and for less durable products.
The assumption that firms know their rivals' planned capacity levels bears closer
examination. Extensive experimental studies (Sterman 1989a, 1989b, Paich and Sterman 1993,
Diehl and Sterman 1995, Kampmann 1992) show in a wide range of exp)erimental markets that
people ignore or give insufficient weight to the supply line of pending capacity or production. The
tendency to ignore the supply line (and more generally, failing to account for delays, e.g. Brehm.er
1992) is robust: it occurs even in settings where the contents of the supply line are available
costlessly and at all times, are prominently displayed, and are highly diagnostic, and where
subjects had financial incentives to perform well. Failure to account for time delays and supply
lines appears to be common in real markets as well. Studies show few real estate developers, for
example, take account of the supply line of projects under development (Thornton 1992, Bakken
1993), leading to periodic overbuilding. Figure 5 shows the payoffs in the case where we assume
firms do not account for the supply line of pending capacity but instead use the competitors'
current capacity to estimate uncontested demand:
K'j = Kj. (31')
When the supply line is ignored the aggressive strategy is inferior for all the market environments
tested. Ignoring the supply line ensures that during the growth phase each firm erroneously
believes its rival is expanding capacity much less than it actually is, and overestimates uncontested
demand. The aggressive player opportunistically increases its target capacity still further and the
conservative player fails to cede sufficiently, leading to a much larger overshoot of capacity and
much larger losses when the market saturates. The aggressive strategy is dominated by the
conservative strategy even in the slow scenario where demand for the product peaks 20 years after
its introduction and the decline from peak to equilibrium sales is small.
D-4354 20
5. Discussion and Conclusions
Prior research has shown that under assumptions of equilibrium and perfect rationality, the
optimal strategy for a firm facing a learning curve is to aggressively preempt competitors, cutting
price and boosting output beyond the static optimum levels. We have shown that under a more
realistic set of assumptions, the normative result can be reversed. When there are capacity
adjustment lags, commonly used forecasting heuristics lead to capacity overshoot as a market
saturates. Investing in additional capacity and lower prices to achieve learning benefits is only
optimal when the dynamic complexity of the market, and hence the risk of capacity overshoot, is
low. In these circumstances fully and boundedly rational decision making converge. However, as
the dynamic complexity of the market increases, disequilibrium effects and systematic decision
making errors become more important, and cause the predictions of the rational model to fail.
These conclusions are consistent with experimental and empirical evidence. The results
predict that learning curve strategies will perform best in industries where there is slow demand
growth (or where customer awareness of the product category is already high), the product has a
high repeat purchase rate and is fairly undifferentiated, or where capacity can be adjusted rapidly at
low cost. Observations that learning curve strategies generally led to sustained advantage in
industries such as synthetic fibers, bulk chemicals, and disposable diapers (Shaw and Shaw 1984,
Porter 1984, Lieberman 1984, and Ghemawat 1984 respectively) are broadly consistent with this
prediction. Similarly, our results predict poor performance for aggressive strategies in industries
with high word of mouth, durable, differentiated products, or long capacity adjustment delays.
The overcapacity, excess inventory, and price wars observed in industries such as televisions and
VCRs, toys and games, lighting equipment, snowmobiles, hand calculators, tennis equipment,
bicycles, chain saws, semiconductors, and running shoes cited earlier support this proposition.
The results have implications both for practicing managers and for the larger issue of the
modeling tools most appropriate for the study of strategic behavior. The recommendation to
pursue a learning curve strategy must always be treated with caution. Current texts and theory
suggest firms should assess the strength and appropriability of learning curves in their industry and

D-4354 21
recommend aggressive preemption in the presence of strong, appropriable learning curves or other
positive feedbacks that confer increasing returns. Our results show that firms must also determine
whether they are vulnerable to capacity overshoot or underestimation of competitor capacity plans.
A firm electing to pursue a learning curve driven strategy must devote significant effort to
understanding the dynamics of market demand so that it is not caught unprepared by market satu-
ration. It must clearly and credibly signal its capacity intentions in a rapidly growing market so that
less aggressive players will not unintentionally overbuild. To prevent competitor overbuilding, it
may find it optimal to share its forecasts and market intelligence with rivals. Experience and
experimental studies suggest that this is both hard medicine to take and difficult to carry out
successfully. Rather, it appears that when high dynamic complexity increases the risk of capacity
overshoot, firms should consider conservative strategies even in the presence of learning curves
and other sources of increasing returns, allowing less sensible rivals to play the aggressive strat-
egy, then buying these rivals at distress prices when they fail during the transition from boom to
bust. Jack Tramiel followed just such a strategy, purchasing Atari from Warner Communications
after the peak in the video game market for $160 million in unsecured debt and no cash, while
Warner took a $592 million writeoff of Atari assets on top of $532 million in Atari losses.
On the methodological front, our results suggest that the equilibrium and rationality
assumptions of game theory and microeconomics are not robust. More realistic physical,
institutional and behavioral assumptions can reverse the neoclassical result and reveals a much
more complex relation between the learning curve, the dynamics of demand and firm strategy.
When the system dynamics are sufficiently slow, the delays in information acquisirion,
decision making and system response sufficiently short, and the cognitive demands on the agents
sufficiently low, behavioral theories will yield predictions observationally indistinguishable from
those of equilibrium models. However, in cases of high dynamic complexity, boundedly rational
people can and do behave significantly differently. The case of the learning curve in a dynamic
market shows these differences can matter greatly, and their impact can be examined rigorously.
We speculate that relaxing the assumptions of rationality and equilibrium may lead to similar

D-4354 22
differences in a variety of other contexts. Such cases are likely to include settings in which there
are long time delays between action and effect or in the reporting of information, where there are
positive feedback processes (increasing returns), and where there are significant nonlinearities
(Stemian 1994, Arthur 1994). Likely examples include markets such as shipbuilding, real estate,
paper, and many others plagued by chronic cyclicality, and industries with network externalities
and standard formation issues such as telecommunications and software. We suggest the
combination of game theoretic reasoning with behavioral simulation models can help create a
meaningful 'behavioral game theory' (Camerer 1990, 1991), that is, a behaviorally grounded,
empirically testable, and normatively useful theory of disequilibrium dynamics in strategic settings.
NOTES
1
.
The model is solved by Euler integration with a time step of .0625 years. The results are not
sensitive to the use of smaller time steps or higher-order integration methods.
2. Including inventories would substantially destabilize the system (Sterman 1989b); omitting
inventories is thus an a fortiori assumption.
3. Paich and Sterman ( 1993) estimated a slightly different form of the model, in which there was
no market share effect. They found the cost effect was very strong, while the response to the
demand/supply balance was quite weak.

D-4354 23
References
Armstrong, J. S. (1985) Long Range Forecasting. 2nd ed. John Wiley & Sons, New York.
Arthur, W. Brian, (1989) "Competing Technologies, Increasing Returns, and Lock-In byHistorical Events," Economic Journal, 99, 116-131.
Arthur, W. Brian, (1994) Increasing Returns and Path Dependence in the Economy. Ann Arbor:
University of Michigan Press.
Bakken, Bent, (1993) "Learning and Transfer in Dynamic Decision Environments," Unpublished
Ph.D. thesis, MIT Sloan School of Management.
Bass, F. M. (1969) A New Product Growth Model for Consumer Durables. ManagementScience. 15, 215-227.
Beinhocker, E. (1991) "Worlds of Wonder (A) and (B)." MIT Sloan School of ManagementCase Study. Available from Prof. John Sterman, Cambridge, MA 02142.
Brehmer, B. (1992) Dynamic Decision Making: Human Control of Complex Systems. Acta
PsychologicaSl, 21 1-241.
Business Week (1992) "L.A. Gear Still Looks Like an Also-Ran." December 21, p. 37.
Camerer, C.F. (1990) "Behavioral Game Theory." Insights in Decision Making: A Tribute to
Hillel J. Einhorn., Hogarth, R.M., Ed., The University of Chicago Press, Chicago.
Camerer, C. F. (1991) "Does Strategy Research Need Gaine Theory?" Strategic ManagementJournal, 12 (Winter, special issue) 137-152.
Collopy, F., and Armstrong, J. S. (1992) Expert opinions about extrapolation and the mystery of
the overlooked discontinuities. International Journal of Forecasting. 8, 575-582.
Cyert, R.M. and March, J.G. (1963) A Behavioral Theory of the Firm. Prentice Hall, NJ.
Diehl, E., & Sterman, J. D. (1995) Effects of Feedback Complexity on Dynamic Decision
Making. Organizational Behavior and Human Decision Processes, 62(2), 198-215.
Dino, Richard (1985) Forecasting the Price Evolution of New Electronic Products. Journal ofForecasting. 4, 39-60.
Dutton, J.M. and Thomas, A. (1984) "Progress Functions as a Managerial Opportunity."
Academy of Management Review, 9, 235-247.
The Economist. (1991) "Japan's Chip Makers: Falling Off the Learning Curve." Feb. 23, 64-66.
Forrester, J. W. (1961) Industrial Dynamics. Cambridge MA: The MIT Press.
Fudenberg, D. and Tirole, J.J. (1983) "Learning by Doing and Market Performance." Bell
Journal of Economics, 14, 522-530.
Fudenberg, D. and Tirole, J.J. (1986) Dynamic Models of Oligopoly. Harwood, London.

D-4354 24
Ghemawat, P. (1984) "Capacity Expansion in the Titanium Dioxide Industry." Journal ofIndustrial Economics. 33, 145-163.
Ghemawat, P. and Spence, M. (1985) "Learning Curve Spillovers and Market Performance."
Quarterly Journal of Economics, 100, 839-852.
Hax, A. C, and Majluf, N.S. (1984) Strategic Management: An Integrative Perspective.
Prentice-Hall, Englewood Cliffs, NJ.
Hines, J. (1987) Three essays in behavioral economic modeling. Unpublished Ph.D.
dissertation, MIT Sloan School of Management.
Jorgenson, D., and Stephenson, J. (1967) The Time Structure of Investment Behavior in United
States Manufacturing, 1947-1960. Review ofEconomics and Statistics. 49, 16-27.
Kalish, S. (1983) "Monopolist Pricing with Dynamic Demand and Production Cost." Marketing
Science, 2, 135-159.
Kampmann, Christian (1992) "Feedback Complexity and Market Adjustment in Experimental
Economics," Unpublished Ph.D. Thesis, MIT Sloan School of Management.
Klepper, S. and Graddy, E. (1990) "The Evolution of New Industries and the Determinants of
Market Structure." RAJ^ID Journal of Economics, 21, 27-44.
Krugman, P. (1987) "The Narrow Moving Band, the Dutch Disease, and the Competitive
Consequences of Margaret Thatcher: Notes on Trade in the Presence of Dynamic Scale
Economies." Journal ofDevelopment Economics. 27, 41-55.
Krugman, P. (1990) Rethinking International Trade. MIT Press, Cambridge, MA.
Lieberman, M.B. (1984) "The Learning Curve and Pricing in the Chemical Processing
Industries." RAND Journal of Economics. 15,218-228.
Mahajan, v., Muller, E., and Bass, F. (1990) "New Product Diffusion Models in Marketing: AReview and Directions for Research." Journal ofMarketing, 54, 1-26.
Majd, S., and Pindyck, R.S. (1989) "The Learning Curve and Optimal Pricing UnderUncertainty." RAND Journal of Economics, 20, 331-343.
Makridakis, S. et al. (1982) The accuracy of extrapolation (time series) methods: results of a
forecasting competition. Journal ofForecasting, 1, 111-153.
Makridakis, S., et. al. (1993) The M2 competition: areal time judgmentally based forecasting
study. International Journal ofForecasting, 9, 5-22.
Mayer, T. (1960) Plant and equipment lead times. Journal of Business. 33, 127-132.
Morecroft, J. (1985) Rationality in the analysis of behavioral simulation models. ManagementScience 3l{7), 900-916.
Oster, S.M. (1990) Modern Competitive Analysis. Oxford University Press, New York.
Paich. M., & Sterman, J. D. (1993) Boom, Bust, and Failures to Learn in Experimental Markets.
Management Science, 39(12), 1439-1458.

D-4354 25
Parker, P. (1994) Aggregate diffusion forecasting models in marketing: A critical review.
International Jcnirnal of Forecasting. 10, 3453-380.
Porter. M.E. (1980) Competitive Strategy. The Free Press, New York.
Porter, M.E. (1984) "Strategic Interactions: Some Lessons from Industry Histories for Theory
and Anti-Trust Policy." In Lamb, R.B. (ed.). Competitive Strategic Management. Prentice
Hall, Englewood Cliffs, NJ.
Rao, S. K. (1985) An empirical comparison of sales forecasting models. Journal of Product
Innovation Management. 2, 232-242.
Rothschild, M. (1990) 5/onow/c5. New York: Henry Hoh.
Salter, M. (1969) "Tensor Corporation." Harvard Business School Case 370-041. HES CaseServices, Boston, MA 02163.
Saporito, B. (1992) "Why the Price Wars Never End." Fortune, March 23, 67-78.
Shaw, R.W. and Shaw, S.A. (1984) "Late Entry, Market Shares, and Competitive Survival: the
Case of Synthetic Fibers." Managerial Decision Economics, 5, 72-79.
Simon, H.A (1976) Administrative Behavior. Free Press, NY.
Simon, H.A (1979) "Rational Decision Making in Business Organizations." The AmericanEconomic Review, 69, 493-513.
Simon, H.A (1982) Models ofBounded Rationality. The MIT Press, Cambridge, MA.
Spence, A.M. (1979) "Investment Strategy and Growth in a New Market." The Bell Journal ofEconomics, 10, 1-19.
Spence, A.M. (1981) "The Learning Curve and Competition." The Bell Journal ofEconomics,
12, 49-70.
Sterman, J. D. (1987) Expectation Formation in Behavioral Simulation Models. Behavioral
Science, 32, 190-211.
Sterman, J. D. (1989a) "Misperceptions of Feedback in Dynamic Decision Making."
Organizational Behavior and Human Decision Processes, 43, No. 3, 301-335.
Sterman, J. D. (1989b) "Modeling Managerial Behavior: Misperceptions of Feedback in a
Dynamic Decision Making Experiment." Management Science, 35, No. 3, 321-339.
Sterman, J. D. (1994) Learning In and About Complex Systems. System Dynamics Review, 10(2-
3), 291-330.
Thornton, Liam (1992) Real Estate Development Firms as Learning Organizations: Systems
Thinking as a Methodology for Strategic Planning. Unpublished SM Thesis, MIT Center for
Real Estate Development.
Tirole, J. (1990) The Theory of Industrial Organization. The MIT Press, Cambridge, MA.

D-4354
Table 1 . Parameters and initial conditions for the base case.
n number of firms in industry 2
|i Average number of units per household (units/household) 1
a Propensity for nonadopters to adopt the product autonomously ( 1/years) .001
P Propensity for nonadopters to adopt the product through word of mouth (1/years) 1
POP Total population (households) 100e6
a Slope of the demand curve (Households/($/unit)) -.2(P0P7P*)
POP* Population that would adopt at the reference price P* (households) 60e6
P' Price at which industry demand equals the reference population POP* ($/unit) 1000
5 Fractional discard rate of units from the installed base (1/years) . 1
Ep Sensitivity of product attractiveness to price -8
Ea Sensitivity of product attractiveness to availability -4
UvQ Initial unit variable cost ($/unit) (Pio/(l+ m*))/(l+c)
Ufo Initial unit fixed cost ($/unit) c(Pi(/(l+ m*))u7(l+c)
c Ratio of fixed to variable costs (dimensionless) 3
Y Strength of the learning curve (dimensionless) log2(.7)
X* Target delivery delay (years) .25
X Capacity acquisition delay (years) 1
u* Target capacity utihzation rate (dimensionless) .8
K"^'" Minimum efficient scale (units/year) le5
V Forecast horizon (years) A.
X Time delay for reporting industry order rate (years) .25
V' Historic horizon for estimating trend in demand (years) 1
x*^ Time delay for estimating competitor target capacity (years) .25
x"^ Adjustment time for price (years) .25
a' Weight on costs in determination of target price (dimensionless) 1
a'' Weight on demand/supply balance in determination of target price (dimensionless) . 5
a* Weight on market share in determination of target price (dimensionless) -.10
m* Target profit margin (dimensionless) .2
M() Inifial number of adopters (households) .00 IM*
IjQ Initial installed ba.se of product for firm i (units) .5\iM
VjQ Initial value of order backlog of finn i ($) Pi^iO
Bjy Initial order backlog of firm i (units) ^Qqx'
Ejo Inifial cumuladve production experience of firm i (units) 10e6
K Initial capacity of firm i (units/year) K*
K'^j Initial estimate of competitor j's target capacity (units/year) K'j
D'^io Inifial value of reported industry demand (units/year) Q°
Pjo Initial price of firm i ($/unit) 1000
D-4354 27
Table 2. Payoffs for the perfect capacity case in tliree industry evolution scenarios (NPV of
cumulative profits. Billion $).
SLOW

D-4354
Table 4. Sensitivity analysis. The critical value of the word of mouth parameter, |3 , is the value
of P such that the aggressive strategy is inferior for values of [3 > P*^"'^ . The larger the value of
P^"'^, the more robust is the learning curve strategy to a rapid product lifecycle. § denotes the base
case value.
Parameter
D-4354 29
Figure 1.. Diffusion dynamics for three values of the word of mouth parameter, p (Slow,
Medium. Fast: (3 = .5, 1,2 respectively), for the perfect capacity case with taiget market share for
both firms = 50%. From top to bottom: Adopters, hidustry Order Rate, Price.
I ' ' ' ' I
15 20I I I
II I I
30 35 40
I I » ''''''
1 ^ 1 iI
I II II
I I I II
I i-'i I'IT
I 1 I II
1 » II
f I I II
I I I I
5 10 15 20 25 30 35 40
1000
500-
</»
I I I II
I I I II
I I I II
I I II
I I I II I I
II I I—I I I I I
5 10 15 20 25 30 35 40

D-4354 30
Figure 2. Firm Payoffs as they depend on the speed of the product lifecycle, perfect capacity case.
The aggressive strategy always dominates.
12
2 -^
AI[A,A]
CI[A,C]
0.5
I I I I I II
I I I I
1.5 2 2.5
Strength of WOM ((3)
Figure 3. Firm Payoffs as they depend on the speed of the product Hfecycle when capacity adjusts
with a one-year lag. The aggressive strategy is inferior for values of P>|3'^'^'^. Compare to figure 2.
CI[C,C]
oQ.
a>>
= gE =3 mO ^
>Q.
CI[A,C]
Aggressive Strategy
dominant for p < p'^"'^
AI[A,A]
0.5
I II I I
1
Aggressive Strategy
Interior for p > |3'='"'
AI[A,C]
1.5
P I I I 1 "1^^^^
2 2.5
Strength of WOM (p)

D-4354 31
Figure 4a. Dynamics of tiie aggressive vs. conservative strategies in the fast market scenario (p =
2), with the capacity acquisition lag.
o 400 :
Q- 200 :
-I >—
I
_• I I I b_L
Aggressive
0.2 -
ino
IIoto
150
'
Aggressive
ft«ii'i ifi| I
5 10I •
15 20
Aggressive
—1—1—I—I——I—
10 15
40
Q0)
O = 20re =>
20''''*'**''**'
150
—I—
15
--'-- * 1 » » » » I 1
C 100
A ,
D-4354 32
Figure 4b. Aggressive vs. Conservative Strategies in the market clearing case with fast market
dynamics (P = 2). Compare to figure 4a.
• L. '
Aggressive

D-4354 33
Figure 5. Firm Payoffs as they depend on the speed of the product Hfecycle when competitor
capacity is estimated without regard to the supply Hne of pending capacity. The aggressive strategy
is inferior for |3 > .5.
5 -

^^70 13\


MIT LIBRARIES
3 9080 00939 8964
