a basic introduction to standard molecular biology techniques...in the laboratory practicals, you...
TRANSCRIPT
A Basic Introduction To StandardMolecular Biology Techniques
July 26th – August 6th 2010
Course Run by Patricia Dyal
Contact : +44 (0) 207 942 5059/5427Email: [email protected]

Contents Page
Course Timetable
Introduction 1
Laboratory Health and Safety 2
Use of Pipettes 3
Section 1: Isolation of genomic DNA from Cestodes and Digeneans 4
1.1: Tissue solubilisation 5
1.2: Purification of DNA from cell lysate 6
1.3: Agarose gel analysis of purified gDNA 8
1.4: Nanodrop quantitation of DNA 10
Section 2: PCR amplification of a specific genomic region – Large subunit 12
(LSU) and Small subunit (SSU) genes
2.1: PCR reaction setup using RTG beads 13
2.2: Agarose gel analysis of unpurified PCR reactions 15
2.3: Affinity column cleanup of PCR reactions 15
2.4: Agarose gel analysis of purified PCR reactions 17
2.5: Nanodrop quantitation of purified PCR product 17
Section 3: Cycle sequencing 18
3.1: Calculate the amount of DNA needed in sequencing reaction 18
3.2: Sequencing reaction setup 18
Section 4: Isolation of fish genomic DNA using Qiagen DNeasy DNA extraction 20
Kit
4.1: Tissue solubilisation 20
4.2: Purification of DNA from cell lysate 21
4.3: Agarose gel analysis of purified genomic DNA 23
4.4: Nanodrop quantitation of purified genomic DNA 23
4.5: PCR amplification of the mitoc hondrial cytochrome b (cytb) and 23
cytochrome oxidase gene (cox1)
Section 5: CTAB genomic DNA Extraction and ethanol precipitation of 26
snail DNA
5.1: Tissue solubilisation 27
5.2: Organic extraction 28
5.3: Ethanol precipitation of genomic DNA 29
5.4: Agarose gel analysis of purified genomic DNA 31
Section 6: DNA Gel Extraction 32
6.1 QIAquick Gel Extraction Kit Protocol-using a microcentrifuge 32
6.2: Agarose gel analysis of purified PCR products 35
Section 7: Theoretical Background on Basic Molecular Techniques 36
7.1 DNA extraction 36
7.2 PCR –Principles and Procedures 40
7.3 Agarose Electrophoresis 53
7.4 Purifiction of PCR products 57
7.5 Cycle Sequencing 61
7.6 Sequencher DNA sequencing assembly and analysis software 69
7.7 The basic local alignment search tool (BLAST) 73
Appendix 1: Buffers 74
Appendix 2: Tissue Storage 78
Appendix 3: IUB codes-Nomenclature for Incompletely Specified Bases in 81
Nucleic Acid Sequences
Appendix 4: Consumables and Laboratory equipment 82

Outline Time Table:
Week 1 – 26th-30th July 2010
1. General introduction
Facility
Health & Safety
Training program
2. Set up DNA extractions overnight
3. DNA extractions
4. Gel electrophoresis of extracted DNA
5. PCR set up overnight-Kit based
6. Electrophoresis of PCR products
7. PCR products clean up for Sequencing
8. Quantification of PCR products
9. Set up sequencing reactions overnight.
10. Overview of Sequencing Facility with Julia Llewellyn Hughes (Sequencing facility Manager)
11. Overview of GENIUS –bio-informatics software (Dr. Pete Olson)12. Theoretical overview of all molecular techniques (principles and trouble shooting)
Week 2- 2nd-6th August 2010
1. Meeting Dr. Phil Rainbow – head of Zoology Department
2. Data Analysis
Clean up of sequence data
Types of Sequencing Software
Blast searches
Tree generating software – Dr. Tim Littlewood (3rd August)
3. DNA extraction using CTAB and recovery by organic extractions andethanol precipitation.
4. PCR amplification of Mitochondrial genes using standard PCR reagents
5. DNA Gel extraction – commercial kit based
6. Discussion:
Basic laboratory equipment and consumables required for
setting up a molecular facility.

Storage of specimens for molecular analysis
Storage of nucleic acids, short and long term
7. Meeting with Jackie Mackenzie Dodds (Laboratory Manager to discuss setting up a molecular
collection.
1
Introduction
The aim of this molecular training course is to provide initial experience of common
laboratory and computing techniques used for generating and analysing molecular
sequence data:
Extraction and purification of genomic DNA using affinity spin column
Use of agarose gel electophoresis to analyse DNA samples
Amplification of a specific genomic target by the polymerase chain reaction
(PCR)
Purification of PCR products using affinity spin columns
Automated DNA sequencing reactions
DNA sequence editing
DNA sequence identification and analysis using online and local software tools
The theory and practice of phylogenetic reconstruction from aligned sequence
data, and the different inference methods available
In the laboratory practicals, you will be extracting DNA from cestodes (tapeworms) and
digeneans (flukes). This will be a blind study, so from the DNA sequences generated you
should be able to tell which specimens were cestodes or digeneans. If time permits we
will also extract DNA from some fish specimens.

2
Laboratory Health and Safety
Some of the reagents you will be using are toxic and PCR reactions are easily
contaminated with external DNA from the environment, so it is important to wear lab
coats and gloves whenever working at the bench to protect both you and your samples.
Particular hazards will be detailed in the protocol.
Waste solutions from the experimental process should be sealed in the reaction tubes and
stored on your bench for collection and disposal – no liquids from these protocols
should be poured into the sinks unless specifically stated in the protocol.
Empty tubes and discarded pipette tips should be placed in the clear plastic waste bags on
your bench for disposal.
Gloves, paper towels etc should be placed in the yellow sacs at the front of the laboratory.
Wash your hands before leaving the laboratory.
3
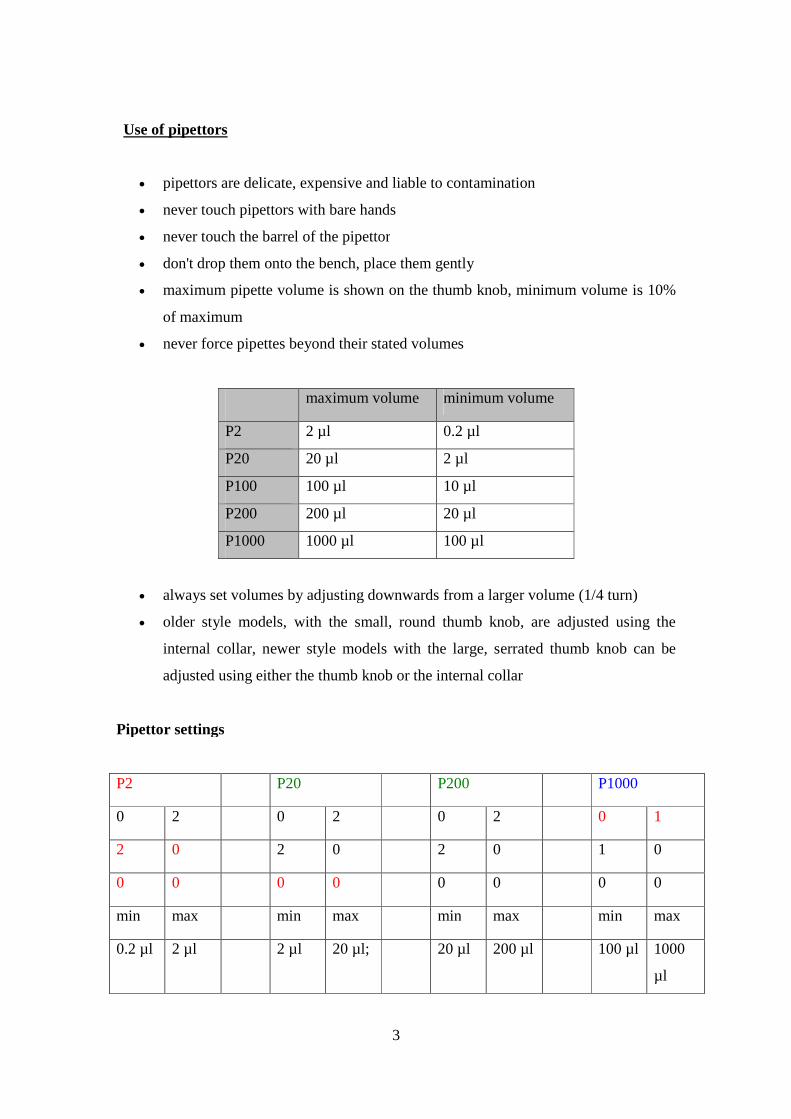
Use of pipettors
pipettors are delicate, expensive and liable to contamination
never touch pipettors with bare hands
never touch the barrel of the pipettor
don't drop them onto the bench, place them gently
maximum pipette volume is shown on the thumb knob, minimum volume is 10%
of maximum
never force pipettes beyond their stated volumes
maximum volume minimum volume
P2 2 µl 0.2 µl
P20 20 µl 2 µl
P100 100 µl 10 µl
P200 200 µl 20 µl
P1000 1000 µl 100 µl
always set volumes by adjusting downwards from a larger volume (1/4 turn)
older style models, with the small, round thumb knob, are adjusted using the
internal collar, newer style models with the large, serrated thumb knob can be
adjusted using either the thumb knob or the internal collar
Pipettor settings
P2 P20 P200 P1000
0 2 0 2 0 2 0 1
2 0 2 0 2 0 1 0
0 0 0 0 0 0 0 0
min max min max min max min max
0.2 µl 2 µl 2 µl 20 µl; 20 µl 200 µl 100 µl 1000
µl
4
Section 1: Isolation of Cestode And Digenean genomic DNA
Background
In order to isolate DNA from any specimen, you need to first release the DNA from the
cellular compartments that it is held in (nucleus, chloroplast, mitochondrion etc) and then
to separate it away from the other biomolecules present in that extract.
There are a large number of protocols available to isolate either DNA or total nucleic
acid, both "home-made" and commercial. Each technique has both advantages and
disadvantages in terms of speed, complexity, use of toxic chemicals, cost and suitability
to particular groups of organisms. Different types of cellular organisation (prokaryote vs.
eukaryote, animal vs. plant etc.) can require different processing methods and special
techniques may be required for particular taxonomic groups (eg. molluscs).
You will be using a commercial protocol for the isolation of total nucleic acid (genomic
and mitochondrial DNA plus RNA) from general animal tissues (Qiagen’s QIAamp
DNA Mini Kit ). This method uses a pad of DNA-binding matrix supported on a mesh to
trap the nucleic acids as a tissue lysate is spun through it in the presence of a salt buffer.
The filter is then washed in ethanol-based wash buffers which remove any residual lysate
whilst keeping the nucleic acid product bound to the matrix. The matrix is then dried and
the purified, bound nucleic acid is eluted. The process involves 5 basic steps:
Physical, chemical and enzymatic disruption of cellular structure
Binding of DNA and RNA to a affinity column and removal of other cellular
components by centrifugation
Washing the bound nucleic acids by centrifugation
Recovery of nucleic acids from the column by elution and centrifugation
Examination of recovered DNA to assess yield, quality and purity
5
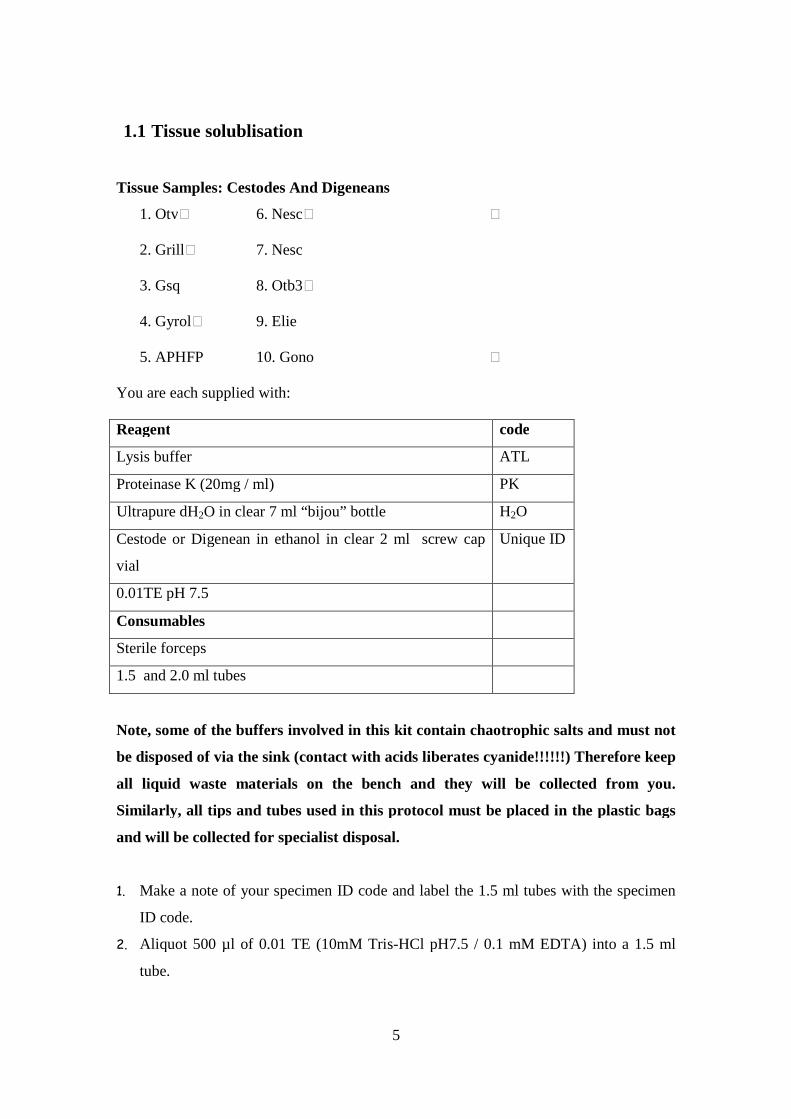
1.1 Tissue solublisation
Tissue Samples: Cestodes And Digeneans
1. Otv 6. Nesc
2. Grill 7. Nesc
3. Gsq 8. Otb3
4. Gyrol 9. Elie
5. APHFP 10. Gono
You are each supplied with:
Reagent code
Lysis buffer ATL
Proteinase K (20mg / ml) PK
Ultrapure dH2O in clear 7 ml “bijou” bottle H2O
Cestode or Digenean in ethanol in clear 2 ml screw cap
vial
Unique ID
0.01TE pH 7.5
Consumables
Sterile forceps
1.5 and 2.0 ml tubes
Note, some of the buffers involved in this kit contain chaotrophic salts and must not
be disposed of via the sink (contact with acids liberates cyanide!!!!!!) Therefore keep
all liquid waste materials on the bench and they will be collected from you.
Similarly, all tips and tubes used in this protocol must be placed in the plastic bags
and will be collected for specialist disposal.
1. Make a note of your specimen ID code and label the 1.5 ml tubes with the specimen
ID code.
2. Aliquot 500 µl of 0.01 TE (10mM Tris-HCl pH7.5 / 0.1 mM EDTA) into a 1.5 ml
tube.
6
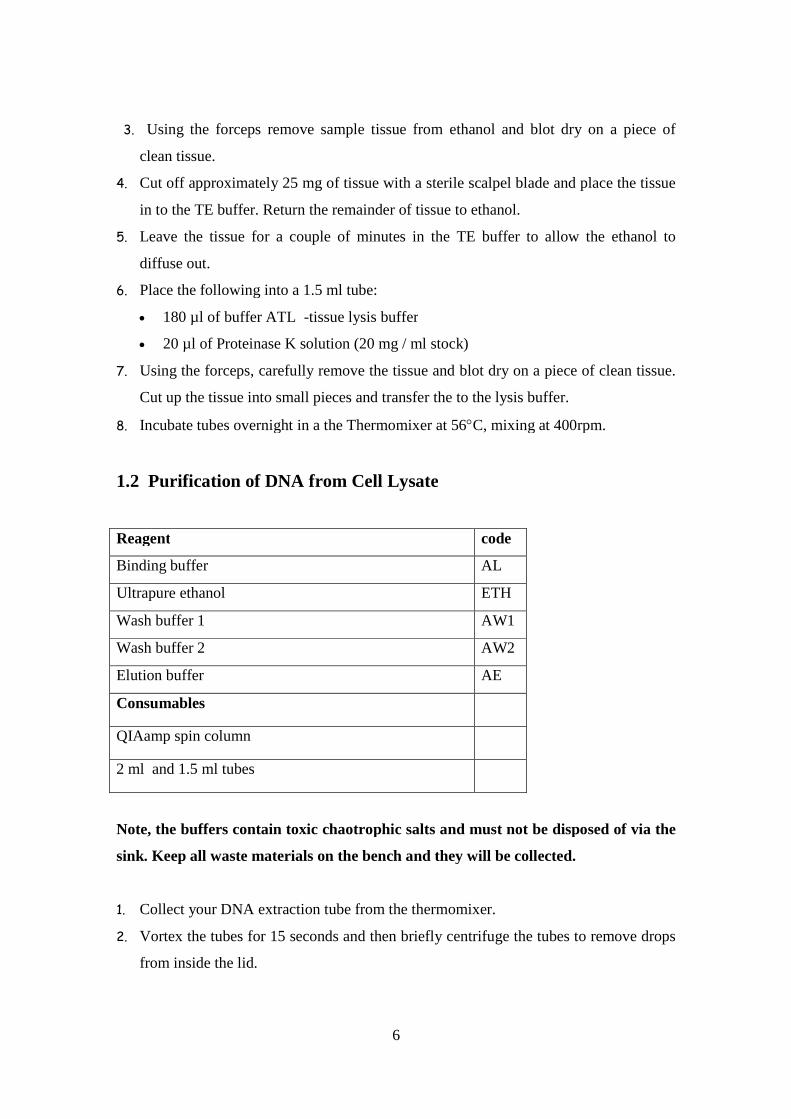
3. Using the forceps remove sample tissue from ethanol and blot dry on a piece of
clean tissue.
4. Cut off approximately 25 mg of tissue with a sterile scalpel blade and place the tissue
in to the TE buffer. Return the remainder of tissue to ethanol.
5. Leave the tissue for a couple of minutes in the TE buffer to allow the ethanol to
diffuse out.
6. Place the following into a 1.5 ml tube:
180 µl of buffer ATL -tissue lysis buffer
20 µl of Proteinase K solution (20 mg / ml stock)
7. Using the forceps, carefully remove the tissue and blot dry on a piece of clean tissue.
Cut up the tissue into small pieces and transfer the to the lysis buffer.
8. Incubate tubes overnight in a the Thermomixer at 56C, mixing at 400rpm.
1.2 Purification of DNA from Cell Lysate
Reagent code
Binding buffer AL
Ultrapure ethanol ETH
Wash buffer 1 AW1
Wash buffer 2 AW2
Elution buffer AE
Consumables
QIAamp spin column
2 ml and 1.5 ml tubes
Note, the buffers contain toxic chaotrophic salts and must not be disposed of via the
sink. Keep all waste materials on the bench and they will be collected.
1. Collect your DNA extraction tube from the thermomixer.
2. Vortex the tubes for 15 seconds and then briefly centrifuge the tubes to remove drops
from inside the lid.

7
3. Add 200 µl of Binding Buffer AL to the tube and mix thoroughly by brief vortexing
(15 seconds)
4. Incubate at 70C for 10 minutes. Briefly centrifuge the tubes to remove drops from
inside the lid.
5. Add 200 µl of ethanol (96-100%) to the tube and mix thoroughly by brief vortexing
(15 seconds). Briefly centrifuge the tubes to remove drops from inside the lid.
It is essential that the sample, Buffer AL, and the ethanol are mixed thoroughly to yield a
homogeneous solution. A white precipitate may form on addition of ethanol. It is essential
to apply all of the precipitate to the QIAamp Mini spin column. This precipitate does not
interfere with the QIAamp procedure or with any subsequent application.
6. Unwrap the spin column / tube and pipette the mixture from step 5 into the top of the
column
7. Place the column / tube into a microfuge and spin at 8000 rpm for 1 minute (ensure
that the rotor is balanced before running the microfuge)
8. Transfer the column to a clean 2 ml collection tube
9. Add 500 µl of Wash Buffer AW1 to the spin column
10. Place the column / tube into a microfuge and spin at 8000 rpm for 1 minute (ensure
that the rotor is balanced before running the microfuge)
11. Transfer the column to a clean 2 ml tube and add 500 µl of Wash Buffer AW2 to the
spin column
12. Place the column / tube into a microfuge and spin at 14000 rpm for 3 minutes.
13. Transfer the column to a clean 2 ml tube and cut off the cap and hinge
14. Place the column / tube into a microfuge and spin at 14000 rpm for 1 minute . This
dry spin ensures that the membrane is completely dry (elution of DNA from the
membrane will fail if it retains any of the ethanol-containing wash buffer)
15. Transfer the column to a clean 2.0 ml tube and cut off the cap and hinge
16. Pipette 100 µl of Elution buffer Buffer AE directly onto the membrane in the spin
column (take care to not touch / puncture the membrane with the pipette tip) and
leave for 5 minutes.
17. Place the column / tube into a microfuge and spin at 8000 rpm for 1 minute.
8
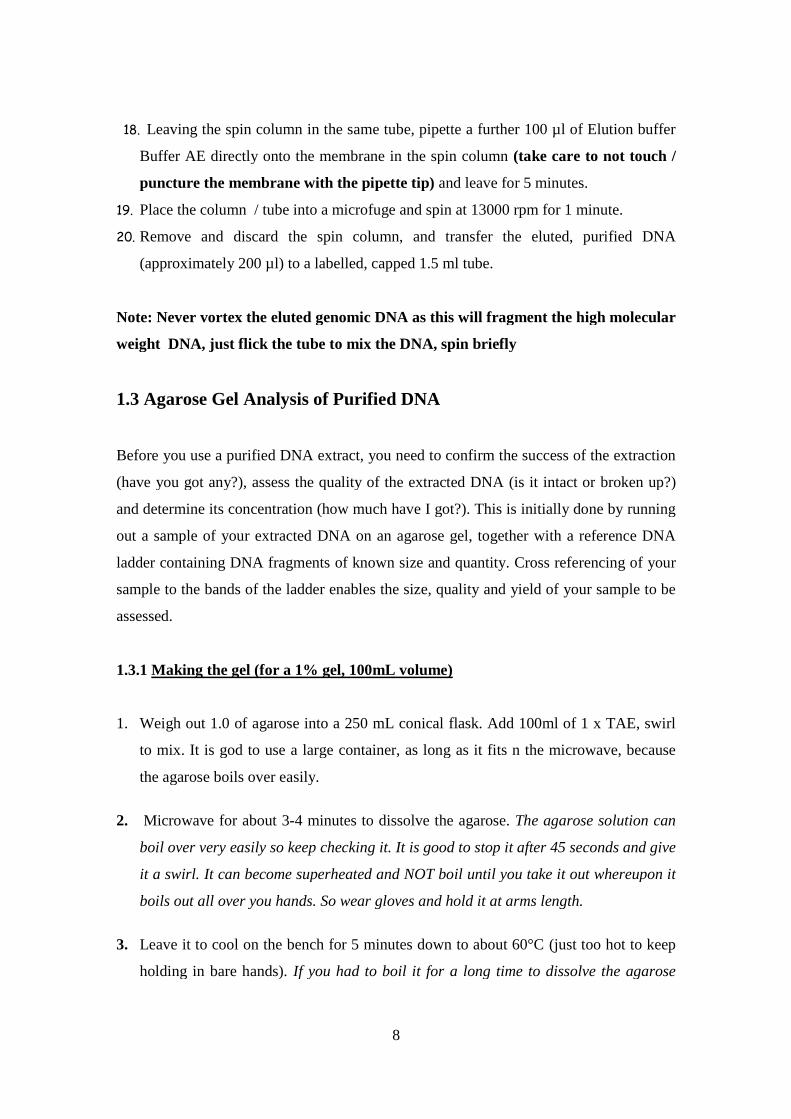
18. Leaving the spin column in the same tube, pipette a further 100 µl of Elution buffer
Buffer AE directly onto the membrane in the spin column (take care to not touch /
puncture the membrane with the pipette tip) and leave for 5 minutes.
19. Place the column / tube into a microfuge and spin at 13000 rpm for 1 minute.
20. Remove and discard the spin column, and transfer the eluted, purified DNA
(approximately 200 µl) to a labelled, capped 1.5 ml tube.
Note: Never vortex the eluted genomic DNA as this will fragment the high molecular
weight DNA, just flick the tube to mix the DNA, spin briefly
1.3 Agarose Gel Analysis of Purified DNA
Before you use a purified DNA extract, you need to confirm the success of the extraction
(have you got any?), assess the quality of the extracted DNA (is it intact or broken up?)
and determine its concentration (how much have I got?). This is initially done by running
out a sample of your extracted DNA on an agarose gel, together with a reference DNA
ladder containing DNA fragments of known size and quantity. Cross referencing of your
sample to the bands of the ladder enables the size, quality and yield of your sample to be
assessed.
1.3.1 Making the gel (for a 1% gel, 100mL volume)
1. Weigh out 1.0 of agarose into a 250 mL conical flask. Add 100ml of 1 x TAE, swirl
to mix. It is god to use a large container, as long as it fits n the microwave, because
the agarose boils over easily.
2. Microwave for about 3-4 minutes to dissolve the agarose. The agarose solution can
boil over very easily so keep checking it. It is good to stop it after 45 seconds and give
it a swirl. It can become superheated and NOT boil until you take it out whereupon it
boils out all over you hands. So wear gloves and hold it at arms length.
3. Leave it to cool on the bench for 5 minutes down to about 60°C (just too hot to keep
holding in bare hands). If you had to boil it for a long time to dissolve the agarose
9
then you may have lost some water to water-vapour. You can weigh the flask before
and after heating and add in a little distilled water to make up this lost volume. While
the agarose is cooling, prepare the gel tank ready, on a level surface.
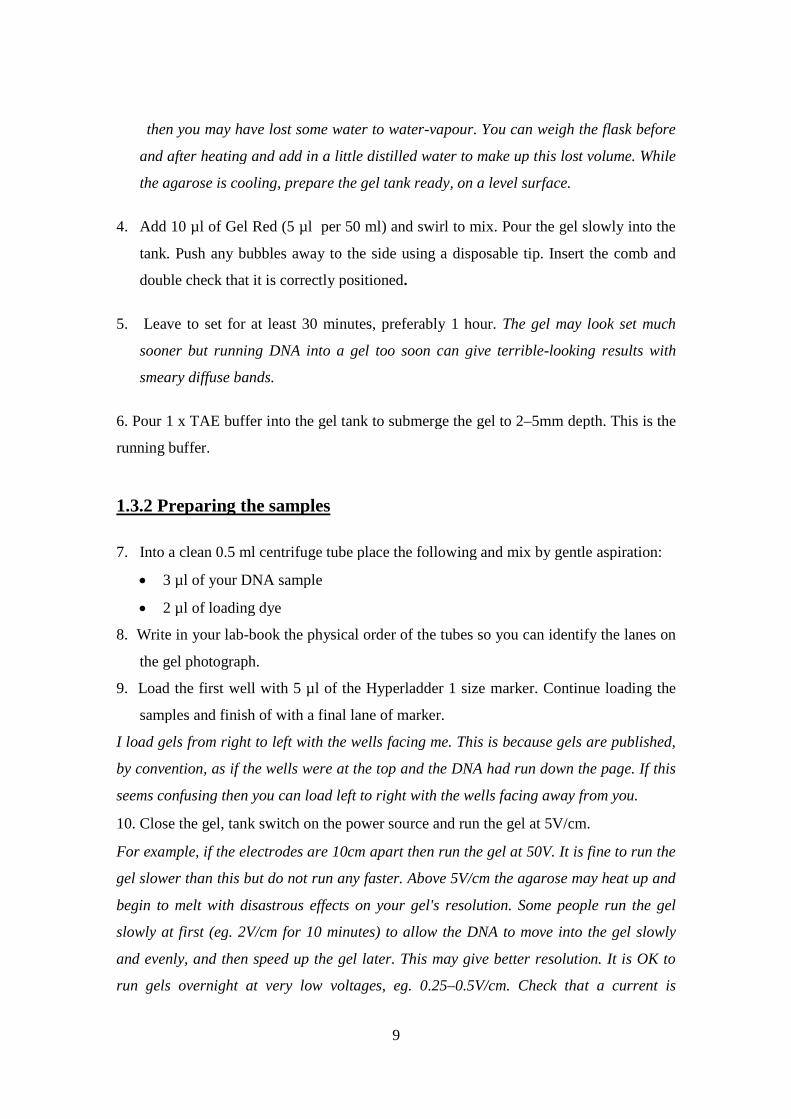
4. Add 10 µl of Gel Red (5 µl per 50 ml) and swirl to mix. Pour the gel slowly into the
tank. Push any bubbles away to the side using a disposable tip. Insert the comb and
double check that it is correctly positioned.
5. Leave to set for at least 30 minutes, preferably 1 hour. The gel may look set much
sooner but running DNA into a gel too soon can give terrible-looking results with
smeary diffuse bands.
6. Pour 1 x TAE buffer into the gel tank to submerge the gel to 2–5mm depth. This is the
running buffer.
1.3.2 Preparing the samples
7. Into a clean 0.5 ml centrifuge tube place the following and mix by gentle aspiration:
3 µl of your DNA sample
2 µl of loading dye
8. Write in your lab-book the physical order of the tubes so you can identify the lanes on
the gel photograph.
9. Load the first well with 5 µl of the Hyperladder 1 size marker. Continue loading the
samples and finish of with a final lane of marker.
I load gels from right to left with the wells facing me. This is because gels are published,
by convention, as if the wells were at the top and the DNA had run down the page. If this
seems confusing then you can load left to right with the wells facing away from you.
10. Close the gel, tank switch on the power source and run the gel at 5V/cm.
For example, if the electrodes are 10cm apart then run the gel at 50V. It is fine to run the
gel slower than this but do not run any faster. Above 5V/cm the agarose may heat up and
begin to melt with disastrous effects on your gel's resolution. Some people run the gel
slowly at first (eg. 2V/cm for 10 minutes) to allow the DNA to move into the gel slowly
and evenly, and then speed up the gel later. This may give better resolution. It is OK to
run gels overnight at very low voltages, eg. 0.25–0.5V/cm. Check that a current is
10
flowing. You can check this on the power-source, the milliamps should be in the same
ball-park as the voltage, but the best way is to look at the electrodes and check that they
are evolving gas (ie. bubbles). If not then check the connections, that the power-source is
plugged in etc.
Monitor the progress of the gel by reference to the marker dye. Stop the gel when the
bromophenol blue has run 3/4 the length of the gel. Switch off and unplug the gel tank
and carry the gel (in its holder if possible) to the dark-room to look at on the UV light-
box and photograph. Note: UV is carcinogenic and must not be allowed to shine on
naked skin or eyes. So wear face protection, gloves and long sleeves.
1.4 Nanodrop Quantification of DNA
Before proceeding further into costly and time-consuming manipulations it is critical to
analyze, at least in a cursory way, the quantity and quality of DNA in the prep. A more
accurate quantitation of your sample can be acheived using a "Nanodrop" UV
spectrophotometer .The machine's use will be demonstrated to you. Only ever use non-
scratching, non linting-tissues to clean the instrument.
1. Switch on machine
2. Start up the Nanodrop software and login. Select the "nucleic acid" option
3. Follow the onscreen instructions - place 1.5 µl of ultrapure water onto the sample
pedestal, close the arm and click on OK to initialise the instrument.
4. Once the instrument has initialised, lift the arm and carefully wipe the sample
pedestal and arm Perform a blanking reaction using 1.5 µl of whatever your sample is
dissolved in (in our case, buffer AE), close down the arm and click on the blank
button
5. Once the instrument has blanked (graph with zeroed baseline), lift the arm and
carefully wipe the sample pedestal and arm
6. Perform a measurement - place 1.5 µl of your sample onto the sample pedestal, name
it in the sample ID window, close down the arm and click on the measure button.
Note: It is advisable to blank the Nano drop after every sixth sample
11
7. Record the concentration (ng / µl) and the OD 260/280 ratio:
Estimating DNA Concentration by A260
The UV absorbance spectrum of DNA exhibits an Amax @ 260 nm based on the
aromatic ring structures of the DNA bases. This is the most convenient way to estimate
DNA concentration and calculate yield, as long as the DNA preparation is relatively free
of contaminants that absorb in the UV. Proteins, and residual phenol left from the
isolation procedure, are typical contaminants that may lead to an overestimate DNA
concentration.
An A260 = 1.0 indicates a [DNA] = 50 ug/ul, assuming the DNA is pure.
Single-stranded DNA: 33 ug/ul
RNA: 40 ug/ul
260/280: The ratio of absorbance at 260 nm and 280 nm is used to assess the purity of
DNA and RNA. A ratio of ~1.8 is generally accepted as “pure” for DNA; a ratio of
~2.0 is generally accepted as “pure” for RNA. If the ratio is appreciably lower in either
case, it may indicate the presence of protein, phenol or other contaminants that absorb
strongly at or near 280 nm.
260/230 Ratio: This ratio is used as a secondary measure of nucleic acid purity. The
260/230 values for “pure” nucleic acid are often higher than the respective 260/280
values. Expected 260/230 values are commonly in the range of 2.0-2.2. If the ratio is
appreciably lower than expected, it may indicate the presence of contaminants which
absorb at 230 nm
12
Section 2: PCR Amplification of A Specific Genomic Region–
Large subunit (LSU) and Small subunit (SSU) genes
Background
You will be amplifying a selected target region of the nuclear 18S (SSU) and 28S (LSU)
gene for the cestodes and digeneans. Subsequently, you will use the PCR product as
template in sequencing. For a PCR reaction, we need to combine, in the correct relative
amounts:
DNA template
the 2 target-specific primer
buffer
dNTPs
Taq polymerase
To set up a PCR reaction it is possible to individually add each of these components.
However, for simplicity, and standardisation, you will be using llustra PuReTaq Ready-
To-Go PCR Beads Catlog no. 27-9559-01 (GE-Healthcare). These are commercial
preparations of dNTPs, buffer and Taq polymerase, that have been mixed together,
dispensed in the correct amounts for a single 25µl PCR reaction and then lyophilised into
a small bead that is stable for many months at room temperature. The additional
advantage of using PCR beads is that they minimise the number of stock solutions and
pipetting steps required for PCR reaction setup, thereby also minimising the risk of
contaminating the reaction with DNA from external sources. This is especially
important when using "universal" primers as they will also potentially amplify the
gene from any contaminating DNA and PCR is a very sensitive process. Liquid PCR
premixes are also available, some also include a gel loading dye so you can pipette
straight from the finished PCR reaction onto a gel.
13
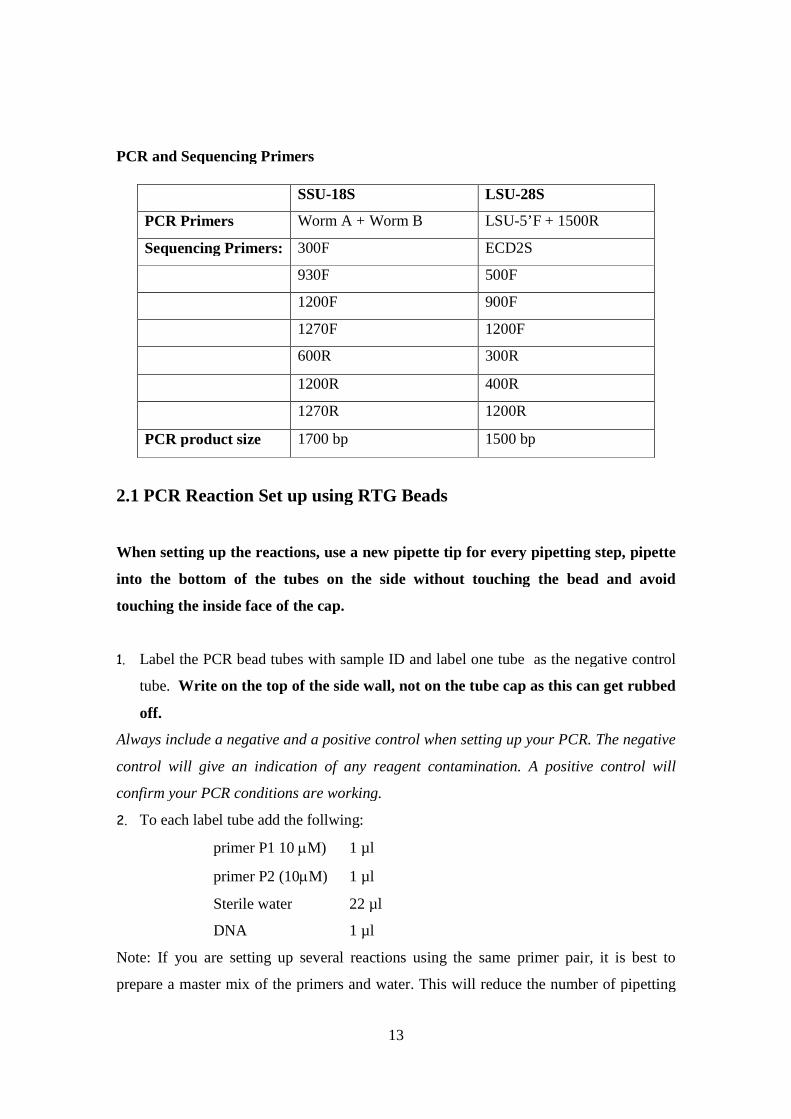
PCR and Sequencing Primers
2.1 PCR Reaction Set up using RTG Beads
When setting up the reactions, use a new pipette tip for every pipetting step, pipette
into the bottom of the tubes on the side without touching the bead and avoid
touching the inside face of the cap.
1. Label the PCR bead tubes with sample ID and label one tube as the negative control
tube. Write on the top of the side wall, not on the tube cap as this can get rubbed
off.
Always include a negative and a positive control when setting up your PCR. The negative
control will give an indication of any reagent contamination. A positive control will
confirm your PCR conditions are working.
2. To each label tube add the follwing:
primer P1 10 M) 1 µl
primer P2 (10M) 1 µl
Sterile water 22 µl
DNA 1 µl
Note: If you are setting up several reactions using the same primer pair, it is best to
prepare a master mix of the primers and water. This will reduce the number of pipetting
SSU-18S LSU-28S
PCR Primers Worm A + Worm B LSU-5’F + 1500R
Sequencing Primers: 300F ECD2S
930F 500F
1200F 900F
1270F 1200F
600R 300R
1200R 400R
1270R 1200R
PCR product size 1700 bp 1500 bp
14
steps and the risk of contamination. For Example: I need to set up 10 reactions
including a negative reagent control.
X-1 X-10
primer P1 10 M) 1 µl 10 µl
primer P2 (10M) 1 µl 10 µl
DNA 1 µl -
Sterile water 22 µl 220 µl
25µl 240 µl
Aliquot 24 µl of the master mix to your label tubes, then add a 1 µl of your respective
template.
3. Vortex the tubes and spin briefly to bring the contents to the bottom of the tube.
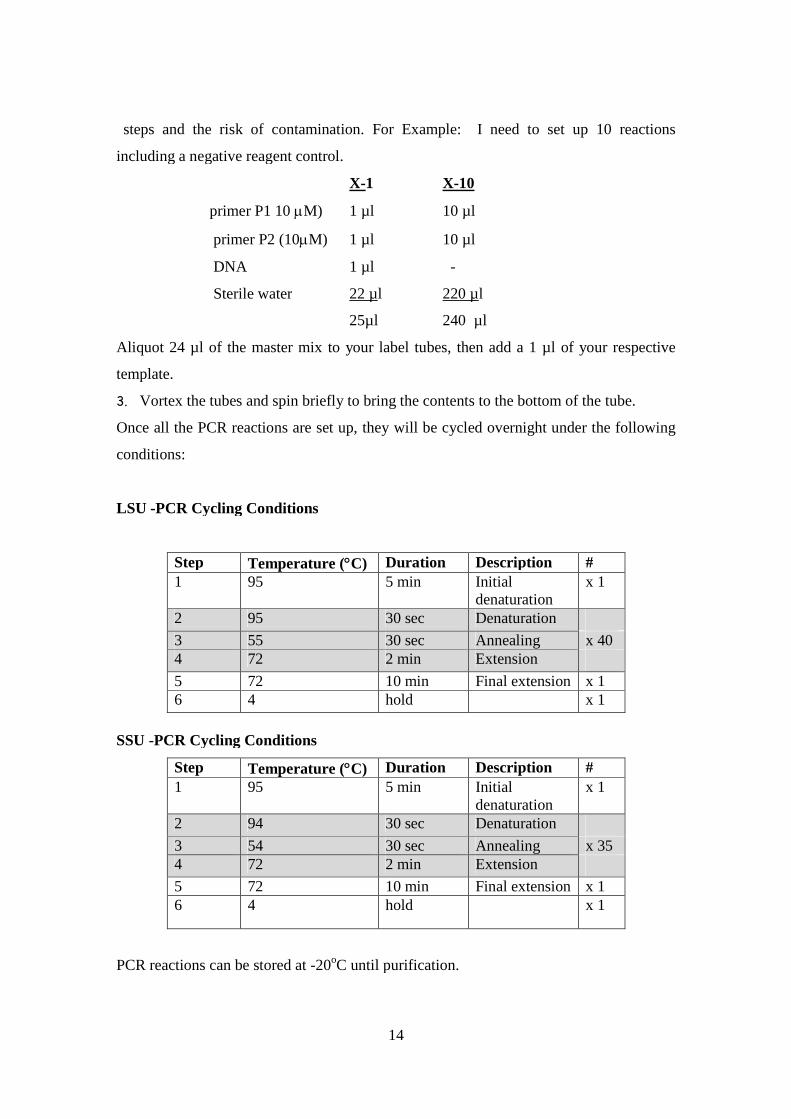
Once all the PCR reactions are set up, they will be cycled overnight under the following
conditions:
LSU -PCR Cycling Conditions
Step Temperature (C) Duration Description #1 95 5 min Initial
denaturationx 1
2 95 30 sec Denaturation
3 55 30 sec Annealing x 404 72 2 min Extension
5 72 10 min Final extension x 16 4 hold x 1
SSU -PCR Cycling Conditions
Step Temperature (C) Duration Description #
1 95 5 min Initialdenaturation
x 1
2 94 30 sec Denaturation
3 54 30 sec Annealing x 354 72 2 min Extension
5 72 10 min Final extension x 16 4 hold x 1
PCR reactions can be stored at -20oC until purification.
15
2.2 Agarose Gel Analysis of Un-purified PCR Reactions
1. Prepare a 1% agarose gel in 1 x TAE as in section 1.3.1
2. Into a clean 0.5 ml centrifuge tube, place the following and mix by gentle aspiration:
3 µl of your PCR sample
2 µl of loading dye
3. Carefully load your 5 µl sample of (PCR reaction plus loading dye) onto the agarose
gel (note the order in which you load your samples).
4. In a separate lane load 5 µl of the molecular standard, Hyperladder 1, which allows
you to determine the size of your PCR product.
5. The gel will be run at 60V for 45 minutes, examined and photographed under UV.
2.3 Affinity Column Cleanup of PCR reactions (Qiagen QIA quick
PCR Purification Kit)
Before the PCR product can be used in a DNA sequencing reaction, it must be purified
from the other components of the PCR reaction mix (especially any unincorporated PCR
primers, which would otherwise act as initiation points for additional, unwanted
sequencing reactions and so give multiple, overlaying, sequencing reads from the same
sequencing reaction). There are many techniques available to purify PCR products. Here
we will be using a commercial affinity column method (Qiagen QIA quick Spin PCR
cleanup columns). Like the QIAamp protocol, it uses a pad of DNA-binding matrix
supported on a mesh to trap the PCR product as the PCR reaction is spun through it in the
presence of a high salt buffer. The filter is then washed in an ethanol-based solution
which removes any residual reaction components whilst keeping the PCR product bound
to the matrix. The matrix is then dried and the purified, bound PCR product then eluted
using a small volume of low salt buffer or water. However the column and buffers differ
in formulation between the 2 kits.

16
Purify the amplified DNA from the remaining 22 µl of your PCR reaction mix using the
following protocol (note: do not purify the negative control which can now be
discarded)
Reagent code
QiaQuick spin column in 2 ml centrifuge tube
Buffer PB (DNA binding buffer) PB
Buffer PE (wash buffer) PE
Buffer EB (elution buffer, (10 mM Tris·Cl, pH
8.5))
EB
Note, the buffers contain toxic chaotrophic salts and must not be disposed of via the
sink. Keep all waste materials on the bench and they will be collected for specialist
disposal.
1. To the remaining 22 µl of PCR reaction add 110 µl ( = 5 volumes) of Buffer PB and
mix well by brief vortexing (2 seconds).
2. Apply the entire sample to the QIAquick column
3. Place the column / tube into a microfuge and spin at full speed (13000 rpm) for 1
minute (ensure that the rotor is balanced before running the microfuge)
4. Transfer the QIAquick column to a clean 2 ml tube and cut off the cap and hinge
5. Add 750 µl of buffer PE to the QIAquick column
6. Place the column / tube into a microfuge and spin at full speed for 1 minute (ensure
that the rotor is balanced before running the microfuge)
7. Transfer the column to a clean 2 ml tube and cut off the cap and hinge
8. Place the column / tube into a microfuge and spin at full speed for 1 minute (ensure
that the rotor is balanced before running the microfuge) – this dry spin ensures
that the membrane is completely dry (elution of PCR product from the membrane will
fail if it retains any of the ethanol-containing wash buffer)
9. Transfer the column to a clean 2 ml tube and cut off the cap and hinge

17
10. Pipette 30 µl of Elution Buffer EB directly onto the membrane in the spin column
(take care to not touch / puncture the membrane with the pipette tip) and leave
for 1 minute
Note: it is important that the elution buffer completely soaks into the membrane
11. Place the column / tube into a microfuge and spin at full speed for 1 minute (ensure
that the rotor is balanced before running the microfuge)
12. Remove and discard the spin column, and transfer the eluted, purified PCR product
(approximately 28 µl) to a labelled, capped 1.5 ml tube
2.4 Agarose gel analysis of purified PCR Products
1. Prepare a 1% agarose gel in 1 x TAE as in section 1.3
2. Into a clean, labelled 0.5 ml centrifuge tube, place the following and mix by gentle
aspiration:
3 µl of your purified PCR sample
21 µl of loading dye
3. Carefully load your 5 µl sample of (purified PCR product plus loading dye) onto the
agarose gel (note the order in which you load your samples).
4. In a separate lane load 5 µl of the molecular standard, Hyperladder 1, which allows
you to determine the size of your PCR product.
5. The gel will be run at 60V for 45 minutes, examined and photographed under UV
6. After loading the gel, place the tube containing the remainder of your purified PCR
reaction (approx 22 µl) on ice.
2.5 Nanodrop quantitation of purified PCR product
Accurately quantify your purified PCR product using the "Nanodrop" UV
spectrophotometer as in section 1.4

18
Section 3: Cycle Sequencing
Background
Sequencing both strands of the sequence of interest is highly recommended as it provides
a double check for accuracy - data from each strand acts to verifying that from the other.
Since (a) your PCR product is 1500 (28S) & 1700 base pairs long (depending on the
source species) and (b) a single sequencing reaction is unlikely to read more than 800
bases at highest quality, we need to perform several sequencing reactions in both
directions to obtain a the whole double stranded sequence.
3.1. Calculate the amount of DNA needed in sequencing reaction
Need 2 ng of DNA for every 100bp of product
e.g. Quantified 18S PCR product is 18 ng/µl
18S PCR product is 700 bp long
Therefore need 14 ng (2 x 7) of PCR product in the sequencing reaction
# ng needed/ # ng per ul quantified = # µl PCR product per 10 µl seq rxn
14 ng / 18 ng / µl = 0.78 µl
3.2 Setting Up the Sequencing reaction
1. Remove the dilution buffer and big dye from the freezer and defrost on ice.
2. Mix the contents of each tube by vortexing and then spin tubes to remove contents
from the lids. Keep tubes on ice .
3. Prepare your primer stock; this should be at 1 pmol/µl.
4. Switch on the PCR machine to warm up.
5. Note: Your total sequence reaction volume is 10 µl.
Set up your sequencing reaction in 0.2 ml tubes as follows on ice: -
DNA (PCR product) 0.78 µl
Primer (1 pmol/ul) 1.0 µl
Big dye dilution buffer from kit (2.5x) 2.0 µl
Sterile water 4.22 µl
Total 8.0 µl

19
General note:
If you are using the same primer for a number of templates you can prepare a master mix
of primer and dilution buffer.
e.g. 10 reactions using SSU 5’F primer.
Master mix:- SSU 5’F 1 pmol/µl 10 µl
Big dye dilution buffer (2.5x) 20 µl
Total 30 µl
Then aliquot 3.0 µl of the master mix per tube. This saves time on pipetting and reduces
the risk of cross contamination.
6. Mix the contents of your tube by gentle pipetting, if there are air bubbles or liquid on
the side of the tube then give the tube a quick spin in the centrifuge. Return tube to ice.
8. Transfer tubes to PCR machine, select program call Big dye terminator.
9. Once the hot start section of the program is completed (5 min, pause 2 sec before this
cycle is complete).
10. Transfer tube to ice, add 1 µl of dilution buffer and 1.0 µl of Big Dye terminator mix.
Mix by gently pipetting up and down. Note: your total reaction volume is now 10 µl.
Note: If you are processing a large number of samples, you can prepare a master
mix of the Big dye and dilution buffer. Aliquot 2.0 µl of the master mix per tube, this
increases pipetting accuracy and saves time on pipetting.
11. After the addition of the big dye return the tube to PCR machine and press resume,
this will continue the program.
PCR Profile:
96˚C 5 min Hot start
96˚C 10 sec
50˚C 05sec 28 cycles
60˚C 4 min
The PCR should take about 2.30 hours to complete.
20
Section 4: Isolation of fish genomic DNA using Qiagen DNeasyDNA extraction Kit
You will be using a commercial protocol for the isolation of total nucleic acid (genomicand mitochondrial DNA plus RNA) from general animal tissues (Qiagen DNeasy Blood& Tisue Kit).
Tissue Samples:
1. LR3754 = Channa gachua2. LR3731 = Luciocephalus pulcher
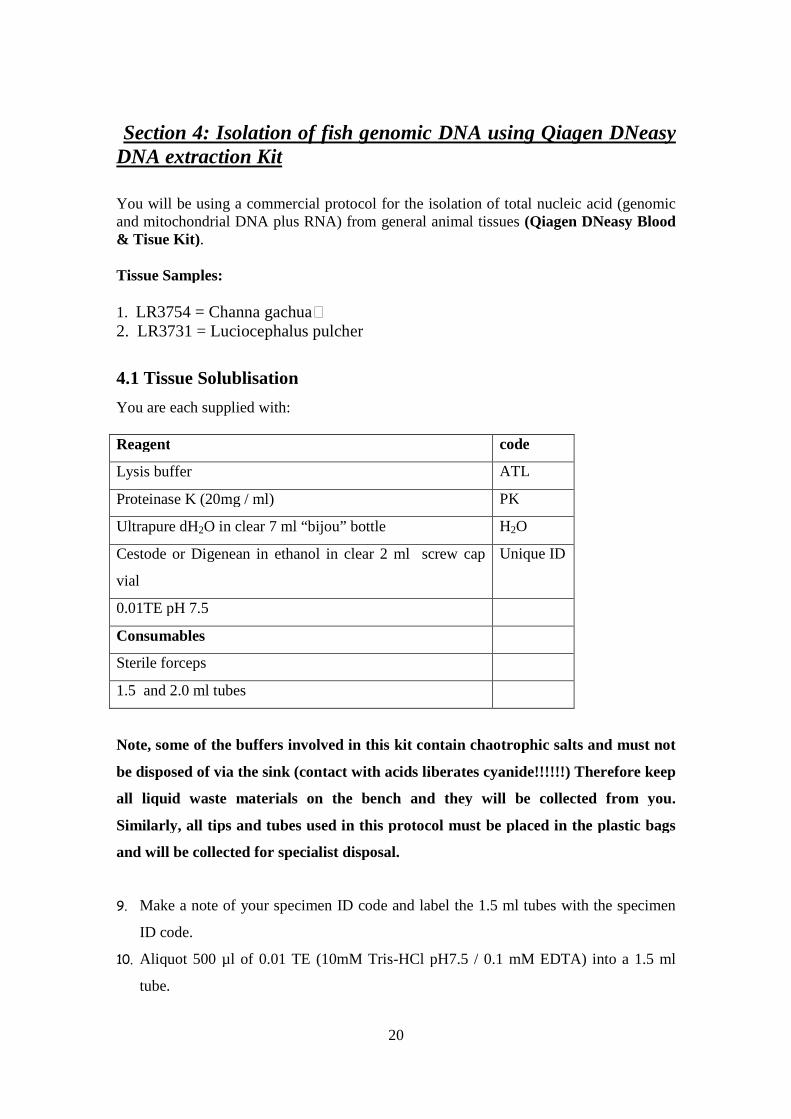
4.1 Tissue Solublisation
You are each supplied with:
Reagent code
Lysis buffer ATL
Proteinase K (20mg / ml) PK
Ultrapure dH2O in clear 7 ml “bijou” bottle H2O
Cestode or Digenean in ethanol in clear 2 ml screw cap
vial
Unique ID
0.01TE pH 7.5
Consumables
Sterile forceps
1.5 and 2.0 ml tubes
Note, some of the buffers involved in this kit contain chaotrophic salts and must not
be disposed of via the sink (contact with acids liberates cyanide!!!!!!) Therefore keep
all liquid waste materials on the bench and they will be collected from you.
Similarly, all tips and tubes used in this protocol must be placed in the plastic bags
and will be collected for specialist disposal.
9. Make a note of your specimen ID code and label the 1.5 ml tubes with the specimen
ID code.
10. Aliquot 500 µl of 0.01 TE (10mM Tris-HCl pH7.5 / 0.1 mM EDTA) into a 1.5 ml
tube.
21
11. Using the forceps remove sample tissue from ethanol and blot dry on a piece of
clean tissue.
12. Cut off approximately 25 mg of tissue with a sterile scalpel blade and place the tissue
in to the TE buffer. Return the remainder of tissue to ethanol.
13. Leave the tissue for a couple of minutes in the TE buffer to allow the ethanol to
diffuse out.
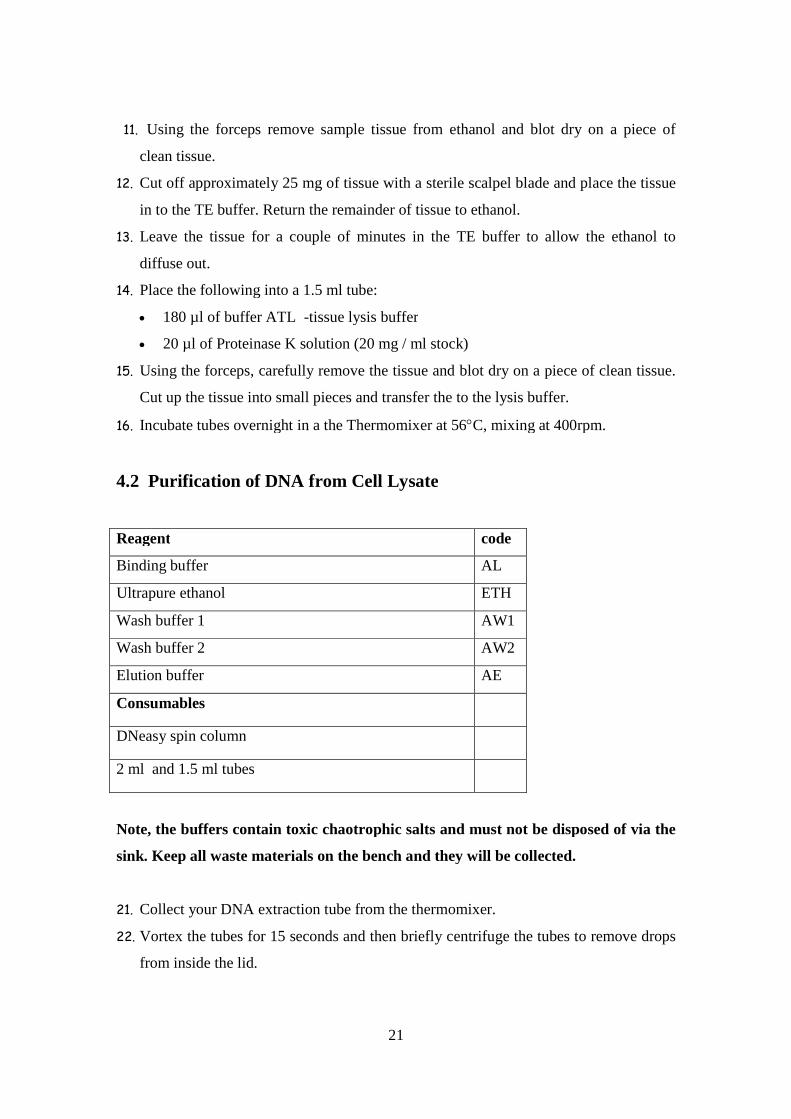
14. Place the following into a 1.5 ml tube:
180 µl of buffer ATL -tissue lysis buffer
20 µl of Proteinase K solution (20 mg / ml stock)
15. Using the forceps, carefully remove the tissue and blot dry on a piece of clean tissue.
Cut up the tissue into small pieces and transfer the to the lysis buffer.
16. Incubate tubes overnight in a the Thermomixer at 56C, mixing at 400rpm.
4.2 Purification of DNA from Cell Lysate
Reagent code
Binding buffer AL
Ultrapure ethanol ETH
Wash buffer 1 AW1
Wash buffer 2 AW2
Elution buffer AE
Consumables
DNeasy spin column
2 ml and 1.5 ml tubes
Note, the buffers contain toxic chaotrophic salts and must not be disposed of via the
sink. Keep all waste materials on the bench and they will be collected.
21. Collect your DNA extraction tube from the thermomixer.
22. Vortex the tubes for 15 seconds and then briefly centrifuge the tubes to remove drops
from inside the lid.
22
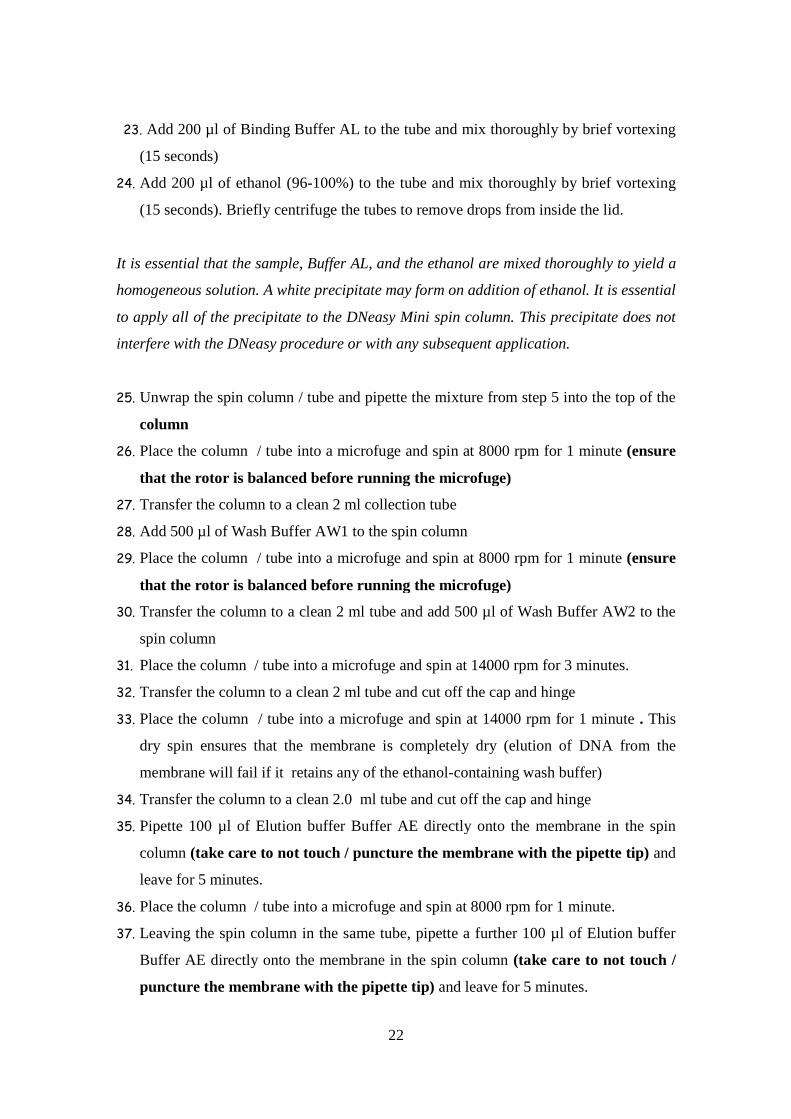
23. Add 200 µl of Binding Buffer AL to the tube and mix thoroughly by brief vortexing
(15 seconds)
24. Add 200 µl of ethanol (96-100%) to the tube and mix thoroughly by brief vortexing
(15 seconds). Briefly centrifuge the tubes to remove drops from inside the lid.
It is essential that the sample, Buffer AL, and the ethanol are mixed thoroughly to yield a
homogeneous solution. A white precipitate may form on addition of ethanol. It is essential
to apply all of the precipitate to the DNeasy Mini spin column. This precipitate does not
interfere with the DNeasy procedure or with any subsequent application.
25. Unwrap the spin column / tube and pipette the mixture from step 5 into the top of the
column
26. Place the column / tube into a microfuge and spin at 8000 rpm for 1 minute (ensure
that the rotor is balanced before running the microfuge)
27. Transfer the column to a clean 2 ml collection tube
28. Add 500 µl of Wash Buffer AW1 to the spin column
29. Place the column / tube into a microfuge and spin at 8000 rpm for 1 minute (ensure
that the rotor is balanced before running the microfuge)
30. Transfer the column to a clean 2 ml tube and add 500 µl of Wash Buffer AW2 to the
spin column
31. Place the column / tube into a microfuge and spin at 14000 rpm for 3 minutes.
32. Transfer the column to a clean 2 ml tube and cut off the cap and hinge
33. Place the column / tube into a microfuge and spin at 14000 rpm for 1 minute . This
dry spin ensures that the membrane is completely dry (elution of DNA from the
membrane will fail if it retains any of the ethanol-containing wash buffer)
34. Transfer the column to a clean 2.0 ml tube and cut off the cap and hinge
35. Pipette 100 µl of Elution buffer Buffer AE directly onto the membrane in the spin
column (take care to not touch / puncture the membrane with the pipette tip) and
leave for 5 minutes.
36. Place the column / tube into a microfuge and spin at 8000 rpm for 1 minute.
37. Leaving the spin column in the same tube, pipette a further 100 µl of Elution buffer
Buffer AE directly onto the membrane in the spin column (take care to not touch /
puncture the membrane with the pipette tip) and leave for 5 minutes.
23
38. Place the column / tube into a microfuge and spin at 13000 rpm for 1 minute.
39. Remove and discard the spin column, and transfer the eluted, purified DNA
(approximately 200 µl) to a labelled, capped 1.5 ml tube.
4.3 Agarose gel analysis of purified genomic DNA
1. Prepare a 1% agarose gel in 1 x TAE as in section 1.3
2. Into a clean 0.5 ml centrifuge tube, place the following and mix by gentle
aspiration:
3. 3 µl of your genomic DNA
4. 2 µl of loading dye
5. Carefully load your 5 µl sample of (DNA plus loading dye) onto the agarose gel
(note the order in which you load your samples).
6. In a separate lane load 5 µl of the molecular standard, Hyperladder 1, which
allows you to determine the size of your DNA.
7. The gel will be run at 60V for 45 minutes, examined and photographed under UV.
4.4 Nanodrop quantitation of purified genomic DNA
Accurately quantify your purified genomic DNA using the "Nanodrop" UV
spectrophotometer as in section 1.4
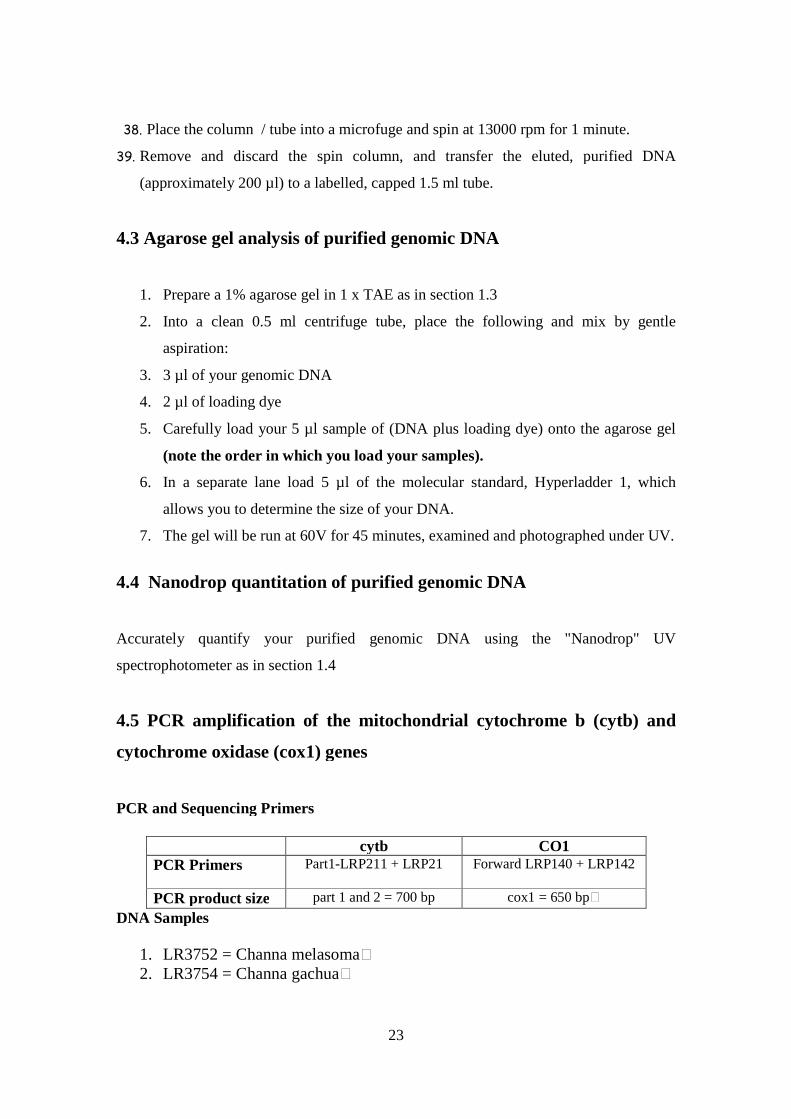
4.5 PCR amplification of the mitochondrial cytochrome b (cytb) and
cytochrome oxidase (cox1) genes
PCR and Sequencing Primers
DNA Samples
1. LR3752 = Channa melasoma2. LR3754 = Channa gachua
cytb CO1PCR Primers Part1-LRP211 + LRP21 Forward LRP140 + LRP142
PCR product size part 1 and 2 = 700 bp cox1 = 650 bp

24
3. LR3731 = Luciocephalus pulcher
PCR Protocol
1. Defrost all PCR reagents, except the Taq Polymerase which is kept on ice.
2. Once thawed, vortex tubes and spin briefly. Place all tubes on ice.
3. Label the PCR tubes with sample ID and label one tube as the negative control tube.
Write on the top of the side wall, not on the tube cap as this can get rubbed off.
Always include a negative and a positive control when setting up your PCR. The negative
control will give an indication of any reagent contamination. A positive control will
confirm your PCR conditions are working.
4. To each label tube add the PCR components in the following order:
Sterile water 13.8 ul
5 X Go Taq Flexi buffer 5 ul
25 mM Magnesium chloride 3 ul
10 uM dNTPs 1 ul
Primer 1 0.5 ul
Primer 2 0.5 ul
Go Taq 5U/ul 0.2 ul
DNA 1 ul
25 ul
5. Vortex the tubes and spin briefly to bring the contents to the bottom of the tube.
Once all the PCR reactions are set up, they will be cycled overnight under the following
conditions:
PCR Cycling Conditions
25
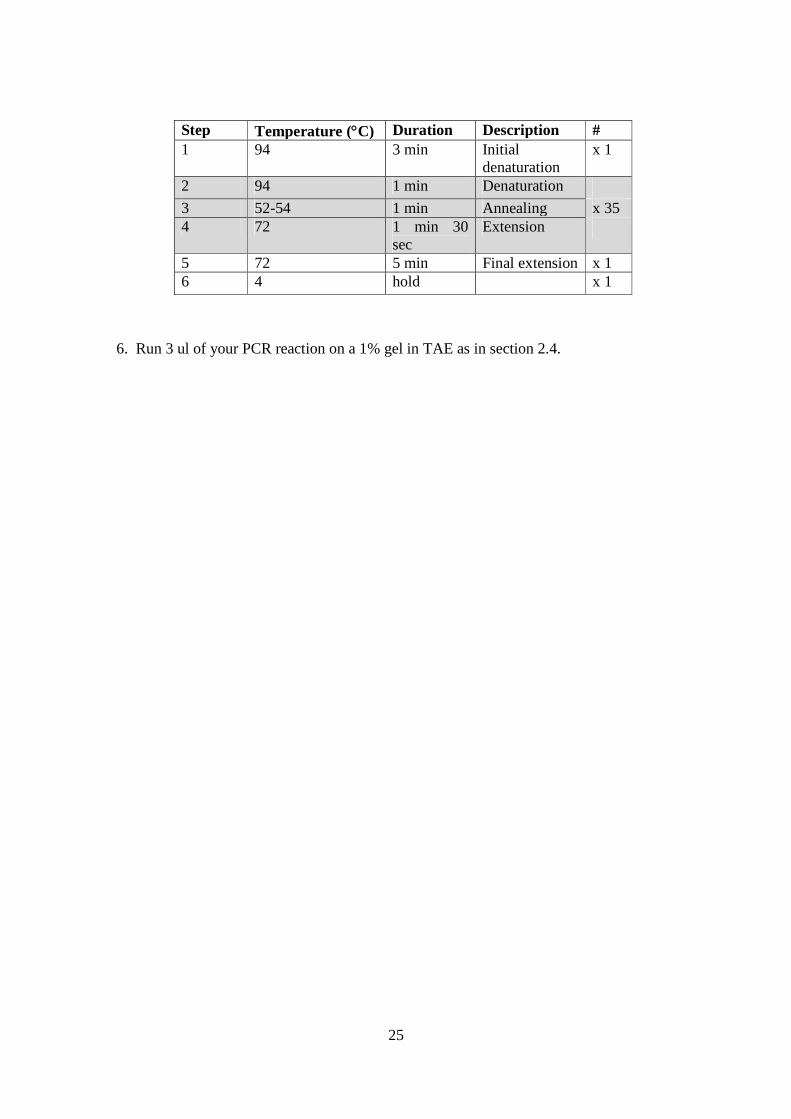
Step Temperature (C) Duration Description #
1 94 3 min Initialdenaturation
x 1
2 94 1 min Denaturation
3 52-54 1 min Annealing x 354 72 1 min 30
secExtension
5 72 5 min Final extension x 16 4 hold x 1
6. Run 3 ul of your PCR reaction on a 1% gel in TAE as in section 2.4.

26
Section 5: CTAB genomic DNA Extraction and ethanol
precipitation of snail DNA
Background
Certain tissue types and organisms provide more of a challenge in terms of DNA
extraction, with the "quick and easy" kit based techniques producing poor yields or
damaged (sheared) DNA. Snails can be problematic, the actual tissue is tough and
rubbery, so it is hard to physically break down and digest, and conventional techniques
may shear the DNA. An alternative, "home brew" technique can produce better results.
You will use a CTAB extraction technique coupled with organic extraction and ethanol
precipitation to extract DNA from a specimen of Biomphalaria glabrata.
CTAB (Cetyl Trimethyl Ammonium Bromide) is a powerful cationic surfactant
which helps disrupt and lyse the snail tissue. Proteinase K is also used to break down
proteins.
Organic compounds such as phenol and "chloroform" (see below for explanation for
the quote marks) are immiscible with aqueous solutions, yet denature and precipitate
out proteins from them, whilst leaving nucleic acids untouched; different subsets of
proteins are precipitated by the different organic compounds. Therefore mixing these
compounds with the snail lysate and then separating the aqueous and organic phases
by brief centrifugation (the aqueous phase is the top (lighter) one) clears the aqueous
phase of proteins, which either form a pellet at the bottom of the tube or a layer at the
interface between the phases. Because pure chloroform can be partly miscible with
water, it is always used as a 24:1 mix with isoamyl alcohol, which allows for a clearer
interface between the organic and aqueous phases. Hence "chloroform" refers to this
24:1 mix. Extraction can either be undertaken sequentially with phenol, then with a
1:1 mix of phenol-"chloroform", and finally with "chloroform", else 2 rounds of
extraction with a 1:1 mix of phenol-"chloroform" can be performed
In order to obtain DNA (actually total nucleic acids) from the resulting protein-free
lysate, it s precipitated out of solution with alcohol and recovered by centrifugation.
The DNA pellet is then washed, dried and redissolved in an appropriate aqueous
buffer. Nucleic acids precipitate out of aqueous solution in the presence of >67%
ethanol or >50% isopropanol. Either can be used, one the one hand, ethanol tends to
27
produce a slihghtly milky pellet whilst that with isopropanol is more glassy and so is
harder to see, on the other hand, the total sample volume is larger with ethanol
(volume of aqueous sample plus 2 volumes of 100% ethanol) than with isopropanol
(volume of aqueous sample plus 1 volume of 100% isopropanol) and so, depending
on sample volume, it may need to be divided between 2 tubes for the precipitation
step (so mote handling time). Often salts are added to the aqueous phase to promote
precipitation (eg ammonium acetate, sodium acetate, sodium chloride), hence the
pellet-rinsing step, to eliminate salt carry over into the purified DNA solution.
Note: both phenol and "chloroform" are toxic - standard laboratory schemes of
work dictate that these steps are conducted in a fume hood. Because you will be
using small volumes that have been pre-aliquoted for you, we have assessed that it is
safe to conduct this practical exercise on the open bench. If you wish to use a fume
cupboard, you are welcome to do so. All tips that are used during the organic
extraction step must be kept separate for specialist disposal, and the organic phases
must be sealed in tubes immediately after use, labelled and left on the bench for us
to collect.
5.1 Tissue solublisation
You are each supplied with:
Reagent Code
"x2" CTAB lysis buffer CTAB
Proteinase K (20mg / ml) PK
Frozen snail tissue
Consumables
Plastic petri dish
Plastic microfuge pestle
Screw cap 1.5 ml tube
1. Label the 1.5 ml screw cap tube.

28
2. Fresh or alcohol preserved animal tissue should be damp-dried quickly using a
kimwipe, diced into small pieces using a scalpel blade.
3. Transfer the macerated tissue to the 1.5 ml screw cap tube and label it with your
name
4. To the tube add 380 µl of CTAB extraction buffer and 20 µl of proteinase (20mg/ml
stock solution).
5. Crush the tissue well with a microfuge pestle.
6. Incubate in the rotating incubator at 55C overnight
5.2 Organic Extraction
You are each supplied with:
Reagent Code
Phenol:"chloroform" PC
Chloroform:isoamylalcohol (24:1)
Consumables
1.5 ml microfuge tubes
1. Transfer the snail lysate to a 1.5 ml microfuge tube
2. Place the tube into a microfuge and spin at full speed for 1 minute (ensure that the
rotor is balanced before running the microfuge) to pellet residual undigested
tissue.
3. Transfer the supernatant to a clean 1.5 ml tube, add 400 µl of phenol / "chloroform"
and firmly cap the tube
4. Gently invert the tube 20 times to form an emulsion.
5. Place the tube into a microfuge and spin at full speed for 3 minutes (ensure that the
rotor is balanced before running the microfuge).
6. Transfer the aqueous (top) phase to a clean, labelled 1.5 ml tube. Try not to transfer
any of the precipitated protein from the interface. It is better to leave a small
amount of the aqueous phase behind. Cap the waste tube containing the organic
phase.
29
7. Add 400 µl chloroform / isoamyl alcohol (24:1) to the aqueous phase and firmly cap
the tube
8. Gently invert the tube 20 times to form an emulsion.
9. Place the tube into a microfuge and spin at full speed for 3 minutes (ensure that the
rotor is balanced before running the microfuge).
10. Transfer the aqueous (top) phase to a clean, labelled 1.5 ml tube. It is essential to not
transfer any precipitated protein from the interface, or chloroform. Cap the
waste tube containing the organic phase.
5.3 Ethanol Precipitation of genomic DNA
You are each supplied with:
Reagent Code
10M sodium acetate SA
100% ultrapure ethanol Eth
70% ultrapure ethanol 70
Ultrapure water H2O
Consumables
Disposable plastic pasteur pipettes
Plastic petri dish
1.5 ml microfuge tubes
1. Add 40 µl of 10M sodium acetate (one tenth of the volume) to the final aqueous
phase from the organic extraction.
2. Add 880 µl of 100% ethanol (ie. 2 x the combined volume of the original aqueous
phase plus the acetate).
3. Vortex briefly to mix and then place in -70oC freezer for 5 minutes.
4. Remove tube from freezer and allow to warm up on bench for a couple of minutes (if
it goes straight into the centrifuge from the freezer, the tube will be brittle and
may shatter).
30
5. Place the tube into a microfuge and spin at full speed for 5 minutes (ensure that the
rotor is balanced before running the microfuge and that you place the tube into
the centrifuge with its hinge pointing outwards).
6. Carefully remove the supernatant with a plastic pasteur pipette and discard into the
petri dish (nb. The pellet may not be visible, but it will be on the side wall of the
tube down from the cap hinge, slide the tip of the pipette slowly down the
opposite wall of the tube, gently sucking up the liquid as you go).
7. Wash the pellet by adding 1000 µl of 70% ethanol and vortexing briefly.
8. Re-pellet the DNA by spinning at 14000 rpm for 2.5 minutes (ensure that the rotor
is balanced before running the microfuge and that you place the tube into the
centrifuge with its hinge pointing outwards).
9. Carefully remove and discard the supernatant (as above).
10. Spin the tube again for a few seconds (ensure that the rotor is balanced before
running the microfuge and that you place the tube into the centrifuge with its
hinge pointing outwards) and remove the last of the liquid.
11. Place the tube, with its cap off, in the heat block at 37oC for about 5 minutes to dry
the pellet / evaporate any remaining drops of fluid (do not overdry the pellet - check
it regularly and remove the tube as soon as there is no fluid left).
12. Once the pellet is dry, add 50 µl of ultra water and incubate in the heat block at 37oC
for 30 minutes to redissolve the DNA. On 3- 4 ocassions during this period, gently
tap the side of the tube to aggitate its contents.
13. Store extracted DNA at -20oC
Note:
samples can be redissolved overnight at 4oC as an alternative.
Redissolving DNA in water, and storing at 4 oC is fine for short term storage (a few
weeks maximum). For longer term storage, samples should be redissolved in TE
buffer (10 mM Tris, 1 mM EDTA) and stored at -20oC. For most purposes, repeated
freeze-thawing will not harm the DNA.
31
Agarose gel analysis of purified gDNA
You are each supplied with:
Reagent code
Loading dye LD
Hyperladder 1
1. Prepare agarose gel as in section 1.3.
2. Into a clean 0.5 ml centrifuge tube place the following and mix by gentle
aspiration:
3. 3 µl of your DNA sample
4. 2 µl of loading dye
5. Carefully load your 5 µl sample of (DNA plus loading dye) onto the agarose gel
(note the order in which you load your samples).
6. In a separate lane load 5 µl of the molecular standard, Hyperladder 1, which
allows you to determine the size of your DNA.
7. The gel will be run at 60V for 45 minutes, examined and photographed under UV.
32
Section 6: DNA Gel Extraction
DNA gel extraction is used to purify DNA from contaminants or to purify a specific
fragment from a PCR reaction that has several fragments.
6.1 Agarose gel electrphoresis of PCR product
1. Prepare a 1% agarose gel in 1 x TAE as in section 1.3.
Note use the wide combs when making the agarose gel if the bands are going to
be excised.
2. Into a clean 0.5 ml centrifuge tube, place the following and mix by gentle
aspiration:
3. 22 µl of your PCR sample (PCR sample remaining)
4. 5 µl of loading dye
5. Carefully load your 27 µl sample of (PCR reaction plus loading dye) onto the
agarose gel (note the order in which you load your samples).
6. In a separate lane load 5 µl of the molecular standard, Hyperladder 1, which
allows you to determine the size of your PCR product.
7. Run the gel at 60V until it has run almost to the end, examined and proceed tosection 6.2 below.
6.2 QIAquick Gel Extraction Kit Protocol-using a microcentrifuge
This protocol is designed to extract and purify DNA of 70 bp to 10 kb from standard or
low-melt agarose gels in TAE or TBE buffer. Up to 400 mg agarose can be processed per
spin column.
Notes: • The yellow color of Buffer QG indicates a pH ≤7.5.
• Add ethanol (96–100%) to Buffer PE before use (see bottle label for volume).
• Isopropanol (100%) and a heating block or water bath at 50°C are required.
• All centrifugation steps are carried out at 13,000 rpm (~17,900 x g) in a
conventional table-top microcentrifuge.
• 3 M sodium acetate, pH 5.0, may be necessary.

33
1. View the agarose gel on a longwave UV light box. Excise the DNA fragment
from the agarose gel with a clean, sharp scalpel.
Minimize the size of the gel slice by removing extra agarose.
2. Weigh the gel slice in a colorless tube. Add 3 volumes of Buffer QG to 1
volume of gel (100 mg ~ 100 μl).
For example, add 300 μl of Buffer QG to each 100 mg of gel. For >2% agarose
gels, add 6 volumes of Buffer QG. The maximum amount of gel slice per QIAquick
column is 400 mg; for gel slices >400 mg use more than one QIAquick column.
3. Incubate at 50°C for 10 min (or until the gel slice has completely dissolved).
To help dissolve gel, mix by vortexing the tube every 2–3 min during the
incubation.
IMPORTANT: Solubilize agarose completely. For >2% gels, increase incubation
time.
4. After the gel slice has dissolved completely, check that the color of the
mixture is yellow (similar to Buffer QG without dissolved agarose).
If the color of the mixture is orange or violet, add 10 μl of 3 M sodium acetate,
pH 5.0, and mix. The color of the mixture will turn to yellow.The adsorption of
DNA to the QIAquick membrane is efficient only at pH ≤7.5. Buffer QG contains
a pH indicator which is yellow at pH ≤7.5 and orange or violet at higher pH,
allowing easy determination of the optimal pH for DNA binding.
5. Add 1 gel volume of isopropanol to the sample and mix.
For example, if the agarose gel slice is 100 mg, add 100 μl isopropanol. This step
increases the yield of DNA fragments <500 bp and >4 kb. For DNA fragments
between 500 bp and 4 kb, addition of isopropanol has no effect on yield. Do not
centrifuge the sample at this stage.
6. Place a QIAquick spin column in a provided 2 ml collection tube.
7. To bind DNA, apply the sample to the QIAquick column, and centrifuge for
1 min.
The maximum volume of the column reservoir is 800 μl. For sample volumes of
more than 800 μl, simply load and spin again.
8. Discard flow-through and place QIAquick column back in the same
collection tube. Collection tubes are re-used to reduce plastic waste.
34
9. (Optional): Add 0.5 ml of Buffer QG to QIAquick column and centrifuge
for 1 min.
This step will remove all traces of agarose. It is only required when the DNA will
subsequently be used for direct sequencing, in vitro transcription or
microinjection.
10. To wash, add 0.75 ml of Buffer PE to QIAquick column and centrifuge for 1
min.
Note: If the DNA will be used for salt sensitive applications, such as blunt-end
ligation and direct sequencing, let the column stand 2–5 min after addition of
Buffer PE, before centrifuging.
11. Discard the flow-through and centrifuge the QIAquick column for an
additional 1 min at 13,000 rpm (~17,900 x g).
IMPORTANT: Residual ethanol from Buffer PE will not be completely removed
unless the flow-through is discarded before this additional centrifugation.
12. Place QIAquick column into a clean 1.5 ml microcentrifuge tube.
13. To elute DNA, add 50 μl of Buffer EB (10 mM Tris·Cl, pH 8.5) or H2O to the
center of the QIAquick membrane and centrifuge the column for 1 min.
Alternatively, for increased DNA concentration, add 30 μl elution buffer to
the center of the QIAquick membrane, let the column stand for 1 min, and
then centrifuge for 1 min.
IMPORTANT: Ensure that the elution buffer is dispensed directly onto the
QIAquick membrane for complete elution of bound DNA. The average eluate
volume is 48 μl from 50 μl elution buffer volume, and 28 μl from 30 μl. Elution
efficiency is dependent on pH. The maximum elution efficiency is achieved
between pH 7.0 and 8.5. When using water, make sure that the pH value is within
this range, and store DNA at –20°C as DNA may degrade in the absence of a
buffering agent. The purified DNA can also be eluted in TE (10 mM Tris·Cl, 1 mM
EDTA, pH 8.0), but the EDTA may inhibit subsequent enzymatic reactions
6.2 Agarose gel analysis of PCR product

35
You are each supplied with:
Reagent code
Loading dye LD
Hyperladder 1
1. Prepare a 1% agarose gel in 1 x TAE as in section 1.3
2. Into a clean 0.5 ml centrifuge tube, place the following and mix by gentle
aspiration:
3. 3 µl of your purified PCR product
4. 2 µl of loading dye
5. Carefully load your 5 µl sample of (PCR product plus loading dye) onto the
agarose gel (note the order in which you load your samples).
6. In a separate lane load 5 µl of the molecular standard, Hyperladder 1, which
allows you to determine the size of your PCR product.
7. The gel will be run at 60V for 45 minutes, examined and photographed under UV.

36
Section 7: Theoretical Background on Basic Molecular
Techniques
7.1 DNA Extraction
DNA Extraction or rather, nucleic extraction is the process by which nucleic acids are
liberated from and then purified away from other cellular materials. There are three basic
and followed by selective recovery of nucleic acids from the cellular lysate :
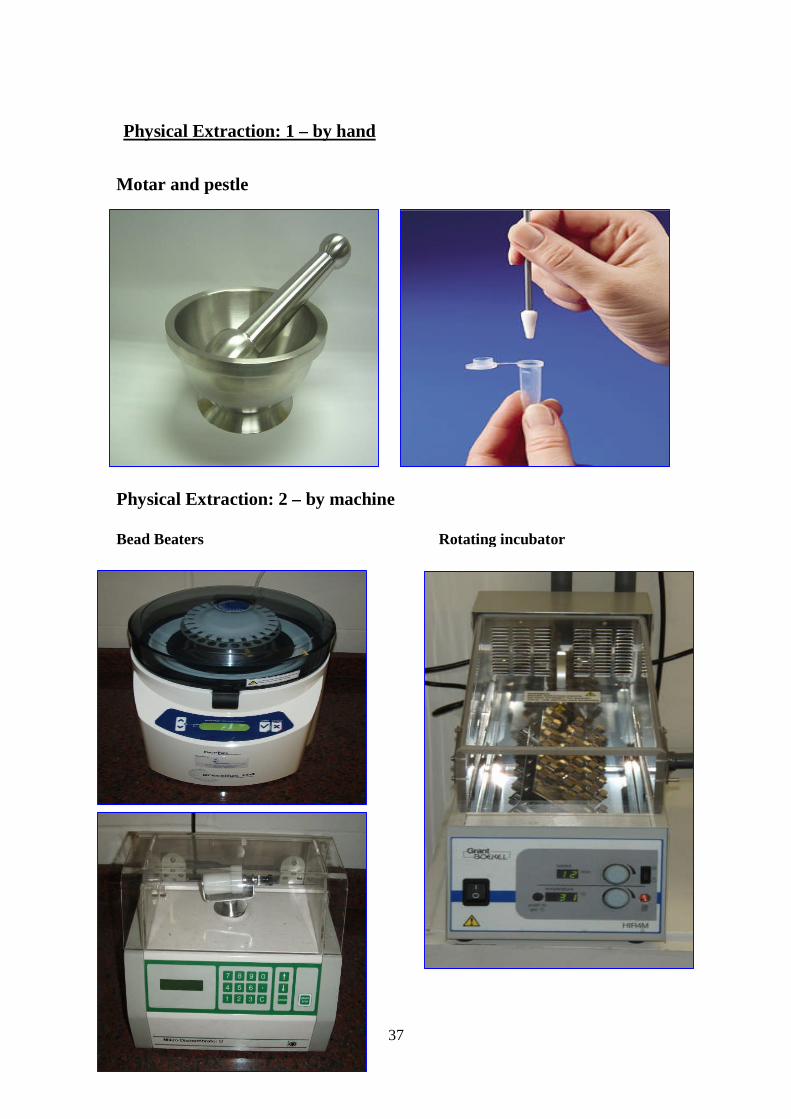
1. Physical Extraction- Breaking the cells open, commonly referred to as cell
disruption or cell lysis to expose the DNA within. This is commonly achieved by
grinding, homogenization, bead beating or sonicating the sample.
2. Chemical dissociation – the solubilisation of lipids (cellular, nuclear,
cytoplasmic and organellar membrane systems) using powerful detergent
solutions (with appropriate buffer conditions (TRIS, EDTA)) such as:
SDS (Sodium Docecyl Sulphate)
CTAB (Cetyl Trimethyl Ammonium Bromide )
For bacterial plasmid preparation:
SDS and NaOH is used to bust open the cells, followed by neutralisation and
precipitation of cell wall and protein with potassium acetate mitochondrial
DNA
3. Enzymatic dissociation
DNA associated proteins, as well as other cellular proteins, may be degraded with the
addition of a protease. Precipitation of the protein is aided by the addition of a salt
such as ammonium or sodium acetate. When the sample is vortexed with phenol-
chloroform and centrifuged the proteins will remain in the organic phase and can be
drawn off carefully. The DNA will be found at the interface between the two phases
(see below)
37
Physical Extraction: 1 – by hand
Motar and pestle
Physical Extraction: 2 – by machine
Bead Beaters Rotating incubator
38
4. Recovery of Nucleic Acids
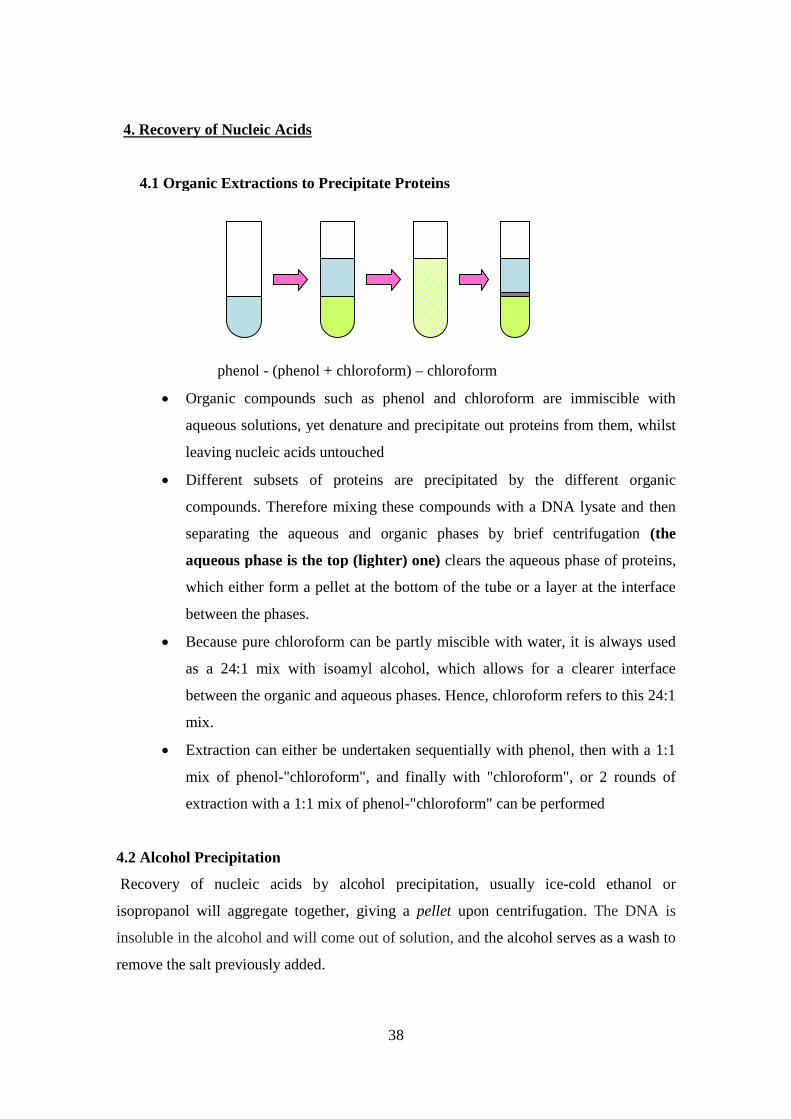
4.1 Organic Extractions to Precipitate Proteins
phenol - (phenol + chloroform) – chloroform
Organic compounds such as phenol and chloroform are immiscible with
aqueous solutions, yet denature and precipitate out proteins from them, whilst
leaving nucleic acids untouched
Different subsets of proteins are precipitated by the different organic
compounds. Therefore mixing these compounds with a DNA lysate and then
separating the aqueous and organic phases by brief centrifugation (the
aqueous phase is the top (lighter) one) clears the aqueous phase of proteins,
which either form a pellet at the bottom of the tube or a layer at the interface
between the phases.
Because pure chloroform can be partly miscible with water, it is always used
as a 24:1 mix with isoamyl alcohol, which allows for a clearer interface
between the organic and aqueous phases. Hence, chloroform refers to this 24:1
mix.
Extraction can either be undertaken sequentially with phenol, then with a 1:1
mix of phenol-"chloroform", and finally with "chloroform", or 2 rounds of
extraction with a 1:1 mix of phenol-"chloroform" can be performed
4.2 Alcohol Precipitation
Recovery of nucleic acids by alcohol precipitation, usually ice-cold ethanol or
isopropanol will aggregate together, giving a pellet upon centrifugation. The DNA is
insoluble in the alcohol and will come out of solution, and the alcohol serves as a wash to
remove the salt previously added.
39
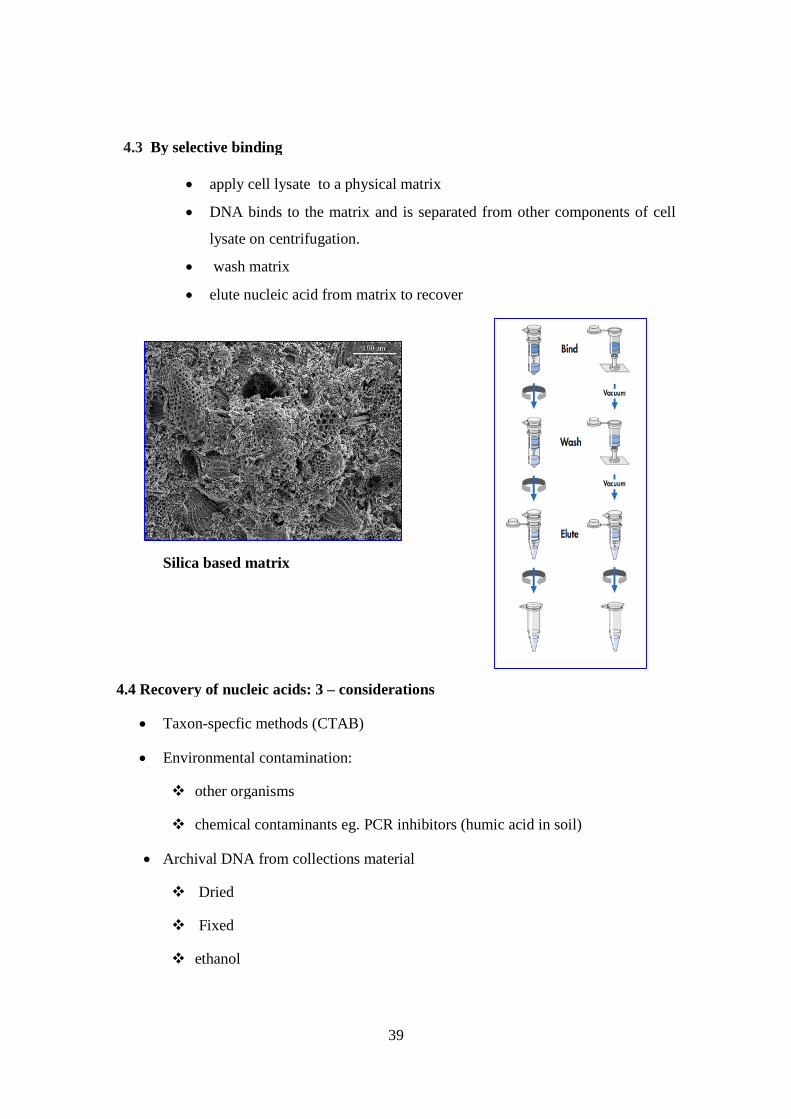
4.3 By selective binding
apply cell lysate to a physical matrix
DNA binds to the matrix and is separated from other components of cell
lysate on centrifugation.
wash matrix
elute nucleic acid from matrix to recover
Silica based matrix
4.4 Recovery of nucleic acids: 3 – considerations
Taxon-specfic methods (CTAB)
Environmental contamination:
other organisms
chemical contaminants eg. PCR inhibitors (humic acid in soil)
Archival DNA from collections material
Dried
Fixed
ethanol
40
formalin?
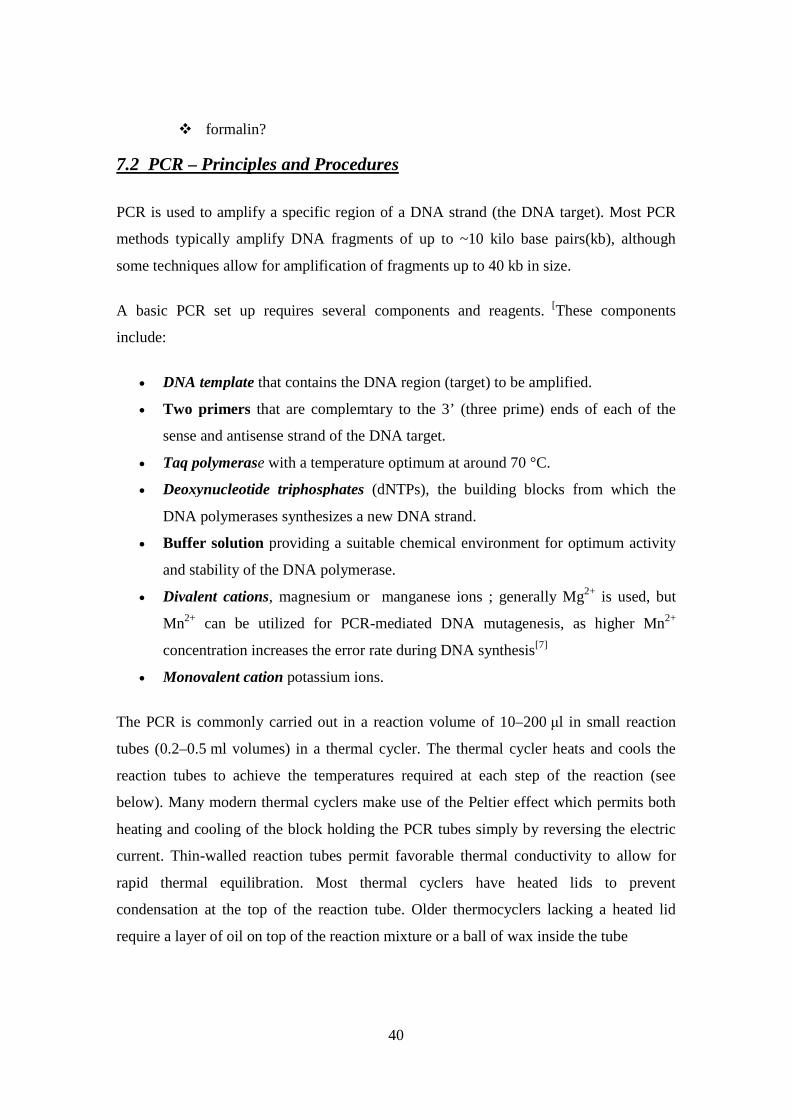
7.2 PCR – Principles and Procedures
PCR is used to amplify a specific region of a DNA strand (the DNA target). Most PCR
methods typically amplify DNA fragments of up to ~10 kilo base pairs(kb), although
some techniques allow for amplification of fragments up to 40 kb in size.
A basic PCR set up requires several components and reagents. [These components
include:
DNA template that contains the DNA region (target) to be amplified.
Two primers that are complemtary to the 3’ (three prime) ends of each of the
sense and antisense strand of the DNA target.
Taq polymerase with a temperature optimum at around 70 °C.
Deoxynucleotide triphosphates (dNTPs), the building blocks from which the
DNA polymerases synthesizes a new DNA strand.
Buffer solution providing a suitable chemical environment for optimum activity
and stability of the DNA polymerase.
Divalent cations, magnesium or manganese ions ; generally Mg2+ is used, but
Mn2+ can be utilized for PCR-mediated DNA mutagenesis, as higher Mn2+
concentration increases the error rate during DNA synthesis[7]
Monovalent cation potassium ions.
The PCR is commonly carried out in a reaction volume of 10–200 μl in small reaction
tubes (0.2–0.5 ml volumes) in a thermal cycler. The thermal cycler heats and cools the
reaction tubes to achieve the temperatures required at each step of the reaction (see
below). Many modern thermal cyclers make use of the Peltier effect which permits both
heating and cooling of the block holding the PCR tubes simply by reversing the electric
current. Thin-walled reaction tubes permit favorable thermal conductivity to allow for
rapid thermal equilibration. Most thermal cyclers have heated lids to prevent
condensation at the top of the reaction tube. Older thermocyclers lacking a heated lid
require a layer of oil on top of the reaction mixture or a ball of wax inside the tube

41
42
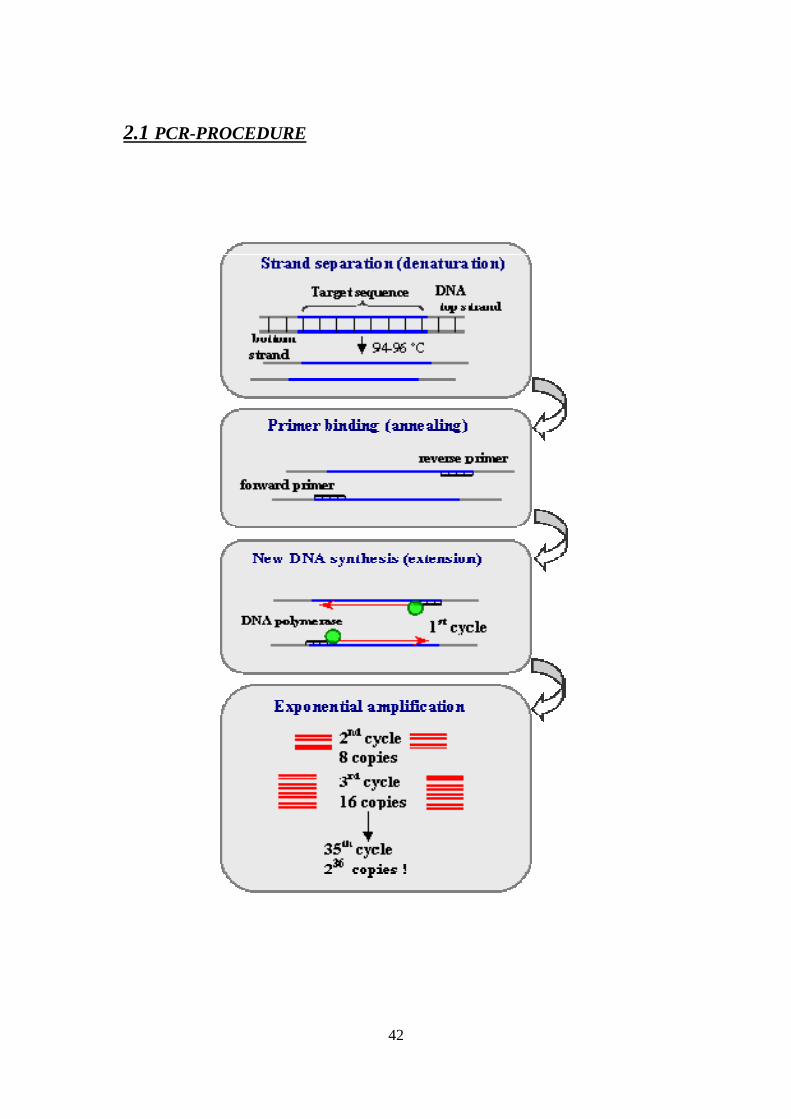
2.1 PCR-PROCEDURE
43
Initialization step: This step consists of heating the reaction to a temperature of 94–96 °C
(or 98 °C if extremely thermostable polymerases are used), which is held for 1–9
minutes. It is only required for DNA polymerases that require heat activation by hot start
PCR.
Hot-Start PCR a technique that reduces non-specific amplification during the
initial set up stages of the PCR. It may be performed manually by heating the
reaction components to the melting temperature (e.g., 95°C) before adding the
polymerase. Specialized enzyme systems have been developed that inhibit the
polymerase's activity at ambient temperature, either by the binding of an antibody
or by the presence of covalently bound inhibitors that only dissociate after a high-
temperature activation step. Hot-start/cold-finish PCR is achieved with new
hybrid polymerases that are inactive at ambient temperature and are instantly
activated at elongation temperature.
Denaturation step: This step is the first regular cycling event and consists of heating the
reaction to 94–98 °C for 20–30 seconds. It causes DNA melting of the DNA template by
disrupting the hydrogen bonds between complementary bases, yielding single strands of
DNA.
Annealing step: The reaction temperature is lowered to 50–65 °C for 20–40 seconds
allowing annealing of the primers to the single-stranded DNA template. Typically the
annealing temperature is about 3-5 degrees Celsius below the Tm of the primers used.
Stable DNA-DNA hydrogen bonds are only formed when the primer sequence very
closely matches the template sequence. The polymerase binds to the primer-template
hybrid and begins DNA synthesis.
Extension/elongation step: The temperature at this step depends on the DNA polymerase
used; Taq polymerase has its optimum activity temperature at 75–80 °C, and commonly a
temperature of 72 °C is used with this enzyme. At this step the DNA polymerase
synthesizes a new DNA strand complementary to the DNA template strand by adding
dNTPs that are complementary to the template in 5' to 3' direction, condensing the 5'-
phosphate group of the dNTPs with the 3’-hydroxyl group at the end of the nascent
(extending) DNA strand. The extension time depends both on the DNA polymerase used
44
and on the length of the DNA fragment to be amplified. As a rule-of-thumb, at its
optimum temperature, the DNA polymerase will polymerize a thousand bases per minute.
Under optimum conditions, i.e., if there are no limitations due to limiting substrates or
reagents, at each extension step, the amount of DNA target is doubled, leading to
exponential amplification of the specific DNA fragment.
Final elongation: This single step is occasionally performed at a temperature of 70–
74 °C for 5–15 minutes after the last PCR cycle to ensure that any remaining single-
stranded DNA is fully extended.
Final hold: This step at 4–15 °C for an indefinite time may be employed for short-term
storage of the reaction.
2.2 PCR Optimization
1. PCR Primer Design Guidelines
PCR involves the following three steps: denaturation, annealing and extension. First, the
genetic material is denatured, converting the double stranded DNA molecules to single
strands. The primers are then annealed to the complementary regions of the single
stranded molecules. In the third step, they are extended by the action of the DNA
polymerase. All these steps are temperature sensitive and the common choice of
temperatures is 94oC, 60oC and 70oC respectively. Good primer design is essential for
successful reactions. The important design considerations described below are a key to
specific amplification with high yield.
Primer Length- Typical primers are 18-28 nucleotides in length. A shorter
primer such as a 15mer would have a higher chance of annealing at more than one
complementary site within the genome. This may lead to amplification of
nonspecific PCR products.
Primer Sequence
a) Avoid runs (3 or more) of C’s and G’s at the 3’ends of primers as this may
promote mispriming at G+C rich sequences.
b) A thymidine (T) at the 3' end is not recommended, since it is more prone
to mispriming than other nucleotides.

45
c) Avoid complementarity at the 3’ ends of primer pairs as this promotes the
formation of primer-dimer artefacts and reduces the yield of the desired
product. (The creation and subsequent amplification of these primer–
dimers reduces the availability of primer to the template molecule
resulting in decreased sensitivity or even failure of the PCR).
d) Avoid sequences with significant secondary structure. Primer sequences
should also be checked for self complementarity which could introduce
secondary structures like hairpin loops into the primer.
GC Content - The GC content (the number of G's and C's in the primer as a
percentage of the total bases) of primer should be 40-60 %
Primer Melting Temperature (Tm)- by definition is the temperature at which one
half of the DNA duplex will dissociate to become single stranded and indicates
the duplex stability. Primers with melting temperatures in the range of 52-58 oC
generally produce the best results. Primers with melting temperatures above 65oC
have a tendency for secondary annealing. The GC content of the sequence gives a
fair indication of the primer Tm.
Annealing temperature - The calculated Tm for a given primer pair should be
similar. For this purpose, one can use the rule of thumb calculation of 2˚C for A
or T and 4˚C for G or C (Thein and Wallace 1986). As a starting point, an
annealing temperature 5°C below the Tm can be used. This is usually the adjusted
to improve specificity and yield in a series of optimization experiments.
2. Primer Annealing
The temperature and length of time required for primer annealing depend on base
composition, length and concentration of the amplification primers. An applicable
annealing temp is 5˚C below the true Tm of the amplification primers.
Increasing the annealing temp, increases specificity. It enhances discrimination
against incorrectly annealed primers and reduces misextension of incorrect
nucleotide s at the 3’’end of primers.
Low extension temperatures together with high dNTP concentrations favours
misextension of primers and extension of misincoporated nucleotides.
46
3. Primer Extension
Extension time depends upon the length and concentration of the target sequence and
upon temperature. Primer extensions traditionally performed at 72˚C, because this
temperature was near optimal for extending primers on M13-based model template.
Length of step is dependent on your target sequence length. In general, allow 1 min. per
1,000 bp of target to be amplified. An extension time of 5-10 min. at the end of the
program allows for final extension of any unfinished products.
4. Denaturation Time and Temperature
The most likely cause for failure of a PCR is incomplete denaturaton of the target
template and/or the PCR product.
Incomplete denaturation allows the DNA to”snap back’ and, thus reduces the
product yield.
A high or too long denaturation step leads to unnecessary loss of enzyme activity.
5. Deoxynucleotide Triphosphates (dNTPs)
Deoxynucleotide concentration between 20 and 200µM each result in optimal
balance among yield, specificity and fidelity.
The four dNTPs should be used at equivalent concentrations to minimize
misincoporation errors.
Both the specificity and the fidelity of PCR are increased by using lower dNTP
concentration.
Lower dNTP concentration minimizes mispriming at non-target sites and reduces
the likelihood of extending misincoporated nucleotides.
6. Magnesium Concentration
It is beneficial to optimize the magnesium ion concentration, as this is a necessary
cofactor enzyme. A high magnesium concentration gives a higher yield, but also lower
specificity.
Magnesium ion concentration may affect all of the following:-
47
Primer annealing
Strand dissociation temperatures of both template and PCR product
Product specificity
Formation of primer –dimer artifacts
Enzyme activity and fidelity
Taq DNA polymerase requires free magnesium on top of that bound by template DNA,
primers and dNTPs. PCRS should contain 0.5 to 2.5 mM magnesium over the total dNTP
concentration. Note: the presence of EDTA or other chelators in the primer stocks or
template DNA may disturb the apparent magnesium optimum.
7. Enzyme Concentration
Recommended concentration range for Taq DNA polymerase is between 1 and
2.5 units.
Requirements may vary with respect to individual target templates or primers.
When optimizing a PCR, testing enzyme concentrations ranging from 0.5 units to
5units / 100µl and assaying the results by gel electrophoresis.
If the enzyme concentration is too high, non-specific background products may
accumulate and if too low, an insufficient amount of desired product is made.
8. Cycle Number
The optimum number of cycles will depend mainly upon the starting concentration of
target DNA when other parameters are optimized.
A common mistake is to execute too many cycles. You should not have to go over
40 cycles as a rule.
Too many cycles can increase the amount and complexity of non-specific back
ground products. Optimizing the number of PCR cycles is the best way to avoid to
amplifying background products.
Too few cycles give low product yield.
48
2.3 PCR Troubleshooting
1. The Template DNA
The amount of total DNA in a PCR has a marked effect on the outcome of a PCR
procedure.
Using too much total DNA results in packed DNA in the confined space of the
reaction vessel and can lead to false priming and even poor DNA synthesis due to
the obstructed diffusion of large Taq polymerase molecules.The concentration of
the target DNA should be balanced with the number of cycles in the reaction.
Using an elevated concentration of the target combined with the normal, or higher
than normal, number of cycles can cause the accelerated accumulation of
nonspecific products.
The accumulation of nonspecific products is often observed in a re-amplification
PCR, when the high initial concentration of the PCR fragment is accompanied by
a high number of cycles. Reducing the number of cycles may help. However, low
concentrations of primer, target, Taq, and nucleotides are recommended as these
generally ensure cleaner product and lower background.
Impurities in nucleic acid preparations or in biological samples can inhibit or
reduce the sensitivity and efficiency of PCR amplification
2. Inadequate dNTPs
An incorrect concentration of deoxynucleotide triphosphates (dNTPs) can cause
problems for the PCR procedure.
The usual dNTP concentration is between 40μM and 200μM of EACH of the four
dNTPs.
Excessive dNTP concentrations can inhibit the PCR preventing the formation of
product.
Low primer, target, Taq and dNTP concentrations are preferable as these
generally ensure cleaner product and lower background.
49
For longer PCR-fragments a higher deoxynucleotide triphosphate concentration
may be required.
A large change in the dNTP concentration may require a corresponding change in
the concentration of MgCl2.
Suboptimal concentration of nucleotides can cause incomplete primer elongation
or premature termination of DNA synthesis during the elongation step of the PCR
cycle.
3. Primer Concentration
The concentration of primer in the amplification reaction should be between 0.1 and 0.5
μM. For most PCR applications, including sensitive PCR assays and the amplification of
longer PCR products, 0.2 μM of each primer produces satisfactory results.
High primer concentrations can have the following effects:
Will promote mis-priming and accumulation of nonspecific product and may
increase the probability of generating a template-dependent artifact termed a
primer-dimer. If the primers are capable of forming dimers, raising their
concentration only results in the creation of primer-dimers and does not improve
the amplification of the desired PCR product.
Non specific products and primer–dimer artifacts generated are themselves
substrates for PCR and compete with the desired product for Taq, dNTPs and
primers, resulting in a lower yield of the desired product.
Raising the primer concentration does not therefore cause an increase in the effective
concentration of the primers. Low primer concentration generally ensures cleaner
product and lower background.
However, to amplify short PCR target sequences, careful calculation of the optimum
primer concentration is required. For example, if the target fragment length is 100bp,
a greater number of PCR product molecules is required to provide a specified amount
of amplified DNA (in nanograms) than for a larger target fragment. In order to
generate the required number of PCR product molecules, a greater number of primers
50
may be needed. Therefore, concentration of primers higher than 1μM may be necessary,
and desirable, for short target sequences.
4. Taq Concentration
In a PCR experiment approximately 1 unit of the Taq enzyme should be used for a 25μl
reaction.
Suboptimal concentration of the Taq enzyme can cause incomplete primer
elongation or premature termination of the PCR product synthesis during the
elongation step of a PCR cycle.
Too much Taq will result in an excessive background of unwanted DNA
fragments (a smear on a gel) while a huge excess may cause the reaction to fail
with no product being detected. A Taq concentration of 1 unit per 25μl reaction
ensures a cleaner product and lower background.
5. Mg Concentration
Magnesium is a required cofactor for thermostable DNA polymerases. Mg2+ in the PCR
mixture stabilizes dsDNA and raises the Tm. Mg2+ concentration therefore is an
important for controlling the specificity of the reaction.
A low Mg2+ concentration requires more stringent base pairing in the annealing
step. Too few Mg2+ ions result in a low yield of PCR product.
Too many Mg2+ ions increase the yield of non-specific products and promote
misincorporation as the fidelity of the Taq is reduced. On a gel this can appear as
a ladder or smear. The MgCl2 concentration should normally be between 1mM
and 4mM
Insufficient Mg2+ concentration in a PCR mixture can causes failure of the
reaction.
The MgCl2 concentration should normally be between 1mM and 4mM. Since
dNTPs sequester Mg2+ ions, a major change in the dNTP concentration in a
rection would require a change in the concentration of MgCl2. Similarly,

51
changing the KCl-based buffer concentration or any other component of the
PCR mix may require adjustment of the Mg2+ concentration in the reaction
mixture.
6. KCl Concentration
Potassium chloride (KCl) is normally used in a PCR amplification at a final concentration
of 50mM. To improve the PCR amplification of DNA fragments, especially fragments in
the size range 100bp to 1000bp, a KCl concentration of between 70mM and 100mM is
sometimes recommended.
For the amplification of longer products a lower salt concentration appears to be
better.
PCR amplification of short products works better at higher salt concentrations.
This is probably because an increase in salt concentration permits shorter DNA
molecules to denature preferentially to longer DNA molecules. Shorter molecules
are therefore amplified better at higher salt concentration. It should be
remembered however that a salt concentration above 50mM can inhibit the
Taq polymerase.
An increase in KCl concentration may reduce the appearance of unwanted, long,
non-specific products.
Decreasing the KCl concentration to about 35 or 40mM, should get rid of short,
non-specific products.
In either case do not change the MgCl2 concentration. To improve the yield of a
product you can try adjusting the KCl concentration: increase it for a desired
product less than 1000bp; lower it for a desired product greater than 1000bp.
Consider the following PCR methods
Nested PCR: A second PCR is performed on the product generated from the first PCR
using primers, which are internal to the original primer pair. This improves sensitivity
without impairing specificity.
52
Semi or hemi-nested PCR: If a full nested PCR (using two internal primers) cannot be
performed, sensitivity and specificity can be improved by using just one ‘inner’ primer in
conjunction with one of the ‘outer’ primers from the first reaction.
Touchdown PCR: Begin PCR cycle with a more stringent annealing temperature and
decrease after each cycle until a predetermined annealing temperature is reached. This
allows more stringent annealing of primers to template in the first few rounds of PCR,
increasing the specificity of the PCR product. As specific products accumulate in the first
rounds, they become available as templates in succeeding rounds which have decreased
annealing temperature allowing for higher yield of product.
2.4 Frequently asked Questions (FAQ)
No Product Yield:
1. Is enzyme being added reproducibly? Consider making a master mix for multiple
PCR reactions.
2. Are proper 0.2 ml tubes being used? The 0.2 ml tubes have thinner walls and
allow for faster heat-transfer during temperature shifts.
3. Is denaturation step sufficient? Consider higher temperature or longer time.
4. Are primers stable? Reliable? Redesign or order new primers. Consider nested
PCR (2 rounds of PCR with different primer sets).
5. Are there proteases or nucleases in sample? Consider a pre-incubation at 95°C
for 5-10 min before adding Taq. Use proteinase-K and inactivate at 95°C for 5-
10 min before adding Taq.
Low Product Yield - Optimize four key parameters:
1. Annealing temperature
2. Number of PCR cycles
3. Mg2+ concentration
4. Template concentration

53
Smear of PCR products on Gel – How to get specificity:
1. Too much starting template? Check the concentration of the starting template.
Make serial dilutions of template nucleic acid from stock solutions. Perform PCR
using these serial dilutions.
2. Taq polymerase concentration too high? Use master mixes.
3. Mg2+ concentration not optimal (too high)? Use buffer that allows separate
addition of Mg2+. Perform a Mg2+ gradient from 0.5–5.0 mM (in 0.5 mM
steps).
4. Are annealing or extension steps too long? Minimize times.
5. Primer concentration not optimal or primers degraded? Repeat the PCR with
different primer concentrations from 0.1–0.5 µM of each primer (in 0.1 µM
steps).
6. Too many PCR cycles? Reduce the number of cycles in steps of 3 cycles.
7. Annealing temperature too low? Optimize annealing temperature or redesign
primers. Touchdown PCR (decrease annealing temperature each cycle). Hot-start
PCR (withhold Taq until after initial 5 min. denaturation).
8. Primer design not optimal? Review your primer design, and design new primers.
9. Do primers have high complementarity to many sites on DNA? Blast primer
sequences against template DNA sequence. Consider nested primer approach.
Primer Dimer Formation
1. Are 3’ ends of primer pairs complementary? Shift primer sequence up or down
and reorder primers.
2. Are primers too short? Check primer characteristics.
3. Is template DNA concentration insufficient? Increase amount of template DNA
added or re-test template DNA concentration.
4. Are primers too concentrated? Decrease primer amount or re-dilute primers from
stock.
5. Too many cycles? Decrease number of cycles.
6. Annealing temperature too low? Increase annealing temperature or try gradient
PCR.
54
7.3 Agarose Gel Electrophoresis
Agarose electrophoresis is a method used where charged molecules in solution, mainly
nucleic acids and proteins, migrate in response to an electrical field. The rate of
migration through the electrical field depends on:
the net charge of the nucleic acid /protein
the size and shape of the molecules
the ionic strength, viscosity, and the medium through which the molecules are
moving
3.1 Factors affecting migration of nucleic acids
In an electric field, molecules migrate through the gel towards the anode
(Negative-Positive) due to their overall negative charge. Nucleic acids have a
natural negative charge due to their sugar-phosphate backbone.
Separation of molecules on the gel is influenced by the molecule size and the
effective pore size of the gel.
Increasing the agarose concentration of a gel reduces the migration speed and
enables separation of smaller DNA molecules. The higher the voltage, the faster
the DNA moves. But voltage is limited by the fact that it heats and ultimately
causes the gel to melt
Conformations of DNA plasmid that has not been cut with a restricition enzyme
will move with different speeds (slowest to fastest: nicked or open circular,
linearised or suoercoiled plasmid)
3.2. Percent agarose and resolution limits
Agarose gel electrophoresis can be used for the separation of DNA fragments ranging
from 50 base pair to several megabases (millions of bases) using specialized apparatus.
The distance between DNA bands of a given length is determined by the percent agarose
in the gel. In general lower concentrations of agarose are better for larger molecules
because they result in greater separation between bands that are close in size. The
disadvantage of higher concentrations is the long run times (sometimes days). Instead
high percentage agarose gels should be run with pulse field electrophoresis (PFE).The
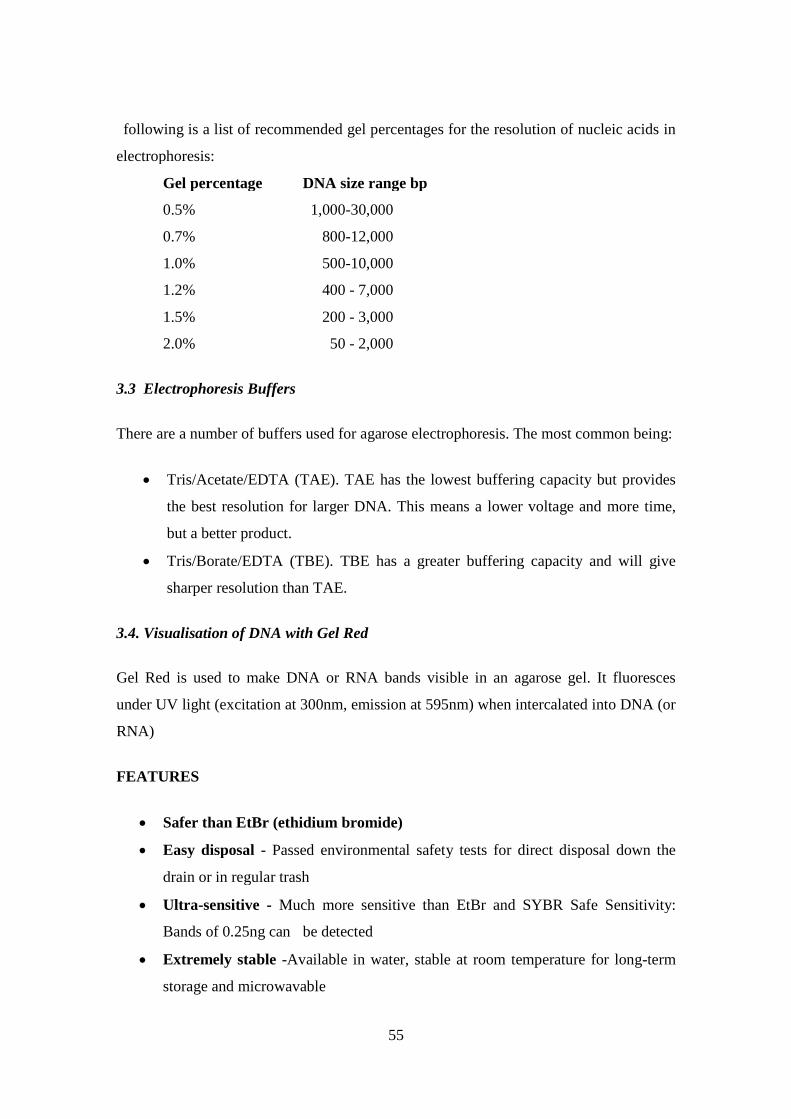
55
following is a list of recommended gel percentages for the resolution of nucleic acids in
electrophoresis:
Gel percentage DNA size range bp
0.5% 1,000-30,000
0.7% 800-12,000
1.0% 500-10,000
1.2% 400 - 7,000
1.5% 200 - 3,000
2.0% 50 - 2,000
3.3 Electrophoresis Buffers
There are a number of buffers used for agarose electrophoresis. The most common being:
Tris/Acetate/EDTA (TAE). TAE has the lowest buffering capacity but provides
the best resolution for larger DNA. This means a lower voltage and more time,
but a better product.
Tris/Borate/EDTA (TBE). TBE has a greater buffering capacity and will give
sharper resolution than TAE.
3.4. Visualisation of DNA with Gel Red
Gel Red is used to make DNA or RNA bands visible in an agarose gel. It fluoresces
under UV light (excitation at 300nm, emission at 595nm) when intercalated into DNA (or
RNA)
FEATURES
Safer than EtBr (ethidium bromide)
Easy disposal - Passed environmental safety tests for direct disposal down the
drain or in regular trash
Ultra-sensitive - Much more sensitive than EtBr and SYBR Safe Sensitivity:
Bands of 0.25ng can be detected
Extremely stable -Available in water, stable at room temperature for long-term
storage and microwavable

56
Simple to use -Very simple procedures for either pre-cast and post gel staining
Perfectly compatible with a standard UV transilluminator - Gel Red replaces
EtBr with no optical setting change
Dilution of Gel Red:
1. Add 2ul of the concentrated Gel Red stock to 1000 ul of Gel loading Buffer. Mix 2ul
of this loading buffer with your sample. OR
2. Add 5 ul of Gel red to 50 ml of agarose solution.
3.5. Gel Loading Buffer
Loading dye is mixed with DNA samples for use in agarose gel electrophoresis. These
buffers serve three purposes:
They increase the density of the samples, ensuring that the DNA sinks evenly into
the well. (glycerol, sucrose or Ficoll)
They add colour to the sample, thereby simplifying the loading process.
They contain dyes that in an electric field, move toward that anode at predictable
rates.
Tracking Dyes
The most common means of monitoring the progress of electrophoretic separations by
following the migration of tracking dyes that are incorporated into the loading buffer.
Two widely used dyes displaying different electrophoretic mobilities are
bromophenol blue and xylene cyanol.
Xylene cyanol typically migrates at approximately 4kb equivalence. So do not
use this if you want fragments of 4kb.
Bromophenol blue migrates at a rate equivalent to 200-400bp DNA. If you
want to see fragments near this size (ie. Anything smaller than 600bp) then
use the other dye because bromophenol blue will obscure the visibility of the
small fragments.
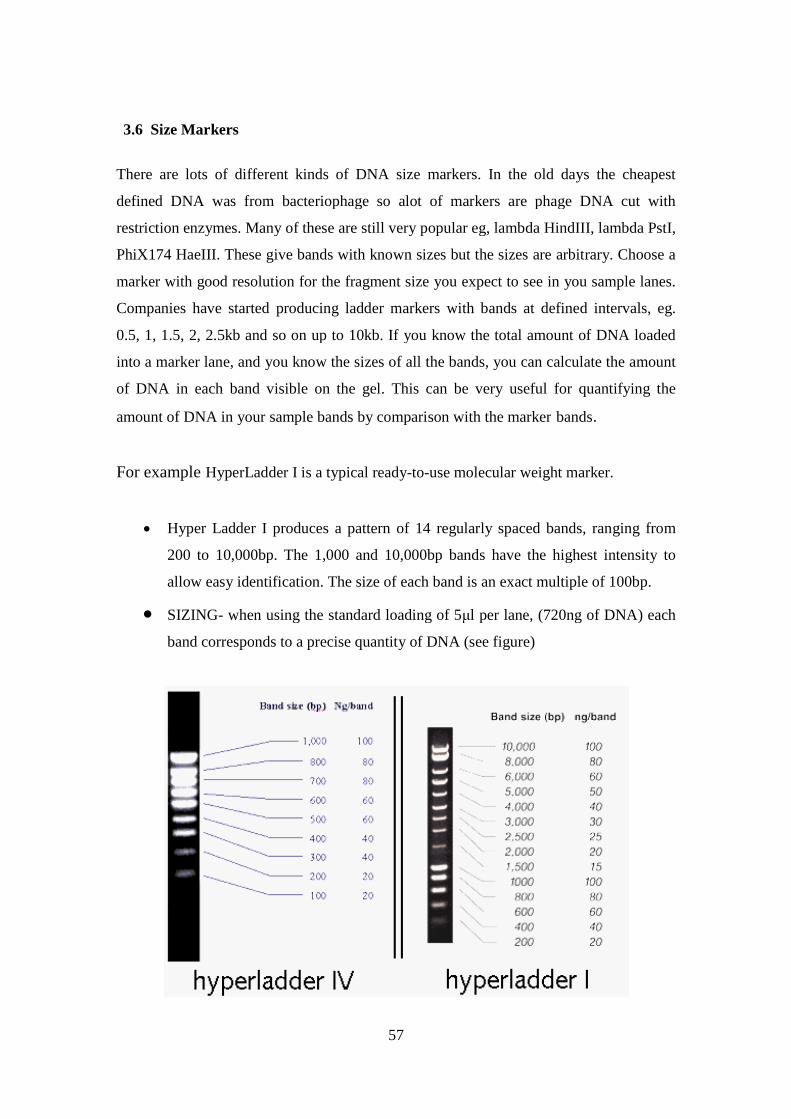
57
3.6 Size Markers
There are lots of different kinds of DNA size markers. In the old days the cheapest
defined DNA was from bacteriophage so alot of markers are phage DNA cut with
restriction enzymes. Many of these are still very popular eg, lambda HindIII, lambda PstI,
PhiX174 HaeIII. These give bands with known sizes but the sizes are arbitrary. Choose a
marker with good resolution for the fragment size you expect to see in you sample lanes.
Companies have started producing ladder markers with bands at defined intervals, eg.
0.5, 1, 1.5, 2, 2.5kb and so on up to 10kb. If you know the total amount of DNA loaded
into a marker lane, and you know the sizes of all the bands, you can calculate the amount
of DNA in each band visible on the gel. This can be very useful for quantifying the
amount of DNA in your sample bands by comparison with the marker bands.
For example HyperLadder I is a typical ready-to-use molecular weight marker.
Hyper Ladder I produces a pattern of 14 regularly spaced bands, ranging from
200 to 10,000bp. The 1,000 and 10,000bp bands have the highest intensity to
allow easy identification. The size of each band is an exact multiple of 100bp.
SIZING- when using the standard loading of 5μl per lane, (720ng of DNA) each
band corresponds to a precise quantity of DNA (see figure)
58
3.7 Troubleshooting
Common problems encountered in agarose gel electrophoresis are described below, along
with several possible causes.
Poor resolution of DNA fragments. The most frequent cause of poor DNA
resolution is improper choice of agarose concentration. Low percentage agarose
gels should be used to re-solve high-molecular-weight DNA fragments and high
percentage gels for low-molecular- weight DNAs (see Table 2.5A.1). Fuzzy bands,
encountered particularly with small DNA fragments, result from diffusion of the
DNA through the gel. This is especially true when gels are run for long periods of
time at low voltages.
Band smearing. Trailing and smearing of DNA bands is most frequently observed
with high molecular-weight DNA fragments. This is often caused by overloading
the DNA sample or running gels at high voltages. DNA samples loaded into torn
sample wells will also cause extensive smearing, as the DNA will tend to run in
the interface between the agarose and the gel support.
Melting of the gel. Melting of an agarose gel during an electrophoretic separation
is a sign that either the electrophoresis buffer has been omitted in the preparation
of the gel or has become exhausted during the course of the run. For high-voltage
electrophoresis over long time periods, TBE should be used instead of TAE as it
has a greater buffering capacity. Also, minigel and midigel boxes, which typically
have small buffer reservoirs, tend to exhaust buffers more readily than larger gel
boxes.
7.4 Purification of PCR products
Template purity and concentration are the two most important factors in obtaining good
quality sequence data. Characteristics of poor quality templates:
Noisy data or peaks under peaks
No usable sequence data
Weak signal

59
4.1 Considerations when cleaning PCR products
Essential to separate the PCR product away from potentially interfering
substances that may remain in solution after the PCR reaction. Primers, dNTPS,
enzyme and salts should be removed.
Determination of the presence of a single band or multiple bands that may result
from your PCR reaction
Primers
Forward and reverse PCR primers remain in solution, will both act as sequencing
primers.
This results in multiple peaks from beginning to end as each primer can anneal to
complementary strands with different nucleotide composition (multiple reactions)
Results in overlapping fragments and unreadable data
dNTPs
Excess dNTPs will upset the specific ratios of dNTPs/ddNTPs required for
optimal extension and termination in the cycle sequencing reaction.
Salts
The processivity of the Taq polymerase used in the cycle sequencing reaction
declines in the presence of high amounts of salts
Non Specific PCR products
Primer dimer artifacts and secondary PCR products can result in poor quality
sequence data.
Nonspecific PCR products behave as templates in the sequencing reaction and
produce extension products which results in noisy data
4.2 Methods for purifying PCR products
1) Ethanol precipitation
2) Column purification
3) Gel extraction (Qiagen kit)
1) Ethanol precipitation
The PCR product is precipitated with ammonium acetate or sodium acetate and ethanol to
remove the contaminants of the PCR
Advantages
Yield products of adequate purity for direct sequencing.
60
Disadvantages
Ethanol contamination results in poor sequence data or complete failure, or
Salt contamination in DNA preps results from co-precipitation of salts in alcohol
precipitations insufficient removal of supernatant after precipitations or an
incomplete wash of the pellet with 70% ethanol
Salts can be preferentially injected and interfere with the migration of the DNA
samples
2) Column purification methods
I. Ultrafiltration
Microcon Centrifugal Filter devices - Cost £2.00 per sample
Millipore Montage PCR Clean up kit
Automated 96 well format and half volume plate format; Cost-20 p per sample
II. Affinity Column purification
Qiaquick PCR purification columns (Qiagen); Cost - £ 1.38 per sample
I. Ultrafiltration - Microcon Centrifugal filter device
Microcon Spin columns have an ultrafiltration membrane across its bottom. The
membrane has molecular size holes that allows molecules smaller than a predetermine
size to pass through it under centrifugal force. Molecules larger than the membrane cut
off size cannot pass through the membrane and are recovered from its surface. For
example YM100 (100,000 dalton nonimal molecular weight) has a nucleotide cut of for
double stranded DNA fragments of 125bp.
The process of ultrafiltration uses semi-permeable membranes and pressure to
separate molecular species on the basis of size and shape.
Microcons, are disposable units that use centrifugal force to drive such separation.
Microcon filters can be used to rapidly wash/desalt/buffer exchange, fractionate or
concentrate many aqueous biological samples including nucleic acids.
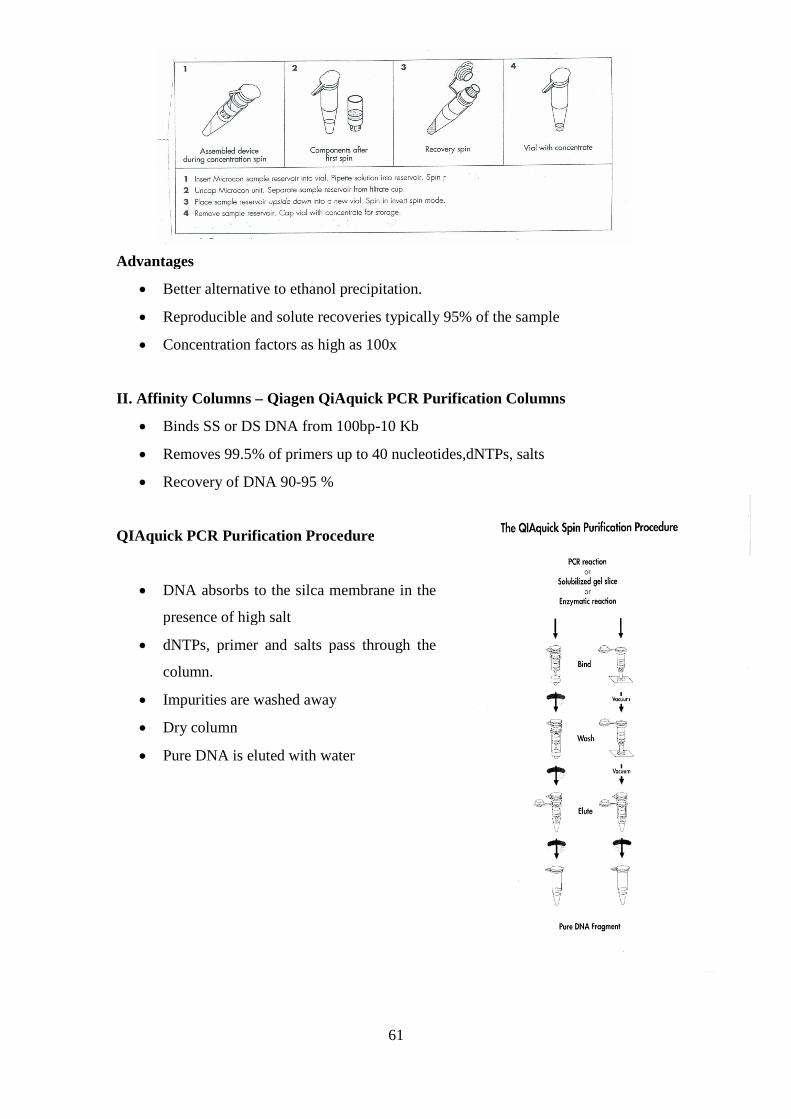
61
Advantages
Better alternative to ethanol precipitation.
Reproducible and solute recoveries typically 95% of the sample
Concentration factors as high as 100x
II. Affinity Columns – Qiagen QiAquick PCR Purification Columns
Binds SS or DS DNA from 100bp-10 Kb
Removes 99.5% of primers up to 40 nucleotides,dNTPs, salts
Recovery of DNA 90-95 %
QIAquick PCR Purification Procedure
DNA absorbs to the silca membrane in the
presence of high salt
dNTPs, primer and salts pass through the
column.
Impurities are washed away
Dry column
Pure DNA is eluted with water
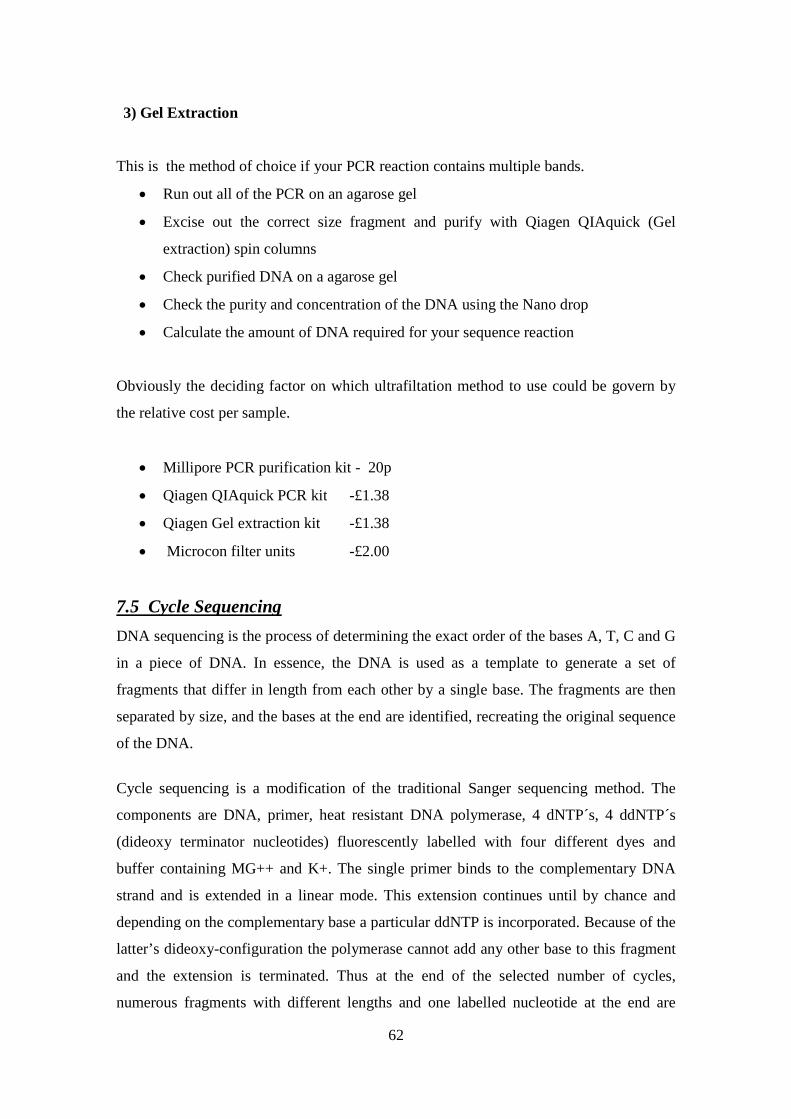
62
3) Gel Extraction
This is the method of choice if your PCR reaction contains multiple bands.
Run out all of the PCR on an agarose gel
Excise out the correct size fragment and purify with Qiagen QIAquick (Gel
extraction) spin columns
Check purified DNA on a agarose gel
Check the purity and concentration of the DNA using the Nano drop
Calculate the amount of DNA required for your sequence reaction
Obviously the deciding factor on which ultrafiltation method to use could be govern by
the relative cost per sample.
Millipore PCR purification kit - 20p
Qiagen QIAquick PCR kit -£1.38
Qiagen Gel extraction kit -£1.38
Microcon filter units -£2.00
7.5 Cycle Sequencing
DNA sequencing is the process of determining the exact order of the bases A, T, C and G
in a piece of DNA. In essence, the DNA is used as a template to generate a set of
fragments that differ in length from each other by a single base. The fragments are then
separated by size, and the bases at the end are identified, recreating the original sequence
of the DNA.
Cycle sequencing is a modification of the traditional Sanger sequencing method. The
components are DNA, primer, heat resistant DNA polymerase, 4 dNTP´s, 4 ddNTP´s
(dideoxy terminator nucleotides) fluorescently labelled with four different dyes and
buffer containing MG++ and K+. The single primer binds to the complementary DNA
strand and is extended in a linear mode. This extension continues until by chance and
depending on the complementary base a particular ddNTP is incorporated. Because of the
latter’s dideoxy-configuration the polymerase cannot add any other base to this fragment
and the extension is terminated. Thus at the end of the selected number of cycles,
numerous fragments with different lengths and one labelled nucleotide at the end are
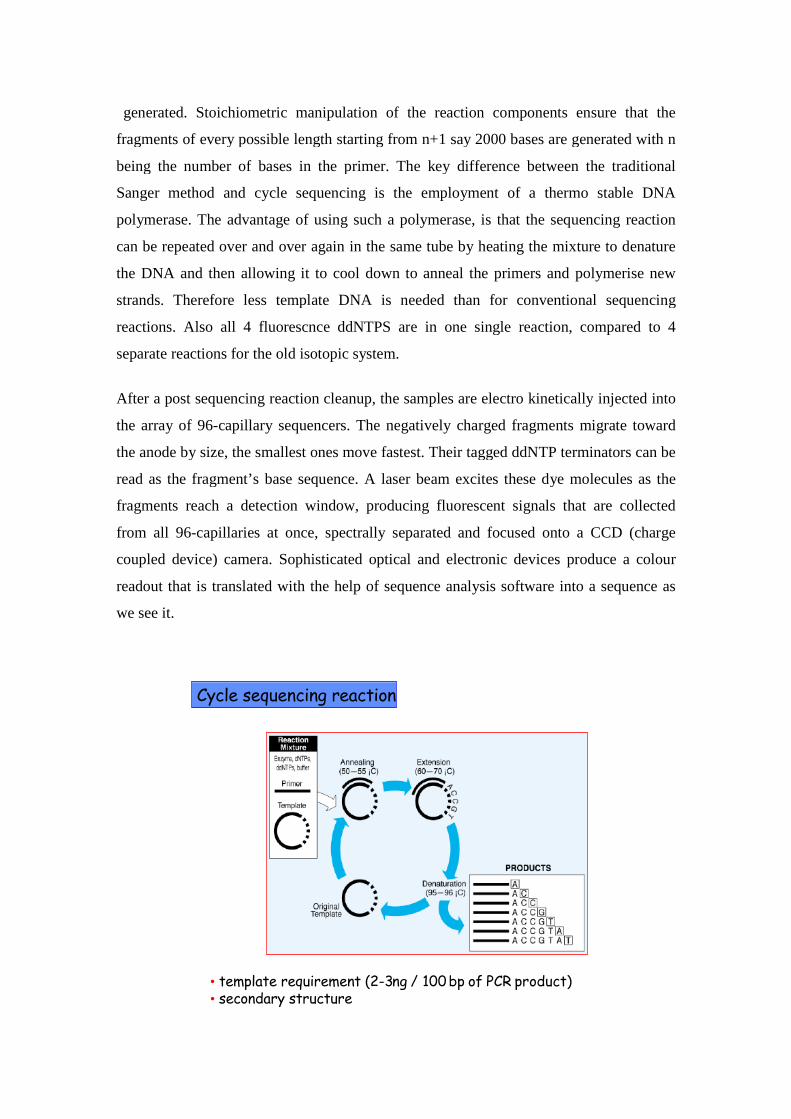
63
generated. Stoichiometric manipulation of the reaction components ensure that the
fragments of every possible length starting from n+1 say 2000 bases are generated with n
being the number of bases in the primer. The key difference between the traditional
Sanger method and cycle sequencing is the employment of a thermo stable DNA
polymerase. The advantage of using such a polymerase, is that the sequencing reaction
can be repeated over and over again in the same tube by heating the mixture to denature
the DNA and then allowing it to cool down to anneal the primers and polymerise new
strands. Therefore less template DNA is needed than for conventional sequencing
reactions. Also all 4 fluorescnce ddNTPS are in one single reaction, compared to 4
separate reactions for the old isotopic system.
After a post sequencing reaction cleanup, the samples are electro kinetically injected into
the array of 96-capillary sequencers. The negatively charged fragments migrate toward
the anode by size, the smallest ones move fastest. Their tagged ddNTP terminators can be
read as the fragment’s base sequence. A laser beam excites these dye molecules as the
fragments reach a detection window, producing fluorescent signals that are collected
from all 96-capillaries at once, spectrally separated and focused onto a CCD (charge
coupled device) camera. Sophisticated optical and electronic devices produce a colour
readout that is translated with the help of sequence analysis software into a sequence as
we see it.
• template requirement (2-3ng / 100 bp of PCR product)• secondary structure
Cycle sequencing reaction

64
TCGA
Equivalence of manual and automated sequencing
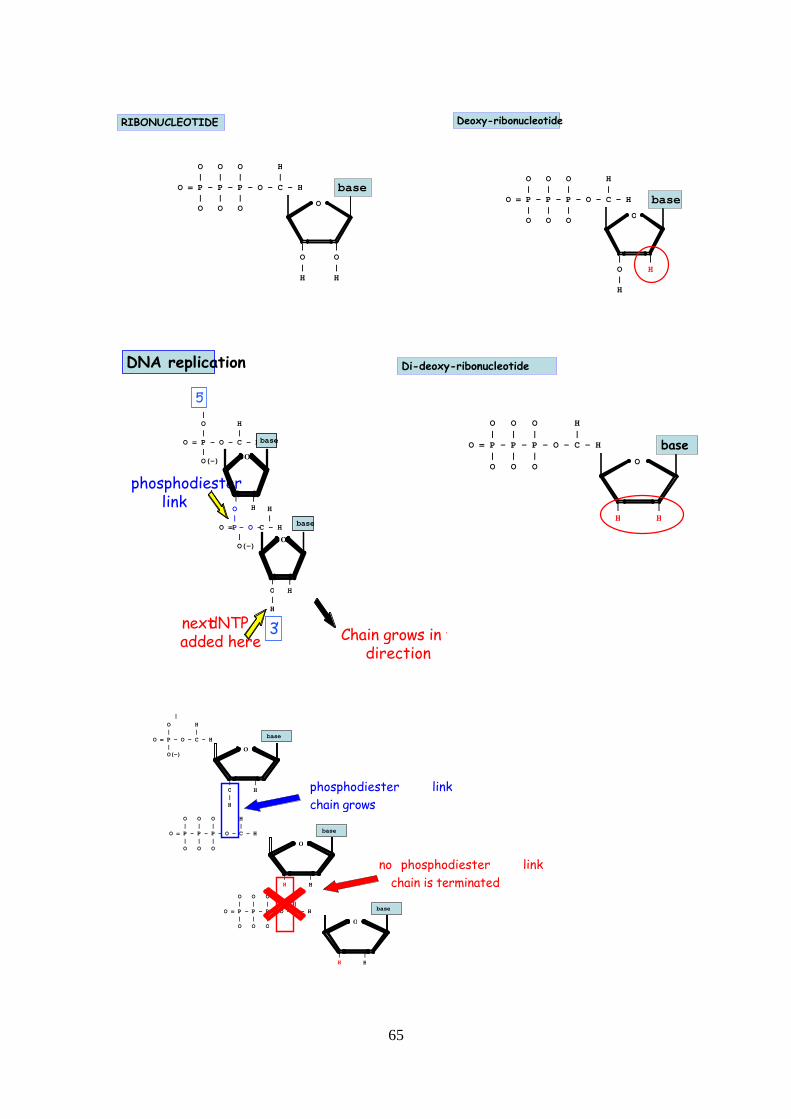
65
O
|H
O O O H| | | |
O = P - P - P - O - C - H| | |O O O
|O|H
base
Deoxy-ribonucleotideRIBONUCLEOTIDE
O
|O|H
O O O H| | | |
O = P - P - P - O - C - H| | |O O O
|O|H
base
Chain grows in thisdirection
|O H| |
O = P - O - C - H|O(-)
O H| |
O =P - O -C - H|O(-)
O
base
|H
|O|H
5’
3’
phosphodiesterlink
O
base
|H
|
nextdNTPadded here
DNA replication
O
|H
O O O H| | | |
O = P - P - P - O - C - H| | |O O O
|H
base
Di-deoxy-ribonucleotide
O H| |
O = P - O - C - H|O(-)
O
base
|H
|O|H
|
O O O H| | | |
O = P - P - P - O - C - H| | |O O O
O
base
|H
|H
O O O H| | | |
O = P - P - P - O - C - H| | |O O O
O
base
|H
|H
phosphodiester link
chain grows
no phosphodiester link
chain is terminated
66
5.1 Preparing the Samples for Cycle Sequencing 2-2 Applied Biosystems 3730/3730xl
DNA Analyzers Sequencing Chemistry Guide
Template Types
The following templates may be used with the BigDye® terminator chemistry:
• PCR product
• Single-stranded DNA (e.g., M13)
• Double-stranded DNA
• Large DNA (e.g., BACs, PACs, YACs, cosmids, and fosmids)
• Bacterial genomic DNA
Template Quality
The quality of DNA in a reaction can affect the performance of the DNA Analyzer.
When preparing DNA templates, it is critical to avoid the following:
• Residual salts
• Proteins
• Residual detergents
• Residual RNA
The presence of residual salts, proteins, RNA, and detergents can interfere with
capillary electrophoresis and electrokinetic injection. Your current template
purification methods may have to be modified to remove residual salts, proteins, and
detergents. The following are characteristics of poor quality templates:
• Noisy data or peaks under peaks
• No usable sequence data
• Weak signal
Effect of Residual Salts
Capillary electrophoresis is especially susceptible to salt in samples, either from
template preparation, from cycle sequencing reactions, or from precipitation methods
using salts. The negative ions in salts can be preferentially injected into the capillary
array during electrokinetic injection, leading to lower signal. In addition, the negative
ions compete and interfere with the injection of larger DNA extension fragments,
leading to shortened read lengths.
67
Effect of Proteins
Many DNA preparation methods for sequencing require the recovery of DNA from
lysed bacterial cultures. Unless DNA is carefully purified, protein can remain in the
DNA samples. Protein can be injected and adhere to the walls of the capillary array,
adversely affecting data resolution and capillary array lifetime.
Effect of Residual Detergents
Some methods of template preparation, such as the Thermomax method for M13
preparation, use detergents such as Triton X-100 to lyse the protein coat of phage
particles. Other detergents, such as sodium dodecyl sulfate (SDS), are used in
plasmid purification protocols to lyse bacterial cells. Small, negatively charged
detergents may be preferentially injected over DNA during electrokinetic injection. If
present at high levels, detergents such as Triton X-100 and SDS will adversely affect
the life of the capillary array and the quality of the sequencing data.
Effect of Residual RNA
Residual RNA that is present in DNA template preparations competes with the DNA
for injection into the capillary array. Residual RNA has the same effect as excess salt,
that is, decreased signal and shortened read lengths.
Template Quantity
Effect of Too Little Template
Too little template or primer in cycle sequencing reactions reduces the signal strength
and therefore the peak height of reaction products. In the worst case, the signal-to noise
level decreases so that bases cannot be called.
Effect of Excess Template
Excess template can affect data quality when:
• present in sample loaded onto the DNA Analyzer
• used in excess in the cycle sequencing reaction
Excess template inhibits the injection of labeled extension fragments, thus affecting
signals generated from this instrument. Excess template can behave similarly to
68
proteins and accumulate in the capillary array, which adversely affects data
resolution and capillary array lifetime.
Excess template used in the cycle sequencing reaction results in generation of short
extension fragments. During electrokinetic injection, short fragments are injected
more efficiently resulting in “top heavy” peak characteristics and shortened reads.
(This phenomena becomes more pronounced with increased dilution of BigDye
Terminator.
Raw data from a BigDye terminator reaction containing excess DNA Template
Below, analyzed data from a BigDye Terminator reaction contains excess template (this is from
the same sample shown in above). The peaks are clearly off-scale and have overall shortened read
lengths. The presence of excess template in the reaction and the preferential electrokinetic
injection of small DNA fragments cause this effect
QuickTime™ and aTIFF (Uncompressed) decompressor
are needed to see this picture.

69
QuickTime™ and aTIFF (Uncompressed) decompressor
are needed to see this picture.
70
7.6 Sequencher DNA sequence assembly and analysis software
1. Sequence Editing
Sequencher gives you the DNA sequence editing tools you need to know that a sequence
is absolutely correct. You can look at your chromatogram data one sequence at a time or
view multiple aligned chromatograms in both forward and reverse orientations
2. Sequence Trimming
Automated DNA sequencers occasionally produce poor quality reads, particularly near
the sequencing primer site, and toward the end of longer sequence runs. The sequences of
clones from DNA libraries frequently contain vector sequence, polyA tails, or other
unrelated sequence. Introns and primer sequence frequently flank the sequence of
QuickTime™ and adecompressor
are needed to see this picture.
71
amplified exons. Unless removed by trimming, any of these artifacts will distort your
sequence assembly and downstream sequence analysis.
Sequencher provides simple-to-use but powerful tools that help you trim poor quality or
ambiguous data:
Trim Ends removes misleading data from the ends of sequencing fragments.
Trim Vector removes sequence-specific data contaminating the ends of your sequences.
Trim to Reference eliminates the ends of sequences that extend beyond an assembled
reference sequence.
Sequence Assembly
Sequencher's intuitive controls allow you to set your
sequence assembly parameters and adjust them within
seconds, allowing you to assemble your DNA
fragments quickly and accurately. Sequencher will
QuickTime™ and adecompressor
are needed to see this picture.
QuickTime™ and adecompressor
are needed to see this picture.
72
automatically compare the forward and the reverse-complement orientations to assemble
the best possible contigs, so you can assemble DNA sequences regardless of orientation.
Apply Sequencher's versatile assembly tools to:
Compare gene variants to a reference sequence
Confirm vector constructs
Assemble viral and bacterial genomes
Cluster tens of thousands of sequences from cDNA libraries
Assemble cDNA to genomic sequence
Create a primer map
4. Support for Confidence Values
Sequencher displays confidence and summary confidence information (if available
in your DNA sequence files) in the Project window, the Sequence Editor, and the
Sequence Get Info window, so you can easily monitor the quality of your data.
QuickTime™ and adecompressor
are needed to see this picture.
73
Genebank Feature Handling
Sequencher imports GenBank Features in your files (if present) and has a variety of tools
to help you manage, add, or edit Features. You can import Genbank Feature keys, or
designate a key for your own features. The Define Feature Key Default Style user
preference lets you set up your own colors and Feature annotations, so you could
distinguish introns from exons, and variants from sequencing errors for example.
QuickTime™ and adecompressor
are needed to see this picture.
QuickTime™ and adecompressor
are needed to see this picture.
74
7.7 The Basic Local Alignment Search Tool (BLAST)
The Basic Local Alignment Search Tool (BLAST) finds regions of local similarity
between sequences. The program compares nucleotide or protein sequences to sequence
databases and calculates the statistical significance of matches. BLAST can be used to
infer functional and evolutionary relationships between sequences as well as help identify
members of gene families. There are many different variations of BLAST available to use
for different sequence comparisons, e.g., a DNA query to a DNA database, a protein
query to a protein database, and a DNA query, translated in all six reading frames, to a
protein sequence database. For a detail explanation of BLAST, please refer to the NCBI
Handbook:
http://www.ncbi.nlm.nih.gov/bookshelf/br.fcgi?book=handbook&part=ch16
75
APPENDIX 1- Buffers
1. Moles and Molar solutions (unit = M = moles/L)
Sometimes it may be more efficient to use molarity when calculating concentrations. A
mole is defined as one gram molecular weight of an element or compound, and
comprised of exactly 6.023 x 10^23 atoms or molecules (this is called Avagadro's
number). The mole is therefore a unit expressing the amount of a chemical. The mass (g)
of one mole of an element is called its molecular weight (MW).
The number of moles in an arbitrary mass of a dry reagent can be calculated as:
# of moles = weight (g)/ molecular weight (g)
Molarity is the unit used to describe the number of moles of a chemical or compounds in
one liter (L) of solution and is thus a unit of concentration. By this definition, a 1.0 Molar
(1.0 M) solution is equivalent to one formula weight (FW = g/mole) of a compound
dissolved in 1 liter (1.0 L) of solvent (usually water).
Example 1: To prepare a liter of a simple molar solution from a dry reagent
Multiply the formula weight (or MW) by the desired molarity to determine how many
grams of reagent to use:
Chemical FW = 194.3 g/mole; to make 0.15 M solution use
194.3 g/mole * 0.15 moles/L = 29.145 g/L
Example 2: To prepare a specific volume of a specific molar solution from a dry
reagent
A chemical has a FW of 180 g/mole and you need 25 ml (0.025 L) of 0.15 M (M =
moles/L) solution. How many grams of the chemical must be dissolved in 25 ml water to
make this solution?
76
#grams/desired volume (L) = desired molarity (mole/L) * FW (g/mole)
by algrebraic rearrangement,
#grams = desired volume (L) * desired molarity (mole/L) * FW (g/mole)
#grams = 0.025 L * 0.15 mole/L * 180 g/mole
after cancelling the units,
#grams = 0.675 g
So, you need 0.675 g/25 ml
2. Buffers
1. 50 x TAE (Tris-Acetate EDTA) Buffer pH 8.0 ( 1 litre)
242 g Tris base in 750 m ddH2O
57.1 ml Glacial acetic acid
100 ml 0.5M EDTA pH 8.0
Stir, do not adjust the pH
Make up to 1000 ml
Sterlize by autoclaving and store at room temperature.
1 x TAE
Dilute to 1x concentration for the use in electrophoresis by taking 20ml of 50x buffer and
making the volume to 1000ml by adding 980 ml of ddH2O.
Final solute concentrations are 40 mM Tris acetate and 1 mM EDTA. The buffer is now
ready for use in running an agarose gel.
2. 0.5M EDTA, pH8
Dissolve 186.1g EDTA (Ethylenediaminetetra-acetic acid disodium salt) in 800ml
distilled water. Stir, on a magnetic stirrer with a 'flea' (magnetic stirring bar), and with the
pH electrode in the buffer gradually add solid sodium hydroxide pellets (~20g of NaOH
77
pellets). Measure the pH and adjust until it is stable at pH8 with 5M NaOH solution. (As
you add the NaOH the pH will come down. This allows more of the EDTA to dissolve
and the pH will rise again - so you have to continue until the solution is clear and the pH
is stable) Adjust volume to 1 liter with distilled water. Sterlize by autoclaving and store
at room temperature.
3. TE (10mM Tris-HCL pH 7.5 / 0.1 mM EDTA pH 8.0)
Stock Buffers required: 1 M Tris-HCL pH 7.5 and 0.5 M EDTA pH 8.0
For 50ml of TE buffer:
VOLUME REQUIRED FOR 50 ML
1M Tris-HCL pH 7.5 O.5 ml (500 µl)
0.5 M EDTA pH 8.0 0.01 ml (10 µl)
Sterile distilled water 49.49 ml
4. 2 x CTAB Extraction Buffer
Weigh out chemicals with a face mask to avoid inhalation of dust.
Tris (hydroxymethyl) amino methane 2.42 g
Sodium Chloride 16.42 g
Ethylenediaminetetra-acetic acid, disodium salt 1.2 g
Hexadecyltrimethyl-ammonium bromide (CTAB) 4.0 g
2-ß Mercaptoethanol 0.4 ml
For 200 mls of 2xCTAB: First dissolve the TRIS in 150 ml distilled water, then add
EDTA, then the remaining chemicals and make up to 200 ml mark, using distilled water.
Heating the solution gently may help to make the CTAB dissolve more quickly.
5. Phenol/ Chloroform / isoamyl alcohol (25:24:1) –This can be bought commercially
Prepare Phenol /chloroform/ isoamyl alcohol in 24: 1 ratio.
For 50 ml mix the following: Phenol 25 ml
Chloroform 24 ml
Isoamylalcohol 1 ml
Mix and store at 4°C in a dark bottle.

78
6. Chloroform / isoamyl alcohol (24:1) –This can be bought commercially
Prepare chloroform/ isoamyl alcohol in 24: 1 ratio.
For 50 ml mix the following:
Chloroform 48 ml
Isoamylalcohol 2 ml
Mix and store at 4°C in a dark bottle.
General Note: The Molecular Cloning: A Laboratory Manual (Third Edition)
(Joseph Sambrook, Peter MacCallum, David Russell) Volume 3 contain the recipes
and methodology to prepare standard buffers used in molecular biology.
79
Appendix 2: Tissue and DNA Storage
I. Tissue Storage
1. Cryo-preservation
The ideal storage for molecular specimens is by using cryo-preservation, storage in liquidnitrogen or at -80ºC.
2. Storage in ethanol
Ethanol preserved samples are regularly used in DNA molecular studies. However thequality of the alcohol used can play a large part in the condition of the DNA in aspecimen. Preservation in absolute ethanol offers the best means of preserving both theDNA and the gross morphology of a specimen. DNA extracted from specimens preservein absolute ethanol are of:
High molecular weight High quality
Disadvantages of ethanol preservation:
Can cause extensive tissue shrinkage Colour loss Extract cellular components such as lipids
3. Storage in RNA later
This reagent was designed for the storage of tissue samples from which you can extractRNA. However tissue stored in this buffer can be also used to extract DNA successfullyof high molecular weight and quality
RNA later ® is an aqueous, non toxic, tissue storage reagent that rapidly permeates mosttissues to stabilize and protect RNA in fresh specimens. RNA later eliminates the need toimmediately process or freeze samples; the specimen can simply be sub- merged in RNAlater and stored for analysis at a later date.
Storage and stability Store RNA later at room temperature. It is guaranteed for 6 months from the date of
receipt, properly stored. Samples in RNA later can be stored for extended periods under conditions where
RNA degradation would normally take place rapidly. Tissues can be storedindefinitely in RNA later at –20°C or below.
RNAlater can be safely discarded down the sink and flushed with water.
Materials compatible with RNA later
RNA later can be used for RNA preservation with most tissues, cultured cells, bacteria,
80
and yeast. RNA later may not be effective in tissues that are poorly penetrated by thesolution, such as waxy plant tissue and bone. RNA later has been extensively tested with
animal tissues including, brain, heart, kidney, spleen, liver, testis, skeletal muscle, fat,lung, and thymus. RNA later has also been proven effective for RNA preservation in E.coli, Drosophila, tissue culture cells, white blood cells, and some plant tissues.
4. Whatman FTA Cards
FTA cards are designs for room temperature collection, shipment, archiving andpurification of nucleic acids from a wide variety of biological samples for PCR analysis:
Blood
Cultured cells
Buccal cells
Plant material
Bacteria
Plasmids
Microorganisms
Solid tissue
Viral particles
FTA cards are impregnated with a patented solution that lyses cell membranes anddenature proteins upon contact. Nucleic acids are immobilized and protected from UVdamage and microbial fungal attack. FTA cards are available in several sizes to meetspecific needs. Since captured nucleic acids are stabilized, FTA Cards facilitate samplecollection in remote locations and simplify sample transport. For example, you cancollect samples in the field without worrying about immediate refrigeration. Ship yoursamples back to the laboratory without expensive special handling or dry ice and processat your convenience.
Store nucleic acids at room temperature for years
Genomic DNA stored on FTA Cards at room temperature for over 17 years (and counting) has been successfully amplified by PCR. RNA, being chemically less stablethan DNA, is best analyzed upon return of samples to the laboratory. Frozen storage ishelpful for RNA preservation.
Sample integrity is optimized when FTA Cards are stored in a Multi-Barrier Pouch with aDesiccant Packet.
FTA Cards offer a compact room-temperature storage system that reduces the need forprecious freezer space.
II. DNA Storage
81
Extracted DNA should be stored as follows:
-20ºC or below for long term storage
DNA for storage should be re-suspended in a buffer solution such as 10 mM TrisHCL pH 7.5 rather than water. If the pH of water is not neutral but slightly acidicthis can cause the DNA to degrade upon storage.
DNA can be stored lyophilized at -20ºC or below for long term storage

82
Appendix 3: IUB Codes -Nomenclature for Incompletely SpecifiedBases in Nucleic Acid Sequences
IUB Base Code Guide
Standard Bases
Mixed Bases (Wobble)
Code BaseB C, G or TD A, G or TH A, C or TV A, C or GR A or GY C or TK G or TM A or CS G or CW A or TN Any base
A, C, G or T
Code BaseA AdenosineC CytidineG GuanosineT Thymidine
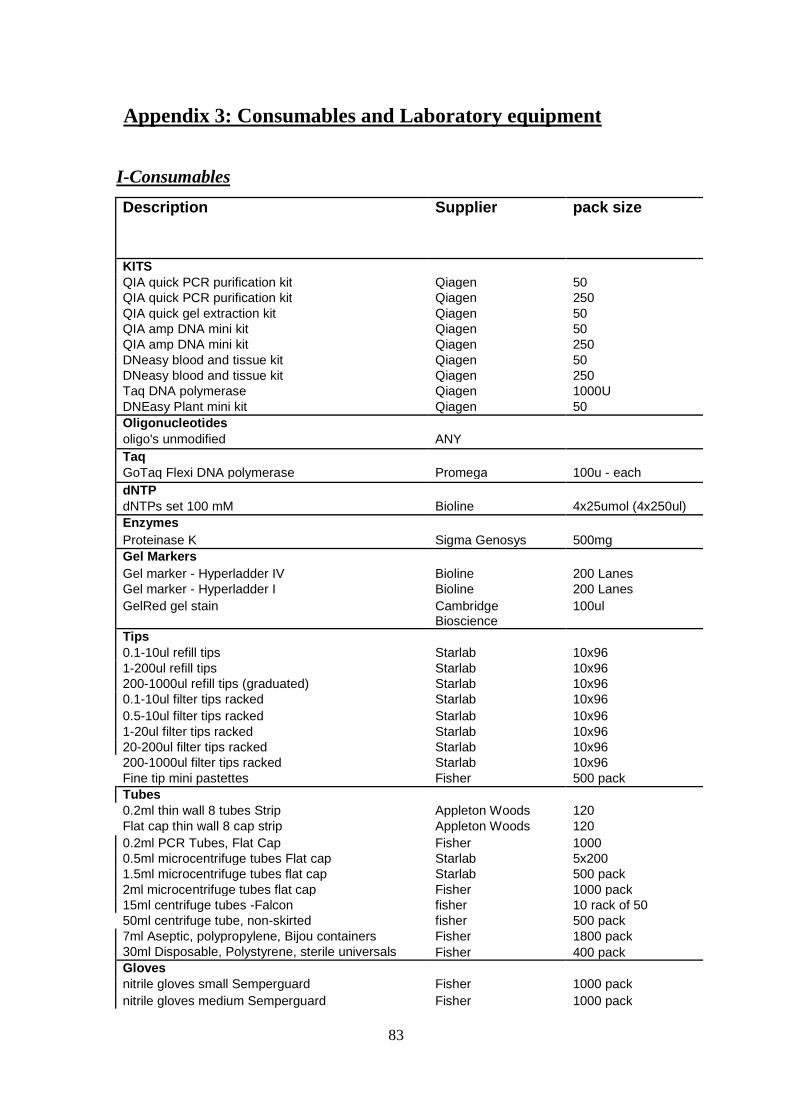
83
Appendix 3: Consumables and Laboratory equipment
I-Consumables
Description Supplier pack size
KITSQIA quick PCR purification kit Qiagen 50QIA quick PCR purification kit Qiagen 250QIA quick gel extraction kit Qiagen 50QIA amp DNA mini kit Qiagen 50QIA amp DNA mini kit Qiagen 250DNeasy blood and tissue kit Qiagen 50DNeasy blood and tissue kit Qiagen 250Taq DNA polymerase Qiagen 1000UDNEasy Plant mini kit Qiagen 50
Oligonucleotides
oligo's unmodified ANY
TaqGoTaq Flexi DNA polymerase Promega 100u - each
dNTPdNTPs set 100 mM Bioline 4x25umol (4x250ul)
Enzymes
Proteinase K Sigma Genosys 500mg
Gel Markers
Gel marker - Hyperladder IV Bioline 200 LanesGel marker - Hyperladder I Bioline 200 Lanes
GelRed gel stain CambridgeBioscience
100ul
Tips
0.1-10ul refill tips Starlab 10x961-200ul refill tips Starlab 10x96200-1000ul refill tips (graduated) Starlab 10x960.1-10ul filter tips racked Starlab 10x96
0.5-10ul filter tips racked Starlab 10x961-20ul filter tips racked Starlab 10x9620-200ul filter tips racked Starlab 10x96200-1000ul filter tips racked Starlab 10x96Fine tip mini pastettes Fisher 500 pack
Tubes0.2ml thin wall 8 tubes Strip Appleton Woods 120Flat cap thin wall 8 cap strip Appleton Woods 120
0.2ml PCR Tubes, Flat Cap Fisher 10000.5ml microcentrifuge tubes Flat cap Starlab 5x2001.5ml microcentrifuge tubes flat cap Starlab 500 pack2ml microcentrifuge tubes flat cap Fisher 1000 pack15ml centrifuge tubes -Falcon fisher 10 rack of 5050ml centrifuge tube, non-skirted fisher 500 pack7ml Aseptic, polypropylene, Bijou containers Fisher 1800 pack30ml Disposable, Polystyrene, sterile universals Fisher 400 packGlovesnitrile gloves small Semperguard Fisher 1000 pack
nitrile gloves medium Semperguard Fisher 1000 pack
84
Description Supplier pack sizenitrile gloves large Semperguard Fisher 1000 packnitrile gloves xlarge Semperguard Fisher 1000 pack
Miscellaneous
Super Glossy Sony Thermal Paper UPP-110HA UVP 5 rolls in a boxSony Thermal Printer paper Sony UPP-110HA UVP 5 rolls in a boxweighing boats anti static 30ml VWR 500 pack
(80x60x14mm)weighing boats anti static 100ml Fisher 1x 250 packdust masks (budget)autoclave tape - Steam ANYparafilm 100mm wide 38m long VWR 1 Roll (55mx19mm)saranwrap fisher 1aluminium foil 75M x 450mm Western Laboratory 36 boxesAutoclave bag, polypropylene, without text,
Chemicals VWR 500 pack(600x780mm)
Agarose VWR 350 pack(700x1100mm)
Ethanol absolute
Disposable Pellet Pestles- Hand-operated or motor-driven grinders for resuspending
pellets or disrupting soft tissue in microcentrifuge tubes. Pestle ends are specially
designed to mate with 0.5 mL or 1.5 mL microtubes. Shaft is convenient length and
diameter for gentle manual back-and-forth rotation or more vigorous motorized
operation.
QuickTime™ and adecompressor
are needed to see this picture.
85
II –Laboratory equipment
1. Cold storage Freezers & refrigerators
1. Ultracold -80 Freezer with a racking system
2. -20°C freezer with a racking system
3. Refrigerator +4ºC
2. Autoclave
3. Ice Maker Machine
Large volume refrigerated centrifuge-high speed
4. Laminar flow hood
5. Fume hood
6. Drying cabinet
7. Dish washer
8. Microwave
9. Magnetic stirrers with heating
10. Vortex mixer
11. Balances
Fine balance (5 dp)
Balance (3dp) or
QuickTime™ and adecompressor
are needed to see this picture.
86
New Top of the range balance has dual mode from 5dp tp 3 dp depending on
weight and anti static. Model: Qubis Sartorius Genuis balance MEM4145-
supplied via VWR
12. Centrifuges:
Microcentrifuges
Bench centrifuges
Refrigerated Benchtop centrifuge
High Speed Centrifuge
13. Experion Bioanalyser-measures DNA/RNA/Proteins
14. Thermomixer Comfort- Supplier Eppendorf
QuickTime™ and adecompressor
are needed to see this picture.
QuickTime™ and adecompressor
are needed to see this picture.
QuickTime™ and adecompressor
are needed to see this picture.
87
16. Nanodrop-spectrophotometer-Supplier Thermo Scientific
ND1000-single channel
ND8000-8 channel
17. PCR machines-Best to get gradient machines this is useful when optimising the
annealing temperature for new primers. For example:
Applied Biosystems Verity 96
Gstorm- GS00001
GS482 twin block
GS482 twin block allows you to run to
separate PCRs independently
18. Speedvac (vacuum concentrators)- to evaporate alcohol or dry down large volumes
19. Precellys 24-tissue homogeniser-Supplier Bertin Technologies
QuickTime™ and adecompressor
are needed to see this picture.
QuickTime™ and adecompressor
are needed to see this picture.
QuickTime™ and adecompressor
are needed to see this picture.
88
20. UV transilluminator –short wave
21. Long wave UV reader
21. UVP Gel documentation / digital camera system
22. Water baths
23. Dri heating block
24. Incubators
Standard
Air incubator
Cool incubator
Shaking incubator
25. pH meter
26. PCR cabinet- use to set up PCRs to reduce contamination
QuickTime™ and adecompressor
are needed to see this picture.
QuickTime™ and adecompressor
are needed to see this picture.
89
27. Distilled water system
28. Horizontal electrophoresis unit with various comb sizes
Mini
Midi
Maxi
29. Mini variable power supply for electrophoresis gel tanks
30. Adjustable Variable pipettes
1-10 µl
2-20 µl
10-100 µl
50-200 µl
100-1000 µl
31. Freezer Storage boxes: Supplier Star lab
(1) 1.5 and 2 ml tubes (PP)
Catlog no: I2381-5040 StarStore 81-Place Storage Box
(2) Storage box no dividers for 15 ml & 50 ml Falcon tubes
Catlog no: E2300-5005
1. 2.
QuickTime™ and adecompressor
are needed to see this picture.
QuickTime™ and adecompressor
are needed to see this picture.
QuickTime™ and adecompressor
are needed to see this picture.
90
32. Tube Racks
Racks for microcentrifuge tubes – 0.2 ml, 0.5 ml, 1.5 ml, 2ml
StarRack™ 96
96-place double-sided rack
Transparent lift-off lid
Holds 96 x 0.5ml tubes on one sideor 96 x 1.5/2.0ml tubes on the other
Optional, 10-place acrylic rack available to help keep your racks tidy
Temperature range: -90°C to 121°C
Dimension (WxDxH): 222 x 114 x 28mm (without lid) / 50mm (with lid)
PCR tube rack-0.2 ml
Racks for 15 ml & 50 ml tubes
33. Ice Buckets
QuickTime™ and adecompressor
are needed to see this picture.
QuickTime™ and adecompressor
are needed to see this picture.
QuickTime™ and adecompressor
are needed to see this picture.
QuickTime™ and adecompressor
are needed to see this picture.
QuickTime™ and adecompressor
are needed to see this picture.

91
34. Lab Pal Label PrinterThe LAB PAL label printer is portable, easy-to-use and makes identifying your samplesmore quick and efficient. The long-lasting labels are designed to withstand extremelaboratory environments, such as liquid nitrogen, hot water baths, freezers andautoclaves. They also resist most chemicals, including Xylene, Alcohol, Ethanol andDMSO.
35. Howie Lab coats with elasticated cuffs.
36. Safety eye protection-goggles
37. Spatulas
38. Magnetic Stir bars
39. Robotic Station- Supplier Hamilton Robotics
DNA extractions
PCR set up
PCR clean up etc.
QuickTime™ and adecompressor
are needed to see this picture.