a baseline survey of ict and knowledge access in...
TRANSCRIPT

1
A baseline survey of ICT and knowledge access in Myanmar
LIRNEasia [email protected] | www.lirneasia.net
August 2015
Helani Galpaya, Ayesha Zainudeen, Suthaharan P.

2
LIRNEasia is a pro-poor, pro-market think tank whose mission is Catalyzing policy change through research to improve people’s lives in the emerging Asia Pacific by facilitating their use of hard and soft infrastructures through the use of knowledge, information and technology. Contact: 12 Balcombe Place, Colombo 00800, Sri Lanka. +94 11 267 1160. [email protected] www.lirneasia.net This work was carried out with the aid of a grant from the International Development Research Centre (IDRC), Canada and the Department for International Development (DFID), UK.
3
Acknowledgements Insights provided by the following participants at an August 2014 research design meeting in Colombo helped shape this study and the research team is thankful to all the participants. In particular, input at the meeting and through subsequent interactions by the following participants were invaluable: Joshua Blumenstock, PhD, Per Helmerson, PhD, Saad Gulzar. Jorge Garcia Hombrados went beyond his remit as consultant to the team, and provided deep insights and practical experience from the very beginning, and was particularly helpful in the sample design stage. LIRNEasia’s research team contributed to study and questionnaire design at various times, and we are thankful in particular to Srignesh Lokanathan and Nilusha Kapugama who provided substantive advice which helped shape the study and questionnaire design. The time spent reviewing early drafts of the questionnaire by Roshanthi Lucas Gunaratne, Rohan Samarajiva and Shazna Zuhyle of LIRNEasia and Christoph Stork, PhD of our sister network Research ICT Africa, Vignesh Illavarasan, PhD of IIT Delhi is gratefully acknowledged. Research assistance and questionnaire design work by Laleema Senanayake and Chiranthi Rajapakse is also appreciated. Phyu Phyu Thi of MIDO’s constant support through advice on questionnaire translation-‐checking, advice on local context, as well as field visits and back checks is gratefully acknowledged. Radhika Gunawardena’s hard work in project coordination is appreciated, as is her time spent on field visits and questionnaire design. This research was co-‐funded by the International Development Research Centre (IDRC) of Canada and UK Aid from the Department for International Development (DFID), UK.

4
Contents
List of Figures ..................................................................................................................................... 5
List of Tables ...................................................................................................................................... 7
1 Executive Summary ......................................................................................................................... 8
2 Sample profile ............................................................................................................................... 11
3 Access (use) of phones .................................................................................................................. 19
4 Mobile phone (and active SIM card) owners ................................................................................. 33
5 Computer and Internet use ........................................................................................................... 46
6 Perceptions about network quality ............................................................................................... 50
7 Non-‐owners ................................................................................................................................... 53
8 Information Needs ........................................................................................................................ 56
9 Perceived Benefits ......................................................................................................................... 63
Annex 1: Survey and Sampling Methodology ...................................................................................... 66
Annex 2: Survey Questionnaire -‐ English ............................................................................................. 76
Annex 3: Survey Questionnaire – Myanmar Language ...................................................................... 129
5
List of Figures Figure 1: Gender Composition (% of respondents) ................................................................. 11 Figure 2: Age distribution (% of respondents) ........................................................................ 11 Figure 3: Occupation (as % of population aged between 15-‐65) ............................................ 11 Figure 4: Type of housing (% of households) .......................................................................... 13 Figure 5: Access to modes of transportation (% of households) ............................................ 14 Figure 6: Access to electricity (% of households)-‐ Total Myanmar ......................................... 14 Figure 7: Access to electricity (% of households)-‐ Urban Myanmar ....................................... 15 Figure 8: Access to electricity (% of households)-‐ Rural Myanmar ........................................ 15 Figure 9: Type of work (% of population aged 15-‐65 who are working) ................................. 17 Figure 10: Total monthly household expenditure (MMK) (% of 15-‐65 population) ............... 17 Figure 11: Number of mobile networks available in ward (urban)/village (rural) (% of wards/villages) ................................................................................................................................................ 20 Figure 12: Number of active SIMs among household members (% of households) ............... 21 Figure 13: Number of handsets among household members (% of households) ................... 21 Figure 14: Household access to ICTs (% of households) ......................................................... 22 Figure 15: Household access to ICTs (% of households .......................................................... 23 Figure 16: Gap between rich and poor households significant for mobile & fixed phones, televisions, CD/DVD players, and computers ............................................................................................ 24 Figure 17: When was the last time you used a phone? (% of 15-‐65 year olds) ...................... 25 Figure 18: When was the last time you used a phone? (% of 15-‐65 year olds) ...................... 26 Figure 19: When was the last time you used a phone? (% of 15-‐65 year olds) ...................... 27 Figure 20: Males -‐ When was the last time you used a phone? (% of 15-‐65 year olds) ......... 28 Figure 21: Females -‐ When was the last time you used a phone? (% of 15-‐65 year olds) ...... 28 Figure 22: What type of phone did you use last? (% of 15-‐65 year olds who have used a phone before) .................................................................................................................................... 29 Figure 23: What type of phone did you use last? (% of 15-‐65 year olds who have used a phone before) .................................................................................................................................... 29 Figure 24: Whose phone did you use last? (% of 15-‐65 year olds who have used a phone before) 30 Figure 25: Purpose of the last call made or received (% of 15-‐65 year olds who have used a phone before) .................................................................................................................................... 31 Figure 26: Purpose of the last call made or received (% of 15-‐65 year olds who have used a phone before) .................................................................................................................................... 32 Figure 27: Mobile SIM and handset ownership (% of 15-‐65 years) ........................................ 33 Figure 28: Mobile subscribers by Household Spending .......................................................... 33 Figure 29: % of the BOP who owned a phone, 2006 .............................................................. 34 Figure 30: Total phone ownership (% of BOP teleusers) ........................................................ 34 Figure 31: Type of work those that are working are involved in (% of population aged 15-‐65 who are working ..................................................................................................... 35 Figure 32: Mobile subscribers (% of 15-‐65 population) .......................................................... 35 Figure 33: Mobile subscribers (% of 15-‐65 year olds) ............................................................. 36 Figure 34: Mobile subscribers by Household Spending (% of 16-‐65 population) ................... 36 Figure 35: Mobile subscribers By Gender & Household Spending (% of 15-‐65 population) .. 37

6
Figure 36: Number of active SIMs owned (% of mobile subscribers) ..................................... 37 Figure 37: Availability of Dual SIM capacity in the Phone (% of 15-‐65 year olds) ................... 38 Figure 38 : Availability of Dual SIM capacity in the Phone (% of 15-‐65 year olds) .................. 39 Figure 39: How primary SIM card was obtained (% of mobile owners) .................................. 40 Figure 40: Handset Type (as % of Mobile Subscribers) ........................................................... 40 Figure 41: Mobile handset features (% of mobile handset owners) ....................................... 41 Figure 42: Smart Phone Penetration (% of Mobile Owners) ................................................... 41 Figure 43 Smartphone Penetration by Household Spending (% of smartphone owners) ...... 42 Figure 44: Type of Handset (% of Mobile Subscribers) By Urban / Rural ................................ 42 Figure 45: Type of Handset (% of Mobile Subscribers) By Expenditure .................................. 43 Figure 46: Money spent to buy a handset .............................................................................. 43 Figure 47: Mean prices off handsets by different expenditure groups .................................. 44 Figure 48: What are you using your phone for? (% of mobile subscribers) ............................ 44 Figure 49: Average total amount of top ups/ reloads within the last month ......................... 45 Figure 50: Average total amount of top ups/ reloads within the last month by different expenditure groups ..................................................................................................................................... 45 Figure 51: What are you using your phone for? (% of mobile subscribers) ............................ 47 Figure 52: Perceived quality of mobile signal (% of mobile subscribers) ................................ 50 Figure 53: Have to move around to get mobile signal ............................................................ 50 Figure 54: Network is busy or is not available ........................................................................ 50 Figure 55: Sound is not clear on phone calls/cannot hear the other person ......................... 51 Figure 56: Calls are dropped before I’m done ........................................................................ 51 Figure 57: Success rate of phone calls on first try .................................................................. 51 Figure 58: Do you plan to get a mobile phone in the future? ................................................. 54 Figure 59: New Buyer Profile by Urban/ Rural ........................................................................ 54 Figure 60: New Buyer Profile by Gender ................................................................................ 55 Figure 61: New Buyer Profile by Household Spending ........................................................... 55 Figure 62: New Buyer Profile by Age ..................................................................................... 55 Figure 63: Frequency of communication with people outside of own town/village (% of 15-‐65 year olds) ........................................................................................................................................ 56 Figure 64: How respondent generally communicates with others outside their town/village (% of those that communicate with people outside town/village) ................................................. 57 Figure 65: How respondent would communicate an urgent message to someone outside of town/village (% of 15-‐65 year olds) ........................................................................................ 57 Figure 66: Typical day-‐to-‐day Information Needs (As % of 15-‐65 Population) ....................... 58 Figure 67: Information needs of Myanmar ............................................................................. 59 Figure 68: Information Sources .............................................................................................. 59 Figure 69: Do you think that you require more information than you currently have access to? (% of 15-‐65 year olds ....................................................................................................................... 60 Figure 70: Do you think that you receive information on this kind of information quickly enough? (% of 15-‐65 year olds) .................................................................................................................. 60 Figure 71: How Ward/Village leaders disseminate information through the community (% of ward/village leaders surveyed) ............................................................................................... 61 Figure 72: Perceived benefits of mobile use and access (mean response) ............................. 63
7
Figure 73: Perceived benefits of mobile phones use and access (mean response) 1=No Change 5=Improved greatly ................................................................................................................ 63 Figure 74: Perceived benefits of mobile phones use and access (mean response) ................ 64 Figure 75: Perceived benefits of mobile phones use and access (mean response) ................ 64 Figure 76: Map of excluded areas ........................................................................................... 70 Figure 77: Overview Map of Survey Locations ........................................................................ 72 Figure 78:Map of Survey Locations in Yangon City ................................................................. 73 Figure 79: Map of Survey Locations in Myitkyina, Kachin State, Northern Hilly Area ............ 73 Figure 80: Map of Survey Locations in Muse, Shan State, Eastern Hills ................................. 73
List of Tables Table 1: Main type of energy for lighting = Electricity (% of households) .............................. 16 Table 2: Does your household have access to government electric power supply or other electric power supply? ........................................................................................................................ 16 Table 3: SEC Grid for Myanmar (based on household income) commonly used in market research 18 Table 4: Signal coverage ........................................................................................................ 19 Table 5: % of BOP who had used a phone in the last 3 months (surveyed in 2006) ............... 26 Table 6: % of BOP who had used a phone in the last week (surveyed in 2008) ..................... 26 Table 7: Number of active SIMs owned (% of mobile subscribers) ........................................ 38 Table 8: Have you used a computer from any location in the last 12 months? This can include a desktop, laptop or tablet (tab) computer ............................................................................... 46 Table 9: Have you used the Internet through a browser (e.g., UC Browser, Opera, Chrome, Mozilla Firefox, Dolphin, Internet Explorer etc.) on a tab, computer or mobile phone in the last 12 months ................................................................................................................................................ 46 Table 10: Does your mobile service provider provide any ‘free’ content through your mobile service plan? (% of mobile subscribers) ............................................................................................. 48 Table 11: Do you use any of these applications/services? (% of those offered free applications/services) ............................................................................................................. 48 Table 12: Have you used the Internet through a browser (e.g., UC Browser, Opera, Chrome, Mozilla Firefox, Dolphin, Internet Explorer etc.) on a tab, computer or mobile phone in the last 12 months ................................................................................................................................................ 49 Table 13: What are you using your phone for? (% of mobile subscribers) ............................. 49 Table 14: Why don't you have a mobile phone connection? (% of teleusers who don’t own a handset or active SIM) .......................................................................................................................... 53 Table 15: How Ward/Village leaders disseminate information through the community (% of ward/village leaders surveyed) ............................................................................................... 61 Table 16: Opportunities to improve: information from superiors/peers still through physical visits 61 Table 17: Sample selection procedure .................................................................................... 67 Table 18: Allocated number of sample households ................................................................ 68 Table 19: Townships excluded from sampling frame ............................................................. 69 Table 20: Myanmar Socio-‐economic classification grid .......................................................... 73 Table 21: State/regionwise sample distribution versus Myanmar population distribution ... 75

8
1 Executive Summary Myanmar today is possibly the most exciting telecommunication market in the world. After years of economic isolation, the country is open for business. The telecom sector has been transformed through the issuance of two new licenses (granted through a competitive process to Ooredoo and Telenor), and flow of Japanese funds and management expertise into the incumbent government operator (MPT).
As has been the experience in other countries, the availability and use of mobile phone connectivity (for voice and data) is expected to have a transformative effect in Myanmar and on its people. As one of the least-‐connected countries in the world, Myanmar is an ideal place to study such impacts. To systematically measure positive or negative impacts, it is necessary to establish a baseline of current communication habits and needs. Working in collaboration with MIDO, LIRNEasia, a regional think tank working on ICT policy and regulatory issues, has done this by conducting a survey that is representative of the population living in accessible areas of Myanmar.
Ideally, such a survey should have been carried out on “day zero” of liberalization – i.e., the day before competition-‐driven rollout started. Given that Ooredoo and Telenor started rollout in August/September of 2014, the ideal time to establish a baseline would have been July 2014. But due to various reasons, fieldwork was only carried out in February, March and May of 2015, six to eight months after liberalization/competitive roll-‐out. But in the absence of any other data, we believe the data from our survey will serve as a reasonable baseline for future research.
Methodology The survey was conducted nationwide in February-‐March of 2015, with some additional data collection in May 2015. Three questionnaires were implemented: at ward/village level targeting the ward leader/village head; at household level, targeting the head of the household; at individual level, targeting a randomly selected individual form each household, aged 15-‐65. Ward/village leaders were asked about characteristics such as availability of mobile signal and transport links, distance to markets and so on. Retail prices for common household items were also collected from each ward/village by walking into a local grocery store. The household heads (or their spouses, when necessary) were asked about household characteristics such as availability of electricity, various household items and about the individuals living in the house. The individual questionnaire covered details of ICT use, communication needs and other details specific to him/her.
The sample selection was done so that the extrapolated data is representative of 97% of households, 96.3% of the population aged 15-‐65, with ±2.5% error margin.
All areas of the country were included in the sampling frame except for 32 townships inaccessible due to security reasons.
The detailed Sampling Methodology is available in Annex 1.
Myanmar is catching up fast: phone ownership is high At the time of the survey, 39% of the population aged 15-‐65 owned a mobile phone and an active SIM card. Mobile penetration was greater in higher spending households (i.e., those with higher income or more wealth) -‐ 42% of them had a mobile phone and SIM. But even in poor households the number was 35%. This figure is remarkable, given that in 2006, nearly 9 years after market liberalization, only 9% of the Indian poor had a phone, 23% of Pakistan and 22% in Sri Lanka.

9
Rural penetration (27%) is still lagging behind that of urban Myanmar (65%; driven largely by Yangon, Mandalay and Nay Pyi Taw), though this is still higher than the 2006 levels seen in India, Pakistan and Sri Lanka.
Not just catching up, but leapfrogging: smart phones dominate Not only are Myanmarese owning phones, they are owning smart phones with Internet-‐ready features such as browsers, touch screens, WiFi and the ability to install apps. Among those who owned a phone, 63% owned a smart phone and 3% owned both a smart phone and a basic (feature/key-‐pad) phone, bringing smart phone penetration to 66%. This is a penetration rate higher than Thailand, Myanmar’s much-‐richer neighbor, reported to have under 50% smart phone penetration. Countries like India and Sri Lanka are much lower – under 20 or 25%.1
Using mobile Internet, not in the “traditional” way Among phone owners, there is considerable use of mobile Internet, using various apps that are installed on the phone. The highest percentage, or 24% of phone/SIM owners’ use is calling/using VOIP application such as Viber and Skype. Next highest, at 20% are the various chat applications such as Whatsapp and Facebook messenger. Third is the Facebook app, with 17% of all phone owners using it. These are reasonably high numbers, just 6 months after liberalization.
Interestingly, however, when asked (in another question of the survey) if they had used the Internet “through a browser on any device such as a computer, tablet or mobile phone in the past 12 months”, only 2% say “yes”. Even within this 2%, the majority use a mobile phone, not a tablet or a computer. Given that computer use in the 12 months preceding the survey was at a mere 2%, the dominance of mobile phone even for browser-‐based Internet (the traditional and perhaps more cumbersome way to access the internet) is not surprising.
Many are using phones. But ownership changes uses and needs 69% of 15-‐65 year olds had used a phone before (not necessarily their own). In most cases the last phone used was a mobile phone. The urban and richer individuals are more frequent users, but even among the rural dwellers, 80% have access to a mobile phone inside their house.
Owners of mobile phones as well as non-‐owners are making calls. However, ownership appears to change the type of use. For example, owners are more likely to have made a livelihood related call compared to non-‐owners: 21% of owners say their last phone call was for livelihood purposes, compared to 13% of non-‐owners.
Owners are hungrier for more information. When respondents are asked if they require “more information than they currently have” about their key information categories, 54% of owners say “yes” (i.e. they need more information) compared 37% of non-‐owner users. When asked if they get certain types of information fast enough, 54% of owners say “no” compared to 42% of non-‐owner users.
1 GSMA Intelligence. 2015. Mobile internet usage challenges in Asia — awareness, literacy and local content. Retrieved from https://gsmaintelligence.com/research/?file=06e82e7d9c569e05a6d54974c33f6b04&download

10
High gender gap in phone ownership, but less in phone use The gender difference in access (i.e., the use of a phone, irrespective of ownership) is not high. Men use phones slightly more frequently than women. Twenty-‐eight percent of men had never used a phone compared to 33% of women. But more than gender, it appears that income has a stronger effect on whether or not a person has access to a phone. In this regard, poor women are more like poor men – having somewhat similar frequency of use, with 35% of poor men and 40% of poor women never having used a phone. Richer women have use patterns similar to those of richer men, with only 13% of richer men never having used a phone compared to 16% of richer women.
New phone buyers we predominantly females from rural, poorer households About 50% of those who did not own a phone at the time of the survey said they planned to purchase one in the coming 12 months. Sixty percent of these new buyers will be rural; 57% will be female; 63% will be from lower-‐spending (poorer) households; 73% will be under the age of 44 years.
Thirst for news, information about weather, jobs and where to buy things When asked what the three most important, day-‐to-‐day information needs are, community news (about what is happening at ward/village level), national news (important things happening in Myanmar) local news (what’s happening at state/regional level), weather information , information on where to get everyday household goods (at a better price), and information about job opportunities are ranked at the very top. Sports, entertainment, horoscope and other “entertainment” related information is ranked much lower. The top 6 categories remain consistent even when urban areas and rural areas are considered separately. But weather information rises to the second most important information need in rural areas, reflecting perhaps the dependence on rainwater for agriculture related livelihoods.
Despite high penetration of TV (in 50% of households) and radio (in 18% of households), very few people (under 10%) rely on these sources to get information. Instead, it is word-‐of-‐mouth that works in Myanmar today: nearly 70% of respondents say friends/family are the main source of information. A ubiquitous and personal device such as the mobile phone may be able to play a significant role in filling the gap and fulfilling information needs of people of Myanmar.
This report provides descriptive data emerging from the survey in the form of figures or tables. It is based on series of slides used in Myanmar in July 2015, to present the research to stakeholders.

11
2 Sample profile
Figure 1: Gender Composition (% of respondents)
Base: All respondents 15-‐65 years old, selected via Kish Grid
Figure 2: Age distribution (% of respondents)
Base: All respondents 15-‐65 years old, selected via Kish Grid
Figure 3: Occupation (as % of population aged between 15-‐65)
45%
55%
Male
Female
27%
24% 20%
17%
12% 15 -‐ 24 years
25 -‐ 34 years
35 -‐ 44 years
45 -‐ 54 years
55 -‐ 65 years

12
0% 10% 20% 30% 40% 50% 60%
Skilled/Unskilled workers
Those not seeking employment ( i n c l . h ou s ew i v e s , e l d e r l y , e t c , excluding students)
Self-‐employed/business owner
Office workers & Professionals
Students
Unemployed (those seeking but unable to find jobs)
Male Female Myanmar total
Base: All respondents 15-‐65 years old, selected via Kish Grid

13
Wooden houses dominate Figure 4: Type of housing (% of households)
Base: All households surveyed
0% 5% 10% 15% 20% 25% 30% 35% 40% 45%
Others (Specify)
Condominium
Flat/apartment with parquet/tonngue-‐and-‐groove plank flooring
Unsafe hut lasung 1 year
Highly renovated brick-‐house
Safe hut built with rudimentary materials (last min 2 years)
Common flat/apartment
Semi brick-‐house/semi brick nogging house
Common brick-‐house/Brick nogging house
Wooden pillar and bamboo-‐mat wall house (last min 4 years)
House with plank floor and wall wooden house
Rural (%) Urban (%)

14
Motorcycles, three-‐wheeled cars and bicycles most common Figure 5: Access to modes of transportation (% of households)
Base: All households surveyed
41% households have govt. power supply. 54% have some form of electricity Figure 6: Access to electricity (% of households)-‐ Total Myanmar
Important Note: A previous version of Figure 6 (shown in presentations in Yangon and Nay Pyi Taw, July 2015) mistakenly had the total electrification rate at 64%. That 64% referred to unweight/raw sample data. This slide corrects the error by using weights, and extrapolates to all households in the country. Our apologies for the confusion.
45%
38%
13%
2%
1%
1%
1%
Motorcycle/Three-‐wheeled car (Petrol/electric, all)
Bicycle/electric bicycle
Cart (Pony cart, bullock cart, etc.)
Car (Sedan/ Wagon/ Van/ Pick-‐up/ SUV)
Motorboat/ outboard motorboat
Truck/ Lorry/ Other heavy duty vehicle
Four-‐wheeled trollergy
Government electric power supply, 40%
Other electric power
supply, 14% Both, 0%
None , 46%

15
Figure 7: Access to electricity (% of households)-‐ Urban Myanmar
Figure 8: Access to electricity (% of households)-‐ Rural Myanmar
Base: All households
Government electric power
supply, 88%
Other electric power
supply, 5%
Both, 0% None , 8%
Government electric power supply, 19%
Other electric power supply, 18%
Both, 0%
None , 63%
16
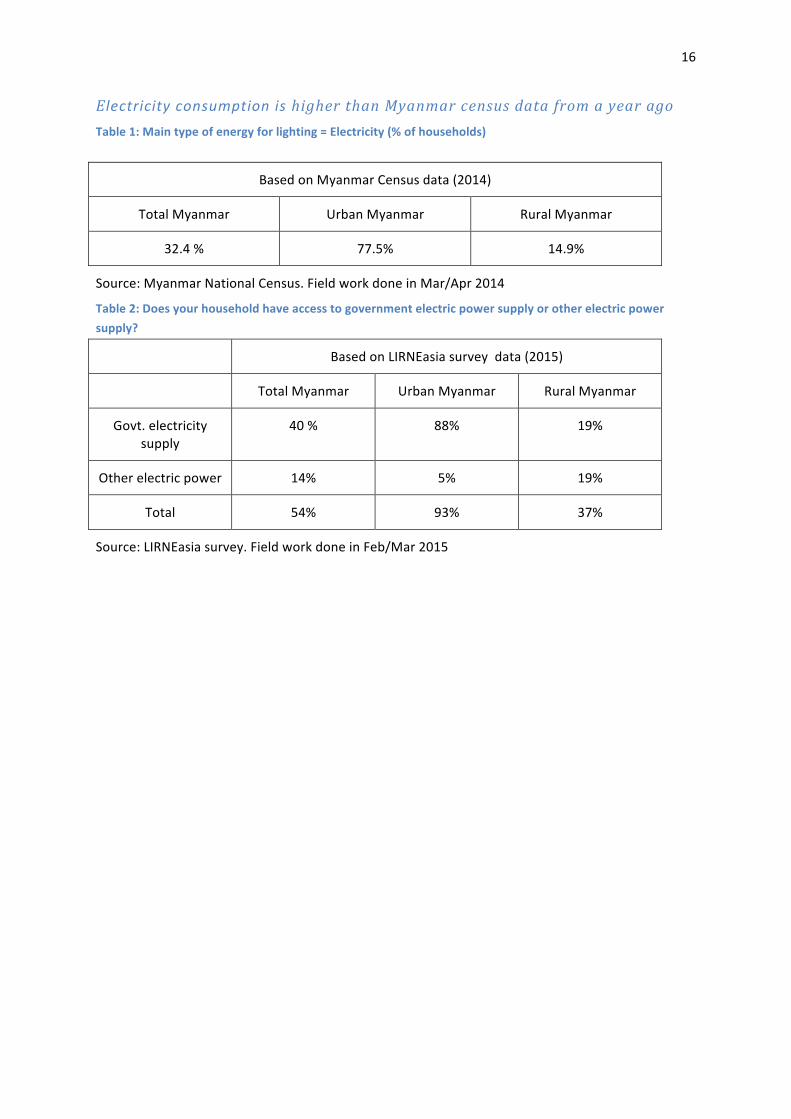
Electricity consumption is higher than Myanmar census data from a year ago Table 1: Main type of energy for lighting = Electricity (% of households)
Based on Myanmar Census data (2014)
Total Myanmar Urban Myanmar Rural Myanmar
32.4 % 77.5% 14.9%
Source: Myanmar National Census. Field work done in Mar/Apr 2014
Table 2: Does your household have access to government electric power supply or other electric power supply?
Based on LIRNEasia survey data (2015)
Total Myanmar Urban Myanmar Rural Myanmar
Govt. electricity supply
40 % 88% 19%
Other electric power 14% 5% 19%
Total 54% 93% 37%
Source: LIRNEasia survey. Field work done in Feb/Mar 2015

17
Figure 9: Type of work (% of population aged 15-‐65 who are working)
Base: All aged 15-‐65 individuals who are working
In this survey, “poor” households are those spending less than 300,000 MMK per month. Myanmar’s SEC grid has close correspondence
Figure 10: Total monthly household expenditure (MMK) (% of 15-‐65 population)
26%
21%
30%
36%
16%
7%
8%
7%
7%
7%
18%
31%
7%
7%
29%
38%
34%
42%
37%
40%
2%
1%
3%
3%
1%
8%
6%
11%
10%
7%
0% 10% 20% 30% 40% 50% 60% 70% 80% 90% 100%
Urban
Rural
Non-‐subscribers
Subscribers Myan
mar
total
Locauo
n
Mob
ile
subscribers
hip
Daily wage Contract earning/ piece rate Monthly salary Profit/ dividends/ interests In kind/ no earning in cash Other
0%
10%
20%
30%
40%
50%
60%
100,000 or below
100,001 -‐ 300,000
300,001 -‐ 500,000
500001 -‐ 1,000,000
More than 1,000,001

18
Table 3: SEC Grid for Myanmar (based on household income) commonly used in market research
Income in Kyats/month SEC
100,000 or below E
100,001 -‐ 200,000 D
200,001 -‐ 300,000
300,001 -‐ 400,000 C
400,001 -‐ 500,000
500,001 -‐ 600,000
B
600,001 -‐ 700,000
700,001 -‐ 800,000
800,001 -‐ 900,000
900,001 -‐ 100,0000
over 1,000,000 A
19
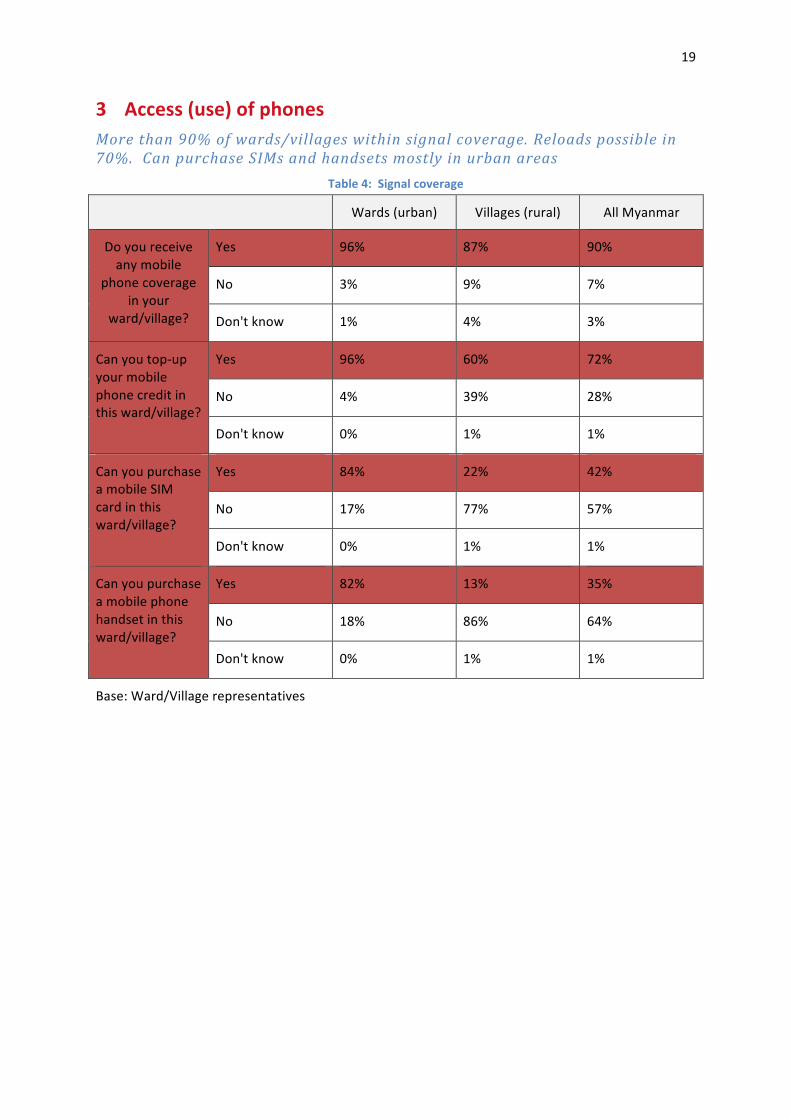
3 Access (use) of phones More than 90% of wards/villages within signal coverage. Reloads possible in 70%. Can purchase SIMs and handsets mostly in urban areas
Table 4: Signal coverage
Wards (urban) Villages (rural) All Myanmar
Do you receive any mobile
phone coverage in your
ward/village?
Yes 96% 87% 90%
No 3% 9% 7%
Don't know 1% 4% 3%
Can you top-‐up your mobile phone credit in this ward/village?
Yes 96% 60% 72%
No 4% 39% 28%
Don't know 0% 1% 1%
Can you purchase a mobile SIM card in this ward/village?
Yes 84% 22% 42%
No 17% 77% 57%
Don't know 0% 1% 1%
Can you purchase a mobile phone handset in this ward/village?
Yes 82% 13% 35%
No 18% 86% 64%
Don't know 0% 1% 1%
Base: Ward/Village representatives

20
Urban consumers have more choice among suppliers Figure 11: Number of mobile networks available in ward (urban)/village (rural) (% of wards/villages)
Most often this is MPT GSM and/or MPT CDMA800 (MEC)
Base: Ward/Village representatives
1
99
80
51 44
5
95
63
31 20
0
20
40
60
80
100
120
no Network at least 1 network
at least 2 networks
at least 3 networks
4 networks
urban Rural

21
Almost 60% of households have at least one mobile phone; almost 30% have more than one Figure 12: Number of active SIMs among household members (% of households)
Q: How many active SIM cards do you have in total? (SIM cards that you have used in the last 30 days)
Base: All households
Figure 13: Number of handsets among household members (% of households)
Q: How many number of functioning hand-‐sets do you own?
Base: All households
16%
4% 8%
22%
10% 14%
24%
31% 29%
16%
53% 41%
0%
20%
40%
60%
80%
100%
Urban (%) Rural (%) Myanmar total (A)
0
1
2
3
4
5
6
7
16%
3% 8%
25%
9%
14%
25%
32%
30%
17%
54% 42%
0% 10% 20% 30% 40% 50% 60% 70% 80% 90%
100%
Urban (%) Rural (%) Myanmar total (A)
6 or more 5 4 3 2 1 0

22
Mobile phones & SIMs are the most common of ICTs. Already ahead of TVs Figure 14: Household access to ICTs (% of households)
Q: Does your household own working/ functioning [item] Base: All households
1%
2%
2%
1%
5%
18%
44%
52%
57%
58%
0% 10% 20% 30% 40% 50% 60% 70%
Tablet computer
Notebook, laptop computer
Internet connecuon (excluding. via
Desktop computer
Fixed phone
Radio/cassexe player
CD/ DVD/ EVD/ Blue Rays Disc Player
Television
Mobile handset
Acuve mobile SIM
Myanmar Total (%)
23
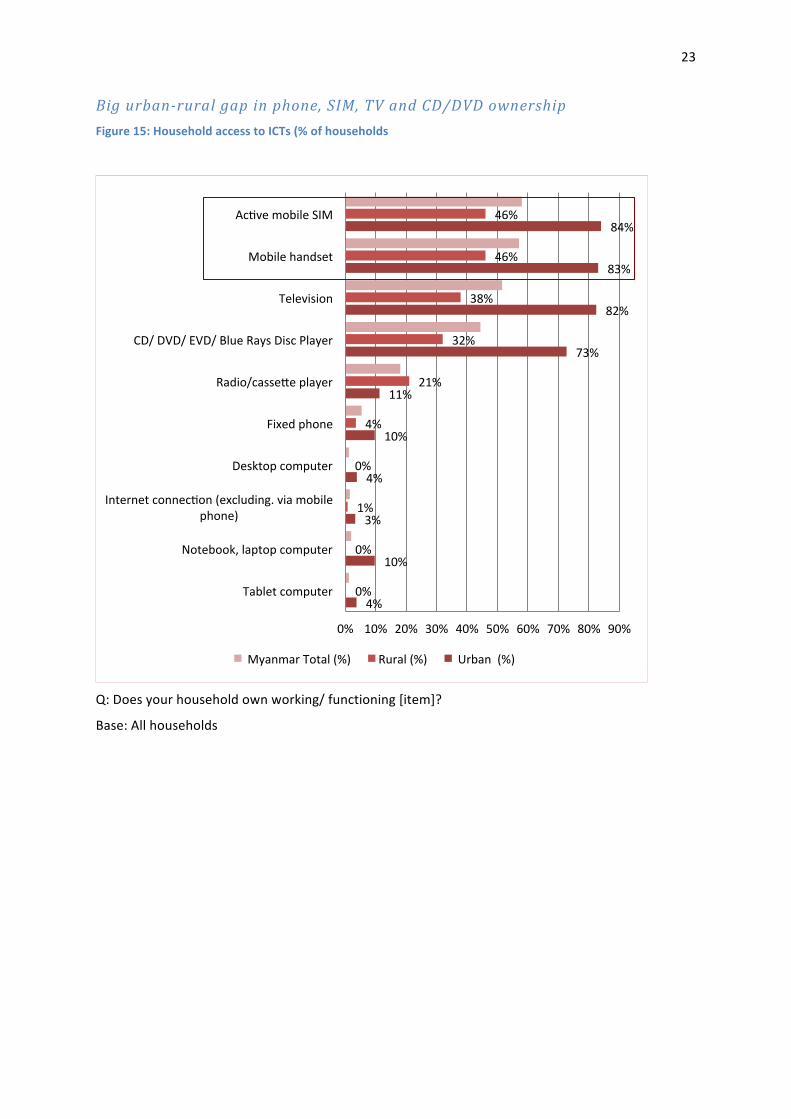
Big urban-‐rural gap in phone, SIM, TV and CD/DVD ownership Figure 15: Household access to ICTs (% of households
Q: Does your household own working/ functioning [item]?
Base: All households
4%
10%
3%
4%
10%
11%
73%
82%
83%
84%
0%
0%
1%
0%
4%
21%
32%
38%
46%
46%
0% 10% 20% 30% 40% 50% 60% 70% 80% 90%
Tablet computer
Notebook, laptop computer
Internet connecuon (excluding. via mobile phone)
Desktop computer
Fixed phone
Radio/cassexe player
CD/ DVD/ EVD/ Blue Rays Disc Player
Television
Mobile handset
Acuve mobile SIM
Myanmar Total (%) Rural (%) Urban (%)
24
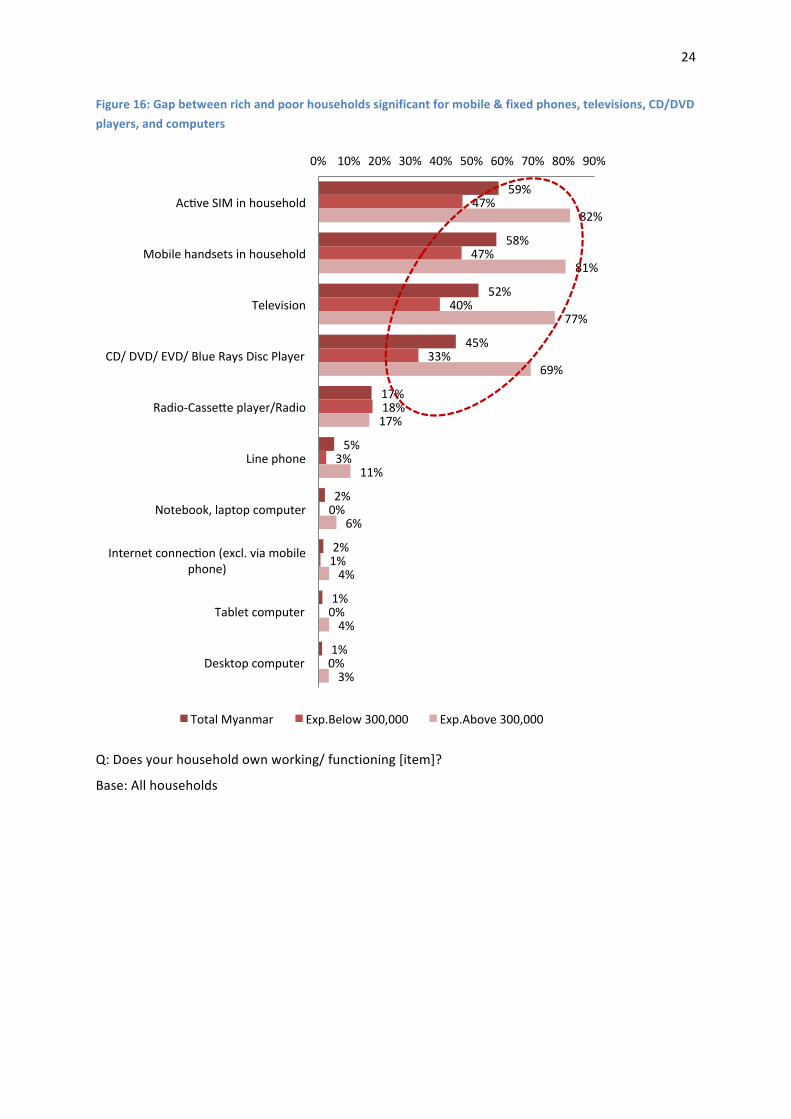
Figure 16: Gap between rich and poor households significant for mobile & fixed phones, televisions, CD/DVD players, and computers
Q: Does your household own working/ functioning [item]?
Base: All households
59%
58%
52%
45%
17%
5%
2%
2%
1%
1%
47%
47%
40%
33%
18%
3%
0%
1%
0%
0%
82%
81%
77%
69%
17%
11%
6%
4%
4%
3%
0% 10% 20% 30% 40% 50% 60% 70% 80% 90%
Acuve SIM in household
Mobile handsets in household
Television
CD/ DVD/ EVD/ Blue Rays Disc Player
Radio-‐Cassexe player/Radio
Line phone
Notebook, laptop computer
Internet connecuon (excl. via mobile phone)
Tablet computer
Desktop computer
Total Myanmar Exp.Below 300,000 Exp.Above 300,000

25
69% of 15-‐65 year olds in MM have used a phone before (teleusers); urban teleusers had more recent use than rural Figure 17: When was the last time you used a phone? (% of 15-‐65 year olds)
Base: All respondents
18%
5% 9%
33%
14%
20%
20%
15%
16%
7%
12%
10%
2%
9%
7%
0%
0%
0%
5%
9%
7%
15%
37% 31%
0%
10%
20%
30%
40%
50%
60%
70%
80%
90%
100%
Urban Rural Myanmar total
In the last hour Earlier today Yesterday In the last week
In the last month In the last year Can't Remember Never

26
Twice as many at the BOP had never used a phone, compared to the rest Figure 18: When was the last time you used a phone? (% of 15-‐65 year olds)
Q: When did you last use a phone to make or receive a call? It could be through your own phone, a neighbor's phone, a friend's phone, communication kiosk/shop or any other. It also need not be paid for?
Base: All respondents
46% of the BOP had used phone in last week; 44% in last month. Compared to Asian neighbors, 9-‐11 years after their liberalization…. Table 5: % of BOP who had used a phone in the last 3 months (surveyed in 2006)
South Asia South East Asia
Pakistan India Sri Lanka Philippines Thailand
Used phone in last 3 months
98% 94% 92% 93% 95%
Table 6: % of BOP who had used a phone in the last week (surveyed in 2008)
Bangladesh Pakistan India Sri Lanka Philippines Thailand
Used phone in last week
82% 66% 65% 77% 38% 72%
Source for above tables: LIRNEasia 2006 and 2008. Teleuse @ the Bottom of the Pyramid Studies. Surveys nationally representative of the BOP in each listed country. BOP = those at the bottom of the pyramid, defined as those belonging to SEC D and E.
5% 17% 9%
16%
31%
21% 15%
19%
17% 10%
10%
10% 8%
3%
6% 8%
6%
7%
38%
15% 30%
0%
20%
40%
60%
80%
100%
Exp.Below 300,000 Exp.Above 300,000 Total Myanmar

27
Gender difference is minimal: males are more frequent teleusers Figure 19: When was the last time you used a phone? (% of 15-‐65 year olds)
Q: When did you last use a phone to take or receive a call? It could be through your own phone, a neighbors' phone, a friend's phone, communication kiosk/shop or any other. It also need not be paid for?
Base: Respondents who had ever used a phone before
10% 7%
23% 18%
16%
16%
10%
11%
6% 7%
0% 0%
6% 8%
28% 33%
0%
10%
20%
30%
40%
50%
60%
70%
80%
90%
100%
Male Female
In the last hour Earlier today Yesterday In the last week
In the last month In the last year Can't Remember Never

28
7% 18%
11%
18%
35%
24%
16%
18%
17% 9%
8%
9% 7%
3%
6% 7%
5%
6%
35%
13%
27%
0%
20%
40%
60%
80%
100%
Exp.Below 300,000
Exp.Above 300,000
Total Myanmar
4% 15%
7% 14%
27%
19% 14%
21%
16% 11%
11%
11% 8%
4%
7% 9%
6%
8%
40%
16% 32%
0%
20%
40%
60%
80%
100%
Exp.Below 300,000
Exp.Above 300,000
Total Myanmar
Income effects wash out gender: access by poor women similar to that by poor men Figure 20: Males -‐ When was the last time you used a phone? (% of 15-‐65 year olds)
Figure 21: Females -‐ When was the last time you used a phone? (% of 15-‐65 year olds)
Q: When did you last use a phone to take or receive a call? It could be through your own phone, a neighbor's phone, a friend's phone, communication kiosk/shop or any other. It also need not be paid for? Base: All respondents

29
80% of teleusers said the last phone they used was a mobile (not necessarily their own) Figure 22: What type of phone did you use last? (% of 15-‐65 year olds who have used a phone before)
Dependence on fixed higher among poor households (who have fewer mobile phones) Figure 23: What type of phone did you use last? (% of 15-‐65 year olds who have used a phone before)
Q: What type of phone did you make or receive your last phone call from?
Base: Respondents who had ever used a phone before
10%
27% 20% 18% 22%
90%
73% 80% 82% 78%
0%
10%
20%
30%
40%
50%
60%
70%
80%
90%
100%
Urban Rural Myanmar total Male Female
Area Gender
Fixed (landline) Mobile (GSM or CDMA)
23% 13% 19%
77% 87% 81%
0%
20%
40%
60%
80%
100%
Exp.Below 300,000 Exp.Above 300,000 Total Myanmar

30
Most either used their own or another phone in the house. 80% rural teleusers have a phone in the house. Figure 24: Whose phone did you use last? (% of 15-‐65 year olds who have used a phone before)
Q: What type of phone did you make or receive your last phone call from?
Base: Respondents who had ever used a phone before
71%
34% 48%
18%
30%
26%
5%
16% 12%
3% 11% 8%
0%
20%
40%
60%
80%
100%
Urban Rural Total Myanmar Other My work place / Office phone/employer
A neighbor (can include friend or relauve) A friend's or relauve (who is not a neighbor)
roadside booths, private pay phone booths) Another household member
The household (common phone) Me (personal phone)

31
Most calls serve social purposes, some are livelihood-‐related. No difference between urban/rural or rich/poor. Figure 25: Purpose of the last call made or received (% of 15-‐65 year olds who have used a phone before)
Q: Can you tell us the purpose of your call?
Base: Respondents who had used a phone before
74% 74% 74%
19% 17% 17%
3% 2% 2% 3% 4% 4% 2% 4% 3%
Urban Rural Myanmar total
Other (please specify) Emergency communicauon Coordinauon of some other acuvity (excluding livelihood) Livelihood-‐related Social purposes / keeping in touch
73% 76% 74%
17% 18% 17% 2% 2% 2% 5% 2% 4% 3% 3% 3%
Exp.Below 300,000
Exp.Above 300,000
Total Myanmar

32
Subscribers (phone + SIM owners) more likely to have made livelihood related calls. Non-‐ subscribers show slightly higher emergency use Figure 26: Purpose of the last call made or received (% of 15-‐65 year olds who have used a phone before)
Q: Can you tell us the purpose of your call?
Base: Respondents who had used a phone before
76% 72%
13% 21% 2%
2% 5% 3% 4% 2%
0%
10%
20%
30%
40%
50%
60%
70%
80%
90%
100%
Non-‐subscriber Mobile subscriber Other (please specify) Emergency communicauon Coordinauon of some other acuvity (excluding livelihood) Livelihood-‐related Social purposes / keeping in touch

33
4 Mobile phone (and active SIM card) owners 39% Myanmar 15-‐65 population are mobile subscribers Figure 27: Mobile SIM and handset ownership (% of 15-‐65 years)
City-‐wise SIM penetration: Yangon-‐83%; Mandalay-‐55%; Nay Pyi Taw-‐55%
Q: Which describes your status of mobile phone ownership?
Base: All respondents
More mobile subscribers are in higher spending households Figure 28: Mobile subscribers by Household Spending (% of population)
Q: Which describes your status of mobile phone ownership?
Base: All respondents
65%
27% 39%
66%
26% 39%
Urban Rural Total Myanmar
Owns an acuve SIM card Owns a mobile handset
35% 42% 39%
0% 5% 10% 15% 20% 25% 30% 35% 40% 45%
Lower Spending household
Higher Spending Household
Overall Myanmar
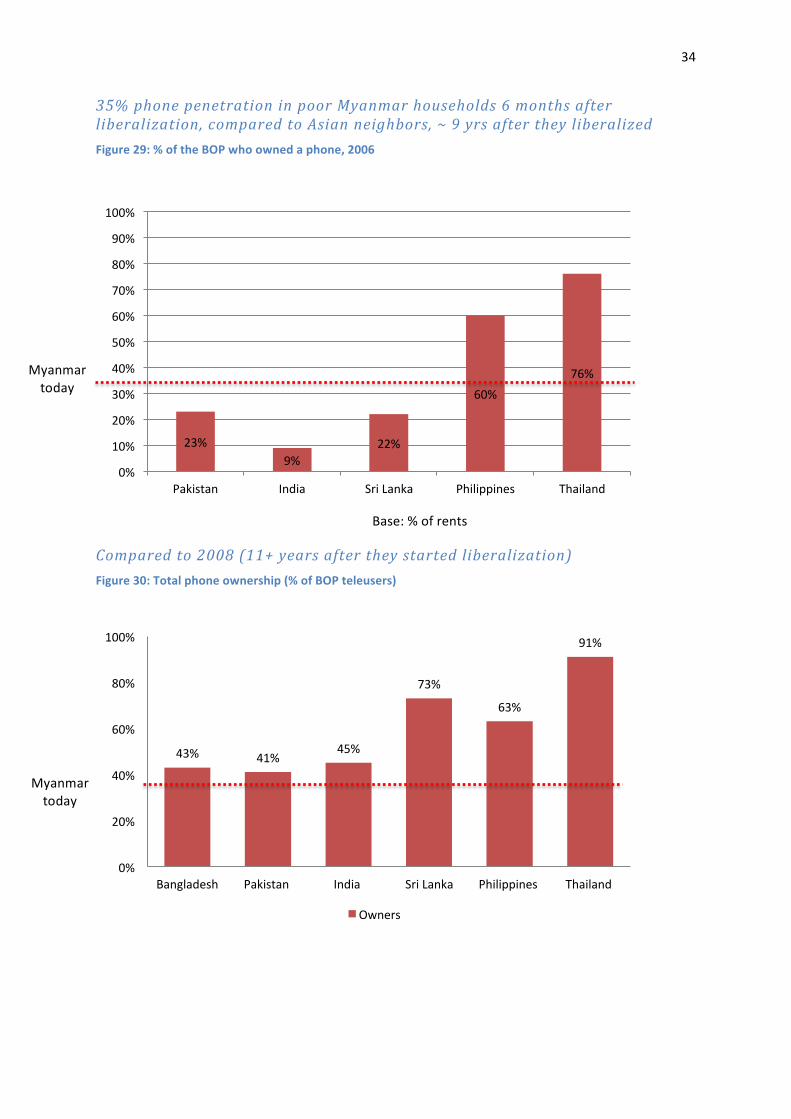
34
35% phone penetration in poor Myanmar households 6 months after liberalization, compared to Asian neighbors, ~ 9 yrs after they liberalized Figure 29: % of the BOP who owned a phone, 2006
Base: % of rents
Compared to 2008 (11+ years after they started liberalization) Figure 30: Total phone ownership (% of BOP teleusers)
23% 9%
22%
60% 76%
0%
10%
20%
30%
40%
50%
60%
70%
80%
90%
100%
Pakistan India Sri Lanka Philippines Thailand
43% 41% 45%
73%
63%
91%
0%
20%
40%
60%
80%
100%
Bangladesh Pakistan India Sri Lanka Philippines Thailand
Owners
Myanmar today
Myanmar today

35
Subscribers mostly on monthly salary or living on profit/dividend-‐making income Figure 31: Type of work those that are working are involved in (% of population aged 15-‐65 who are working
Base: All aged 15-‐65 individuals who are working
Penetration highest among 15-‐44 year olds Figure 32: Mobile subscribers (% of 15-‐65 population)
Base: All respondents
0% 10% 20% 30% 40% 50% 60% 70% 80% 90% 100%
Urban
Rural
Non-‐subscribers
Subscribers
Myan
mar
total
Locauo
n
Mob
ile
subscribershi
p
Daily wage Contract earning/ piece rate
Monthly salary Profit/ dividends/ interests
In kind/ no earning in cash Other
41% 43% 42% 37%
30%
39%
0% 5%
10% 15% 20% 25% 30% 35% 40% 45%
15-‐24 years 25-‐34 years 35-‐44 years 45-‐54 years 55-‐64 years Overall Myanmar
36
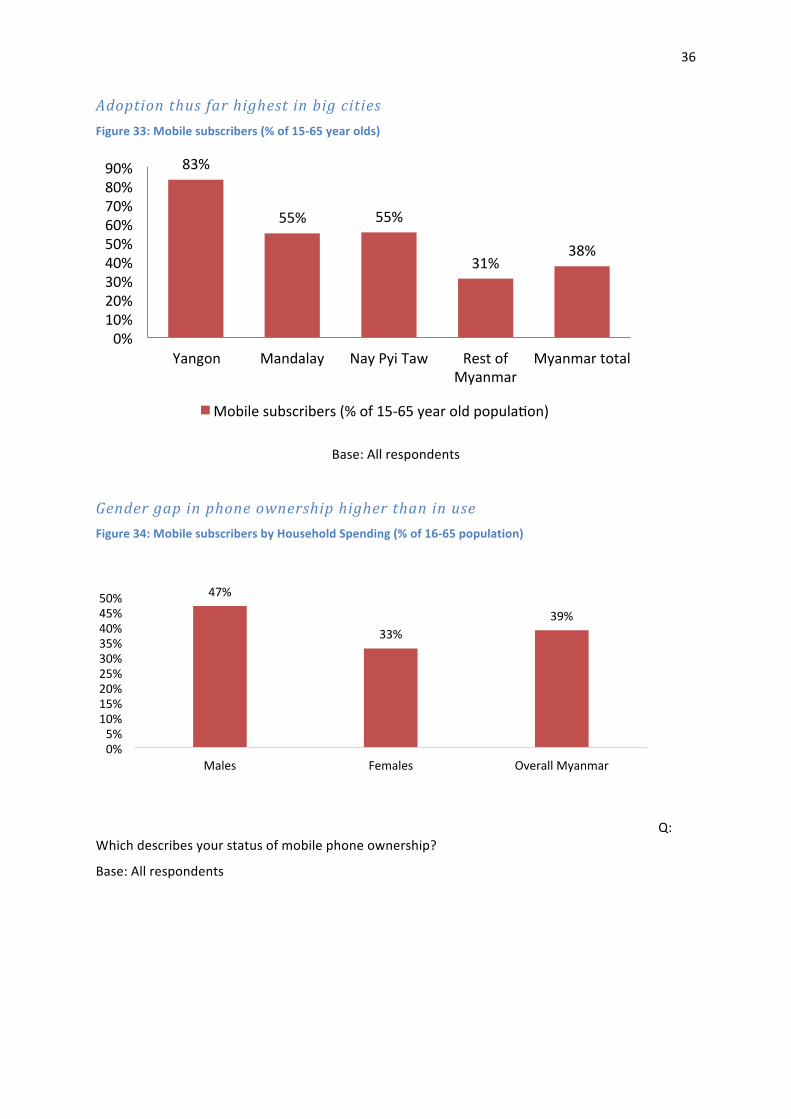
Adoption thus far highest in big cities Figure 33: Mobile subscribers (% of 15-‐65 year olds)
Base: All respondents
Gender gap in phone ownership higher than in use Figure 34: Mobile subscribers by Household Spending (% of 16-‐65 population)
Q: Which describes your status of mobile phone ownership?
Base: All respondents
83%
55% 55%
31% 38%
0% 10% 20% 30% 40% 50% 60% 70% 80% 90%
Yangon Mandalay Nay Pyi Taw Rest of Myanmar
Myanmar total
Mobile subscribers (% of 15-‐65 year old populauon)
47%
33% 39%
0% 5% 10% 15% 20% 25% 30% 35% 40% 45% 50%
Males Females Overall Myanmar

37
Gender gap in mobile ownership exists in high and low-‐spending households. Beyond just income Figure 35: Mobile subscribers By Gender & Household Spending (% of 15-‐65 population)
Q: Which describes your status of mobile phone ownership?
Base: All respondents
13% of mobile owners have more than one active SIM; higher in urban areas Figure 36: Number of active SIMs owned (% of mobile subscribers)
36%
67%
47%
24%
51%
33%
0%
10%
20%
30%
40%
50%
60%
70%
80%
Lower Spending household Higher Spending Household Overall Myanmar
Males Females
38
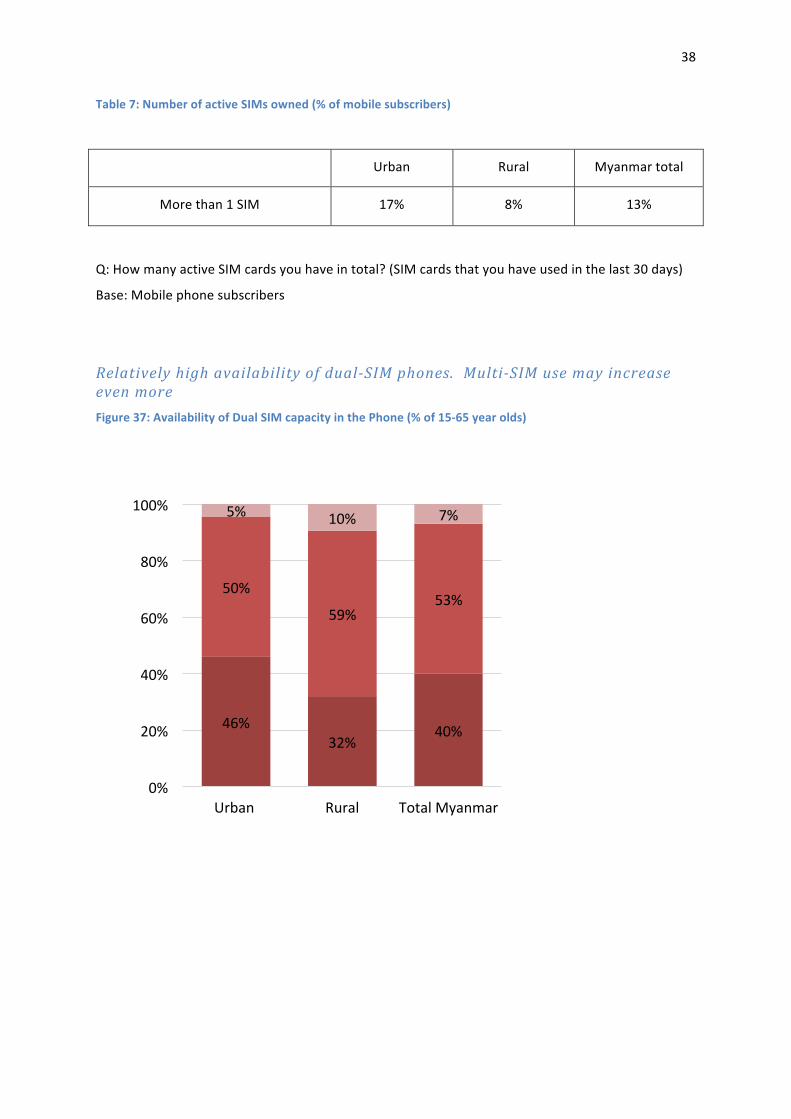
Table 7: Number of active SIMs owned (% of mobile subscribers)
Urban Rural Myanmar total
More than 1 SIM 17% 8% 13%
Q: How many active SIM cards you have in total? (SIM cards that you have used in the last 30 days)
Base: Mobile phone subscribers
Relatively high availability of dual-‐SIM phones. Multi-‐SIM use may increase even more Figure 37: Availability of Dual SIM capacity in the Phone (% of 15-‐65 year olds)
46% 32%
40%
50%
59% 53%
5% 10% 7%
0%
20%
40%
60%
80%
100%
Urban Rural Total Myanmar
39
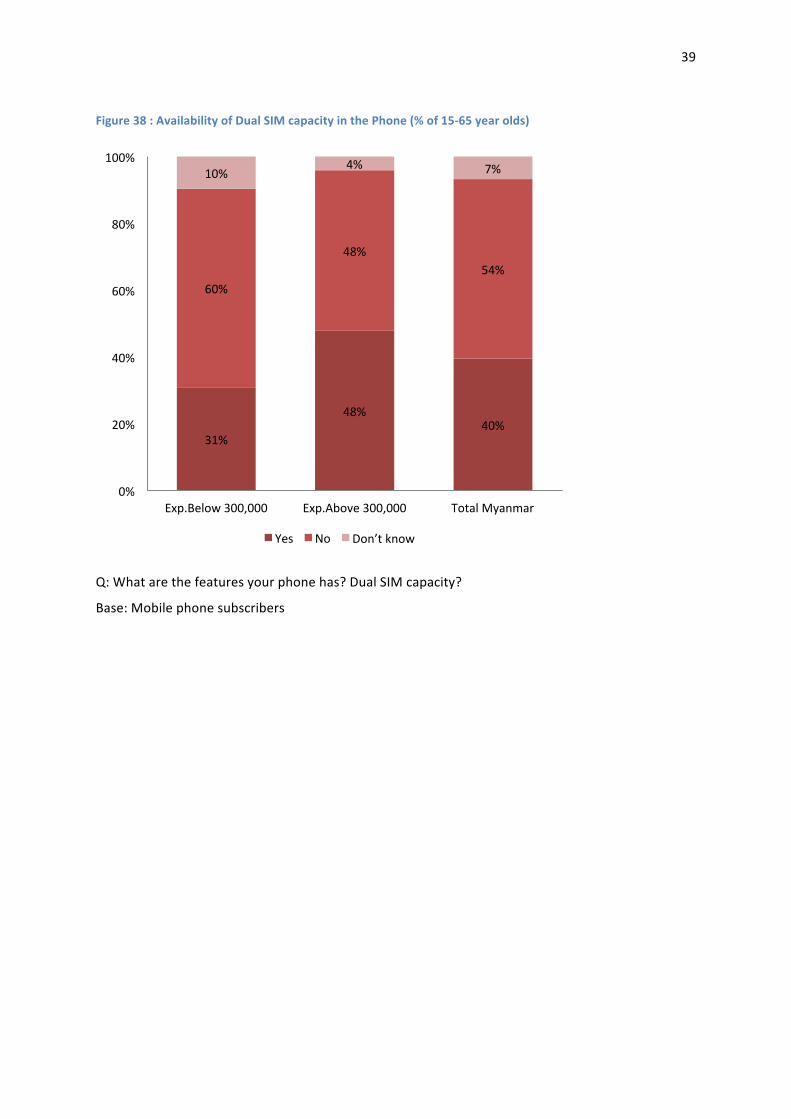
Figure 38 : Availability of Dual SIM capacity in the Phone (% of 15-‐65 year olds)
Q: What are the features your phone has? Dual SIM capacity?
Base: Mobile phone subscribers
31%
48% 40%
60%
48% 54%
10% 4% 7%
0%
20%
40%
60%
80%
100%
Exp.Below 300,000 Exp.Above 300,000 Total Myanmar
Yes No Don’t know

40
18% of subscribers’ primary connection obtained via lottery. Majority purchased Figure 39: How primary SIM card was obtained (% of mobile owners)
Q: How did you obtain your primary SIM/mobile connection?
Base: Mobile phone subscribers
Smartphones dominate: 63% all subscribers have one Figure 40: Handset Type (as % of Mobile Subscribers)
Base: Mobile phone subscribers
63%
34%
3%
Own Smartphone
Own Feature Phone
41
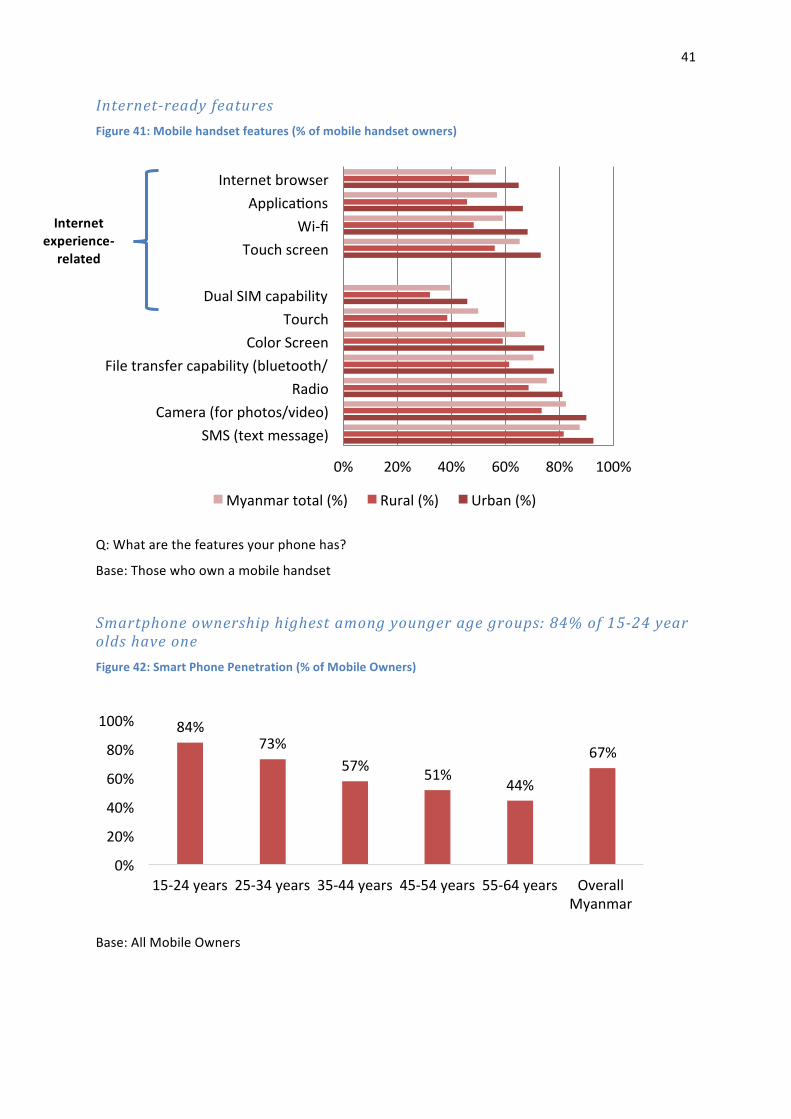
Internet-‐ready features Figure 41: Mobile handset features (% of mobile handset owners)
Q: What are the features your phone has?
Base: Those who own a mobile handset
Smartphone ownership highest among younger age groups: 84% of 15-‐24 year olds have one Figure 42: Smart Phone Penetration (% of Mobile Owners)
Base: All Mobile Owners
0% 20% 40% 60% 80% 100%
SMS (text message) Camera (for photos/video)
Radio File transfer capability (bluetooth/
Color Screen Tourch
Dual SIM capability
Touch screen Wi-‐fi
Applicauons Internet browser
Myanmar total (%) Rural (%) Urban (%)
84% 73%
57% 51% 44%
67%
0%
20%
40%
60%
80%
100%
15-‐24 years 25-‐34 years 35-‐44 years 45-‐54 years 55-‐64 years Overall Myanmar
Internet experience-‐related

42
57%
75% 67%
0% 10% 20% 30% 40% 50% 60% 70% 80%
Lower Spending household
Higher Spending Household
Overall Myanmar
No surprise: Smartphone ownership higher among the rich Figure 43 Smartphone Penetration by Household Spending (% of smartphone owners)
Q: Which describes your status of mobile phone ownership?
Base: All Mobile Owners
Smartphones mostly in the hands of urban, high-‐spending households Figure 44: Type of Handset (% of Mobile Subscribers) By Urban / Rural
75%
57% 67%
25%
44% 33%
0%
20%
40%
60%
80%
100%
Urban Rural Total Myanmar

43
Figure 45: Type of Handset (% of Mobile Subscribers) By Expenditure
Q: What is the type of your phone?
Base: Mobile phone subscribers
Mean price of handset was MMK 94,500 (approx. USD87); 11% got it free/as a gift Figure 46: Money spent to buy a handset
Base: Mobile phone subscribers
57% 75% 67%
43% 25% 33%
0%
20%
40%
60%
80%
100%
Exp.Below 300,000
Exp.Above 300,000
Total Myanmar
Owning Smart Phone Not Owning Smartphone

44
Richer households spend ~ 70% more on handsets than poorer households Figure 47: Mean prices off handsets by different expenditure groups
Mobile used mainly for voice, SMS, missed calls, music, games Figure 48: What are you using your phone for? (% of mobile subscribers)
Base: All who own a mobile phone
0% 10% 20% 30% 40% 50% 60% 70% 80% 90%
For missed calls Receiving phone calls (via your network provider)
To listen to music For calling applicauons (e.g. calls using Viber, Skype,
For sharing content (pictures/video/music, etc) To download/use any other mobile applicauon
To watch online video content (streaming) For email
To access other social-‐networking or blog To access mobile money or banking services
Exp.Below 300,000 Exp.Above 300,000 Total Myanmar
Household
Exp.Below MMK 300,000
Household
Exp.Above MMK 300,000
45
Household Exp.Below MMK 300,000
Household Exp.Above MMK300,000
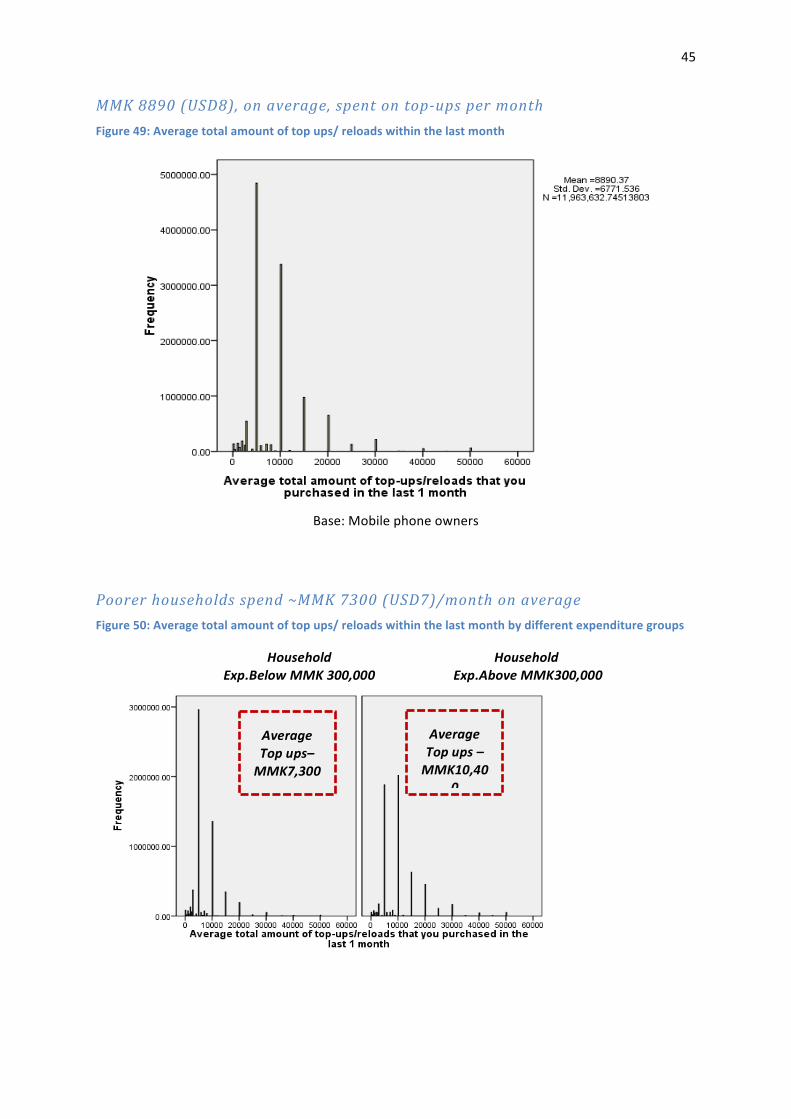
MMK 8890 (USD8), on average, spent on top-‐ups per month Figure 49: Average total amount of top ups/ reloads within the last month
Base: Mobile phone owners
Poorer households spend ~MMK 7300 (USD7)/month on average Figure 50: Average total amount of top ups/ reloads within the last month by different expenditure groups
Average Top ups– MMK7,300
Average Top ups – MMK10,40
0
46
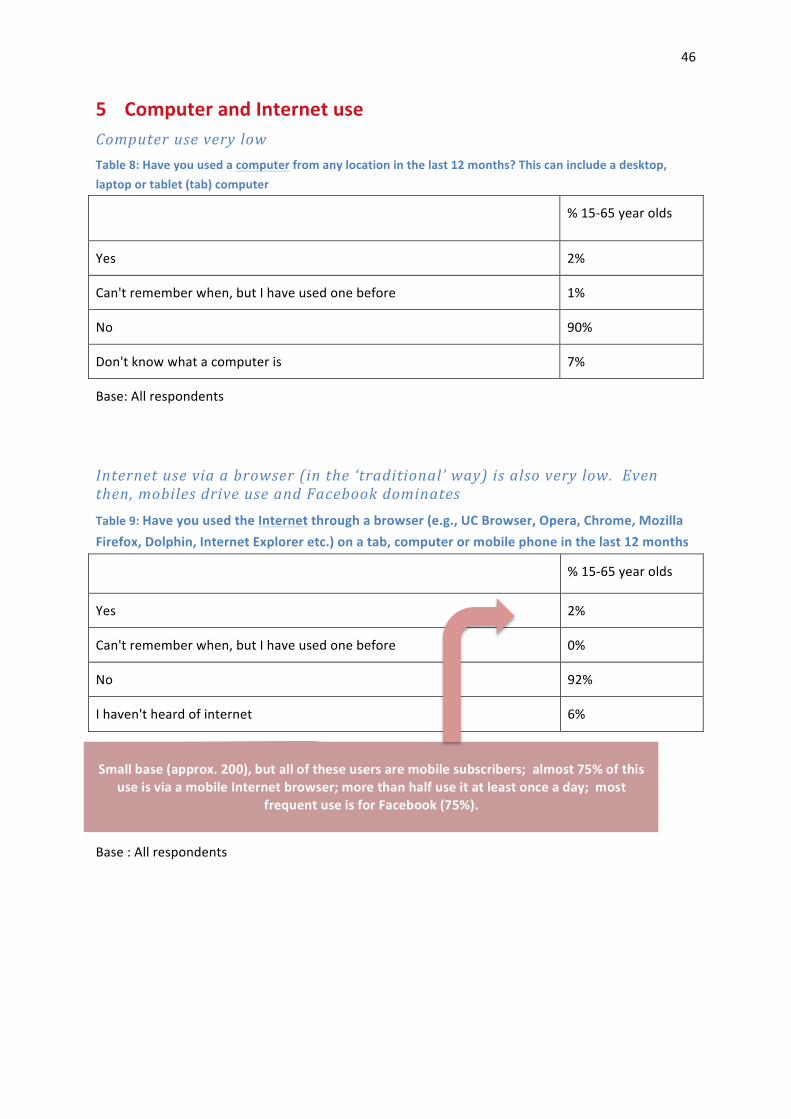
5 Computer and Internet use Computer use very low Table 8: Have you used a computer from any location in the last 12 months? This can include a desktop, laptop or tablet (tab) computer
% 15-‐65 year olds
Yes 2%
Can't remember when, but I have used one before 1%
No 90%
Don't know what a computer is 7%
Base: All respondents
Internet use via a browser (in the ‘traditional’ way) is also very low. Even then, mobiles drive use and Facebook dominates Table 9: Have you used the Internet through a browser (e.g., UC Browser, Opera, Chrome, Mozilla Firefox, Dolphin, Internet Explorer etc.) on a tab, computer or mobile phone in the last 12 months
% 15-‐65 year olds
Yes 2%
Can't remember when, but I have used one before 0%
No 92%
I haven't heard of internet 6%
Base : All respondents
Small base (approx. 200), but all of these users are mobile subscribers; almost 75% of this use is via a mobile Internet browser; more than half use it at least once a day; most
frequent use is for Facebook (75%).
47
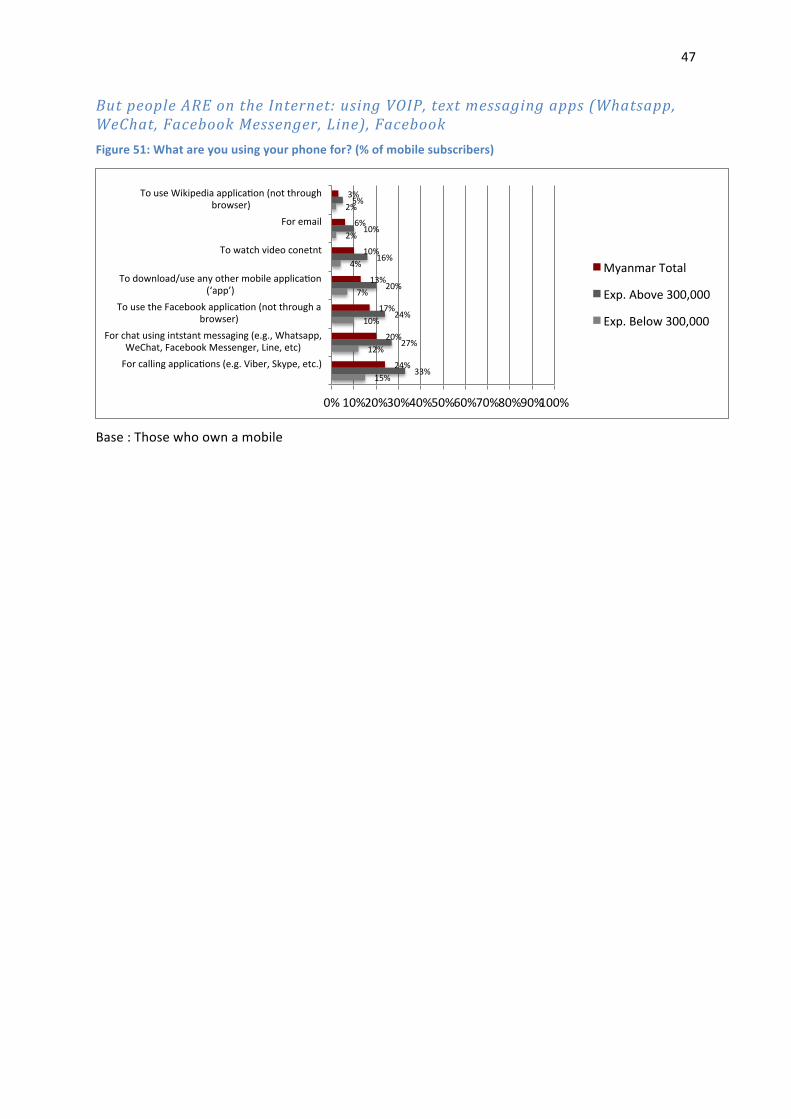
But people ARE on the Internet: using VOIP, text messaging apps (Whatsapp, WeChat, Facebook Messenger, Line), Facebook Figure 51: What are you using your phone for? (% of mobile subscribers)
Base : Those who own a mobile
15%
12%
10%
7%
4%
2%
2%
33%
27%
24%
20%
16%
10%
5%
24%
20%
17%
13%
10%
6%
3%
0% 10% 20% 30% 40% 50% 60% 70% 80% 90% 100%
For calling applicauons (e.g. Viber, Skype, etc.)
For chat using intstant messaging (e.g., Whatsapp, WeChat, Facebook Messenger, Line, etc)
To use the Facebook applicauon (not through a browser)
To download/use any other mobile applicauon (‘app’)
To watch video conetnt
For email
To use Wikipedia applicauon (not through browser)
Myanmar Total
Exp. Above 300,000
Exp. Below 300,000

48
Test-‐bed for attractiveness of zero-‐rated content: Popular if aware/offered Table 10: Does your mobile service provider provide any ‘free’ content through your mobile service plan? (% of mobile subscribers)
Urban Rural Total Myanmar
Wiki-‐zero 1% 0% 1% Facebook-‐zero 8% 4% 6% certain music/songs/ring tones I can listen to/ 4% 2% 3% certain pictures/video I can download/view for free 2% 2% 2% other types of content 2% 3% 2% None 44% 38% 42% Don’t Know 41% 55% 45%
Base : All mobile subscribers
Table 11: Do you use any of these applications/services? (% of those offered free applications/services)
Urban Rural Total
Myanmar
Wiki-‐zero 9% 7% 8%
Facebook-‐zero 54% 36% 49%
Certain music/songs/ring tones I can listen to/ 22% 19% 20%
Certain pictures/video I can download/view for free 6% 2% 5%
Other types of content 12% 23% 14%
None 6% 16% 7%
Base: Those whose service provider offered free content

49
What does “I use the internet” mean in Myanmar? Depends on how the question is asked Table 12: Have you used the Internet through a browser (e.g., UC Browser, Opera, Chrome, Mozilla Firefox, Dolphin, Internet Explorer etc.) on a tab, computer or mobile phone in the last 12 months
Myanmar Total (% 15-‐65 year olds)
Yes 2%
Can't remember when, but I have used one before 0%
No 92%
I haven't heard of internet 6%
Base: All respondents
Table 13: What are you using your phone for? (% of mobile subscribers)
Rural Urban Myanmar Total (% 15-‐65 yr olds)
For calling applications (e.g. Viber, Skype, etc.) 15% 33% 24%
For chat using instant messaging (e.g., Whatsapp, WeChat, Facebook Messenger, Line, etc.)
12% 27% 20%
To use the Facebook application (not through a browser) 10% 24% 17%
For email 2% 10% 16%
To download/use any other mobile application (‘app’) 7% 20% 13%
To watch video content 4% 16% 10%
To use Wikipedia application (not through browser) 2% 5% 3%
Base: All respondents
50
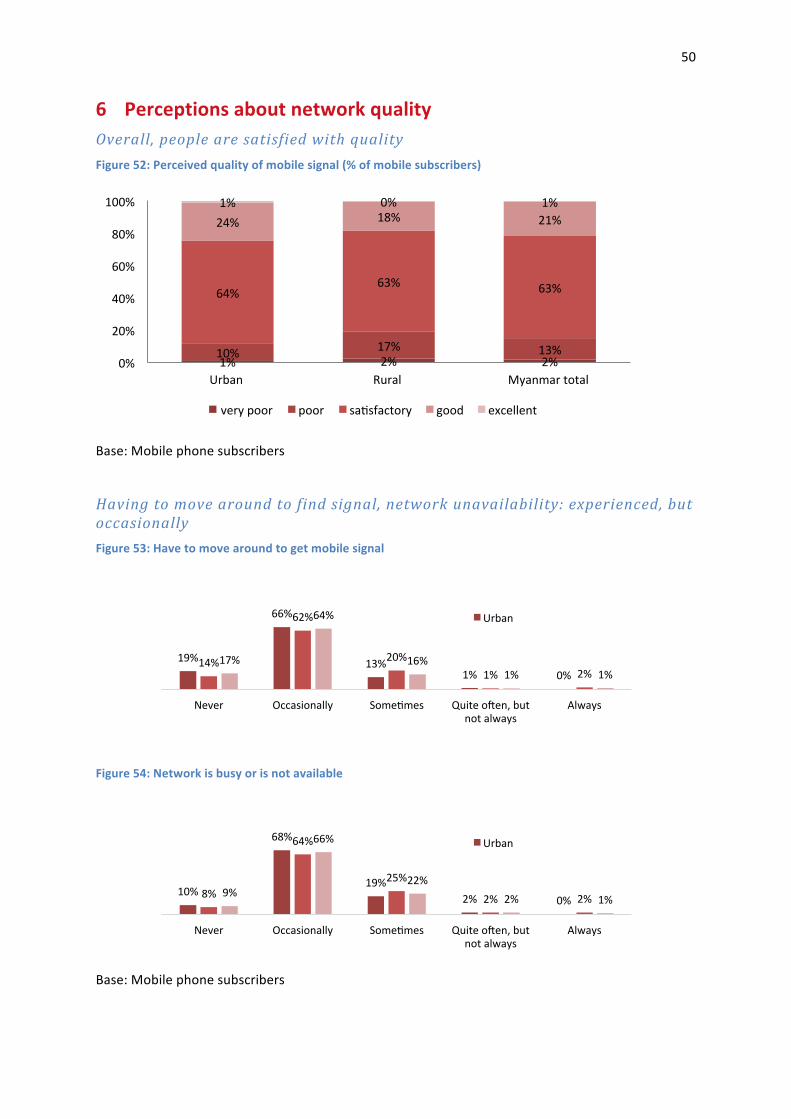
6 Perceptions about network quality Overall, people are satisfied with quality Figure 52: Perceived quality of mobile signal (% of mobile subscribers)
Base: Mobile phone subscribers
Having to move around to find signal, network unavailability: experienced, but occasionally Figure 53: Have to move around to get mobile signal
Figure 54: Network is busy or is not available
Base: Mobile phone subscribers
1% 2% 2% 10% 17% 13%
64% 63% 63%
24% 18% 21% 1% 0% 1%
0%
20%
40%
60%
80%
100%
Urban Rural Myanmar total
very poor poor sausfactory good excellent
19%
66%
13% 1% 0%
14%
62%
20% 1% 2%
17%
64%
16% 1% 1%
Never Occasionally Someumes Quite ozen, but not always
Always
Urban
10%
68%
19% 2% 0% 8%
64%
25%
2% 2% 9%
66%
22% 2% 1%
Never Occasionally Someumes Quite ozen, but not always
Always
Urban

51
. . . as are unclear sound, call drops Figure 55: Sound is not clear on phone calls/cannot hear the other person
Figure 56: Calls are dropped before I’m done
Base: Mobile phone subscribers
50% say calls not successful on first attempt. Problems greater in rural areas Figure 57: Success rate of phone calls on first try
13%
69%
16% 1% 0%
9%
61%
25%
3% 2% 11%
65%
20% 2% 1%
Never Occasionally Someumes Quite ozen, but not always
Always
Urban
15%
68%
15% 2% 0%
11%
62%
24%
2% 2% 13%
65%
19% 2% 1%
Never Occasionally Someumes Quite ozen, but not always
Always
Urban
49%
48%
3%
Yes No Don't know

52
Q: Most of the time, when you try to make a phone call, is it successful on the first try?
Base: Mobile phone subscribers
Yes 56%
No 41%
Don't know 3%
URBAN (% urban mobile subscribers)
Yes 40%
No 56%
Don't know 4%
RURAL (% rural mobile subscribers)
53
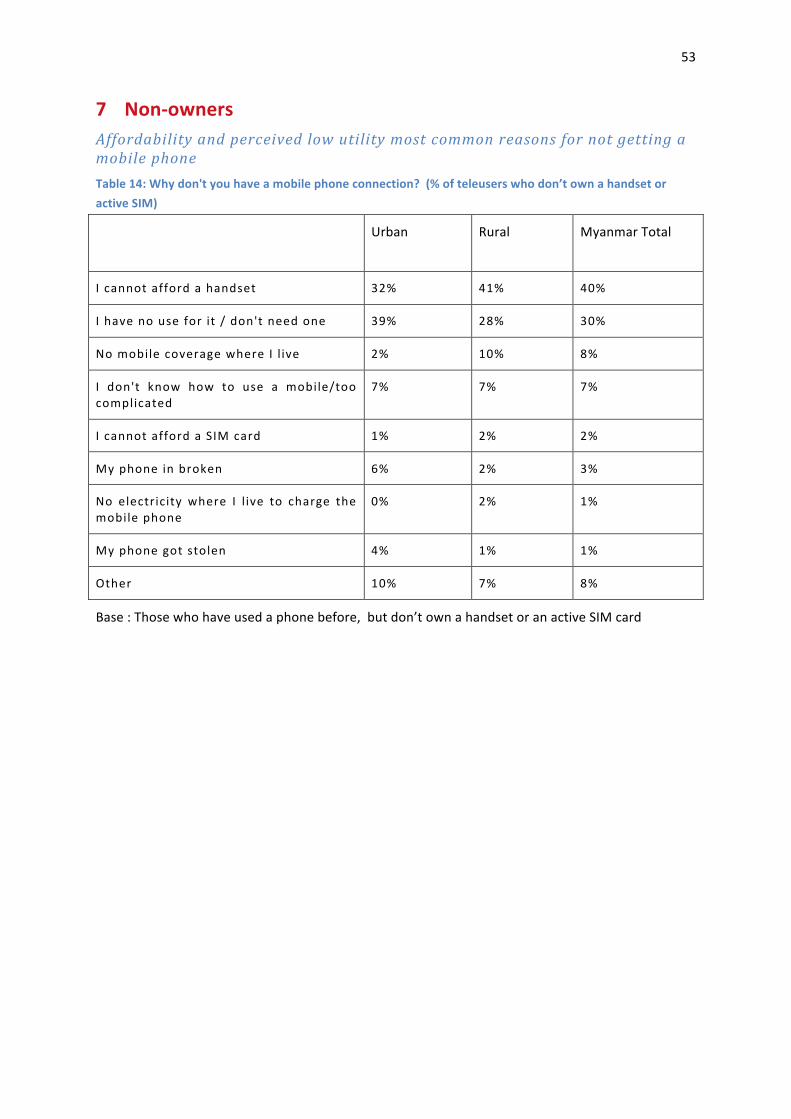
7 Non-‐owners Affordability and perceived low utility most common reasons for not getting a mobile phone Table 14: Why don't you have a mobile phone connection? (% of teleusers who don’t own a handset or active SIM)
Urban Rural Myanmar Total
I cannot afford a handset 32% 41% 40%
I have no use for it / don't need one 39% 28% 30%
No mobile coverage where I l ive 2% 10% 8%
I don't know how to use a mobile/too complicated
7% 7% 7%
I cannot afford a SIM card 1% 2% 2%
My phone in broken 6% 2% 3%
No electricity where I l ive to charge the mobile phone
0% 2% 1%
My phone got stolen 4% 1% 1%
Other 10% 7% 8%
Base : Those who have used a phone before, but don’t own a handset or an active SIM card
54
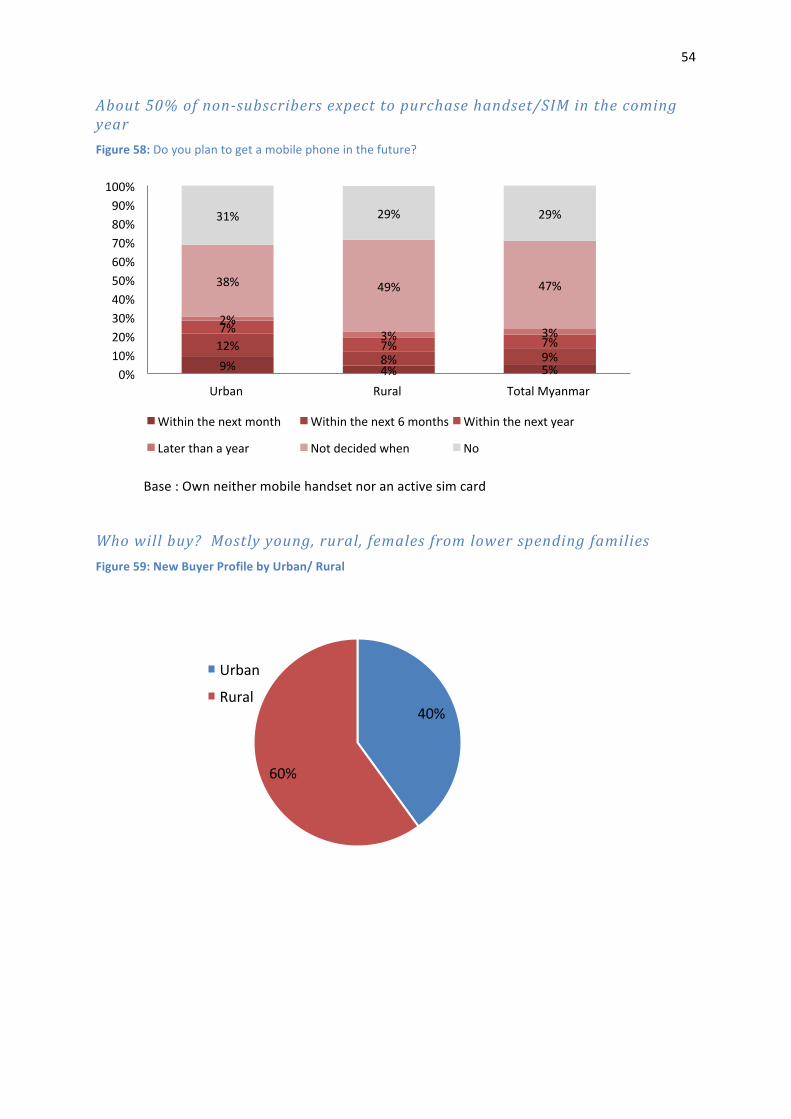
About 50% of non-‐subscribers expect to purchase handset/SIM in the coming year Figure 58: Do you plan to get a mobile phone in the future?
Base : Own neither mobile handset nor an active sim card
Who will buy? Mostly young, rural, females from lower spending families Figure 59: New Buyer Profile by Urban/ Rural
9% 4% 5%
12% 8% 9%
7% 7% 7%
2% 3% 3%
38% 49% 47%
31% 29% 29%
0% 10% 20% 30% 40% 50% 60% 70% 80% 90% 100%
Urban Rural Total Myanmar
Within the next month Within the next 6 months Within the next year
Later than a year Not decided when No
40%
60%
Urban
Rural

55
43%
57%
Male
Female
26%
22% 26%
16%
10% 15-‐24years
25-‐34years
35-‐44years
45-‐54years
55-‐65years
Figure 60: New Buyer Profile by Gender
Figure 61: New Buyer Profile by Household Spending
Figure 62: New Buyer Profile by Age
Base : Those who are willing to buy a mobile phone within a year
63%
37% Lower Spending household
Higher Spending household

56
8 Information Needs Most need to communicate with those outside their town/village. Subscribers more frequent communicators Figure 63: Frequency of communication with people outside of own town/village (% of 15-‐65 year olds)
2% 6% 3% 6%
23%
13% 13%
23%
17% 11%
13%
12%
37%
24%
32%
22%
9%
17%
9% 2% 7%
0%
10%
20%
30%
40%
50%
60%
70%
80%
90%
100%
Non-‐subscriber Mobile subscriber Myanmar total
Many umes in a day Daily Weekly
Monthly Less than once a month Never
Don’t know

57
Most communicate outside the town/village by in-‐person visits or phone calls; in-‐person visits more common among non-‐subscribers Figure 64: How respondent generally communicates with others outside their town/village (% of those that communicate with people outside town/village)
Base: All respondents
Communication in an emergency: mobiles substitute for physical travel Figure 65: How respondent would communicate an urgent message to someone outside of town/village (% of 15-‐65 year olds)
Base: All respondents
54%
22%
42%
55%
92%
69%
12% 9% 11%
0% 10% 20% 30% 40% 50% 60% 70% 80% 90%
100%
Non-‐Subscriber Subscriber Myanmar total
In-‐person visit Phone calls Other Methods
29%
6% 20%
3%
1%
2%
38% 87% 57%
14%
5%
10% 10%
0% 6%
6% 1% 4%
0%
10%
20%
30%
40%
50%
60%
70%
80%
90%
100%
Non-‐subscriber Mobile subscriber Myanmar total
Go there and tell them in person Send a message through someone else
Call them via mobile phone Call them via landline
Ask someone else to call them Wait unul you met them next to tell them
58
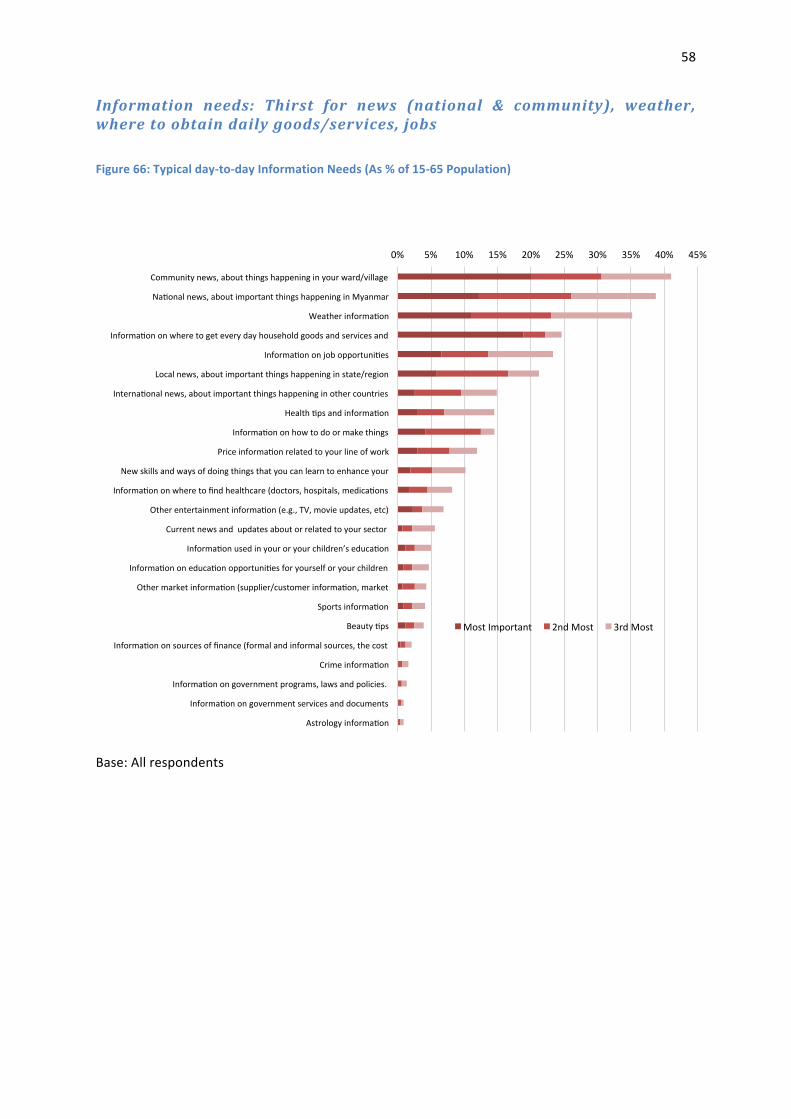
Information needs: Thirst for news (national & community), weather, where to obtain daily goods/services, jobs Figure 66: Typical day-‐to-‐day Information Needs (As % of 15-‐65 Population)
Base: All respondents
0% 5% 10% 15% 20% 25% 30% 35% 40% 45%
Community news, about things happening in your ward/village
Nauonal news, about important things happening in Myanmar
Weather informauon
Informauon on where to get every day household goods and services and
Informauon on job opportuniues
Local news, about important things happening in state/region
Internauonal news, about important things happening in other countries
Health ups and informauon
Informauon on how to do or make things
Price informauon related to your line of work
New skills and ways of doing things that you can learn to enhance your
Informauon on where to find healthcare (doctors, hospitals, medicauons
Other entertainment informauon (e.g., TV, movie updates, etc)
Current news and updates about or related to your sector
Informauon used in your or your children’s educauon
Informauon on educauon opportuniues for yourself or your children
Other market informauon (supplier/customer informauon, market
Sports informauon
Beauty ups
Informauon on sources of finance (formal and informal sources, the cost
Crime informauon
Informauon on government programs, laws and policies.
Informauon on government services and documents
Astrology informauon
Most Important 2nd Most 3rd Most

59
Urban and rural information needs compared Figure 67: Information needs of Myanmar
Base: All respondents
Friends, family and neighbors are main information sources today Figure 68: Information Sources
Q: Who do you usually obtain that kind of information? Base : All respondents
0% 10% 20% 30% 40% 50% 60% 70% 80%
Friends/family
Neighbor
Mass media (Radio, TV, Newspapers,
Work/business contacts/colleagues
Other (please specify)
Quarter/ward/village administrator
Teachers/school
Hospitals/clinics
Shop keepers/service providers
Urban
Rural
Total Mayanmar
Rural Myanmar Urban Myanmar
60
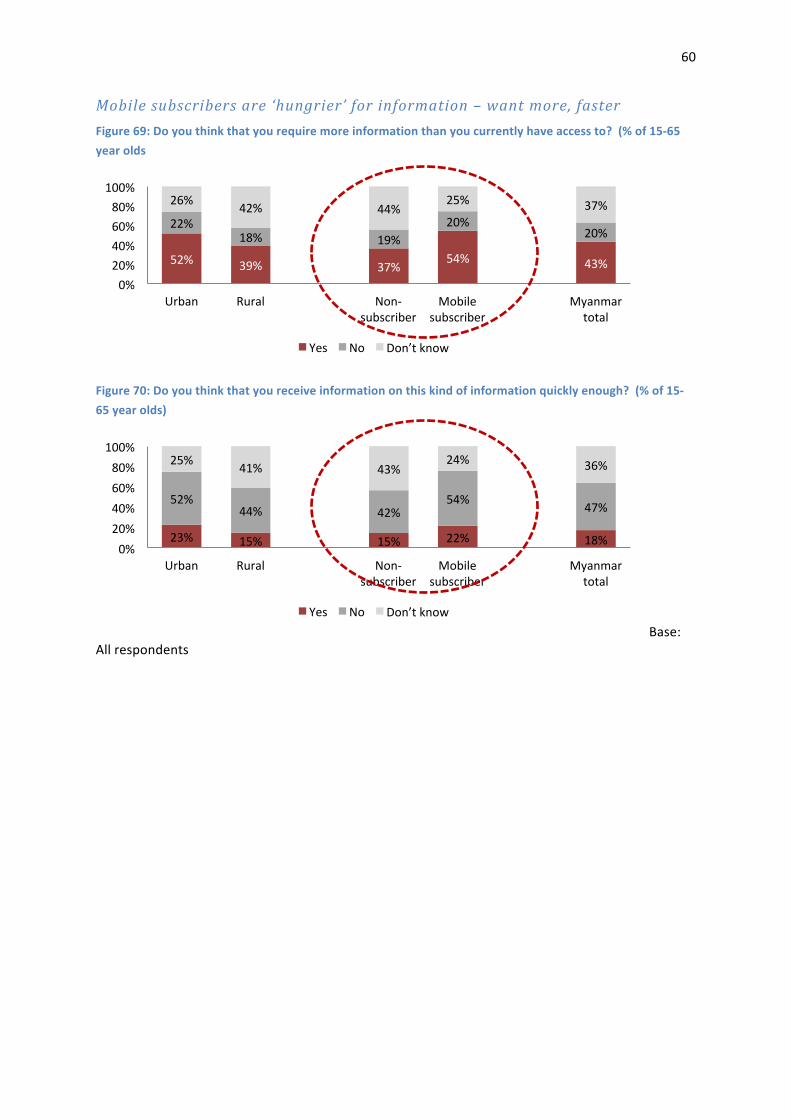
Mobile subscribers are ‘hungrier’ for information – want more, faster Figure 69: Do you think that you require more information than you currently have access to? (% of 15-‐65 year olds
Figure 70: Do you think that you receive information on this kind of information quickly enough? (% of 15-‐65 year olds)
Base: All respondents
52% 39% 37% 54% 43%
22% 18% 19%
20% 20%
26% 42% 44% 25% 37%
0% 20% 40% 60% 80% 100%
Urban Rural Non-‐subscriber
Mobile subscriber
Myanmar total
Yes No Don’t know
23% 15% 15% 22% 18%
52% 44% 42%
54% 47%
25% 41% 43% 24% 36%
0% 20% 40% 60% 80% 100%
Urban Rural Non-‐subscriber
Mobile subscriber
Myanmar total
Yes No Don’t know

61
Ward/village leaders use phones as the second mode of disseminating information Figure 71: How Ward/Village leaders disseminate information through the community (% of ward/village leaders surveyed)
Table 15: How Ward/Village leaders disseminate information through the community (% of ward/village leaders surveyed)
Phone ownership among Ward/Village leaders (%)
Landline Official 8.3
Personal 11.4
Mobile Official 9.6
Personal 89.2
Base: Ward/Village representatives
Opportunities to improve: information from superiors/peers still through physical visits Table 16: Opportunities to improve: information from superiors/peers still through physical visits
Urban % Rural % Total %
Yes, have sufficient information and resources (e.g., forms) to assist them on the first visit
82% 74% 76%
No, we do not have sufficient information and resources (e.g., forms) to assist them on the first visit
16% 26% 22%
Don't know 2% 1% 1%
60% 29%
25% 19%
16% 14%
10% 1% 3%
0% 10% 20% 30% 40% 50% 60% 70%
Megaphone/Public Address System Phone calls
Individual hand delivered messages Public Meeungs
Public nouce boards Face-‐to-‐face meeungs/appointments
By way of community groups (eg -‐ farmer Post
Other

62
Base : Ward/Village representatives
Mode of Communication %
Go to (visit) higher relevant government office/department 28.9
Go to (visit) another ward/village tract administrator (same level) 22.0
Contact via mobile phone higher relevant government office/department 20.6
Contact via mobile phone another ward/village tract administrator (same level) 13.4
Contact via phone higher relevant government office/department 7.6
Other 7.6

63
9 Perceived Benefits Overall low perceptions; greatest benefit seen on social and family relations/relationships Figure 72: Perceived benefits of mobile use and access (mean response) 1=No change 5=Improved greatly
Base: All respondents
Higher-‐expenditure group sees greater benefits than lower group Figure 73: Perceived benefits of mobile phones use and access (mean response) 1=No Change 5=Improved greatly
Q: To what extent has your usage and access of a mobile improved the following, if at all? This can include mobile use through voice or data, and need not have been your own mobile.
Base: All Respondents
1 1.5 2 2.5 3 3.5 4 4.5 5
Your economic/financial status or well being
Your level of knowledge and skills
Your social and familial relauons and relauonships
Your emouonal well-‐being and happiness
-‐ 0.5 1.0 1.5 2.0 2.5 3.0 3.5 4.0 4.5 5.0
Your economic/financial status or well being
Your level of knowledge and skills
Your social and familial relauons and relauonships
Your emouonal well-‐being and happiness
Exp.Below 300,000 Exp.Above 300,000

64
Mobile subscribers see greater benefits than non-‐subscribers Figure 74: Perceived benefits of mobile phones use and access (mean response) 1=No change 5=Improved greatly
Base: All respondents
Students and job-‐seekers see greater benefits than those who are working Figure 75: Perceived benefits of mobile phones use and access (mean response) 1=No change 5=Improved greatly
1.00 1.50 2.00 2.50 3.00 3.50 4.00 4.50 5.00
Your economic/financial status or well being
Your level of knowledge and skills
Your social and familial relauons and relauonships
Your emouonal well-‐being and happiness
Non-‐subscriber Subscriber

65
Base: All respondents
1 1.5 2 2.5 3 3.5 4 4.5 5
Your economic/financial status or well being
Your level of knowledge and skills
Your social and familial relauons and relauonships
Your emouonal well-‐being and happiness
Working Not working, but seeking job
Not working, not seeking job Full ume student
Full-‐ume housewife (unpaid housework)
66
Annex 1: Survey and Sampling Methodology
This section summarizes the methodology used for LIRNEasia’s Baseline Survey on Information, Knowledge and Communications Technology Needs and Uses in Myanmar. The fieldwork was carried out in February-‐March and May 2015. The objectives of the research are:
1. To understand current national ICT use and penetration levels 2. To establish a baseline for a future evaluation of the socio-‐economic impacts of mobiles in
the country.
1.0 Data collection
Two main surveys – a household survey and cluster survey were conducted. The household survey covers information on characteristics of household members; housing and living status; household expenditure and income; respondent’s profile; ICT use, information sources, needs and access; respondent’s media habits; and perceived Impact of ICTs. The household head (or a suitable alternative) was first interviewed on household characteristics and then one household member between ages 15-‐65 was randomly selected (using the Kish grid) to be interviewed on individual characteristics and habits.
The cluster survey was conducted in each ward (urban) and village tract (rural) where household surveys were conducted and consisted of three main parts – village/ward administrator interview, mobile network data collection and grocery price collection. Village/ward administrator survey covers general information of ward/village and selected cluster, access to town, mobile network coverage, administrator duties/provision of government services, livelihood, access to markets, schools and health facilities. The mobile network data was collected through a mobile app, Open Signal, and included signal strength and data network quality metrics. The price survey was aimed at collecting the prices of a predetermined group of essential grocery items at the cluster level.
The CAPI system hosted by World Bank Survey Solution 3.2 server is used in this survey. ASUS Fone Pad 7 with Dual SIM tablets were the devices used during the interview to run the Survey Solution Interviewer Application as well as the Open Signal app for mobile signal testing. Huawei 8816 D dual SIM handsets were also used for the Open Signal app for mobile signal testing. The task of mobile signal testing was assigned to field supervisors.
It should also be noted that field teams for the Chin, Rakhine and Shan States were formed with native speakers for easier communication. Local interpreters were hired for a few minority languages such as Pa-‐Oh, Larhu, Ahkar and Chinese. There are about 300 interviews which were conducted in local languages. Among them, less than half of the interviews were carried out with the assistance of local interpreters.
Fieldwork was conducted in local language/dialects by a total field staff (including supervisors) of 90 by Third Eye Co on behalf of LIRNEasia in February, March and May 2015.
2.0 Sample design
The sample was designed to represent all accessible areas of Myanmar, both urban and rural with no more than ±2.5% margin of error. The township was used as the Primary Sampling Unit (PSU). There are altogether 330 townships in Myanmar. 32 townships from Kachin State, Kayah State, Kayin State, Chin State, Sagaing Region, Rakhine State and Yangon Region are excluded from the PSU sampling frame due to inaccessibility and security concerns. The excluded townships contain 3% of
67
total households, or 3.5% of population living in conventional households.2 Excluded townships are listed in Annex 1.
2.1 Stratification
A stratified four stage PPS cluster sampling design was used.
The main stratification was based on the population size of the cities/townships. There are three main strata – Big cities, Other Major Cities and Smaller Townships. Big Cities are Yangon, Mandalay and Nay Pyi Taw, each of which have a population that is greater than one million people. Other Major Cities are described as townships with populations of 0.25 million to 1 million. A few townships with smaller populations are also allocated under this stratum based on their level of importance, especially considering their administrative structure and geographic coverage. The remaining townships of small population sizes are included under Smaller Townships.
Two additional levels of sub strata based on geographic coverage and location of residence as per administrative structure were used. The first level sub strata is the 6 geographic areas which are described as Northern hills, Eastern hills, Middle dry zone, Lower valley, Delta & Long coast. The second level sub stratum is Urban and Rural. Samples are allocated as one third and two thirds as appropriate between urban and rural. See Annex 2 for details.
The township sampling frame was based on the Provisional Results of Population and Housing Census of Myanmar 2014.
2.2 Selection procedure
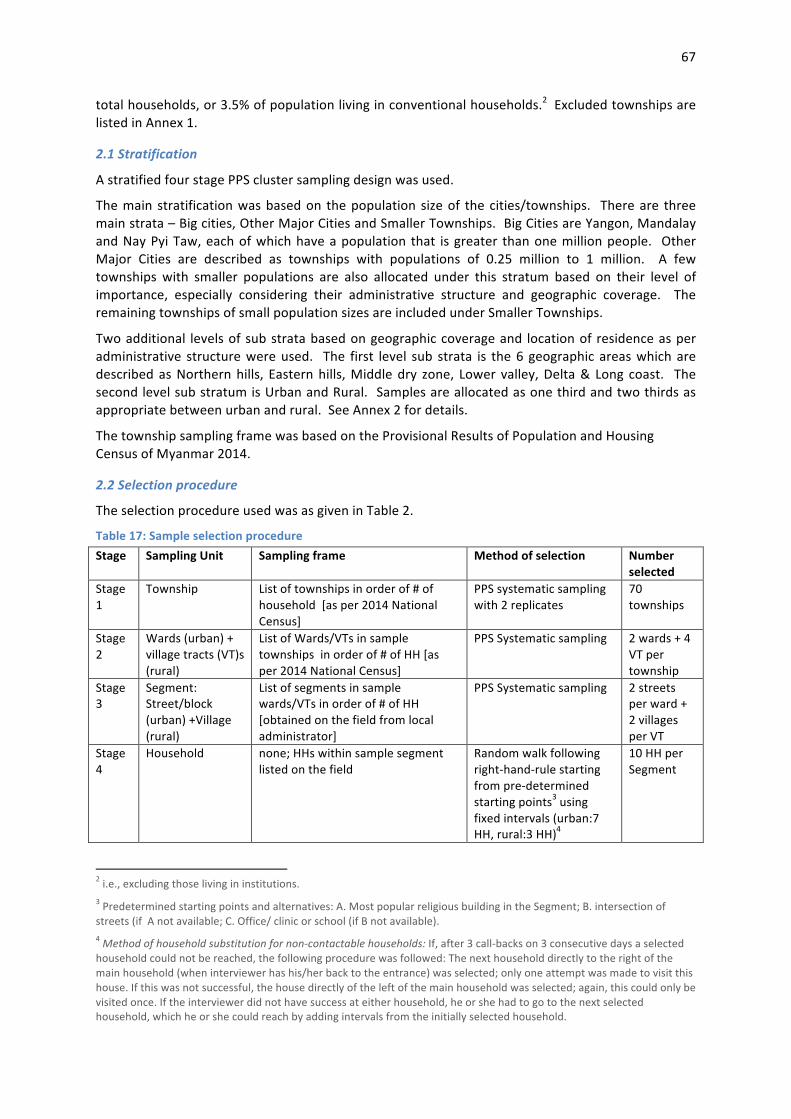
The selection procedure used was as given in Table 2.
Table 17: Sample selection procedure Stage Sampling Unit Sampling frame Method of selection Number
selected Stage 1
Township List of townships in order of # of household [as per 2014 National Census]
PPS systematic sampling with 2 replicates
70 townships
Stage 2
Wards (urban) + village tracts (VT)s (rural)
List of Wards/VTs in sample townships in order of # of HH [as per 2014 National Census]
PPS Systematic sampling 2 wards + 4 VT per township
Stage 3
Segment: Street/block (urban) +Village (rural)
List of segments in sample wards/VTs in order of # of HH [obtained on the field from local administrator]
PPS Systematic sampling 2 streets per ward + 2 villages per VT
Stage 4
Household none; HHs within sample segment listed on the field
Random walk following right-‐hand-‐rule starting from pre-‐determined starting points3 using fixed intervals (urban:7 HH, rural:3 HH)4
10 HH per Segment
2 i.e., excluding those living in institutions. 3 Predetermined starting points and alternatives: A. Most popular religious building in the Segment; B. intersection of streets (if A not available; C. Office/ clinic or school (if B not available). 4 Method of household substitution for non-‐contactable households: If, after 3 call-‐backs on 3 consecutive days a selected household could not be reached, the following procedure was followed: The next household directly to the right of the main household (when interviewer has his/her back to the entrance) was selected; only one attempt was made to visit this house. If this was not successful, the house directly of the left of the main household was selected; again, this could only be visited once. If the interviewer did not have success at either household, he or she had to go to the next selected household, which he or she could reach by adding intervals from the initially selected household.

68
After Household data collected from HH head
Individual List of HH members aged 15-‐65 in order of age
Kish grid (random number chart)
1 individual per HH
2.3 Determination of Sample Sizes:
2.3.1 Household sample size
At the 95% confidence interval, the national level minimum household sample required for a proportion with +/-‐ 2.5% margin of error using multi-‐stage sampling procedure would be:
𝑛 =4𝑠!
𝑑!∗ 𝑑𝑒𝑓𝑓
where n = number of sample required for the survey d = margin of error (2.5% of proportion) s2 = variance of the sample proportion (here we set the proportion at 0.5 so that the
variance s2 (0.25) is at the maximum) deff = Design Effect (1.3)
Therefore, the minimum household sample required at the national level would be !∗!.!"!
(!.! ! !.!"#)!∗ 1.3
= 8,320.
Based on above proposed sampling procedure and minimum required sample size, allocated numbers of sample household per city/ township by urban and rural are presented in Table 3.
Table 18: Allocated number of sample households
Main stra-‐tum
Geographic area
Sample city/ townships Total Town-‐ships
No. of Sample
Townships
Number of Sample Households
Urban Rural Total
No. of townships represented by survey 298 70 3,680 4,720 8,400
1. Big Cities (16.3% of represented households) 46 16 1,520 400 1920
4. Lower Valley 1 Yangon 31 8 960 -‐ 960
3. Middle Dry Zone 2 Mandalay 7 4 320 160 480
3. Middle Dry Zone 3 Naypyitaw 8 4 240 240 480
2. Other Major Cities (29.5% of represented households) 51 24 960 1920 2880
1. Northern Hills (2.0% of represented households) 4 4 160 320 480
2. Eastern Hills (3.6% of represented households) 7 4 160 320 480
3. Middle Dry Zone (7.6% of represented households) 13 4 160 320 480
4. Lower Valley (5.0% of represented households) 8 4 160 320 480
5. Delta (7.0% of represented households) 11 4 160 320 480
6. Long Coast (4.3% of represented households) 8 4 160 320 480
3. Smaller Townships (54.2% of represented households) 201 30 1,200 2,400 3,600
1. Northern Hills (5.7% of represented households) 30 4 160 320 480
2. Eastern Hills (9.5% of represented households) 48 6 240 480 720
3. Middle Dry Zone (13.8% of represented households) 44 6 240 480 720
4. Lower Valley (9.4% of represented households) 30 6 240 480 720
5. Delta (6.3% of represented households) 18 4 160 320 480

69
Main stra-‐tum
Geographic area
Sample city/ townships Total Town-‐ships
No. of Sample
Townships
Number of Sample Households
Urban Rural Total
6. Long Coast (9.6% of represented households) 31 4 160 320 480
2.3.2. Cluster sample size
The household surveys were carried out in a total of 554 wards and villages (‘clusters’); cluster-‐level data was collected as per Table 1 in each of these clusters.
2.4 Weighting of sample according to national census data
The survey focused on two units – household and individual aged 15 to 65 year olds. Therefore, two sampling weights are required for estimation. Weights were calculated based on the Results of Population and Housing Census of Myanmar 2014, as released in May 2015.
Household weights are the inverse of multiplication of sample selection probabilities at the different stages. Selection with replacement is assumed for simplicity for the first stage unit (township) selection though PPS systematic with 2 replicates is employed. It should be noted that household weights are design weights as per sample design. We finally have one household weight for urban and one household weight for rural for each sample township. It is worth to note that household weight should be applied only to the household related variables.
Sampling weights for individual aged 15 to 65 years is derived with application of household weights. City (Yangon, Mandalay and Nay Pyi Taw), gender and age group (Under 5 years, 5 -‐ 14 years, 15 -‐ 24 years, 25 -‐ 34 years, 35 -‐ 44 years, 45 -‐ 54 years, 55 -‐ 65 years and Over 65 years) of respondent are three additional variables to basic strata variables strata, geographic area and urban/rural. First, estimated total population by those six variables in nesting are obtained from household roster information with application of household weights. Second, numbers of respondents selected by Kish Grid procedure for the same criteria are obtained from the respondent profile data. There are altogether 290 (29 for strata X 2 for gender X 5 for age group) different criteria for individual weights. The ratio of “estimated total population” and “number of respondents” for respective criterion is individual weights for aged 15 to 65 year olds respondents.
Table 19: Townships excluded from sampling frame
Township Name Geographical Region 1 Injangyang
Northern Hills
2 Tanai 3 Chipwi 4 Tsawlaw 5 Hpakan 6 Puta-‐O 7 Sumprabum 8 Machanbaw 9 Nawngmun 10 Khaunglanhpu 11 Paletwa 12 Lay Shi 13 Lahe 14 Nanyun 15 Shadaw
Eastern Hills 16 Bawlakhe 17 Mese

70
18 Hpapun 19 Kunlong 20 Laukkaing 21 Konkyan 22 Pangsang 23 Narphan 24 Pangwaun 25 Mongmao 26 Hopang 27 Matman 28 Mongyawng 29 Cocokyun Delta 30 Rathedaung
Long Coast 31 Maungdaw
32 Buthidaung
Figure 76: Map of excluded areas
Excluded
3 Big Cities
Other Major Cities/ Townships
Smaller Townships

71
Sample stratification
Main strata: Population size
Sub-‐ strata 1: Geographic region
Population (%) Northern hills 8.9 Middle dry zone (incl. Mandalay and Nay Pyi Taw) 26.3 Eastern hills 14.4 Lower valley (incl. Yangon) 23.8 Delta 12.9 Long coast 13.7
Sub-‐ strata 2: Urban-‐rural
Population (%) Urban 29.6% Rural 70.4%
Criteria Townships Population (%)
Big cities (Yangon, Mandalay, Nay Pyi Taw) Population >1m 46 15.7
Other major cities/ townships* Population 0.25-‐1m 51 28.4
Smaller townships Population <0.25m 201 52.3
Excluded townships Inaccessible 32 3.6
Based on Provisional Results of 2014 Population & Housing Census of Myanmar *Also includes a few important townships in terms of administration and resources

72
Map of survey locations Figure 77: Overview Map of Survey Locations
Note: Numbers in dots indicate number of surveys conducted in that location.
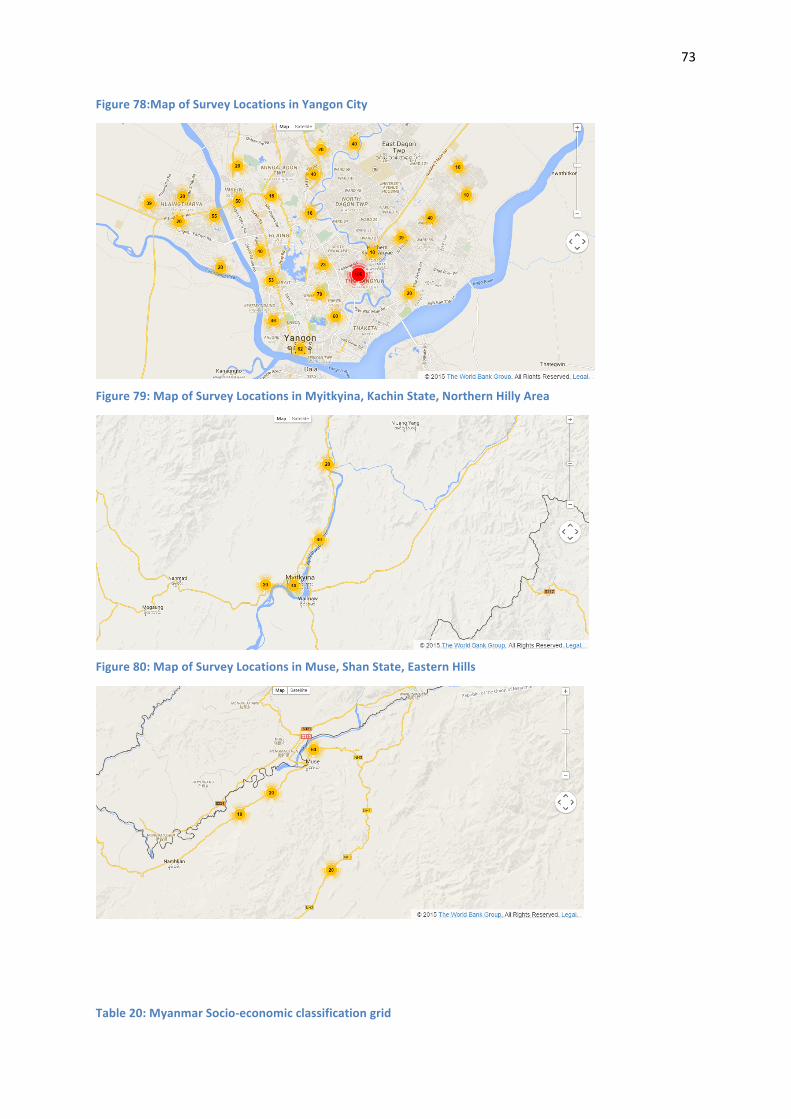
73
Figure 78:Map of Survey Locations in Yangon City
Figure 79: Map of Survey Locations in Myitkyina, Kachin State, Northern Hilly Area
Figure 80: Map of Survey Locations in Muse, Shan State, Eastern Hills
Table 20: Myanmar Socio-‐economic classification grid
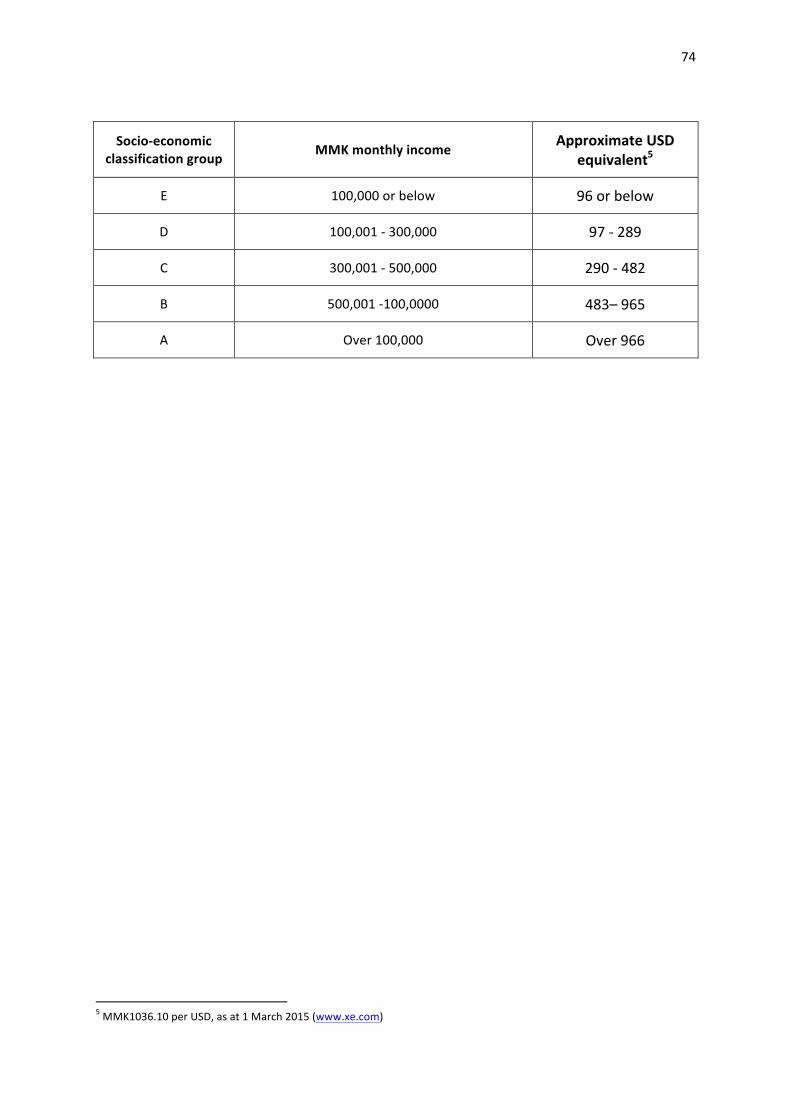
74
Socio-‐economic classification group MMK monthly income Approximate USD
equivalent5
E 100,000 or below 96 or below
D 100,001 -‐ 300,000 97 -‐ 289
C 300,001 -‐ 500,000 290 -‐ 482
B 500,001 -‐100,0000 483– 965
A Over 100,000 Over 966
5 MMK1036.10 per USD, as at 1 March 2015 (www.xe.com)

75
Table 21: State/regionwise sample distribution versus Myanmar population distribution
Population Sample (planned)
State/ Region Total
(millions) Urban
(millions) Rural
(millions) Urban (% of total)
Rural (% of total)
Urban-‐ Sample
Rural-‐ Sample
Total sample
Ayeyawady 6.2 0.9 5.3 14.1% 85.9% 320 640 960
Bago 4.9 1.1 3.8 22.0% 78.0% 320 640 960
Chin 0.5 0.1 0.4 20.9% 79.1% 40 80 120
Kachin 1.6 0.6 1.1 35.9% 64.1% 80 160 240
Kayah 0.3 0.1 0.2 25.3% 74.7% 40 80 120
Kayin 1.5 0.3 1.2 21.9% 78.1% 40 80 120
Magway 3.9 0.6 3.3 15.1% 84.9% 240 480 720
Mandalay 6.1 2.1 4.0 34.8% 65.2% 440 400 840
Mon 2.1 0.6 1.5 27.8% 72.2% 80 160 240
Nay Pyi Taw 1.2 0.4 0.8 32.5% 67.5% 240 240 480
Rakhine 2.1 0.4 1.7 16.9% 83.1% 120 240 360
Sagaing 5.3 0.9 4.4 17.1% 82.9% 280 560 840
Shan 5.8 1.4 4.4 24.0% 76.0% 320 640 960
Tanintharyi 1.4 0.3 1.1 24.0% 76.0% 80 160 240
Yangon 7.4 5.2 2.2 70.1% 29.9% 1,040 160 1,200
Total 50.2 14.9 35.3 29.6% 70.4% 3,680 4,720 8,400

76
Annex 2: Survey Questionnaire -‐ English
“Baseline Survey for Socio-‐economic Impact Evaluation of Mobile Phones in Myanmar”
respondent ID, interview details (date, time, location, etc), GPS location if possible; type (sampled or replacement); SEC [using CWE details] to be determined and recorded; interview languages; interview status [complete, incomplete, discarded],
I. Specifications for location
Details for Contact Specification Code
Name ____________________________________ State/Region _______________________________ |__|__|
Address ____________________________________ Township __________________________________ |__|__|
____________________________________ Urban/Rural -‐ 1. Urban 2. Rural |__|
____________________________________ Town/Sub-‐township _________________________ |__|
____________________________________ Ward/Village Tract __________________________ |__|__|__|
____________________________________ Street/Block*Cluster/Village___________________ |__|__|
Phone No. ____________________________________ Sample household number ____________________ |__|__|
This is 1. Initial sample hhd 2. Replaced hhd |__|
Household head is a person making the main decisions in the household. Please contact him/her for interview.
-‐ If not available, then housewife or the person second most knowledgeable about the household members.
-‐ If not available , then house should be revisited at a later time (the time of day being different to the time that the first visit is made; ideally, interviewer needs to inquire from other members at what time the relevant person will be home).
Screening Questions
sc1 Are you the household head? By household head, I mean the person who makes the main/most important decisions in the house.
Yes. .............................................................................................................1 >> c101 No ................................................................................................................2 >> Ask next question

77
sc2 Are you the spouse of the household head?
Yes. .............................................................................................................1 >> c101 No ................................................................................................................2
sc3 Are you able to accurately tell me about the details (age, educational level, occupation, earnings, etc) of the other household members?
Yes. .............................................................................................................1 >> c101 No ................................................................................................................2 >> Thank and terminate. Ask to speak to
household head, if not available, spouse of household head; if not available, find out when either of them will be available and revisit at that time.
sc4 Record reason WHY household head not available/spoken to
Not available ...............................................................................................1 Refused .......................................................................................................2 Other ______________________________ ..............................................3
1. Characteristics of household members
c100 Interviewer: Record number of attempts that have been made to meet with this household respondent [Record number]
No. of attempts that have been made ________________
(To be asked from HOUSEHOLD HEAD OR SPOUSE OF HOUSEHOLD HEAD OR SUITABLE REPRESENTATIVE of the HOUSEHOLD)
c101 How many people in total live in this household? This includes one person (i.e. single household) or a group of two or more (i.e. a multi-‐person household) persons living together who make common provisions for food and other essentials for living [Record number]
No. of household members ________________
I will now ask you some information about the people living in this household, as mentioned earlier. Please tell me the names and following details all the people who live in this house, starting with the head of the household. As mentioned earlier, by household head, I mean the person who makes the main/most important decisions in the house.
9.1.1 Ask for each household member (in Roster)
c102a Name of the household member ______________________________
c102b Record whether [name] is current household respondent.
Current respondent ......................................................................................1 Not current respondent ................................................................................0
c102c Gender of [name]

78
Male. ...........................................................................................................1 Female .........................................................................................................2
c102d1 What’s the age of [Name] at last birthday?
Put ‘0’ if [name] is infant and put ‘95’ if [name] is 95 years or older.
________________ years
c102d2 Ask if the child is under 1 year. What’s the age of [Child’s Name] in months?
Put ‘0’ if age of [child’s name] under 1 month.
________________ months
c103 What is the relationship of [Name] with the HH head?
1. Household head .......................................................................................1 2. Spouse .....................................................................................................2 3. Children ...................................................................................................3 4. Son-in-law /Daughter-in-law ..................................................................4 5. Grandchild/ Great grandchild .................................................................5 6. Parents / Parents-in-law ..........................................................................6 7. Sibling .....................................................................................................7 8. Grandfather/ Grandmother ......................................................................8 9. Others – Relative .....................................................................................9 10. Adopted son/daughter ...........................................................................10 11. Others – Non-relative ...........................................................................11
Ask for those aged 14 years and above
c104 What is the marital status of [name]?
Single ..........................................................................................................1 Married ........................................................................................................2 Separated/ Divorced ....................................................................................3 Widowed .....................................................................................................4 Other ...........................................................................................................5
Ask for those aged 5 years and above
c105a Has [Name] ever had any years of schooling?
Yes ..............................................................................................................1 No ................................................................................................................2 >> c106a
c105b Is [Name] studying full time or part time now?
Yes, full time ...............................................................................................1 Yes, part time ..............................................................................................2 No, not at all ................................................................................................3
c105c What is the highest exam for class/ degree that [Name] has passed?
Grade 1 (Kindergarten, Pre-primary) ..........................................................1 Grade 2 (1st std., Primary) ...........................................................................2 Grade 3 (2nd std., Primary) ..........................................................................3 Grade 4 (3rd std., Primary) ..........................................................................4 Grade 5 (4th std., Primary) ...........................................................................5 Grade 6 (5th std., Middle school) ................................................................6 Grade 7 (6th std., Middle school) ................................................................7 Grade 8 (7th std., Middle school) ................................................................8
79
Grade 9 (8th std., Middle school) ................................................................9 Grade 10 (9th std., High school) ..................................................................10 Grade 11 (10th std., High school) ................................................................11 University/College classes (Tertiary) .........................................................12 Vocational trainings ....................................................................................13 Diploma (Tertiary) ......................................................................................14 Bachelor’s Degree (BSc/ BA) .....................................................................20 Graduate of an institute/ post graduate diploma ........................................30 Master’s/ PhD .............................................................................................40
c106a What is main activity of [name] during the last 6 months?
Full time political/ social related high rankers and associates ....................10 Employer/ Business owner with employed person
- farmer/ fisherman (agri./ livestock/ fishery/ forestry) ..........................21 - with 1 – 4 employees in non-agriculture ..............................................22 - with 5 – 10 employees in non-agriculture ............................................23 - with more than 10 employees in non-agriculture .................................24
Self-employed persons (Not employee and no employed person) - farmer/ fisherman (agri./ livestock/ fishery/ forestry) ..........................31 - in trading (wholesale/ retail & repairs) ................................................32 - with respect to food ..............................................................................33 - in services and others ...........................................................................34
Government employee - equivalent to professional/ officer level and higher ranks ...................41 - equivalent to deputy officer and lower ranks .......................................42
Employee of company/ private business/ ngo - equivalent to professional/ officer level and higher ranks ...................51 - equivalent to deputy officer and lower ranks .......................................52
Casual worker (Work any job, no fixed employer) - related to agriculture/ livestock/ fishery & forestry .............................61 - not related to agriculture/ livestock/ fishery & forestry .......................62
Unpaid family workers - related to agriculture/ livestock/ fishery & forestry .............................71 - not related to agriculture/ livestock/ fishery & forestry .......................72
Fulltime housewife (Unpaid housework) ....................................................81 >> t106d Full-time learning (Student) ........................................................................82 >> t106d Sought job, got no job .................................................................................91 >> t106d Did not work and didn’t seek job ................................................................92 >> t107b Full-time devotion in religion .....................................................................93 >> t107b Not able to work (Unhealthy/ Disabled) .....................................................94 >> t107b Old aged and don’t work (Pension/ supports/ allowance) ..........................95 >> t107b
c106b How do you earn mainly? Is it by profit/ daily wages/ contract earning/ salary?
Daily wage ..................................................................................................1 >> continue Contract earning/ piece rate ........................................................................2 >> t106d Weekly/ fortnightly salary ..........................................................................3 >> t106d Monthly salary ............................................................................................4 >> t106d Profit/ dividends/ interests ..........................................................................5 >> t106d Other ______________________________ ..............................................6 >> t106d In kind/ no earning in cash ..........................................................................7 >> t106d
c106c How much do you usually earn for a full day’s work?
_____________ Kyats
t106d Apart from this main activity, did [Name] work any (other) job in the past 6 months?
Yes ..............................................................................................................1 No ................................................................................................................2
Ask for those who might be economically active in the past 6 months (c106a <= 62)
c107a Is [Name] main income earner (the person who makes the highest contribution towards household expenses) in the household?

80
Yes ..............................................................................................................1 No ................................................................................................................2
t107b Is [Name] housewife (the person who is mainly responsible for household chores – cooking, buying food for household consumption, washing clothes and housekeeping, but not domestic servants) in the household?
Yes ..............................................................................................................1 No ................................................................................................................2
2. House and living status
9.1.2 Type of house and ownership c201a Record the type of house.
Condominium .............................................................................................10 Flat/apartment with parquet/tongue-and-groove plank flooring .................21 Common flat/apartment ..............................................................................22 Highly renovated brick-house ....................................................................31 Common brick-house/ Brick nogging house ..............................................32 Semi brick-house/ Semi brick nogging house ............................................40 House with plank floor and wall/ wooden house ........................................50 Wooden pillar and bamboo-mat wall house (last min 4 years) ..................60 Safe hut built with rudimentary materials (last min 2 years) ......................70 Unsafe hut lasting 1 year .............................................................................80 Others (Specify _________________) .......................................................90
t201b How many rooms are there in this house that your household occupy for living, including bedrooms, living rooms, and rooms used for household business? (Do not count toilets, kitchens, balconies and corridors.)
_________ rooms
t201c Is this house _ owned by your household or collectively owned or staff housing or rented?
Owned by our household ............................................................................1 Free of charge (live at parents/ relatives/ friend’s house) ...........................2 Rented .........................................................................................................3 Housing for Government employees .........................................................4 Housing provided by private business/industry ..........................................5 Others (Specify _________________) .......................................................6
9.1.3 Electricity c202a Does your household have access to government electric power supply or other electric power supply?
Yes, has access to government electric power supply ................................1 Yes, has access to other electric power supply ...........................................2 Yes, both .....................................................................................................3 No ................................................................................................................4 >> c203a
c202b Let me know if the source of electricity is owned by this household or neighbor’s or rented?
Household ...................................................................................................1 Neighbor .....................................................................................................2 Rented .........................................................................................................3
c202c How many hours did this household have electricity in the past 24 hours?
_________ hours in the past 24 hours
9.1.4 Lighting c203a What is the main source of lighting for your household in the last month? What other sources does your household also use?
(Record 1 for main source and following numbers for other sources. )
Government owned electric power supply .................................................1 Commercialized privately owned electric power/generator .......................2 Own generator .............................................................................................3 Solar power (Solar panel) ...........................................................................4 Car battery ...................................................................................................5

81
Rechargeable battery ...................................................................................6 Kerosene, diesel ..........................................................................................7 Candle ........................................................................................................8 Others (Specify _________________) .......................................................9
9.1.5 Fuel for cooking t204a What is the main fuel for your household cooking in the last month? What other fuel does your household also used? (Record 1
for main source and following numbers for other sources. )
Government owned electric power supply .................................................1 Commercialized privately owned electric power/generator .......................2 Gas ..............................................................................................................3 Kerosene, diesel ..........................................................................................4 Bio-gas ........................................................................................................5 Charcoal/ Briquette ....................................................................................6 Wood/ Firewood ........................................................................................7 Coal ............................................................................................................8 Others (Specify _________________) .......................................................9
9.1.6 Drinking water t205a What was the main source of drinking water for your household in the last month?
Purchase bottled water ................................................................................1 Tap water (City Development Committee) .................................................2 Artesian well ..............................................................................................3 Tap water for public use .............................................................................4 Well (with brick inside wall) ......................................................................5 Well (without brick inside wall) ................................................................6 Rain water/ piped water from spring/ mountain water source ....................7 Lake water/dam water .................................................................................8 River water/stream water/canal water .........................................................9 Buy water (from private/ public supplier) ..................................................10 Others (Specify _________________) .......................................................11
9.1.7 Bathroom and toilet/latrine t206a Do you have bathroom(s) in your house? If "Yes" - How many bathrooms? (If "No" record "Zero (0)")
No. of bathrooms: _________
t206b1 Do you have toilet/latrine in your house? If "Yes" - How many toilets/latrines? (If "No" record "Zero (0)")
No. of toilets/ latrines: _________
t206b2 What type of toilet/latrine do you mainly use in your home?
Sitting type flush toilet ................................................................................1 Squatting type flush toilet with a ceramic/cement bowl .............................2 Other hand-flush toilet/ safe latrine ............................................................3 Open-pit/open wooden box type latrine ......................................................4 Latrine without a pit ...................................................................................5 Others (Specify _________________) .......................................................6
l207a How long does it take you to access the following places from your residence in terms of time by walking)? (Record in minutes. If “Don’t know”, write down 9996)
No. of minutes
Nearest grocery/convenience store .........................................................[ ____ ]
Nearest place to access public transport .................................................[ ____ ]
Nearest medical facility ..........................................................................[ ____ ]
Nearest market ........................................................................................[ ____ ]
Nearest post office ..................................................................................[ ____ ]
Nearest bank branch ...............................................................................[ ____ ]
Nearest place to top-up your mobile phone/purchase
airtime (IF APPLICABLE) ...............................................................[ ____ ]

82
9.1.8 Household goods t208a Do your household own working/ functioning [item]? If "Yes", how many of working/ functioning pieces does your household
own? (Ask for each item. If "No", record "Zero (0)".) No. of items owned
1. Furniture and essentials Teak/ wooden settee set ..........................................................................11 [ ____ ] Sofa settee set .........................................................................................12 [ ____ ] Wardrobe ...............................................................................................13 [ ____ ] Teak, pressed-board, iron bed ...............................................................14 [ ____ ]
2. TV/Video CRT TV ..................................................................................................21 [ ____ ] LCD/ LED TV (up to 25 in) ...................................................................22 [ ____ ] LCD/ LED TV (26 in and above) ...........................................................23 [ ____ ] CD/ DVD/ EVD/ Blue Rays Disc Player ...............................................24 [ ____ ]
3. Pay TV channels Myawaddy digital receiver .....................................................................31 [ ____ ] 4 HD/ 5 Network ....................................................................................32 [ ____ ] Sky Net ...................................................................................................33 [ ____ ] Other international satellite TV receiver ................................................39 [ ____ ]
4. Other A/V instruments Home Theatre System ............................................................................41 [ ____ ] Radio-Cassette player/Radio ..................................................................42 [ ____ ] Camera (Any type) .................................................................................43 [ ____ ]
5. Computer and ICT (Functioning items) Desktop computer ..................................................................................51 [ ____ ] Notebook, laptop computer ...................................................................52 [ ____ ] Tablet computer ......................................................................................53 [ ____ ] Mobile phone (no. of handsets in household) ........................................54 [ ____ ] Line phone ..............................................................................................55 [ ____ ] Internet connection (excl. via mobile phone) .........................................56 [ ____ ] Printer .....................................................................................................57 [ ____ ] Active SIM card .....................................................................................58 [ ____ ]
6. Other household goods Electric iron ............................................................................................61 [ ____ ] Electric fan .............................................................................................62 [ ____ ] Air conditioner .......................................................................................63 [ ____ ] Washing machine ...................................................................................64 [ ____ ] Refrigerator ...........................................................................................65 [ ____ ]
7. Kitchen electric utensils Rice cooker ............................................................................................71 [ ____ ] Electric pot/electric pan ..........................................................................72 [ ____ ] Microwave oven ....................................................................................73 [ ____ ] Iron induction coil stove .........................................................................74 [ ____ ] Gas stove / oven .....................................................................................75 [ ____ ] Other electric kitchen utensils ................................................................76 [ ____ ]
8. Transport vehicles Bicycle/electric bicycle ..........................................................................81 [ ____ ] Motorcycle/Three-wheeled car (Petrol/electric, all) ..............................82 [ ____ ] Car (Sedan/ Wagon/ Van/ Pick-up/ SUV) ..............................................83 [ ____ ] Tractor/ any agriculture vehicle .............................................................84 [ ____ ] Cart (Pony cart, bullock cart, etc.) .........................................................85 [ ____ ] Boat/ Sampan ........................................................................................86 [ ____ ] Motorboat/ outboard motorboat .............................................................87 [ ____ ] Pick-up/ Truck/ Lorry/ Other heavy duty vehicle ..................................88 [ ____ ]
9.1.8.1 TV Sets t209a How many functioning TV sets are there in your household? (If no functioning TV set, put ‘0’ and >> t210a)
_________ Functioning TV sets
For each TV set owned by the household, ask the following questions. (Ask in Roster)
t209b1 What is the brand?
Chan Hong ..................................................................................................1 Daewoo .......................................................................................................2 Fuji ..............................................................................................................3

83
LG ...............................................................................................................4 Media ..........................................................................................................5 Nibban .........................................................................................................6 Panasonic ....................................................................................................7 Plummy .......................................................................................................8 Sakura .........................................................................................................9 Samsung ......................................................................................................10 Samsonic .....................................................................................................11 Sanyo...........................................................................................................12 Sharp ...........................................................................................................13 Sony ............................................................................................................14 T-Home .......................................................................................................15 Toshiba ........................................................................................................16 Other ...........................................................................................................21
t209b2 What type it is, CRT or LCD/ LED?
CRT .............................................................................................................1 LCD/ LED ...................................................................................................2
t209b3 What size it is?
_________ inches
t209b4 How long (years) was it been with your household? (if less than 1, put “0”)
_________ years
9.1.8.2 Refrigerator t210a How many functioning refrigerators are there in your household? (If no functioning refrigerator, put ‘0’ and >> t211a)
_________ Functioning refrigerators For each Refrigerator owned by the household, ask the following questions.
t210b1 What is the brand?
Akira ...........................................................................................................1 Daewoo .......................................................................................................2 Elba .............................................................................................................3 Fuji ..............................................................................................................4 Hitachi .........................................................................................................5 LG ...............................................................................................................6 Media ..........................................................................................................7 Mitsubishi ...................................................................................................8 Nibban .........................................................................................................9 Panasonic ....................................................................................................10 Samsung ......................................................................................................11 Samsonic .....................................................................................................12 Sanyo...........................................................................................................13 Sharp ...........................................................................................................14 Sony ............................................................................................................15 Toshiba ........................................................................................................16 Other ...........................................................................................................21
t210b2 What type it is, one door or more than one door?
One door ......................................................................................................1 More than one door .....................................................................................2
t210b4 How long (years) was it been with your household? (if less than 1, put “0”)
_________ years
9.1.8.3 Air Conditioner t211a1 How many air conditioner are there in your household? (If no functioning air conditioner, put ‘0’ and >> t212a)

84
_________ Functioning air conditioner
t211a2 Of those air conditioner, how many air conditioner are owned by your household?
_________ owned functioning air conditioner
t211a3 How many times did your household purchase those air conditioner owned by your household?
_________ times For each air conditioner owned by the household, ask the following questions.
t211b1 What is the brand?
Aux ..............................................................................................................1 Chigo ...........................................................................................................2 LG ...............................................................................................................3 Media ..........................................................................................................4 Mitsubishi ...................................................................................................5 Panasonic ....................................................................................................6 Samsung ......................................................................................................7 Sanyo...........................................................................................................8 Sony ............................................................................................................9 TCL .............................................................................................................10 Toshiba ........................................................................................................11 Other ...........................................................................................................21
t211b2 What type it is, split type or window type of tower type?
Window type ...............................................................................................1 Split type .....................................................................................................2 Tower/ stand type ........................................................................................3
t211b4 How long (years) was it been with your household? (if less than 1, put “0”)
_________ years
9.1.8.4 Washing Machine t212a How many functioning washing machine are there in your household? (If no functioning washing machine, put ‘0’ and >>
t213a)
_________ Functioning washing machine For each washing machine owned by the household, ask the following questions.
t212b1 What is the brand?
Aliexpress ...................................................................................................1 Elba .............................................................................................................2 LG ...............................................................................................................3 Media ..........................................................................................................4 Mitsubishi ...................................................................................................5 Nibban .........................................................................................................6 Panasonic ....................................................................................................7 Sakura .........................................................................................................8 Samsung ......................................................................................................9 Sango...........................................................................................................10 Shan Hong ...................................................................................................11 Sharp ...........................................................................................................12 Sony ............................................................................................................13 TCL .............................................................................................................14 Toshiba ........................................................................................................15 Other ...........................................................................................................21
t212b2 What type it is, manual or auto?
Manual ........................................................................................................1 Automatic ....................................................................................................2

85
t212b4 How long (years) was it been with your household? (if less than 1, put “0”)
_________ years
9.1.8.5 Car for Home Use (Sedan/ Wagon/ Van/ Pick-‐up/ SUV) t213a1 How many passenger cars owned by your household? (If no car, put ‘0’ and >> t3a01a)
Number of cars _________
t213a2 How long have your household been owning a passenger car?
_________ years For each car owned by the household, ask the following questions.
t213b1 What is the brand and model?
Cherry .........................................................................................................1 Ford .............................................................................................................2 Honda ..........................................................................................................3 Mitsubishi ...................................................................................................4 Nissan ..........................................................................................................5 Suzuki .........................................................................................................6 Ta Ta ...........................................................................................................7 Toyota .........................................................................................................8
t213b2 What type of car it is?
Sedan/ Saloon ..............................................................................................1 Van/ Super roof ...........................................................................................2 Station Wagon/ Hi-Ace/ Super Custom ......................................................3 Pick-up/ Light truck ....................................................................................4 SUV/ 4WD/ Off-road ..................................................................................5 Sport ............................................................................................................6 Other ...........................................................................................................7
t213b2 What model (year) it is?
Model (Year) _________
t213b4 What type of fuel does it use?
Petrol ...........................................................................................................1 Octane (92/ 95) ...........................................................................................2 Diesel ..........................................................................................................3 Premium Diesel ...........................................................................................4 Other ...........................................................................................................5
t213b5 What type of license of this car?
Black plate ..................................................................................................1 Red plate .....................................................................................................2 Other ...........................................................................................................3

86
3. Household expenditure and Income
9.1.9 3a. Household Expenditure Ask these questions to the housewife
t3a01a Where do you purchase food for household consumption most?
Not purchase, we consume more from own production .............................1 Shops/ vendors in the village (no market) ..................................................2 Near by street market/ market in the village ...............................................3 Municipal market/ wet market ....................................................................4 Super market/ shopping center ....................................................................5 Other ...........................................................................................................6
t3a01b In the past 7 days, how many times do you purchase food for household consumption?
____________ times in the past 7 days
9.1.9.1 Rice and staple food t3a02a Does your household eat rice as main staple food?
Yes ..............................................................................................................1 No ................................................................................................................2
t3a02b How does your household acquire rice (other staple food) for consumption?
Purchase in cash or in kind .........................................................................1 Consumption from household production/ received as gifts ......................2 Both .............................................................................................................3
t3a02c How many cans (cups) of rice (other staple food) does you cook for household members in a normal day?
____________ cans
t3a02d What is the price per Pyi of rice (other staple food) that your household consume?
__________________ Kyat per Pyi (1 Pyi = 8 cans)
t3a02e How often does your household purchase/ acquire rice (other staple food)?
Daily/ almost daily ......................................................................................1 2 – 4 times a week .......................................................................................2 Once a week ................................................................................................3 2 – 3 times a month .....................................................................................4 Once a month ..............................................................................................5 Less often than once a month ......................................................................6
9.1.9.2 Edible oil t3a03a How does your household acquire edible oil for consumption?
Purchase in cash or in kind .........................................................................1 Consumption from household production/ received as gifts ......................2 Both .............................................................................................................3
t3a03b What sort of edible oil does your household consume most?
Groundnut oil ..............................................................................................1 Sesame oil ...................................................................................................2 Mustard seed oil ..........................................................................................3 Groundnut/ Sesame oil mixed with palm oil ..............................................4 Palm oil .......................................................................................................5 Soy bean oil .................................................................................................6 Sunflower seed oil .......................................................................................7 Other vegetable oil ......................................................................................8 Animal fat ...................................................................................................9
t3a03c Does it branded one or not?
87
Branded .......................................................................................................1 Unbranded ...................................................................................................2 >> t3a03e
t3a03d What brand of edible oil does your household consume most?
Ah May Htwar ............................................................................................1 Arsha Thar ..................................................................................................2 Brolio ..........................................................................................................3 DD ...............................................................................................................4 Diamond Mountain .....................................................................................5 Global ..........................................................................................................6 Golden Crown .............................................................................................7 Hitech ..........................................................................................................8 Mayzin ........................................................................................................9 Mya .............................................................................................................10 Myin Chan ..................................................................................................11 Ngwe Thazin Min .......................................................................................12 Polar ............................................................................................................13 Saji .............................................................................................................. Shwe ............................................................................................................14 Shwe Khid ...................................................................................................15 Shwe Popa ...................................................................................................16 Shwe Sin Moe .............................................................................................17 Shwe Sin Nandaw .......................................................................................18 Suna............................................................................................................. Thin .............................................................................................................19 Tun ..............................................................................................................20 Yangon ........................................................................................................21 Zwe .............................................................................................................22 Other local branded edible oil .....................................................................31 Other foreign branded edible oil .................................................................41
t3a03e How many Ticals of edible oil did your household members consume in the past 30 days?
________________ Ticals (1 Kg = 1000 gram = 63 Ticals)
t3a03f What is the price per Viss of edible oil that your household consume?
__________________ Kyat per Viss (100 Ticals)
9.1.9.3 Other household consumption expenditures t3a04 How does your household acquire food for household consumption?
Purchase in cash or in kind .........................................................................1 Consumption from household production/ received as gifts ......................2 Both .............................................................................................................3
CIID CIName Refp t3a05a t3a05b
Item code Particular
Reference period (in
the past …)
Does your household have … [Particular] expense in the past
… [Ref. period]?
Yes ................. 1 No .................. 2 >> next item
What is total (both purchase and non-purchase) expense
(Kyat) of … [Particular] in the past … [Ref.
period] for all household members?
Food, beverages and tobacco 103 Meat (fresh & dried)
7 days 1. Yes 2. No
104 Eggs 7 days 1. Yes 2. No
105 Fish, prawn and seafood (fresh & dried) 7 days 1. Yes 2. No
106 Ngapi, Nganpyaryay & other fish products 7 days 1. Yes 2. No
107 Pulses, beans, seeds and nuts 7 days 1. Yes 2. No
108 Vegetables, roots and tubers 7 days 1. Yes 2. No
109 Processed meat and canned food 7 days 1. Yes 2. No

88
CIID CIName Refp t3a05a t3a05b
Item code Particular
Reference period (in
the past …)
Does your household have … [Particular] expense in the past
… [Ref. period]?
Yes ................. 1 No .................. 2 >> next item
What is total (both purchase and non-purchase) expense
(Kyat) of … [Particular] in the past … [Ref.
period] for all household members?
110 Fruits 30 days 1. Yes 2. No
111 Onion, garlics and dried chilly 30 days 1. Yes 2. No
112 Chicken power and other taste powder 30 days 1. Yes 2. No
113 Salt, MSG, spices and condiments 30 days 1. Yes 2. No
114 Pickles mustard, Soy bean paste (Pe Boke), Tofu … etc (Shan traditional ready made food) 30 days 1. Yes 2. No
115 Instant noodle 30 days 1. Yes 2. No
116 Buy meals from restaurant 30 days 1. Yes 2. No
121 Health food drinks/ Malted food drinks (Ovaltine, Horlicks, Milo … etc.) 30 days 1. Yes 2. No
122 Milk powder 30 days 1. Yes 2. No
123 Coffee/ Tea/ Milk drinks at home 30 days 1. Yes 2. No
124 Soft drinks/ Cordial/ Syrups drink at home 30 days 1. Yes 2. No
125 Bread/ Biscuit/ Cookies/ Cakes and related fast food 30 days 1. Yes 2. No
126 Other expenses on food eating outside home 7 days 1. Yes 2. No
127 Pocket money for children 7 days 1. Yes 2. No
131 Alcoholic beverages (beer, hard liquor, wine, rice wine … etc) 30 days 1. Yes 2. No
141 Tobacco (cigarette, cheroot, chewing betel) 1 day 1. Yes 2. No
Regular monthly nonfood expenditure 211 Electricity bill
1 month 1. Yes 2. No
212 Candle, battery, kerosene, diesel for lighting 1 month 1. Yes 2. No
213 Gas 1 month 1. Yes 2. No
214 Charcoal, firewood and other fuel for cooking (excl. electricity) 1 month 1. Yes 2. No
215 Water for drinking and domestic use 1 month 1. Yes 2. No
221 House cleansing products (insecticide, tissue and floor cleansing) 1 month 1. Yes 2. No
222 Detergent (bar/ powder/ paste/ liquid) 1 month 1. Yes 2. No
223 Body soap/ Shower cream 1 month 1. Yes 2. No
224 Shampoo/ conditioner 1 month 1. Yes 2. No
225 Facial soap/ cleansing cream/ foam 1 month 1. Yes 2. No
231 Thanakha (any form) 1 month 1. Yes 2. No
232 Facial cream/ Body lotion/ Make-up and cosmetics/ Roll-on/ Deodorant/ Body Spray 1 month 1. Yes 2. No
89
CIID CIName Refp t3a05a t3a05b
Item code Particular
Reference period (in
the past …)
Does your household have … [Particular] expense in the past
… [Ref. period]?
Yes ................. 1 No .................. 2 >> next item
What is total (both purchase and non-purchase) expense
(Kyat) of … [Particular] in the past … [Ref.
period] for all household members?
233 Hair oil/ cream/ gel/ spray … etc. 1 month 1. Yes 2. No
234 Hair cut/ Hair styling and visiting beauty parlor/ spa 1 month 1. Yes 2. No
241 Daily travel (Bus/ Train/ Taxi/ Trishaw) 1 month 1. Yes 2. No
242 Fuel for motor cycle/ car for daily travel 1 month 1. Yes 2. No
251 Telephone bill and top-up expenses 1 month 1. Yes 2. No
252 Internet and other communication (except internet using mobile phone connection) 1 month 1. Yes 2. No
261 Paid TV expenses 1 month 1. Yes 2. No
262 Purchase of VCD/ EVD and cinema attending 1 month 1. Yes 2. No
263 Playing TV/ computer/ network games 1 month 1. Yes 2. No
264 Purchase of Newspaper/ Journal/ Magazine and other books 1 month 1. Yes 2. No
265 Expenses on playing sports/ gyms 1 month 1. Yes 2. No
271 Regular use medicines (Vitamins, Supplements and related medicines) 1 month 1. Yes 2. No
281 Regular religious and social donations and contributions 1 month 1. Yes 2. No
Other non-regular nonfood expenditure 311 Education and learning (School/ University/
Tuition/ Training … etc.) 1 year 1. Yes 2. No
321 All health and treatment related expenses for cure 1 year 1. Yes 2. No
331 Shoes and slippers 1 year 1. Yes 2. No
332 Clothing of all kind including tailoring 1 year 1. Yes 2. No
333 Bags, hand bags, watches, glasses, accessories and fancies … etc. 1 year 1. Yes 2. No
341 Domestic travels 1 year 1. Yes 2. No
342 International travels 1 year 1. Yes 2. No
351 House rent 1 year 1. Yes 2. No
352 House repairs and maintenance 1 year 1. Yes 2. No
361 Purchase of furniture, bed and accessories, cooking and dining utensils 1 year 1. Yes 2. No
362 Purchase of TV, Video, paid TV receivers, camera and other audio visual instruments 1 year 1. Yes 2. No
363 Purchase of computer, laptop and tablets 1 year 1. Yes 2. No
364 Purchase of mobile phones 1 year 1. Yes 2. No
365 Purchase of household electronic and electrical products (Refrigerator, Air-Con, Washing Machine, oven, cookers and other kitchen electric products)
1 year 1. Yes 2. No
90
CIID CIName Refp t3a05a t3a05b
Item code Particular
Reference period (in
the past …)
Does your household have … [Particular] expense in the past
… [Ref. period]?
Yes ................. 1 No .................. 2 >> next item
What is total (both purchase and non-purchase) expense
(Kyat) of … [Particular] in the past … [Ref.
period] for all household members?
366 Purchase of new/ additional car and/or additional expense on changing old car with a new one 1 year 1. Yes 2. No
367 Purchase of new/additional motor cycle/ bicycle and/or additional expense on changing old motor cycle with a new one
1 year 1. Yes 2. No
368 Purchase of gold and jewelry and/or additional expense on changing the old jewelry with a new one
1 year 1. Yes 2. No
371 Maintenance and repairs of car 1 year 1. Yes 2. No
372 Maintenance and repairs of motorcycle 1 year 1. Yes 2. No
381 Attending live show, concert 1 year 1. Yes 2. No
382 Lottery tickets (any) 1 year 1. Yes 2. No
391 Non-regular religious and social donations and contributions 1 year 1. Yes 2. No
392 Transfer of money to household members who is living in other town and/or country for learning or working/ seeking job
1 year 1. Yes 2. No
l3a06 How does this household send money to family members and friends who are living in another town and/or country for learning or working/ seeking job?
Take it and go deliver it ..............................................................................1 send it through a bus driver .........................................................................2 send it through a courier service .................................................................3 send it through someone known from this area ..........................................4 send a cheque which must be cashed at/deposited at a bank ......................5 send it through the bank or money transfer service
(e.g., Western Union, etc) .......................................................................6 send it through the post office .....................................................................7 send it through mobile money .....................................................................8 send it through a hundi [local name] service ..............................................9 Other (Please specify______________________) .....................................____ No need to send money ...............................................................................20
9.1.9.4 Detergent (powder/ paste/ cream/ liquid/ bar) Now let me ask about usage of detergent powder/ paste/ cream/ liquid/ bar, dish washing liquid or hand washer.
PCD Product t3a07a t3a07b t3a07c t3a07d t3a07e
Product Names
Does your household use
[product]? Yes ..... 1 No ....... 2 >> next
How long (Years) has your household been using [product]? (Put “0” if less
than 1 year)
In the past 30 days, how many times did
your household purchase [product]?
(Put “0” if the household did not
purchase in the past 30 days.)
How many packets/
bottles does your
household buy per time?
What is the price of …
packet/ bottle?
1 Detergent powder 1. Y 2. N
2 Detergent paste/ cream 1. Y 2. N
3 Detergent liquid 1. Y 2. N
4 Detergent bar 1. Y 2. N

91
PCD Product t3a07a t3a07b t3a07c t3a07d t3a07e
Product Names
Does your household use
[product]? Yes ..... 1 No ....... 2 >> next
How long (Years) has your household been using [product]? (Put “0” if less
than 1 year)
In the past 30 days, how many times did
your household purchase [product]?
(Put “0” if the household did not
purchase in the past 30 days.)
How many packets/
bottles does your
household buy per time?
What is the price of …
packet/ bottle?
5 Dish washing liquid 1. Y 2. N
6 Hand washer 1. Y 2. N
t3a07e Where do you purchase them most?
Traditional shops/ stores in the ward/ village .............................................1 Near by street market/ market in the village ...............................................2 Municipal market/ wet market ....................................................................3 Modern retail store like abc, city express, g&g, 702) .................................4 Super market/ shopping center ....................................................................5 Other ...........................................................................................................6
t3a08a In the past 3 months, what detergent brand is your household’s most often brand (MOB)?
Arial ............................................................................................................1 Breeze .........................................................................................................2 BSC ............................................................................................................3 Dixan ...........................................................................................................4 Eco ..............................................................................................................5 E-Lan ...........................................................................................................6 Ezee .............................................................................................................7 Fab...............................................................................................................8 Fineline .......................................................................................................9 Fuji ..............................................................................................................10 Gold.............................................................................................................11 Good Maid ..................................................................................................12 Hi Class .......................................................................................................13 Jasmine ........................................................................................................14 Kao ..............................................................................................................15 Laurel ..........................................................................................................16 Oki...............................................................................................................17 OMO ...........................................................................................................18 Pao...............................................................................................................19 Pro ...............................................................................................................20 Rainbow ......................................................................................................21 USA ............................................................................................................22 Win ..............................................................................................................23 X-tra ............................................................................................................24 Other ...........................................................................................................31 Don’t know the brand (loose pack/ repacked) ............................................41
t3a08e What other brands did your household also used in the past 3 months? [MR]
Arial ............................................................................................................1 Breeze .........................................................................................................2 BSC ............................................................................................................3 Dixan ...........................................................................................................4 Eco ..............................................................................................................5 E-Lan ...........................................................................................................6 Ezee .............................................................................................................7 Fab...............................................................................................................8 Fineline .......................................................................................................9 Fuji ..............................................................................................................10 Gold.............................................................................................................11 Good Maid ..................................................................................................12 Hi Class .......................................................................................................13 Jasmine ........................................................................................................14 Kao ..............................................................................................................15 Laurel ..........................................................................................................16 Oki...............................................................................................................17 OMO ...........................................................................................................18
92
Pao...............................................................................................................19 Pro ...............................................................................................................20 Rainbow ......................................................................................................21 USA ............................................................................................................22 Win ..............................................................................................................23 X-tra ............................................................................................................24 Other ...........................................................................................................31 Don’t know the brand (loose pack/ repacked) ............................................41
t3a08e How long has your household been using …… (brand) as most often brand (MOB)? (Put “0” if less than 1 year) _____________ year(s) and ____________ months
t3a08f Before your household has been using the [MOB] most, which brand did your household used most (Previous Brand - PB)?
Arial ............................................................................................................1 Breeze .........................................................................................................2 BSC ............................................................................................................3 Dixan ...........................................................................................................4 Eco ..............................................................................................................5 E-Lan ...........................................................................................................6 Ezee .............................................................................................................7 Fab...............................................................................................................8 Fineline .......................................................................................................9 Fuji ..............................................................................................................10 Gold.............................................................................................................11 Good Maid ..................................................................................................12 Hi Class .......................................................................................................13 Jasmine ........................................................................................................14 Kao ..............................................................................................................15 Laurel ..........................................................................................................16 Oki...............................................................................................................17 OMO ...........................................................................................................18 Pao...............................................................................................................19 Pro ...............................................................................................................20 Rainbow ......................................................................................................21 USA ............................................................................................................22 Win ..............................................................................................................23 X-tra ............................................................................................................24 Other ...........................................................................................................31 Don’t know the brand (loose pack/ repacked) ............................................41

93
9.1.10 3b. Household Income
9.1.10.1 Agriculture and Livestock c3b01a1 Does your household own one or more agriculture/ livestock breeding farm?
Yes ..............................................................................................................1 No ................................................................................................................2 >> c3b01c1
c3b01a2 How many acres of agriculture land does your household own?
__________________ acres (1 acre = 43560 sq. ft.)
c3b01b1 Did you lease your household-owned agriculture land?
Yes ..............................................................................................................1 No ................................................................................................................2 >> c3b01c1
c3b01b2 How much does your household receive as rental fees?
Rental fees received ______________________ Kyat
c3b01c1 Did your household cultivate in the last 12 months?
Yes ..............................................................................................................1 No ................................................................................................................2 >> c3b02a
c3b01c2 How many crops did you cultivated in the past 12 months?
No. of crops cultivated in the past 12 months ______________________
c3b01c3 Please answer a few details about each crop that your household cultivated in the past 12 months?
Sr
a b c d e f
Name of crop Acre cultivated Cost of
cultivation per acre
Total yields Unit of measure Price per unit
c3b02a Did your household breed any livestock animal/s in the last 12 months?
Yes ..............................................................................................................1 No ................................................................................................................2 >> c3b03a
c3b02b How many kinds of livestock breeding animal did your household raised in the past 12 months?
______________________
c3b02c Please answer a few details about each livestock breeding animal that your household raised in the past 12 months?
Sr a b c d

94
Name of animal Current number of animal
Total cost in the past 12 months
Total income (including increased value and consumption for
household consumption) in the past 12 months
9.1.10.2 Non-‐agriculture business c3b03a Did your household run any businesses over the last 12 months?
Yes ..............................................................................................................1 No ................................................................................................................2 >> c3b04a
c3b03b How much net income/profit did your household make from the business in the last 12 months?
Business Income ______________________ Kyat
9.1.10.3 Salary and wage earning c3b04a Does your household have any person who earns salary, wage income or pension in the last month?
Yes ..............................................................................................................1 No ................................................................................................................2 >> c3b05a
c3b04b How much salary, daily wages, piecework income, pension income in total did your household members earn in the last month?
Household total salary, wage income and pension ______________________ Kyat
9.1.10.4 Income from leasing house(s)/ room(s) c3b05a Does your household own any other house?
Yes ..............................................................................................................1 No ................................................................................................................2
c3b05b Did your household lease other house(s) and/or room(s) of this house to other person/ family in the last 12 months?
Yes ..............................................................................................................1 No ................................................................................................................2 >> l3b06a
c3b05c How much rent did your household earns in total in the past 12 months?
Salary and wages income ______________________ Kyat
9.1.10.5 Remittances (Local/ International) l3b06a Are there any immediate family members who have migrated to other parts of Myanmar (outside of this town or village)?
Yes ..............................................................................................................1 No ................................................................................................................2
c3b06b Did your household receive any local remittances in the last 12 months?
Yes ..............................................................................................................1 No ................................................................................................................2 >> c3b06e

95
c3b06c How much local remittances did your household receive in the past 12 months?
Local remittances: ______________________ Kyat
l3b06d Are there any immediate family members who have migrated abroad?
Yes ..............................................................................................................1 No ................................................................................................................2
c3b06e Did your household receive any remittance from abroad in the last 12 months?
Yes ..............................................................................................................1 No ................................................................................................................2 >> c3b07a
c3b06f How much remittances from abroad did your household receive in the past 12 months?
Remittances from abroad: ______________________ Kyat
l3b06g How do they send the money to the household?
They bring it when they come home ...........................................................1 They send it through a bus driver ...............................................................2 They send it through a courier service ........................................................3 They send it through someone known from this area .................................4 They send a cheque which must be cashed at/
deposited at a bank .................................................................................5 They send it through the bank or money transfer service
(e.g., Western Union, etc) .......................................................................6 They send it through the post office ...........................................................7 They send it through mobile money ...........................................................8 They send it through a hundi [local name] service .....................................9 Other (Please specify______________________) .....................................____
9.1.10.6 Interests and dividends c3b07a Did your household earns interest from any bank account and/or by lending money to other(s)?
Yes ..............................................................................................................1 No ................................................................................................................2 >> c3b07c
c3b07b How much interest did your household earn in the last 12 months?
Interests ______________________ Kyat
c3b07c Did your household earn dividends due to any investment/ shares?
Yes ..............................................................................................................1 No ................................................................................................................2 >> c3b08a
c3b07d How much dividends did your household earn in the last 12 months?
Dividends ______________________ Kyat
9.1.10.7 Lottery winning, inheritance and other income n.e.s c3b08a Did your household win any lottery and/or received any other income other than specified above?
Yes ..............................................................................................................1 No ................................................................................................................2 >> select one respondent by Kish Grid
c3b08b How much such income did your household earn in the last 12 months?
Lottery and/or other income ______________________ Kyat