9/30 test today over graphing. pick up formula chart, scantron, and calculator assigned to your desk...
TRANSCRIPT

9/30 Test Today over Graphing.•Pick up formula chart, scantron, and Calculator assigned to your desk (see blue number on desk)•Turn in Review to blue sorter•You will need a pencil•Record your First and Last name and Period on side. For subject write “Graphing
•You will answer the multiple choice (blue packet) on scantron. DO NOT WRITE ON THE BLUE PACKET•The short answer questions are on the white paper that I will hand out. Record your First and Last name and Period on the white paper. •Remember to show your work (variables, formula, substitution with units, and answer with units.
•What’s the difference between interpolation and extrapolation?

9/14 Friday you finished Lil Dudes I and took a quiz. You also finished warm ups and turned them in.
Pick up Graphing 2 Practice Sheet, a ruler & a new Warm Up Sheet. Have your graphing notes out.
Do You Need to Make Something UP? Check the board above my desk.Tonight: Meet the Teacher 6 pm. Write your schedule (with room numbers) for your folks.
Quiz on Thursday, Test on Friday.
Warm Up 1: Sketch a D v T graph with constant acceleration away from the detector.

9/15• Yesterday we went through Graph II Notes• Pick up purple folder and calculator.• First we will discuss practice 6 and area
under a curve• Then you will work on Lil Dudes 2• Warm up 2:

9/?• Warm up ?: Which of the following
students was using the most precise instrument? Why?

The graphs Part II…

A word about + vs –position vs direction
-500
-400
-300
-200
-100
0
100
200
300
400
500
0 10 20 30 40 50 60 70 80 90 100
dis
pla
cem
ent (
met
ers)
time (seconds)
Displacement-Time Graph
Series1

Three descriptions of speed or velocity:
1. Constant
2. Average
3. Instantaneous

What is the difference between constant speed and average
speed?• Constant speed is like cruise control, it never
varies.• Average speed is the total distance divided by
total time. – Sometimes this can be represented by a diagonal
line (on a position vs time of DvT graph), there are only small variations in speed as time changes.
– If there are large variations in speed, then this can be calculated by considering total distance / total time.

The slope of a position vs time graph is?
The slope of part 1?
The slope of part 2?
The velocity in interval 3?
Velocity
+ 2 m/s -1m/s

Consider a car moving with a constant, rightward (+) velocity of +10 m/s.
What does a velocity vs time graph look like for this motion?
Zero Acceleration

Now consider a car moving with a rightward (+), changing velocity – that is, a car that is moving rightward and speeding up or accelerating.
The car is moving in the positive direction and speeding up, it is said to have a positive acceleration.
And the graph?

The (instantaneous acceleration) of an object at a certain time is the slope of the velocity versus time graph at that time. It can be positive, negative, or zero.
The slope of a velocity time graph is …
Slope = Δy = Change in velocity = Δx Change in time
ACCELERATION
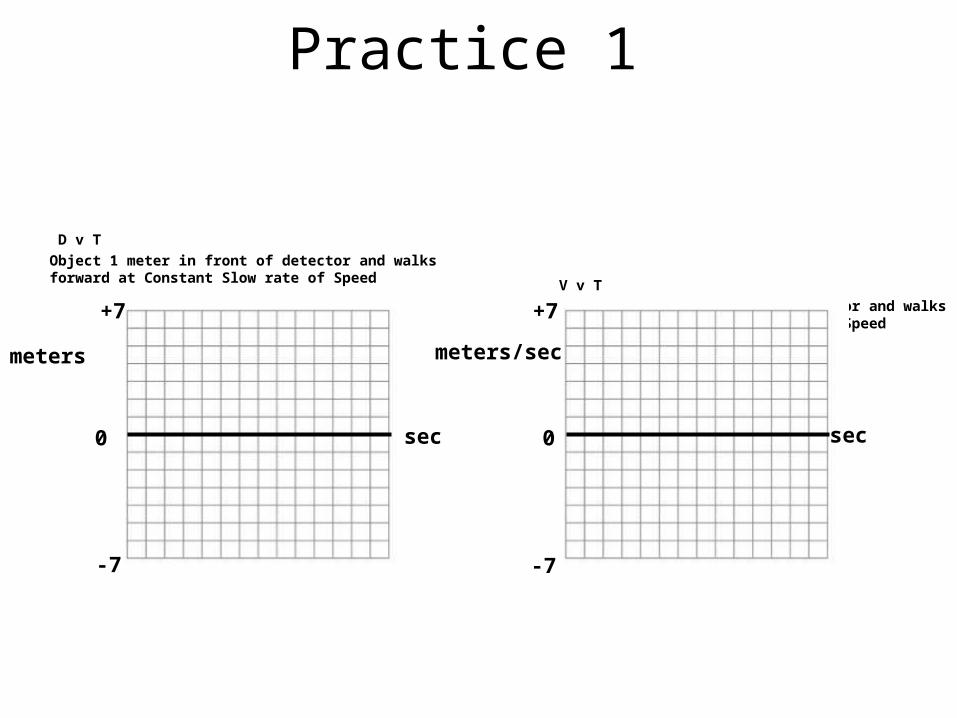
Practice 1
D v T
Object 1 meter in front of detector and walks forward at Constant Slow rate of Speed V v T
Object 1 meter in front of detector and walks forward at Constant Slow rate of Speed
meters
secsec
meters/sec
+7 +7
-7 -7
0 0

Practice 1
D v T
Object 1 meter in front of detector and walks forward at Constant Slow rate of Speed V v T
Object 1 meter in front of detector and walks forward at Constant Slow rate of Speed
meters
secsec
meters/sec
+7 +7
-7 -7
0 0

Practice 2
D v T
Object 3 meter in front of detector and walks backwards at Constant fast rate of Speed V v T
Object 3 meter in front of detector and walks backwards at Constant fast rate of Speed
meters
secsec
meters/sec
+7 +7
-7 -7
0 0

Practice 2
D v T
Object 3 meter in front of detector and walks backwards at Constant fast rate of Speed V v T
Object 3 meter in front of detector and walks backwards at Constant fast rate of Speed
meters
secsec
meters/sec
+7 +7
-7 -7
0 0

Practice 3
D v T
Object is at rest at 0. It gradually increases speed (accelerates) forward from the start.
V v T
Object is at rest at 0. It gradually increases speed (accelerates) forward from the start.
meters
secsec
meters/sec
+7 +7
-7 -7
0 0

Practice 3
D v T
Object is at rest at 0. It gradually increases speed (accelerates) forward from the start.
V v T
Object is at rest at 0. It gradually increases speed . (accelerates) forward from the start.meters
secsec
meters/secmeters
+7 +7
-7 -7
0 0

Practice 4Draw the V v T from the D v T
D v TV v T
meters
secsec
meters/secmeters
+7 +7
-7 -7
0 0

Practice 4Draw the V v T from the D v T
D v TV v T
meters
secsec
meters/sec
+7 +7
-7 -7
0 0

Practice 5Draw the D v T from the V v T
D v TV v T
meters
secsec
meters/sec
+7 +7
-7 -7
0 0

Practice 5Draw the D v T from the V v T
D v TV v T
meters
secsec
meters/sec
+7 +7
-7 -7
0 0

Practice 6
D v T
Object is at rest at 2m behind the origin. It stands still for 2 seconds. Then it moves forward at a 1 m/s for 5 seconds and then it stops for 3 seconds. The object the moves back towards the start at 2 m/s. V v T
Object is at rest at 2m behind the origin. It stands still for 2 seconds. Then it moves forward at a 1 m/s for 5 seconds and then it stops for 3 seconds. The object the moves back towards the start at 2 m/s.
meters
secsec
meters/sec
+7 +7
-7 -7
0 0

Practice 6
D v T
Object is at rest at 2m behind the origin. It stands still for 2 seconds. Then it moves at a 1 m/s for 5 seconds and then it stops for 3 seconds. The object the moves back towards the start at 2 m/s. V v T
Object is at rest at 2m behind the origin. It stands still for 2 seconds. Then it moves at a 1 m/s for 5 seconds and then it stops for 3 seconds. The object the moves back towards the start at 2 m/s.
meters
secsec
meters/sec
+7 +7
-7 -7
0 0
How far (distance) did the object travel during time segment 2 sec-5 sec?

Area and Graphs
This applies to the V vs T graph
What is the formula for area of a rectangle?
What is the formula for area of a triangle?

Example 2: a) What is the acceleration in interval A?
Acc = Δy = (20 – 0 m/s) = Δx (10 – 0 s)
+ 2 m/s2
b) What distance does it travel in first the 20s?
The distance covered is the “area under” the line.
Area = ½ bh
Distance = ½ (20s)(40m/s) Distance = 400 m

Example 2:
The distance covered is the “area under” the line.
c) What is the acceleration in interval B?
Constant velocity of +40 m/s
d) What is the distance traveled during t=20s to t = 40s?
Area = (b)(h)
Distance = (20s)(40m/s)
Distance = 800m
e) What is the total distance?
Distance = 400m + 800m = 1200m

Interpolation vs Extrapolation

ReviewD v T Graphs
Slope?What is happening?
+ or –No motion, constant
velocity, or acceleration?
A B
C D
E F
G H

ReviewV v T Graphs
Slope? Area? What is happening? + or –
No motion, constant velocity, or acceleration?
A B
C D

6
-4
-6
What is the net displacement over the 11 seconds?

Graph Matching
DvT DvT DvT
VvT VvT VvT

Graph Matching
DvT DvT DvT
VvT VvT VvT

Slope Calculations
DvT
5m
10s
B
5s

Area Calculations
VvT
5m/s
10s
A
15s

Positive and negative acceleration & velocity?Acceleration and velocity are in opposite directionsAcceleration and
velocity in same direction
Acceleration and velocity in same direction
Acceleration and velocity are in opposite directions

9/29 Test tomorrow.I will start out with a verbal review, then you
can finish your work. (lil dudes 1 & 2, graphing review) I will be here after school and in the am Powerpoints are on line. BOPS are on line.
Remember the video review on youtube (mrsseeb239)
Solve now:Curious George rides his bicycle for 20 minutes at an average speed of 15km/hr.How far does he travel? (calculate distance in meters)
An alien drops a hammer on Saturn. What will be the speed of the hammer after falling for 3 seconds? The acceleration on Saturn is 11.17 m/s2. How would you determine the distance that the hammer dropped?

Describe the motion of the dot.
What does the position vs time graph look like?
What does the velocity vs time graph look like?
What does the acceleration vs time graph look like?
Constant positive velocity

Describe the motion of the dot.
What does the position vs time graph look like?
What does the velocity vs time graph look like?
What does the acceleration vs time graph look like?
A negative constant velocity

Describe the motion of the dot.
What does the position vs time graph look like?
What does the velocity vs time graph look like?
What does the acceleration vs time graph look like?
A positive velocity and a positive acceleration
Describe the motion of the dot.
What does the position vs time graph look like?
What does the velocity vs time graph look like?
What does the acceleration vs time graph look like?
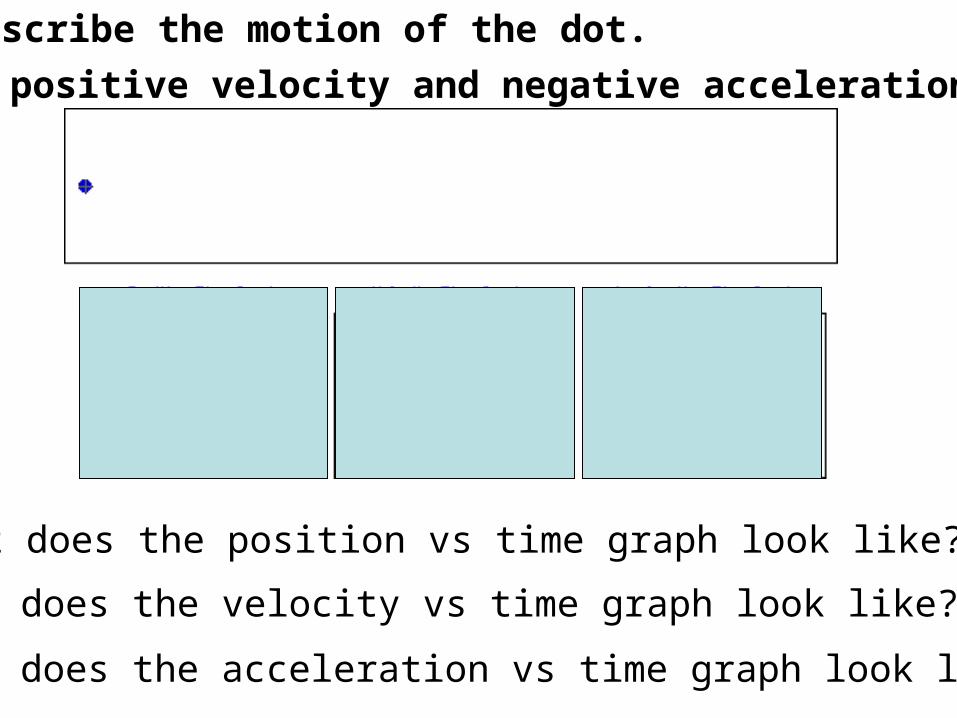
A positive velocity and negative acceleration

Describe the motion of the dot.
What does the position vs time graph look like?
What does the velocity vs time graph look like?
What does the acceleration vs time graph look like?
A negative velocity and negative acceleration

Summary
Velocity in Quad 1: positive
Velocity in Quad 4: negative
Acceleration: positive if slope positive
negative if slope negative
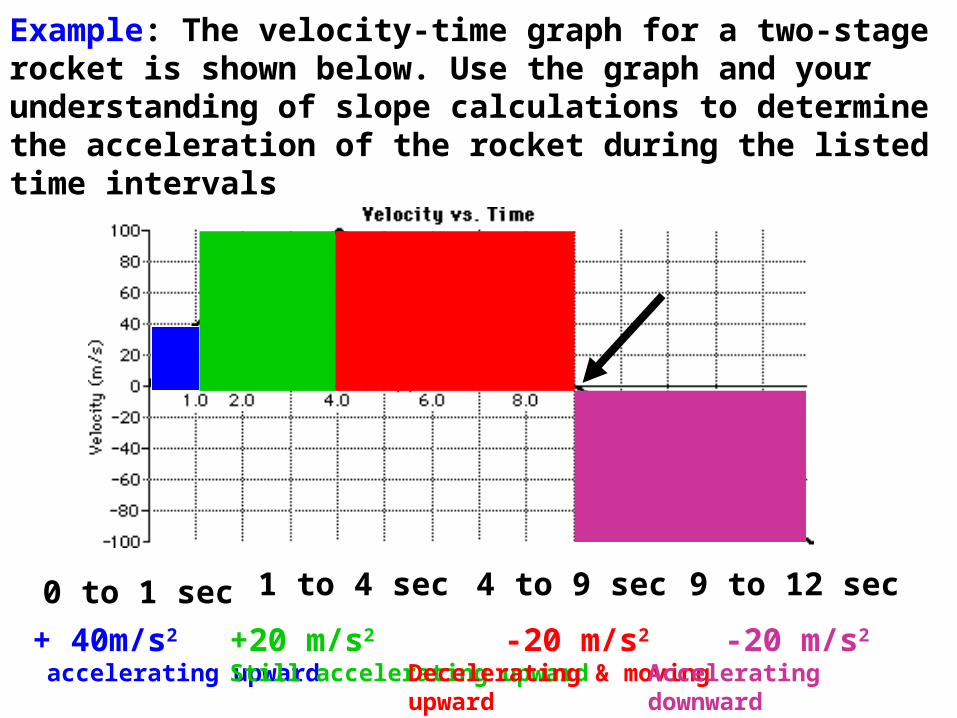
Example: The velocity-time graph for a two-stage rocket is shown below. Use the graph and your understanding of slope calculations to determine the acceleration of the rocket during the listed time intervals
0 to 1 sec 1 to 4 sec 4 to 9 sec 9 to 12 sec
+ 40m/s2
accelerating upward+20 m/s2
Still accelerating upward-20 m/s2
Decelerating & moving upward
-20 m/s2 Accelerating downward

3,2,1,Blast off…

Graph Summary
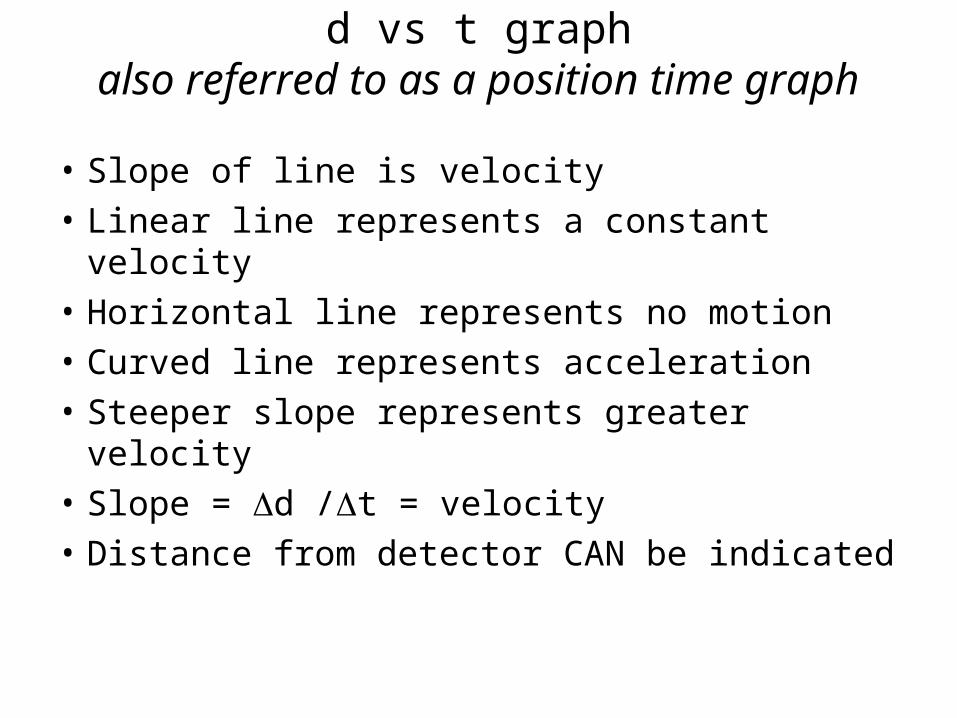
d vs t graphalso referred to as a position time graph
• Slope of line is velocity
• Linear line represents a constant velocity
• Horizontal line represents no motion
• Curved line represents acceleration
• Steeper slope represents greater velocity
• Slope = d /t = velocity
• Distance from detector CAN be indicated

v vs t graph• Slope of line is acceleration• Linear line represents uniform acceleration• Horizontal line represents constant velocity, a=o• Curved line represents changing acceleration• Steeper slope represents greater acceleration• Slope = v /t = acceleration• Distance from detector cannot be indicated, only
direction: away is positive and towards is negative• Area under curve indicates displacement

a vs t graph
• Linear line– acceleration is changing at a constant rate
• Horizontal line– uniform acceleration(the acceleration stays the same)
• Curved line– acceleration is changing non-uniformly
• Steeper slope-- greater change in a• Slope = a /t• Area under curve indicates velocity

Comparing graphsNo motion (v=0)
velocity vs. time
00.20.40.60.8
1
1 2 3 4 5 6
time
ve
loc
ity
Series1
acceleration vs. time
00.20.40.60.8
1
1 2 3 4 5 6
time
ac
ce
lera
tio
n
Series1
Distance Vs. Time
0
2
4
6
1 2 3 4 5
time
dis
tan
ce
Series1

Constant Velocity (a=0) positive direction
velocity Vs. Time
0
2
4
6
1 2 3 4 5
time
ve
loc
ity
Series1
Distance vs. time
0
10
20
30
1 2 3 4 5 6
time
dis
tan
ce
Series1
acceleration vs. time
00.20.40.60.8
1
1 2 3 4 5 6
time
ac
ce
lera
tio
n
Series1

Constant velocity (a=0) negative direction
acceleration vs. time
00.20.40.60.8
1
1 2 3 4 5 6
time
ac
ce
lera
tio
n
Series1
velocity vs. time
-6
-4
-2
0
1 2 3 4 5 6
time
ve
loc
ity
Series1
distance vs. time
0
10
20
30
1 2 3 4 5 6
time
dis
tan
ce
Series1

Classwork: Graphing Little Dudes WS # 2