92 multivariate analysis in metabolomics - university...
TRANSCRIPT

Send Orders of Reprints at [email protected]
92 Current Metabolomics, 2013, 1, 92-107
Multivariate Analysis in Metabolomics
Bradley Worley and Robert Powers*
Department of Chemistry, University of Nebraska-Lincoln, Lincoln, NE 68588-0304, USA
Abstract: Metabolomics aims to provide a global snapshot of all small-molecule metabolites in cells and biological flu-ids, free of observational biases inherent to more focused studies of metabolism. However, the staggeringly high informa-tion content of such global analyses introduces a challenge of its own; efficiently forming biologically relevant conclu-sions from any given metabolomics dataset indeed requires specialized forms of data analysis. One approach to finding meaning in metabolomics datasets involves multivariate analysis (MVA) methods such as principal component analysis (PCA) and partial least squares projection to latent structures (PLS), where spectral features contributing most to variation or separation are identified for further analysis. However, as with any mathematical treatment, these methods are not a panacea; this review discusses the use of multivariate analysis for metabolomics, as well as common pitfalls and miscon-ceptions.
Keywords: Multivariate analysis, PCA, PLS-DA, OPLS-DA, metabolomics, metabonomics.
INTRODUCTION Metabolomics is defined [1] as “the quantitative meas-urement of the multiparametric metabolic response of living systems to pathophysiological stimuli or genetic modifica-tion.” Such a definition implies that metabolomic studies offer the finest-grained detail available in the nascent field of systems biology: a molecular-level convolution of all up-stream genomic, transcriptomic and proteomic responses of an organism to a given stimulus or change [2-4]. Metabolites are the end product of all cellular processes, and are a direct outcome of enzymatic and protein activity. Thus, metabolites are more proximal to a phenotype or disease than either ge-netic or proteomic information [5, 6]. This occurs because a simple change in the expression level of a gene or protein does not necessarily correlate directly with a variation in the activity level of a protein, but an alteration in a metabolite only occurs through such a change [7]. Consequently, me-tabolomics has been used to identify disease biomarkers [8, 9], to aid in the drug discovery process [10, 11], and to study plants [12], bacteria [13, 14], nutrition [15], and the envi-ronment [16], among numerous other applications [17]. However, metabolomics experiments are plagued with difficulty. The number of small-molecule metabolites in a biofluid, cell lysate, tissue or organ differs wildly depending on the organism studied, ranging from several hundred to hundreds of thousands [18]. Metabolomics is also a rela-tively new discipline and as a result a complete catalog of the human metabolome and the metabolomes of other organisms is not available [19]. Therefore, it is common to encounter unknown metabolites, a complication in the analysis and interpretation of metabolic changes. Similarly, the lack of
*Address correspondence to this author at the University of Nebraska-Lincoln, Department of Chemistry, 722 Hamilton Hall, Lincoln, NE 68588-0304, USA; Tel: (402) 472-3039; Fax: (402) 472-9402; E-mail: [email protected]
reference NMR or MS spectra for all known metabolites makes proper identification of metabolites challenging [20-22]. Further, the exhibited diversity of chemical and physical properties of compounds within the metabolome makes true metabolomics (simultaneous quantification of all metabo-lites) unattainable with current instrumental capabilities [1, 18, 23]. As an illustration, the limited molecular-weight dis-tribution of the metabolome prohibits a comprehensive and detailed analysis by mass spectroscopy and generally re-quires the additional use of chromatography [2, 24]. The analysis of metabolomic data is further complicated by the inherent variability in each sample. Every single cell, tissue, organ or organism is fundamentally unique [25], de-spite any defining feature they share in common, such as being the same species, infected with the same disease or receiving the same drug treatment. As such, the overall goal of metabolomics is to identify the few chemical features against a large and complex background of metabolites that uniquely define the system [20, 26]. These few chemical features or metabolites should be directly related to the de-fining characteristic of the system. But, unfortunately, all biological systems are easily perturbed by any number of experimental or environmental factors, such as age, diet, growth phase, media, nutrients, pH, sex, and temperature [27, 28]. Similarly, cell lysis, enzyme quenching and me-tabolome extraction techniques, and the storage of the me-tabolomics samples can also induce undesirable variations. There are also unavoidable fluctuations in spectral data, such as changes in peak position or peak width that are caused by instrument instability and variability in sample conditions. As a result, the analysis of metabolomic data requires a ro-bust methodology to expose underlying trends in these highly complex and variable data sets. One class of methods, appropriately termed “metabolic fingerprinting,” aims to retain much of the promised unbi-ased, global nature of the metabolomics experiment by dif-
2213-2368/13 $58.00+.00 © 2013 Bentham Science Publishers

Multivariate Analysis in Metabolomics Current Metabolomics, 2013, Vol. 1, No. 1 93
ferentially analyzing spectral information acquired from normal and perturbed systems [29]. Again, a perturbed sys-tem may result from a disease state, a drug treatment, the presence of a pest or parasite, an environmental stimulus (pH, temperature, toxin, or nutrient change), a temporal, spa-tial, or species difference. Metabolic fingerprinting is also amenable to high throughput data collection and analysis, since global metabolite profiling can be accomplished with minimal samples and rapid spectral acquisitions [30]. The goal of metabolic fingerprinting experiments is to determine the relative differences between the metabolomes of two or more systems to infer a biological relationship. Thus, a hall-mark of metabolic fingerprinting is the use of multivariate analysis methods to identify those biologically relevant spec-tral features for further targeted analyses [1, 23, 31], with two of the most popular methods being principal component analysis (PCA) [32, 33] and partial least squares projection to latent structures (PLS) [34, 35]. In essence, PCA and PLS aim to differentiate between classes in highly complex data sets, despite within class variability. These multivariate analysis methods will be briefly described, along with a dis-cussion of their application to metabolomics, with an empha-sis on common errors and misconceptions.
METABOLOMICS DATASETS
The choice of analytical method used for metabolic fin-gerprinting experiments is limited primarily by its ability to reveal metabolic differences due to system perturbations. Other desirable features include minimal sample prepara-tions or requirements, and the ability to analyze the sam-ples in a high-throughput manner. High-resolution 1H NMR spectroscopy is especially suited for probing biofluids, cell lysates and tissues with almost no sample treatment and without bias [36, 37]. Mass spectrometry is similarly em-ployed for metabolic fingerprinting and is typically favored
for its sensitivity in more global metabolic profiling appli-cations, but generally requires upstream chromatographic separations due to the limited molecular-weight diversity of metabolites [37-39]. Raman and Fourier-transform infrared (FT-IR) spectroscopies have also been successfully utilized [31, 40] for metabolomic studies, and capillary electropho-resis has recently been shown to provide useful data [41, 42] in fingerprinting experiments. The remarkable diversity of instrumental approaches used in metabolic fingerprinting experiments is traceable in large part to the flexibility of the multivariate analysis tech-niques used to analyze the collected data. A data matrix X, containing N observation row vectors of K variables each, is almost universally common [34, 43, 44], and very few mathematical constraints are placed on the values it holds. Correspondingly, NMR, MS, FT-IR, or any other source of spectral data can be used as input into the data matrix X. However, as discussed below, preprocessing of the data ma-trix is essential to yield interpretable results. This data matrix X can be immediately decomposed using unsupervised di-mensionality reduction methods, such as PCA, or it can be paired with a matrix Y of N corresponding M-dimensional outputs for use in supervised dimensionality reduction, in the case of PLS regression (PLSR) and its descendants. An out-put may range from a simple class membership designation [35] to a range of observables [45], such as patient histories (age, sex, weight, etc.). While the same mathematical flexi-bility also applies to outputs, metabolic fingerprinting data typically stores binary (or n-ary) class membership informa-tion in Y, in which case the applicable supervised methods are forms of discriminant analysis (PLS-DA, OPLS-DA). A graphical representation of the data (X) and response (Y) matrices, along with their PCA/PLS decomposition, is shown in Fig. (1).
Fig. (1). Canonical example of the data (X) and response (Y) matrices and decompositions thereof used by projection-based multivariate analysis algorithms. In metabolic fingerprinting applications, the data matrix will contain spectral information on its rows, such that every column will represent a single spectral frequency or bin. For supervised projections, each row of data is paired with a corresponding row in the response matrix that holds either continuously varying outputs or binary (n-ary) class memberships. The data is then decomposed into a small number of score vectors (t) and loading vectors (p), with a corresponding weight vector (w) used to transform rows of X to scores space. Responses are similarly decomposed into scores (u) and loadings (c), where t is an effective estimator of u. Adapted with permission from reference [35], (Copyright 2001 Elsevier).

94 Current Metabolomics, 2013, Vol. 1, No. 1 Worley and Powers
Simply, the primary goal of PCA and PLS is to identify class differences from a multivariate dataset. A class can refer to any biologically relevant classification, such as humans treated with a specific diet or drug; or cells ex-posed to particular environmental stress (temperature, pH, osmolality, etc.), or different genetic modification to an organism. An NMR, MS, or FT-IR spectrum of a biofluid or metabolome extract is an observation: a vector of K variables, where each spectrum represents an individual cell culture, tumor or organism. The entire collection of N observations forms the data matrix X. PCA and PLS then identify a combination of the K variables or spectral fea-tures that defines the class separation.
A key characteristic of metabolic fingerprinting datasets is an excess of observed variables (K) in comparison to the number of observations (N), belonging to the so-called ‘large K, small N’ class of problems in statistics [46]. This feature makes traditional linear regression methods infeasi-ble, as X is no longer invertible (i.e. it is singular) and no unique least-squares solution exists. Consequently, analysis of metabolomics data requires the use of multivariate analysis methods capable of dealing with significant amounts of collinearity in X, of which PCA and PLS are prime examples.
LINEAR TRANSFORMATIONS
The ultimate goal of the multivariate dimensionality re-duction algorithms discussed herein is to find a K-by-P ma-trix A that optimally transforms the data matrix X into a new matrix of P-dimensional scores given by T:
T = XA (1)
Thus, each row of T is a transformation of the corre-sponding row of X. Alternately, expressing the i-th row of X as a column vector xi and the corresponding row of T as a column vector ti shows that the so-called ‘weights’ matrix AT defines a linear transformation from the input data space occupied by X to the output space of T, termed the ‘scores’ space:
ti = AT xi (2)
In the case where P is less than K, the dimensionality of the scores space will be less than that of the input data space and the above transformation has achieved dimensionality reduction. This is a key characteristic of multivariate analysis in metabolic fingerprinting. Finally, the optimal transforma-tion by matrix A depends on the chosen algorithm, such as PCA, PLS, or OPLS.
PRINCIPAL COMPONENT ANALYSIS
Principal component analysis (PCA) is arguably the most widely used multivariate analysis method for meta-bolic fingerprinting and, in fact, chemometrics in general. The objective of PCA is to arrive at a linear transformation that preserves as much of the variance in the original data as possible in the lower dimensionality output data [44]. It can be shown [44] that the transformation A that achieves
this objective is a matrix whose columns are the first P ei-genvectors of the non-singular portion of the sample co-variance matrix S:
S =
1N !1
X T HX = Q"Q!1 (3)
Here, H is the N-by-N centering matrix used to center each variable about its sample mean. The second equality above describes the form of the eigendecomposition of S, where Q is the matrix of eigenvectors of S and Λ is a diago-nal matrix of the corresponding eigenvalues. When X is left unscaled, the eigenvalues in Λ equal the variances of the newly transformed data in T, providing a means to calculate the ratio of variance preserved during the transformation relative to the original variance:
Ri2
=!ii
j=1
N
" S jj
(4)
where Ri2 is the amount of variance in X preserved in the
i-th principal component. Given the fact that !ii decreases monotonically with i, it can be seen that each principal com-ponent preserves progressively less variance of the original data.
PARTIAL LEAST SQUARES
While the unsupervised nature of the PCA algorithm provides a means to achieve unbiased dimensionality re-duction, its application only reveals group structure when within-group variation is sufficiently less than between-group variation. Therefore, supervised forms of discrimi-nant analysis such as Partial Least Squares (PLS-DA; alter-natively Partial Least Squares Projections to Latent Struc-tures [35]) that rely on the class membership of each obser-vation are also commonly applied in metabolic fingerprint-ing experiments [35, 47]. When class memberships are coded in matrix form into Y [47] and the PLS components are constrained to be orthogonal, the dimensionality-reducing transformation A is a matrix whose columns are the first P eigenvectors of a matrix formed by the covari-ances between X and Y:
S = Sxy Syx =1
N !1( )2
X T HYY T HX (5)
where H is again the centering matrix and the eigendecom-position takes an identical form to that shown for PCA. Thus, the new ‘latent variables’ formed by this transforma-tion are linear combinations of original variables that pre-serve as much covariance between X and Y as possible in the first transformed dimensions; simply put, the low-dimensional scores space is formed predominately by the predictive components of X. This casting of PLS-DA as an eigendecomposition problem [48] is of course, complemen-tary to the usual description of the algorithm as an iterative regression problem that more closely resembles the roots of

Multivariate Analysis in Metabolomics Current Metabolomics, 2013, Vol. 1, No. 1 95
PLS regression [34, 35]. However, it provides a means to contrast the results of PLS-DA with those of PCA. In fact, placing every observation into its own class, effectively set-ting Y to the identity, yields an identical eigenvector problem to that of PCA.
It is far more common, however, to find descriptions of PLS-DA that do not impose orthogonality of the PLS com-ponents; these methods require instead that the X scores be uncorrelated, closer to traditional PLS regression [35]. The popular form of PLS-DA under this condition is then:
X = X + E = TPT+ E (6)
Y = Y + G = UCT+ G (7)
where T and P are the scores and loadings for X, U and C are the scores and loadings for Y, and E and G are the re-sidual errors of X and Y that are left unaccounted for in the model. Decomposition is performed such that T and U share maximum covariance, in effect allowing T to serve as an estimator of U. These equations emphasize the fact that PLS finds a small set of scores and loadings – the latent structures – which most effectively summarize X and Y as well as describe their correlation. Until recently, this tradi-tional PLS regression method was referred to as Partial Least Squares due to its use of Non-linear Iterative Partial Least Squares (NIPALS) for estimating model parameters. With the introduction of PLS to chemometrics, an alterna-tive meaning of ‘Projection to Latent Structures’ has also been used for the methods of Partial Least Squares regres-sion [35].
ORTHOGONAL PROJECTION TO LATENT STRUC-TURES
The utilization of class memberships in PLS-DA allows the algorithm to better expose separations between classes in scores space. However, variation not directly correlated with Y is still present in the scores. This complicates inter-pretation of PLS-DA scores and loadings plots, especially as the number of classes increases [43]. Orthogonal Projec-tions to Latent Structures (OPLS) addresses this interpret-ability problem by incorporating an Orthogonal Signal Cor-rection (OSC) filter [49-51] into a PLS model, effectively separating Y-predictive variation from Y-uncorrelated variation in X:
X = X + Xo + E = TPT+ ToPo
T+ E (8)
where To and Po are the scores and loadings, respectively, for the Y-uncorrelated variation identified by the OSC filter. The predictive OPLS-DA scores and loadings used to estimate Y are then composed of variation directly correlated with Y and free of interfering structured variation, yielding enhanced interpretability when compared with PLS-DA [43, 52]. Fi-nally, it is important to note that OPLS-DA provides no pre-dictive advantage over PLS-DA [53]; in fact, when no Y-uncorrelated variation exists in X, OPLS-DA will yield an identical model to PLS-DA.
METHOD SELECTION
In designing experiments for metabolic fingerprinting studies, the choice of multivariate analysis method must be driven by the data and the experimental goals. For explora-tory studies where metabolomic differences between ex-perimental groups may be unknown or unpredictable, initial application of PCA provides an informative first look at the dataset structure and relationships between groups. Even when dataset structure may be predictable, initial use of un-biased methods like PCA provide further confirmation prior to analysis by supervised methods. Ideally, the results of PCA analyses would be used to formulate an initial biologi-cal conclusion, which PLS or OPLS can then verify and test in more detail. The principal reason for this is due to the fact that separation is only observed between groups in PCA scores when within-group variation is significantly less than between-group variation in the data, while separation in PLS scores may simply be fortuitous. Therefore, PLS classifica-tion guided by well-separated PCA scores has a greater like-lihood of producing biologically relevant results.
DATA PREPROCESSING
Pre-treatment of raw spectral data is critical for generat-ing reliable, interpretable models using multivariate analysis techniques. A summarization of the procedures involved for preprocessing of metabolic fingerprinting datasets has been well described, and efforts have been made to standardize the processes [54, 55]. Nevertheless, depending on the in-strumental technique, the experimenter must adopt certain procedures to obtain an optimal model.
BINNING AND ALIGNMENT
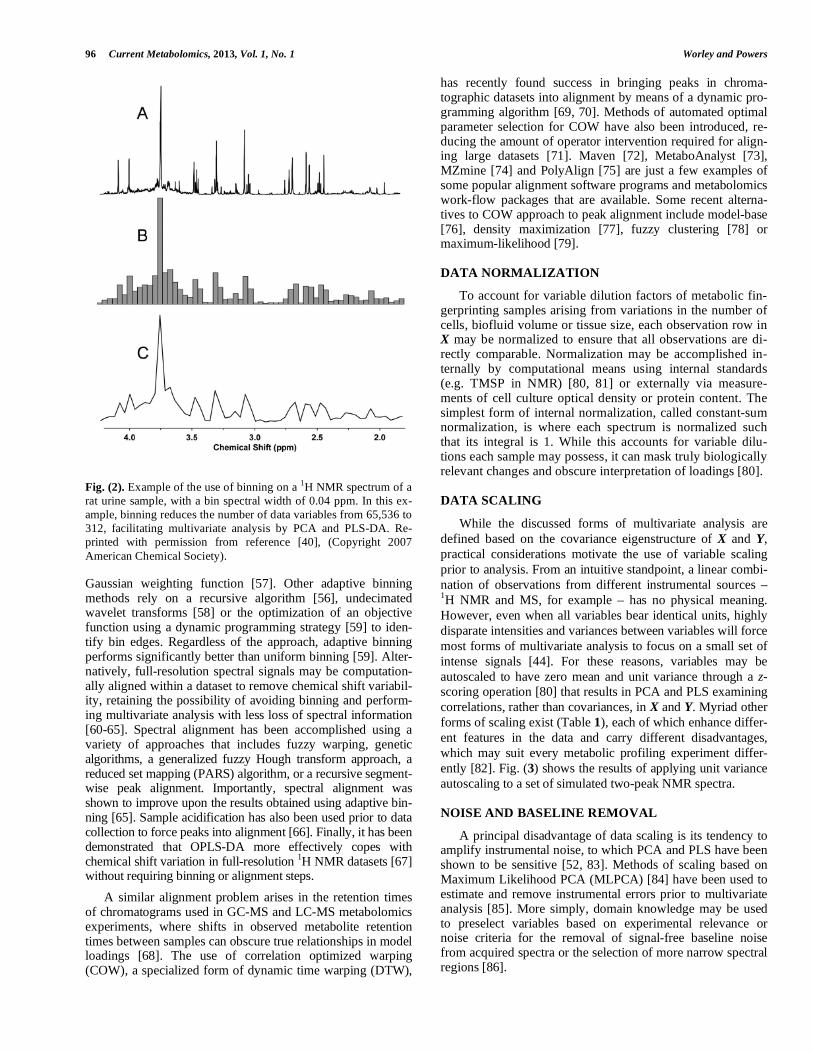
As 1H NMR chemical shifts vary at times with a strong dependence on temperature, pH, ionic strength, and other factors that influence their electronic environment, metabolic fingerprinting datasets acquired from NMR spectrometers suffer from imprecisions in chemical shifts, and thus in the X variables. Therefore, models generated using PCA or PLS-DA on full-resolution 1H NMR spectra may fail to identify separations between classes, and their loadings can be diffi-cult to interpret due to the over-abundance of variables. These complications from chemical shift variations may be mitigated by uniformly dividing each spectrum into ‘bins’ having typical spectral widths of 0.04 ppm and integrating signal intensities within each bin to produce a smaller set of variables. A representative example of a binned 1H NMR spectrum is given in Fig. (2), showing the appreciable loss of resolution typically incurred. The binning procedure not only masks subtle chemical shift differences and filters noise in spectra, but it also hides potentially significant changes of low-intensity peaks nearby strong signals. Additionally, uniform binning incurs the risk of splitting peaks or spectral features between bins, recreating the imprecision in the X variables that the preprocessing set out to correct. “Intelligent” or “adaptive” binning endeavors to evade this problem by using variable bin sizes that avoid dividing peaks between multiple bins [56-59]. A recent ker-nel-based method of binning seeks to optimally reduce vari-able count while retaining spectral information by applying a
96 Current Metabolomics, 2013, Vol. 1, No. 1 Worley and Powers
Fig. (2). Example of the use of binning on a 1H NMR spectrum of a rat urine sample, with a bin spectral width of 0.04 ppm. In this ex-ample, binning reduces the number of data variables from 65,536 to 312, facilitating multivariate analysis by PCA and PLS-DA. Re-printed with permission from reference [40], (Copyright 2007 American Chemical Society). Gaussian weighting function [57]. Other adaptive binning methods rely on a recursive algorithm [56], undecimated wavelet transforms [58] or the optimization of an objective function using a dynamic programming strategy [59] to iden-tify bin edges. Regardless of the approach, adaptive binning performs significantly better than uniform binning [59]. Alter-natively, full-resolution spectral signals may be computation-ally aligned within a dataset to remove chemical shift variabil-ity, retaining the possibility of avoiding binning and perform-ing multivariate analysis with less loss of spectral information [60-65]. Spectral alignment has been accomplished using a variety of approaches that includes fuzzy warping, genetic algorithms, a generalized fuzzy Hough transform approach, a reduced set mapping (PARS) algorithm, or a recursive segment-wise peak alignment. Importantly, spectral alignment was shown to improve upon the results obtained using adaptive bin-ning [65]. Sample acidification has also been used prior to data collection to force peaks into alignment [66]. Finally, it has been demonstrated that OPLS-DA more effectively copes with chemical shift variation in full-resolution 1H NMR datasets [67] without requiring binning or alignment steps. A similar alignment problem arises in the retention times of chromatograms used in GC-MS and LC-MS metabolomics experiments, where shifts in observed metabolite retention times between samples can obscure true relationships in model loadings [68]. The use of correlation optimized warping (COW), a specialized form of dynamic time warping (DTW),
has recently found success in bringing peaks in chroma-tographic datasets into alignment by means of a dynamic pro-gramming algorithm [69, 70]. Methods of automated optimal parameter selection for COW have also been introduced, re-ducing the amount of operator intervention required for align-ing large datasets [71]. Maven [72], MetaboAnalyst [73], MZmine [74] and PolyAlign [75] are just a few examples of some popular alignment software programs and metabolomics work-flow packages that are available. Some recent alterna-tives to COW approach to peak alignment include model-base [76], density maximization [77], fuzzy clustering [78] or maximum-likelihood [79].
DATA NORMALIZATION
To account for variable dilution factors of metabolic fin-gerprinting samples arising from variations in the number of cells, biofluid volume or tissue size, each observation row in X may be normalized to ensure that all observations are di-rectly comparable. Normalization may be accomplished in-ternally by computational means using internal standards (e.g. TMSP in NMR) [80, 81] or externally via measure-ments of cell culture optical density or protein content. The simplest form of internal normalization, called constant-sum normalization, is where each spectrum is normalized such that its integral is 1. While this accounts for variable dilu-tions each sample may possess, it can mask truly biologically relevant changes and obscure interpretation of loadings [80].
DATA SCALING
While the discussed forms of multivariate analysis are defined based on the covariance eigenstructure of X and Y, practical considerations motivate the use of variable scaling prior to analysis. From an intuitive standpoint, a linear combi-nation of observations from different instrumental sources – 1H NMR and MS, for example – has no physical meaning. However, even when all variables bear identical units, highly disparate intensities and variances between variables will force most forms of multivariate analysis to focus on a small set of intense signals [44]. For these reasons, variables may be autoscaled to have zero mean and unit variance through a z-scoring operation [80] that results in PCA and PLS examining correlations, rather than covariances, in X and Y. Myriad other forms of scaling exist (Table 1), each of which enhance differ-ent features in the data and carry different disadvantages, which may suit every metabolic profiling experiment differ-ently [82]. Fig. (3) shows the results of applying unit variance autoscaling to a set of simulated two-peak NMR spectra.
NOISE AND BASELINE REMOVAL
A principal disadvantage of data scaling is its tendency to amplify instrumental noise, to which PCA and PLS have been shown to be sensitive [52, 83]. Methods of scaling based on Maximum Likelihood PCA (MLPCA) [84] have been used to estimate and remove instrumental errors prior to multivariate analysis [85]. More simply, domain knowledge may be used to preselect variables based on experimental relevance or noise criteria for the removal of signal-free baseline noise from acquired spectra or the selection of more narrow spectral regions [86].

Multivariate Analysis in Metabolomics Current Metabolomics, 2013, Vol. 1, No. 1 97
Table 1. Listing of Most Commonly Used Data Scaling Methods in Metabolic Fingerprinting Multivariate Analyses.1
Method Equation Goal Advantage Disadvantage
Centering %xik = xik ! xk Focus on differences, not similari-
ties Removes offset from the data Unsuitable for heteroscedastic
data
UV
%xik =
xik ! xksk
Compare metabolites based on correlation
All metabolites equally impor-tant
Inflation of measurement errors
Range
%xik =xik ! xk
xk ,max ! xk ,min
Compare metabolites relative to biological response range
All metabolites equally impor-tant. Biologically related scal-ing
Inflation of measurement er-rors, sensitive to outliers
Pareto
%xik =xik ! xk
sk
Reduce relative importance of large values, partially preserve data structure
Stays closer to original meas-urement than UV
Sensitive to large fold changes
Vast
�
Focus on small fluctuations Aims for robustness, uses prior group knowledge
Not suited for large induced variation without group struc-ture
Level
%xik =
xik ! xkxk
Focus on relative response Suited for biomarker identifica-
tion Inflation of measurement errors
1Variable subscripts reflect conventions shown in Fig. (1), with the mean of the k-th variable in X represented by xk and its deviation represented by sk, the sample standard deviation.
Reprinted with permission from reference [82], (Copyright 2006 van den Berg et. al.).
Fig. (3). Demonstration of the effects of autoscaling to unit variance in simulated 1H NMR spectral data. (A) Set of 40 spectra containing two Lorentzian peaks having random intensities, summed with Gaussian baseline noise. (B) Spectra from above with mean-centering. (C) Spectra with mean-centering and autoscaling to unit variance, exhibiting amplification of noise in signal-free regions. Adapted with permission from reference [80], (Copyright 2006 American Chemical Society).
xik
=x
ikx
k
sk
ix
k
sk
98 Current Metabolomics, 2013, Vol. 1, No. 1 Worley and Powers
VARIABLE SELECTION
Due to the expense of sampling and data collection in metabolomics experiments, a tendency exists in metabolic fingerprinting studies to retain all collected variables for multivariate analysis [86]. Unfortunately, this exacerbates the aforementioned collinearity problem and increases the likelihood of finding spurious correlations in data, leading to a greater chance of inferring incorrect biological conclusions [46, 51]. While it is not typically performed during data ex-ploration, variable selection may be used conservatively in concert with domain knowledge to select only biologically meaningful regions of datasets for classification or dimen-sionality reduction. 1H NMR datasets, for instance, may con-tain highly varying signals from solvents, buffers and chemi-cal shift reference compounds, as well as large signal-free noise regions. These features may obscure biologically rele-vant variation and are good candidates for variable selec-tion/removal. Structured noise (baseline issues, contami-nants) negatively affects the correspondence between scores and loadings and hinders the correct interpretation of PLS results [87]. OPLS can separate out this structured noise, but often at the expense of an overly complex model [88]. There are significantly more variables (K) than observations (N) in a typical metabolomics dataset, so removing irrelevant vari-ables is beneficial to the multivariate analysis. A more ex-haustive variable selection approach applies a pretreatment based on orthogonal projections [89] or a recursive algorithm [90-92], support vector machine, genetic algorithm or ran-dom forest, to select for variables or spectral features primar-ily contributing to class separation. This is particularly perti-nent to MS metabolomics data that may contain a very large number of variables, of which only a small percentage is relevant. Importantly, either the complete absence of variable selection or an overly aggressive variable selection may lead to inadequate separation or over-fitting of the dataset, respec-tively [92, 93].
INTERPRETATION
Interpretation of multivariate analysis results of meta-bolic fingerprinting data for the purposes of inferring bio-logical importance must be done with care, bearing in mind the nature and goal of the algorithm used. Scatter plots of scores and loadings are no exception, particularly since dif-ferent axis scaling can produce misleading results [86, 94]. As an illustration, an observed difference in a scores plot comparing spectral data obtained from healthy and ill pa-tients may imply the existence of potential disease biomark-ers. Thus, it is imperative to verify that this variation is due to an underlying biological source instead of artifacts in-duced by the algorithm, sample handling or data processing.
SCORES
Scores produced by PCA and PLS are the observation rows of X projected onto a hyperplane within the data that describes the covariances of X, or the covariances between X and Y, respectively. In a nutshell, scores are good ‘summa-ries’ of the observations [35]. Because fewer predictive components are required to yield discrimination in OPLS-
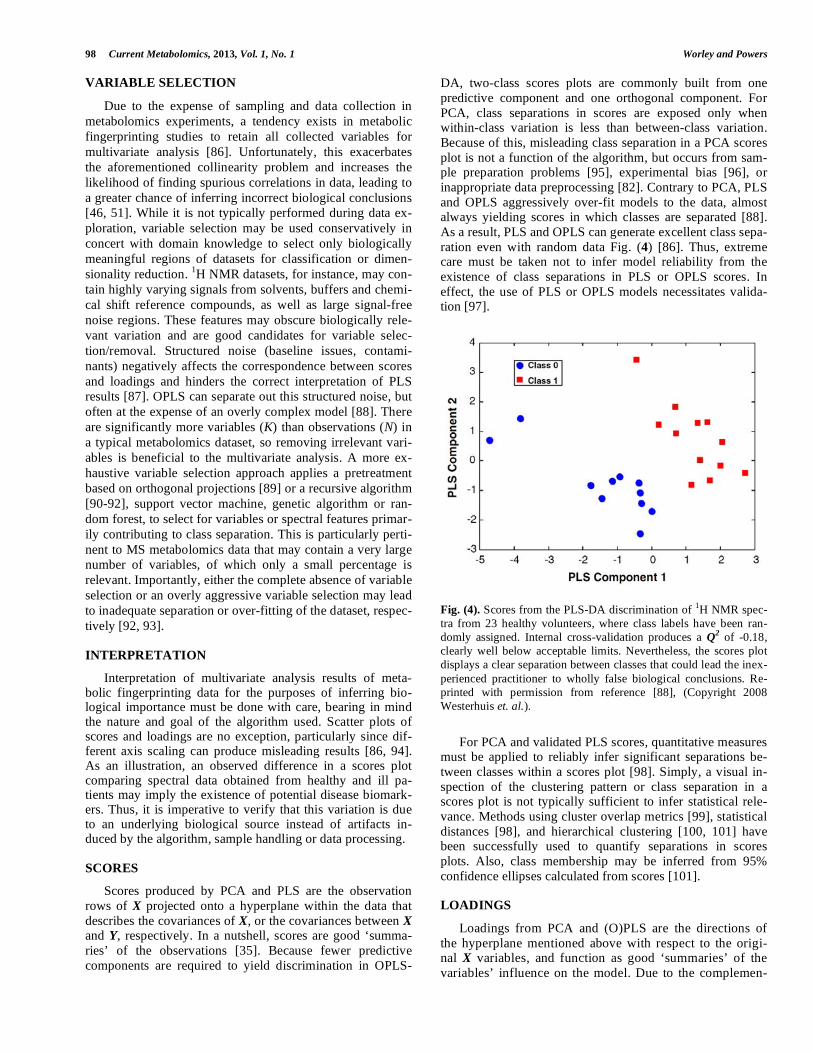
DA, two-class scores plots are commonly built from one predictive component and one orthogonal component. For PCA, class separations in scores are exposed only when within-class variation is less than between-class variation. Because of this, misleading class separation in a PCA scores plot is not a function of the algorithm, but occurs from sam-ple preparation problems [95], experimental bias [96], or inappropriate data preprocessing [82]. Contrary to PCA, PLS and OPLS aggressively over-fit models to the data, almost always yielding scores in which classes are separated [88]. As a result, PLS and OPLS can generate excellent class sepa-ration even with random data Fig. (4) [86]. Thus, extreme care must be taken not to infer model reliability from the existence of class separations in PLS or OPLS scores. In effect, the use of PLS or OPLS models necessitates valida-tion [97].
Fig. (4). Scores from the PLS-DA discrimination of 1H NMR spec-tra from 23 healthy volunteers, where class labels have been ran-domly assigned. Internal cross-validation produces a Q2 of -0.18, clearly well below acceptable limits. Nevertheless, the scores plot displays a clear separation between classes that could lead the inex-perienced practitioner to wholly false biological conclusions. Re-printed with permission from reference [88], (Copyright 2008 Westerhuis et. al.).
For PCA and validated PLS scores, quantitative measures must be applied to reliably infer significant separations be-tween classes within a scores plot [98]. Simply, a visual in-spection of the clustering pattern or class separation in a scores plot is not typically sufficient to infer statistical rele-vance. Methods using cluster overlap metrics [99], statistical distances [98], and hierarchical clustering [100, 101] have been successfully used to quantify separations in scores plots. Also, class membership may be inferred from 95% confidence ellipses calculated from scores [101].
LOADINGS
Loadings from PCA and (O)PLS are the directions of the hyperplane mentioned above with respect to the origi-nal X variables, and function as good ‘summaries’ of the variables’ influence on the model. Due to the complemen-
views, 2013, Vol. 9, No. 1

Multivariate Analysis in Metabolomics Current Metabolomics, 2013, Vol. 1, No. 1 99
tary nature of scores and loadings as explanations of the rows and columns of X, respectively, the two may be used in concert. Variables whose loadings are co-located away from the origin in a loadings plot may be inferred to be correlated. Moreover, variables with loadings in a given position in a loadings plot contribute heavily to observa-tions whose scores are found in a similar position in a scores plot. This requires proper normalization such that the scores and loadings are on the same scale, where the loadings closest to the scores are expected to have the highest contribution to class separation. The ease of inter-pretation of loadings is directly affected by the number of variables and the scaling method used, if any [82]. As indi-cated by (Table 1), scaling protocols emphasize different spectral features which will then perturb the influence of a particular variable on the model. In turn, the magnitude of the corresponding loadings will be proportionally affected. As an example, Pareto scaling is commonly used to reduce the influence of intense peaks while emphasizing weaker peaks that may have more biological relevance. The corre-sponding loadings of intense peaks will be reduced and loadings from weak peaks will be increased due to Pareto scaling. Loadings may also be examined on a per-component basis as a line plot, with the loading value plotted as de-pendent upon the spectral variables (ppm, m/z, v). This is especially valuable when full-resolution spectra are used as data. In this form, the loadings of each model component may be viewed as a spectrum or pseudo-spectrum, with large positive or negative excursions of a variable’s loading corresponding to a large positive or negative correlation with class structure, respectively. With full-resolution spec-tra and OPLS-DA models, this method of interpreting load-ings is highly useful for identifying metabolites contribut-ing to class differences [67, 102]. Pareto scaling has an added advantage in this context, as it better preserves spec-tral lineshapes in loading pseudo-spectra. Of course, large loadings corresponding to irrelevant spectral regions such as noise, artifacts, buffers, or solvent peaks, raise serious concerns about the biological relevance of the model.
WEIGHTS
The weights produced in A by multivariate analysis are the relative degrees of influence that each observed variable in X has on each of the latent structures in the model, and are used to transform new observation vectors from later meas-urements into scores space for the purposes of class predic-tion. A common misconception is misrepresenting loadings as weights for the purpose of identifying variable or metabo-lite contribution to class separation.
VALIDATION
PLS and OPLS have an innate tendency to over-fit models to data, even identifying excellent class separation in completely random variables as demonstrated in Fig. (4) [88]. For PLS and OPLS, validation is a critical step in en-suring model reliability. Truly honest model validation re-quires partitioning the data into a training set used to build
a model and a validation set used to assess predictive abil-ity of the model, where the validation set is in no way used to generate the trained model [103, 104]. Few practitioners have adopted this method of validation because of the low sample count in metabolic fingerprinting experiments and the costly nature of sample preparation and data acquisi-tion. Instead, internal cross-validation is routinely em-ployed, where the leave-one-out method is a common choice [105]. However, it has been demonstrated that leave-one-out internal cross-validation should be aban-doned [106-108] in favor of the more consistent leave-n-out method.
In the leave-n-out method, the data is partitioned into N-choose-n subsets, where each of the subsets is then used as a validation set [109, 110]. As true leave-n-out cross-validation is computationally inefficient, Monte Carlo cross-validation may be utilized to rapidly estimate model predic-tion ability [111, 112]. The quality assessment ( Q
2 ) statistic is typically reported as a result of cross-validation and pro-vides a qualitative measure of consistency between the pre-dicted and original data. Even still, Q
2 has no standard of comparison or critical value for inferring significance, aside from its theoretical maximum of 1 or an empirically inferred acceptable value of ≥ 0.4 for a biological model [88]. Unfor-tunately, an invalid or irrelevant model is still capable of producing a large Q
2 value, since consistent cross-validation requires a systematic deletion of large portions of its dataset during training. One solution recently demonstrated for me-tabolomics combines random permutation of class labels, which requires no deletion of data, with internal leave-n-out cross-validation [88]. The approach produces a distribution of Q
2 values suitable for testing the null hypothesis for a model’s Q2. In essence, a reliable model should yield a sig-nificantly larger Q
2 value compared to Q2 values generated
from random models using the same data set. The technique is also valid for testing null hypotheses for the area under Receiver Operating Characteristic (ROC) curves (AUROC) statistic and misclassification count. Another method, the CV-ANOVA, uses the cross-validated predictive residuals of a model as a basis for hypothesis testing [97].
Also, while they are not strictly a cross validation meas-ure, the R2 values of a given model may be used to assess its degree of fit to the data [35, 44]. PCA decompositions will return only R2 X , the degree to which the principal compo-nents describe the observation data, and PLS decompositions will return both R2 X and R2Y. Due to its division of X into
X and Xo , OPLS splits R2 X into R2 X p and R
2 Xo , the
explained sum of squares of the Y-predictive and Y-uncorrelated components of X, respectively. Highly disparate
R2 and Q2 values (i.e. R2 >>Q2) are an indicator of possible
model over-fitting in supervised analyses.

100 Current Metabolomics, 2013, Vol. 1, No. 1 Worley and Powers
APPLICATIONS
Raman and NMR Fingerprinting of Rat Urine
The application of Raman spectroscopy to the study of metabolite fingerprints has occurred only relatively recently compared with the more mature NMR and MS techniques [31]. A comparative analysis demonstrates Raman spectros-copy offers complementary spectral information to NMR [40]. In the study, three groups of rats were orally fed differ-ent triazole fungicides, and a fourth group was fed only the drug carrier vehicle as a control. After five days of exposure, urine was collected from the rats and subjected to both 1H NMR and Raman spectroscopy. NMR spectra were acquired on a Varian Inova 800 spectrometer with a spectral width of 12.5 ppm over 64k data points using a standard 1D pre-saturation pulse sequence. Peaks corresponding to the sol-vent, urea and carrier vehicle were removed from the spectra, which were then truncated to 0.5 – 9.5 ppm extents and inte-grated into 0.04 ppm-wide bins. The NMR bins were then mean-centered and Pareto scaled [82] prior to PCA. While collection and PCA of Raman spectra was per-formed in similar fashion to the NMR data, several marked differences exist. First, samples for Raman analysis were subjected to ultrafiltration to remove fluorescent biomacro-molecules having molecular weights greater than 500 Da. While the filtration step reduced biologically irrelevant chemical noise in the collected spectra, the authors noted that the tricarboxylates citrate, trans-aconintate, and oxoglutarate were significantly removed in the process. Raman spectra were then collected with 785 nm laser excitation at ~5 cm-1 resolution between ~3280 – 95 cm-1. Unlike the collected NMR spectra, Raman peaks showed no significant pH-
dependent variation, permitting the full spectral resolution to be used in PCA without binning or alignment. Spectra of urea and sodium azide were subtracted from each spectrum, which were then truncated to 1705 – 467 cm-1, mean-subtracted, normalized to constant AUC and submitted to PCA and PLS-DA. Fig. (5) shows a comparison of the PCA scores produced by the collected NMR and Raman datasets. From the scores, it can be seen that the within-class variation of the Raman spectra is noticeably lower than that of the NMR spectra, effectively showing a better separation for the collected samples. However, due to the low number of spectra col-lected for each experimental class, it is difficult to judge class separations on a statistical basis. The authors note that PCA captured a greater percentage variance of the Raman spectra than the NMR spectra, suggesting better perform-ance. This use of captured variance is incorrect, however, as captured variance is a relative measure that only describes model performance for any given dataset and not between different datasets. Finally, two-class PLS-DA was used to find loadings in the Raman spectra that discriminated between each fungicide treatment and the control. Significant changes in the loadings were found to coincide with transitions of the metabolites allantoin, creatine, alanine, taurine, acetate and hippurate. However, no measures of validation were provided to lend statistical credence to the observed metabolite changes. The class distinction present in the PCA scores plot does suggest the same class separation in the PLS-DA is likely correct. But, the PLS-DA model could still be over-fitted to the data, leading to an invalid model and incorrect loadings. As a re-
Fig. (5). Scores from PCA decomposition of (A) 1H NMR and (B) Raman spectra of rat urine metabolites, demonstrating the use of PCA to compare within- and between-group variation datasets from complementary instrumental sources. In this example, the captured variances on each plot reflect the relative effectiveness of PCA to approximate the input data, and may not be used as a standard of comparison. Reprinted with permission from reference [40], (Copyright 2007 American Chemical Society).

Multivariate Analysis in Metabolomics Current Metabolomics, 2013, Vol. 1, No. 1 101
sult, the identified metabolites could be biologically irrele-vant. This is not necessarily true, but it is plausible outcome in the absence of a validated PLS-DA model. Nevertheless, the study does provide an illustrative proof-of-principle for Raman spectroscopy-based metabolic fingerprinting which, with further tuning, promises to be a useful instrumental platform for metabolomics.
Discrimination of French Labeled Brandies
While the metabolite profiles of many brandies were pre-viously known, marker metabolites that could be used to discriminate between different types of brandy were not identified. Such metabolites could be used in determination of the origin and authenticity of French labeled brandies. To that end, gas chromatography mass spectrometry (GC-MS) analyses of Cognac, Armagnac, Calvados and Mirabelle were analyzed and subjected to PLS-DA [113]. Ethyl unde-canoate and 4-methylpentan-2-ol were added to the brandy samples for use as internal standards, and two liquid-liquid extractions were used to isolate the volatile organic mole-cules from the samples. Peaks in the collected GC-MS spectra having a signal-to-noise greater than 10 were linked with compounds using database searches based on electron impact spectra and re-tention indices; the resulting intensities of all compounds were then normalized to the internal standards. The data ma-trix was then generated using the calculated relative com-pound concentrations, which were mean-centered and autoscaled to unit variance prior to PLS-DA. This particular study highlights the flexibility of multivariate analysis meth-ods to accept any type of variable, not only raw spectral in-formation, for modeling purposes in metabolomics.
Fig. (6) shows the variable loadings from PLS-DA plot-ted for the two discriminatory components found in the GC-MS dataset. The authors understandably described the load-ings as weights in the manuscript, a confusing description
exacerbated by the SIMCA (UMETRICS) nomenclature for PLS loadings ( w
*c[n] ). Unfortunately, the SIMCA loadings nomenclature appears startlingly similar to the PLS regres-sion coefficients [35], the product of X-weights and Y-weights, and not the loadings. However, in PLS loading plots of this type, the X-weights ( w* ) and Y-weights (c) are sim-ply plotted together – not multiplied – in order to expose the correlation structure between X and Y. The loadings for each type of brandy in scores space were printed on the loadings plot to aid in identifying compounds that contribute most to the discrimination between each of the beverage types. Im-portantly, loadings must be non-zero along any principal component axis to have any contribution to the model.
Each loading is correlated to a particular X-variable, in this case the molecular-weight of a particular metabolite. Thus, the loadings strongly correlated with scores for each type of brandy identify metabolites that may uniquely de-scribe or characterize that particular brandy. While the vola-tile compound identification and quantification procedure resulted in a great wealth of useful information, no validation statistics were provided to justify the discriminatory com-pounds selected from the PLS-DA loadings. Again, the lack of appropriate validation is a common problem among the metabolomics community.
Correlations of Human Gut Microbiome with Urine Me-tabolites
Studies have shown that the microbiome – the sum total of all microbial organisms – of the human gastrointestinal tract has a great impact on individual metabolite profiles, even when genetic variations are minimized [114]. Changes in the symbiotic gut microbes correlate with phenotypic variations observed between gender and across ethnicities, and are implicated in many forms of human pathology. Re-
Fig. (6). PLS-DA loadings for volatile compound composition of French labeled brandies. Clustering patterns of variables reveal relevance of those X variables to the responses in Y. The Y-weights for each type of brandy are labeled and represented as squares, and the X-weights are represented as numbered triangles. Variable numbers relate to volatile compounds identified by GC-MS analysis, with the identity and amount of each compound may be found in reference [113]. Reprinted with permission from reference [113], (Copyright 2010 American Chemical Society).

102 Current Metabolomics, 2013, Vol. 1, No. 1 Worley and Powers
cent work based on the gut microbiomes and urine metabolic fingerprints of Chinese family members has shed light onto correlations between gut flora and phenotype [45].
In the study by Li et al., selected portions of the bacterial genomes of family members’ gut microbiota were subjected to denaturing gradient gel electrophoresis (DGGE), and urine samples were also collected from each family member and analyzed by 1H NMR spectroscopy. OPLS-DA was used to identify gender-predictive components of the DGGE gels and NMR spectra. The Q
2 value of each variable obtained by five-fold internal cross-validation was used to identify statistically reliable loadings in the OPLS-DA models. Spe-cies of Clostridia, Bacteroidetes and Proteobacteria were found to be predictive of gender based on DGGE gels, and 3-aminoisobutyrate and creatine were found to predict gender from the NMR spectra.
A cross-correlation analysis was also performed to model the DGGE gel bands using NMR spectral data, and vice versa, using OPLS regression. Again, five-fold internal cross-validation was performed to ensure model reliability, and the predictions of NMR peaks and DGGE bands made by the model were color-coded according to Q
2 to facilitate rapid identification of significant correlations. A correlation matrix was also constructed to show peaks in the collected NMR spectra that co-varied with bands in the DGGE gel.
Fig. (7) summarizes the results of the cross-correlation analysis. This study highlights a powerful use of OPLS, both in discrimination and regression applications, as well as the use of cross-validation statistics.
Analysis of Bacterial Metabolic Signaling of Stress Re-sponse
It has been shown that the stress response of prokaryotic organisms contains a metabolic sensing component, centered around the tricarboxylic acid (TCA) cycle and sensed by catabolite control protein A (CcpA), that effects downstream signaling networks involved in virulence factor presentation and biofilm formation [115]. Metabolic fingerprinting using 1H NMR spectroscopy was conducted to further examine the effects of external biofilm-inducing perturbations on the me-tabolome of Staphylococcus epidermidis [116]. Metabolite mixtures were collected from wild-type cells, as well as cells exposed to sodium chloride, glucose, tetracycline, ethanol, iron-depleted media, and an aconitase deletion mutation.
PCA analysis of the NMR spectra revealed that the so-dium chloride-treated cells grouped with the wild-type in scores space. All other observations on treated cells group together in scores space except for glucose treatment, which clustered separately from all observations. The separations between classes in the PCA scores were used to define two classes for a subsequent OPLS-DA analysis, with wild-type
Fig. (7). Cross-correlation analysis between the DGGE gel in (A) and collected 1H NMR spectra of urine metabolites. (B) Prediction of DGGE bands using NMR spectra. (C) Correlation matrix relating the aromatic region of collected NMR spectra to DGGE bands. Red indi-cates positive correlation greater than 0.7 and blue indicates negative correlation of the same magnitude or greater. (D) Prediction of the
NMR spectral aromatic region based on DGGE data. Both predictions from OPLS regression are colored according to Q2 obtained from
cross-validation. Reprinted with permission from reference [45], (Copyright 2008 National Academy of Sciences of the USA).

Multivariate Analysis in Metabolomics Current Metabolomics, 2013, Vol. 1, No. 1 103
and salt-treated cells discriminated from all other observa-tions. Fig. (8) shows the OPLS scores plot and dendrogram resulting from decomposition into one Y-predictive compo-nent and three Y-uncorrelated components. In the OPLS model, the explained sum of squares for X and Y were found to be 0.637 and 0.966, respectively. It is important to note that the reported R2 X of 0.637 includes Y-uncorrelated variation, and is therefore not a measure of modeled predic-tive variation. Leave-n-out internal cross-validation resulted in a Q
2 value of 0.941, an acceptable value in light of the
models R2Y , but by no means conclusive. While it was not performed for the publication, a subsequent validation using CV-ANOVA provided a p-value of 0.0 – to within machine precision [117] – for the OPLS model.
Future Directions
Multivariate analysis of metabolic fingerprinting datasets is performed most often with the linear projection-based methods of PCA, PLS and OPLS, but these are by no means the only tools available. Hierarchical clustering analysis (HCA) and nearest-neighbor clustering may be applied to multivariate spectral data to reveal differences between classes without supervision. Support-vector machine (SVM) methods [118] have been applied to human urine me-tabolomics NMR [119], NIR and UV datasets [120] with enhanced predictive power over PLS-DA. Artificial neural networks (ANN) have also been used in combination with PCA for plant metabolic profiling and fingerprinting [121, 122]. In contrast to pure PCA and PLS, which model linear relationships, both SVM and ANN algorithms admit the use of a kernel function to allow for modeling of non-linear rela-tionships between X and Y. However, none of these methods provide quite the interpretative simplicity of projective ‘la-tent-space’ methods such as PCA and PLS. The metabolom-ics community is accustomed to drawing conclusions from
PCA and PLS results, but these new methods with their un-familiar analysis formats require further acclimation. Finally, the majority of multivariate analysis techniques used in metabolic fingerprinting are designed for ‘snapshot’ datasets, where the state of a system is observed at one or two highly distinct time points. However, as instrumental methods improve to accommodate measurement of highly time-resolved metabolite concentration changes, methods of multivariate analysis must be developed to cope with the new information [123]. Multi-way data analysis methods such as Parallel Factor Analysis (PARAFAC [124]), consen-sus PCA (CPCA) and multi-block PLS are all suited to par-ticular types of multi-way datasets [125]. Somewhat similar in form to time-resolved metabolomic datasets are those pro-duced by the fusion of data from orthogonal or complemen-tary instrumentation. For example, 1H NMR and LC-MS data matrices have been combined by multiple means to achieve improved PCA and PLS models [126]. GC-MS and LC-MS datasets [127], as well as near-IR and mid-IR spec-tral datasets [128] have been similarly fused for the purposes of multivariate analysis.
CONCLUDING REMARKS
Techniques such as PCA and PLS provide an essential platform for rapid interpretation of information-rich spectral datasets for inferring biological conclusions. Through proper application of preprocessing transformations, optimal choice of analysis algorithms, and judicious application of valida-tion metrics, MVA can lend a powerful hand in the biologi-cal understanding and exploration of complex, multiparamet-ric metabolic systems. Unfortunately, misunderstandings and the misuse of MVA can lead to misleading or erroneous bio-logical inferences. The few examples highlighted in this re-view are just a sampling of the large number of metabolom-ics studies with similar problems. Additionally, metabolom-ics has many data challenges left to be solved, and machine learning chemometrics methods have much to offer me-tabolomics.
Fig. (8). Results of OPLS-DA modeling of the metabolomic effects of six different stressors on S. epidermidis. (A) OPLS scores of all ex-perimental groups, showing the high observation counts for each group necessary for statistical treatment of scores. Ellipses around each group the 95% confidence regions of the groups under the assumption of normally distributed data. (B) Dendrogram built from OPLS scores-space data using Euclidean distances between the sample means of each group. Within-group substructure that was not forced during class discrimination is evident in the dendrogram. Group name colors in (B) correspond to scores colors in (A). Reprinted with permission from reference [116], (Copyright 2011 American Chemical Society).
104 Current Metabolomics, 2013, Vol. 1, No. 1 Worley and Powers
CONFLICT OF INTEREST
The authors confirm that this article content has no con-flicts of interest.
ACKNOWLEDGEMENT
Declared none.
REFERENCES [1] Lindon, J. C.; Nicholson, J. K.; Holmes, E.; Everett, J. R.
Metabonomics: Metabolic processes studied by NMR spectroscopy of biofluids. Concept Magnetic Res., 2000, 12, (5), 289-320.
[2] Kell, D. B. Metabolomics and systems biology: making sense of the soup. Curr. Opin. Microbiol., 2004, 7, (3), 296-307.
[3] Trethewey, R. N. Gene discovery via metabolic profiling. Curr. Opin. Biotechnol., 2001, 12, (2), 135-138.
[4] Weckwerth, W. Metabolomics in systems biology. Annu. Rev. Plant Biol., 2003, 54, 669-689.
[5] Navon, G.; Burrows, H.; Cohen, J. S. Differences in metabolite levels upon differentiation of intact neuroblastoma * glioma cells observed by proton NMR spectroscopy. FEBS Lett., 1983, 162, (2), 320-323.
[6] Pfeuffer, J.; Tkac, I.; Provencher, S. W.; Gruetter, R. Toward an in vivo Neurochemical Profile: Quantification of 18 Metabolites in Short-Echo-Time 1H NMR Spectra of the Rat Brain. J. Magn. Reson., 1999, 141, (1), 104-120.
[7] ter Kuile, B. H.; Westerhoff, H. V. Transcriptome meets metabolome: hierarchical and metabolic regulation of the glycolytic pathway. FEBS Lett., 2001, 500, (3), 169-171.
[8] Gebregiworgis, T.; Powers, R. Application of NMR Metabolomics to Search for Human Disease Biomarkers. Comb. Chem. High Throughput Screening, 2012, 15, (8), 595-610.
[9] Vinayavekhin, N.; Homan, E. A.; Saghatelian, A. Exploring Disease through Metabolomics. ACS Chem. Biol., 2010, 5, (1), 91-103.
[10] Powers, R. NMR metabolomics and drug discovery. Magn. Reson. Chem., 2009, 47, S2-S11.
[11] Wilcoxen, K. M.; Uehara, T.; Myint, K. T.; Sato, Y.; Oda, Y. Practical metabolomics in drug discovery. Expert Opin. Drug Discovery, 2010, 5, (3), 249-263.
[12] Hall, R. D. Plant metabolomics in a nutshell: potential and future challenges. Annu. Plant Rev., 2011, 43, (Biology of Plant Metabolomics), 1-24.
[13] Zhang, B.; Powers, R. Using NMR-based metabolomics to study the regulation of biofilm formation. Future Med. Chem., 2012, 4, (10), 1273-1306.
[14] Tang, J. Microbial metabolomics. Curr. Genomics, 2011, 12, (6), 391-403.
[15] McNiven, E. M. S.; German, J. B.; Slupsky, C. M. Analytical metabolomics: nutritional opportunities for personalized health. J. Nutr. Biochem., 2011, 22, (11), 995-1002.
[16] Bundy, J. G.; Davey, M. P.; Viant, M. R. Environmental metabolomics: a critical review and future perspectives. Metabolomics, 2009, 5, (1), 3-21.
[17] Baker, M. Metabolomics: From small molecules to big ideas. Nat. Methods, 2011, 8, (2), 117-121.
[18] Dunn, W. B.; Ellis, D. I. Metabolomics: Current analytical platforms and methodologies. Trac-Trends in Anal. Chem., 2005, 24, (4), 285-294.
[19] Pearson, H. Meet the human metabolome. Nature, 2007, 446, (7131), 8.
[20] Wishart, D. S.; Tzur, D.; Knox, C.; Eisner, R.; Guo, A. C.; Young, N.; Cheng, D.; Jewell, K.; Arndt, D.; Sawhney, S.; Fung, C.; Nikolai, L.; Lewis, M.; Coutouly, M.-A.; Forsythe, I.; Tang, P.; Shrivastava, S.; Jeroncic, K.; Stothard, P.; Amegbey, G.; Block, D.; Hau, D. D.; Wagner, J.; Miniaci, J.; Clements, M.; Gebremedhin, M.; Guo, N.; Zhang, Y.; Duggan, G. E.; MacInnis, G. D.; Weljie, A. M.; Dowlatabadi, R.; Bamforth, F.; Clive, D.; Greiner, R.; Li, L.; Marrie, T.; Sykes, B. D.; Vogel, H. J.; Querengesser, L. HMDB: the Human Metabolome Database. Nucleic Acids Res., 2007, 35, (Database Iss), D521-D526.
[21] Cui, Q.; Lewis, I. A.; Hegeman, A. D.; Anderson, M. E.; Li, J.; Schulte, C. F.; Westler, W. M.; Eghbalnia, H. R.; Sussman, M. R.;
Markley, J. L. Metabolite identification via the Madison Metabolomics Consortium Database. Nat. Biotechnol., 2008, 26, (2), 162-164.
[22] Kind, T.; Wohlgemuth, G.; Lee, D. Y.; Lu, Y.; Palazoglu, M.; Shahbaz, S.; Fiehn, O. FiehnLib: Mass Spectral and Retention Index Libraries for Metabolomics Based on Quadrupole and Time-of-Flight Gas Chromatography/Mass Spectrometry. Anal. Chem., 2009, 81, (24), 10038-10048.
[23] Dettmer, K.; Aronov, P. A.; Hammock, B. D. Mass spectrometry-based metabolomics. Mass Spectrom. Rev., 2007, 26, (1), 51-78.
[24] Viswanadhan, V. N.; Rajesh, H.; Balaji, V. N. Atom Type Preferences, Structural Diversity, and Property Profiles of Known Drugs, Leads, and Nondrugs: A Comparative Assessment. ACS Comb. Sci., 2011, 13, (3), 327-336.
[25] Rubakhin, S. S.; Romanova, E. V.; Nemes, P.; Sweedler, J. V. Profiling metabolites and peptides in single cells. Nat. Methods, 2011, 8, (4), S20-S29.
[26] Aoki-Kinoshita, K. F. Overview of KEGG applications to omics-related research. J. Pestic. Sci. (Tokyo, Jpn.), 2006, 31, (3), 296-299.
[27] Alvarez-Sanchez, B.; Priego-Capote, F.; Luque, d. C. M. D. Metabolomics analysis I. Selection of biological samples and practical aspects preceding sample preparation. TrAC, Trends Anal. Chem., 2010, 29, (2), 111-119.
[28] Alvarez-Sanchez, B.; Priego-Capote, F.; Luque, d. C. M. D. Metabolomics analysis II. Preparation of biological samples prior to detection. TrAC, Trends Anal. Chem., 2010, 29, (2), 120-127.
[29] Tyagi, S.; Raghvendra; Singh, U.; Kalra, T.; Munjal, K. Applications of Metabolomics - a systematic study of the unique chemical fingerprints: an overview. Int. J. Pharm. Sci. Rev. Res., 2010, 3, (1), 83-86.
[30] Han, J.; Datla, R.; Chan, S.; Borchers, C. H. Mass spectrometry-based technologies for high-throughput metabolomics. Bioanalysis, 2009, 1, (9), 1665-1684.
[31] Ellis, D. I.; Goodacre, R. Metabolic fingerprinting in disease diagnosis: biomedical applications of infrared and Raman spectroscopy. Analyst, 2006, 131, (8), 875-885.
[32] Pearson, K. On Lines and Planes of Closest Fit to Systems of Points in Space. Philos. Mag., 1901, 2, (6), 14.
[33] Hotelling, H. Analysis of a complex of statistical variables into principal components. J. Educ. Psychol., 1933, 24, (7), 22.
[34] Wold, S.; Johansson, E.; Cocchi, M., PLS. In 3D-QSAR in Drug Design: Theory, Methods and Applications, ed.; Kubinyi, H., ESCOM Science: Ledien, 1993; 523-550.
[35] Wold, S.; Sjostrom, M.; Eriksson, L. PLS-regression: a basic tool of chemometrics. Chemometr. Intell. Lab, 2001, 58, (2), 109-130.
[36] Beckonert, O.; Keun, H. C.; Ebbels, T. M. D.; Bundy, J.; Holmes, E.; Lindon, J. C.; Nicholson, J. K. Metabolic profiling, metabolomic and metabonomic procedures for NMR spectroscopy of urine, plasma, serum and tissue extracts. Nat. Protocols, 2007, 2, (11), 2692-2703.
[37] Koh, P.; Chan, E.; Mal, M.; Eu, K.; Blackshall, A.; Keun, H. Metabolic Profiling of Human Colorectal Cancer Using High-Resolution Magic Angle Spinning Nuclear Magnetic Resonance (Hr-Mas Nmr) Spectroscopy and Gas Chromatography Mass Spectrometry (Gc/Ms). Dis. Colon Rectum, 2009, 52, (4), 769-769.
[38] Goodacre, R.; York, E. V.; Heald, J. K.; Scott, I. M. Chemometric discrimination of unfractionated plant extracts analyzed by electrospray mass spectrometry. Phytochemistry, 2003, 62, (6), 859-863.
[39] Wu, H. F.; Southam, A. D.; Hines, A.; Viant, M. R. High-throughput tissue extraction protocol for NMR- and MS-based metabolomics. Anal. Biochem., 2008, 372, (2), 204-212.
[40] Cherney, D. P.; Ekman, D. R.; Dix, D. J.; Collette, T. W. Raman spectroscopy-based metabolomics for differentiating exposures to triazole fungicides using rat urine. Anal. Chem., 2007, 79, (19), 7324-7332.
[41] Garcia-Perez, I.; Vallejo, M.; Garcia, A.; Legido-Quigley, C.; Barbas, C. Metabolic fingerprinting with capillary electrophoresis. J. Chromatogr. A, 2008, 1204, (2), 130-139.
[42] Ramautar, R.; Demirci, A.; de Jong, G. J. Capillary electrophoresis in metabolomics. Trac-Trends in Anal. Chem., 2006, 25, (5), 455-466.
[43] Bylesjo, M.; Rantalainen, M.; Cloarec, O.; Nicholson, J. K.; Holmes, E.; Trygg, J. OPLS discriminant analysis: combining the
Multivariate Analysis in Metabolomics Current Metabolomics, 2013, Vol. 1, No. 1 105
strengths of PLS-DA and SIMCA classification. J. Chemom., 2006, 20, (8-10), 341-351.
[44] Jolliffe, I. T., Principal Component Analysis. 2 ed.; Springer: 2002. [45] Li, M.; Wang, B. H.; Zhang, M. H.; Rantalainen, M.; Wang, S. Y.;
Zhou, H. K.; Zhang, Y.; Shen, J.; Pang, X. Y.; Zhang, M. L.; Wei, H.; Chen, Y.; Lu, H. F.; Zuo, J.; Su, M. M.; Qiu, Y. P.; Jia, W.; Xiao, C. N.; Smith, L. M.; Yang, S. L.; Holmes, E.; Tang, H. R.; Zhao, G. P.; Nicholson, J. K.; Li, L. J.; Zhao, L. P. Symbiotic gut microbes modulate human metabolic phenotypes. Proc Natl Acad Sci U S A, 2008, 105, (6), 2117-2122.
[46] Johnstone, I. M.; Titterington, D. M. Statistical challenges of high-dimensional data. Phil. Trans. R. Soc. A, 2009, 367, (1906), 4237-4253.
[47] Barker, M.; Rayens, W. Partial least squares for discrimination. J. Chemom., 2003, 17, (3), 166-173.
[48] Rannar, S.; Lindgren, F.; Geladi, P.; Wold, S. A Pls Kernel Algorithm for Data Sets with Many Variables and Fewer Objects .1. Theory and Algorithm. J. Chemom., 1994, 8, (2), 111-125.
[49] Wold, S.; Antti, H.; Lindgren, F.; Ohman, J. Orthogonal signal correction of near-infrared spectra. Chemometr. Intell. Lab, 1998, 44, (1-2), 175-185.
[50] Sjoblom, J.; Svensson, O.; Josefson, M.; Kullberg, H.; Wold, S. An evaluation of orthogonal signal correction applied to calibration transfer of near infrared spectra. Chemometr. Intell. Lab, 1998, 44, (1-2), 229-244.
[51] Hoskuldsson, A. Variable and subset selection in PLS regression. Chemometr. Intell. Lab, 2001, 55, (1-2), 23-38.
[52] Trygg, J.; Wold, S. Orthogonal projections to latent structures (O-PLS). J. Chemom., 2002, 16, (3), 119-128.
[53] Tapp, H. S.; Kemsley, E. K. Notes on the practical utility of OPLS. Trac-Trends in Anal. Chem., 2009, 28, (11), 1322-1327.
[54] Lindon, J. C.; Nicholson, J. K.; Holmes, E.; Keun, H. C.; Craig, A.; Pearce, J. T. M.; Bruce, S. J.; Hardy, N.; Sansone, S. A.; Antti, H.; Jonsson, P.; Daykin, C.; Navarange, M.; Beger, R. D.; Verheij, E. R.; Amberg, A.; Baunsgaard, D.; Cantor, G. H.; Lehman-McKeeman, L.; Earll, M.; Wold, S.; Johansson, E.; Haselden, J. N.; Kramer, K.; Thomas, C.; Lindberg, J.; Schuppe-Koistinen, I.; Wilson, I. D.; Reily, M. D.; Robertson, D. G.; Senn, H.; Krotzky, A.; Kochhar, S.; Powell, J.; van der Ouderaa, F.; Plumb, R.; Schaefer, H.; Spraul, M.; worki, S. M. R. S. Summary recommendations for standardization and reporting of metabolic analyses. Nat. Biotechnol., 2005, 23, (7), 833-838.
[55] Goodacre, R.; Broadhurst, D.; Smilde, A. K.; Kristal, B. S.; Baker, J. D.; Beger, R.; Bessant, C.; Connor, S.; Calmani, G.; Craig, A.; Ebbels, T.; Kell, D. B.; Manetti, C.; Newton, J.; Paternostro, G.; Somorjai, R.; Sjostrom, M.; Trygg, J.; Wulfert, F. Proposed minimum reporting standards for data analysis in metabolomics. Metabolomics, 2007, 3, (3), 231-241.
[56] De Meyer, T.; Sinnaeve, D.; Van Gasse, B.; Tsiporkova, E.; Rietzschel, E. R.; De Buyzere, M. L.; Gillebert, T. C.; Bekaert, S.; Martins, J. C.; Van Criekinge, W. NMR-Based Characterization of Metabolic Alterations in Hypertension Using an Adaptive, Intelligent Binning Algorithm. Anal. Chem., 2008, 80, (10), 3783-3790.
[57] Anderson, P. E.; Reo, N. V.; DelRaso, N. J.; Doom, T. E.; Raymer, M. L. Gaussian binning: a new kernel-based method for processing NMR spectroscopic data for metabolomics. Metabolomics, 2008, 4, (3), 261-272.
[58] Davis, R. A.; Charlton, A. J.; Godward, J.; Jones, S. A.; Harrison, M.; Wilson, J. C. Adaptive binning: An improved binning method for metabolomics data using the undecimated wavelet transform. Chemom. Intell. Lab. Syst., 2007, 85, (1), 144-154.
[59] Anderson, P. E.; Mahle, D. A.; Doom, T. E.; Reo, N. V.; Del, R. N. J.; Raymer, M. L. Dynamic adaptive binning: an improved quantification technique for NMR spectroscopic data. Metabolomics, 2011, 7, (2), 179-190.
[60] Vu, T. N.; Valkenborg, D.; Smets, K.; Verwaest, K. A.; Dommisse, R.; Lemiere, F.; Verschoren, A.; Goethals, B.; Laukens, K. An integrated workflow for robust alignment and simplified quantitative analysis of NMR spectrometry data. BMC Bioinformatics, 2011, 12.
[61] Wu, W.; Daszykowski, M.; Walczak, B.; Sweatman, B. C.; Connor, S. C.; Haseldeo, J. N.; Crowther, D. J.; Gill, R. W.; Lutz, M. W. Peak alignment of urine NMR spectra using fuzzy warping. J. Chem. Inf. Model, 2006, 46, (2), 863-875.
[62] Zhou, W.; Seoung Bum, K. Automatic Alignment of High-Resolution NMR Spectra Using a Bayesian Estimation Approach. Proceedings of the 18th International Conference on Pattern Recognition, 2006, 4, 667-670.
[63] Forshed, J.; Schuppe-Koistinen, I.; Jacobsson, S. P. Peak alignment of NMR signals by means of a genetic algorithm. Anal. Chim. Acta, 2003, 487, (2), 189-199.
[64] Veselkov, K. A.; Lindon, J. C.; Ebbels, T. M. D.; Crockford, D.; Volynkin, V. V.; Holmes, E.; Davies, D. B.; Nicholson, J. K. Recursive Segment-Wise Peak Alignment of Biological 1H NMR Spectra for Improved Metabolic Biomarker Recovery. Anal. Chem., 2009, 81, (1), 56-66.
[65] Csenki, L.; Alm, E.; Torgrip, R. J. O.; Aaberg, K. M.; Nord, L. I.; Schuppe-Koistinen, I.; Lindberg, J. Proof of principle of a generalized fuzzy Hough transform approach to peak alignment of one-dimensional 1H NMR data. Anal. Bioanal. Chem., 2007, 389, (3), 875-885.
[66] Beneduci, A.; Chidichimo, G.; Dardo, G.; Pontoni, G. Highly routinely reproducible alignment of H-1 NMR spectral peaks of metabolites in huge sets of urines. Anal. Chim. Acta, 2011, 685, (2), 186-195.
[67] Cloarec, O.; Dumas, M. E.; Trygg, J.; Craig, A.; Barton, R. H.; Lindon, J. C.; Nicholson, J. K.; Holmes, E. Evaluation of the orthogonal projection on latent structure model limitations caused by chemical shift variability and improved visualization of biomarker changes in H-1 NMR spectroscopic metabonomic studies. Anal. Chem., 2005, 77, (2), 517-526.
[68] Lange, E.; Tautenhahn, R.; Neumann, S.; Gropl, C. Critical assessment of alignment procedures for LC-MS proteomics and metabolomics measurements. BMC Bioinf., 2008, 9, (375), Epub.
[69] Nielsen, N. P. V.; Carstensen, J. M.; Smedsgaard, J. Aligning of single and multiple wavelength chromatographic profiles for chemometric data analysis using correlation optimised warping. J. Chromatogr. A, 1998, 805, (1-2), 17-35.
[70] Tomasi, G.; van den Berg, F.; Andersson, C. Correlation optimized warping and dynamic time warping as preprocessing methods for chromatographic data. J. Chemom., 2004, 18, (5), 231-241.
[71] Skov, T.; van den Berg, F.; Tomasi, G.; Bro, R. Automated alignment of chromatographic data. J. Chemom., 2006, 20, (11-12), 484-497.
[72] Clasquin, M. F.; Melamud, E.; Rabinowitz, J. D. LC-MS data processing with MAVEN: a metabolomic analysis and visualization engine. Curr Protoc Bioinformatics, 2012, 37, (14.11.1–14.11.23.), Epub.
[73] Xia, J.; Mandal, R.; Sinelnikov, I. V.; Broadhurst, D.; Wishart, D. S. MetaboAnalyst 2.0--a comprehensive server for metabolomic data analysis. Nucleic Acids Res, 2012, 40, (19), W127-133.
[74] Pluskal, T.; Castillo, S.; Villar-Briones, A.; Oresic, M. MZmine 2: modular framework for processing, visualizing, and analyzing mass spectrometry-based molecular profile data. BMC Bioinf., 2010, 11, (395), Epub.
[75] Vahamaa, H.; Koskinen, V. R.; Hosia, W.; Moulder, R.; Nevalainen, O. S.; Lahesmaa, R.; Aittokallio, T.; Salmi, J. PolyAlign: a versatile LC-MS data alignment tool for landmark-selected and -automated use. Int. J. Proteomics, 2011, 2011, 450290.
[76] Jeong, J.; Shi, X.; Zhang, X.; Kim, S.; Shen, C. Model-based peak alignment of metabolomic profiling from comprehensive two-dimensional gas chromatography mass spectrometry. BMC Bioinf., 2012, 13, (27), Epub.
[77] Perera, V.; Torres, Z. M.; Florance, H.; Smirnoff, N.; Grant, M.; Yang, Z. R. Aligning extracted LC-MS peak lists via density maximization. Metabolomics, 2012, 8, (Supplement 1), 175-185.
[78] Tikunov, Y. M.; Laptenok, S.; Hall, R. D.; Bovy, A.; Vos, R. C. H. MSClust: a tool for unsupervised mass spectra extraction of chromatography-mass spectrometry ion-wise aligned data. Metabolomics, 2012, 8, (4), 714-718.
[79] Voss, B.; Hanselmann, M.; Renard, B. Y.; Lindner, M. S.; Koethe, U.; Kirchner, M.; Hamprecht, F. A. SIMA: Simultaneous Multiple Alignment of LC/MS Peak Lists. Bioinformatics, 2011, 27, (7), 987-993.
[80] Craig, A.; Cloareo, O.; Holmes, E.; Nicholson, J. K.; Lindon, J. C. Scaling and normalization effects in NMR spectroscopic metabonomic data sets. Anal. Chem., 2006, 78, (7), 2262-2267.
[81] Sysi-Aho, M.; Katajamaa, M.; Yetukuri, L.; Oresic, M. Normalization method for metabolomics data using optimal

106 Current Metabolomics, 2013, Vol. 1, No. 1 Worley and Powers
selection of multiple internal standards. BMC Bioinformatics, 2007, 8.
[82] van den Berg, R. A.; Hoefsloot, H. C. J.; Westerhuis, J. A.; Smilde, A. K.; van der Werf, M. J. Centering, scaling, and transformations: improving the biological information content of metabolomics data. BMC Genomics, 2006, 7.
[83] Halouska, S.; Powers, R. Negative impact of noise on the principal component analysis of NMR data. J. Magn. Reson., 2006, 178, (1), 88-95.
[84] Wentzell, P. D.; Andrews, D. T.; Hamilton, D. C.; Faber, K.; Kowalski, B. R. Maximum likelihood principal component analysis. J. Chemom., 1997, 11, (4), 339-366.
[85] Hoefsloot, H. C. J.; Verouden, M. P. H.; Westerhuis, J. A.; Smilde, A. K. Maximum likelihood scaling (MALS). J. Chemom., 2006, 20, (3-4), 120-127.
[86] Kjeldahl, K.; Bro, R. Some common misunderstandings in chemometrics. J. Chemom., 2010, 24, (7-8), 558-564.
[87] Trygg, J.; Wold, S. O2-PLS, a two-block (X-Y) latent variable regression (LVR) method with an integral OSC filter. J. Chemom., 2003, 17, (1), 53-64.
[88] Westerhuis, J. A.; Hoefsloot, H. C. J.; Smit, S.; Vis, D. J.; Smilde, A. K.; van Velzen, E. J. J.; van Duijnhoven, J. P. M.; van Dorsten, F. A. Assessment of PLSDA cross validation. Metabolomics, 2008, 4, (1), 81-89.
[89] Boulet, J.-C.; Roger, J.-M. Pretreatments by means of orthogonal projections. Chemom. Intell. Lab. Syst., 2012, 117, 61-69.
[90] Lin, X.; Wang, Q.; Yin, P.; Tang, L.; Tan, Y.; Li, H.; Yan, K.; Xu, G. A method for handling metabonomics data from liquid chromatography/mass spectrometry: combinational use of support vector machine recursive feature elimination, genetic algorithm and random forest for feature selection. Metabolomics, 2011, 7, (4), 549-558.
[91] Ramadan, Z.; Jacobs, D.; Grigorov, M.; Kochhar, S. Metabolic profiling using principal component analysis, discriminant partial least squares, and genetic algorithms. Talanta, 2006, 68, (5), 1683-1691.
[92] Wongravee, K.; Heinrich, N.; Holmboe, M.; Schaefer, M. L.; Reed, R. R.; Trevejo, J.; Brereton, R. G. Variable Selection Using Iterative Reformulation of Training Set Models for Discrimination of Samples: Application to Gas Chromatography/Mass Spectrometry of Mouse Urinary Metabolites. Anal. Chem., 2009, 81, (13), 5204-5217.
[93] Brereton, R. G. Consequences of sample size, variable selection, and model validation and optimization, for predicting classification ability from analytical data. TrAC, Trends Anal. Chem., 2006, 25, (11), 1103-1111.
[94] Geladi, P.; Manley, M.; Lestander, T. Scatter plotting in multivariate data analysis. J. Chemom., 2003, 17, (8-9), 503-511.
[95] Vuckovic, D. Current trends and challenges in sample preparation for global metabolomics using liquid chromatography-mass spectrometry. Anal. Bioanal. Chem., 2012, 403, (6), 1523-1548.
[96] Teahan, O.; Gamble, S.; Holmes, E.; Waxman, J.; Nicholson, J. K.; Bevan, C.; Keun, H. C. Impact of Analytical Bias in Metabonomic Studies of Human Blood Serum and Plasma. Anal. Chem., 2006, 78, (13), 4307-4318.
[97] Eriksson, L.; Trygg, J.; Wold, S. CV-ANOVA for significance testing of PLS and OPLS (R) models. J. Chemom., 2008, 22, (11-12), 594-600.
[98] Goodpaster, A. M.; Kennedy, M. A. Quantification and statistical significance analysis of group separation in NMR-based metabonomics studies. Chemometr. Intell. Lab, 2011, 109, (2), 162-170.
[99] Dixon, S. J.; Heinrich, N.; Holmboe, M.; Schaefer, M. L.; Reed, R. R.; Trevejo, J.; Brereton, R. G. Use of cluster separation indices and the influence of outliers: application of two new separation indices, the modified silhouette index and the overlap coefficient to simulated data and mouse urine metabolomic profiles. J. Chemom., 2009, 23, (1-2), 19-31.
[100] Werth, M. T.; Halouska, S.; Shortridge, M. D.; Zhang, B.; Powers, R. Analysis of metabolomic PCA data using tree diagrams. Anal. Biochem., 2010, 399, (1), 58-63.
[101] Worley, B.; Halouska, S.; Powers, R. Utilities for Quantifying Separation in PCA/PLS-DA Scores Plots. Anal. Biochem. , 2012, in press.
[102] Cloarec, O.; Dumas, M. E.; Craig, A.; Barton, R. H.; Trygg, J.; Hudson, J.; Blancher, C.; Gauguier, D.; Lindon, J. C.; Holmes, E.;
Nicholson, J. Statistical total correlation spectroscopy: An exploratory approach for latent biomarker identification from metabolic H-1 NMR data sets. Anal. Chem., 2005, 77, (5), 1282-1289.
[103] Anderssen, E.; Dyrstad, K.; Westad, F.; Martens, H. Reducing over-optimism in variable selection by cross-model validation. Chemometr. Intell. Lab, 2006, 84, (1-2), 69-74.
[104] Broadhurst, D. I.; Kell, D. B. Statistical strategies for avoiding false discoveries in metabolomics and related experiments. Metabolomics, 2006, 2, (4), 171-196.
[105] Eliasson, M.; Raennar, S.; Trygg, J. From data processing to multivariate validation - essential steps in extracting interpretable information from metabolomics data. Curr. Pharm. Biotechnol., 2011, 12, (7), 996-1004.
[106] Eriksson, L.; Johansson, E.; Muller, M.; Wold, S. On the selection of the training set in environmental QSAR analysis when compounds are clustered. J. Chemom., 2000, 14, (5-6), 599-616.
[107] Stone, M. An Asymptotic Equivalence of Choice of Model by Cross-Validation and Akaike’s Criterion J. R. Stat. Soc., B, 1977, 39, (1), 44-47.
[108] Martens, H. A.; Dardenne, P. Validation and verification of regression in small data sets. Chemom. Intell. Lab. Syst., 1998, 44, (1-2), 99-121.
[109] Golbraikh, A.; Tropsha, A. Beware of q(2)! J. Mol. Graphics Modell., 2002, 20, (4), 269-276.
[110] Shao, J. Linear-Model Selection by Cross-Validation. J. Am. Stat. Assoc., 1993, 88, (422), 486-494.
[111] Xu, Q. S.; Liang, Y. Z. Monte Carlo cross validation. Chemometr. Intell. Lab, 2001, 56, (1), 1-11.
[112] Xu, Q. S.; Liang, Y. Z.; Du, Y. P. Monte Carlo cross-validation for selecting a model and estimating the prediction error in multivariate calibration. J. Chemom., 2004, 18, (2), 112-120.
[113] Ledauphin, J.; Le Milbeau, C.; Barillier, D.; Hennequin, D. Differences in the Volatile Compositions of French Labeled Brandies (Armagnac, Calvados, Cognac, and Mirabelle) Using GC-MS and PLS-DA. J. Agric. Food. Chem., 2010, 58, (13), 7782-7793.
[114] Nicholson, J. K.; Holmes, E.; Wilson, I. D. Gut microorganisms, mammalian metabolism and personalized health care. Nat. Rev. Microbiol., 2005, 3, (5), 431-438.
[115] Sadykov, M. R.; Zhang, B.; Halouska, S.; Nelson, J. L.; Kreimer, L. W.; Zhu, Y. F.; Powers, R.; Somerville, G. A. Using NMR Metabolomics to Investigate Tricarboxylic Acid Cycle-dependent Signal Transduction in Staphylococcus epidermidis. J Biol Chem, 2010, 285, (47), 36616-36624.
[116] Zhang, B.; Halouska, S.; Schiaffo, C. E.; Sadykov, M. R.; Somerville, G. A.; Powers, R. NMR Analysis of a Stress Response Metabolic Signaling Network. J. Proteome Res., 2011, 10, (8), 3743-3754.
[117] IEEE Standard for Floating-Point Arithmetic. IEEE Std 754-2008, 2008, 1-58.
[118] Cortes, C.; Vapnik, V. Support-Vector Networks. Mach. Learn, 1995, 20, (3), 273-297.
[119] Mahadevan, S.; Shah, S. L.; Marrie, T. J.; Slupsky, C. M. Analysis of metabolomic data using support vector machines. Anal. Chem., 2008, 80, (19), 7562-7570.
[120] Li, H. D.; Liang, Y. Z.; Xu, Q. S. Support vector machines and its applications in chemistry. Chemometr. Intell. Lab, 2009, 95, (2), 188-198.
[121] Mounet, F.; Lemaire-Chamley, M.; Maucourt, M.; Cabasson, C.; Giraudel, J. L.; Deborde, C.; Lessire, R.; Gallusci, P.; Bertrand, A.; Gaudillere, M.; Rothan, C.; Rolin, D.; Moing, A. Quantitative metabolic profiles of tomato flesh and seeds during fruit development: complementary analysis with ANN and PCA. Metabolomics, 2007, 3, (3), 273-288.
[122] Xia, J. M.; Wu, X. J.; Yuan, Y. J. Integration of wavelet transform with PCA and ANN for metabolomics data-mining. Metabolomics, 2007, 3, (4), 531-537.
[123] van der Greef, J.; Smilde, A. K. Symbiosis of chemometrics and metabolomics: past, present, and future. J. Chemom., 2005, 19, (5-7), 376-386.
[124] Bro, R. PARAFAC. Tutorial and applications. Chemometr. Intell. Lab, 1997, 38, (2), 149-171.
[125] Westerhuis, J. A.; Kourti, T.; MacGregor, J. F. Analysis of multiblock and hierarchical PCA and PLS models. J. Chemom., 1998, 12, (5), 301-321.

Multivariate Analysis in Metabolomics Current Metabolomics, 2013, Vol. 1, No. 1 107
[126] Forshed, J.; Idborg, H.; Jacobsson, S. P. Evaluation of different techniques for data fusion of LC/MS and H-1-NMR. Chemometr. Intell. Lab, 2007, 85, (1), 102-109.
[127] Smilde, A. K.; van der Werf, M. J.; Bijlsma, S.; van der Werff-van-der Vat, B. J. C.; Jellema, R. H. Fusion of mass spectrometry-based metabolomics data. Anal. Chem., 2005, 77, (20), 6729-6736.
[128] Bras, L. P.; Bernardino, S. A.; Lopes, J. A.; Menezes, J. C. Multiblock PLS as an approach to compare and combine NIR and MIR spectra in calibrations of soybean flour. Chemometr. Intell. Lab, 2005, 75, (1), 91-99.
Received: September 18, 2012 Revised: November 13, 2012 Accepted: November 14, 2012