9 consolidated financial statements of sbp and its ... · pursuant to the requirements of section...
TRANSCRIPT

9 Consolidated Financial Statements of SBP and its Subsidiaries
A. F. FERGUSON & CO.
Chartered Accountants
State Life Building No. 1-C
I. I. Chundrigar Road
P.O. Box 4716
Karachi-74000
EY FORD RHODES
Chartered Accountants
Progressive Plaza
Beaumont Road
P. O. Box 15541
Karachi-75530
Independent Auditor's Report
To the Board of Directors of State Bank of Pakistan
Opinion
We have audited the consolidated financial statements of the State Bank of Pakistan (the Bank) and its
subsidiaries, SBP Banking Services Corporation, National Institute of Banking and Finance
(Guarantee) Limited and Pakistan Security Printing Corporation (Private) Limited (together “the
Group”), which comprise the consolidated balance sheet as at June 30, 2017, and the consolidated
profit and loss account, consolidated statement of comprehensive income, consolidated statement of
changes in equity and consolidated statement of cash flows for the year then ended, and notes to the
consolidated financial statements, including a summary of significant accounting policies.
In our opinion, the accompanying consolidated financial statements give a true and fair view of the
consolidated financial position of the Group as at June 30, 2017, and of its consolidated financial
performance and its consolidated cash flows for the year then ended in accordance with International
Financial Reporting Standards (IFRSs).
Basis for Opinion
We conducted our audit in accordance with International Standards on Auditing (ISAs). Our
responsibilities under those standards are further described in the ‘Auditor’s Responsibilities for the
Audit of the Financial Statements’ section of our report. We are independent of the Group in
accordance with the International Ethics Standards Board for Accountants’ Code of Ethics for
Professional Accountants as adopted by the Institute of Chartered Accountants of Pakistan (the Code),
and we have fulfilled our other ethical responsibilities in accordance with these requirements and the
Code. We believe that the audit evidence we have obtained is sufficient and appropriate to provide a
basis for our opinion.
Responsibilities of Management and Those Charged with Governance for the Consolidated
Financial Statements
Management is responsible for the preparation and fair presentation of the consolidated financial
statements in accordance with IFRSs, and for such internal control as management determines is
77

State Bank of Pakistan Annual Report FY17
A. F. FERGUSON & CO.
Chartered Accountants EY FORD RHODES
Chartered Accountants
necessary to enable the preparation of consolidated financial statements that are free from material
misstatement, whether due to fraud or error.
In preparing the consolidated financial statements, management is responsible for assessing the
Group’s ability to continue as a going concern, disclosing, as applicable, matters related to going
concern and using the going concern basis of accounting unless management either intends to
liquidate the Group or to cease operations, or has no realistic alternative but to do so.
Those charged with governance are responsible for overseeing the Group’s financial reporting
process.
Auditor’s Responsibilities for the Audit of the Consolidated Financial Statements
Our objectives are to obtain reasonable assurance about whether the consolidated financial statements
as a whole are free from material misstatement, whether due to fraud or error, and to issue an auditor’s
report that includes our opinion. Reasonable assurance is a high level of assurance, but is not a
guarantee that an audit conducted in accordance with ISAs will always detect a material misstatement
when it exists. Misstatements can arise from fraud or error and are considered material if, individually
or in the aggregate, they could reasonably be expected to influence the economic decisions of users
taken on the basis of these consolidated financial statements.
As part of an audit in accordance with ISAs, we exercise professional judgment and maintain
professional skepticism throughout the audit. We also:
Identify and assess the risks of material misstatement of the consolidated financial statements,
whether due to fraud or error, design and perform audit procedures responsive to those risks,
and obtain audit evidence that is sufficient and appropriate to provide a basis for our opinion.
The risk of not detecting a material misstatement resulting from fraud is higher than for one
resulting from error, as fraud may involve collusion, forgery, intentional omissions,
misrepresentations, or the override of internal control.
Obtain an understanding of internal control relevant to the audit in order to design audit
procedures that are appropriate in the circumstances, but not for the purpose of expressing an
opinion on the effectiveness of the Group’s internal control.
Evaluate the appropriateness of accounting policies used and the reasonableness of
accounting estimates and related disclosures made by management.
Conclude on the appropriateness of management’s use of the going concern basis of
accounting and, based on the audit evidence obtained, whether a material uncertainty exists
related to events or conditions that may cast significant doubt on the Group’s ability to
continue as a going concern. If we conclude that a material uncertainty exists, we are required
to draw attention in our auditor’s report to the related disclosures in the consolidated financial
statements or, if such disclosures are inadequate, to modify our opinion. Our conclusions are
78

Consolidated Financial Statements of SBP and its Subsidiaries
A. F. FERGUSON & CO.
Chartered Accountants EY FORD RHODES
Chartered Accountants
based on the audit evidence obtained up to the date of our auditor’s report. However, future
events or conditions may cause the Group to cease to continue as a going concern.
Evaluate the overall presentation, structure and content of the consolidated financial
statements, including the disclosures, and whether the consolidated financial statements
represent the underlying transactions and events in a manner that achieves fair presentation.
We communicate with those charged with governance regarding, among other matters, the planned
scope and timing of the audit and significant audit findings, including any significant deficiencies in
internal control that we identify during our audit.
We also provide those charged with governance with a statement that we have complied with relevant
ethical requirements regarding independence, and to communicate with them all relationships and
other matters that may reasonably be thought to bear on our independence, and where applicable,
related safeguards.
A. F. Ferguson & Co.
Chartered Accountants
Karachi
Salman Hussain
Audit Engagement Partner
Dated: October 27, 2017
EY Ford Rhodes
Chartered Accountants
Karachi
Omer Chughtai
Audit Engagement Partner
79

State Bank of Pakistan Annual Report FY17
Note 2017 2016
ASSETS
Cash and bank balances held by a subsidiary 6 2,190,657 -
Gold reserves held by the Bank 7 270,361,202 287,170,323
Local currency - coins 8 861,860 488,198
Foreign currency accounts and investments 9 1,782,539,188 1,977,084,370
Earmarked foreign currency balances 10 10,319,532 5,147,596
Special Drawing Rights of the International Monetary Fund 11 63,657,319 67,656,236
Reserve tranche with the International Monetary Fund
under quota arrangements 12 17,382 17,455
Securities purchased under agreement to resell 13 1,533,373,313 1,533,574,159
Current accounts of Governments 24.2 7,279,247 955,474
Investments - local 14 2,694,286,076 2,147,418,594
Long Term Investment in associates 15 2,134,590 -
Loans, advances and bills of exchange 16 362,703,790 350,571,180
Taxation - net 398,414 -
Assets held with the Reserve Bank of India 17 5,758,914 6,012,137
Balances due from the Governments of India and
Bangladesh (former East Pakistan) 18 9,917,256 9,214,881
Property, plant and equipment 19 111,142,903 60,074,805
Intangible assets 20 107,554 24,986
Deferred taxation 21 193,274 -
Other assets 22 8,657,388 4,348,162
Total assets 6,865,899,859 6,449,758,556
LIABILITIES
Bank notes in circulation 23 4,167,135,807 3,554,922,057
Bills payable 630,547 598,142
Current accounts of Governments 24.1 178,601,965 606,657,778
Payable to Islamic Banking Institutions against Bai Muajjal transactions 25 25,137,230 44,952,938
Payable under bilateral currency swap agreement 26 155,550,410 158,507,631
Deposits of banks and financial institutions 27 669,337,539 391,760,469
Other deposits and accounts 28 164,665,074 161,552,998
Payable to the International Monetary Fund 29 787,381,266 778,739,505
Other liabilities 30 57,515,443 49,579,000
Deferred liability - staff retirement benefits 31 89,806,875 82,419,258
Endowment fund 98,421 94,207
Total liabilities 6,295,860,577 5,829,783,983
Net assets 570,039,282 619,974,573
REPRESENTED BY
Share capital 32 100,000 100,000
Reserves 33 100,664,452 175,944,238
Unappropriated profit 44,154,941 3,712,051
Unrealised appreciation on gold reserves held by the Bank 34 266,327,601 283,342,601
Unrealised appreciation on remeasurement of investments - local 14.6 93,302,881 91,386,276
Surplus on revaluation of property, plant and equipment 65,489,407 65,489,407
Total equity 570,039,282 619,974,573
CONTINGENCIES AND COMMITMENTS 35
The annexed notes from 1 to 56 form an integral part of these consolidated financial statements.
___________________________ ___________________________ ___________________________
Tariq Bajwa Riaz Riazuddin Inayat Hussain
Governor Deputy Governor Executive Director
CONSOLIDATED BALANCE SHEET
AS AT JUNE 30, 2017
--------------------(Rupees in '000)--------------------
Pursuant to the requirements of section 26 (1) of the SBP Act, 1956, the assets of the Group specifically earmarked against the liabilities of the issue department
have been detailed in note 23.1 to these consolidated financial statements.
STATE BANK OF PAKISTAN AND ITS SUBSIDIARIES
80

Note 2017 2016
Discount, interest / mark-up and / or profit earned 36 260,870,627 252,831,070
Less: interest / mark-up expense 37 (21,368,844) (25,454,480)
239,501,783 227,376,590
Commission income 38 2,591,194 1,909,180
Exchange gain - net 39 24,569,638 25,779,375
Dividend income 12,248,843 12,226,343
Share of profit from associates 40 26,196 -
Other operating income - net 41 574,355 2,756,112
Other income - net 42 302,049 160,960
279,814,058 270,208,560
Less: Operating expenses
- Cost of preparation of bank notes and printing charges 43 9,127,971 7,730,740
- Agency commission 44 9,679,298 8,968,647
- General administrative and other expenses 45 22,941,749 24,250,586
(Reversal of provision against) / Provision for / write-off:
- loans and advances - net 16.4 (6,139) (756)
- claims 30.3.2 - (232)
- other doubtful assets 30.3.1.1 16,842 (86,213)
- others (14,674) (7,338)
(3,971) (94,539)
41,745,047 40,855,434
Profit before taxation 238,069,011 229,353,126
Taxation 46 5,414 -
Profit after taxation 238,063,597 229,353,126
The annexed notes from 1 to 56 form an integral part of these consolidated financial statements.
___________________________ ___________________________ ___________________________
Tariq Bajwa Riaz Riazuddin Inayat Hussain
Governor Deputy Governor Executive Director
Consolidated Financial Statements of SBP and its Subsidiaries
CONSOLIDATED PROFIT AND LOSS ACCOUNT
FOR THE YEAR ENDED JUNE 30, 2017
------- (Rupees in '000) -------
STATE BANK OF PAKISTAN AND ITS SUBSIDIARIES
81

Note 2017 2016
Profit after taxation for the year 238,063,597 229,353,126
Other comprehensive income
Items that will be reclassified subsequently to consolidated profit and loss account
when specific conditions are met:
Unrealised appreciation on remeasurement of investments - local
- Appreciation during the year 14.6 1,918,895 7,391,288
- Share of associates of other comprehensive income / (loss) - net of deferred tax (2,290) -
1,916,605 7,391,288
Unrealised (diminution) / appreciation on gold reserves held by the Group 7 (17,015,000) 39,975,291
(15,098,395) 47,366,579
Items that will not be reclassified subsequently to the consolidated profit and loss account:
Remeasurements of staff retirement defined benefit plans - net of deferred tax 45.3.4 & 45.4.6 (3,805,653) (15,327,075)
Remeasurements of property, plant and equipment - 39,511,003
(3,805,653) 24,183,928
Total comprehensive income for the year 219,159,549 300,903,633
The annexed notes from 1 to 56 form an integral part of these consolidated financial statements.
___________________________ ___________________________ ___________________________
Tariq Bajwa Riaz Riazuddin Inayat Hussain
Governor Deputy Governor Executive Director
State Bank of Pakistan Annual Report FY17
------- (Rupees in '000) -------
CONSOLIDATED STATEMENT OF COMPREHENSIVE INCOME
FOR THE YEAR ENDED JUNE 30, 2017
STATE BANK OF PAKISTAN AND ITS SUBSIDIARIES
82

STATE BANK OF PAKISTAN AND ITS SUBSIDIARIES
CONSOLIDATED STATEMENT OF CHANGES IN EQUITY
FOR THE YEAR ENDED JUNE 30, 2017
Balance as at July 1, 2015 100,000 - 164,644,238 2,600,000 1,600,000 1,500,000 900,000 4,700,000 - - 243,367,310 83,994,988 25,978,404 529,384,940
Total comprehensive income for the year
Profit for the year - - - - - - - - - 229,353,126 - - - 229,353,126
Other comprehensive income
Unrealised appreciation on remeasurement of investments - local - - - - - - - - - - - 7,391,288 - 7,391,288
Unrealised appreciation on gold reserves held by the Bank - - - - - - - - - - 39,975,291 - - 39,975,291
Remeasurements of staff retirement defined benefit plans - - - - - - - - - (15,327,075) - - (15,327,075)
Remeasurements of property, plant and equipment - - - - - - - - - - - - 39,511,003 39,511,003
- - - - - - - - - 214,026,051 39,975,291 7,391,288 39,511,003 300,903,633
Transactions with owners
Dividend - - - - - - - - - (10,000) - - - (10,000)
Profit transferred to the Government of Pakistan - - - - - - - - - (210,304,000) - - - (210,304,000)
- - - - - - - - (210,314,000) - - - (210,314,000)
Balance as at June 30, 2016 100,000 - 164,644,238 2,600,000 1,600,000 1,500,000 900,000 4,700,000 - 3,712,051 283,342,601 91,386,276 65,489,407 619,974,573
Total comprehensive income for the year
Profit after taxation for the year - - - - - - - - 238,063,597 - - 238,063,597
Transfer to the reserve fund 1,999,567 - - - - - - (1,999,567) - - - -
Transfer from the reserve fund - 65,464,000 (65,464,000) - - - - - - - - - - -
Reserve created as a result of acquisition of PSPC (note 2) - - - - - - - - (41,279,353) - - - - (41,279,353)
Share of other comprehensive income of associates - net of deferred tax - - - - - - - - - - - - - -
Other comprehensive income
Share in loss of associates relating to investment classified as " available for sale" (2,290) (2,290)
Unrealised appreciation on remeasurement of investments - local - - - - - - - - - - - 1,918,895 - 1,918,895
Unrealised appreciation on gold reserves held by the Bank - - - - - - - - - - (17,015,000) - - (17,015,000)
Remeasurements of staff retirement defined benefit plans - - - - - - - - - (3,805,653) - - - (3,805,653)
- 65,464,000 (63,464,433) - - - - - (41,279,353) 232,258,377 (17,015,000) 1,916,605 - 177,880,196
Transactions with owners
Dividend - - - - - - - - - (10,000) - - - (10,000)
Profit transferred to the Government of Pakistan - - (36,000,000) - - - - - - (191,805,487) - - - (227,805,487)
- (36,000,000) - - - - - - (191,815,487) - - - (227,815,487)
Balance as at June 30, 2017 100,000 65,464,000 65,179,805 2,600,000 1,600,000 1,500,000 900,000 4,700,000 (41,279,353) 44,154,941 266,327,601 93,302,881 65,489,407 570,039,282
The annexed notes from 1 to 56 form an integral part of these consolidated financial statements.
________________________ ________________________ ________________________
Tariq Bajwa Riaz Riazuddin Inayat Hussain
Governor Deputy Governor Executive Director
Reserve created as a
result of acquisition
of PSPC (note 2)
Consolidated Financial Statements of SBP and its Subsidiaries
-------------------------------------------------Reserves--------------------------------------------------
Reserve for
acquisition of
PSPC
-------------------------------------------------------------------------------------------------------------------------(Rupees in '000)----------------------------------------------------------------------------------------------------------------------
Share
capital Reserve fund Rural credit fundIndustrial credit
fund
Export credit
fund
Loans
guarantee fund
TotalHousing credit
fund
Unappropriated
profit / (loss)
Unrealised
appreciation /
(diminution) on
gold reserves held
by the Bank
Unrealised
appreciation /
(diminution) on
remeasurement of
investments - local
Surplus on
revaluation of
property, plant and
equipment
83

STATE BANK OF PAKISTAN AND ITS SUBSIDIARIES
CONSOLIDATED STATEMENT OF CASH FLOWS
FOR THE YEAR ENDED JUNE 30, 2017
Note 2017 2016
CASH FLOWS FROM OPERATING ACTIVITIES
Profit for the year after non-cash and other items 47 234,134,201 273,910,044
Taxes received / (paid) 20,102 -
(Increase) / decrease in assets:
Foreign currency accounts and investments (98,569,273) (72,996,950)
Reserve tranche with the International Monetary Fund under quota arrangements 73 (403)
Securities purchased under agreement to resell 200,846 (870,994,311)
Investments - local (471,377,545) 275,513,962
Loans, advances and bills of exchange (74,538,445) (1,492,519)
Assets held with the Reserve Bank of India and balances due from
Governments of India and Bangladesh (former East Pakistan) (724,717) (566,878)
Other assets 1,230,399 (180,279)
(643,778,662) (670,717,378)
(409,624,359) (396,807,334)
Increase / (decrease) in liabilities:
Bank notes issued - net 612,213,750 847,664,045
Bills payable 32,405 (44,979)
Current accounts of Governments (434,585,465) 214,686,114
Payable to Islamic Banking Institutions against Bai Muajjal transactions (19,815,708) (144,966,183)
Payable under bilateral currency swap agreement (2,957,221) (6,360,259)
Deposits of banks and financial institutions 277,577,070 (21,473,576)
Other deposits and accounts 3,112,076 14,355,148
Retirement benefits and employees' compensated absences (7,609,727) (13,880,942)
Other liabilities 766,651 4,944,673
Endowment fund 4,214 4,816
428,738,045 894,928,857
Net cash generated from operating activities 19,113,686 498,121,523
CASH FLOWS FROM INVESTING ACTIVITIES
Dividend received 12,248,843 12,226,343
Payment for acquisition of Pakistan Security Printing Corporation - net of cash acquired (98,649,872)
Capital expenditure (1,274,978) (1,266,970)
Proceeds from disposal of property, plant and equipment 46,074 24,603
Net cash generated from investing activities (87,629,933) 10,983,976
CASH FLOWS FROM FINANCING ACTIVITIES
Profit paid to the Federal Government of Pakistan (227,805,487) (227,895,141)
Receipts from International Monetary Fund 8,641,761 224,566,523
Dividend paid (10,000) (10,000)
Net cash used in financing activities (219,173,726) (3,338,618)
Increase in cash and cash equivalents during the year (287,689,973) 505,766,881
Cash and cash equivalents at the beginning of the year 1,811,145,674 1,350,924,757
Effect of exchange gain on cash and cash equivalents (1,687,144) (45,545,964)
Cash and cash equivalents at the end of the year 48 1,521,768,557 1,811,145,674
The annexed notes from 1 to 56 form an integral part of these consolidated financial statements.
___________________________ ___________________________ ___________________________
Tariq Bajwa Riaz Riazuddin Inayat Hussain
Governor Deputy Governor Executive Director
------- (Rupees in '000) -------
State Bank of Pakistan Annual Report FY17
84

STATE BANK OF PAKISTAN AND ITS SUBSIDIARIES
NOTES TO AND FORMING PART OF THE CONSOLIDATED FINANCIAL STATEMENTS
FOR THE YEAR ENDED JUNE 30, 2017
1. STATUS AND NATURE OF OPERATIONS
1.1 The Group comprises of State Bank of Pakistan ("the Bank") as the "Parent entity" and following subsidiaries:
- SBP Banking Services Corporation
- National Institute of Banking and Finance (Guarantee) Limited
- Pakistan Security Printing Corporation (Private) Limited
- Deposit Protection Corporation - non operational
1.1.1
- formulating and implementing the monetary policy;
- facilitating free competition and stability in the financial system;
- licensing and supervision of banks including micro finance banks, development financial institutions and exchange companies;
- organising and managing the inter-bank settlement system and promoting smooth functioning of payment systems;
- providing of loans and advances to the Governments, banks, financial institutions and local authorities under various facilities;
- purchasing, holding and selling of shares of banks and financial institutions on the directives of the Federal Government; and
- acting as a depository of the Government under specific arrangements between the Government and certain institutions.
1.1.2 The head office of the Bank is situated at I.I.Chundrigar Road, Karachi, in the province of Sindh, Pakistan.
1.1.3 The subsidiaries of the Bank and the nature of their respective activities are as follows:
a) SBP Banking Services Corporation - wholly owned subsidiary:
b) National Institute of Banking and Finance (Guarantee) Limited - wholly owned subsidiary:
The head office of the Institute is situated at Pitras Bukhari Road Islamabad, Pakistan.
c) Pakistan Security Printing Corporation (Private) Limited - wholly owned subsidiary:
The registered office and the factory are located at Jinnah Avenue, Malir Halt Karachi, in the province of Sindh, Pakistan.
d)
State Bank of Pakistan is the central bank of Pakistan and is incorporated under the State Bank of Pakistan Act, 1956. The Bank is
primarily responsible for monitoring of credit and foreign exchange, management of currency and also acts as the banker to the
Government. The activities of the Bank include:
SBP Banking Services Corporation was established in Pakistan under the SBP Banking Services Corporation Ordinance, 2001 and
commenced its operations with effect from January 2, 2002. It is responsible for carrying out certain statutory and administrative
functions and activities on behalf of the State Bank of Pakistan, as transferred or delegated by the Bank under the provisions of the
Ordinance.
National Institute of Banking and Finance (Guarantee) Limited 'the Institute' was incorporated in Pakistan under the repealed
Companies Ordinance, 1984 as a company limited by guarantee having share capital. It is engaged in providing education and
training in the field of banking, finance and allied areas.
The head office of the Banking Services Corporation (BSC) is situated at I.I.Chundrigar Road, Karachi, in the province of Sindh,
Pakistan.
During the year the Bank acquired 100% share holding in Pakistan Security Printing Corporation (Private) Limited (“the PSPC”).
The effective date of the acquisition of the Corporation is June 14, 2017. The PSPC was incorporated in Pakistan under the
repealed Companies ordinance, 1984 (the Ordinance). The PSPC is principally engaged in the printing of currency notes and
national prize bonds.
Deposit Protection Corporation - non operational
Deposit Protection Corporation ("the DPC") has been incorporated as a wholly owned subsidiary of SBP and is established under
the Deposit Protection Corporation Act 2016. It has been established for the protection of small depositors in order to ensure the
financial stability of and maintain public interest in, the financial system, and for matters connected therewith or ancillary thereto.
Consolidated Financial Statements of SBP and its Subsidiaries
85

The share capital of the DPC is yet to be contributed by the State Bank of Pakistan.
2. Acquisition of Pakistan Security Printing Corporation (Private) Limited (PSPC)
The assets and liabilities of PSPC as on the acquisition date were as follows:
As on June 14,
2017
Rupees in '000
Assets
Cash and bank balances 1,499,128
Investments - local 9,137,428
Investment in associates 2,111,012
Loans, advances and bills of exchange 87,539
Taxation - net 423,118
Deferred taxation 190,685
Property, plant and equipment 52,183,913
Intangible assets 103
Other assets 5,539,625
TOTAL ASSETS 71,172,551
Liabilities
Deferred liability - Staff retirement benefits 3,119,272
Other liabilities 9,183,632
TOTAL LIABILITIES 12,302,904
NET ASSETS 58,869,647
Cash paid for acquisition of shares 100,149,000
Recognised as capital reserve (41,279,353)
The acquisition was approved by the Board of Directors of the Bank in their meeting held on May 31, 2017.
3. STATEMENT OF COMPLIANCE
4. BASIS OF MEASUREMENT
4.1 These consolidated financial statements have been prepared under the historical cost convention, except that gold reserves, certain
foreign currency accounts and investments, certain local investments and certain items of property as referred to in their respective notes
have been included at revalued amounts and certain staff retirement benefits and provision for employee's compensated absences have
been carried at present value of defined benefit obligations.
These consolidated financial statements have been prepared in accordance with the requirements of the International Financial Reporting
Standards (IFRSs) as issued by the International Accounting Standards Board (IASB).
During the year, the Bank has acquired 100% shareholding in Pakistan Security Printing Corporation (Private) Limited (PSPC) from the
Federal Government against a purchase consideration of Rs 100.149 billion. The effective date of acquisition of PSPC is June 14, 2017.
Prior to acquisition of PSPC by the Bank, PSPC was 100 percent owned by the Federal Government. The controlling interest of the
Bank also rests with the Federal Government being the major shareholder. Accordingly, the acquisition of the controlling interest by the
Bank in PSPC is considered as a business combination between entities under common control as the Federal government is the ultimate
controlling party for both the entities both before and after the transaction. The management has opted to apply predecessor method
accounting for incorporating this transaction in the consolidated financial statements. Under this method, the net assets of PSPC are
included in the consolidated financial statements at the same carrying values at which they were recorded in PSPC's own financial
statements as on the acquisition date (i.e June 14, 2017). The results and statement of financial position of PSPC are consolidated
prospectively from the date of acquisition. The difference between the purchase consideration and the net assets acquired is recognised in
equity as a capital reserve under the head "Reserve created as a result of acquisition of PSPC".
The DPC shall commence its operations after the composition of Board by the Federal Government. The head office of the DPC as
per the Act is to be situated in Karachi, in the province of Sindh, Pakistan.
The profit after tax of the PSPC (subsequent to its acquisition by the Bank) for the period from June 14, 2017 to June 30, 2017
amounted to Rs. 11.704 million.
State Bank of Pakistan Annual Report FY17
86

4.2
4.3 Use of estimates and judgments
4.3.1 Fair value of financial instruments
4.3.2 Effective Interest Rate (EIR) method
4.3.3 Impairment against loans and advances
4.3.4 Impairment of available-for-sale investments
4.3.5 Retirement benefits
4.3.6 Useful life and residual value of property and equipment
The preparation of financial statements in conformity with IFRS requires management to make judgments, estimates and assumptions
that affect the application of policies and reported amounts of assets and liabilities that are not readily available from other sources. The
estimates and associated assumptions are based on historical experiences and various other factors that are believed to be reasonable
under the circumstances, the result of which form the basis of making judgments about the carrying values of assets and liabilities and
income and expenses. Actual results may differ from these estimates. The estimates and underlying assumptions are reviewed on an
ongoing basis.
Revisions to accounting estimates are recognised in the period in which the estimate is revised if the revision affects only that period, or
in the period of revision and future periods if the revision affects both current and future periods. Judgments made by the management in
the application of IFRS and estimates that have a significant risk of material adjustment to the carrying amounts of assets and liabilities
are as follows:
The consolidated financial statements ('the financial statements') are presented in Pakistani Rupees (PKR), which is the Group's
functional and presentation currency.
The Group determines that available-for-sale investments are impaired when there is a significant or prolonged decline in the fair value
below its cost. The determination of what is significant or prolonged requires judgment. In making this judgment, the Group evaluates
among other factors, the normal volatility in security price. In addition, impairment may be appropriate when there is evidence of
deterioration in the financial health of the investee, industry and sector performance, changes in technology, and operational and
financing cash flows.
The fair value of financial instruments is the price that would be received to sell an asset or paid to transfer a liability in an orderly
transaction in the principal (or most advantageous) market at the measurement date under current market conditions (i.e., an exit price)
regardless of whether that price is directly observable or estimated using another valuation technique. When the fair values of financial
assets and financial liabilities recorded in the consolidated balance sheet cannot be derived from active markets, they are determined
using a variety of valuation techniques that include the use of valuation models. The inputs to these models are taken from observable
markets where possible, but where this is not feasible, estimation is required in establishing fair values. Judgements and estimates may
include items like considerations of liquidity and model inputs related to items such as credit risk (both own and counterparty), funding
value adjustments, correlation and volatility. For further details about determination of fair value please see Note 5.5 to these
consolidated financial statements.
The Group’s EIR methodology recognises interest income using a rate of return that represents the best estimate of a constant rate of
return over the expected behavioural life of financial instruments. This, by nature, requires an element of estimation regarding the
expected behaviour and life-cycle of the instruments, as well as clubbing of and other determinable fee income / expense to the cost of
acquisition of financial instruments that are integral parts of the instrument.
The Group reviews its loan portfolio to assess recoverability of loans and advances and impairment allowance required there against on a
continuous basis. While assessing this requirement, various factors including the delinquency in the account, financial position of the
borrower, quality of collateral and other relevant factors are considered. The amount of impairment may require adjustment in case
borrowers do not perform according to the expectations.
The key actuarial assumptions concerning the valuation of defined benefit plans and the sources of estimation are disclosed in note
45.3.1 and 45.4.1 to these consolidated financial statements.
Estimates of useful life and residual value of property, plant and equipment and intangibles are based on the management’s best estimate.
Consolidated Financial Statements of SBP and its Subsidiaries
87

4.4 New and amended standards and interpretations that are not yet effective:
Standards
-
-
- IFRS 16 ‘Leases’
-
Amendments
- Amendments to IAS 7 – ‘Statement of cash flows’ on disclosure initiative
-
-
- Amendment to IAS 40 - ‘Investment property’ relating to transfers of investment property
-
-
Interpretations
- IFRIC 22, 'Foreign currency transactions and advance consideration’
- IFRIC 23, 'Uncertainty over income tax treatment'
Improvements
-
-
-
-
IFRS 12, 'Disclosure of interests in other entities’ regarding clarification of the scope of the
standard.
January 1, 2017
January 1, 2018
January 1, 2019
January 1, 2018
Date yet to be finalized
January 1, 2017
Amendments to IFRS 2 - ‘Share based payments’ on clarifying how to account for certain
types of share-based payment transactions
January 1, 2018
Amendments to IFRS 4 - ‘Insurance contracts’ regarding the implementation of IFRS 9,
‘Financial instruments’
January 1, 2018
January 1, 2018
Amendments to IFRS 10 – ‘Consolidated Financial Statements’ and IAS 28 – ‘Investments
in Associates and Joint Ventures’ regarding sale or contribution of assets between an
investor and its associate or joint venture
Amendment to IAS 12 – ‘Income taxes’ on recognition of deferred tax assets for unrealised
losses
January 1, 2017
IFRS 1, 'First-time adoption of IFRS’ , regarding the deletion of short-term exemptions for
first-time adopters regarding IFRS 7, IAS 19, and IFRS 10
IAS 28, 'Investments in associates and joint ventures’ regarding measuring an associate or
joint venture at fair value
January 1, 2018
The Group expects that the adoption of the above standards, amendments, interpretations and improvements will not have any material
impact on the Group's financial statements in the period of initial application other than the initial application of IFRS 9, 'Financial
instruments' and IFRS 15, 'Revenue from contracts with customers' as described below:
IFRS 9, Financial Instruments (Hedge Accounting and amendments to IFRS 9, IFRS 7 and IAS 39) sets out the principles of
classification, measurement and derecognition of financial assets and financial liabilities, introduces new rules for hedge
accounting and a new impairment model for financial assets. The standard replaces IAS 39 'Financial Instruments: Recognition
and Measurement' except for the recognition requirements. The adoption of the standard introduces expanded disclosure
requirements and changes in presentation of the financial instruments which are expected to change the nature and extent of the
Group's disclosures about its financial instruments particularly in the year of the adoption of the new standard. The standard is
mandatorily effective for periods beginning on or after January 1, 2018 with early adoption permitted (subject to local regulation
requirements). the Group intends to adopt IFRS 9 on its mandatory date and the management is in the process of assessing the
impacts of IFRS 9 on the consolidated financial statements of the Group.
January 1, 2018
The following standards, amendments and interpretations would be effective from the dates mentioned below against the respective
standard or interpretation:
IFRS 15 ‘Revenue from contracts with customers’
IFRS 9 ‘Financial instruments’ January 1, 2018
Effective date (annual periods
beginning on or after)
January 1, 2019
Early adoption is permitted only if
IFRS 15 is adopted at the same time.
IFRS 17, ‘Insurance contracts’ January 1, 2021
State Bank of Pakistan Annual Report FY17
88

-
4.5
5. SIGNIFICANT ACCOUNTING POLICIES
5.1 Basis of consolidation
5.2 Bank notes in circulation and local currency - coins
5.3 Financial assets and financial liabilities
Financial instruments carried on the consolidated balance sheet include cash and bank balances held by a subsidiary, local currency -
coins, foreign currency accounts and investments, earmarked foreign currency balances, investments - local, loans, advances and bills of
exchange, assets held with Reserve Bank of India (other than gold held by Reserve Bank of India), balances due from the governments of
India and Bangladesh, taxation, other assets, bank notes in circulation, bills payable, deposits of banks and financial institutions,
balances and securities under repurchase and reverse repurchase transactions, payable to Islamic Banking Institutions against Bai Muajjal
transactions, current accounts of Governments, balances with the International Monetary Fund (IMF), amount payable under bilateral
currency swap agreement, other deposits and accounts and other liabilities. The particular recognition and measurement methods adopted
are disclosed in the individual policy statements associated with each financial instrument.
All financial assets and financial liabilities are measured initially at their fair value plus transaction costs, except in the case of financial
assets and financial liabilities recorded at fair value through profit or loss where transaction cost is taken directly to the consolidated
profit and loss account. Any difference between the fair value of consideration given and the amount determined using the valuation
techniques detailed in note 5.5 is recognised in the consolidated profit and loss account.
The management determines the appropriate classification of its financial instruments at the time of initial recognition in the following
categories:
The liability of the Bank towards bank notes issued as a legal tender under the State Bank of Pakistan Act, 1956, is stated at face value
and is represented by the specified assets of the Issue Department of the Group as per the requirements stipulated in the State Bank of
Pakistan Act, 1956. The cost of producing the notes including printing charges is charged to the consolidated profit and loss account as
and when incurred. Any un-issued fresh bank notes lying with the Bank and previously issued notes held by the Bank are not reflected in
the balance sheet.
The Group also issues coins of various denominations on behalf of the Government of Pakistan (GoP). These coins are purchased from
the GoP at their respective face values. The coins held by the Group form part of the assets of the Issue Department.
IFRS 15, ‘Revenue from contracts with customers’ deals with revenue recognition and establishes principles for reporting useful
information to users of financial statements about the nature, amount, timing and uncertainty of revenue and cash flows arising
from an entity’s contracts with customers. Revenue is recognised when a customer obtains control of a good or service and thus
has the ability to direct the use and obtain the benefits from the good or service. The standard replaces IAS 18 ‘Revenue’ and IAS
11 ‘Construction contracts’ and related interpretations. The standard is effective for annual periods beginning on or after January
1, 2018 and earlier application is permitted. The management is in the process of assessing the impact of IFRS 15 on the
consolidated financial statements of the Group.
New and amended standards, interpretations and amendments to published approved accounting standards that are effective in
the current year
There are certain new and amended standards and interpretations that are mandatory for the accounting period beginning on or after July
1, 2016 but are considered not to be relevant or do not have any significant effect on the Group's operations and are, therefore, not
disclosed in these consolidated financial statements.
All material inter group balances and transactions have been eliminated.
The consolidated financial statements include collectively the financial statements of the State Bank of Pakistan and its subsidiaries.
Financial statements of the subsidiaries have been consolidated on a line-by-line basis.
The significant accounting policies applied in the preparation of these consolidated financial statements are set out below. These policies
have been consistently applied to all the years presented, unless otherwise stated.
Subsidiaries are entities controlled by the Bank. The Bank controls an entity if it is exposed to, or has rights to, variable returns from its
involvement with the investee and has the ability to effect these returns through its power over the investee. The financial statements of
subsidiaries are included in the consolidated financial statements from the date on which control commences until the date when control
ceases.
All financial assets are initially recognised on the trade date, i.e. the date at which the Group becomes a party to the contractual
provisions of the instruments. This includes purchases or sale of financial assets that require delivery of asset within the time frame
generally established by regulations in market conventions.
Consolidated Financial Statements of SBP and its Subsidiaries
89

5.3.1 Financial assets and financial liabilities at 'fair value through profit or loss' / 'held for trading'
5.3.2 Held to maturity investments
5.3.3 Loans and receivables
5.3.4 Available-for-sale financial assets
5.3.5 Investment in associates
5.3.6 Financial liabilities at amortised cost
Financial assets at fair value through profit or loss are financial assets held for trading and financial assets designated upon initial
recognition as at fair value through profit or loss.A financial asset is classified as held for trading if acquired principally for the purposes
of selling in the short term.These assets and liabilities are either acquired / assumed for generating a profit from short term fluctuations in
market price, interest rate movements, dealer’s margin or securities included in a portfolio in which a pattern of short term profit making
exists. These are initially recognised at fair value and transaction costs associated with the instrument are taken directly to the
consolidated profit and loss account. These instruments are subsequently re-measured at fair value. All related realised and unrealised
gains and losses are recognised in the consolidated profit and loss account directly. Derivatives are also categorised as financial assets
and financial liabilities at 'fair value through profit or loss'.
These are the non derivative financial assets which are either designated in this category or which do not fall in any of the other
categories. Subsequent to initial recognition, these securities are measured at fair value, except investments in those securities the fair
value of which cannot be determined reliably and are stated at cost. Gain or loss on changes in fair value is taken to and kept in equity
until the investments are sold or disposed off, or until the investments are determined to be impaired. At that time, cumulative gain or
loss previously recognised in equity is re-classified to the consolidated profit and loss account.
These are non-derivative financial assets with fixed or determinable payments that are not quoted in an active market. Subsequent to
initial recognition, these assets are carried at amortised cost less impairment losses, if any, and premiums and / or discounts are
accounted for using the effective interest method.
All loans and receivables are recognized when cash is advanced to borrowers. When a loan becomes uncollectible, it is written off
against the related provision for impairment. Subsequent recoveries are credited in the consolidated profit and loss account.
Financial liabilities with a fixed maturity are measured at amortised cost using the effective interest rate. These include deposits of banks
and financial institutions, other deposits and accounts, securities sold under agreement to repurchase, payable under bilateral currency
swap agreement, current accounts of Governments, current account with SBP- Banking Services Corporation, current account with
National Institute of Banking and Finance (Guarantee) Limited, payable to Islamic Banking Institutions against Bai Muajjal transactions,
payable to the IMF, bank notes in circulation, bills payable and other liabilities.
Entities in which the Group has significant influence but not control and which are neither its subsidiaries nor joint ventures are
classified as associates and are accounted for by using the equity method of accounting.
These investments are initially recognised at cost, thereafter the carrying amount is increased or decreased to recognise the Group share
of profit or loss of associates. Share of post acquisition profit and loss of associates is accounted for in the consolodiated profit and loss
account. Distribution received from investee reduces the carrying amount of investment. The Group's share of associates' other
comprehensive income is recognised in consolidated Other Comprehensive Income of the Group.
The carrying amount of the investment is tested for impairment, by comparing its recoverable amount (higher of value in use and fair
value less costs to sell) with its carrying amount and loss, if any is recognised in the consolidated profit and loss account.
Unrealised gains / losses arising from transactions with associated companies are eliminated against the investment in the associates to
the extent of Group's interest in the associates. Unrealised losses are eliminated in the same way as unrealised gains except that they are
only eliminated to the extent that there is no evidence of impairment.
The Group accounts for its share of comprehensive income from associates as at year end on the basis of latest available financial
statement of associates but not older than three months.
These are non-derivative financial assets with fixed or determinable payments and fixed maturity that the Group has the positive intent
and ability to hold till maturity. After initial measurement, held-to-maturity investments are subsequently measured at amortised cost
using the effective interest rate method, less impairment losses, if any. Amortised cost is calculated by taking into account any discount
or premium on acquisition and fees that are integral part of the effective interest rate. The effective interest rate method is a method of
calculating the amortised cost of financial assets or financial liabilities and of allocating the interest income or interest expense over the
relevant period in the consolidated profit and loss account. The losses arising from impairment of such investments are recognised in the
consolidated profit and loss account.
State Bank of Pakistan Annual Report FY17
90

5.4 Derecognition of financial asset and financial liabilities
a)
b)
5.5 Fair value measurement principles
5.6 Offsetting
5.7 Derivative financial instruments
5.8 Collateralised borrowing / lending
5.8.1 Reverse repurchase and repurchase agreements
5.8.2 Payable under bilateral currency swap agreement
5.9 Payable to Islamic Banking Institutions against Bai Muajjal transactions
The Group purchases Government of Pakistan (GoP) Ijara sukuks on deferred payment basis (Bai Muajjal) from Islamic Banks. The
deferred price is agreed at the time of purchase and such proceeds are paid to the Islamic Banks at the end of the agreed period. The
difference between the fair value and deferred price represents financing cost and is recognised in consolidated profit and loss account
on a time proportion basis as "mark-up expense". Amount payable to Islamic Banking Institutions under deferred payment basis on
purchase of sukuks is reported at transaction value plus profit payable thereon (i.e. at amortised cost).
A financial liability is derecognised when the obligation under the liability is discharged or cancelled or expired. Where an existing
financial liability is replaced by another from the same lender on substantially different terms, or the terms of an existing liability
are substantially modified, such an exchange or modification is treated as a derecognition of the original liability and the
recognition of new liability, and the difference in the respective carrying amount is recognised in the consolidated profit and loss
account.
The fair value of financial instruments traded in active markets at the balance sheet date is based on their quoted market prices or dealer
price quotation without any deduction for transaction costs. If there is no active market for a financial asset, the Group establishes fair
value using valuation techniques. These include the use of recent arms length transaction, discounted cash flow analysis and other
revaluation techniques commonly used by market participants. Investments in securities of which the fair value cannot be determined
reliably are carried at cost.
On derecognition of a financial asset, the difference between the carrying amount of the asset (or the carrying amount allocated to
the portion of the asset transferred), and the sum of (i) the consideration previously received (including any new asset obtained less
any new liability assumed) and (ii) any cumulative gain or loss that had been previously recognised in other comprehensive
income, is recognised in the consolidated profit and loss account.
Financial assets
Financial liabilities
Securities sold subject to a commitment to repurchase them at a pre-determined price, are retained on the balance sheet and a liability is
recorded in respect of the consideration received as “Securities sold under agreement to repurchase”. Conversely, securities purchased
under analogous commitment to resell are not recognized on the consolidated balance sheet and an asset is recorded in respect of the
consideration paid as “Securities purchased under agreement to resell”. The difference between the sale and repurchase price in the
repurchase transaction and the purchase price and resell price in reverse repurchase transaction represents expense and income
respectively, and is recognised in the consolidated profit and loss account on time proportion basis. Both repurchase and reverse
repurchase transactions are reported at transaction value inclusive of any accrued expense / income.
A financial asset and a financial liability are offset and the net amount is reported in the consolidated financial statements when the
Group has a legally enforceable right to set off the recognised amount and it intends either to settle on a net basis or to realise the asset
and to settle the liability simultaneously.
The Group uses derivative financial instruments which include forwards, futures and swaps. Derivatives are initially recorded at fair
value and are re-measured to fair value on subsequent reporting dates. Forwards, futures and swaps are shown under commitments. The
resultant gains or losses from derivatives are included in the consolidated profit and loss account.
Bilateral currency swap agreements with counterpart central banks involve the purchase / sale and subsequent resale / repurchase of local
currencies of counterpart central banks against PKR at the applicable exchange rate (determined in accordance with the terms of the
agreement). The actual use of facility by the Group / counterpart central bank in the agreement is recorded as borrowing / lending in
books of the Group and interest is charged / earned at agreed rates to the consolidated profit and loss account on a time proportion basis
from the date of actual use. Any unutilised limit of the counterpart's drawing is reported as commitments.
The Group derecognises a financial asset when the contractual rights to receive the cash flows from the financial asset expires, or it
transfers the rights to receive the contractual cash flows in a transaction in which substantially all the risks and rewards of
ownership of the financial asset are transferred or in which the Group neither transfers nor retains substantially all the risks and
rewards of ownership and it does not retain control of the financial asset.
Consolidated Financial Statements of SBP and its Subsidiaries
91
5.10 Gold reserves
5.11 Cash and cash equivalents
5.12 Property, plant and equipment
5.13 Leased Assets
Depreciation on assets held under finance lease is charged in a manner consistent with that for depreciable assets owned by the PSPC.
5.14 Investment Property
Property, plant and equipment except land, buildings and capital work-in-progress (CWIP) are stated at cost less accumulated
depreciation and accumulated impairment losses, if any. Freehold land is stated at revalued amount. Leasehold land and buildings are
stated at revalued amount less accumulated depreciation and accumulated impairment losses, if any. CWIP is stated at cost less
accumulated impairment losses, if any and consists of expenditure incurred and advances made in respect of fixed assets in the course of
their acquisition, construction and installation. CWIP assets are capitalised to relevant asset category as and when work is completed.
Estimates of useful life and residual value of property, plant and equipment are based on the management's best estimate. The assets'
residual value, depreciation method and useful life are reviewed, and adjusted, if appropriate, at each balance sheet date.
Assets held under finance lease are stated at the lower of their fair value or present value of minimum lease payments at inception less
accumulated depreciation and accumulated impairment losses, if any. The outstanding obligations under the lease agreements net of
financial charges allocable to future periods are shown in other liabilities .
The financial charges are allocated to accounting periods in a manner so as to provide a constant periodic rate of return on the
outstanding liability.
Gold is recorded at the cost, which is the prevailing market rate, at initial recognition. Subsequent to initial measurement, it is revalued at
the closing market rate fixed by the London Bullion Market Association on the last working day of the year which is also the requirement
of State Bank of Pakistan Act, 1956 and State Bank of Pakistan General Regulation No.42(vi). Appreciation or diminution, if any, on
revaluation is taken to equity under the head “unrealised appreciation on gold reserves held by the Group”. Appreciation / diminution
realised on disposal of gold is taken to the consolidated profit and loss account. Unrealised appreciation / diminution on gold reserves
held with the Reserve Bank of India is not recognised in the consolidated statement of changes in equity pending transfer of these assets
to the Group subject to final settlement between the Governments of Pakistan and India. Instead it is shown in "other liabilities" as
provision for other doubtful assets.
Increase in carrying amount arising on revaluation of land and buildings is recognised in consolidated other comprehensive income and
credited to surplus on revaluation of property, plant and equipment. Decreases that offset previous increases of the same assets are
charged against surplus on revaluation of property, plant and equipment in equity, while all other decreases are charged to the
consolidated profit and loss account. The surplus on revaluation realised on sale of property, plant and equipment is transferred to un-
appropriated profit to the extent reflected in the surplus on revaluation of property, plant and equipment account. The amount of sale
proceeds exceeding the balance in surplus on revaluation of property, plant and equipment account is taken to the consolidated profit and
loss account.
Depreciation on additions is charged to the consolidated profit and loss account from the month in which the asset is available for use
while no depreciation is charged in the month in which the assets are deleted / disposed off. Normal repairs and maintenance are charged
to the consolidated profit and loss account as and when incurred. Major renewals and improvements are capitalised and the assets so
replaced, if any, are retired. Gains and losses on disposal of fixed assets are included in the consolidated profit and loss account.
Depreciation on property, plant and equipment is charged to the consolidated profit and loss account using the straight-line method
whereby the cost / revalued amount of an asset is written off over its estimated useful life at the rates specified in note 19.1 to these
consolidated financial statements. The useful life of assets is reviewed and adjusted, if appropriate, at each balance sheet date.
Cash and cash equivalents include cash and bank balances of subsidiary company, foreign currency accounts and investments (other than
held to maturity investments), local currency coins, earmarked foreign currency balances, SDRs, balances in the current and deposit
accounts and securities that are realisable in known amounts of cash within three months from the date of original investments and which
are subject to insignificant changes in value.
State Bank of Pakistan Annual Report FY17
Investment properties are measured initially at cost, including related transaction costs. These properties are carried at cost less
accumulated depreciation subsequent to initial recognition.
Additions to investment properties consists of cost of capital nature. The profit on disposal is determined as a difference between sales
proceeds and the carrying amount of the assets at the commencement of the accounting period plus capital expenditure in the period.
92

5.15 Intangibles
5.16 Accounts receivables and other receivables
5.17 Impairment of financial assets
a) Financial assets carried at amortised cost
b) Available-for-sale financial assets
5.18 Impairment of non-financial assets
The carrying amounts of the Group’s assets are reviewed at each balance sheet date to determine whether there is any indication of
impairment of any asset or a group of assets. If such indication exists, the recoverable amount of such assets is estimated. The
recoverable amount is higher of an asset's fair value less cost to sell and value in use. In assessing the value in use, future cash flows are
estimated which are discounted to present value using a discount rate that reflects the current market assessments of the time value of
money and the risk specific to the asset. In determining fair value less cost to sell, an appropriate valuation model is used. An impairment
loss is recognised in the consolidated profit and loss account whenever the carrying amount of an asset or a group of assets exceeds its
recoverable amount. Impairment loss on revalued assets is adjusted against the related revaluation surplus to the extent that the
impairment loss does not exceed the surplus on revaluation of that asset.
Intangible assets are carried at cost less accumulated amortisation and accumulated impairment losses, if any.
Intangible assets are amortised using straight-line method over the period specified in note 20.1 to these consolidated financial
statements. Where the carrying amount of an asset exceeds its estimated recoverable amount, it is written down immediately to its
recoverable amount.
Accounts receivables and other receivables are carried at invoice amount less an allowance for any uncollectible amounts. Known bad
debts are written off when identified.
For available-for-sale financial assets, the Group assesses at each balance sheet date whether there is an objective evidence that an
investment is impaired. In case of equity investment classified as available-for-sale, significant or prolonged decline in the fair
value of the security below its cost is considered in determining whether the assets are impaired. If any such evidence exist for
available-for-sale financial assets, the cumulative loss measured as the difference between the acquisition cost and the current fair
value, less any impairment loss on that financial asset previously recognised in consolidated profit and loss account, is reclassified
from consolidated other comprehensive income and recognised in the consolidated profit and loss account. Impairment losses
recognised in the consolidated profit and loss account on equity instruments are not reversed through the income statement till the
time the investments are sold or disposed off.
The Group assesses at each balance sheet date whether there is any objective evidence that a financial asset or a group of financial assets
is impaired. A financial asset or a group of financial assets is deemed to be impaired if there is an objective evidence of impairment as a
result of one or more events that has occurred after the initial recognition of the assets (an incurred 'loss event') and that loss event (or
events) has an impact on estimated future cash flows, of the financial asset or a group of financial assets that can be reliably estimated.
Evidence of impairment may include indication that the borrower or group of borrowers is experiencing significant financial difficulty,
the probability that they will enter bankruptcy or other financial reorganisation, default or delinquency in interest or principal payment
and where observable data indicates that there is measurable decrease in the estimated future cash flows, such as changes in arrears or
economic conditions that correlate with defaults, if any.
For financial assets carried at amortised cost, the Group first assesses whether objective evidence of impairment exists for financial
assets that are individually significant, or collectively for financial assets that are not individually significant. If the Group
determines that no objective evidence of impairment exists for individually assessed financial assets, it includes the assets in a
group of financial assets with similar credit risk characteristics and collectively assesses them for impairment. Assets that are
individually assessed for impairment and for which an impairment loss is, or continues to be, recognised are not included in the
collective assessment of impairment.
If there is objective evidence that an impairment loss has been incurred, the amount of the loss is measured as the difference
between the asset's carrying value and the present value of estimated future cash flows discounted at the financial asset's original
effective interest rate. The carrying value of the assets is reduced through the use of an allowance account and the amount of the
loss is recognised in the consolidated profit and loss account. If in a subsequent year the amount of the estimated impairment loss
increases or decreases because of an event occurring after the impairment was recognised, the previously recognised impairment
loss is increased or reduced by adjusting the allowance account. If in a subsequent period the amount of impairment loss decreases
and the decrease can be linked objectively to an event occurring after the write down, the write down or allowance is reversed
through the consolidated profit and loss account.
Consolidated Financial Statements of SBP and its Subsidiaries
93

5.19 Stores and spares
5.20 Stock-in-trade-PSPC
5.21 Stationery and other consumables
5.22 Provisions
5.23 Transactions and balances with the International Monetary Fund
-
-
-
- service charge is recognised in the consolidated profit and loss account at the time of receipt of the IMF tranches.
- charges on borrowings under credit schemes and fund facilities;
- charges on net cumulative allocation of SDRs;
- exchange gain or loss: and
- return on holdings of SDRs.
5.24 Staff retirement benefits
5.24.1 The Bank operates:
a)
The Group reviews the carrying amount of stores and spares on a regular basis and provision is made for obsolescence if there is any
change in usage pattern and physical form.
Raw materials are valued at lower of cost determined on weighted average basis and net realisable value except for items in transit which
are stated at cost incurred upto the balance sheet date.
Stationery and other consumables are valued at the lower of cost and net realisable value. Cost comprises of cost of purchases and other
costs incurred in bringing the items to their present location and condition. Replacement cost of the items is used to measure the net
realisable value. Provision is made for items which are not used for a considerable period of time.
Work-in-process and finished goods are valued at lower of cost determined on weighted average basis and net realisable value. Cost in
relation to work-in-process and finished goods represents direct cost of materials, direct wages and an appropriate portion of production
overheads.
Net realisable value signifies the estimated selling price in the ordinary course of business less the estimated cost of completion and the
costs necessary to be incurred to make the sale.
Provisions are recognised when the Group has a present legal or constructive obligation as a result of past events, it is probable that an
outflow of economic resources will be required to settle the obligation and a reliable estimate of the amount can be made. Provisions are
reviewed at each balance sheet date and are adjusted to reflect the current best estimates.
Transactions and balances with the International Monetary Fund (IMF) are recorded on following basis:
the Government’s contribution for quota with the IMF is recorded by the Group as depository of the Government. Exchange
differences arising on these balances are transferred to the Government of Pakistan account.
State Bank of Pakistan Annual Report FY17
an unfunded contributory provident fund (old scheme) for those employees who joined the Bank prior to 1975 and opted to remain
under the old scheme. Under this scheme, contribution is made both by the Bank and employee at the rate of 6% of the monetized
salary. The Bank provided an option to employees covered under old scheme to join the funded Employer Contributory Provident
Fund Scheme - ECPF (new scheme) effective from June 1, 2007. Under this scheme, contribution is made both by the Bank and
employee at the rate of 6% of the monetized salary. Moreover, employees joining the Bank service after June 1, 2007 are covered
under the new scheme.
the cumulative allocation of Special Drawing Rights (SDRs) by the IMF is recorded as a liability and is translated at closing
exchange rate for SDRs prevailing at the balance sheet date. Exchange differences on translation of SDRs is recognised in the
consolidated profit and loss account.
exchange gains or losses arising on revaluation of borrowings from the IMF are recognised in the consolidated profit and loss
account.
All other income or charges pertaining to balances with the IMF are taken to the consolidated profit and loss account, including the
following:
Stores and spares held by PSPC are valued at the lower of cost determined on weighted average method and net realisable value. Stores
and spares in transit are valued at cost incurred upto the balance sheet date. Local purchases of engineering stores are charged to the
consolidated profit and loss account at the time of purchase.
94

b)
c)
d)
e)
f) an unfunded benevolent fund scheme;
g) an unfunded post retirement medical benefit scheme; and
h) six months post retirement benefit facility.
5.24.2 The SBP Banking Service Corporation operates the following staff retirement benefit schemes for employees:
a)
b)
c)
d)
e)
Following are other staff retirement benefit schemes operated for employees of the Corporation:
- an unfunded benevolent fund scheme;
- an unfunded post retirement medical benefit scheme; and
-
5.24.3 The Pakistan Security Printing Corporation (Private) Limited operates following staff retirement benefits scheme for employees:
a)
b)
5.24.4
six months post retirement benefit facility.
Obligations for contributions to defined contribution provident fund plans are recognised as an expense in the consolidated profit and
loss account as and when incurred.
an unfunded gratuity scheme (old scheme) for all employees other than those who opted for the new general provident fund
scheme, or joined the Bank after 1975 and are entitled only to pension scheme benefits;
a funded Employees Gratuity Fund (EGF) was introduced by the Bank effective from June 1, 2007 for all its employees other than
those who opted for pension scheme or unfunded gratuity scheme (old scheme);
employees who have completed the prescribed qualifying period of more than ten years of service and opt for the scheme are
entitled to post retirement pension benefit; and
gratuity for employees who have opted for gratuity instead of pension or those who have completed five years of service but have
not yet completed ten years of service.
an unfunded pension scheme for those employees who joined the Bank after 1975 and before the introduction of EGF which is
effective from June 1, 2007;
an un-funded gratuity scheme (old scheme) for all employees other than the employees who opted for the new general contributory
provident fund scheme or transferred employees who joined SBP after 1975 and are entitled only to pension scheme benefits;
a funded New Gratuity Fund (NGF) which was introduced by the Corporation effective from July 1, 2010 for all its employees
other than those who opted for pension scheme or unfunded gratuity scheme (old scheme);
an un-funded pension scheme for those employees who joined the SBP after 1975 and before the introduction of EGF which is
effective from July 1, 2010;
Consolidated Financial Statements of SBP and its Subsidiaries
an unfunded General Provident Fund (GPF) scheme for all those employees who joined the Bank after 1975 and those employees
who had joined prior to 1975 but opted for this scheme. Under this scheme contribution is made by the employee only at the rate of
5% of the monetized salary;
an un-funded contributory provident fund (old scheme) for transferred employees who joined SBP prior to 1975 and opted to
remain under the old scheme. Under this scheme, contribution is made both by the Corporation and employee at the rate of 6% of
the monetized salary. The Corporation provided an option to employees covered under old scheme to join the funded New
Contributory Provident Fund Scheme - NCPF (new scheme) effective from July 1, 2010. Under this scheme contribution is made
by both the employer and employee at the rate of 6% of the monetized salary. Moreover, employees joining the Corporation service
after July 1, 2010 are covered under the new scheme.
an un-funded general contributory provident fund (new scheme) for transferred employees who joined SBP after 1975 or who had
joined SBP prior to 1975 but have opted for this new scheme. Under this scheme contribution is made by the employee only at the
rate of 5% of the monetized salary.
An approved funded defined benefit funded pension scheme for all its permanent employees under the Pakistan Security Printing
Corporation (Private) Limited Employees (Pension and Gratuity) Regulations 1993 (the regulations). As a result of business
reorganisation, employees relating to National Security Printing Corporation (Private) Limited (NSPC) were transferred to NSPC and as
per the business transfer agreement dated May 19, 2017 the cost of gratuity or pension are to be borne by transferee company i.e. NSPC,
accordingly, the pension fund has become a multi-employer fund. Under the scheme, the employees are entitled to the following:
95

5.24.5
5.24.6
5.25 Compensated absences
5.26 Trade and other payables
5.27 Borrowing costs
5.28 Leases
5.29 Deferred income
5.30 Revenue recognition
-
-
- Commission income is recognised when related services are rendered.
- Dividend income is recognised when the Group’s right to receive the dividend is established.
- Gains / losses on disposal of securities are recognised in the consolidated profit and loss account at the trade date.
- Training, education and hostel services are recognised on accrual basis.
- Rental income from property is accrued on time proportion basis at agreed rates.
- Return on bank deposits is recognised on accrual basis taking into account the effective yield.
- Scrap sales and miscellaneous income are recognised on receipt basis.
- All other revenues are recognised on a time proportion basis.
5.31 Finances under profit and loss sharing arrangements
5.32 Foreign currency translation
The Group makes annual provision in respect of liability for employees’ compensated absences based on actuarial estimates. The liability
is estimated using the Projected Unit Credit Method.
Grants received on account of capital expenditure are recorded as deferred income. These are amortised over the useful life of the
relevant asset.
Transactions denominated in foreign currencies are translated to Pak Rupees at the foreign exchange rate prevailing at the date of
transaction. Monetary assets and liabilities in foreign currencies are translated into rupees at the closing rate of exchange prevailing at the
balance sheet date.
Discount, interest / mark-up and / or return on loans and advances and investments are recorded on time proportion basis that takes
into account the effective yield on the asset. However, income on balances with Bangladesh (former East Pakistan), doubtful loans
and advances and overdue return on investments is recognised on receipt basis.
The Group provides various finances to financial institutions under profit and loss sharing arrangements. Share of profit / loss under
these arrangements is recognised on an accrual basis.
Annual provisions are made by the Group to cover the obligations arising under defined benefit schemes based on actuarial
recommendations. The actuarial valuations are carried out under the "Projected Unit Credit Method". The most recent valuation in this
regard was carried out as at June 30, 2017. The amount arising as a result of remeasurements are recognised in the consolidated balance
sheet immediately, with a charge or credit to consolidated other comprehensive income in the period in which they occur.
The above staff retirement benefits are vested on completion of prescribed qualifying period of service.
Revenue from sale of goods is measured at fair value of the consideration received or receivable. Revenue is recognised when the
significant risks and rewards of ownership have been transferred to the buyer, recovery of the consideration is probable, the
associated costs and possible return of goods can be estimated reliably, and there is no continuing management involvement with
the goods. The Group records revenue from sale of goods on dispatch of goods to its customers.
Liabilities for trade and other amounts payable are carried at amortised cost, which is the fair value of the consideration to be paid in
future for goods and services received, whether or not billed.
Borrowing costs relating to the acquisition, construction or production of a qualifying asset are recognised as part of the cost of that
asset. All other borrowing costs are recognised as an expense in the period in which these are incurred.
Liabilities against assets subject to finance lease are accounted for at the net present value of minimum payments under the lease
arrangements. Financial charges under lease arrangements are allocated to periods during the lease term so as to produce a constant
periodic rate of financial cost on the remaining balance of principal liability for each period.
State Bank of Pakistan Annual Report FY17
96

5.33 Taxation
Current
Deferred
Note 2017 2016
6. CASH AND BANK BALANCES HELD BY A SUBSIDIARY
With banks in current accounts 6.1 2,184,161 -
Cash in hand 6,496 -
2,190,657 -
6.1
Note 2017 2016
7. GOLD RESERVES HELD BY THE BANK
Opening balance 2,074,032 287,170,323 247,150,713
Additions during the year 1,602 205,879 44,319
(Diminution) / appreciation for the year due to revaluation 34 (17,015,000) 39,975,291
23.1 2,075,634 270,361,202 287,170,323
Note 2017 2016
8. LOCAL CURRENCY - COINS
Coins held as an asset of the Issue Department 8.1 & 23.1 861,860 488,198
Exchange differences arising under Exchange Risk Coverage Scheme and on currency swap transactions are recognised in the
consolidated profit and loss account on an accrual basis.
Commitments for outstanding foreign exchange forward, future and swap contracts disclosed in note 35.2 to these consolidated financial
statements are translated at forward rates applicable to their respective maturities. Contingent liabilities / commitments for letters of
credit and letters of guarantee denominated in foreign currencies are expressed in PKR terms at the closing rate of exchange prevailing at
the balance sheet date.
Net content in
troy ounces ---------(Rupees in '000)--------
--------------- (Rupees in '000) --------------
This includes remunerative accounts carrying mark-up ranging from 3.75% to 6.25% per annum.
---------(Rupees in '000)--------
Deferred tax is recognised using the balance sheet method, providing for temporary differences between the carrying amounts of assets
and liabilities for financial reporting purposes and amounts used for taxation purposes. Deferred tax is not recognised for the temporary
differences relating to initial recognition of goodwill, initial recognition of assets or liabilities in a transaction that is not a business
combination and that affects neither accounting nor taxable profits and differences relating to investments in subsidiaries to the extent
that they probably will not reverse in the foreseeable future.
The charge for current taxation is based on expected taxable income for the year at the current rates of taxation, after taking into
consideration available tax credits, rebates, tax losses, etc. The charge for current tax also includes adjustments to tax payable in respect
of previous years including those arising from assessments finalised during the year and are separately disclosed.
Deferred tax is measured at the tax rates that are expected to be applied to the temporary differences when they reverse, based on the
laws that have been enacted or substantively enacted by the reporting date.
A deferred tax asset is recognised only to the extent that it is probable that future taxable profits will be available against which the assets
can be utilised. Deferred tax assets are reviewed at each reporting date and are reduced to the extent that it is no longer probable that the
related tax benefits will be realised.
Exchange gains and losses are taken to the consolidated profit and loss account except for certain exchange differences on balances with
the International Monetary Fund which are transferred to the Government of Pakistan account.
Income tax expense comprises of current and deferred tax. Income tax expense is recognised in the consolidated profit and loss account
or statement of comprehensive income to which it relates. Income tax expense is recognised based on management’s estimate of the
weighted average effective annual income tax rate expected for the full financial year.
The income of the Bank and the SBP Banking Services Corporation are exempt from tax under applicable laws. However, in case of the
Institute, the Institute is eligible for hundred percent (100%) tax credit on taxes payable by the Institute under clause (d) of sub-section 2
of section 100C of the Income Tax Ordinance, 2001, introduced under the Finance Act, 2015.The income of PSPC is subject to tax at
applicable rates.
Consolidated Financial Statements of SBP and its Subsidiaries
97

8.1
9. FOREIGN CURRENCY ACCOUNTS AND INVESTMENTS
These essentially represent foreign currency reserves held by the Group, the details of which are as follows:
Note 2017 2016
At fair value through profit or loss - held-for-trading
- Investments 9.1 379,452,397 269,942,861
- Unrealised gain / (loss) on derivative financial instruments - net 9.2 2,688,587 (3,904,829)
Held to maturity investment 9.3 337,120,388 238,549,410
Loans and receivables
- Deposit accounts 90,760,872 26,378,414
- Current accounts 20,926,003 6,689,560
- Securities purchased under agreement to resell 9.4 178,482,457 569,237,084
- Money market placements 9.5 773,108,484 870,191,870
1,782,539,188 1,977,084,370
The above foreign currency accounts and investments are held as follows:
Issue Department 23.1 1,495,115,694 1,237,112,270
Banking Department 287,423,494 739,972,100
1,782,539,188 1,977,084,370
9.1
9.2
9.3
9.4
9.5
10. EARMARKED FOREIGN CURRENCY BALANCES
These represent foreign currency cash balances held by the Group to meet foreign currency commitments of the Group.
11. SPECIAL DRAWING RIGHTS OF THE INTERNATIONAL MONETARY FUND
Note 2017 2016
SDRs are held as follows:
- By the Issue Department 23.1 51,051,350 51,179,450
- By the Banking Department 12,605,969 16,476,786
63,657,319 67,656,236
----------------(Rupees in '000)---------------
This represents unrealised gain / (loss) on foreign currency swaps, futures and forward contracts (including transactions executed by the
Fund Managers on behalf of the Bank) entered into with various counterparties.
Special Drawing Rights (SDRs) are the foreign reserve assets which are allocated by the International Monetary Fund (IMF) to its
member countries in proportion to their quota in the IMF. In addition, the member countries can purchase the SDRs from the IMF and
other member countries in order to settle their obligations. The figures given below represent the rupee value of the SDRs held by the
Group as at June 30, 2017. Interest is credited by the IMF on the SDR holding of the Group at weekly interest rates on daily products of
SDRs held during each quarter.
State Bank of Pakistan Annual Report FY17
--------------- (Rupees in '000) --------------
This represents investment in sovereign bonds of foreign countries carrying yield ranging from 0.82 % to 4.11 % per annum and having
maturities from July 06, 2017 to September 24, 2018 (2016: 0.19% to 3.45% per annum and having maturities from July 07, 2016 to
May 05, 2017).
These represent money market placements carrying interest in USD ranging from 0.85% to 1.52% per annum (2016: 0.40% to 0.85%
per annum) and GBP ranging from 0.10 % to 0.20% per annum (2016: 0.33% per annum) and having maturities from July 03, 2017 to
September 22, 2017 (2016: from July 04, 2016 to September 30, 2016).
This represents investments made (by the bank) in foreign sukuks, investments made in international markets and balances maintained
(on behalf of the Bank) through reputable Fund Managers. The activities of the Fund Managers are being monitored through a
custodian. Furthermore, the foreign sukuks purchased by the bank are also held with the custodian. The market value of the investments
and carrying amount of deposit accounts as on June 30, 2017 cumulatively amounts to USD 4,103.57 million (2016: USD 3,331.83
million).
These represent lending under repurchase agreements and carry mark-up in USD ranging from 0.02 % to 1.16 % per annum (2016:
0.40% to 0.48% per annum) and GBP at 0.33% per annum (2016: 0.26% per annum) and these are due to mature on July 03, 2017
(2016: July 01, 2016).
As mentioned in note 5.2, the Group is responsible for issuing coins of various denominations on behalf of the Government. This
balance represents the face value of coins held by the Group at the year end (also refer note 23.1).
98

2017 2016
12. RESERVE TRANCHE WITH THE INTERNATIONAL
MONETARY FUND UNDER QUOTA ARRANGEMENTS
Quota allocated by the International Monetary Fund 296,398,560 297,633,877
Liability under quota arrangements (296,381,178) (297,616,422)
17,382 17,455
13. SECURITIES PURCHASED UNDER AGREEMENT TO RESELL
14. INVESTMENTS - LOCAL Note 2017 2016
Loans and receivables
Government securities
- Market Related Treasury Bills (MRTBs) 2,518,817,198 2,047,573,403
- Federal Government scrips 2,740,000 2,740,000
14.1 2,521,557,198 2,050,313,403
Others
- Term Deposit Receipt 14.2 6,207,070 -
2,527,764,268 2,050,313,403
Held to maturity
Government securities
- Pakistan Investment Bonds 105,118 -
- Market Treasury Bills 14.1 659,000 643,839
764,118 643,839
Investments in banks and other financial institutions
- Preference shares - unlisted 14.3 54,160,348 -
54,924,466 643,839
Fair value through profit and loss
- Mutual Funds 1,582,086 -
Available - for - sale investments
- Mutual Funds 27,164 -
Investments in banks and other financial institutions
Ordinary shares
- Listed 94,406,896 92,487,082
- Unlisted 16,319,632 4,712,706
14.4 110,726,528 97,199,788
Term Finance Certificates 84,722 84,722
Certificates of Deposits 33,705 33,705
110,872,119 97,318,215
Provision against diminution in value of investments 14.5 (856,863) (856,863)
110,015,256 96,461,352
2,694,286,076 2,147,418,594
The above investments are held as follows:
Issue Department - MRTBs 23.1 2,344,098,193 1,973,105,293
Banking Department / subsidiaries 350,187,883 174,313,301
2,694,286,076 2,147,418,594
----------------(Rupees in '000)---------------
--------------- (Rupees in '000) --------------
This represents collateralised lendings made to various financial institutions under repurchase arrangement carrying mark-up at rates
ranging from 5.77% to 6.25% per annum (2016: 5.77% to 6.25% per annum) and are due to mature from July 4, 2017 to July 7, 2017
(2016: July 4, 2016 to July 11, 2016). The fair value of securities collateralised as on June 30, 2017 amounts to Rs. 1,534,782 million
(2016: Rs. 1,535,800 million). The collaterals held by the Group consist of Pakistan Investment Bonds and Market Treasury Bills.
Consolidated Financial Statements of SBP and its Subsidiaries
99

14.1 These represent investments guaranteed / issued by the Government. The profile of return on securities is as follows:
2017 2016
Market Related Treasury Bills 5.90 to 6.01 5.89 to 6.24
Federal Government scrips 3 3
Pakistan Investment Bonds 11.25 -
Market Treasury Bills 5.91 to 6.11 5.91 to 6.26
- MRTBs are created for a period of six months while Federal Government Scrips are of perpetual nature.
- Pakistan Investment Bonds held by the subsidiaries have maturity upto July, 2017
- Treasury bills held by the subsidiaries have maturities upto December, 2017 (2016: June, 2017)
14.2
14.3
14.4 Investments in shares of banks and other financial institutions
Note 2017 2016 2017 2016
Listed
- National Bank of Pakistan 14.4.2 75.20 75.20 94,406,896 92,487,082
Unlisted
- Zarai Taraqiati Bank Limited 14.4.3 76.23 - 10,199,622 -
- House Building Finance Company Limited 14.4.4 90.31 37.50 1,482,304 75,000
Unlisted - at cost
Other investments with holding less than or equal to 50% 4,637,706 4,637,706
16,319,632 4,712,706
110,726,528 97,199,788
14.4.1
14.4.2
14.4.3
14.4.4
------------- (Rupees in '000) -------------
Investments in above entities have been made under the specific directives of the Government of Pakistan in accordance with the
provisions of the State Bank of Pakistan Act, 1956 and other relevant statutes. The Group neither exercises significant influence nor has
control over these entities except for any regulatory purposes or control arising as a consequence of any statute which applies to the
entire sector to which these entities belong. Accordingly, these entities have not been consolidated as subsidiaries or accounted for as
investments in associates or joint ventures.
Cost of the Group's investment in the shares of National Bank of Pakistan at June 30, 2017 amounted to Rs. 1,100.8 million (2016: Rs.
1,100.8 million).
------% of holding-------
This represents 4,015.599 million ordinary shares issued by ZTBL during the year against conversion of suspended mark-up on loans of
Rs. 40,156 million as more fully explained in note 16.1.1 to these unconsolidated financial statements. These ordinary shares have been
recognised at fair value upon initial recognition / receipt.
This represents 1,636.4 million ordinary shares issued by HBFCL during the year against conversion of principal and suspended mark-
up on loans of Rs. 16,364 million as more fully explained in note 16.1.2 to these unconsolidated financial statements. These ordinary
shares have been recognised at fair value upon initial recognition / receipt.
State Bank of Pakistan Annual Report FY17
This represents term deposit receipts maturing upto 12 months with various banks bearing mark-up at rates ranging from 5.6% to 7.6%
(2016: 5.6% to 7.6%) per annum. Term deposit receipt of Rs 22 million is marked under lien against bank guarantee.
This represents 5,446.153 million preference shares of Rs. 10 each issued by Zarai Taraqiati Bank Limited against conversion of
outstanding loan of Rs. 54,461.536 million as more fully explained in note 16.1.1 to these consolidated financial statements. These
preference shares are redeemable on completion of 10 years in one bullet payment on March 7, 2027. These preference shares have been
recognised at fair value upon initial recognition / receipt.
(% per annum)
100

Note 2017 2016
14.5 Provision against diminution in value of investments - local - net
Opening balance 856,863 856,863
Reversal during the year - -
Closing balance 856,863 856,863
14.6
91,386,276 83,994,988
1,918,895 7,391,288
Share in loss of associates relating to "Available for sale investment" (2,290)
93,302,881 91,386,276
15. INVESTMENTS IN ASSOCIATES Percentage
holding
Investments in associates are accounted for using equity method of accounting: %
Security Papers Limited 40.03 1,624,763
SICPA Inks Pakistan (Private) Limited 47 509,827
2,134,590
15.1 Summarised financial statements of the associates are as follows:
Security
Papers
Limited
SICPA Inks
Pakistan
(Private)
Limited
(audited) (unaudited)
June 30, March 31,
2017 2017
Total Assets of the Company 5,679,207 1,982,402
Total Liabilities of the Company 1,078,750 510,972
Year ended
June 30,
Year ended
March 31,
2017 2017
Total Revenue of the Company 2,842,085 2,519,454
Profit after tax of the Company 937,653 554,503
Total Other comprehensive (loss) / income of the Company (142,265) 1,509
15.2
Note 2017 2016
16. LOANS, ADVANCES AND BILLS OF EXCHANGE
Government owned / controlled financial institutions 16.1 47,796,089 102,794,207
Private sector financial institutions 16.2 297,555,950 232,449,996
345,352,039 335,244,203
Employees 16.3 19,489,724 20,675,412
364,841,763 355,919,615
Provision against doubtful balances 16.4 (2,137,973) (5,348,435)
362,703,790 350,571,180
--------------------------------------------------------------------------------------------------------------------------------------------------------------------------------------------------------------------------------------------------------------------------------------------------------------------------------------------------------------------------------------------------------------------------------------------------------------------------------------------------------------------Rupees '000--------------------------------------------------------------------------------------------------------------------------------------------------------------------------------------------------------------------------------------------------------------------------------------------------------------------------------------------------------------------------------------------------------------------------------------------------------------------------------------------------------------------
--------------------------------------------------------------------------------------------------------------------------------------------------------------------------------------------------------------------------------------------------------------------------------------------------------------------------------------------------------------------------------------------------------------------------------------------------------------------------------------------------------------------Rupees '000--------------------------------------------------------------------------------------------------------------------------------------------------------------------------------------------------------------------------------------------------------------------------------------------------------------------------------------------------------------------------------------------------------------------------------------------------------------------------------------------------------------------
Consolidated Financial Statements of SBP and its Subsidiaries
------------- (Rupees in '000) -------------
------------- (Rupees in '000) -------------
Closing balance
Unrealised appreciation on remeasurement of investments - local
Opening balance
Appreciation for the year
2017
--------------- (Rupees in '000) --------------
The market value of SPL as at June 30, 2017 is Rs 105.59 per share i.e. an aggregate amount of Rs 2,504.779 million. The breakup
value based on net assets of SICPA as per latest unaudited financial statements as on March 31, 2017 is Rs 258.146 per share i.e. an
aggregate amount of Rs 691.573 million.
101

16.1 Loans and advances to Government owned / controlled financial institutions
2017 2016 2017 2016 2017 2016
Agricultural sector (16.1.1) 439,900 50,767,526 - - 439,900 50,767,526
Industrial sector (16.1.1 &16.1.2) 8,063,316 4,821,191 - - 8,063,316 4,821,191
Export sector (16.2.1 ) 25,554,323 19,020,317 3,567 3,567 25,557,890 19,023,884
Housing sector (16.2.2) - - - 11,242,300 - 11,242,300
Others (16.2.1, 16.2.3 &16.2.4) 13,734,983 16,939,306 - - 13,734,983 16,939,306
47,792,522 91,548,340 3,567 11,245,867 47,796,089 102,794,207
16.1.1
a)
b)
c) The principal of the preference shares and return thereon shall be guaranteed by the Federal Government.
d)
16.1.2
Scheduled banks Other financial institutions
As at June 30, 2016 the exposure to the agricultural and industrial sectors included Rs. 50,174.09 million and Rs. 1,083.12 million
respectively, representing the cumulative Government guaranteed financing of Rs. 51,257.21 million to Zarai Taraqiati Bank Limited
(ZTBL) in addition to the unsecured subordinated loan to ZTBL amounting to Rs. 3,204 million classified in other loans and advances.
The entire exposure had been overdue since 2002.
Total
------------------------------------------- (Rupees in '000) -------------------------------------------
A tripartite meeting was held on July 11, 2014 between Ministry of Finance (MoF), ZTBL and the Bank ( the parties ) wherein it was
decided that the total outstanding amount of Rs. 89,490 million, including suspended mark-up of Rs. 35,029 million will be converted to
an equity investment of the Bank in ZTBL. The conversion plan was re-negotiated between all the parties in a tripartite meeting held on
November 16, 2015. The MoF approved the re-negotiated conversion plan on April 4, 2016 as detailed below:
The re-negotiated conversion plan was subject to completion of all legal and statutory formalities and the fair value exercise of the entity.
During the current year, 5,446.15 million redeemable preference shares equivalent to Rs. 54,461 million carrying profit of 7.5 percent
per annum payable half yearly were issued. These preference shares are redeemable in 10 years in one bullet payment on March 7, 2027.
As a result of conversion of outstanding loan amount into preference shares, the provision amounting to Rs. 3,204 million held against
unsecured sub-ordinated loan to ZTBL has been reversed and the entire principal exposure against ZTBL amounting to Rs. 54,461
million (representing loan amount) has been derecognised. The preference shares received have been recognised at their fair value as
disclosed in note 14.3 to these consolidated financial statements. In addition, ZTBL has also issued 4,015.6 million ordinary shares
having face value of Rs. 10 each in lieu of mark-up which has been suspended by the Bank in prior years aggregating to Rs. 40,156
million. These shares have been recognised at their fair value (using expected dividend discount method) aggregating to Rs. 10,200
million as disclosed in note 14.4 and the related gain arising due to reversal of suspended mark-up is reflected in note 41.1 to these
consolidated financial statements.
This represented loan receivable from House Building Finance Company Limited (HBFCL) against seven credit lines on profit and loss
sharing basis amounting to Rs. 11,242 million. All of these credit lines were overdue since 2006. These credit lines were secured by
guarantee from the Federal Government.
During the current year, the Ministry of Finance (MoF) vide its letter no. F.No.1(3) IF-II/2016-1122 dated January 09, 2017 approved
the conversion of credit lines of Rs. 11,242 million along with the outstanding suspended mark-up of Rs. 5,122 million (net of Rs 1,378
million in respect of share of loss payable under profit and loss sharing arrangement) into ordinary shares of the HBFCL effective from
December 31, 2016. As a result of conversion of outstanding loan amount into ordinary shares the entire exposure (representing
principal amount) amounting to Rs. 11,242 million has been derecognised. The ordinary shares received have been recognised at their
fair value as disclosed in note 14.4 to these consolidated financial statements. Further, the share of loss amounting to Rs 1,378 million
payable in respect of profit and loss sharing arrangements by the Group to HBFCL has been written back. The net loss amounting to Rs.
8,457 arising on this arrangement is reflected in note 41.1 to these consolidated financial statements.
State Bank of Pakistan Annual Report FY17
The Bank’s principal debt amount of Rs. 54,461 million outstanding against ZTBL as on December 31, 2015 will be converted
into redeemable preference shares carrying a profit of 7.5% per annum, redeemable in 10 years in one bullet payment on
December 31, 2025.
The mark-up on preference shares shall be payable half yearly on June 30th and December 31st each year and shall be the
contractual obligation of ZTBL.
Mark-up on the existing debt shall be accrued upto December 31, 2015 as per existing arrangements leading to increase in accrued
mark-up amount from Rs. 35,029 million as on June 30, 2014 to Rs. 40,156 million as on December 31, 2015. The accrued mark-
up of Rs. 40,156 million as on December 31, 2015 will be converted into ordinary shares of ZTBL.
102

16.1.3
16.1.4
16.2 Loans and advances to private sector financial institutions
2017 2016 2017 2016 2017 2016
Agricultural sector 744,204 947,390 420,901 151,398 1,165,105 1,098,788
Industrial sector 72,186,912 38,550,364 8,892,963 4,923,344 81,079,875 43,473,708
Export sector (16.2.1) 212,825,188 185,597,057 - - 212,825,188 185,597,057
Others (16.2.2) 2,485,782 2,280,443 - - 2,485,782 2,280,443
288,242,086 227,375,254 9,313,864 5,074,742 297,555,950 232,449,996
16.2.1
16.2.2
16.3 The interest / mark-up rate profile of the interest / mark-up bearing loans and advances is as follows:
2017 2016
Government owned / controlled and private sector financial institutions 0 to 9.75 0 to 9.75
Employees loans (where applicable) 0 to 10 0 to 10
2017 2016
16.4 Provision against doubtful assets
Opening balance 5,348,435 5,349,191
Charge for the year 127
Reversal during the year on:
- issuance of preference shares of Zarai Taraqiati Bank Limited (3,204,323) -
- cash recovery (6,266) (756)
Closing balance 2,137,973 5,348,435
-----------------(Rupees in '000)----------------
Scheduled banks Other financial institutions Total
-----------------------------------------------------------------------------(Rupees in '000) -------------------------------------------------------------------------
This includes exposure to the Industrial Development Bank Limited (IDBL) under Locally Manufactured Machinery (LMM) credit line
amounting to Rs. 1,054 million (2016: Rs. 1,054 million). Furthermore, loans and advances also include loans amounting to Rs. 13,000
million and Rs. 340.78 million (2016: Rs. 13,000 million and Rs. 340.78 million) to IDBL which are secured by the Government
guarantee and other Government securities respectively. The Federal Government vide its vesting order dated November 13, 2012 had
transferred and vested all assets and liabilities of IDBP into the IDBL with effect from November 13, 2012. The Cabinet Committee on
Privatisation, in its meeting held on May 07, 2016 approved the inclusion of IDBL in the 'Privatisation Program For Early
Implementation'.
These balances include Rs. 417.7 million (2016: Rs. 423 million) which are recoverable from various financial institutions operating in
Bangladesh (former East Pakistan). The realisability of these balances is subject to final settlement between the Governments of Pakistan
and Bangladesh (former East Pakistan).
Export sector loans of scheduled banks are fully secured against demand promissory notes.
In the year 2015, the Bank in continuation of a scheme of amalgamation of two commercial banks duly sanctioned by the Federal
Government under Section 47 of the Banking Companies Ordinance 1962 and under Section 17 of the State Bank of Pakistan Act 1956,
extended a 10-year financing facility of Rs.5,000 million with a bullet payment of markup and principal at maturity to an Islamic
Commercial Bank (ICB) which is secured against Government of Pakistan Ijara Sukuk. The 10-year facility was provided on the basis
of Mudaraba to be remunerated at profit sharing ratio declared by the ICB on its remunerative current accounts on monthly basis (the last
declared rate in this respect is 0.01% per annum). In accordance with the requirements of accounting framework of the Bank the 10-year
financing facility had been recognized at fair value on initial recognition. The amortized cost as of June 30, 2017 is Rs. 2,465 million
(2016: Rs. 2,255 million). The principal amount (Rs. 5,000 million) of the facility along with the profit will be recovered at its respective
maturity.
Consolidated Financial Statements of SBP and its Subsidiaries
(% per annum)
103

Note 2017 2016
17. ASSETS HELD WITH THE RESERVE BANK OF INDIA
Gold reserves
- Opening balance 4,650,103 4,002,690
- (Diminution) / appreciation for the year due to revaluation 30.3.1.1 (275,565) 647,413
4,374,538 4,650,103
Sterling securities 450,221 467,390
Government of India securities 231,832 222,024
Rupee coins 4,769 4,576
17.1 5,061,360 5,344,093
Indian notes representing assets receivable from the Reserve Bank of India 17.2 697,554 668,044
23.1 5,758,914 6,012,137
17.1
17.2
Note 2017 2016
18. BALANCES DUE FROM THE GOVERNMENTS OF INDIA
AND BANGLADESH (FORMER EAST PAKISTAN)
India
Advance against printing of notes 39,616 39,616
Receivable from the Reserve Bank of India 837 837
40,453 40,453
Bangladesh (former East Pakistan)
Inter office balances 819,924 819,924
Loans, advances and commercial papers 18.1 9,056,879 8,354,504
9,876,803 9,174,428
18.2 9,917,256 9,214,881
18.1
18.2
Note 2017 2016
19. PROPERTY, PLANT AND EQUIPMENT
Operating fixed assets 19.1 110,679,814 59,608,532
Capital work-in-progress 19.5 463,089 466,273
111,142,903 60,074,805
State Bank of Pakistan Annual Report FY17
-----------------(Rupees in '000)----------------
-----------------(Rupees in '000)----------------
-----------------(Rupees in '000)----------------
These assets were allocated to the Government of Pakistan as its share of the assets of the Reserve Bank of India under the provisions
of Pakistan (Monetary System and Reserve Bank) Order, 1947. The transfer of these assets to the Group is subject to final settlement
between the Governments of Pakistan and India (also refer note 30.3.1).
These represent Pak Rupee equivalent of Indian rupee notes which were in circulation in Pakistan until retirement from circulation
under the Pakistan (Monetary System and Reserve Bank) Order, 1947. Realisability of these assets is subject to final settlement
between the Governments of Pakistan and India (also refer note 30.3.1).
These represent interest bearing loans and advances (including commercial papers) provided to the Government of Bangladesh (former
East Pakistan).
The realisability of the above balances is subject to final settlement between the Government of Pakistan and Government of
Bangladesh (former East Pakistan) and India (also refer notes 30.1 and 30.3.1).
104

19.1 Operating fixed assets
Freehold land * 13,041,840 51,072,000 53,000 64,166,840 - - - - 64,166,840 -
Leasehold land * 38,491,706 - 563 38,492,269 - - 1,226,621 1,226,621 37,265,648 30-99 years
Buildings on 2,301,474 735,132 63,068 2,944,098 - 2,686 149,526 148,985 2,795,113 20 years
freehold land * (155,576) ** (3,227) **
Buildings on 4,509,573 - 146,469 4,303,486 - - 292,527 287,594 4,015,892 20 years
leasehold land * (352,556) ** (4,933) **
Plant and Machinery - 6,678,201 30,155 7,817,504 - 6,362,813 65,327 6,930,358 887,146 10%-20%
1,110,647 ** 502,846 **
(1,499) (628)
Furniture and 268,758 44,044 16,376 298,252 203,182 34,618 13,865 220,950 77,302 10%-20%
fixtures (30,926) (30,715)
Office equipment 1,979,570 193,651 583,288 2,120,930 1,629,247 157,668 146,590 1,406,365 714,565 10%-33%
(602,515) ** (494,686) **
(33,064) (32,454)
EDP equipment 2,381,280 - 172,848 2,438,079 1,912,107 - 256,440 2,054,636 383,443 33.33%
(116,049) (113,911)
Motor vehicles 676,031 59,872 129,563 784,290 297,164 44,486 122,047 410,425 373,865 20%
(81,176) (53,272)
63,650,232 58,782,900 1,195,330 123,365,748 4,041,700 6,602,271 2,272,943 12,685,934 110,679,814
(262,714) (230,980)
Freehold land * 3,791,658 - 9,250,182 13,041,840 - - - - 13,041,840 -
Leasehold land * 16,811,005 72,751 21,607,950 38,491,706 2,197,006 428,963 (2,625,969) - 38,491,706 30-99 years
Buildings on 1,138,375 158,764 1,004,335 2,301,474 849,525 223,312 (1,072,837) - 2,301,474 20 years
freehold land *
Buildings on 2,307,509 195,010 2,007,054 4,509,573 1,547,259 395,417 (1,942,676) - 4,509,573 20 years
leasehold land *
Furniture and 253,350 16,677 - 268,758 189,244 14,819 - 203,182 65,576 10%
fixtures (1,269) (881)
Office equipment 1,755,707 235,424 - 1,979,570 1,504,187 132,273 - 1,629,247 350,323
(11,561) (7,213) 20%
EDP equipment 1,945,437 462,876 - 2,381,280 1,746,053 191,062 - 1,912,107 469,173
(27,033) (25,008)
33.33%
Motor vehicles 588,139 129,905 - 676,031 212,888 112,340 - 297,164 378,867
(42,013) (28,064)
28,591,180 1,271,407 33,869,521 63,650,232 8,246,162 1,498,186 (5,641,482) 4,041,700 59,608,532 20%
(81,876) (61,166)
* These represent revalued assets.
** Adjustments represents reclassifications within different categories of assets.
***
Consolidated Financial Statements of SBP and its Subsidiaries
2017
--------------------------------------------------------------- (Rupees in '000) ---------------------------------------------------------------
This includes investment property having nil book value. The fair value of the investment property was assessed to be Rs 32.315 million as at March 31, 2017 as a result of
revaluation exercise carried out by an independent valuer
Useful life /
Rate of
depreciation
Cost /
revalued
amount at
July 1, 2015
Additions /
(deletions) /
adjustments
** during the
year
Accumulated
depreciation at
July 1, 2015
Depreciation
for the year/
(deletions)
Accumulated
depreciation at
June 30, 2016
Net book
value at June
30, 2016
Cost /
revalued
amount at
June 30, 2016
Revaluation
during the
year
Reversal due
to revaluation
2016
--------------------------------------------------------------- (Rupees in '000) ---------------------------------------------------------------
Cost /
revalued
amount at
July 1, 2016
Additions /
(deletions)
during the
year
Cost /
revalued
amount at
June 30, 2017
Accumulated
depreciation
at July 1, 2016
Depreciation
for the year/
(deletions)
Accumulated
depreciation
at June 30,
2017
Net book
value at June
30, 2017
Useful life /
Rate of
depreciation
Accumulated
depreciation
transferred
from PSPC
Asset
transferred
from PSPC
105

19.2
19.3
2017 2016
Freehold land 92,858 39,858
Leasehold land 157,415 159,077
Buildings on freehold land 327,372 485,202
Buildings on leasehold land 710,875 1,052,028
1,288,520 1,736,165
19.4
2017
(Rupees in '000)
Freehold land 3,241
Building on leasehold land 107,928
111,169
2017 2016
19.5 Capital work-in-progress
Buildings on freehold land 63,536 43,634
Buildings on leasehold land 229,031 311,309
Furniture and fixtures 50,637 -
Office equipment 23,068 44,467
EDP equipment 92,329 66,863
Plant and Machinery 4,488 -
463,089 466,273
20. INTANGIBLE ASSETS
Software 20.1 4,732 3,833
Capital work-in-progress 102,822 21,153
107,554 24,986
20.1 Intangible assets
Software 2017 613,585 20,533 4,027 638,145 609,752 20,430 3,231 633,413 4,732 20 - 33.33
Software 2016 610,844 - 2,741 613,585 606,641 - 3,111 609,752 3,833 33.33
Accumulated
amortisation
transferred
from PSPC
Amortisation
for the year
Accumulated
amortisation
at June 30
Net book value at
June 30
State Bank of Pakistan Annual Report FY17
Annual rate of
amortisation %
During the year, the management has reassessed the classification of fixed assets and reclassified certain fixed assets as “plant and
machinery” from buildings on freehold / leasehold land and office equipment. Further, the management has also revised the depreciation
on those assets ranging from 5 to 20 percent per annum to 10 percent per annum with effect from July 1, 2016. The revision has been
made after taking into account the expected pattern of recovery of economic benefits associated with the use of those assets. The
revision has been accounted for as change in accounting estimate as defined in IAS-8 'Accounting Policies, Changes in Accounting
Estimates and Errors'. Had this change in estimate not been made, the depreciation for the year would have decreased by Rs. 4.6 million
with a corresponding increase in profit for the year.
Land and buildings of the Group are carried at revalued amount. The latest revaluation of assets of SBP was carried out on June 30,
2016 by M/S M.J.Surveyors (Pvt.) Ltd which resulted in a surplus of Rs. 33,870 million. The revaluation was carried out based on the
market value assessment being the fair value of the land and buildings. The carrring value of these assets as at June 30, 2017 amount to
Rs. 56,440 million. Had there been no revaluation, the carrying value of the revalued assets would have been as follows:
---------(Rupees in '000)--------
Land and buildings of PSPC have been recorded based on their revalued amount as appearing in the financial statements of the PSPC as
at June 30, 2017. These assets were ravalued on April 1, 2017 by M/s Iqbal A. Nanjee & Co. (Private) Limited based on the market
value assessment being the fair value of the land and buildings. Their carring value as at June 30, 2017 was Rs. 51,804 million. Had
there been no revaluation of these assets, their carrying value would have been as follows:
---------(Rupees in '000)--------
---------------------------------------------------------------(Rupees in '000) ---------------------------------------------------------------
Cost at
July 1
Asset
transferred
from PSPC
Additions
during the
year
Cost at
June 30
Accumulate
d
amortisation
at July 1
106

21. DEFERRED TAXATION June 30, 2017
Rupees '000
Deductible temporary differences
Property, plant and equipment 468
Stores and spares 8,176
Stock-in-trade 15,321
Loans and advances 1,667
Other receivables 8,846
Liabilities under finance lease 5,053
Deferred liabilities - pension payable 626,542
666,073
Taxable temporary differences
Long term investment in associates (262,849)
Short term investments (22,782)
Surplus on revaluation of property, plant and equipment (187,168)
(472,799)
Deferred taxation asset 193,274
Note 2017 2016
22. OTHER ASSETS
Commission receivable and others 22.1 4,999,406 2,136,336
Unrealised gain on derivative financial instruments - net 505,076 1,442,497
Medical, stationery consumables and stamps on hand 166,013 139,829
Other advances, deposits and prepayments 664,338 629,500
Stores and spares - net 248,608 -
Stock-in-trade - net 2,073,947 -
8,657,388 4,348,162
22.1
Note 2017 2016
23. BANK NOTES IN CIRCULATION
Total bank notes issued 23.1 4,167,247,213 3,555,067,671
Bank notes held by the Banking Department (111,406) (145,614)
Bank notes in circulation 4,167,135,807 3,554,922,057
23.1
Note 2017 2016
Gold reserves held by the Bank 7 270,361,202 287,170,323
Local currency - coins 8 861,860 488,198
Foreign currency accounts and investments 9 1,495,115,694 1,237,112,270
Special Drawing Rights of the International Monetary Fund 11 51,051,350 51,179,450
Investments - local 14 2,344,098,193 1,973,105,293
Assets held with the Reserve Bank of India 17 5,758,914 6,012,137
4,167,247,213 3,555,067,671
24. CURRENT ACCOUNTS OF GOVERNMENTS
24.1 Current accounts of Governments - payable balances
Federal Government 24.3 76,078,530 313,688,605
Provincial Governments
- Punjab 24.4 38,899,196 96,833,336
- Sindh 24.5 20,398,680 89,107,726
- Khyber Pakhtunkhwa 24.6 31,526,641 77,207,052
- Baluchistan 24.7 2,459,725 19,091,164
Gilgit - Baltistan Administration Authority 24.8 9,239,193 10,729,895
102,523,435 292,969,173
178,601,965 606,657,778
---------------(Rupees in '000)--------------
---------------(Rupees in '000)--------------
The liability for bank notes issued of the Issue Department is recorded at its face value in the consolidated balance sheet. In accordance
with section 26 (1) of SBP Act 1956, this liability is supported by the following assets of the Issue Department.
This includes Rs 11.684 million to be collected and paid (net) on behalf of National Security Printing Corporation (NSPC) on no-charge
basis in accordance with the common facilities agreement dated May 19, 2017.
---------------(Rupees in '000)--------------
Consolidated Financial Statements of SBP and its Subsidiaries
107

Note 2017 2016
24.2 Current accounts of Governments - receivable balances
Government of Azad Jammu and Kashmir 24.9 7,279,247 955,474
7,279,247 955,474
24.3 Federal Government
Non-food account 40,062 973,642
Zakat fund accounts 80,317,636 7,884,671
Railways accounts (29,518,688) (13,313,227)
Other accounts 25,239,520 318,143,519
76,078,530 313,688,605
24.4 Provincial Government - Punjab
Non-food account 24,344,157 82,846,743
Zakat fund account 753,583 401,259
Other accounts 13,801,456 13,585,334
38,899,196 96,833,336
24.5 Provincial Government - Sindh
Non-food account 18,180,177 84,389,116
Zakat fund account 1,694,383 1,526,526
Other accounts 524,120 3,192,084
20,398,680 89,107,726
24.6 Provincial Government - Khyber Pakhtunkhwa
Non-food account 29,771,904 67,829,675
Zakat fund account 1,281,569 1,186,629
Other accounts 473,168 8,190,748
31,526,641 77,207,052
24.7 Provincial Government - Baluchistan
Non-food account 1,183,617 16,553,943
Zakat fund account 999,379 833,822
Other accounts 276,729 1,703,399
2,459,725 19,091,164
24.8 Gilgit - Baltistan Administration Authority 9,239,193 10,729,895
24.9 Government of Azad Jammu and Kashmir (7,279,247) (955,474)
Classified as receivable balance 24.10 7,279,247 955,474
- -
24.10 These balances carry mark-up at rates ranging from 5.89% to 6.01% per annum (2016: 6.18% to 6.88% per annum).
25 PAYABLE TO ISLAMIC BANKING INSTITUTIONS AGAINST BAI MUAJJAL TRANSACTIONS
26. PAYABLE UNDER BILATERAL CURRENCY SWAP AGREEMENT
26.1 Payable under bilateral currency swap agreement with the People's Bank of China (PBoC)
This represents amount payable to various Islamic Banking Institutions against purchases of Government of Pakistan (GoP) Ijara
Sukuks by the Bank on Bai Muajjal basis (deferred payment basis) having profit rates ranging from 5.32% to 5.97% per annum (2016:
4.75% to 5.74% per annum) and maturities on December 31, 2017 and June 21, 2018 (2016: February 10, 2017 and March 15, 2017).
---------------(Rupees in '000)--------------
A bilateral currency swap agreement was entered between the Bank and the PBoC on December 23, 2011 in order to promote bilateral
trade, finance direct investment, provide short term liquidity support and for any other purpose mutually agreed between the two central
banks. The original agreement was for tenure of 3 years with overall limit of CNY 10,000 million and equivalent PKR, which was
renewed on December 23, 2014 for a further period of three years. The Bank has purchased CNY 5,000 million, CNY 1,500 million
and CNY 3,500 million against PKR during the year with maturity bucket of three months and six months (2016: CNY 5,000 million,
CNY 1,500 million and CNY 3,500 million with maturity buckets of six months, three months and two months respectively). These
purchases have been fully utilized as on June 30, 2017 and the same amounts are outstanding as on June 30, 2017. Interest is charged
on outstanding balance at agreed rates. As at June 30, 2017, the Bank's commitment under this agreement is Rs. 154,595 million (2016:
Rs. 165,000 million).
State Bank of Pakistan Annual Report FY17
108

Note 2017 2016
27. DEPOSITS OF BANKS AND FINANCIAL INSTITUTIONS
Foreign currency
Scheduled banks 7,619,462 7,527,991
Held under Cash Reserve Requirement 27.1 137,166,870 136,803,601
144,786,332 144,331,592
Local currency
Scheduled banks 27.1 516,209,260 234,778,810
Financial institutions 8,264,427 12,574,555
Others 77,520 75,512
524,551,207 247,428,877
669,337,539 391,760,469
27.1 This includes cash deposited with the State Bank of Pakistan by the scheduled banks under regulatory requirements.
Note 2017 2016
28. OTHER DEPOSITS AND ACCOUNTS
Foreign currency
Foreign central banks 47,257,038 47,210,792
International organisations 28.1 26,533,361 26,479,513
Others 18,013,438 19,445,168
28.2 91,803,837 93,135,473
Local currency
Special debt repayment 28.3 24,243,841 24,243,841
Government 28.4 17,850,348 17,850,348
Foreign central banks 2,059 2,003
International organisations 6,302,580 6,692,016
Others 24,462,409 19,629,317
72,861,237 68,417,525
164,665,074 161,552,998
28.1
2017 2016
28.2 The interest rate profile of the interest bearing deposits is as follows:
Foreign central banks 0.59 to 1.49 0.30 to 0.76
International organisations 2.62 to 3.09 2.11 to 2.62
Others 0.38 to 1.00 0.09 to 0.41
28.3
28.4
Consolidated Financial Statements of SBP and its Subsidiaries
-----------------(Rupees in '000)----------------
These are interest free and represent amounts kept in separate special accounts to meet forthcoming foreign currency debt repayment
obligations of the Government of Pakistan.
These represent rupee counterpart of the foreign currency loan disbursements received from various international financial institutions
on behalf of the Government and credited to separate deposit accounts in accordance with the instructions of the Government.
----------(% per annum)----------
-----------------(Rupees in '000)----------------
This includes a long-term deposits of USD 500 million (2016: two contracts of Rs 500 million each) received from the State
Administration Foreign Exchange (SAFE) China in January 2009 (rolled-over in January 2017) carrying interest at six months LIBOR
plus 100 bps (2016: LIBOR plus 100 bps), payable semi-annually. The deposit of USD 500 million which has been set off against the
rupee counterpart receivable from the Federal Government and has been covered under Ministry of Finance (MoF) Guarantee whereby
the MoF has agreed to assume all liabilities and risks arising from the Bank's agreement with SAFE China.
109

Note 2017 2016
29. PAYABLE TO THE INTERNATIONAL MONETARY FUND
Borrowings under:
- Fund facilities 29.1 & 29.3 643,054,775 634,172,641
- Allocation of SDRs 29.2 144,326,457 144,566,830
787,381,232 778,739,471
Current account for administrative charges 34 34
787,381,266 778,739,505
29.1
29.2
Note 2017 2016
29.3 Interest profile of amount payable to the IMF is as under:
Fund facilities 29.3.1 1.05 to 1.63 1.05 to 1.07
29.3.1
Note 2017 2016
30. OTHER LIABILITIES
Local currency
Provision against overdue mark-up 30.1 8,662,726 7,960,351
Remittance clearance account 2,215,088 2,259,587
Exchange loss payable under exchange risk coverage scheme 239,068 233,121
Dividend payable 30.2 10,000 10,000
Share of loss payable under profit and loss sharing arrangements - 1,377,691
Other accruals and provisions 30.3 29,835,773 31,126,910
Liabilities against assets subject to finance leases 16,904
Payable to NSPC 7,983,186 -
Others 30.4 8,552,698 6,611,340
57,515,443 49,579,000
30.1
30.2
Note 2017 2016
30.3 Other accruals and provisions
Agency commission 12,451,275 12,440,190
Provision for employees' compensated absences 45.4.10 7,098,384 7,475,810
Provision for other doubtful assets 30.3.1 6,652,772 6,911,495
Other provisions 30.3.2 2,848,701 2,848,701
Others 784,641 1,450,714
29,835,773 31,126,910
This includes dividend payable on shares held by the Government of Pakistan and Government controlled entities amounting to Rs. 9.99
million (2016: Rs. 9.99 million).
--------------(Rupees in '000)---------------
State Bank of Pakistan Annual Report FY17
--------------(Rupees in '000)---------------
This represents amount payable against allocation of SDRs. A charge is levied by the IMF on the SDR allocation of the Bank at weekly
interest rate applicable on daily product of SDR.
The IMF levies a basic rate of interest (charges) on loans based on the SDR interest rate and imposes surcharges depending on the
amount and maturity of the loan and the level of credit outstanding. Interest rates are determined by the IMF on weekly basis. Charges
are, however, payable on quarterly basis.
IMF provides financing to its member countries from General Resources Account (GRA) held in its General Department. GRA credit is
normally governed by the IMF’s general lending policies (also known as “credit tranche” policies, which provide financing for Balance
of Payments [BoP] needs).
-----------------(Rupees in '000)----------------
This represents suspended mark-up which is recoverable from Government of Bangladesh (former East Pakistan) subject to the final
settlement between the Governments of Pakistan and Bangladesh (former East Pakistan).
Under GRA financing i.e. Extended Fund Facility (EFF) was granted by IMF in FY 2013-14. The total facility amounts to SDR 4,393
million having repayment period of 4½–10 years, with repayments in twelve equal semi-annual installments. A total amount of SDR
4,393 million has been disbursed under twelve (12) tranches of EFF up to June 30, 2017 (2016: SDR 4,320 million). The repayments
under this facility would start in March 2018 and would continue till September 2026.
--------(% per annum)-------
110

Note 2017 2016
30.3.1 Provision for other doubtful assets
Provision against assets held with / receivable from Government of India and
the Reserve Bank of India
- Issue Department 5,758,914 6,012,137
- Banking Department 40,483 40,483
5,799,397 6,052,620
Provision against assets receivable from Government of
Bangladesh (former East Pakistan)
- Issue Department - -
- Banking Department 853,375 858,875
853,375 858,875
30.3.1.1 6,652,772 6,911,495
30.3.1.1 Movement of provisions for other doubtful assets
Opening balance 6,911,495 6,350,295
Charge / (reversal) for the year - net 16,842 (86,213)
(Diminution) / appreciation relating to gold reserves held by
the Reserve Bank of India (275,565) 647,413
Closing balance 6,652,772 6,911,495
30.3.2 Movement of other provisions
Opening balance 2,848,701 2,848,933
Reversal during the year - (232)
Closing balance 2,848,701 2,848,701
Home Specific claims Others Total
remittance (note 30.3.2.1) (note 30.3.2.2)
Balance as at July 1, 2015 260,363 1,600,000 988,570 2,848,933
Reversal during the year - - (232) (232)
Balance as at June 30, 2016 260,363 1,600,000 988,338 2,848,701
(Charge) / Reversal during the year - - - -
Balance as at June 30, 2017 260,363 1,600,000 988,338 2,848,701
30.3.2.1 This represents provision made against a claim under arbitration.
30.3.2.2 This represents provision made in respect of various litigations and claims against the Group.
30.4
Note 2017 2016
31. DEFERRED LIABILITY - STAFF RETIREMENT BENEFITS
Unfunded staff retirement benefits
Pension 61,733,525 58,018,505
Gratuity scheme 48,799 41,822
Post retirement medical benefits 21,789,331 21,135,683
Benevolent fund scheme 1,602,183 1,755,433
Six months post retirement facility 527,426 480,397
45.3.3 85,701,264 81,431,840
Provident fund scheme 959,344 987,418
86,660,608 82,419,258
Funded staff retirement benefits
Staff pension scheme 45.4.2 3,146,267 -
Total 89,806,875 82,419,258
This includes liability maintained against balances due from Government of Bangladesh (former East Pakistan) amounting to Rs.
778.399 million (2016: Rs. 778.399 million).
-----------------(Rupees in '000)----------------
----------------------------------------- (Rupees in '000) -----------------------------------------
-----------------(Rupees in '000)----------------
Consolidated Financial Statements of SBP and its Subsidiaries
111

32. SHARE CAPITAL
2017 2016 2017 2016
---(Number of shares)---
Authorised share capital
1,000,000 1,000,000 Ordinary shares of Rs. 100 each 100,000 100,000
Issued, subscribed and paid-up capital
1,000,000 1,000,000 Fully paid-up ordinary shares of Rs. 100 each 100,000 100,000
33. RESERVES
33.1 Reserve fund
33.2 Reserve for acquisition of PSPC
33.3 Other funds
Note 2017 2016
34. UNREALISED APPRECIATION ON GOLD RESERVES
HELD BY THE BANK
Opening balance 283,342,601 243,367,310
(Diminution) / appreciation for the year due to revaluation 7 (17,015,000) 39,975,291
266,327,601 283,342,601
35. CONTINGENCIES AND COMMITMENTS
35.1 Contingencies
State Bank of Pakistan
a) Contingent liability in respect of guarantees given on behalf of:
Federal Government 16,889,529 21,486,999
Federal Government owned / controlled bodies and authorities 7,103,733 7,605,996
23,993,262 29,092,995
b) Certain employees of the Bank who had retired under the Early Retirement Incentive Scheme (ERIS) introduced in the year 2000 had
filed a case against the Bank in the Federal Services Tribunal (FST) for the enhancement of their entitlement paid under the above
scheme amounting to Rs. 157 million approximately. The Tribunal has decided the case in favour of these employees and has
directed that the entitlement under the above scheme should include the effect of subsequent increases in certain staff retirement and
other benefits. The Bank, in response to the above decision of the Tribunal filed a civil petition for leave to appeal in the Supreme
Court of Pakistan. In prior years, the Honorable Bench of the Supreme Court of Pakistan set aside the judgment of FST and allowed
employees to avail proper forum. The employees have filed an appeal in the Honorable Lahore High Court, Rawalpindi Bench, the
decision of which is pending. The management is confident that the Bank would not have to bear any additional expenditure on this
account and, accordingly, no provision has been made in this respect.
-----------------(Rupees in '000)----------------
State Bank of Pakistan Annual Report FY17
The shares of the Bank are held by the Government of Pakistan and certain Government controlled entities except for 200 shares held by
the Central Bank of India (held by Deputy Custodian Enemy Property, Banking Policy and Regulations Department, State Bank of
Pakistan) and 500 shares held by the State of Hyderabad.
This represents appropriations made out of the annual profits of the State Bank of Pakistan in accordance with the provisions of the
State Bank of Pakistan Act, 1956.
These represent appropriations made out of the surplus profits of the State Bank of Pakistan for certain specified purposes in
accordance with the provisions of the State Bank of Pakistan Act, 1956.
-----------------(Rupees in '000)----------------
During the current year the Board of Directors of the Bank in its meeting held on June 29, 2017 has approved the creation of a special
reserve fund by the name of "The Reserve for Acquisition of PSPC" and has appropriated an amount of Rs. 65,464 million from
"Reserve Fund" to "The Reserve for Acquisition of PSPC".
112

c)
Note 2017 2016
d) Other claims against the Bank not acknowledged as debts 35.1.1 353,153 353,640
35.1.1 These represent various claims filed against the Bank's role as a regulator and certain other cases.
National Instiute of Banking and Finance (Guarantee) Limited
a)
b)
Pakistan Security Printing Corporation (Private) Limited
a)
b)
The PSPC is defending certain cases filed by its ex-employees on account of their reinstatement in the PSPC and compensation for
loss of their jobs. Management considers that the probability of any significant liability arising from such cases is remote.
In the previous years the tax authorities initiated proceedings for amendment of deemed assessments for tax years 2004 to 2009 by
issuing notices under sections 122 (5A) read with 122(9) of the Income Tax Ordinance, 2001. The amended orders were passed and
certain demands were raised for which the PSPC subsequently filed rectification application as a result of which the demands were
rectified to Rs 34.9 million. The PSPC, having paid the aforesaid net demand of Rs 34.9 million, had filed appeals before the
Commissioner of Inland Revenue - Appeals {CIR(A)} which were decided against the PSPC. The PSPC, further filed appeal before
the Appellate Tribunal Inland Revenue (ATIR) which vide order dated June 29, 2015 partially upheld the action of the Additional
Commissioner Inland Revenue for amending the aforesaid assessments.
Further, the PSPC's miscellaneous application before ATIR on the matter of allocation of expenses has been dismissed. A reference
before the High Court of Sindh has been filed by the PSPC, the adjudication of which is pending to date. The management, however,
is continuing with its view that the net demand will eventually be revoked and the amount paid will be refunded / adjusted in favour
of the PSPC.
During the current year, the Institute has filed an appeal before the Commissioner Inland Revenue Appeals II (CIRA) challenging the
compulsory registration of the Institute done by the department vide its order dated February 19, 2016. This appeal was disposed of
by the CIRA on February 9, 2017 because it was not maintainable under the law (as it was outside the jurisdiction) and the case can
now be taken to the Honorable Islamabad High Court. Consequently, the Institute intends to file writ petition against the above
orders before the Honorable Islamabad High Court.
The Institute, based on the advice of its legal counsel, is of the view that the Institute has valid grounds and there are fair chances of
success before the Honorable Islamabad High Court. Accordingly, no provision has been recognized in these consolidated financial
statements.
The Finance Act 2015 extended the scope of services covered under Islamabad Capital Territory (Tax on Services) Ordinance, 2001
(ICTO) and some new services were brought within the purview of sales tax which are detailed in schedule to the ICTO. During the
year 2016, the Institute received a notice from the tax department dated January 20, 2016 claiming that the services provided by the
Institute fall within the purview of serial numbers 13, 19 and 38 of schedule to the ICTO and accordingly the Institute should get
itself registered for sales tax, obtain Sales Tax Registration number (STRN), file returns for six months from July 2015 to December
31, 2015 and settle the outstanding liability in respect of sales tax for those six months. The management believes that the Institute
does not fall under the purview of serial numbers 13, 19 and 38 of schedule to the ICTO mainly on the ground that NIBAF is a
training institute and is not liable to be registered under sales tax on services. A reply was sent from the Institute’s management to
the Assistant Commissioner Inland Revenue (ACIR) justifying the non-applicability of serial numbers 13, 19 and 38 of schedule to
the ICTO to the Institute. However, the ACIR maintained the tax department’s view and ordered the compulsory registration of the
Institute with immediate effect through its order dated February 19, 2016.
Moreover, the Institute received a show cause notice on March 10, 2016 for filing the tax returns for the period from July 2015 to
December 2015 and payment of the due amount of sales tax on services. Subsequently, the department passed the following order on
April 11, 2016:
Imposition of sales tax amounting to Rs.13,675,649; and
Imposition of a penalty under section 33(1) of the Sales Tax Act, 1990 for non-filing amounting to Rs.35,000 along
with default surcharge and penalty under section 33(5) of the Sales Tax Act, 1990.
The Institute challenged the above order passed by the ACIR before the Commissioner Inland Revenue Appeals II (CIRA).
However, the matter was decided against the Institute.
In addition to these claims, there are several other investigations / lawsuits filed by various parties as a result of the regulatory
actions / investigations taken by the Bank in its capacity as regulator and banker to the government, which the Bank is currently
contesting in various courts of laws / forums. The management of the Bank, believes that the Bank has reasonable position in respect
of these litigations and accordingly no provision for any liability may be needed in the consolidated financial statements.
-----------------(Rupees in '000)----------------
Consolidated Financial Statements of SBP and its Subsidiaries
113

Note 2017 2016
35.2 Commitments
35.2.1 Foreign currency forward and swap contracts - sale 935,079,726 802,656,331
35.2.2 Foreign currency forward and swap contracts - purchase 498,678,723 595,499,305
35.2.3 Futures - sale 43,038,829 18,044,108
35.2.4 Futures - purchase 35,430,566 14,656,485
35.2.5 Capital Commitments 35.2.5.1 272,021 935,886
35.2.6 Letter of Guarantee / Credit 4,701,000 -
35.2.5.1 This represents amounts committed by the bank to purchase assets from successful bidders.
35.2.7
35.2.8
36. DISCOUNT, INTEREST / MARK-UP AND / OR PROFIT EARNED Note 2017 2016
Discount, interest / mark-up on Government transactions
- Government securities 36.1 171,399,674 150,313,267
- Federal Government Scrips 82,769 82,200
- Loans and advances to and current accounts of Governments 36.2 442,256 327,520
Securities purchased under agreement to resell 63,193,756 80,712,710
Interest income on preference shares 1,333,659 -
Return on loans and advances to financial institutions 6,400,591 8,683,044
Foreign currency loan and advance including deposits 9,034,732 4,258,735
Foreign currency securities 8,970,869 8,382,254
Profit on Sukuks purchased under Bai Muajjal agreement 11,412 70,542
Others 909 798
260,870,627 252,831,070
36.1 This represents income earned on Market Related Treasury Bills, Market Treasury Bills and Pakistan Investment Bonds.
2017 2016
36.2 Interest profile on loans and advances to facilities are as under: -----(% per annum)----
Mark-up on facility 6.89 to 6.01 6.18 to 6.88
Additional mark-up (where ways and means facility limit is exceeded) 4 4
Note 2017 2016
37. INTEREST / MARK-UP EXPENSE
Deposits 19,087,345 15,866,387
Securities sold under agreement to repurchase 152,737 218,111
Return on Sukuks purchased under Bai Muajjal agreement 1,735,682 9,287,535
Charges on allocation of Special Drawing Rights of the IMF 388,071 78,609
Others 5,009 3,838
21,368,844 25,454,480
38. COMMISSION INCOME
Market Treasury Bills 38.1 1,163,377 472,821
Management of public debts 38.1 959,936 989,118
Prize Bonds and National Saving Certificates 38.1 459,422 439,041
Draft / payment orders 8,408 8,148
Others 51 52
2,591,194 1,909,180
38.1 These represent commission income earned from services provided to the Federal Government.
-----------(Rupees in '000)---------
-----------(Rupees in '000)---------
The Group has made commitments to extend advance under ways and means limits to the Provincial Governments of Pakistan,
Government of Azad Jammu and Kashmir and Gilgit-Baltistan Administration Authority in the normal course of its operations. The
unutilised limits as on June 30, 2017 amounted to Rs. 67,325 million (2016: Rs. 71,945 million).
In case the Governments exceed their respective ways and means limits, the Bank charges a penal rate of 4% over and above the
normal rate of return on the amount exceeding the ways and means limit.
State Bank of Pakistan Annual Report FY17
-----------(Rupees in '000)---------
Commitments in respect of bilateral currency swap agreements with People's Bank of China have been disclosed in note 26 to these
consolidated financial statements.
114

39. EXCHANGE GAIN - NET Note 2017 2016
Gain / (loss) on:
- Foreign Currency placements, Deposits, securities and Other Accounts - net 21,802,161 38,322,960
- Forward covers under Exchange Risk Coverage Scheme (109) 6
- IMF Fund Facilities 2,642,689 (10,984,606)
- Special Drawing Rights of the IMF 80,160 (1,611,329)
24,524,901 25,727,031
Others 446 -
Exchange risk fee income 44,291 52,344
24,569,638 25,779,375
40. SHARE OF PROFIT FROM ASSOCIATES
Security Papers Limited 14,058 -
SICPA Inks Pakistan (Private) Limited 12,138 -
26,196 -
41. OTHER OPERATING INCOME - NET
Penalties levied on banks and financial institutions 1,131,474 1,017,004
License / Credit Information Bureau fee recovered 904,202 817,885
Gain / (loss) on sale of investment-net
Local - 'at fair value through profit or loss' - 58,663
Foreign - 'at fair value through profit or loss' 39,949 201,043
39,949 259,706
Gain / loss on restructuring of exposure of Zarai Taraqiati
Bank Limited and House Building Finance Company Limited 41.1 3,311,793 -
Gain / (loss) on remeasurement of securities classified
as 'fair value through profit or loss' (4,930,365) 559,888
Sales of prize bond to Government of Pakistan 6,306
Others 110,996 101,629
574,355 2,756,112
41.1 Gain / loss on restructuring of exposure of Zarai Taraqiati Bank
Limited (ZTBL) and House Building Finance Company Limited (HBFCL)
ZTBL:
- Fair value loss on recognition of preference shares (1,634,847) -
- Reversal of previously suspended mark-up on issuance
of equity shares to the Bank 10,199,622 -
- Reversal of provision of loans and advances on issuance of
preference shares 16.4 3,204,323 -
11,769,098 -
HBFCL:
- Loss arising on conversion of loans into ordinary shares (9,834,996) -
- Share of loss payable under profit and loss sharing arrangements written back 1,377,691 -
(8,457,305) -
3,311,793 -
42. OTHER INCOME - NET
Gain on disposal of property, plant and equipment 14,340 3,893
Liabilities and provisions written back - net 11,780 12,327
Grant income under foreign assistance program 9,064 11,808
Others 266,865 132,932
302,049 160,960
43. COST OF PREPARATION OF BANK NOTES AND PRINTING CHARGES
44. AGENCY COMMISSION
-----------(Rupees in '000)---------
Agency commission is mainly payable to National Bank of Pakistan (NBP) under an agreement for providing banking services to
Federal and Provincial Governments as an agent of the Bank. Furthermore, a small portion of the agency commission also pertains to
Bank of Punjab (BOP), which was appointed as agent of the Bank, during last year, to collect Government of Punjab’s taxes and
receipts.
This includes bank notes printing charges paid to Pakistan Security Printing Corporation (Private) Limited - PSPC until June 13, 2017
at agreed rates under specific arrangements. PSPC became part of the group consequent to its acquisition by the Bank effective June
14, 2017.
Consolidated Financial Statements of SBP and its Subsidiaries
115

Note 2017 2016
45. GENERAL ADMINISTRATIVE AND OTHER EXPENSES
Salaries and other benefits 9,379,672 9,751,687
Retirement benefits and employees' compensated absences 45.1 7,691,921 9,827,094
Rent and taxes 56,481 54,189
Insurance 49,958 34,017
Electricity, gas and water 399,577 368,646
Depreciation 19.1 2,273,363 1,498,186
Amortisation of intangible assets 20 3,231 3,111
Repairs and maintenance 647,007 638,414
Auditors' remuneration 45.2 14,337 12,397
Legal and professional 53,536 39,048
Fund managers / custodian expenses 475,909 495,428
Travelling expenses 543,492 449,223
Daily expenses 106,964 83,681
Fuel 43,876 47,597
Conveyance 24,647 25,017
Postages, telegram / telex and telephone 228,128 218,832
Training 122,700 102,813
Stationery 23,881 22,740
Remittance of treasure 132,636 92,744
Books and newspapers 37,289 29,693
Advertisement 48,554 43,068
Uniforms 36,345 29,936
Others 548,245 383,025
22,941,749 24,250,586
45.1 This includes an amount relating to defined contribution plan aggregating Rs. 238,396 million (2016: Rs. 169,553 million).
45.2 Auditors' remuneration
State Bank of Pakistan
Audit fee 3,000 3,000 6,000 2,610 2,610 5,220
Out of pocket expenses 500 500 1,000 415 415 830
3,500 3,500 7,000 3,025 3,025 6,050
SBP Banking Services Corporation
Audit fee 2,500 2,500 5,000 2,090 2,090 4,180
Out of pocket expenses 1,000 1,000 2,000 885 885 1,770
3,500 3,500 7,000 2,975 2,975 5,950
National Institute of Banking and Finance
Audit fee - 225 225 - 225 225
Out of pocket expenses - 63 63 - 172 172
- 288 288 - 397 397
Pakistan Security Printing Corporation
Audit fee - 49 49 - - -
Out of pocket expenses - - - - - -
- 49 49 - 397 -
7,000 7,337 14,337 6,000 6,794 12,397
45.3 Staff retirement benefits-unfunded (State Bank of Pakistan and SBP Banking Services Corporation)
45.3.1
2017
- Discount rate for year end obligation 7.75% p.a. 7.25% p.a.
- Salary increase rate (where applicable) 8.75% p.a. 8.25% p.a.
- Pension indexation rate (where applicable) 6.25% p.a. 4.75% p.a.
- Medical cost increase rate 7.75% p.a. 6.25% -7.25% p.a
- Petrol price increase rate (where applicable) 8.75% p.a. 8.25% p.a.
- Personnel turnover
SBP 4.8% p.a. 18.1% p.a
SBP-BSC 9.2% p.a. 11.50% p.a
- Normal retirement age 60 Years 60 Years
State Bank of Pakistan Annual Report FY17
Assumptions regarding future mortality are based on actuarial advice in accordance with published statistics and experience in
Pakistan. The rates assumed are based on the adjusted SLIC 2001 - 2005 mortality tables with 1 year setback.
-----------(Rupees in '000)---------
During the year the actuarial valuations of the defined benefit obligations were carried out under the Projected Unit Credit Method
using following significant assumptions:
Total A. F. Ferguson
& Co.
EY Ford
RhodesTotal
EY Ford
Rhodes
A. F. Ferguson
& Co.
2016
-------------------------------------------------- (Rupees in '000) --------------------------------------------------
2017 2016
116
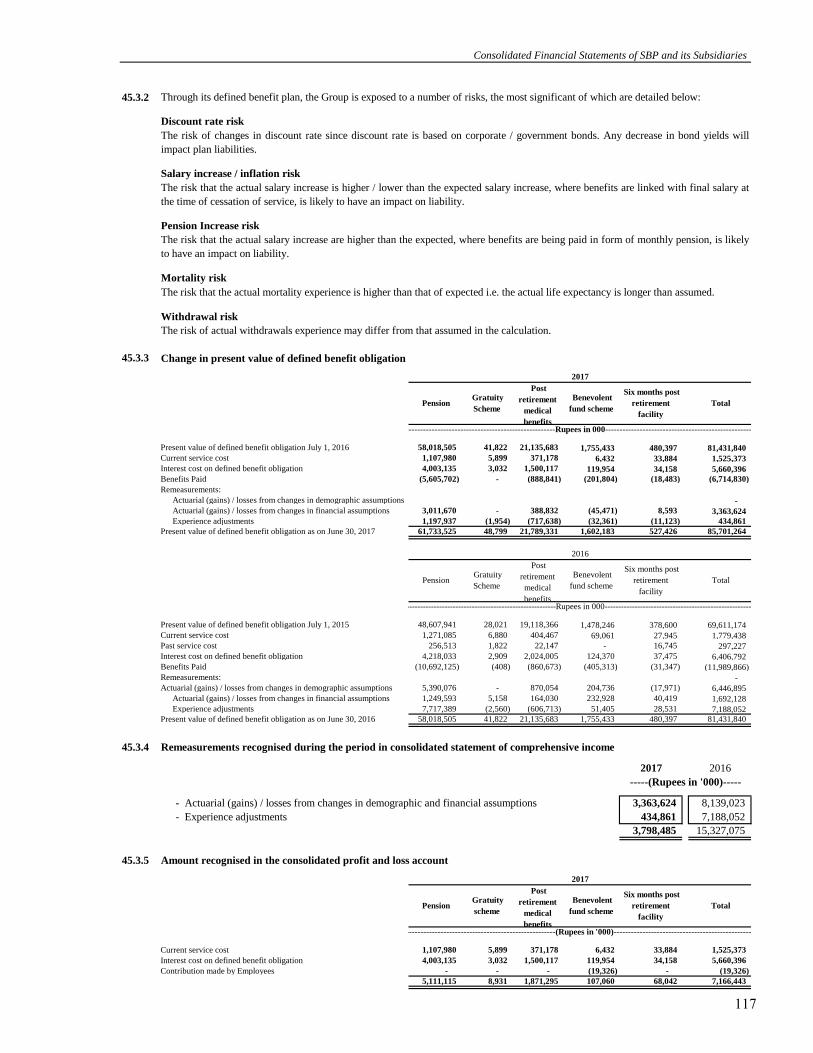
45.3.2
Discount rate risk
Salary increase / inflation risk
Pension Increase risk
Mortality risk
The risk that the actual mortality experience is higher than that of expected i.e. the actual life expectancy is longer than assumed.
Withdrawal risk
The risk of actual withdrawals experience may differ from that assumed in the calculation.
45.3.3 Change in present value of defined benefit obligation
Present value of defined benefit obligation July 1, 2016 58,018,505 41,822 21,135,683 1,755,433 480,397 81,431,840
Current service cost 1,107,980 5,899 371,178 6,432 33,884 1,525,373
Interest cost on defined benefit obligation 4,003,135 3,032 1,500,117 119,954 34,158 5,660,396
Benefits Paid (5,605,702) - (888,841) (201,804) (18,483) (6,714,830)
Remeasurements:
Actuarial (gains) / losses from changes in demographic assumptions -
Actuarial (gains) / losses from changes in financial assumptions 3,011,670 - 388,832 (45,471) 8,593 3,363,624
Experience adjustments 1,197,937 (1,954) (717,638) (32,361) (11,123) 434,861
Present value of defined benefit obligation as on June 30, 2017 61,733,525 48,799 21,789,331 1,602,183 527,426 85,701,264
Present value of defined benefit obligation July 1, 2015 48,607,941 28,021 19,118,366 1,478,246 378,600 69,611,174
Current service cost 1,271,085 6,880 404,467 69,061 27,945 1,779,438
Past service cost 256,513 1,822 22,147 - 16,745 297,227
Interest cost on defined benefit obligation 4,218,033 2,909 2,024,005 124,370 37,475 6,406,792
Benefits Paid (10,692,125) (408) (860,673) (405,313) (31,347) (11,989,866)
Remeasurements: -
Actuarial (gains) / losses from changes in demographic assumptions 5,390,076 - 870,054 204,736 (17,971) 6,446,895
Actuarial (gains) / losses from changes in financial assumptions 1,249,593 5,158 164,030 232,928 40,419 1,692,128
Experience adjustments 7,717,389 (2,560) (606,713) 51,405 28,531 7,188,052
Present value of defined benefit obligation as on June 30, 2016 58,018,505 41,822 21,135,683 1,755,433 480,397 81,431,840
45.3.4 Remeasurements recognised during the period in consolidated statement of comprehensive income
2017 2016
- Actuarial (gains) / losses from changes in demographic and financial assumptions 3,363,624 8,139,023
- Experience adjustments 434,861 7,188,052
3,798,485 15,327,075
45.3.5 Amount recognised in the consolidated profit and loss account
Current service cost 1,107,980 5,899 371,178 6,432 33,884 1,525,373
Interest cost on defined benefit obligation 4,003,135 3,032 1,500,117 119,954 34,158 5,660,396
Contribution made by Employees - - - (19,326) - (19,326)
5,111,115 8,931 1,871,295 107,060 68,042 7,166,443
Consolidated Financial Statements of SBP and its Subsidiaries
-----(Rupees in '000)-----
2016
Gratuity
Scheme
Six months post
retirement
facility
Pension
------------------------------------------------------------------Rupees in 000------------------------------------------------------------------
Post
retirement
medical
benefits
Benevolent
fund scheme
Through its defined benefit plan, the Group is exposed to a number of risks, the most significant of which are detailed below:
Pension Gratuity
Scheme
Post
retirement
medical
benefits
Benevolent
fund scheme
Six months post
retirement
facility
Total
2017
The risk of changes in discount rate since discount rate is based on corporate / government bonds. Any decrease in bond yields will
impact plan liabilities.
The risk that the actual salary increase is higher / lower than the expected salary increase, where benefits are linked with final salary at
the time of cessation of service, is likely to have an impact on liability.
The risk that the actual salary increase are higher than the expected, where benefits are being paid in form of monthly pension, is likely
to have an impact on liability.
------------------------------------------------------------------Rupees in 000------------------------------------------------------------------
Total
Pension Gratuity
scheme
Post
retirement
medical
benefits
Benevolent
fund scheme
Six months post
retirement
facility
Total
-------------------------------------------------------------(Rupees in '000)----------------------------------------------------------
2017
117

Current service cost 1,271,085 6,880 404,467 69,061 27,945 1,779,438
Past service cost 256,513 1,822 22,147 - 16,745 297,227
Interest cost on defined benefit obligation 4,218,033 2,909 2,024,005 124,370 37,475 6,406,792
Contribution made by Employees - - - (12,184) - (12,184)
5,745,631 11,611 2,450,619 181,247 82,165 8,471,273
45.3.6 Movement of present value of defined benefit obligation
Net recognised liabilities at July 1, 2016 58,018,505 41,822 21,135,683 1,755,433 480,397 81,431,840
Amount recognised in the consolidated profit and loss account 5,111,115 8,931 1,871,295 107,060 68,042 7,166,443
Remeasurements 4,209,607 (1,954) (328,806) (77,832) (2,530) 3,798,485
Benefits paid during the year (5,605,702) - (888,841) (201,804) (18,483) (6,714,830)
Employees contribution / amount transferred - - - 19,326 - 19,326
Net recognised liabilities at June 30, 2017 61,733,525 48,799 21,789,331 1,602,183 527,426 85,701,264
Net recognised liabilities at July 1, 2015 48,607,941 28,021 19,118,366 1,478,246 378,600 69,611,174
Amount recognised in the consolidated profit and loss account 5,745,631 11,611 2,450,619 181,247 82,165 8,471,273
Remeasurements 14,357,058 2,598 427,371 489,069 50,979 15,327,075
Benefits paid during the year (10,692,125) (408) (860,673) (405,313) (31,347) (11,989,866)
Employees contribution / amount transferred - - - 12,184 - 12,184
Net recognised liabilities at June 30, 2016 58,018,505 41,822 21,135,683 1,755,433 480,397 81,431,840
45.3.7 The sensitivity of the defined benefit obligation to changes in the weighted principal assumptions is:
Pension
Discount rate 1% (4,482,955) 5,300,468
Salary increase rate 1% 1,362,038 (1,284,489)
Pension increase rate 1% 3,931,550 (3,345,546)
Expected mortality rates 1 Year (127,573) 177,650
Gratuity
Discount rate 1% (6,197) 7,384
Salary increase rate 1% 7,244 (6,197)
Post retirement medical benefit
Discount rate 1% (2,938,449) 3,755,316
Salary increase 1% 2,710,088 (2,141,140)
Post-Retirement medical cost increase rate 1% 1,155,532 (929,300)
Expected mortality rates 1 Year 135,888 (130,252)
Benevolent
Discount rate 1% (82,813) 94,022
Six months post retirement benefit
Discount rate 1% (42,697) 48,990
Salary / Petrol price increase rate 1% 48,969 (43,519)
Pension Gratuity
Scheme
Pension Gratuity
Scheme
Post
retirement
medical
benefits
-------------------------------------------------------------(Rupees in '000)----------------------------------------------------------
Post
retirement
medical
benefits
Benevolent
fund scheme
Six months post
retirement
facility
Total
Total
Total
Benevolent
fund scheme
Six months post
retirement
facility
Six months post
retirement
facility
-------------------------------------------------------------(Rupees in '000)----------------------------------------------------------
2016
2017
-------------------------------------------------------------(Rupees in '000)----------------------------------------------------------
Pension Gratuity
Scheme
Post
retirement
medical
benefits
Benevolent
fund scheme
2016
Decrease in
assumption
(Rupees in '000)
State Bank of Pakistan Annual Report FY17
The above sensitivity analysis are based on a change in an assumption while holding all other assumptions constant. When calculating
the sensitivity of the defined benefit obligation to significant actuarial assumptions, the same method (present value of the defined
benefit obligation calculated with the projected unit credit method at the end of the reporting period) has been applied as when
calculating the liability of all schemes recognised within the balance sheet.
Impact on defined benefit obligation - Increase /
(Decrease)
Change in
Assumption
Increase in
assumption
118

45.3.8 Duration of defined benefit obligation
The weighted average duration of the defined benefit obligation is 8 Years 6-14 Years 14-16 Years 5-7 Years 5-9.66 Years
45.3.9 Estimated expenses to be charged to consolidated profit and loss account for the year ending June 30, 2018
Current service cost 1,041,589 6,624 480,431 6,287 36,937 1,571,868
Interest cost on defined benefit obligation 4,784,348 3,782 1,688,673 124,170 40,876 6,641,849
Amount chargeable to the consolidated profit
and loss account 5,825,937 10,406 2,169,104 130,457 77,813 8,213,717
45.4 Funded Staff Retirement Benefits - PSPC
45.4.1
2017
- Discount rate 9.00% p.a
- Expected rate of increase in salaries 9.00% p.a
- Expected rate of increase in monthly pension 5.00% p.a
- Pre-Retirement Mortality SLIC 2001-2005
- Post-Retirement Mortality SLIC 2001-2005
45.4.2 Through its defined benefit plan, the Group is exposed to a number of risks, the most significant of which are detailed below:
Investment risks
Longevity risks
Salary increase risk
The risk arises when the actual increases are higher than expectation and impacts the liability accordingly.
Withdrawal risk
2017
The amounts recognised in the consolidated balance sheet are determined as follows: Rupees in 000
Present value of defined benefit obligations 4,957,302
Fair value of plan assets (1,811,035)
3,146,267
Consolidated Financial Statements of SBP and its Subsidiaries
During the year, the actuarial valuations of the defined benefit obligations were carried out under the Projected Unit Credit Method
using the following significant assumptions:
The risk arises when the actual performance of the investments is lower than expectation thus creating a shortfall in the funding
objectives.
The risk arises when the actual lifetime of retirees is longer than expectation. This risk is measured at the plan level over the entire
retiree population.
The risk of actual withdrawals varying with the actuarial assumptions can impose a risk to the benefit obligation. The movement of the
liability can go either way.
PensionGratuity
Scheme
Six months post
retirement
facility
Based on the actuarial advice, the management estimates that charge in respect of defined benefit plans for the year ending June 30,
2018 would be as follows:
------------------------------------------------------------------Rupees in 000'------------------------------------------------------------------
TotalPensionGratuity
Scheme
Post
retirement
medical
benefits
Benevolent
fund scheme
Six months post
retirement
facility
Post
retirement
medical
benefits
Benevolent fund
scheme
119

45.4.3 The movement in the defined benefit obligation and fair value of plan assets over the period is as follows:
At June 14 4,921,040 1,801,768 3,119,272
Current service cost 2,666 - 2,666
Interest expense / (income) - net 23,069 8,980 14,089
4,946,775 1,810,748 3,136,027
Remeasurements (gain) / loss 10,527 287 10,240
10,527 287 10,240
At June 30 4,957,302 1,811,035 3,146,267
45.4.4 Plan assets consist of the following: Rupees in 000 Percentage
Equity instruments 721,954 30.22%
Debt instruments 679101 28.42%
Cash and cash equivalent 988,115 41.36%
2,389,170 100%
Less: Pertaining to NSPC (being the multi employer fund) 578,135
1,811,035
2017
45.4.5 Amount recognised in the consolidated profit and loss account Rupees in 000
Current service cost 2,666
Net interest cost on defined benefit obligation 14,089
16,755
45.4.6 Amount recognised in consolidated other comprehensive income
Remeasurement gain / loss on obligation
Actuarial gains / (losses) from changes in financial assumptions (10,527)
(10,527)
Remeasurement gain / (loss) on plan assets
Actual net return on plan assets 287
(10,240)
45.4.7 The sensitivity of the defined benefit obligation to changes in the weighted principal assumptions is:
Approved pension scheme
Discount rate 1% (675,557) 881,966
Salary growth rate 1% 277,068 (203,017)
Pension indexation rate 1% 26,438 27,355
45.4.8 Duration of defined benefit obligation Pension
The weighted average duration of the defined benefit obligation is 11.86 Years
Change in
Assumption
Increase in
assumption
Decrease in
assumption
Impact on defined benefit obligation -
Increase / (Decrease)
2017
The above sensitivity analysis are based on a change in an assumption while holding all other assumptions constant. When calculating
the sensitivity of the defined benefit obligation to significant actuarial assumptions the same method (present value of the defined
benefit obligation calculated with the projected unit credit method at the end of the reporting period) has been applied as when
calculating the liability of all schemes recognised within the consolidated balance sheet.
Present
value of
obligation
Fair value of
plan assetsNet
2017
----------------(Rupees in '000)----------------
(Rupees in '000)
State Bank of Pakistan Annual Report FY17
120

45.4.9 Estimated expenses to be charged to consolidated profit and loss account for the year ending June 30, 2018
Pension
Rupees in 000'
Current service cost 285,669
Interest cost on defined benefit obligation 57,363
Amount chargeable to the consolidated profit and loss account 343,032
45.4.10 Employees' compensated absences
Note 2017 2016
46. TAXATION -----------(Rupees in '000)---------
Current - for the period 4,602 -
4,602 -
Deferred 812 -
5,414 -
46.1 This represent taxation charge on the profits of PSPC from the date of its acquisition till June 30, 2017.
47. PROFIT FOR THE YEAR AFTER NON-CASH AND OTHER ITEMS
Profit for the year 238,069,011 229,353,126
Adjustments for:
Depreciation 19 2,273,363 1,498,186
Amortisation of intangible assets 20 3,231 3,111
Provision / (reversal) for / write-off:
- retirement benefits and employees' compensated absences 45 7,691,921 9,827,094
- loans and advances (6,139) (756)
- claims - (232)
- other doubtful assets 16,842 (86,213)
Gain on restructuring of exposure of Zarai Taraqiati -
Bank Limited (ZTBL) and House Building Finance Company Limited (HBFCL) 41.1 (3,311,793)
Gain on disposal of property, plant and equipment (14,340) (3,893)
Share of Profir from associate (26,196) -
Dividend income (12,248,843) (12,226,343)
Effect of exchange gain on cash and cash equivalents 1,687,144 45,545,964
234,134,201 273,910,044
48. CASH AND CASH EQUIVALENTS
Cash and bank balances 6 2,190,657 -
Local currency 8 861,860 488,198
Foreign currency accounts and investments 9 1,444,739,189 1,737,853,644
Earmarked foreign currency balances 10 10,319,532 5,147,596
Special Drawing Rights of the IMF 11 63,657,319 67,656,236
1,521,768,557 1,811,145,674
Based on the actuarial advice, the management estimates that charge in respect of defined benefit plans for the year ending June 30,
2018 would be as follows:
The Group's liability for employees' compensated absences determined through an actuarial valuation carried out under the Projected
Unit Credit Method amounted to Rs. 7,098.384 million (2016: Rs. 7,475.81 million). An amount of Rs. 281.365 million (2016: Rs.
1,217.59 million) has been charged to the consolidated profit and loss account in the current period based on the actuarial advice.
Expected charge in respect of the scheme for the year ending June 30, 2018 would be Rs 950.287 million. The benefits paid during the
year amounted to Rs 658.791 million (2016: Rs 1645.64 million). In case of 1% increase / decrease in discount rate the net charge for
the year would decrease / increase by Rs. 383.3 million and Rs. 437.101 million respectively and the net liability would also be
affected by the same amount. In case of 1% increase / decrease in salary rate the net charge for the year would increase / decrease by
452.505 million and Rs. 405.464 million respectively and the net liability would also be affected by the same amount.
Consolidated Financial Statements of SBP and its Subsidiaries
121

49. RELATED PARTY TRANSACTIONS
49.1 Governments and related entities
2017 2016
Transactions during the year
- Creation of MRTBs 6,250,800,000 4,294,300,000
- Retirement / rollover of MRTBs 5,799,530,000 4,558,055,859
- Investment purchased / matured and re-invested 11,471 (30,204)
- Outstanding foreign currency swap contracts 89,778,296 183,961,130
-
49.2 Remuneration to key management personnel
2017 2016
Short-term employee benefit 453,614 341,346
Post-employment benefit 56,169 105,272
Loans disbursed during the year 60,458 173,047
Loans repaid during the year 77,397 92,324
Directors' fees 13,584 12,181
Number of key management personnel 37 32
50. RISK MANAGEMENT POLICIES
50.1 Credit risk management
State Bank of Pakistan Annual Report FY17
The Group enters into transactions with related parties in its normal course of business. Related parties include the Federal Government
as major shareholder of the Group, Provincial Governments, Government of Azad Jammu and Kashmir, Gilgit-Baltistan
Administration Authority, Government controlled enterprises / entities, retirement benefit plans, directors and key management
personnel of the Group.
The Group is primarily subject to interest / mark-up rate, credit, currency and liquidity risks. The policies and procedures for managing
these risks are outlined in notes 50.1 to 50.10 to these consolidated financial statements. The Group has designed and implemented a
framework of controls to identify, monitor and manage these risks. The senior management is responsible for advising the Governor on
the monitoring and management of these risks.
Credit risk is the risk that one party to a financial instrument will fail to discharge an obligation and cause the other party to incur a
financial loss. Credit risk in the Group's portfolio is monitored, reviewed and analysed by the appropriate officials and the exposure is
controlled through counterparty and credit limits. Counterparties are allocated to a particular class based mainly on their credit rating.
Foreign currency placements are made in approved currencies and government securities. Loans and advances to scheduled Banks and
financial institutions are usually secured either by Government guarantees or by demand promissory notes. Equity exposures based on
their nature are not exposed to credit risk. Geographical exposures are controlled by country limits and are updated as and when
necessary with all limits formally reviewed on a periodic basis. The Group's exposure to credit risk associated with foreign investments
is managed by monitoring compliance with investment limits for counterparties. The Group's credit risk mainly lies with exposure
towards government sector and financial institutions.
Key management personnel of the Group include members of the Board of Directors of the Bank, Governor of the Bank, Deputy
Governors of the Bank and other executives of the Group who have responsibility for planning, directing and controlling the activities
of the Group. Fee of the non-executive members of the Board of Directors is determined by the Board. According to section 10 of the
State Bank of Pakistan Act, 1956, the remuneration of the Governor is determined by the President of Pakistan. Deputy Governors are
appointed and their salaries are fixed by the Federal Government. Details of remuneration of key management personnel of the Group
are as follows:
-----------(Rupees in '000)---------
The Group is acting as an agent of the Federal Government and is responsible for functions conferred upon as disclosed in note 1 to
these consolidated financial statements. Balances outstanding from and transaction with the Federal and Provincial Governments and
related entities not disclosed elsewhere in the consolidated financial statements are given below:
Commission income from sale of Market Treasury Bills, issuance of prize bonds, national saving certificates and management of
public debt (refer note 38).
-----------(Rupees in '000)---------
Short-term benefits include salary and benefits, medical benefits and free use of Group maintained cars in accordance with their
entitlements. Post employment benefits include gratuity, pension, benevolent fund, post retirement medical benefits, six months post
retirement facility and contributory provident fund.
122

50.2 Concentrations of risk
50.2.1 Geographical analysis
Financial assets `
Cash and bank balances held by a subsidiary 2,190,657 - - - - - 2,190,657
Local currency - coins 861,860 - - - - - 861,860
Foreign currency accounts and investments 23,961,146 453,088,974 652,637,412 560,768,972 48,496,151 43,586,533 1,782,539,188
Earmarked foreign currency balances 10,319,532 - - - - - 10,319,532
Special Drawing Rights of the International Monetary Fund - - 63,657,319 - - - 63,657,319
Reserve tranche with the International Monetary
Fund under quota arrangements - - 17,382 - - - 17,382
Securities purchased under agreement to resell 1,533,373,313 - - - - - 1,533,373,313
Current accounts of Governments 7,279,247 - - - - - 7,279,247
Investments - local 2,694,286,076 - - - - - 2,694,286,076
Loans, advances and bills of exchange 362,286,041 417,749 - - - - 362,703,790
Assets held with the Reserve Bank of India - 1,384,376 - - - - 1,384,376
Balances due from the Governments of India and
Bangladesh (former East Pakistan) - 9,917,256 - - - - 9,917,256
Other assets 2,677,144 743,347 117,504 559,715 2,307 - 4,100,017
Total financial assets 4,637,235,016 465,551,702 716,429,617 561,328,687 48,498,458 43,586,533 6,472,630,013
Financial assets
Local currency - coins 488,198 - - - - 488,198
Foreign currency accounts and investments 19,082,343 490,232,443 841,281,192 534,829,640 91,658,752 1,977,084,370
Earmarked foreign currency balances 5,147,596 - - - - 5,147,596
Special Drawing Rights of the International Monetary Fund - - 67,656,236 - - 67,656,236
Reserve tranche with the International Monetary
Fund under quota arrangements - - 17,455 - - 17,455
Securities purchased under agreement to resell 1,533,574,159 - - - - 1,533,574,159
Current accounts of Governments 955,474 - - - - 955,474
Investments - local 2,147,418,594 - - - - 2,147,418,594
Loans, advances and bills of exchange 350,147,931 423,249 - - - 350,571,180
Assets held with the Reserve Bank of India - 1,362,034 - - - 1,362,034
Balances due from the Governments of India and
Bangladesh (former East Pakistan) - 9,214,881 - - - 9,214,881
Other assets 2,616,622 1,050,258 25,909 301,694 36,508 4,030,991
Total financial assets 4,059,430,917 502,282,865 908,980,792 535,131,334 91,695,260 6,097,521,168
Consolidated Financial Statements of SBP and its Subsidiaries
America Europe Australia Others Grand Total
Australia
---------------------------------------------------------------------------- (Rupees in '000) ----------------------------------------------------------------------------
2016
Asia (other
than
Pakistan)
America EuropePakistan
2017
---------------------------------------------------------------------------- (Rupees in '000) ----------------------------------------------------------------------------
Concentration risk arises when a number of counterparties are engaged in similar business activities or have similar economic features
that would cause their ability to meet contractual obligations to be similarly effected by changes in economic, political or other
conditions. The Group's significant concentrations arising from financial instruments at the balance sheet date without taking any
collateral held or other credit enhancements is shown below:
Grand Total
The geographical analyses is based on composition of financial assets in the specific continents other than for Pakistan which has been disclosed separately. All continents
having significant composition have been presented separately while the remaining have been clubbed under "Others".
Asia (other
than
Pakistan)
Pakistan
123

50.2.2 Industrial analysis
Financial assets
Cash and bank balances held by a subsidiary 6,496 - - 2,184,161 - 2,190,657
Local currency - coins 861,860 - - - - 861,860
Foreign currency accounts and investments 831,724,378 213,375,369 2,494,010 718,737,738 16,207,693 1,782,539,188
Earmarked foreign currency balances 10,319,532 - - - - 10,319,532
Special Drawing Rights of the International Monetary Fund
Monetary Fund - 63,657,319 - - - 63,657,319
Reserve tranche with the International Monetary
Fund under quota arrangements - 17,382 - - - 17,382
Securities purchased under agreement to resell - - - 1,533,373,313 - 1,533,373,313
Current accounts of Governments 7,279,247 - - - - 7,279,247
Investments - local 2,522,321,316 - 160,249,170 11,715,590 - 2,694,286,076
Loans, advances and bills of exchange 13,340,783 - 32,990,934 296,890,086 19,481,987 362,703,790
Assets held with the Reserve Bank of India 1,384,376 - - - - 1,384,376
Balances due from the Governments of India and
Bangladesh (former East Pakistan) 9,917,256 - - - - 9,917,256
Other assets 1,844,622 252,614 267,856 1,222,763 512,162 4,100,017
Total financial assets 3,398,999,866 277,302,684 196,001,970 2,564,123,651 36,201,842 6,472,630,013
Financial assets
Local currency - coins 488,198 - - - - 488,198
Foreign currency accounts and investments 936,159,121 178,478,743 1,087,680 848,890,453 12,468,373 1,977,084,370
Earmarked foreign currency balances 5,147,596 - - - - 5,147,596
Special Drawing Rights of the International Monetary Fund
Monetary Fund - 67,656,236 - - - 67,656,236
Reserve tranche with the International Monetary
Fund under quota arrangements - 17,455 - - - 17,455
Securities purchased under agreement to resell - - - 1,533,574,159 - 1,533,574,159
Current accounts of Governments 955,474 - - - - 955,474
Investments - local 2,050,957,242 - - 96,461,352 - 2,147,418,594
Loans, advances and bills of exchange 423,249 - 98,119,245 231,360,884 20,667,802 350,571,180
Assets held with the Reserve Bank of India 1,362,034 - - - - 1,362,034
Balances due from the Governments of India and - - - - -
Bangladesh (former East Pakistan) 9,214,881 - - - - 9,214,881
Other assets 1,237,025 111,047 - 1,896,310 786,609 4,030,991
Total financial assets 3,005,456,622 246,263,481 99,206,925 2,712,183,158 33,922,784 6,097,521,168
---------------------------------------------------------------------------- (Rupees in '000) ----------------------------------------------------------------------------
2017
---------------------------------------------------------------------------- (Rupees in '000) ----------------------------------------------------------------------------
Others Grand Total
Grand
Total
Sovereign SupranationalPublic Sector
Entities
State Bank of Pakistan Annual Report FY17
Banks &
Financial
Institutions
Sovereign SupranationalPublic Sector
Entities
Banks &
Financial
Institutions
Others
2016
124

50.3 Credit exposure by credit rating
Sovereign
(50.3.1) AAA AA A BBB
Lower than
BBBUnrated Grand Total
Financial assets
Cash and bank balances held by a subsidiary - - - 2,184,161 - - 6,496 2,190,657
Local currency - coins 861,860 - - - - - - 861,860
Foreign currency accounts and investments 2,818,137 327,909,180 790,607,846 646,085,502 12,836,602 - 2,281,921 1,782,539,188
Earmarked foreign currency balances 10,319,532 - - - - - - 10,319,532
Special Drawing Rights of the International
Monetary Fund - - - - - - 63,657,319 63,657,319
Reserve tranche with the International Monetary
Fund under quota arrangements - - - - - - 17,382 17,382
Securities purchased under agreement to resell - - - 1,532,117,992 - 1,255,321 - 1,533,373,313
Current accounts of Governments 7,279,247 - - - - - - 7,279,247
Investments - local 2,576,481,664 - - 6,207,070 - - 1,609,250 2,584,297,984
Loans, advances and bills of exchange 13,340,783 106,832,276 204,791,850 17,816,145 - 23,000 19,899,736 362,703,790
Assets held with the Reserve Bank of India - - - - 1,384,376 - - 1,384,376
Balances due from the Governments of India
and Bangladesh (former East Pakistan) - - - - 40,453 9,876,803 - 9,917,256
Other assets 1,844,622 280,764 224,919 889,481 21,250 - 838,981 4,100,017
Total financial assets 2,612,945,845 435,022,220 995,624,615 2,205,300,351 14,282,681 11,155,124 88,311,085 6,362,641,921
Sovereign
(50.3.1)
AAA AA A BBB Lower than
BBB
Unrated Grand Total
Financial assets
Local currency - coins 488,198 - - - - - - 488,198
Foreign currency accounts and investments - 340,043,611 950,304,290 655,800,370 11,179,378 19,075,404 681,317 1,977,084,370
Earmarked foreign currency balances 5,147,596 - - - - - - 5,147,596
Special Drawing Rights of the International
Monetary Fund - - - - - - 67,656,236 67,656,236
Reserve tranche with the International Monetary
Fund under quota arrangements - - - - - - 17,455 17,455
Securities purchased under agreement to resell - - - 1,532,762,001 - 812,158 - 1,533,574,159
Current accounts of Governments 955,474 - - - - - - 955,474
Investments - local 2,050,957,242 - - - - - - 2,050,957,242
Loans, advances and bills of exchange 75,846,587 81,063,739 146,636,085 24,650,228 955,253 40,489 21,378,799 350,571,180
Assets held with the Reserve Bank of India - - - - 1,362,034 - - 1,362,034
Balances due from the Governments of India
and Bangladesh (former East Pakistan) - - - - 40,453 9,174,428 - 9,214,881
Other assets 1,766,876 421,338 487,247 1,093,113 - - 262,383 4,030,957
Total financial assets 2,135,161,973 421,528,688 1,097,427,622 2,214,305,712 13,537,118 29,102,479 89,996,190 6,001,059,782
50.3.1
50.3.2 The collateral held as security against financial assets to cover the credit risk are disclosed in the respective notes.
50.4 Details of financial assets impaired and provision recorded there against:
2017 2016 2017 2016
-----------------------------(Rupees in '000)-------------------------
Available for sale investment - unlisted 2,431,758 2,431,758 856,863 856,863
Loans and advances - agriculture sector 18,587 18,587 18,587 18,587
Loans and advances - industrial sector 1,054,285 1,054,285 1,054,285 1,054,285
Loans and advances - others 15,128,995 15,128,995 4,275,563 4,275,563
Assets held with the Reserve Bank of India 1,384,376 1,362,034 1,384,376 1,362,034
Balances due from the Governments of India and Bangladesh [(former East Pakistan)
including loans recoverable from financial institutions operating in Bangladesh] 10,340,535 9,638,160 10,340,535 9,638,160
Gross Amount Impairment Provision
The credit quality of financial assets is managed by the Group using external credit ratings. The table below shows the credit quality by
class of assets for all financial assets that are neither past due nor impaired as at the reporting date and are exposed to credit risk, based on
the rating of external rating agencies. The Group uses lower of the credit rating of Moody's, Standard & Poor's and Fitch to categorise its
financial assets in foreign currency accounts and investments. For domestic financial assets, credit ratings of JCR-VIS and PACRA are
used.
2017
2016
---------------------------------------------------------------------------- (Rupees in '000) ----------------------------------------------------------------------------
---------------------------------------------------------------------------- (Rupees in '000) ----------------------------------------------------------------------------
Government securities and balances, pertaining to Pakistan are rated as sovereign. The international rating of Pakistan is B- (as per
Moodys).
Consolidated Financial Statements of SBP and its Subsidiaries
125

50.5 Liquidity analysis with interest / mark-up rate risk
50.5.1
Grand
Maturity Maturity Sub-total Maturity Maturity Sub-total Total
up to one after up to one after
year one year year one year
Financial assets
Non-derivatives assets:
Cash and bank balances held by a subsidiary 1,231,312 - 1,231,312 959,345 - 959,345 2,190,657
Local currency - coins - - - 861,860 - 861,860 861,860
Foreign currency accounts and investments 1,506,549,874 250,388,472 1,756,938,346 22,232,615 679,640 22,912,255 1,779,850,601
Earmarked foreign currency balances - - - 10,319,532 - 10,319,532 10,319,532
Special Drawing Rights of the International - - - -
Monetary Fund 63,657,319 - 63,657,319 - - - 63,657,319
Reserve tranche with the International Monetary - - - -
Fund under quota arrangements - - - 17,382 - 17,382 17,382
Securities purchased under agreement to resell 1,533,129,822 - 1,533,129,822 243,491 - 243,491 1,533,373,313
Current accounts of Governments* 7,575,105 - 7,575,105 (295,858) - (295,858) 7,279,247
Investments - local 2,475,250,955 56,900,348 2,532,151,303 151,935,151 10,199,622 162,134,773 2,694,286,076
Loans, advances and bills of exchange 244,351,283 83,664,077 328,015,360 18,150,023 16,538,407 34,688,430 362,703,790
Assets held with the Reserve Bank of India - - - 1,384,376 - 1,384,376 1,384,376
Balances due from the Governments of India
and Bangladesh (former East Pakistan) 9,056,879 - 9,056,879 860,377 - 860,377 9,917,256
Other assets - - - 3,593,850 1,091 3,594,941 3,594,941
5,840,802,549 390,952,897 6,231,755,446 210,262,144 27,418,760 237,680,904 6,469,436,350
Derivatives assets
Foreign currency accounts and investments - 44,081 44,081 2,644,506 - 2,644,506 2,688,587
Other assets - - - 505,076 - 505,076 505,076
- 44,081 44,081 3,149,582 - 3,149,582 3,193,663
Grand Total 5,840,802,549 390,996,978 6,231,799,527 213,411,726 27,418,760 240,830,486 6,472,630,013
Financial liabilities
Bank notes in circulation - - - 4,167,135,807 - 4,167,135,807 4,167,135,807
Bills payable - - - 630,547 - 630,547 630,547
Current accounts of the Government * 178,601,965 - 178,601,965 - - - 178,601,965
Payable to islamic banking institutions
against Bai Muajjal transactions 25,098,651 - 25,098,651 38,579 - 38,579 25,137,230
Payable under bilateral currency swaps agreements 154,669,000 - 154,669,000 881,410 - 881,410 155,550,410
Deposits of banks and financial institutions 96,686,622 - 96,686,622 572,650,917 - 572,650,917 669,337,539
Other deposits and accounts 85,599,474 - 85,599,474 79,065,600 - 79,065,600 164,665,074
Payable to International Monetary Fund 144,192,970 622,436,124 766,629,094 20,752,172 20,752,172 787,381,266
Other liabilities 5,160 11,674 16,834 31,344,852 - 31,344,852 31,361,686
684,853,842 622,447,798 1,307,301,640 4,872,499,884 - 4,872,499,884 6,179,801,524
Derivatives liabilities
Foreign currency accounts and investments - (103,955) (103,955) 906,473 3,102,311 4,008,784 3,904,829
684,853,842 622,343,843 1,307,197,685 4,873,406,357 3,102,311 4,876,508,668 6,183,706,353
On balance sheet gap (a) 5,155,948,707 (231,346,865) 4,924,601,842 (4,659,994,631) 24,316,449 (4,635,678,182) 288,923,660
Foreign currency forward and swap contracts - sale - - - (935,079,726) - (935,079,726) (935,079,726)
Foreign currency forward and swap contracts - purchase - - - 498,678,723 - 498,678,723 498,678,723
Futures - sale - - - (43,038,829) - (43,038,829) (43,038,829)
Futures - purchase - - - 35,430,566 - 35,430,566 35,430,566
Capital Commitment - - - (272,021) - (272,021) (272,021)
Off balance sheet gap - - - (444,281,287) - (444,281,287) (444,281,287)
Total yield / interest risk sensitivity gap 5,155,948,707 (231,346,865) 4,924,601,842 (4,215,713,344) 24,316,449 (4,191,396,895) 733,204,947
Cumulative yield / interest risk sensitivity gap 5,155,948,707 4,924,601,842 9,849,203,684 5,633,490,340 5,657,806,789 1,466,409,894 1,466,409,894
Contingent liabilities in respect of guarantees given - - - 3,382,264 20,608,998 23,991,262 23,991,262
(a) On-balance sheet gap represents the net amounts of on-balance sheet items.
*
---------------------------------------------------------------------------- (Rupees in '000) ----------------------------------------------------------------------------
The Group has the contractual right and intention to offset these balances against their respective non-interest bearing deposit balances. Mark-up on these balances is charged only when
these balances are in debit.
State Bank of Pakistan Annual Report FY17
Interest / mark-up rate risk is the risk that the value of a financial instrument will fluctuate due to changes in the market interest / mark-
up rates. The Group has adopted appropriate policies to minimise its exposure to this risk.
2017
Interest / mark-up bearing Non interest / mark-up bearing
126

Grand
Maturity Maturity Sub-total Maturity Maturity Sub-total Total
up to one after up to one after
year one year year one year
Financial assets
Non-derivatives assets:
Local currency - coins - - - 488,198 - 488,198 488,198
Foreign currency accounts and investments 1,623,513,653 348,154,813 1,971,668,466 8,639,389 681,344 9,320,733 1,980,989,199
Earmarked foreign currency balance - - - 5,147,596 - 5,147,596 5,147,596
Special Drawing Rights of International - - - -
Monetary Fund 67,656,236 - 67,656,236 - - - 67,656,236
Reserve tranche with the International Monetary - - - - -
Fund under quota arrangements - - - 17,455 - 17,455 17,455
Securities purchased under agreement to resell 1,533,280,018 - 1,533,280,018 294,141 - 294,141 1,533,574,159
Current accounts of Governments 2,955,474 - 2,955,474 (2,000,000) - (2,000,000) 955,474
Investments - local 2,017,734,979 2,740,000 2,020,474,979 126,943,615 - 126,943,615 2,147,418,594
Loans, advances and bills of exchange 297,930,617 30,364,651 328,295,268 4,433,931 17,841,981 22,275,912 350,571,180
Assets held with the Reserve Bank of India - - - 1,362,034 - 1,362,034 1,362,034
Balances due from the Governments of India
and Bangladesh (former East Pakistan) 8,354,504 - 8,354,504 860,377 - 860,377 9,214,881
Other assets - - - 2,586,543 1,951 2,588,494 2,588,494
5,551,425,481 381,259,464 5,932,684,945 148,773,279 18,525,276 167,298,555 6,099,983,500
Derivatives assets
Other assets - - - 1,442,497 - 1,442,497 1,442,497
Grand Total 5,551,425,481 381,259,464 5,932,684,945 150,215,776 18,525,276 168,741,052 6,101,425,997
Financial liabilities
Bank notes issued - - - 3,554,922,057 - 3,554,922,057 3,554,922,057
Bills payable - - - 598,142 - 598,142 598,142
Current accounts of the Government * - - - 606,657,778 - 606,657,778 606,657,778
Payable to islamic banking institutions -
against Bai Muajjal transactions 44,068,109 - 44,068,109 884,829 - 884,829 44,952,938
Payable under bilateral currency swaps agreements 157,812,000 - 157,812,000 695,631 - 695,631 158,507,631
Deposits of banks and financial institutions - - - 391,760,469 - 391,760,469 391,760,469
Other deposits and accounts 87,730,857 - 87,730,857 73,822,141 - 73,822,141 161,552,998
Payable to International Monetary Fund 144,554,785 633,076,488 777,631,273 - 1,108,232 1,108,232 778,739,505
Other liabilities - - - 20,791,527 - 20,791,527 20,791,527
434,165,751 633,076,488 1,067,242,239 4,650,132,574 1,108,232 4,651,240,806 5,718,483,045
Derivatives liabilities
Foreign currency accounts and investments - (103,955) (103,955) 906,473 3,102,311 4,008,784 3,904,829
434,165,751 632,972,533 1,067,138,284 4,651,039,047 4,210,543 4,655,249,590 5,722,387,874
On balance sheet gap (a) 5,117,259,730 (251,713,069) 4,865,546,661 (4,500,823,271) 14,314,733 (4,486,508,538) 379,038,123
Foreign currency forward and swap contracts - sale - - - (802,656,331) - (802,656,331) (802,656,331)
Foreign currency forward and swap contracts - purchase - - - 595,499,305 - 595,499,305 595,499,305
Futures - sale - - - (18,044,108) - (18,044,108) (18,044,108)
Futures - purchase - - - 14,656,485 - 14,656,485 14,656,485
Capital Commitment - - - (935,886) - (935,886) (935,886)
Off balance sheet gap - - - (211,480,535) - (211,480,535) (211,480,535)
Total yield / interest risk sensitivity gap 5,117,259,730 (251,713,069) 4,865,546,661 (4,289,342,736) 14,314,733 (4,275,028,003) 590,518,658
Cumulative yield / interest risk sensitivity gap 5,117,259,730 4,865,546,661 9,731,093,322 5,441,750,586 5,456,065,319 1,181,037,317 1,181,037,317
Contingent liabilities in respect of guarantees given - - - 4,022,903 25,070,092 29,092,995 29,092,995
(a) On-balance sheet gap represents the net amounts of on-balance sheet items.
*
50.5.2
50.6 Interest rate risk
50.6.1 Cash flow interest rate risk
2016
Interest / mark-up bearing Non interest / mark-up bearing
Consolidated Financial Statements of SBP and its Subsidiaries
The Group does not keep a sizable portion of its foreign currency accounts and investments in floating rate securities, therefore the profit
/ loss attributable to the Group's exposure to interest rate on its variable rate instruments is negligible.
If interest rates had been 10 basis points higher/ lower and all other variables were held constant, the Group's profit for the year ended
June 30, 2017 would increase / decrease by Rs. 806.82 (2016: Rs. 566 million). This is mainly attributable to the Group's exposure to
interest rates on its variable rate instruments.
Cash flow interest rate risk is the risk of loss arising from changes in variable interest rates. The sensitivity analysis below have been
determined based on the exposure to interest rates for floating rate assets and liabilities, the analysis is prepared assuming the amount of
average assets and liabilities outstanding at the balance sheet date was outstanding for the whole year.
The Group has the contractual right and intention to offset these balances against their respective non-interest bearing deposit balances. Mark-up on these balances is charged only when
these balances are in debit.
---------------------------------------------------------------------------- (Rupees in '000) ----------------------------------------------------------------------------
The effective interest / mark-up rate for the monetary financial assets and liabilities are mentioned in their respective notes to the
consolidated financial statements.
127

50.6.2 Fair value interest rate risk
50.7 Currency risk management
2017 2016
US Dollar 1,072,083,483 1,270,462,855
Pound Sterling (62,074,847) (78,830,048)
Chinese Yuan (87,260,316) (3,698,119)
Euro (224,807,106) (268,904,801)
Japanese Yen (55,935,160) (48,103,822)
United Arab Emirates Dirham 1,625,688 6,190,362
Australian Dollar (139,679) (92,021)
Canadian Dollar (19,128) 22,191
Others 35,014,019 152,216
678,486,954 877,198,813
50.8 Price Risk
State Bank of Pakistan Annual Report FY17
The Group also enters into forward foreign exchange contracts with the commercial banks and financial institutions to hedge against
the currency risk on foreign currency transactions.
The composition of the Group's financial instruments and the correlation thereof to different variables is expected to change over time.
Accordingly, the sensitivity analyses in note 50.6 and 50.7 to these consolidated financial statements prepared as of June 30, 2017 are
not necessarily indicative of the effects on the Group's profit and loss of future movements in different variables.
Price risk is the risk that the fair value or future cash flows of a financial instrument will fluctuate because of changes in market prices
(other than those arising from interest rate risk or currency risk) whether those changes are caused by factors specific to the individual
financial instrument or its issuer or factors affecting all similar financial instruments traded in the market.
-----------(Rupees in '000)---------
Net exposure in Special Drawing Rights (SDR) is allocated to its five basket currencies i.e. the US dollar, the Euro, the Chinese
renminbi, the Japanese yen and the British pound sterling in the ratio of their percentage allocated by IMF for SDR basket.
The sensitivity analyses calculates the effect of reasonably possible movement of the currency rate against Pak Rupee, with all other
variables held constant, on the consolidated profit and loss account and equity. If the Rupee had weakened / strengthened 1 percent
against the principal currencies to which the Group had significant exposure as at June 30, 2017 with all other variables constant profit
for the year would have been Rs. 6,748.87 million higher / lower (2016: Rs. 8,771.99 million). Net foreign currency exposure of the
Group is as follows:
Fair value interest rate risk is the risk that the value of a financial instrument will fluctuate because of changes in market interest rates.
The Group is exposed to fair value interest rate risk on its fixed income securities classified as 'financial assets at fair value through
profit or loss'. To manage its fair value interest rate risk arising from investments in these securities, the management adopts practices
mentioned in note 50.10 to these consolidated financial statements.
As at June 30, 2017, a 10 basis points shift in market value, mainly as a result of change in interest rates with all other variables held
constant, would result in consolidated profit for the year to increase by Rs. 1,562.32 million (2016: Rs. 1,897.5 million) or decrease by
Rs. 1,565.47 million (2017: Rs. 1,918.47 million) mainly as a result of an increase or decrease in the fair value of fixed rate financial
assets classified as financial asset at fair value through profit or loss.
Currency risk is the risk that the value of a financial instrument will fluctuate due to changes in foreign exchange rates. Foreign
currency activities result mainly from the Group's holding of foreign currency assets under its foreign reserves management function
and the overall level of these assets is determined based on the prevailing extent of credit and liquidity risks. In order to avoid losses
arising from adverse changes in the rates of exchange, the Group's compliance with the limits established for foreign currency positions
is being regularly monitored by the management.
The Group also holds from time to time, foreign currency assets and liabilities that arise from the implementation of domestic monetary
policies. Any foreign currency exposure relating to these implementation activities are hedged through the use of foreign currency
forwards, swaps and other transactions.
128

50.9 Liquidity risk management
50.10 Portfolio risk management
51. Fair Value of Financial Instruments
2017 2016 2017 2016
Financial assets
Cash and bank balances held by a subsidiary 2,190,657 - 2,190,657 -
Local currency - coins 861,860 488,198 861,860 488,198
Foreign currency accounts and investments 1,782,539,188 1,977,084,370 1,782,539,188 1,977,084,370
Earmarked foreign currency balances 10,319,532 5,147,596 10,319,532 5,147,596
Special Drawing Rights of the International Monetary Fund 63,657,319 67,656,236 63,657,319 67,656,236
Reserve tranche with the International Monetary Fund
under quota arrangements 17,382 17,455 17,382 17,455
Securities purchased under agreement to resell 1,533,373,313 1,533,574,159 1,533,373,313 1,533,574,159
Current accounts of Governments 7,279,247 955,474 7,279,247 955,474
Investments - local 2,694,286,076 2,147,418,594 2,694,286,076 2,147,419,039
Loans, advances and bills of exchange 362,703,790 350,571,180 362,703,790 350,571,180
Assets held with the Reserve Bank of India 1,384,376 1,362,034 1,384,376 1,362,034
Balances due from the Governments of India and
Bangladesh (former East Pakistan) 9,917,256 9,214,881 9,917,256 9,214,881
Other assets 4,100,017 4,030,957 4,100,017 4,030,957
Consolidated Financial Statements of SBP and its Subsidiaries
The Group is exposed to equity securities price risk because of investment in listed equity securities by the Group classified as available-
for-sale. These investments are held as per the specific directives of the Government of Pakistan in accordance with the provisions of the
State Bank of Pakistan Act, 1956 and other relevant statutes. Accordingly, price risk on listed equity securities can not be managed by
the Group.
In case of 5% increase or decrease in KSE 100 index on June 30, 2017, other comprehensive income would increase or decrease by Rs.
945.623 million (2016: Rs. 901.429 million) and equity of the Group would increase or decrease by the same amount as a result of gains
/ (losses) on equity securities classified as available-for-sale.
The analysis is based on the assumption that the equity index would increase or decrease by 5% with all other variables held constant
and all the Group’s equity instruments move according to the historical correlation with the index. This represents management's best
estimate of a reasonable possible shift in the KSE 100 index. The composition of the Group's investment portfolio and the correlation
thereof to the KSE index is expected to change over time. Accordingly, the sensitivity analysis prepared as of June 30, 2017 is not
necessarily indicative of the effect on the Group's equity of future movements in the level of KSE 100 index.
Liquidity risk is the risk that an entity will encounter difficulty in raising funds to meet commitments associated with the financial
instruments. In order to reduce the level of liquidity risk arising out of the local currency activities, the Group manages the daily liquidity
position of the banking system including advancing and withdrawal of funds from the system for smoothening out daily peaks and
troughs.
The risk arising out of the Group's obligations for foreign currency balances or deposits is managed through available reserves generated
mainly from borrowings and open market operations. The maturity profile of Group's financial assets and financial liabilities is given in
note 50.5.1.
The Group has appointed external managers to invest a part of the foreign exchange reserves in international fixed income securities. The
external managers are selected after conducting a thorough due diligence by the Group and externally hired investment consultants, and
appointed after the approval of the Board of Directors of the Bank. The mandates awarded to the managers require them to outperform
the benchmarks which are based on fixed income global aggregate indices. The benchmarks are customised to exclude certain securities,
currencies, and maturities to bring it to an acceptable level of risk and within the Group's approved risk appetite. Managers are provided
investment guidelines within which they have to generate excess returns over the benchmark. Safe custody of the portfolio is provided
through carefully selected global custodian who is independent of the portfolio managers. The custodian also provides valuation,
compliance, corporate actions and recovery, and other value added services which are typically provided by such custodian. The
valuations provided by the custodian are reconciled with the portfolio managers, and recorded accordingly.
Fair value is the amount for which an asset could be exchanged, or a liability settled, between knowledgeable, willing parties in an arm’s
length transaction, and is usually determined by the quoted market price. The following tables summarises the carrying amounts and fair
values of financial assets and liabilities.
Carrying Value Fair value
-----------------------------(Rupees in '000)-----------------------------
129

2017 2016 2017 2016
Financial Liability
Bank notes in circulation 4,167,135,807 3,554,922,057 4,167,135,807 3,554,922,057
Bills payable 630,547 598,142 630,547 598,142
Current accounts of Governments 178,601,965 606,657,778 178,601,965 606,657,778
Payable to Islamic Banking Institutions against Bai
Muajjal transactions 25,137,230 44,952,938 25,137,230 44,952,938
Payable under bilateral currency swap agreement 155,550,410 158,507,631 155,550,410 158,507,631
Deposits of banks and financial institutions 669,337,539 391,760,469 669,337,539 391,760,469
Other deposits and accounts 164,665,074 161,552,998 164,665,074 161,552,998
Payable to the International Monetary Fund 787,381,266 778,739,505 787,381,266 778,739,505
Other liabilities 31,361,686 20,791,527 31,361,686 20,791,527
51.1
- Quoted prices (unadjusted) in active markets for identical assets or liabilities (Level 1).
-
-
Level 1 Level 2 Level 3 Total
Recurring Fair Value Measurements
On balance sheet
Financial Assets
Foreign currency accounts and investments - held for trading 379,452,397 - - 379,452,397
Investments - local 96,016,146 - - 96,016,146
Non-Financial Assets
Operating fixed assets (Land and buildings) - - 108,243,493 108,243,493
Gold reserves held by the Bank 270,361,202 - - 270,361,202
745,829,745 - 108,243,493 854,073,238
Off balance sheet financial instruments
Foreign currency forward and swap contracts - sale - 935,079,726 - 935,079,726
Foreign currency forward and swap contracts - purchase - 498,678,723 - 498,678,723
Futures - sale 43,038,829 - - 43,038,829
Futures - purchase 35,430,566 - - 35,430,566
Non-Recurring Fair Value Measurements
On balance sheet
Financial Assets
Investments - local - 54,160,348 11,681,926 65,842,274
Level 1 Level 2 Level 3 Total
Recurring Fair Value Measurements
On balance sheet
Financial Assets
Foreign currency accounts and investments - held for trading 269,942,861 - - 269,942,861
Investments - local 92,487,082 - - 92,487,082
Non-Financial Assets
Operating fixed assets (Land and buildings) - 58,344,593 - 58,344,593
Gold reserves held by the Bank 327,189,933 - - 327,189,933
689,619,876 58,344,593 - 747,964,469
Off balance sheet
Foreign currency forward and swap contracts - sale - 802,656,331 - 802,656,331
Foreign currency forward and swap contracts - purchase - 595,499,305 - 595,499,305
Futures - sale 18,044,108 - - 18,044,108
Futures - purchase 14,656,485 - - 14,656,485
There were no transfers between levels 1 and 2 during the year.
Fair value
-----------------------------(Rupees in '000)-----------------------------
The table below analyses financial and non-financial assets carried at fair value, by valuation method. The different levels have been
defined as follows:
State Bank of Pakistan Annual Report FY17
2016
-----------------------------(Rupees in '000)-----------------------------
The Group's policy is to recognise transfers into and out of the different fair value hierarchy levels at the date the event or change in
circumstances that caused the transfer occurred.
-----------------------------(Rupees in '000)-----------------------------
Inputs other than quoted prices included within level 1 that are observable for the asset or liability, either directly (that is, as prices)
or indirectly (that is, derived from prices) (Level 2).
Inputs for the assets or liabilities that are not based on observable market data (i.e. unobservable inputs e.g. estimated future cash
flows) (Level 3).
2017
Carrying Value
130

(a) Financial assets in level 1
(b) Financial assets in level 2
(c) Financial assets in level 3
51.2 Valuation techniques used in determination of fair values within level 2 and level 3
Decrease in
assumption by
50 basis points
ZTBL
Preference
shares
7.94%
Discounted
Cash flow
Method
Risk free
discount rate for
a 10 year
Instrument
1,860,218
17.50% Risk adjusted
discount rate80,312
2.82%Disbursement
level(481,872)
15.85% Deposits growth (321,248)
14.66% Risk adjusted
discount rate16,364
8.00%Disbursement
level(4,298)
Consolidated Financial Statements of SBP and its Subsidiaries
Financial assets included in level 1 comprise of foreign currency investments, gold reserves, investments in listed shares and mutual
funds.
Financial assets included in level 2 comprise of preference shares of ZTBL and derivative finanacial instruments in respect of forward
foreign exchange contracts.
Certain categories of operating fixed assets (land and building) and unlisted equity shares of ZTBL and HBFCL are classified as level 3
assets.
Item Valuation approach and input used
Operating fixed assets (Land and
building)
Land and buildings are revalued to their fair values on a periodic basis by involving
professional valuers. The fair values of land and building are determined by physically
analysing the condition of land and building and in case of land by ascertaining the current
market value of similar land, which is selling in near vicinity. Moreover, for buildings, the
valuer has also considered prevailing current cost of construction for relevant type of civil
work carried out thereon, where ever required. The management considers the above
parameters used as the "highest and best use" and best evidence of fair value for its land and
building. Note 19.1 to these consolidated financial statements highlights the year of valuation
and external valuer name. The effect of changes in the unobservable inputs used in the
valuations cannot be determined with certainty. Accordingly, a qualitative disclosure of
sensitivity has not been presented in these consolidated financial statements.
Forward foreign exchange contracts The valuation has been determined by interpolating the mid rates announced by State Bank of
Pakistan.
HBFCL
Ordinary
Shares
Cash Flow to
Equity
(16,364)
13,678
ZTBL
Ordinary
Shares
Dividend
Discount
Model
(80,312)
1,646,396
1,084,212
Un-observable
Inputs
The finance department of the Bank includes a team which performed the valuations of
preference shares of ZTBL and ordinary shares of ZTBL and HBFCL acquired during the
year as more fully explained in notes 16.1.1 and 16.1.2 respectively to these consolidated
financial statements. The team reports to the Director Finance and is responsible for ensuring
that the final reported fair value figures are in accordance with IFRS.
Relationship of unobservable
inputs to fair value
Increase in
assumption by
50 basis points
(Rupees in '000)
(1,799,149)
Investment in unlisted preference and
ordinary shares
Description Range of InputsValuation
method
131

-
-
-
52. CLASSIFICATION OF FINANCIAL INSTRUMENTS
Loans and Assets at fair Held to Available for Total
receivables value through maturity sale
profit or loss
Financial assets
Cash and bank balances held by a subsidiary 2,190,657 - - - 2,190,657
Local currency - coins 861,860 - - - 861,860
Foreign currency accounts and investments 1,063,277,816 382,140,984 337,120,388 - 1,782,539,188
Earmarked foreign currency balances 10,319,532 - - - 10,319,532
Special Drawing Rights of the International Monetary Fund 63,657,319 - - - 63,657,319
Reserve tranche with the International Monetary Fund
under quota arrangements 17,382 - - - 17,382
Securities purchased under agreement to resell 1,533,373,313 - - - 1,533,373,313
Current accounts of Governments 7,279,247 - - - 7,279,247
Investments - local 2,527,764,268 1,582,086 54,924,466 110,015,256 2,694,286,076
Loans, advances and bills of exchange 362,703,790 - - - 362,703,790
Assets held with the Reserve Bank of India 1,384,376 - - - 1,384,376
Balances due from the Governments of India and
Bangladesh (former East Pakistan) 9,917,256 - - - 9,917,256
Other assets 3,594,941 505,076 - - 4,100,017
Loans and Assets at fair Held to Available for Total
receivables value through maturity sale
profit or loss
Financial assets
Local currency - coins 488,198 - - - 488,198
Foreign currency accounts and investments 1,472,496,928 266,038,032 238,549,410 - 1,977,084,370
Earmarked foreign currency balances 5,147,596 - - - 5,147,596
Special Drawing Rights of the International Monetary Fund 67,656,236 - - -
Reserve tranche with the International Monetary Fund -
under quota arrangements 17,455 - - - 17,455
Securities purchased under agreement to resell 1,533,574,159 - - - 1,533,574,159
Current accounts of Governments 955,474 - - - 955,474
Investments - local 2,050,313,403 - 643,839 96,461,352 2,147,418,594
Loans, advances and bills of exchange 350,571,180 - - - 350,571,180
Assets held with the Reserve Bank of India 1,362,034 - - - 1,362,034
Balances due from the Governments of India and
Bangladesh (former East Pakistan) 9,214,881 - - - 9,214,881
Other assets 2,588,460 1,442,497 - - 4,030,957
Item
2017
Valuation approach and input used
----------------------------------------------------------(Rupees in '000)----------------------------------------------------------
2016
----------------------------------------------------------(Rupees in '000)----------------------------------------------------------
State Bank of Pakistan Annual Report FY17
Deposits growth of the entities based on the historic trends of similar entities in the market.
The deposits growth is critical from the point of having sufficient cash flows to pay dividend.
The main level 3 inputs used by the Bank are derived and evaluated as follows:
Discount margin/spreads represent the discount rates used when calculating the present value
of future cash flows. In discounted cash flow models such spreads are added to the
benchmark rate when discounting the future expected cash flows. Hence, these spreads
reduce the net present value of an asset or increase the value of a liability. They generally
reflect the premium an investor expects to achieve over the benchmark interest rate to
compensate for the higher risk driven by the uncertainty of the cash flows caused by the
credit quality of the asset. They can be implied from market prices and are usually
unobservable for illiquid or complex instruments.
Discount rates used for cashflows in the Dividend Discount Method (DDM) which is based
on post-tax rate that reflects expected return on similar types of entities by the investors. This
also takes into account the risks being faced by similar types of entities.
Disbursement growth level on a year to year basis keeping in view the past trends of the
entities, general market conditions and market penetration.
132

Financial liabilities
Bank notes in circulation 4,167,135,807 - 4,167,135,807
Bills payable 630,547 - 630,547
Current accounts of Governments 178,601,965 - 178,601,965
Payable under bilateral currency swap agreement 155,550,410 - 155,550,410
Payable to Islamic Banking Institutions against Bai Muajjal transactions 25,137,230 - 25,137,230
Deposits of banks and financial institutions 669,337,539 - 669,337,539
Other deposits and accounts 164,665,074 - 164,665,074
Payable to the International Monetary Fund 787,381,266 - 787,381,266
Other liabilities 31,361,686 - 31,361,686
Financial liabilities
Bank notes in circulation 3,554,922,057 - 3,554,922,057
Bills payable 598,142 - 598,142
Current accounts of Governments 606,657,778 - 606,657,778
Payable under bilateral currency swap agreement 158,507,631 - 158,507,631
Payable to Islamic Banking Institutions against Bai Muajjal transactions 158,507,631 - 158,507,631
Deposits of banks and financial institutions 44,952,938 - 44,952,938
Other deposits and accounts 391,760,469 - 391,760,469
Payable to the International Monetary Fund 161,552,998 - 161,552,998
Other liabilities 778,739,505 - 778,739,505
20,791,527 - 20,791,527
FROM TO 2016
Rupees in '000
Intangible assets
21,153
56. GENERAL
Figures have been rounded off to the nearest thousand rupees, unless otherwise stated.
___________________________ ___________________________ ___________________________
Tariq Bajwa Riaz Riazuddin Inayat Hussain
Governor Deputy Governor Executive Director
Consolidated Financial Statements of SBP and its Subsidiaries
----------------------------------------------------------(Rupees in '000)----------------------------------------------------------
----------------------------------------------------------(Rupees in '000)----------------------------------------------------------
2016
Carried at
amortised cost
Corresponding figures have been rearranged and reclassified, wherever necessary for the purpose of better presentation and comparison.
No significant reclassifications have been made during the current year except for the following:
Liabilities at
fair value
through profit
or loss
Total
Liabilities at
fair value
through profit
or loss
Carried at
amortised costTotal
Capital work-in-progress
2017
Property, plant and equipment
Capital work-in-progress
53. NON-ADJUSTING EVENT
The Board of Directors of the Bank in their meeting held on October 26, 2017 have appropriated an amount of Rs 13,771.22 million to "Revenue Reserve". The balance of profit after allocation of such appropriation will be transferred to the Government of Pakistan. The financial statements of the Group for the year ended June 30, 2017 do not include the effect of above appropriation and transfer of balance profit to the Government of Pakistan, which will be accounted for in the financial statements of the Group for the year ending June 30, 2018.
54. DATE OF AUTHORISATION
These consolidated financial statements were authorised for issue on October 26, 2017 by the Board of Directors of the Bank (i.e. Parent entity).
55. CORRESPONDING FIGURES
133