9 conclusion and suggestion for further...
TRANSCRIPT

Thi Thu Thuy Huynh CAPACITY CONSTRAINTS IN MULTI-STAGE
PRODUCTION-INVENTORY SYSTEMS – APPLYING MATERIAL REQUIREMENTS
PLANNING THEORY
PROFIL 23
PRODUCTION-ECONOMIC RESEARCH IN LINKÖPING LINKÖPING 2006

Production-Economcic Research in Linköping (PROFIL) Box 10034 S-58010 Linköping, Sweden
affiliated to
The Department of Production Economics
Linköping Institute of Technology S-581 83 Linköping, Sweden
Tel: 013-28 10 00
ISBN 91-974579-2-2
Copyright 2006 Thi Thu Thuy Huynh
LTAB Linköpings Tryckeri AB 2006.992

PREFACE
The objective of the PROFIL series is to provide information on research and other developments within the field of Production Economics by associates of Linköping Institute of Technology. Production Economics is basically an engineering discipline. It focuses on topics treating the interface between engineering and management and is therefore interdisciplinary in nature. It attempts at a two-way scientific integration; on the one hand to apply economic knowledge and reasoning to engineering and manufacturing problems, on the other, to utilise the arsenal of existing mathematical and quantitative engineering methods for analysing economic and managerial issues. It focuses on various allocation problems, in particular on the optimal use of productive resources within manufacturing and other industries. It encompasses developments in theory and application, wherever engineering and technology meet the managerial and economic environment in which industry operates. From the economic science perspective, the methodological approach is based on the theory of production, a branch of microeconomic theory, and on methods of production and operations management. During the last several decades this theory has been integrated with mathematical and statistical models and methods from operational research and management science. The quantitative economic approach has thereby in a natural manner obtained a firm footing within the field – a development which has been strongly supported and encouraged by many Swedish industrialists and others. Among the multitude of problems covered by this subject area can be found the development of principles for production planning and control on different levels and with varying scope. Rules for scheduling and sequencing work operations, the development of economic criteria for maintenance routines, principles for quality and inventory control etc. are other items of major interests, as well as methods, principles and procedures for investment planning and financial decisions, and also general theoretical frameworks. In this fascinating field of research, a host of interesting and intricate problems are awaiting solution, and their
v

practical implementation may often be just round the corner. The field is also experiencing considerable attention today – from the academic as well as the practical point of view. The competitive edge of many world class companies is nowadays gained through manufacturing excellence, for instance from lead time and inventory reductions. Education and research in these areas are therefore important and rewarding, perhaps more so now than ever before. This twenty-third publication in the PROFIL series entitled Capacity Constraints in Multi-Stage Production-Inventory Systems - Applying Material Requirements Planning Theory has been written by Thi Thu Thuy Huynh, who is presenting it as her doctoral thesis in Production Economics at Linköping Institute of Technology. Linköping in January 2006 Robert W. Grubbström FVR RI Professor
vi

FOREWORD
I started my doctoral studies in February 2002 in the Department of Production Economics at Linköping Institute of Technology. While being a doctoral student for four years, I owe a lot to my teachers, family and friends. First of all, I would like to express my gratitude to my supervisor, Professor Robert W. Grubbström, who has supported me throughout the whole process. He has contributed to many of the basic ideas of this dissertation. Without his guidance, I never could have finished this. I am greatly indebted to Professor Marija Bogataj and Professor Ludvik Bogataj, who have spent a lot of time with me for discussing suitable models and approaches. My thanks to Professor Ludvik Bogataj are not only for his valuable comments on my work, but also for his willingness to act as Faculty Opponent for this thesis. My appreciation is also expressed to Professor Christopher O'Brien, Professor Lars-Erik Andersson and Professor Anders Segerstedt for their kindness in taking on responsibility as Committee Members. At Billerud Skärblacka AB, I have received enthusiastic help from Ivo Fronzaroli, Marie Ardell and Mats Andersson. I greatly appreciate their help and the time they generously spent with me. I would like to show my deep thanks to Docent Ou Tang who has supported me with several valuable pieces of advice in my work as well as on my conference trips. My thanks go to all my colleagues in Department of Production Economics for making the department a nice place to work in. Living in a foreign country, which is so far away from my home country, is not easy. I would like to thank the family of Son, Tuyet and Viet Ha,
vii

the family of Bo, Gabriella and Filippa, and the family of Märtha. They have given me a lot of help making my life easier and more enjoyable. I would also like to thank Lan, my room mate. We have spent a pleasant time together, which will be remembered all my life. Many thanks go to Phuong, who has helped me in programming the examples of this thesis. I also wish to thank several friends, whom I cannot list here, for sharing with me an interesting time in Sweden. Finally, no word can express my deep gratitude to my parents, my sisters and my brothers for their love and for their encouragement throughout my long period of study. Linköping in January 2006 Huynh Thi Thu Thuy
viii

CONTENTS
1 INTRODUCTION ......................................................................... 1 1.1 Background and Motives ............................................................... 1 1.2 Objectives ...................................................................................... 4 1.3 Limitations..................................................................................... 5 1.4 Outline and Scientific Contribution............................................... 7 2 LITERATURE REVIEW AND RESEARCH FRAMEWORK.. 11 2.1 Capacity-Constrained Multi-Stage Production Planning and
Inventory Control......................................................................... 11 2.1.1 Deterministic Demand .................................................... 12 2.1.2 Stochastic Demand ......................................................... 14 2.1.3 Models Applied in Industry ............................................ 14 2.2 The Application of MRP Theory Employing Laplace Transform
and Input-Output Analysis to Multi-Level Multi-Stage Production and Inventory Systems................................................................. 15
2.3 Capacity-Constrained Multi-Level Multi-Stage Production Inventory Systems – Some Notation and Explanations ............... 16
3 ANALYSIS OF STANDARD ORDERING POLICIES WITHIN
THE FRAMEWORK OF MRP THEORY.................................. 21 3.1 The Fundamental Equations of MRP Theory .............................. 23 3.1.1 Definitions ...................................................................... 23 3.1.2 Properties of Cumulative Requirements ......................... 24 3.2 Time Development of Production for Basic Ordering Policies ... 27 3.2.1 Lot-For-Lot (L4L) Policy ............................................... 27 3.2.2 Fixed Order Quantity (FOQ) Case.................................. 28 3.2.3 Fixed Period Requirements (FPR) Case ......................... 29 3.3 Solutions to Non-Negativity Conditions for Available Inventory
with Requirements as Discrete Events......................................... 30 3.4 Solution to Non-Negative Conditions for Available Inventory with
Requirements as Continuous Events............................................ 33 3.5 Optimal FOQ and Optimal FPR when External Demand is
Stochastic ..................................................................................... 36 3.6 Summary...................................................................................... 41
ix

4 A HEURISTIC METHOD FOR THE CAPACITY CONSTRAINED PROBLEM WITH NON-ZERO LEAD TIMES..................................................................................................... 43
4.1 Problem Formulation ................................................................... 43 4.2 Heuristic Method ......................................................................... 45 4.2.1 Starting Point .................................................................. 46 4.2.2 Moving Procedure .......................................................... 46 4.2.3 Reduction Procedure....................................................... 51 4.2.4 Improvement Procedure.................................................. 52 4.3 Numerical Examples.................................................................... 53 4.4 Conclusion ................................................................................... 57 5 CAPACITATED PRODUCTION-INVENTORY SYSTEMS IN
DISCRETE TIME WITH NON-ZERO LEAD TIMES .............. 59 5.1 Assumptions and Notation........................................................... 60 5.2 Basic Model ................................................................................. 61 5.3 Numerical Examples.................................................................... 65 5.4 Summary...................................................................................... 71 6 THEORY FOR NON-ZERO LEAD TIMES EXTENDED TO
CONTINUOUS TIME FRAMEWORK...................................... 73 6.1 Assumptions and Notation........................................................... 74 6.2 Objective Function and Constrains.............................................. 75 6.3 Preliminary Example: One Product Case and Constant Demand ....
..................................................................................................... 78 6.4 Multi-Item Cases with Deterministic External Demand and Given
Capacity Limits............................................................................ 84 6.5 Numerical Examples.................................................................... 86
6.5.1 Two-level Serial Product Structure................................. 86 6.5.2 Three-level Product Structure......................................... 88
6.6 Summary...................................................................................... 90 7 CAPACITY-CONSTRAINED PRODUCTION-INVENTORY
SYSTEMS WITH NON-ZERO LEAD TIMES IN CONTINUOUS TIME AND WITH STOCHASTIC DEMAND.....
...................................................................................................... 93 7.1 Objective Function and Constraints.............................................. 94 7.2 Dynamic Programming Solution Procedure ................................. 95
x
7.3 Interpretation of the State and Other Entities ............................... 98 7.4 Summary....................................................................................... 99 8 CAPACITY CONSTRAINTS IN A PAPER MILL (BILLERUD
SKÄRBLACKA AB) ................................................................. 101 8.1 Introduction................................................................................. 101 8.2 Production Planning and Capacity Constraint Problems ............ 104 8.3 Some Observation and Suggestions............................................ 110 9 CONCLUSIONS AND SUGGESTION FOR FURTHER
STUDIES.................................................................................... 113 9.1 Summary and Conclusions ......................................................... 113 9.2 Suggestions for Further Studies.................................................. 115 REFERENCES ..................................................................................... 119
xi

xii

1 INTRODUCTION In a company, the role of production economics is to maximise the company’s economic result with respect to existing constraints. Production-inventory control is one of the important techniques of production economics. 1.1 Background and Motives The objective of production-inventory control was stated by George W. Plossl (1985) in the following way:
“Production and inventory control is concerned basically with providing the information needed for the day-to-day decisions required to reconcile these objectives (maximum customer service, minimum inventory investment, and low-cost plant operation) in plant operations. The fact that these objectives are in basic conflict was readily apparent to the manager who owned his own small manufacturing company. He had invested his money in the machines and equipment in the plant, controlled his own manufacturing schedules and was his own sales representative. When a customer demanded immediate delivery, his alternatives was clear – either spend money on breaking into machine setups and working overtime or let the customer wait. He also had the alternative of carrying inventory in the future – finished products. Part or raw materials – so that he would be able to give his customer better service. The basic conflicts among these objectives existed in this one manager company and they were not easy to resolve, but at least the manger could see the conflict and weigh the alternatives.”
There are two techniques that a manufacturing enterprise may employ for purposes of inventory management (Orlicky 1975). The first one is stock replenishment, popularly known as statistical inventory control or the order point system. Usually, it is applied for single item models. Under this approach, the depletion in the supply of each inventory item is monitored and a replenishment order is issued whenever the supply drops to a predetermined quantity. The second technique is Material Requirements Planning (MRP), which is used for a multi-level, multi-period production planning and control
1

system. Multi-level production and inventory control is the subject of this work. It is commonly much more difficult to analyse and to control than a single-stage method. MRP was introduced in the 1970’s. Much of the credit goes to three individuals by the names of Joseph Orlicky, George Plossl, and Oliver Wight. The American Production and Inventory Control Society (APICS), which was endorsed by Orlicky, Plossl, and Wight, was also credited with the introduction of MRP. MRP is a system that controls inventory levels, plans production, helps to supply management with important information, and supports the manufacturing control system with respect to the production of assembled parts. Figure 1.1 indicates an overview of how the MRP system works. The Product Structure File, the Master Production Schedule (MPS), and the Inventory Master File are the inputs of the MRP system. The output of the MRP system provides which component items that have to be produced and when, and this output can therefore be converted into the capacities required to produce these items. The MRP system does not, itself, plan capacity requirements, but it provides an input to a capacity requirements planning system without which the latter cannot possibly function effectively (Orlicky 1975). In MRP systems, the MPS represent a plan for the production of all end-items over a given planning horizon. It specifies how much of each end-item that will be produced in each planning period, so that future component production requirements and material purchases can be calculated using the MRP component-explosion logic. As such, the MPS has to be feasible so that components can be produced within the capacity available in each time period. Hence the production-inventory system is governed by the capacity constraints. Capacity constraints are considered in inventory planning for determining optimal target inventory positions.
2

Product Structure
File
Master Production Schedule
Inventory Master File
Material Requirements
Planning
Manufacturing Orders
Purchase Orders
Various Reports
Figure 1.1. An overview of how the MRP system works. Adopted from Foster (2002).
Capacity decisions are related to the performance of the system, e.g. the production lead time (Billington et al. 1983). Lead times are the times required to produce or assemble the items. The study of the MRP system has received a great deal of attention and extensions have been made to connect these studies with other theory. With the objective of obtaining optimal solutions, quantitative aspects of planning and-inventory control have resulted in several pieces of theoretical work on MRP and similar multi-level production-inventory systems. One breakthrough in this direction is the application of Laplace transform and Input-Output Analysis methodology. Combining Laplace transforms and Input-Output Analysis has proved to be advantageous for dealing with complex production-inventory systems (Grubbström and Tang, 2000). The useful relationship between the Laplace Transform and the Net Present Value (NPV) has been known for a considerable time
3

(Grubbström, 1967) and the NPV principle, considered as a more correct approach than the average cost measure, is being applied to production-inventory theory in a rapidly increasing number of articles (Grubbström and Lundquist 1977, Grubbström 1980, Thorstenson 1988, Grubbström and Jiang 1990). Here, we continue with this combined methodology. The Input-Output methodology is used to generalise the product structure as well as the timing relationship between items. The fundamental equations of the production-inventory system are described by the combination of transforms and Input-Output Analysis (Grubbström and Ovrin 1992, Grubbström and Molinder 1994). These equations are balance equations in the frequency domain explaining the development of total inventory, available inventory, backlogs and allocations (items reserved for production). The combined methodology of Input-Output Analysis and Laplace (or z-) transforms applied to production-inventory systems, we name MRP theory. More recent outcomes are the dissertations by Molinder (1995), Tang (2000), and by Wang (2002). Different directions of research within MRP theory have been developed, such as by Horvat and Bogataj (1996), Martin (1997), Bogataj (1999), Bogataj and Bogataj (2004). This work treats the capacitated multi-level, multi-stage production inventory problems within MRP theory. Input-Output Analysis and Laplace transforms or z-transforms are then employed as the essential tools. 1.2 Objectives In this thesis, capacity-constrained aspects of multi-level, multi-stage production planning are investigated. The aim has been to extend Material Requirements Planning Theory (MRP Theory) to cover more general problems dealing with capacity constraints, in particular when non-zero lead times are present and the processes take place in continuous time. The methodology used in this book is the quantitative method, which is based on the principles of Operational Research and Management
4

Science. The models are built on mathematically oriented production planning and inventory theory. In previous studies, the NPV objective function of multi-item production- inventory system has been developed. The optimisation conditions and capacity constraints have been generated. The problem is easy to formulate but difficult to solve for the optimal solution, especially when lead times are non-zero and external demand is considered in continuous time. Our aim is to extend our study to situations explaining how production-inventory system should works under capacity constraints when lead times are non-zero. First we develop a heuristic approach to get an inaccurate, but simple, result. Then, we state optimisation approaches for the models in several steps. This thesis also examines the fundamental equations of MRP Theory in order to analyse the possibility to obtain closed-form expressions for the time development of the system, when standard ordering policies of MRP are applied. Input-Output Analysis is used for capturing the Bill of Materials (the product structure) and Laplace transforms for describing the advanced timing requirements (lead times). 1.3 Limitations Multi-level production and inventory control causes several problems and difficulties in practice. Hence we have simplified the models with some assumptions. The product structures which are used in our work are assembly type (left part of Figure 1.2) only. Other types of production such as arborescent structures (right part of Figure 1.2) are not treated in this thesis. The assembly type of product structure is the prevailing type in manufacturing industries, whereas extraction industries, such as mining, often have product structures of the arborescent type. In various process industries there are often different mixtures of these types of structures. In a sequential structure, each item produced has only one predecessor
5

and only one successor. A sequential structure is therefore both of an assembly and an arborescent type.
Assembly structure Arborescent structure
Figure 1.2. The two basic types of product structures. End products are represented by top-level boxes, and subassemblies or
semi-processed products by lower-level boxes.
We focus on the multi-period production planning and control system applying MRP theory. Other alternative techniques such as inventory control and order point systems is not the subject of this work. We used the NPV instead of total or average cost as our objective functions. NPV is useful when we apply the Laplace transform. The only “uncertain” aspect considered here is stochastic demand. We mostly assume that lead times are given constants, even if lead times often can be stochastic in the real system. We also ignore other kinds of uncertainty such as machine reliability and production costs changing over time. Other limitations will be explained in the chapters to follow. Often such limitations are consequences of assumptions set forth.
6

1.4 Outline and Scientific Contribution As mentioned above, the multi-stage, multi-level capacity-constrained production-inventory problems have been treated in some previous studies. In Table 1.1, we have described the contribution from previously completed studies and the current contributions from this dissertation. The systems considered are classified with respect to properties of demand, properties of the time scale and with respect to whether or not the lead times are zero (or unity) or not in discrete time, or zero or non-zero in continuous time. The papers relevant to this development are listed in Table 1.1. Discrete time Continuous time
Deterministic demand
Varying τ Grubbström-
Huynh (2006) τ ≤ 1 Segerstedt (1996)
Varying τ Grubbström-
Huynh(2005a) τ = 0
Stochastic demand
Varying τ τ ≤ 1 Grubbström-Wang (2003)
Varying τ Huynh (2006) τ = 0
Table 1.1. Contributions to the development of multi-stage, multi-level
capacity-constrained production-inventory theory with respect to demand, time framework and lead times τ.
Segerstedt (1996) built a dynamic programming model to solve the capacitated multi-level, multi-stage production-inventory problem under the assumption that lead times either all are zero or all have a length of one period in discrete time. Later, Grubbström and Wang (2003) presented a model in discrete time when external demand is stochastic
7

and production lead times are zero. From 2002 until now, we develop the other cases in turn. This thesis consists of nine chapters. This first chapter is an introduction to the report. Here is presented the background and motives, the objectives, the limitations and the general contents of other chapters. Chapter 2 discusses the major research framework of this work. It also presents a literature review on the topics of multi-stage production inventory planning which focuses on capacity constraints. Our basic model for multi-level, multi-stage production inventory is also presented in this chapter for providing the general formulas of the model and the notation applied. Chapter 3 examines the fundamental equations of MRP Theory. These equations are balance equations in the frequency domain explaining the development of total inventory, available inventory, backlogs and allocations (items reserved for production). The objective is to analyse the possibility to obtain closed-form expressions for the time development of the system, when standard ordering rules of MRP are applied. Standard ordering policies presented are Lot-For-Lot (L4L), Fixed Order Quantity (FOQ), Fixed Period Requirements (FPR) which are mostly used when demand is considered to be deterministic. However, this chapter also analyses aspects of the Economic Fixed Order Quantity policy and the Optimal Fixed Period Requirements when assuming demand to be stochastic. The approaches analyse the problems both in the time domain and in the frequency domain. This chapter is based on Grubbström and Huynh (2005b). In Chapter 4 we present a heuristic methodology for solving a capacity constrained production-inventory model. This chapter extends the Grubbström and Wang (2003) model to the case when lead times are non-zero. It applies the heuristic method of França et al (1996) to solve lot-sizing in a multi-stage system. Firstly, the uncapacitated model is solved by dynamic programming to get an initial solution. If the initial solution is capacity infeasible, a smoothing procedure and an improvement procedure are applied to obtain feasible solution. This gives an inaccurate, but simple solution. The contents of this chapter are rewritten from Grubbström and Huynh (2002).
8

From Chapter 5 to Chapter 7, we solve the capacitated multi-level, multi-stage problems. The Laplace transform together with Input-Output Analysis are employed as tools for modelling the production-inventory system. This approach has been successfully used for formulating a theoretical base for Material Requirements Planning. The development follows the steps described below. In Chapter 5, we assume that demand is deterministic. The model is considered in discrete time and production lead times are non-zero. A dynamic programming model is formulated for the purpose to solve the optimisation of our objective function. The objective function is the NPV in this and the two following chapters. Here is the first time we introduce an efficient state space for dynamic programming, in which historical values of cumulative production and cumulative demand are given state variables. This chapter is based on Grubbström and Huynh (2006). In Chapter 6, we turn to continuous time theory and develop the corresponding methodology for the case that lead times are non-zero, while keeping external demand deterministic. Our emphasis is on the design of the state space, the properties of which depend on the product structures (the input matrix), the distribution of lead times among the production processes (the lead time matrix), and on the historical sequences of production and demand vectors. Once an efficient state space is designed, dynamic programming once again is applied as the solution method. The Net Present Value Principle is applied. This chapter is based on Grubbström and Huynh (2005a). In Chapter 7, we cover a model with stochastic demand in continuous time. The lead times are allowed to be non-zero. This is the most general system treated, and all other theory referred to, may be considered as special cases hereof. In Table 1.1, the thick-line triangle represents this theory. Appropriate states for applying dynamic programming are also designed. Once again, the Net Present Value is applied. The Laplace transform together with Input-Output Analysis have been employed as tools in constructing the model. The content of this chapter comes from Huynh (2006).
9
In addition, in Chapter 8, the production planning procedures applied in a paper mill have been studied, and they are here presented in the form of a case study. We investigate the production planning and related capacity-constraints of this plant. Chapter 9 summarises our work and states some of our conclusions. There we have also listed some further issues suggested for future research.
10

2 LITERATURE REVIEW AND RESEARCH FRAMEWORK
Production planning has a fundamental role in any manufacturing operation. The problem is to decide what type of product, and how much of each product that should be produced in future time periods. The decisions should be based on many factors, including period machine capacity, production lead times, holding costs, etc. Of primary importance is the estimate of demand for manufacturer's products in upcoming periods. Multi-stage production planning and inventory control is one of the most challenging problem areas in the field of manufacturing management (Axsäter et. al., 1986). One of the problems concerned is the application of MRP Theory to multi-stage lot sizing. MRP should be ranked at the top for analysing multi-level production-inventory control (Axsäter and Rosling, 1994). The widespread and popular use of MRP systems in industry has also resulted in an increased interest in the topic of decision making in capacitated multi-stage production-inventory system. This chapter provides a literature review of work treating capacitated multi-stage production-inventory systems and the application of MRP theory and Input-Output Analysis together with Laplace transforms to production-inventory systems. 2.1 Capacity-Constrained Multi-Stage Production
Planning and Inventory Control We structure this section in the following areas: - Deterministic demand, multi-stage production planning and inventory control, - Stochastic demand, multi-stage production planning and inventory control. - Multi-stage production planning and inventory models applied in industry.
11

2.1.1 Deterministic Demand Throughout this literature review of deterministic demand models, only discrete-time approaches have been found. Billington et al (1983) modelled the general MRP problem with capacity constraints. They presented an integer linear programming model of a general capacity-constrained multi-level MRP system. They limited themselves to very few constrained facilities (one or two), since they used a simple heuristic optimisation method. In 1994, also Tempelmeier and Helber used a heuristic for solving multi-item, multi-level lot-sizing problems with multiple capacity constraints. França et al (1996), have used a heuristic method for solving lot-sizing in multi-stage systems. First, they used the Wagner-Whitin dynamic lotsizing algorithm for each item of the system. Subsequently, a smoothing procedure and an improvement procedure are introduced for finding feasible capacity solutions. Segerstedt (1996) dealt with an optimisation approach for the multi-level, multi-stage capacity problem. Demand was assumed to be deterministic and the discrete production lead time either zero or unity. Dynamic programming was applied to find the optimum solution using the NPV as objective function. Ip et al. (2000) solved the earliness and tardiness production scheduling and planning problems. They applied a genetic algorithm in order to obtain an optimal solution to the multi-product production environment. Their objective was to find an optimal lot-size production schedule within a production planning and scheduling horizon such that the total cost of earliness and tardiness penalties could be minimised while satisfying the manufacturing process capacity constraints. Both a genetic and a linear programming approach were used and compared. A heuristic genetic algorithm for capacitated lot-sizing problems was developed by Xie and Dong (2002). With a zero lead time assumption, they built a model to minimise the total cost for a multi-stage production-inventory model. Their product structure could be a single level system, or a serial or an assembly system, and other variants. The capacity constraints could be of several types: uncapacitated, capacitated
12

single resources and/or capacitated multiple resources. It should be noted that the cost of computations and computation time for this algorithm is significant, since the complexity of problem is very high. Recently, Clark has built some models for capacity-constrained multi-level MRP systems with deterministic demand. In Clark (2003), three mixed integer programming (MIP) models and solution methods were developed to assists in identifying a capacity feasible MPS in MRP systems. An optimisation of capacity utilisation model was formulated and then solved using two approaches based on model approximation and sequential decomposition. The objective function applied was the traditional cost principle. Lead times were here assumed to be zero. In contrast, not avoiding lead times, Clark and Armentano in their report (1993) explicitly dealt with lead times in their multi-stage lot sizing problems treated. The limited capacity manufacturing system also was treated by Bouhia and Abernathy (2003). In this paper, they defined a list of ordering and scheduling policies in a multiple product, multiple plant case to maximise profits subject to capacity limits of the system. Their solution method was based on simulation methodology. Pongcharoen et al. (2002) introduced a genetic algorithm for the finite capacity scheduling of complex products with multiple levels in the product structure. Their algorithm including problem encoding, chromosome representation and initialisation, genetic operation, repair process, fitness measurement and chromosome selection is described in detail. A statistical analysis showed that the size of the problem has a major influence on the penalty costs concerned. Jolayemi and Oloruniwo (2004) developed a deterministic model for planning production and transportation quantities in a multi-plant and multi-warehouse environment, where opportunities to increase capacity levels were available. A mixed integer linear programming model was applied to analyse this model.
13

2.1.2 Stochastic Demand In practice, almost every production-inventory is subject to influences with uncertainty. This may be external demand, the supply lead time or other operational parameters (Tang, 2000). Here, we will be dealing with the uncertainty of external demand only. Albritton, M., et al (2000) considered a multi-product system in a single stage model, each resource having a finite capacity. The demand for each product was stochastic with log-normal distributions. When demand for a product exceeded the available inventory for that product, the manufacturer would lose sales. They solved this problem with two variants of Monte Carlo sampling-based optimisation techniques, to which they refer as simulation-based optimisation methods. However, they did not consider any multi-stage aspect. Grubbström and Wang (2003) have developed a capacity-constrained multi-level multi-stage production-inventory system with stochastic demand and zero lead times. Their optimisation methodology was dynamic programming. In their results stated, a comparison was made between the capacitated and uncapacitated problems indicating the value of adding new capacity. Brander et al (2005) have presented a simulation study under stationary stochastic demand. They used a heuristic approach to calculate the lot size for the economic lot scheduling problem. In this study, the actual demand had a uniform distribution. The purpose of this paper was to examine if a deterministic model could be used when demand has a stationary stochastic distribution. The authors concluded that the model used for determination of lot size was of lesser importance than the decision rule used for identifying the item to produce and, in particular, when to produce it. 2.1.3 Models Applied in Industry. There are some papers dealing with multi-product multi-period problems in industrial systems. Yan (2000) presented a hierarchical stochastic production planning for flexible automation workshops. Their software
14

package, named as stochastic interaction/ prediction algorithm, was developed as a result of this study. A capacity planning system that considered both the capacity and the capability of equipment was developed for multi-product semiconductor fabs (Chen et al, 2005). Recently, Mula et al (2006) presented a new linear programming model for medium term production planning in a capacity constrained MRP, multi-product, multi-level and multi-period manufacturing environment. This paper provided three fuzzy models with flexibility in the objective function. The paper demonstrated the usefulness and significance of MRP modelling with flexible constraints under uncertainty in demand. Their model was tested using real data from an automobile seat manufacturer. 2.2 The Application of MRP Theory Employing
Laplace Transform and Input-Output Analysis to Multi-Level Multi-Stage Production and Inventory Systems
The idea of applying Input-Output Analysis to MRP and multi-level production and inventory systems has been studied for some years in the Department of Production Economics at Linköping Institute of Technology. In Grubbström and Lundquist (1989), the relationships between Input-Output Analysis, MRP and production function were discussed. They concluded that there was an obvious relationship between master production scheduling, MRP, the bill of material (BOM), manufacturing resource planning (MRP II), and a general linear production-economic system interpreted in terms of an input-output model. The useful relationship between the Laplace Transform and the Net Present Value (NPV) was presented by Grubbström (1967). Moreover, the NPV principle, considered as a more correct approach than the average cost measure, has been applied to production-inventory theory in
15

an number of articles (Grubbström and Lundquist 1977, Grubbström 1980, Thorstenson 1988, Grubbström and Jiang 1990), Van der Laan (2003), and Teunter (2003). Applying the combination of transforms and Input-Output analysis to production-inventory was presented in Grubbström and Ovrin (1992) and Grubbström and Molinder (1994), and was further developed in Molinder (1995). In Grubbtröm and Ovrin (1992), the theory was originally introduced using the z-transform for application in discrete time. In Grubbström and Molinder (1994) and Molinder (1995), the theory was converted from discrete time to continuous time by introducing the Laplace transform. The advantages from combining the Laplace transform and Input-Output Analysis when dealing with complex production-inventory systems have been argued in Grubbström and Tang (2000). Grubbström and Tang (1997) have reviewed some early writings related to the topics of MRP and Input-Output Analysis. They also presented simple examples to further explain the interrelationship between these two methodologies. Recently, a few publications on capacitated multi-stage production-inventory applying MRP theory have appeared (Grubbström and Wang (1999), Grubbström and Wang (2000a), Grubbström and Wang (2000b), and Grubbström and Wang (2003)). There are also other recent outcomes such as the theses of Molinder (1995), Tang (2000), and of Wang (2002). 2.3 Capacity-Constrained Multi-Level Multi-Stage
Production Inventory Systems – Some Notation and Explanations.
We now describe the capacity-constrained multi-level multi-stage production inventory systems. Our basic notation is introduced for the application in all chapters to follow.
16

T time until given horizon.
N number of all items in the system.
N’ number of end items
M number of resources constraining production.
s complex Laplace frequency.
in number of set-ups for the production of batches of item i.
ijt time at which batch no j of item i is completed (decision variable), i = 1, 2, ... , . in
τ i lead time for the production of item i. τ( )s ( )N N× -dimensional lead time matrix with a lead time
operator ise τ in its ith diagonal position and zeros elsewhere.
ijν jth set-up of the production of item i referred to completion time . As a time function ijt ijν may be written as a sequence of Dirac impulses ( )ijt tδ − , j = 1, 2, ... . in
( )sν vector of all completion times in Laplace transform notation
iK set-up cost for producing a batch of item i,. ρ continuous interest rate per time unit.
ijh′ number of units of item i required to produce one unit of its immediate successor j. Collected into the input matrix
. ′Hkjh′′ capacity of resource k needed to produce one unit of item j
collected into the input matrix ′′H . ′H and ′′H make up the joint input matrix H.
ri sales price per unit of end product i collected into the row vector r.
ci echelon production cost per item i collected into the column vector c.
wk variable cost for using resource k per time unit collected into the column vector w.
Ck(t) Available capacity of resource k at time t.
17
Di external demand rate of item i at time t.
( )iD t external cumulative demand per time unit of item i from
time 0 to t, 0
( ) ( )t
i iD t D dα α= ∫ .
Pij number of units of item i (lotsize of batch no j) completed at time . ijt
( )iP t cumulative number of units of item i produced from time 0 to t.
Bi(t) level of stockouts of item i at time t. Ri(t) Available inventory of item i at time t. NPV Net Present Value, objective function. E (·) expectation operator.
( )x t short-hand notation for a time derivative of x(t). Tildes or the operator { }£ ⋅ are used to denote Laplace transforms of the
corresponding time functions, i. e. { }( ) £ ( )f s f t= = 0
( ) stf t e dt∞
−∫ =
0
nstn
nf e
∞−
=∑ for a continuous ( )f t or a discrete time function nf ,
respectively, and bars for cumulative functions, like 0
( ) ( )t
f t f dα α= ∫ or
0
n
n kk
f f=
= ∑ .
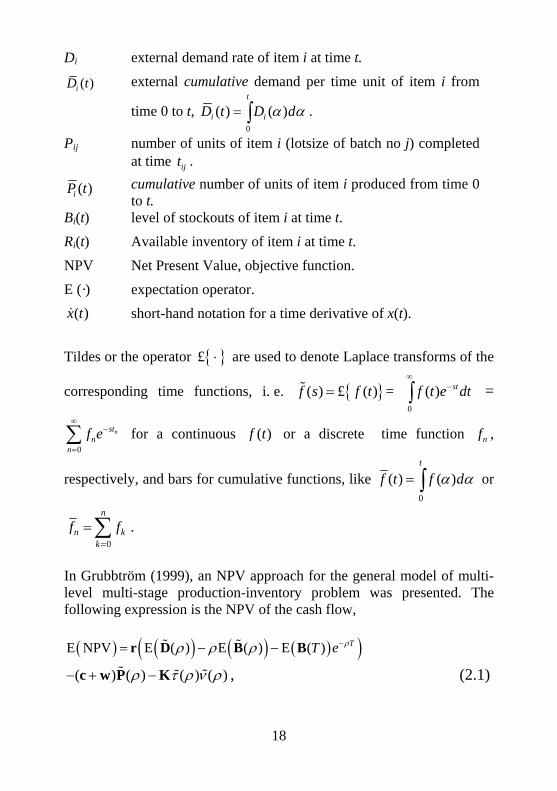
In Grubbtröm (1999), an NPV approach for the general model of multi-level multi-stage production-inventory problem was presented. The following expression is the NPV of the cash flow,
( ) ( ) ( ) ( )( )E NPV E ( ) E ( ) E ( ) TT e ρρ ρ ρ −= − −r D B B
( ) ( ) ( ) ( )ρ τ ρ ν ρ− + −c w P K , (2.1)
18

where r and K are N-dimensional row vector containing the components rj (sales prices) and Kj (set-up costs), respectively, and (c + w) an (N + M)-dimensional row vector with components ci + wi. The lead time matrix ( )τ ρ appearing in the last term accounts for allocating the set-up costs to the beginning of the lead time, since ( )ν ρ is defined from the completion dates. The production costs have been allocated to the completion dates by using the (N + M)-dimensional column production vector ( )ρP . In (2.1), (E ( ))ρD is an N-dimensional column vector of component
presenting expected external demand discounted to time zero with no consideration to stockouts, ( )E ( )ρ ρB is a similar vector of discounted
changes in backlogs, and ( )E ( ) TT e ρ−B contains correction terms for the sake of backlogs not being satisfied at the horizon T, since the process then terminates and no more production is planned. To get the optimal solution, we search for the maximal value of (2.1) subject to the following constraints. The available inventory ( )sR is cumulative production ( )sP less cumulative demand ( )sD and cumulative internal demand
( ) ( )s sHτ P and must be non-negative.
(0) (0) ( ( )) ( ) ( )( ) s s sss
+⎡ ⎤′− + − −
= ⎢⎣ ⎦
R B I H τ P DR ⎥ , (2.2)
where is the maximum operator [ ]+· Max{0, }⋅ , is the total production of all items and
( )sP( ) ( )s sHτ P is the internal demand. In (2.2),
all vectors are N-dimensional If external demand cannot be satisfied, we assume that this demand is backlogged and satisfied at the time available inventory starts to become positive one again.
19

(0) (0) ( ( )) ( ) ( )( ) s s sss
+⎡ ⎤′− − − +
= ⎢⎣ ⎦
B R I H τ P DB ⎥ (2.3)
Regarding end items (the N’ first components), the non-negativity is taken care of by the backlogging opportunity. For lower-level items, the backlogs are only allowed for external demand, but internal demand must always be met in order for the production plan to be feasible (the available inventory constraint):
{ }1 1 (0) (0) ( ( )) ( )£ ( ) £ s sss
− − ⎧ ⎫′− + −= ≥⎨
⎩ ⎭
R B I H τ PR 0⎬ , (2.4)
where { }1£− ⋅ denote the inverse Laplace transform. The second constraint is that of the capacity limitations,
1 ( ( ) ) ( )£ ( ) s sss
− ⎧ ⎫′′ −−⎨
⎩ ⎭
H τ I PC 0≥⎬ . (2.5)
In the next chapters, we will search for the optimal solution to (2.1) subject to constraints (2.4) and (2.5) following several steps of development.
20

3 ANALYSIS OF STANDARD ORDERING POLICIES WITHIN THE FRAMEWORK OF MRP THEORY
In MRP theory the time development of the production-inventory system is determined by a set of fundamental equations on the one hand, and external demand and production decisions, on the other. The fundamental equations are balance equations applicable to available inventory, total inventory and backlogs, using Input-Output Analysis for capturing the Bill of Materials and Laplace transforms for describing the advanced timing requirements (lead times). This chapter aims to examine the fundamental equations of MRP Theory into in order to obtain closed-form expressions for the time development of the system, when standard ordering policies of MRP are applied. The fundamental equations of MRP Theory have been developed in several earlier papers, beginning with Grubbström and Ovrin (1992) and in some earlier unpublished studies. These equations are balance equations in the frequency domain explaining the development of total inventory, available inventory, backlogs and allocations. Input-Output Analysis is used for capturing the Bill of Materials and Laplace transforms for describing the advanced timing requirements (lead times) In Grubbström and Tang (2000) an overview is presented. This chapter analyses the question of developing closed-form expressions for production when applying basic ordering rules. Order sizes are to be decided in time when inventories are zero or near to zero. In Grubbström and Ovrin (1992) the problem treated here was touched upon. In that paper the processes took place in discrete time, and the z-transformation was applied. Grubbström and Molinder (1994) and Molinder (1995) also followed up some research into this issue in the continuous time case.
21

In Orlicky (1975), some standard ordering policies such as Lot-For-Lot (L4L), Fixed Order Quantity (FOQ), Fixed Period Requirements (FPR) are defined. The L4L rule, being the simplest (also called “as required”) involves an order to be placed exactly large enough to cover requirements. This means that available inventory is kept at a zero level (assuming no initial inventories). In L4L, both the size of the order and the interval between orders will vary over time in a general case. Production, by this rule, is therefore adapted directly to requirements. With the FOQ policy, the order size is always the same. An order is placed as soon as there is not enough available inventory to cover requirement. If demand fluctuates, the interval between orders also must fluctuate. In general, available inventory will only reach a zero level on occasion. Applying the FPR policy, the interval during which total demand is generated and which the order should cover is constant. An order is placed just large enough to cover the total requirements during each such interval. At the end of these intervals, available inventory will have dropped to zero. We present a brief overview of the fundamental equations of MRP Theory in Section 3.1. This is followed by deriving the basic properties of production for the three ordering policies in relation to this theory in Section 3.2. Sections 3.3 and 3.4 are devoted to solving for the production development. In Section 3.5, the optimal FOQ and optimal FRP are presented when demands are stochastic.
22

3.1 The Fundamental Equations of MRP Theory 3.1.1 Definitions
Figure 3.1. Flowchart of the fundamental equations of MRP Theory (Grubbström and Tang 2000).
The fundamental equations of MRP Theory are balance equations describing the time development of total inventory, available inventory, backlogs, and allocations (see Grubbström and Tang, 2000). With the policies we are studying, backlogs will not occur in deterministic demand cases. In such cases, the fundamental equations for total inventory and available inventory may be written:
( )(0) ( ) ( )( )
s ss
s+ − −
=S I H P D
S , (3.1)
( )(0) ( ) ( ) ( )
( )s s s
ss
+ − −=
R I Hτ P DR , (3.2)
where is the column vector of items in inventory (including allocations), is the column vector of items in available inventory (total inventory less allocations), is the vector
SR
D of external demand, is the vector of items produced, H is the input matrix (the Bill of Materials), and I is the identity matrix. The lead time matrix
P
( )sτ is a matrix with lead time operators in its diagonal positions:
23

1
2
0 00
( )
0 0 N
s
s
s
ee
s
e
τ
τ
τ
⎡ ⎤⎢ ⎥⎢=⎢⎢ ⎥⎢ ⎥⎣ ⎦
τ0 ⎥
⎥. (3.3)
Internal (dependent) demand is given by ( ) ( )s sHτ P , since the input matrix and lead time matrix together determine all advanced requirements of sub-components in amount and timing, given a production schedule ( )sP . The main problem treated in this chapter, is how production P is determined by each of the policies, when facing a given external (independent) demand . D In one-item systems, there is no internal (dependent) demand and, thus, independent and dependent demand, on the one hand, and available and total inventory, on the other, will coincide. The fundamental equations (1)-(2) then collapse into:
(0) ( ) ( )( ) R P s D sR ss
+ −= . (3.4)
3.1.2 Properties of Cumulative Requirements The minimum necessary production to meet external (independent) requirements is always given by ( ) ( ) ( )1 2 3( ) ... ( )s s− ⎛
⎜⎝
− = + + + +I Hτ D I Hτ Hτ Hτ D⎞⎟⎠
, (3.5)
where the Neumann expansion has been used. This expansion is valid as long as the numerical values of all characteristic roots of H are less than unity. For assembly systems, in which H is triangular with zeros along its main diagonal and above, this is indeed so. The expansion will converge in at most N terms, where N is the dimension of H.
24

Assuming only one end product at the top level, we have
1
0( )
0
D
s
⎡ ⎤⎢ ⎥⎢ ⎥= ⎢ ⎥⎢ ⎥⎢ ⎥⎣ ⎦
D , (3.6)
and minimum cumulative requirements become
( ) ( ) ( )2 311 1
11/ ... /
colcolD s D−⎡ ⎤ ⎡ ⎤− = + + + +⎢ ⎥ ⎣ ⎦⎣ ⎦
I Hτ I Hτ Hτ Hτ s (3.7)
The triangular nature of H for an assembly system creates the following first elements
( ) 11 1
1/ /
rowD s D s−⎡ ⎤− =⎢ ⎥⎣ ⎦
I Hτ
(3.8)
( ) 111 21
2/ /s
row1D s e H D sτ−⎡ ⎤− =⎢ ⎥⎣ ⎦
I Hτ
(3.9)
( ) ( )1 211 13 32 21
3/ /s s
row1D s e H H H e D sτ τ−⎡ ⎤− = +⎢ ⎥⎣ ⎦
I Hτ
(3.10)
( ) 11
4/
rowD s−⎡ ⎤−⎢ ⎥⎣ ⎦
I Hτ
( )3 2 31 2 ( )14 42 21 43 31 43 32 21 1 /s ss se H H H e H H e H H H e D sτ τ ττ τ += + + + (3.11)
This reveals that requirements occur at times in advance of external demand in such a way that steps are generated sums of lead times ahead of top-level requirements. The further down in the product structure tree, the more opportunities for additional steps exist. For instance, on level 4, if all relevant are non-zero, then, generated by an external demand ijH
25

event at , items will be required at the points in time t 1t τ− , 1 2t τ τ− − ,
1t 3τ τ− − , and 1 2t 3τ τ τ− − − , whereas on level 3, items may be required only at 1t τ− and 1t 2τ τ− − . The total number of possible times increases geometrically, but all need not exist. One may also note that all possible times at a higher level are repeated again at all lower levels. Therefore the set of possible times for the entire system can be found by studying the lowest level in the system. But zeros in the matrix below the diagonal will rule out some combinations. A sequence of external demand events together with the set of lead times will thus generate a sequence of possible internal demand events. On levels above the lowest level, the sequence will be a subset of the sequence at the bottom level. Certain points in time may be covered more than once at least two reasons, (i) if external demand includes events at distances equal to combinations of lead times, and (ii) if combinations of lead times happen to be equal (such as if 2τ were equal to 3τ above).
Figure 3.2. Cumulative requirements as a staircase. In total, we can therefore regard cumulative requirements on any level (including the top level) to be made up of a staircase of steps occurring at the times , , , … , of which several steps may have a zero height. 0t 1t 2t
26

These requirements are given by
( )ˆ ( ) ( ) ( ) /s s s= +D Hτ P D s , (3.12)
for a general production policy, and in the general L4L case by (see Section 3.2.1 below)
( ) 1ˆ ( ) ( ) /s s −= −D I Hτ D s (3.13) When there is only one end item in the L4L case, we have
( ) 11
1
ˆ ( ) ( ) /col
s s D−⎡ ⎤= −⎣ ⎦D I Hτ s (3.14)
The staircase is illustrated in Figure 3.2 for an individual item. 3.2 Time Development of Production for Basic
Ordering Policies 3.2.1 Lot-For-Lot (L4L) policy
Figure 3.3. The Lot-for-Lot Policy. Production of an item (thick
staircase) follows exactly total requirements (sum of independent and dependent demand, thin staircase).
27

In the L4L case, with zero initial available inventory R(0) = 0, the solution is perfectly simple, also in the multi-item case with non-zero lead times. It is then just a matter of keeping available inventory at a zero level. This means
( )(0) ( ) ( ) ( )( )
s s ss
s+ − −
=R I Hτ P D
R = 0 , (3.15)
from which production is determined as
( ) 1 ˆ( ) ( ) ( ) ( )s s s−= − =P I Hτ D D s , (3.16) as is illustrated in Figure 3.3. If there are non-zero initial available inventories, the expression needs to be adjusted slightly. 3.2.2 Fixed Order Quantity (FOQ) case A fixed order quantity policy may be specified for any item in an MRP system. However, in practice it would be applicable to items with ordering cost sufficiently high to rule out ordering in net requirement quantities, period by period. The replenishments occur as available inventory approaches to zero. With the FOQ policy, having Q as the fixed order size, production for an individual item will behave according to
ˆ 1
0( ) n
nsT
nP s Q e
−−
=
= ∑ , (3.17)
where is the time when the nth batch is completed (made available), see Figure 3.4. These are the variables that need be determined by the policy. When production is other than L4L, the requirements on lower levels will depend on production on levels above. This implies, in the general case, that new sets of possible times of requirement events might be introduced.
nT
28

Figure 3.4. The Fixed Order Quantity Policy (FOQ). Production of an item is made in equally-sized batches as late as possible when avoiding
negative available inventory.
Available inventory of this individual item will then be
ˆ 11
0
ˆ( ) (0) ( )n
nsT
nR s R Q e D s s
−− −
=
⎛= + −⎜
⎝ ⎠∑ ⎞
⎟ , (3.18)
and the policy is to make all as late as possible without causing R(t) to become negative.
nT
3.2.3 Fixed Period Requirements (FPR) case Under the FPR policy, the ordering interval is constant and the quantities are allowed to vary. Production of a certain item will thus obey
ˆ 1
0( )
nsnT
nn
P s Q e−
−
=
= ∑ (3.19)
29

where T denotes the constant time interval between orders and is the batch size at time
nQ
nT nT= . The FPR policy is demonstrated in Figure 3.5.
Figure 3.5. The Fixed Period Requirements Policy (FPR). Production of an item is made in as small batches as possible to cover future
requirements during a constant period, without creating a negative available inventory.
The FPR policy requires the to be made as small as possible without violating the non-negativity condition for available inventory. This implies that available inventory is likely to take on a zero value during finite time intervals, which is not the case, other than by chance (or at the end), with the FOQ policy, as seen when comparing Figures 3.4 and 3.5.
nQ
3.3 Solutions to Non-Negativity Conditions for
Available Inventory with Requirements as Discrete Events
As shown above, the L4L policy provides an immediate explicit expression for the production on all levels. For the other two policies, this is not equally simple.
30

In the FOQ case we need to solve for the latest as possible batch times , , , … , such that available inventory R(t) is kept non-negative.
The solution in the time domain is simple for the individual item, given the requirements
0T 1T 2T
ˆ ( )itD at the times when there are steps , , ,… 0t 1t 2t Examining, for successive values of n,
( )1ˆ ˆarg max ( ) ( ) 0
i
i it
D t nQ D t− ≤ < ≥ , there will be a unique index i
assigned to each n, which we denote . So, ni nn iT t= will be the latest time that batch n can be produced. Hence, the solution to the FOQ production staircase is:
ˆ 1
0( ) /in
nsT
nP s Q e s
−−
=
= ∑ . (3.20)
In the FPR case instead, we need to solve for the smallest possible batch size at times 0, T, 2T, … , not violating the non-negativity of available inventory. The sequence of batches generated by nQ
1
0
ˆ (( 1) )n
ni
Q D n T Q−
=
= + − i∑ , (3.21)
or, equivalently,
ˆ ˆ(( 1) ) ( )nQ D n T D nT= + − , (3.22) for successive values of n = 0, 1, 2, … , will uniquely determine the production staircase satisfying the conditions. Hence, the production staircase becomes:
( )ˆ 1
0
ˆ ˆ( ) (( 1) ) ( ) /n
snT
nP s D n T D nT e s
−−
=
= + −∑ . (3.23)
Until now, we have investigated consequences of the non-negativity requirements in the time domain.
31

A corresponding set of non-negativity conditions in the frequency domain is given in Feller (1971) as the following provisions. If a time function ( )f t having the transform ( )f s is non-negative in the time domain, then the following property must hold
( ) ( ) ( )( )1 1j
j j jj
d f s f sds
− = − ( ) 0≥
1−
, (3.24)
for all integers j > 0 and all real s. In our case, we are looking at available inventories which for the FOQ policy are given by (assuming initial available inventory to be zero)
{ }ˆ 1
1 1
0
ˆ( ) £ ( ) £ ( )n
nsT
nR t R s Q e D s s
−−− −
=
⎧ ⎫⎛ ⎞= = − =⎨ ⎬⎜ ⎟
⎝ ⎠⎩ ⎭∑
( )ˆ 11 1
10 1
ˆ ˆ£ ( ) ( )n
nsT st
l ln l
Q e D t D t e s−
− −− −−
= =
⎧ ⎫⎛ ⎛ ⎞= − −⎜ ⎟⎨ ⎬⎜ ⎝ ⎠⎝ ⎠⎩ ⎭∑ ∑ 0l
⎞≥⎟ (3.25)
Choosing the situation for the interval of the ith requirements step and mth batch, and writing
( )1
10 1
ˆ ˆ( ) ( ) ( )n
m isT st
l ln l
f s Q e D t D t e−
−−
= =
⎛= − −⎜⎝ ⎠∑ ∑ l− ⎞⎟ , (3.26)
1( )g s s−= , (3.27)
we apply Euler’s formula
( )( ) ( ) ( )
0( ) ( ) ( ) ( )
jj k j
k
jf s g s f s g s
k−
=
⎛ ⎞= ⎜ ⎟
⎝ ⎠∑ k (3.28)
to Eq. (3.26). Differentiating ( )f s and ( )g s the number of times required, we obtain
32

( ) ( ) ( )1( )
10 1
ˆ ˆ( ) ( ) ( )n l
m ik ksT sk
n l l ln l
tf s Q T e t D t D t e−
− −−
= =
= − − − −∑ ∑ , (3.29)
1( ) ( 1) ( )!j k j kg s j k s− − −= − − j k− + , (3.30)
and thus
( ) ( ) ( )( ) ( ) ( )
0
!1 ( ) ( ) 1 ( ) ( )!( )!
jjj j k j k
k
jf s g s f s g sk j k
−
=
− = −−∑ =
( ) ( ) ( )1
110 0 1 0
! ˆ ˆ( ) ( )! !
n l
k kj jm in lsT st
l ljn k l k
sT stj Q e D t D t es k
−− −
−+= = = =
⎛ ⎞⎜ ⎟= − −⎜ ⎟⎝ ⎠
∑ ∑ ∑ ∑ k
( )1
! ˆ ( ) 0lj
j mQ D ts +→ − ≥ , (3.31)
for large values of j. This again provides the result in (3.20). 3.4 Solutions to Non-Negativity Conditions for
Available Inventory with Requirements as Continuous Events
In cases when the cumulative requirements are assumed to be a continuous time function given by an analytical expression, we may apply Cauchy’s Residue Theorem for solving for production in the FOQ and FPR policy cases. A residue is the coefficient of the first negative power in a Laurent expansion around a pole, i. e. where the numerator of an expression evaluates to zero. For the FOQ policy, we need to solve for the points in time when available inventory drops to zero.
{ }1ˆ 11 1
0
ˆ( ) £ ( ) £ ( )n
nsT
n
R t R s Q e D s s−
−− − −
=
⎧ ⎫⎛= = −
⎞⎨ ⎬⎜⎝ ⎠⎩ ⎭
∑ ⎟ . (3.32)
33

Assuming zero initial inventories and writing the Laurent expansion of
as ˆ ( )D s
ˆ ( ) jj
jD s d s
∞
=−∞
= ∑ (3.33)
for the nth batch, we have
1 ˆ( ) / ( )2
i wt
w iR t nQ w D w
iβ
βπ+ ∞
= − ∞
⎛ ⎞= −⎜ ⎟⎝ ⎠∫ e dw , (3.34)
which evaluated by the Residue Theorem will be
1 ˆ( ) / ( )2
i wt
w iR t nQ w D w e
iβ
βπ+ ∞
= − ∞
⎛ ⎞= −⎜ ⎟⎝ ⎠∫ dw =
0ˆRes ( ) wt
w residues
nQ D w ew=
⎛ ⎞⎛ ⎞= −⎜ ⎟ ⎜ ⎟⎝ ⎠ ⎝ ⎠∑ =
0
( ) 0!
kj
jresidues j k
wtnQ d wk
∞ ∞
=−∞ =
⎛ ⎞= − =⎜
⎝ ⎠∑ ∑ ∑ ⎟ . (3.35)
As an example, when requirements increase linearly and cumulative requirements therefore increase quadratically, cumulative requirements
behave according to 3ˆ ( )D s as−= , where a is the slope of the linearly increasing requirements. Then, the Laurent expansion collapses into
3jj
jd w aw
∞−
=−∞
=∑ , (3.36)
with the only non-zero coefficient 3d− a= . In this case, the only pole is at w = 0, so
34

3
0 00 0
( ) ( )Res Res / 2!! !
k kj
jw wj k k
wt wtd w aw atk k
∞ ∞ ∞−
= ==−∞ = =
⎛ ⎞ ⎛ ⎞=⎜ ⎟ ⎜ ⎟
⎝ ⎠⎝ ⎠∑ ∑ ∑ 2= , (3.37)
and
2( ) / 2 0R T nQ aT= − = . (3.38) The time of the nth batch will be 2 /T nQ= a . Hence, cumulative production in the FOQ case will follow
2 /( ) /s nQ a
nP s Q e s−= ∑ . (3.39)
In the FPR case instead, production has the structure
ˆ 1
0( )
nsnT
nn
P s Q e−
−
=
= ∑ , (3.40)
and available inventory will be
{ }1ˆ 11 1
0
ˆ( ) £ ( ) £ ( )n
snTn
n
R t R s Q e D s s−
−− −
=
−⎧ ⎫⎛= = −
⎞⎨ ⎬⎜⎝ ⎠⎩ ⎭∑ ⎟ . (3.41)
At the end of the nth step of the production staircase (at t = nT), we have
1
0
1 ˆ( ) / ( )2
ni wnTmw i
mR nT Q w D w e dw
iβ
βπ
−+ ∞
= − ∞=
⎛ ⎞= −⎜ ⎟
⎝ ⎠∑∫ , (3.42)
which evaluated by the Residue Theorem will be
1
0
1 ˆ( ) / ( )2
ni wnTmw i
mR nT Q w D w e dw
iβ
βπ
−+ ∞
= − ∞=
⎛ ⎞= −⎜ ⎟
⎝ ⎠∑∫ =
1
0 0
ˆRes / ( )n
wnTmw m residues
Q w D w e−
= =
⎛ ⎞ ⎛ ⎞= −⎜ ⎟ ⎜ ⎟⎝ ⎠⎝ ⎠
∑ ∑ =
35

1
0 0
( ) 0!
knj
m jm residues j k
wtQ d wk
− ∞ ∞
= =−∞ =
⎛ ⎞= − ⎜
⎝ ⎠∑ ∑ ∑ ∑ =⎟ . (3.43)
In the quadratically increasing requirement case with cumulative
requirements 3ˆ ( )D s as−= , we thus obtain 21
33w=00
( )( ) Res2!
n
mm
wnTR nT Q d w−
−=
⎛ ⎞= − ⎜ ⎟
⎝ ⎠∑ =
21
0
( ) 02!
n
mm
nTQ a−
=
= − =∑ . (3.44)
The size of the nth batch is therefore
( ) ( ) ( )2 2
2( 1)1/ 2
2n
n T nTQ a n aT
+ −= = + , (3.45)
and the cumulative production staircase becomes:
( )ˆ ˆ1 1
2
0 0( ) 1/ 2
n nsnT snT
nn n
P s Q e aT n e− −
− −
= =
= = +∑ ∑ . (3.46)
3.5 Optimal FOQ and Optimal FPR when External
Demand is Stochastic We now assume that external demand is a stochastic process D(t) of the renewal type, i.e.
1 1
( ) ( )j
kj k
D t tδ τ∞
= =
= −∑ ∑ , (3.47)
which is made up of sequence of unit impulses ( )δ ⋅ , i.e. Dirac delta functions. Here kτ is the stochastic interval between the (k-1)th and kth
36

demand event, 0kτ ≥ , k = 1, 2, 3... These are considered stochastically independent for different values of k. Let { }£ ( ) ( )f t f= s be the Laplace transform of the probability density function of any individual kτ . From Grubbström (1996), we then obtain the probability of demand during any given interval t to have the value:
{ }1
1
Pr( ) £ ( )Q
Qk
tk
t dt f s dtτ −
=
⎡ ⎤= = ⎣ ⎦∑ . (3.48)
The transform of expected cumulative demand is therefore
0
1E( ( )) (1 )1
j
j
1 fD s j f fs s f
∞
=
= − = ⋅−∑ . (3.49)
Assuming a zero safety stock, the FOQ policy implies that Q is ordered at , whenever 1iT + 1( ) (i iQ D T D T+≥ − )
− − +
. Total production will now have the transform;
1 2 31 1 2
0
( ) ...isT sT sT sTsT sT sT
i
P s Q e Q Qe Qe Qe∞
− −− − −
=
= = + + +∑ . (3.50)
Because the Ti are independent, we may drop the index i: E E Ej ksT sT sTe e e− − −⎡ ⎤ ⎡ ⎤ ⎡ ⎤= = ⎣ ⎦⎣ ⎦⎣ ⎦ . (3.51)
We also have
10
E Pr( )Q
sT sTk
kT
e Tτ∞
− −
==
⎡ ⎤ = =⎣ ⎦ ∑∫ e dT =
37

{ }1
0
£ ( ) ( )Q sT
TT
Qf s e dT f s∞
− −
=
⎡ ⎤= ⎣ ⎦∫ = , (3.52)
so that expected total production obeys:
( )1 1 2E ( ) 1+E E E ...sT sT sTP s Q e e e− − −⎡ ⎤ ⎡ ⎤ ⎡ ⎤⎡ ⎤ = +⎣ ⎦ ⎣ ⎦ ⎣ ⎦ ⎣ ⎦ +
1 ( )1 E QsT
Q Qf se−
= =⎡ ⎤ −− ⎣ ⎦
. (3.53)
Let ( )tν denote the setup frequency (Molinder, 1996, p. 41),
0 0
( )i
ji j
t tν δ∞
= =
⎛ ⎞= −⎜⎜
⎝ ⎠∑ ∑T ⎟⎟ , (3.54)
where ( )δ ⋅ again denotes the Dirac delta function. Then we have the expected setup frequency:
[ ] 1 1E ( )1 ( )1 E QsT
sf se
ν−
= =⎡ ⎤ −− ⎣ ⎦
. (3.55)
By multiplying E ( )P s⎡ ⎤⎣ ⎦ by s and taking the limit , we obtain the long-term average of production:
0s →
10 0 0lim E ( ) lim lim
1 ( ) ( ) ( )average Q Qs s s
sQ QP s P sf s f s Qf s −→ → →
⎡ ⎤= = =⎣ ⎦ − − . (3.56)
But from the moment generating property of the transform (Grubbström and Tang, 2006), we also have
(0) 1,f =
38

0 00
(0) lim ( ) lim ( ) ( ) E ,stjs s
t
f f s t f t e ττ μ∞
−
→ →=
′ ′ ⎡ ⎤= − = − − = − = −⎣ ⎦∫
2 2
00
(0) lim ( ) ( ) ,st
st
f t f t e 2τ τμ σ
∞−
→=
′′ = − = +∫
where τμ and 2
τσ are the mean value and variance of τ respectively. Then, the average production and setup frequency may be written:
1averageP
τμ= , (3.57)
[ ]0
1lim E ( )average ss s
Q τ
ν νμ→
= = . (3.58)
Assuming the net present value (NPV) of out payments to be minimised, we investigate the optimal value of Q F . The NPV of the cash flow can be written:
OQ=
[ ]NPV= E ( ) E ( )1 ( )1 E QTs
cQ K cQ Kc P s K sfe ρρ
νρ−=
+ +⎡ ⎤⎡ ⎤ + = =⎣ ⎦⎣ ⎦ ⎡ ⎤ −− ⎣ ⎦ , (3.59)
where c is unit production cost and K is setup cost. On differentiating NPV with respect to Q we obtain
( )( )2
( ) ln ( )NPV =1 ( ) 1 ( )
Q
Q Q
cQ K f fcQ f f
ρ ρρ ρ
+∂+
∂ − −=
( ) ( )
( )2
1 ( ) ( ) ln ( )0
1 ( )
Q Q
Q
c f cQ K f f
f
ρ ρ
ρ
− + +=
−
ρ= . (3.60)
39

which is the necessary optimisation condition. Using a second-order approximation of ( )f ρ provides us with the following optimal order quantity:
22EOQ averageKDKc cτρ μ ρ
= = , (3.61)
which has the standard format. Instead, in the fixed period requirement (FPR) case, the quantity
( ) (n nQ D t T D t= + − )n is ordered at the beginning of each interval of length T. Expected production will then be:
( )0
E ( ) E ( ) ( ) nstn n
n
P s D t T D t e∞
=
⎡ ⎤⎡ ⎤ = + −⎢ ⎥⎣ ⎦
⎣ ⎦∑ =
( )2 1E ( ) 1 ...1
sT s TsT
TD T e eeτμ
− −−
⎡ ⎤= + + + =⎣ ⎦ − . (3.62)
Average production is obtained as:
0 0
1lim E ( ) lim1average sT sTs s
sT TP s P se Te
1
τ ττμ μμ− −→ →⎡ ⎤= = =⎣ ⎦ −
= , (3.63)
and the average setup frequency
[ ]0 0
1lim E ( ) lim1average sTs s
ss sTe
ν ν −→ →= =
−= . (3.64)
The net present value of the cash flow will be:
[ ] 1NPV= E ( ) E ( )1 1Ts
Tc P s K s ce e T
Kρ ρρ τ
νμ −=
⎡ ⎤⎡ ⎤ + = +⎣ ⎦⎣ ⎦ − − − . (3.65)
40

To find the optimum interval T, we take the derivative of NPV with respect to T:
( )( )2
1NPV =
1
T T T
T
c e T e K e
T e
ρ ρ ρ
τ
ρ
ρ ρμ
− − −
−
− − −∂
=∂ −
0 . (3.66)
Using again a second-order approximation of Te ρ− , the following optimal interval is obtained:
* 2 2
average
K KTc cD
τμρ ρ
= = . (3.67)
This shows that in both of the cases FOQ and FPR, the optimal policies are obtained as when using the traditional average inventory approach with the inventory holding cost interpreted as cρ , i.e. interest rate times unit production cost. 3.6 Summary The objective of this chapter has been to analyse the previously developed fundamental equations of MRP Theory concerning the basic ordering policies Lot-For-Lot (L4L), Fixed Order Quantity (FOQ) and Fixed Period Requirements (FPR). Our aim has been to find closed-form Laplace transform expressions for the time development of production, when given external demand. When leaving the L4L policy, it is shown that the expressions are possible to derive, but they become considerably more complicated.
41

42

4 A HEURISTIC METHOD FOR THE CAPACITY CONSTRAINED PROBLEM WITH NON-ZERO LEAD TIMES
This chapter extends Grubbström and Wang (2003) by proposing a heuristic method to solve the case when lead times are non-zero. The model is stochastic demand and the lead times are assumed to be constant. The model is treated in a discrete time framework. As before, and in several other publications, the Laplace transform together with Input-Output Analysis are employed as tools for modelling the production-inventory system. This approach has been successfully used for formulating a theoretical base for Material Requirements Planning (MRP). The use of the transform in this chapter is limited to formulating the objective and constraint functions, but the method, as such, operates in the time domain. The objective function is chosen as in Grubbström (1999), and we now search for the optimum solution. The results are decisions concerning the produced amounts and production timing. The objective is to maximise the net present value (NPV) of the cash flow associated with production and demand. 4.1 Problem Formulation In continuous time, the objective function to be maximised is suggested in Grubbström (1999)
( )ˆˆE(NPV) E( ( )) E( ( )) E( ( )) ( ) ( ),TT e ρρ ρ ρ ρ ρ−= − − − −r D B B cР Kν (4.1)
subject to capacity constraints
{ } { }1£ £− −′′ ≤H τP 1 C , (4.2)
43

where, as before, ′′H is the part of the input matrix capturing capacity requirements and is the transform of capacities available.
C
Available inventory is non-negative
{ }1£ ( )s− ≥R 0 . (4.3)
In discrete time instead, Grubbström and Wang (2003) have presented the objective function
( ) ( )( )( 1)1 1
E NPV ET N
ni in in i n
n ir D B B e ρ− Δ
−= =
= − −∑ ∑
1 1 1
ˆ( ) n
T N Mst
i in i in k knn i k s
c P K w c eρ
ν −
= = = =
⎡ ⎛− + +⎢ ⎜⎝ ⎠⎣ ⎦
∑ ∑ ∑ ⎤⎞⎥⎟ , (4.4)
and suggested the available inventory in discrete time to be written
00Δ Δ
1 ( (1 1s se e− −
⎡ ⎤= + − − = + − −⎣ ⎦− −RR R I Hτ)P D I Hτ)P D , (4.5)
where is the length of the discrete period, since for our discrete process we have cumulative production
Δ
( )/ 1 se− Δ= −P P and and
cumulative demand ( )/ 1 se− Δ= −D D , and where is the vector of
initial available inventory. 0R
The capacity constraints (4.2) are reformulated as:
{ }1£ n t nδ− ′′ ≤ −H τP C ( )Δ , (4.6)
where ( )δ ⋅ is the Dirac impulse function.
44

4.2 Heuristic Method The procedure we propose to use follows França et al (1996). This is a heuristic method for finding the best solution for the production quantity of each item in each period. The method involves four procedures, of which the first is finding a starting solution. The three others are named “Moving”, “Reduction” and “Improvement” and are explained after the outline of the algorithm is described. We introduce some additional notation: m = iteration counter S[m] = set of solution variables obtained at iteration m NPV(S[m]) = expected net present value of S[m]
maxm = maximum number of iterations of the heuristic. S* = incumbent solution. We have the pseudo-code: m = 0 S[m] = starting solution {procedure P1} For m = 1 to maxm If S[m] is infeasible then S[m] = Moving {procedure P2} If S[m] is still infeasible then S[m] = Reduction {procedure P3} End If End If If S[m] is feasible then S[m] = Improvement {procedure P4} If NPV (S[m]) > NPV (S*) then S* = S[m] End If Next m. The four procedures are explained in the following sections.
45

4.2.1 Starting Point The starting solution is the solution for the uncapacitated problem which is obtained by optimising (4.4) by dynamic programming as Wagner-Whitin algorithm applied to each component of the product structure. First, the algorithm is applied to the end item which has only external demand. Next, the algorithm is applied to lower-level items which have both internal and external demand. The results are the production quantities of each item at each period. If such a solution is capacity feasible, then procedure P4 (Improvement) is called, otherwise, the Moving procedure P2 is applied. 4.2.2 Moving Procedure If procedure P1 yields a capacity infeasible solution and total capacity requirements is smaller than total available capacity, then the Moving procedure P2 tries to find a feasible solution by moving production from an infeasible period to some other period. The period is infeasible if a capacity requirement exceeds capacity available. Given an infeasible period t, an attempt is made to transfer a production quantity , ii tq τ+ of the production , ii tP τ+ of component i in period
it τ+ to another period lt iτ+ . For each component i that is produced in an infeasible period it τ+ , two alternative quantities are considered for possibly being moved to period l it τ+ : (i) the maximum quantity of the production , l ii tW τ+ = , ii tP τ+ that ensures that the available inventory constraints still are satisfied. (ii) the exact quantity of the production , ,ii t kQ τ+ = , ii tP τ+ which eliminates the overload of resource k in period t.
46

, , ( )1
/i i
N
i t k jk j t kt jkj
Q h P Cτ τ
+
+ +=
⎡ ′′ ⎤ ′′= −⎣∑ h⎦ , (4.7)
where { }max ,0a a+ = . The amount indicates if there is a quantity less than ktiQ ,, , l ii tW τ+ which can reduce the overuse of resource k in period t to zero. We define the moving quantity as follows
{ }, , , ,,i i li t i t k i tq Q Wτ τ iτ
−
+ + += (4.8)
where { } . {, min ,a b a b− = } Backward shifts Production shifts from period t = T, T - 1, ..., 2 are analysed. Portions of production, which affect an infeasible period t, are moved to earlier periods until period t becomes feasible. If, after having repeated these moves, period 1 is feasible, then we have a feasible solution. For a given infeasible period t, we consider moving a quantity , ii tq τ+ of
the production , ii tP τ+ of each item i from period it τ+ to earlier target
periods lt iτ+ . These periods are such that 1l i it tτ τ τ≤ + ≤ + − , where τ = max {1, the latest period in which there is production of item i prior to period t}. The inventory constraint shows that if , ii tq τ+ is moved from period it τ+
to earlier periods lt iτ+ , then the available inventory Rij, j = , ... , 1l it tτ+ − will increase by an amount , ii tq τ+ . We must ensure that
the constraints (4.3) are satisfied after such a move:
47

( ) ( )1
0l i l j
N
i t t ij j tj
h τ+ +=
′−∑P P ≥ (4.9)
Thus, we have
, , ( ) ( ) ,1
min ,i l l i l j
N
i t i t i t t ij j t i tj
q W h Pτ+ + +=
iτ τ+
⎧ ⎫′≤ = −⎨ ⎬
⎩ ⎭∑P P (4.10)
The choice of quantity, item, and target period ( ), , l iq i t τ+ is based on a ratio test, (described below), which takes into account the NPV variation and the use of resources, if the quantity , ii tq τ+ were moved to
l it τ+ . If, after these moves, period 1 is still infeasible, then we apply a step consisting of forward shifts. Otherwise, an improvement step is considered. Forward shifts Production shifts from periods t = 1, 2, …, T - 1 are considered in that order. Portions of the production which affect an infeasible t are moved from period it τ+ to later target periods lt iτ+ . For a given infeasible period t, we consider moving a quantity , ii tq τ+ of the production , ii tP τ+
of each item i to later target periods lt iτ+ . These periods are such that 1i l it tτ τ τ+ + ≤ + ≤ , where τ = min {T, the first period in which there
is production of item i after period t}. The moving procedure must ensure that the inventory constraints are satisfied as mentioned above.
48

Ratio test This test is used to choose the quantity, item and target period ( , , l iq i t )τ+ , i.e., the quantity , ii tq τ+ of the production , ii tP τ+ of item i
in period it τ+ to target periods lt iτ+ . The triple ( ), , l iq i t τ+ is chosen for smallest ratio test:
NPV Decrease Value Penalty( )Ratio 1( )Excess Capacity Reduction
tt β+= (4.11)
The term Penalty(t) and its factor β are defined in (4.16) and below. The NPV Decrease Value is the ratio between the change in NPV and total NPV, where the change in NPV is the NPV variation caused shifting quantity , ii tq τ+ from period it τ+ to periods l it τ+ . The expression for NPV follows (4.4). When we move amount , ii tq τ+ in
period it τ+ to target periods lt iτ+ , the cumulative production changes
from E( )itP τ+ to E( )
l itP τ+ by an amount , ii tq τ+ . It causes a decrease of the net present value ΔNPV:
before moving after movingNPV NPV NPVΔ = − , which is calculated as:
49

( ) ( )( )
( ) ( )( )( ) ( )( )
( 1) ( 1)
11
( )( ) ( ) ( ) ( )
( ) ( ) ( 1) ( 1)1
NPV E
ˆ
E ( )
E ( ) ( )
i
l i
l i
l i l i l i l i
l i l i
l i
tn
in in i n i nn t
Mt
i i i k ktk
ti t i t i t i t
t
i t i t i n i nn t
r D P D P e
c q K w c e
r D P q D P e
r D P q D P q
τρ
τ
ρ
ρ ττ τ τ τ
τ ττ
ν
+−− − Δ
− −= +
−
=
− − − ++ + + +
− −
+ + − −= + +
Δ = − − −
⎛ ⎞− + +⎜ ⎟
⎝ ⎠⎡− − + − −⎢⎣
+ − + − − +
∑
∑
( ) ( )( )
1
( )( ) ( ) ( 1) ( 1)
21
E ( ) ( )
ˆ ,
i
i
i i l i
l
n
ti t i t i t i t
Mt
i i i k ktk
e
r D P q D P q e
c q K w c e
τρ
ρ ττ τ τ τ
ρν
+ −− Δ
− − − ++ + + − + −
−
=
+ − − − − +
⎤⎛ ⎞− + + ⎥⎜ ⎟
⎝ ⎠ ⎦
∑
∑
(4.12) with
1
1, if ,
0, otherwise,it i t
i
q Pν
=⎧= ⎨
⎩ (4.13)
and (4.14) 2
1, if 0,
0, otherwise.li t
i
Pν
=⎧= ⎨
⎩ When the amount , ii tq τ+ is moved from period it τ+ to periods l it τ+ , there will be a variation in the use of the resource in such a period. Let,
( )1
=1Excess( )
j
N
kj j t ktKj
k kt
h P Ct
C
τ
+
+=
⎧ ⎫′′ −⎪ ⎪⎪= ⎨⎪ ⎪⎪ ⎪⎩ ⎭
∑∑ ⎪
⎬ (4.15)
50

denote the proportion of overuse of the resource in period t. The Penalty term in (4.11) considers the variation of the use of resources caused by the quantity , ii tq τ+ being moved from period it τ+ to periods l it τ+ . Defining as:
[ ]Penalty Excess after ( ) Excess after ( ) Excess before ( )l lt t= + − t , (4.16) where Excess after ( ) Excess ( ) after the movet t= , Excess before ( ) Excess ( ) before the movet t= , and, Excess Capacity Reduction Excess before ( ) Excess after ( )t t= − . Let a cycle denotes a sequence of a backward step and a forward step in the moving procedure. In the first cycles, we set 1β = . If a feasible is not found in the first cycle, we consider a second cycle with 2β = . In general, in cycle n, we set nβ = . The increase of the factor β at each cycle reflects a greater importance to the overuse of a resource. The maximum number of cycles is specified. If this number is reached and a feasible solution not found, then we change to the Reduction procedure P3. If the solution P2 is infeasible, then the external demand cannot be satisfied. Because backlogs are allowed for end items, we can reduce a production amount of end items. We now turn to the Reduction procedure. 4.2.3 Reduction Procedure For a given infeasible period t, we consider reducing a quantity , ii tq τ+ of
the production , ii tP τ+ of each item i at period it τ+ . The reducing
51

amount , ii tq τ+ is defined as in (4.8). We choose the item and target
period ( ), , l iq i t τ+ , by applying a smallest second ratio test:
NPV Decrease Ratio 2 ( )Excess Capacity Reduction
t = (4.17)
with NPV Decrease defined by:
before reduction after reductionNPV NPV NPVΔ = − , calculated by
( ) ( )( )
( ) ( )( )( ) ( )( )
( 1) ( 1)
11
( )( ) ( ) ( 1) ( 1)
( ) ( 1) ( 1) ( 1)1
NPV E
ˆ
E ( )
E ( ) ( )
l i
i
i i l i
l i l i
l i
Tn
in in i n i nn t
Mt
i i i k ktk
ti t i t i t i t
T
i t i t i n i nn t
r D P D P e
c q K w c e
r D P q D P e
D P q D P q e
ρ
τ
ρ
ρ ττ τ τ τ
τ ττ
ν
−− − Δ− −
= +
−
=
− − − ++ + + − + −
− − −+ + + − −
= + +
Δ = − − −
⎛ ⎞− + +⎜ ⎟
⎝ ⎠⎡− − − − −⎢⎣
+ − − − − −
∑
∑
∑ .nρ Δ ⎤⎥⎦
(4.18) After the reduction procedure, if all periods are feasible, we have a feasible solution and we turn to the improvement procedure P4. Otherwise, we conclude that the model is infeasible. 4.2.4 Improvement Procedure Starting from a feasible solution this procedure tries to find a lower cost by moving production to earlier or later periods. The procedure is similar to the moving procedure, also has a backward and a forward step. However, we allow only feasible and improving moves. That means the moving neither causes any capacity restriction to be violated, nor any decrease of the NPV.
52

The procedure ends, when no improved solution which is feasible, can be found. 4.3 Numerical Examples
A
B X1* C
X
1* 2*
1*
B1* 1* 2*
1*X1*2*
Figure 4.1. The three-level product structure, one resource requirement In this section, we provide numerical examples to explain our heuristic method. Consider the genaral structure as Fig. 4.1 (N = 3) constrained by one resource (M = 1), over a 10-period planning horizon with the parameters as in Table 4.1. The lead times of A, B and C are 1, 1 and 0, respectively.
Planning hoizon T 10 Interest rate ρ 0.05 Demand outcome dL, dH 2, 8 Outcome probability 0.3, 0.7 Average demand E[DA] 6.2 Sale revenue rA 800 Set up cost KA, KB, KB C 50, 50 , 20 Unit production costs cA, cB, cB C 100, 50, 50 Variable capacity cost wX 20
Table 4.1. Parameters of the example
53

Available capacity Cx is constant in each period. We change this level in different cases of the example. From figure 4.1, we have input and lead time matrices:
[ ]
A 0 0 00 0 0A
B 1 0 01 0 0 ; X 11 1 ,B
C 1 0 01 0 0C
X 1 1 1
⎡ ⎤⎡ ⎤ ⎢ ⎥⎢ ⎥ ⎢ ⎥′ ′′= = =⎢ ⎥ ⎢ ⎥⎢ ⎥ ⎢ ⎥⎣ ⎦
⎣ ⎦
H H H , 0 0
0 00 0 1
sA eB seC
⎡ ⎤⎢ ⎥
= ⎢ ⎥⎢ ⎥⎢ ⎥⎣ ⎦
τ .
The initial solution is shown in Table 4.2, which was obtained by applying a dynamic programming method to the uncapacitated model.
T 1 2 3 4 5 6 7 8 9 10 Item A 0 0 26 0 16 0 10 0 14 0 Item B 26 0 16 0 10 0 14 0 0 Item C 26 0 16 0 10 0 14 0 0
X 52 78 32 48 20 30 28 42 0 0
Table 4.2. Initial solution (infeasible, NPV = 203,487) The step of moving procedure are show in table 4.3. Firstly, we choose Cx = 38 Moving procedure, backward t = 10 Excess(t) = 0 t = 9 Excess(t) = 0 t = 8 Excess(t) = 0.105.
Consider PA,9, PB,9, PC,8Item A: PA,9=14, WA,9 = 0, WA,8 = 0, WA,7 = 0, WA,6 = 0, WA,5 = 0, WA,4 = 0, WA,3 = 0, WA,2 = 0. Hence no production of item A can be transferred to any previous periods. Item B: PB,9 = 0. No production of item B can be transfered to previous periods item C: PC,8= 14.
54

tl + 0 = 7 WC,7 = 14, QC,8 = 4, ⇒ q = 4, ratio = 5.929 tl + 0 = 6 WC,6 = 14, QC,8 = 4, ⇒ q = 4, ratio = 4.935 tl + 0 = 5 WC,5 = 14, QC,8 = 4, ⇒ q = 4, ratio = 11.488 tl + 0 = 4 WC,4 = 14, QC,8 = 4, ⇒ q = 4, ratio = 12.139 tl + 0 = 3 WC,3 = 14, QC,8 = 4, ⇒ q = 4, ratio = 17.990 tl + 0 = 2 WC,2 = 14, QC,8 = 4, ⇒ q = 4, ratio = 18.166 tl + 0 = 1 WC,1 = 14, QC,8 = 4, ⇒ q = 4, ratio = 26.170 Hence, we transfer q = 4 of item C from t +0= 8 to tl +0 = 6.
t = 7 Excess(t) = 0 t = 6 Excess(t) = 0 t = 5 Excess(t) = 0 t = 4 Excess(t) = 0.026. Consider PA,5, PB,5, PC,4
Item A: PA,5=16, WA,5 = 0, WA,4 = 0, WA,3 = 0, WA,2 = 0. Hence, no production of item A can be transferred to previous periods. Item B: PB,5 = 0. Hence, no production of item B can be transferred to previous periods. Item C: PC,4= 16 tl + 0 = 3 WC,3 = 16, QC,3 = 10, ⇒ q = 10, ratio = 11.900 tl + 0 = 2 WC,2 = 16, QC,3 = 10, ⇒ q = 10, ratio = 16.818 tl + 0 = 1 WC,1 = 16, QC,3 = 10, ⇒ q = 10, ratio = 19.693 We transfer q = 10 of item C from t +0= 4 to tl + 0 = 3.
t = 3 Excess(t) = 0.105. Consider PA,4 , PB,4, PC,3Item A: PA,4=0. Item B: PB,4 = 16 tl +1= 3 WB,3 = 16, QC,3 = 4, ⇒ q = 4, ratio = 15.537 tl +1= 2 WB,2 = 16, QC,3 = 4, ⇒ q = 4, ratio = 8.749 Item C: PC,3= 0 We transfer q = 4 of item B from t+1 = 4 to tl +1= 2.
t = 2 Excess(t) =2.158. Consider PA,3 , PB,3 , PC,2Item A: PA,3=26, WA,3 = 0, WA,2 = 0
55

Item B: PB,3 = 0 Item C: PC,2 = 30 We transfer q = 30 of item C from t +0 = 2 to tl +0 = 1.
After 6 cycles of backward and forward steps, we obtain a feasible solution as listed in Table 4.3.
T 1 2 3 4 5 6 7 8 9 10 Item A 0 0 9 0 9 6 9 5 14 14 Item B 0 19 0 16 7 0 10 14 0 0 Item C 0 19 6 5 26 0 0 10 0 0
X 38 37 38 37 38 38 38 38 28 0
Table 4.3. A feasible solution ( NPV = 18,708). Next, we make some backward and forward cycles to find improvement solutions. In our case, no new improved solution could be found. Therefore, we choose the solution from Table 4.3 as a final solution. The results are shown in Table 4.4 where we compare four levels of available capacity:
• Tight capacity: available capacity Cx = 33 • Normal capacity: available capacity Cx = 38 • Loose capacity: available capacity Cx = 45 • And uncapacitated model.
Uncapacitated
model
Tight capacity Cx= 33
Normal capacity Cx= 38
Loose capacity Cx= 45
NPV 20 348 16 425 18 708 20 052Ratio =NPV/CX 497.73 492.32 445.60% 100 80.7% 91.9% 98.5%
Table 4.4. NPV from four levels of available capacity.
56

In Table 4.4, the NPV is compared for cases when the capacity level is varied from 33 to 45 units of capacity and when model is uncapacitated. 4.4 Conclusion In this chapter, we have proposed a model for a capacity-constrained production-inventory system extended with non-zero lead times. The net present value is employed as the objective function. The solution procedure applies a heuristic method, which we applied to three-level product structure. The results in Table 4.4 show that the NPV increases, when the available capacity increases, but with a small degressive element showing "diminishing returns to scale" (Table 4.4 and Figure 4.2).
32 34 36 38 40 42 44 460
2000
4000
6000
8000
10000
12000
14000
16000
18000
20000 NPV
Ratio
NPV Ratio
Capacity
200
300
400
500
600
700
800
Figure 4.2. NPV and NPV over Capacity as Functions of Capacity
57

58

5 CAPACITATED PRODUCTION-INVENTORY SYSTEMS IN DISCRETE TIME WITH NON-ZERO LEAD TIMES
This chapter deals with the non-zero lead time problem. The developments are presented within a discrete time framework. Lead times are assumed to be given constants and the Net Present Value Principle is applied. In some previous papers (Segerstedt (1996), Grubbström and Wang (2003)), although the theory developed concerned situations in which the lead times could be any non zero constants, in order to design an analytical solution procedure, the assumption was made that lead times were zero, in order to be able to apply dynamic programming. Cumulative production and cumulative demand were taken as state variables. In this chapter, we remain in the discrete time framework and develop a methodology for the case that lead times are non zero, whereas demand is deterministic. Our emphasis is on the design of the state space, the properties of which depend on the product structures (the input matrix), the distribution of lead times among the production processes (the lead time matrix), and on the historical sequences of the production vectors. We also now apply a dynamic programming procedure in order to solve the non-zero lead time problem. The objective is to choose the best production plan maximising the net present value of the cash flow associated with production and demand. We thus extend the treatment from Grubbström and Wang (2003) in one dimension, at the same time limiting our attention to deterministic demand situations. The main novelty in this chapter is the design of the state space necessary to handle arbitrary non-zero lead times. Whereas cumulative production of all items, at the point when production decisions were to be taken, could be used in the zero-lead time solution procedure as a state description, we now extend the state space to include a sequence of prior cumulative production vectors. This sequence has a sufficient
59

number of elements to cover all opportunities that decisions might have had to limit future opportunities and affect the economic outcome. This chapter is based on Grubbström and Huynh (2006). However, the example in Section 5.3 is more extensive (four levels) as compared to the example included in Grubbström and Huynh (2006) (three levels). 5.1 Assumptions and Notation We consider a complex production-inventory system operating within a discrete finite time horizon T. The following assumptions are made:
• Demand is deterministic and assumed to take place at discrete points in time.
• Production of all items concerned take place in batches of arbitrary size at the same discrete points in time.
• For each item, external demand is deterministic • No backlogs are allowed for internal demand. • For externally demanded items, backorders are allowed and are
satisfied whenever a replenishment takes place. • Capacity constraints are assumed to be of the momentary kind,
meaning that capacity may neither be borrowed, nor lent, between different periods, see Grubbström and Wang (2000b).
• Only assembly-type product structures are considered. • No setup times are considered
In addition to the notation previously introduced in Section 2.3, the following symbols are introduced:
iτ lead time for the production of item i,
τ maximum lead time of all items,
ˆ iw variable cost for each unit of item i to use capacity resources determined by the requirements ′′H , collected in the row vector , w ˆ ′′=w wH ,
Ckn available capacity of resource k in period n, collected in a column vector , nC
60
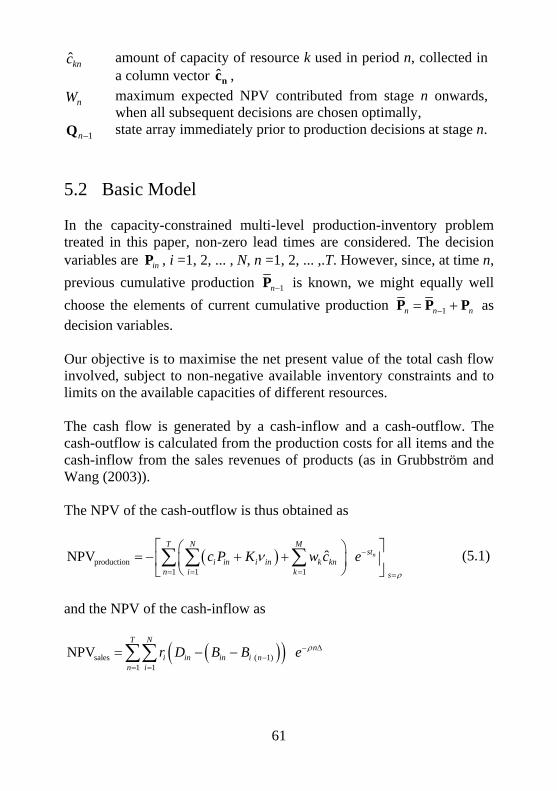
ˆknc amount of capacity of resource k used in period n, collected in a column vector , ˆnc
nW maximum expected NPV contributed from stage n onwards, when all subsequent decisions are chosen optimally,
1n−Q state array immediately prior to production decisions at stage n. 5.2 Basic Model In the capacity-constrained multi-level production-inventory problem treated in this paper, non-zero lead times are considered. The decision variables are , i =1, 2, ... , N, n =1, 2, ... ,.T. However, since, at time n, previous cumulative production
inP
1n−P is known, we might equally well choose the elements of current cumulative production 1n n− n= +P P P as decision variables. Our objective is to maximise the net present value of the total cash flow involved, subject to non-negative available inventory constraints and to limits on the available capacities of different resources. The cash flow is generated by a cash-inflow and a cash-outflow. The cash-outflow is calculated from the production costs for all items and the cash-inflow from the sales revenues of products (as in Grubbström and Wang (2003)). The NPV of the cash-outflow is thus obtained as
( )production1 1 1
ˆNPV n
T N Mst
i in i in k knn i k s
c P K w c eρ
ν −
= = = =
⎡ ⎤⎛= − + +⎢ ⎥⎜
⎝ ⎠⎣ ⎦∑ ∑ ∑ ⎞
⎟ (5.1)
and the NPV of the cash-inflow as
( )( )sales ( 1)1 1
NPVT N
ni in in i n
n ir D B B e ρ− Δ
−= =
= − −∑∑
61

( )( )( 1)1 s s TT s
e eρ
− Δ − + Δ
=⎡ ⎤= − − −⎣ ⎦r D B B , (5.2)
where the deferred revenues due to backlogs are taken care of. This provides the objective function:
sales productionNPV NPV NPV= + . (5.3) Our choice of solution procedure is dynamic programming. Since the lot sizes are possible to choose arbitrarily, there is never more than one set-up of a particular item in any period. As pointed out above, the decision variables in period n are chosen as cumulative production nP . In order to define our state space, we introduce the symbol τ for the maximum of all production lead times: ˆ Max ( )iiτ τ= . (5.4)
We then define the array 1n−Q as a sequence of τ previous cumulative production vectors:
ˆ ˆ1( ) 1( 1) 1( 1)
ˆ ˆ2( ) 2( 1) 2( 1)1
ˆ ˆ( ) ( 1) ( 1)
....
....
....
n n n
n n nn
N n N n N n
P P PP P P
P P P
τ τ
τ τ
τ τ
− − + −
− − + −−
− − + −
⎡ ⎤⎢ ⎥⎢= ⎢⎢ ⎥⎢ ⎥⎣ ⎦
Q ⎥⎥ (5.5)
This array represents the state prior to taking the nth production decision
nP . The transition from state 1n−Q to state may then conveniently be written:
nQ
62

1
ˆ ˆ1( ) 1( 1) 1( 1)
ˆ ˆ2( ) 2( 1) 2( 1)
ˆ ˆ( ) ( 1) ( 1)
ˆ ˆ(τ, τ)
.... 0 0 ... 0
.... 1 0 ... 0....
0 1 0....n
n n n
n n nn
N n N n N n
squarematrix
P P PP P P
P P P
τ τ
τ τ
τ τ
−
− − + −
− − + −
− − + −
⎡ ⎤ ⎡ ⎤⎢ ⎥ ⎢ ⎥⎢ ⎥ ⎢ ⎥= ⎢ ⎥ ⎢ ⎥⎢ ⎥ ⎢ ⎥
⎢ ⎥⎢ ⎥ ⎣ ⎦⎣ ⎦Q
Q
1
2
ˆrows, τ columns
0 0 ...0 0 ...
0 0 ...
n
n
Nn
N
PP
P
⎡ ⎤⎢ ⎥⎢ ⎥+ ⎢ ⎥⎢ ⎥⎢ ⎥⎣ ⎦
, (5.6)
where the post-multiplication by the ( ˆ ˆτ τ× )-matrix
0 0 ... 01 0 ... 0
....0 1 0
⎡ ⎤⎢ ⎥⎢ ⎥⎢ ⎥⎢ ⎥⎢ ⎥⎣ ⎦
,
having unit elements in the diagonal below the main diagonal, moves the columns in one step to the left, discarding the left-most column and emptying the right-most column to be filled with
1n−Q
nP in the summation. Using this formula for the transition from 1n−Q to shows the transition to be dependent on the current decision variables
nQ
inP alone, making the transition equation suitable for dynamic programming. The available inventory constraints are written:
{ }1£− ≥R 0 , (5.7)
with
00Δ Δ
1 ( (1 1s se e− −
⎡ ⎤= + − − = + − −⎣ ⎦− −RR R I Hτ)P D I Hτ)P D , (5.8)
since for our discrete process we have ( )/ 1 se− Δ= −P P and
(/ 1 se− Δ= −D D ) , and where is the vector of initial available
inventory. 0R
The capacity constraints are formulated as:
63

{ }1£ (n t nδ− ′′ ≤ −H τP C )Δ , (5.9)
which are interpreted as internal demand for resources ′′H τP (during any period) being limited to available given capacity levels collected in the vector , and where nC { }1£− ′′H τP is the inverse transform of ′′H τP .
The comparison in (6.9) is interpreted as a comparison of the coefficients of the impulses. As shown in Grubbström and Wang (2000), all constraints (available inventory as well as capacity) may be collected into a single relation { }1=£n
− ≥R R 0 by extending R with M additional
rows in a suitable way. We let be the contribution to the NPV from the nth stage, when given . Furthermore, let be the maximum NPV contributed from stage n onwards, when all subsequent decisions are chosen optimally. Adopting the NPV as our objective function, thus leads us to the recursive equation:
NPVnΔ
1n−Q nW
[ ]1 1,
( ) Max NPV ( )n n
n n n n nW W− +≥= Δ +
P R 0Q Q (5.10)
where depends on the given NPVnΔ 1n−Q and the decision nP :
( )( )( 1)1
NPVN
nn i in in i n
ir D B B e ρ− Δ
−=
Δ = − −∑
( )( 1)1 1
ˆ i
N Ms n
i ki in i n i ini k
c w e P P K v eτ ρ− Δ−
= =
⎡ ⎤⎛ ⎞− + − + +⎢ ⎜ ⎟
⎝ ⎠⎣ ⎦∑ ∑ ⎥ , (5.11)
with
( 1)
( 1)
1, if ,
0, if .in i n
inin i n
P Pv
P P−
−
⎧ >⎪= ⎨=⎪⎩ (5.12)
Since the process ends after stage T, we have 1 0TW + = , and therefore:
64

1 ,( ) Max NPV
T TT T TW − ≥
= ΔP R 0
Q . (5.13)
Working backwards in time, at each stage determining an argument nP that maximises NPVnΔ 1( )n nW ++ Q , given the state 1n−Q , provides us with the optimum policy:
*1(n n n−=P P Q ) . (5.14)
If we depart from the initial situation , we thus choose the following optimal production plan constituted by a sequence of decisions obeying this policy:
0Q
1 0( )P Q , 2 1( )P Q , ..., 1(T T −P Q ) . (5.15)
Since we are dealing with processes constrained by capacity limitations, the choice of decision nP is restricted by available capacity (5.9), this having an impact on the set of available opportunities to choose from. 5.3 Numerical Examples In this section, we provide a few numerical examples to explain and illustrate our basic model in Section 5.2. Consider the four-level product structure shown in Figure 5.1. With A, B and C being items and X a resource with limited momentary capacity, the input matrices and the lead time matrix will be the following:
A 0 0 0E 1 0 0C 1 1 0
⎡ ⎤⎢ ⎥′ = ⎢ ⎥⎢ ⎥⎣ ⎦
H , [ ]X 2 1 1′′ =H , 2
1 0 0A0 0B
C 0 0
s
s
ee
⎡ ⎤⎢ ⎥= ⎢ ⎥⎢ ⎥⎣ ⎦
τ ,
assuming that the top-level item A has a zero lead time, item B has a lead time of two periods and that item C has a lead time of one period.
65

A
B X
X
1* C
C
X
X
1* 2*
1*1*1*
1*
A
B XX
XX
1* C
C
XX
XX
1* 2*
1*1*1*
1*
Figure 5.1. Four-level product structure with one type of capacity
requirement. A computer program was developed to solve the recursive equations (5.10) with parameters given values according to Table 5.1. On the one hand, available capacity was varied between three constant levels, on the other, a separate run with varying demand was carried out. When solving the dynamic programming recursion, a complete enumeration procedure for integral values of the feasible production volumes was used.
planning horizon (time periods) T 10 initial inventory A0R , B0R , C0R 0, 6, 3 interest rate ρ per time period 0.05 demand outcomes AD 3 sales revenue Ar 1000 set-up costs , , AK BK CK 50, 50, 50 unit production costs , , Ac Bc Cc 100, 50,50 variable capacity cost Xw 20 variable product capacity costs , , Aw Bw Cw 40, 20, 20
Table 5.1. Parameter values for the numerical examples
66

Item n=0 n=1 n=2 n=3 n=4 n=5 n=6 n=7 n=8 n=9 n=10 A External
demand 3 3 3 3 3 3 3 3 3 3
Cumulative demand
3 6 9 12 15 18 21 24 27 30
Cumulative production
2 4 6 8 10 12 14 17 19 21
Net inventory
-1 -2 -3 -4 -5 -6 -7 -7 -8 -9
Capacity requirement
4 4 4 4 4 4 4 6 4 4
B Internal demand
2 2 2 2 2 2 2 3 2 2
Cumulative demand
2 4 6 8 10 12 14 17 19 21
Cumulative production
0 0 0 4 5 7 9 11 13 15
Net inventory
6 4 2 0 2 1 1 1 0 0 0
Capacity requirement
0 4 1 2 2 2 2 2 0 0
C Internal demand
2 6 3 4 4 4 4 5 2 2
Cumulative demand
2 8 11 15 19 23 27 32 34 36
Cumulative production
0 5 7 11 15 19 23 27 29 31
Net inventory
5 3 2 1 1 1 1 1 0 0 0
Capacity requirement
5 2 4 4 4 4 4 2 2 0
Total capacity requirements
9 10 9 10 10 10 10 10 6 4
Table 5.2. Results from example with constant demand DA =3 and
constant capacity CX = 10. Resulting NPV=10503.12
67

Item n=0 n=1 n=2 n=3 n=4 n=5 n=6 n=7 n=8 n=9 n=10 A External
demand 3 3 3 3 3 3 3 3 3 3
Cumulative demand
3 6 9 12 15 18 21 24 27 30
Cumulative production
2 5 8 11 14 17 20 23 27 30
Net inventory
-1 -1 -1 -1 -1 -1 -1 -1 0 0
Capacity requirement
4 6 6 6 6 6 6 6 8 6
B Internal demand
2 3 3 3 3 3 3 3 4 3
Cumulative demand
2 5 8 11 14 17 20 23 27 30
Cumulative production
0 0 3 6 9 12 15 18 21 24
Net inventory
6 4 1 1 1 1 1 1 1 0 0
Capacity requirement
3 3 3 3 3 3 3 3 0 0
C Internal demand
5 6 6 6 6 6 6 6 4 3
Cumulative demand
5 11 17 23 29 35 41 47 51 54
Cumulative production
0 6 12 18 24 30 36 42 46 49
Net inventory
5 0 0 0 0 0 0 0 0 0 0
Capacity requirement
6 6 6 6 6 6 6 4 3 0
Total capacity requirements
13 15 15 15 15 15 15 13 11 6
Table 5.3. Results from example with constant demand DA =3 and
constant capacity CX = 15. Resulting NPV=13468.56
68

Item n=0 n=1 n=2 n=3 n=4 n=5 n=6 n=7 n=8 n=9 n=10 A External
demand 3 3 3 3 3 3 3 3 3 3
Cumulative demand
3 6 9 12 15 18 21 24 27 30
Cumulative production
2 6 9 12 15 18 21 24 27 30
Net inventory
-1 0 0 0 0 0 0 0 0 0
Capacity requirement
4 8 6 6 6 6 6 6 6 6
B Internal demand
2 4 3 3 3 3 3 3 3 3
Cumulative demand
2 6 9 12 15 18 21 24 27 30
Cumulative production
0 0 3 6 9 12 16 21 21 24
Net inventory
6 4 0 0 0 0 0 1 3 0 0
Capacity requirement
3 3 3 3 4 5 0 3 0 0
C Internal demand
5 7 6 6 7 8 3 6 3 3
Cumulative demand
5 12 18 24 31 39 42 48 51 54
Cumulative production
0 7 13 19 26 34 37 46 46 49
Net inventory
5 0 0 0 0 0 0 0 3 0 0
Capacity requirement
7 6 6 7 8 3 9 0 3 0
Total capacity requirements
14 17 15 16 18 14 15 9 9 6
Table 5.4. Results from example with constant demand DA =3 and
constant capacity CX = 20. Resulting NPV=13857.21
69

Item n=0 n=1 n=2 n=3 n=4 n=5 n=6 n=7 n=8 n=9 n=10 A External
demand 3 4 0 5 0 4 3 5 3 3
Cumulative demand
3 7 7 12 12 16 19 24 27 30
Cumulative production
2 5 8 11 14 17 20 23 27 30
Net inventory
-1 -2 1 -1 2 1 1 -1 0 0
Capacity requirement
4 6 6 6 6 6 6 6 8 6
B Internal demand
2 3 3 3 3 3 3 3 4 3
Cumulative demand
2 5 8 11 14 17 20 23 27 30
Cumulative production
0 0 3 6 9 12 15 18 21 24
Net inventory
6 4 1 1 1 1 1 1 1 0 0
Capacity requirement
3 3 3 3 3 3 3 3 0 0
C Internal demand
5 6 6 6 6 6 6 6 4 3
Cumulative demand
5 11 17 23 29 35 41 47 51 54
Cumulative production
0 6 12 18 24 30 36 42 46 49
Net inventory
5 0 0 0 0 0 0 0 0 0 0
Capacity requirement
6 6 6 6 6 6 6 4 3 0
Total capacity requirements
13 15 15 15 15 15 15 13 11 6
Table 5.5. Results from example with varying demand DA and constant
capacity CX = 15. Resulting NPV=13017.10
70

Type of demand
Available capacity CX
NPV Ratio = NPV/ CX
10 10503.12 1050.3115 13468.56 897.90
Constant DA=3 20 13857.21 692.86Varying DA 15 13017.10 867.81
Table 5.6. Ratio of NPV and available capacity.
The resulting production plans in these four numerical cases are depicted in Tables 5.2 – 5.5. Table 5.6 shows the NPV and the ratio of NPV per available capacity level as functions of the capacity level. The production levels PA, PB, PB C are defined according to completion times (as in current theory). The similarity with traditional MRP tableaus is apparent, as one would have expected. 5.4 Summary When introducing non-zero lead times into the capacitated lot-sizing problem, the complexity of the model grows significantly. However, as shown in Section 5.2, the theoretical analysis is still manageable and requires only small additional conditions, when choosing an appropriate definition of the state space. Therefore, we can conclude the existence of a non-zero lead time extension of MRP Theory. But from a numerical perspective, the volume of computations and associated memory requirements increases substantially, when leaving the zero (or unit) lead time assumption. Still, for some limited structures the problems are still solvable such as three-level product structure (Grubbström and Huynh (2006)) and four-level product structure (Section 5.3). The four cases chosen have all given solutions that essentially used up all available capacity and produced hardly any inventory or backlogs. The NPV, resulting from these examples, behaves as one might have
71

expected intuitively, namely a close to linear relation between available capacity and NPV, but with a small degressive element showing "diminishing returns to scale" (Table 5. 6 and Figure 5.2).
10 12 14 16 18 200
2000
4000
6000
8000
10000
12000
14000NPV
NPV
Capacity
500
550
600
650
700
750
800
850
900
950
1000
1050
1100
constant demand varying demand
Ratio
Ratio
Figure 5.2. NPV and NPV over Capacity as Functions of Capacity (four-level product structure).
72

6 THEORY FOR NON-ZERO LEAD TIMES EXTENDED TO CONTINUOUS TIME FRAMEWORK
The solution methodology concerning capacity constraints has been developed in the following steps. In Grubbström and Wang (2003) the problem with stochastic demand, with or without non-zero lead times, was addressed in the discrete time case. In order to find a solution methodology (dynamic programming), lead times were then assumed to be zero. This zero lead time assumption was relaxed in Chapter 5, at the same time limiting the treatment to deterministic demand. The main problem treated below, is to turn from the discrete time deterministic case into the continuous time deterministic case. We thus attempt to find amounts to produce of each item in a multi-level/multi-stage capacity-constrained production-inventory system, which has a known development of external demand. As before, in this chapter we also apply a dynamic programming procedure in order to solve the non-zero lead time problem. The objective is to choose the best production plan maximising the net present value of the total cash flow associated with production and demand. We thus extend our treatment from Chapter 5 in one dimension, still limiting our attention to deterministic demand situations. This extension to include the continuous timing of production adds to complexity, in particular a need to extend the design of the state space to handle arbitrary non-zero lead times embedded in continuous time. As objective function, the Net Present Value (NPV) has often been chosen. Combining Laplace transforms and Input-Output Analysis has proved to be advantageous for dealing with complex production-inventory systems (Grubbström and Tang, 2000). Here, we continue with this combined methodology. Whereas cumulative production of all items, at the point when production decisions were to be taken, could be used in the zero-lead time solution procedure as a state description, the state space was needed
73

to include a sequence of prior cumulative production vectors when enabling non-zero lead times. This sequence had a sufficient number of elements to cover all opportunities that decisions might have to limit future opportunities and affect the economic outcome. In the current study the state space needs to be slightly modified, but, since we are retaining the assumption that production takes place at discrete points in continuous time, the modification required is limited. 6.1 Assumptions and Notation In this chapter we extend the theory from chapter 5 from discrete to continuous time. A complex production-inventory system operating within a finite time horizon T is considered. Basic assumptions are: • External demand is deterministic and is assumed to take place as
known processes in continuous time. • Production of all items concerned take place in batches of arbitrary
size at discrete points embedded in continuous time. • No backlogs are allowed for internal demand. • For externally demanded items backorders are allowed. • Capacity constraints are assumed to be of the momentary kind,
meaning that capacity may neither be borrowed, nor lent, at any time, see (Grubbström and Wang, 2000).
• Only assembly-type product structures are considered. We introduce some additional notation for the current continuous time model: ˆ iw variable cost per time unit for each unit of item i to use
capacity resources determined by the requirements ′′H , collected in the row vector , w ˆ ′′=w wH . This notation differs slightly from in Chapter 5, w
n number of cumulative production vectors used for describing state of system.
1j−Q state of system immediately prior to jth decision. jQ is chosen as a matrix made up of a sequence of consecutive cumulative production vectors.
n
74

6.2 Objective Function and Constraints Using the convention that no time functions are truncated at the horizon t = T, when computing the Laplace transforms, we state the following expression for the Net Present Value of the payments concerned. This is the continuous version of Eq. (5.1) in Chapter 5.
( )1 0
1 1 1
NPV ( ) ( ) ( )
1iiij
Tnt T
i i i i ii t
nN Mt
i ij i ij k k i iji j k
r D t B t e dt r B T e
ec P K w h P e
ρ ρ
ρτρν
ρ
− −
= =
−
= = =
= − −
⎛ ⎞−′′− + +⎜ ⎟⎝ ⎠
∑ ∫
∑ ∑ ∑ =
( ) ( )( )( ) /s
s sρ=
⎡ ⎤′′= − − + − +⎣ ⎦r D B c wH τ I P Kν . (6.1)
The terms of this expression are explained as follows. The following part is the net present value of revenues taking backlogs into account:
( )1 0
( ) ( ) ( ) .Tn
t Ti i i i i s
i t
r D t B t e dt r B T e sρ ρ
ρ
− −
== =
⎡ ⎤− − = −⎣ ⎦∑ ∫ r D B (6.2)
During an interval in which there is a stockout of item i, the backlog changes as demand, and we have ( ) ( )i iB t D t= , and during the interior of this interval there will be no revenues. If there is a momentary replenishment iB−Δ at t′ , reducing or eliminating ( )iB t , revenues having the NPV of t
iB e ρ ′−Δ will be obtained. When ( )iB t at t′ is interpreted as ( ) ( )i iB t B t tδ′ ′= Δ − (where ( )t tδ ′− is a Dirac impulse function at t ), the contribution to the NPV from the sudden change in ′
( )iB t will thus be accounted from the reduction in backlog
0
( )t
ti i
t t
r B t e dtρ′
−
′= −
− =∫0
( )t
ti i
t t
r B t t e dtρδ′
−
′= −
′− Δ −∫ ti ir B e ′ρ−= − Δ . If there is a
remaining backlog at the horizon ( )iB T , there has been no, or at least not a sufficient, replenishment at the horizon. This will account for lost sales
75

at T creating a reduction in the NPV by ( ) Ti ir B T e ρ−− as compared to
when all demand at the end is satisfied. The production cost term i ij i ijc P K ν+ is easily interpreted and this cost is timed at . It may be questioned if this is the correct timing for the set-up, but a modification locating the set-up to the beginning of the lead time rather than at the completion time, would be straightforward and would only add slightly to notational complexity. The variable capacity
cost term
ijt
1
1iM
k k i ijk
ew h Pρτ
ρ=
−′′∑ is explained below.
There are two types of constraints involved in this problem. On the one hand, available inventory must be non-negative, in order for the production plan to be feasible. Available inventory, before external demand , may be written as cumulative production less internal demand. In transform terms, this will be written
PD
( (0) ) / s′+ −R P H τP ( (0)= R ( ) ) / s′+ −I H τ P , where I is the identity matrix. Here, (0) / sR is
the vector of initial available inventory, ′H τP is internal (dependent) demand of subcomponents required by the production plan , appropriately timed the relevant lead times in advance of the completion times defining . Dividing ( by s, represents a time integration of the difference between production and internal demand. This difference, together with initial available inventory, may be used to satisfy external demand and must be non-negative as a time function.
P
P )′−I H τ P)
Secondly, there is the set of capacity constraints. The demand for capacity is always internal (not considering any external sales of surplus capacity) and, in transform terms, the momentary capacity requirements may be expressed as ′H τP . If the capacity of different resources is given as a vector of time functions C(t), the capacity constraint will be the condition
{ }1£ ( ) ( ) ( )s s s− ′− ≥C H τ P 0 . (6.3)
76
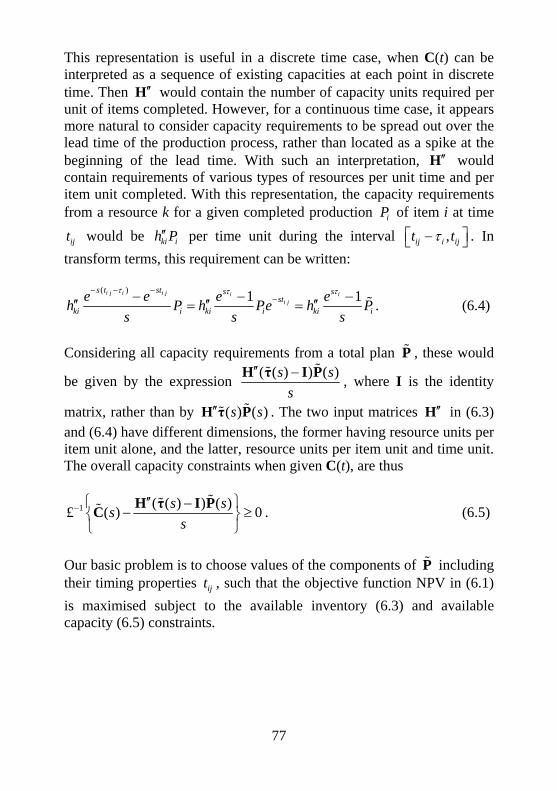
This representation is useful in a discrete time case, when C(t) can be interpreted as a sequence of existing capacities at each point in discrete time. Then would contain the number of capacity units required per unit of items completed. However, for a continuous time case, it appears more natural to consider capacity requirements to be spread out over the lead time of the production process, rather than located as a spike at the beginning of the lead time. With such an interpretation,
′′H
′′H would contain requirements of various types of resources per unit time and per item unit completed. With this representation, the capacity requirements from a resource k for a given completed production of item i at time
would be per time unit during the interval iP
ijt ki ih P′′ ,ij i ijt tτ⎡ ⎤−⎣ ⎦ . In transform terms, this requirement can be written:
( ) 1 1i j i i j i ii j
s t st s sst
ki i ki i ki ie e e eh P h Pe h
s s
τ τ τ− − −−− −′′ ′′ ′′= = P
s− . (6.4)
Considering all capacity requirements from a total plan , these would
be given by the expression
P( ( ) ) ( )s s
s′′ −H τ I P , where I is the identity
matrix, rather than by ( ) ( )s s′′H τ P . The two input matrices ′′H in (6.3) and (6.4) have different dimensions, the former having resource units per item unit alone, and the latter, resource units per item unit and time unit. The overall capacity constraints when given C(t), are thus
1 ( ( ) ) ( )£ ( ) s sss
− ⎧ ⎫′′ −− ≥⎨ ⎬
⎩ ⎭
H τ I PC 0 . (6.5)
Our basic problem is to choose values of the components of including their timing properties , such that the objective function NPV in (6.1) is maximised subject to the available inventory (6.3) and available capacity (6.5) constraints.
Pijt
77

6.3 Preliminary Example: One Product Case and Constant Demand
As an introductory example, we choose a very simplified case with only one item and a constant demand rate ˆ( )D t D= . At first, capacity is unlimited, and backlogging is not allowed, B(t)=0. Because there is only one item, the subscript i may be dropped and the remaining subscript j refers to the stage. Variable capacity cost may be included in the unit production cost c. The net present value is
( )10
ˆNPV j
T ntt
jj
r De dt cP K e ρρ −−
=
= − +∑∫ =
( ) ( )1
ˆ 1j
T nt
jj
r D ecP K e
ρρ
ρ
−−
=
−= − +∑ , (6.6)
where jP refers to the jth batch completed at time . Our problem is to choose all values of
jt
jP and that maximise the NPV. Without loss of generality, we define
jt
1nt + T= (although there might be a production decision at ). The production decision at stage j is thus the pair of decision variables
1n nt t T+= =
1j j jP P P −= − and . jt Just before a production set-up at time , cumulative production is jt 1jP − and this level may be chosen as the state variable. Taking a production decision at that time, the contribution to the NPV (disregarding the constant revenues) will be
( ) ( )1NPV , , jtj j j j jP P t cP K e ρ−
−Δ = − + . (6.7) Since, in this example with unlimited capacity, there is never any advantage to produce more than what is demanded until the next replenishment, cumulative production will always equal cumulative demand just before each such point in time (the so called "inner corner condition" when viewing cumulative production as a staircase function
78

in the same diagram as cumulative demand),
1ˆ( )j j jP D t D− = = t , (6.8)
so the timing decision is forced to be jt 1
ˆ/j jt P D−= . The contribution to NPV from stage j may therefore be written
( ) ( ) 1ˆ/
1NPV , jP Dj j j jP P cP K e ρ −−
−Δ = − + , (6.9) and the transition between the states
1j j jP P P−= + . (6.10) Let 1( )j jW P+ be the contribution from stage (j + 1) and onwards, when
optimal decisions are chosen based on the state jP . At stage j we therefore choose jP so that
( ) ( )1 1 1 1NPV , ( ) NPV , ( )j j j j j j j j j j jP P W P P P W P P− + − +Δ + = Δ + 1−+ is maximised,
( )1 1 1( ) max NPV , (j
j j j j j j j jPW P P P W P P− − += Δ + + 1)− . (6.11)
At the final set-up at , the remaining contribution to the NPV is nt
( ) ( ) 1ˆ/
1NPV , nP Dn n n nP P cP K e ρ −−
−Δ = − + = ( ) 1ˆ/
1ˆ( ) nP D
nc DT P K e ρ −−−− − + .
(6.12) Since T is given, and 1nP − is the current state determined from past decisions, this contribution is given by the state variable and not subject to any maximisation procedure, so
79

( )1 1( ) NPV ,n n n n nW P P P− −= Δ = ( ) 1ˆ/
1ˆ( ) nP D
nc DT P K e ρ −−−− − + . (6.13)
The solution to this recursive equation is not so simple as it might seem at first glance. The equation stated here offers a multitude of opportunities. Details of the structure of the solution are found in Grubbström and Kingsman (2004). We now introduce the opportunity of backlogging. This means that the inner corner condition may be violated. At time jt , just before a possible
production decision jP , cumulative demand is ˆjDt and cumulative
production 1jP − , and there might be a backlog 1ˆ( 0)j j jB t Dt P −− = − if
1ˆ
j jDt P −> . A batch completion of jP will reduce the backlog, possibly eliminate it. The state at jt , just before the decision is interpreted as the pair of
variables 1jP − and its timing 1jt − . There are now also two decision variables, when to produce jt and how much to produce jP . The contribution to the NPV from this decision at jt will be
( )1 1NPV ( , , , ) jtj j j j j jt P t P cP K e ρ−
− −Δ = − + +
( )( ) ( )( )11
ˆ ˆmin ,max 0, /j jt t tj j jr P Dt P e D e eρ ρ ρ ρ−− − ′−
−+ − + − , (6.14)
where ( )( )1 1
ˆmax ,min , /j j jt t t P− −′ = D . The terms are explained as
follows. Production costs account for a negative contribution to the NPV by ( ) jt
jcP K e ρ−− + . The term ( )( )1ˆmin ,max 0, jt
j j jr P Dt P e ρ−−− is the
contribution from when there is a backlog ( )1ˆmax 0, j jDt P −− just before
jt to be satisfied by the replenishment jP . If jP does not suffice to cover the whole backlog, the revenue contribution to the NPV will be
jtjr P e ρ− , otherwise ( )1
ˆmax 0, jtj jr Dt P e ρ−
−− . The term
80

( 1ˆ /jt tD e eρ ρ ) ρ−− ′−− accounts for the revenue contribution to the NPV
from current sales between 1jt − and t′ , the latter time being when a new backlog is incurred. The time t′ is at least 1jt − and at most jt and
depends on the state ( )1 1,j jt P− − . Introducing 1( , )j j jW t P+ as the contribution to the NPV from stage (j + 1) and onwards, when optimal succeeding decisions are chosen based on the state ( ),j jt P , we have the recursive optimisation problem to
maximise 1 1 1NPV ( , , , ) ( , )j j j j j j j jt P t P W t P− − +Δ + by a suitable choice of jt and jP :
( )1 1 1 1 1 1,( , ) max NPV ( , , , ) ( , )
j jj j j j j j j j j j j jt P
W t P t P t P W t P P− − − − + −= Δ + + . (6.15)
The pair of decisions ( ),j jt P together with the old state ( )1 1,j jt P− −
determines the new state ( ) ( )1, ,j j j jt P t P P−= + j . Let us now introduce capacity constraints into this problem including a fixed lead time τ . Let C(t) be available capacity of one resource required in the amount of h′′ per item unit and time unit during the lead time. A completion of jP units at time jt will therefore require the availability
of jh P′′ units of capacity per time unit during the interval [ jt τ− , jt ]. The condition on jP from capacity limitations will then be ( )jh P C t′′ ≤ for j jt t tτ− < ≤ . However, if the lead time τ is sufficiently long (or the completion times short apart), there might have been one or more other earlier set-ups during the interval [ jt τ− , jt ] also requiring capacity. Then the limitations on the choice of jP will be more restrictive and need take into consideration earlier capacity commitments. In order to determine the state at jt , prior to the decision jP , the history of the
81

production decisions (including their timing) during the lead time need to be included. In the discrete time case treated in Chapter 5, a matrix −Q 1j was introduced to represent the state immediately prior to the jth production decision. This matrix (in our current one-item example, a row vector) was defined as the sequence of the τ preceding cumulative production levels 1 1, , ...,j j j jP P Pτ τ− − − + −⎡= ⎣Q 1 ⎤⎦ . In Chapter 5, the maximum of all lead times τ was used for the definition, but with only one item considered in this example, the maximum will be the single lead time τ . The transition from state −Q 1j to state Q could then conveniently be written:
j
1
1 1
columns
squarematrix ( )
0 0 ... 01 0 ... 0
, ,..., 0,0,...,....
0 1 0j
j j j j jP P P Pτ τ
τ
τ τ
−
− − + −
×
⎡ ⎤⎢ ⎥⎢ ⎥⎡ ⎤ ⎡= +⎣ ⎦ ⎣⎢ ⎥⎢ ⎥⎢ ⎥⎣ ⎦
Q
Q ⎤⎦ , (6.16)
where the post-multiplication by the (τ τ× )-the columns in −Q 1j one step to the left, discarding the left-most column and emptying the right-most column to be filled with jP in the summation. In the current continuous time case, the description of a state transition will be more involved, since there is not necessarily the same number of earlier decisions to account for during the given lead time for different transitions. Some decisions, on occasion, might be closer in time than at other times. However, a list of the cumulative production vectors representing decisions during the interval τ will always suffice. Due to the fixed set-up cost K, there can never be an infinite number of optimum production decisions within any finite time interval. Therefore, by choosing a sufficiently large but finite number of earlier cumulative production vectors as the state description, this will suffice for our purposes, and the transition between states may be written:
n
82

1
ˆ ˆ 1 1
ˆ columns
ˆ ˆsquarematrix ( )
0 0 ... 01 0 ... 0
, ,..., 0,0,...,....
0 1 0j
j j n j n j j
n
n n
P P P P−
− − + −
×
⎡ ⎤⎢ ⎥⎢ ⎥⎡ ⎤ ⎡= +⎣ ⎦ ⎣⎢ ⎥⎢ ⎥⎢ ⎥⎣ ⎦
Q
Q ⎤⎦ . (6.17)
The information about the timing of each kP , i. e. , may also be included in
kt
jQ . A simple method for this purpose would be to add an
extra component to each kt kP in jQ . The possible variable costs of capacity utilisation, with the interpretation that capacity is used during the lead time τ , are considered to incur a
contribution to the NPV at stage j by ˆ ( 1) jt
jw e P e
ρτρ
ρ−−
− . The
contribution to the NPV from decisions at stage j will then be
( )1 ˆNPV ( , , ) ( ( 1) / ) jtj j j j jt P c w e P K e ρρτ ρ −
−Δ = − + − +Q +
( )( ) ( )( )11
ˆ ˆmin ,max 0, / ,j jt t tj j jr P Dt P e D e eρ ρ ρ ρ−− − ′−
−+ − + − (6.18)
and the recursive optimisation problem
( )1 1,( ) max NPV ( , , ) ( )
j jj j j j j j j jt P
W t P− −= Δ +Q Q 1W + Q . (6.19)
Furthermore, without loss of generality, we may choose cumulative production jP , including timing jt , rather than jP (and jt ), as decision
variables, since jP and the state 1jP − would then define the decision. This shortens our argument notation somewhat:
( )1 1ˆNPV ( , ) ( ( 1) / )( ) jtj j j j jP c w e P P K e ρρτ ρ −
− −Δ = − + − − +Q
( )( ) ( )( )11 1
ˆ ˆmin ,max 0, /j jt t tj j j jr P P Dt P e D e eρ ρ ρ ρ−− − ′−
− −+ − − + − ,
83

( )1 1( ) max NPV ( , ) ( )j
j j j j j j jPW P− −= Δ +Q Q 1W + Q , (6.20)
where the maximisation is subject to the capacity constraint for t in the
interval j jt t tτ− < ≤ , i.e. ( )( )11£ 1 /s
j jh e P P s C tτ−−
⎡ ⎤′′ − − ≤⎢ ⎥⎣ ⎦( ) . Finally,
we introduce internal (dependent) demand into this introductory example. Let there be requirements of a second item, which is a sub-component, amounting to jh P′ , when jP is the end item planned to be completed at
jt . The timing of this requirement is at jt τ τ− − . Available inventory of this second item must be non-negative throughout. This requires knowledge about available inventory of this second item immediately prior to jt τ τ− − . Thus available inventory, which is given by cumulative production of the component and cumulative earlier production of the end item generating internal demand (and also possibly initial available inventory), will need to be added to the state description. However, we are now leaving the one-item example and proceeding into the general multi-item case of the next section. 6.4 Multi-Item Case with Deterministic External
Demand and Given Capacity Limits Turning to the general deterministic continuous-time case, the objective function is written
( ) ( )( )NPV ( ) /s
s sρ=
⎡ ⎤′′= − − + − +⎣ ⎦r D B c wH τ I P Kν , (6.21)
where r, c, w and K are row vectors capturing economic consequences in the form of external item sales prices, unit production costs, unit variable capacity costs per time unit and set-up costs for batches of each item. D, B, P and are column vectors for external demand, backlogs, production and set-ups and
ν′′H is the input matrix for capacity
requirements and the lead time matrix, the latter having τ ise τ as its
84

diagonal elements and zeros elsewhere. The production and cumulative production vectors may be written
1
jn
stj
je−
=
= ∑P P , 1
/jn
stj
je s−
=
= ∑P P , (6.22)
and the set-up vector
1
jn
stj
je−
=
= ∑ν ν . (6.23)
The timing jt is interpreted to cover any production completion at jt and items that are not relevant at that time will have zero components in their position in . Similarly, the set-up vector jP jν will contain a unit value for an item completed at time jt and zeros elsewhere. The available inventory and capacity constraints for the whole process are
1 (0) ( )£ 0s
− ⎧ ⎫′+ −≥⎨ ⎬
⎩ ⎭
R I H τ P, (6.24)
where R(0) is the vector of initial available inventory and ′H the input matrix for component requirements, and
1 ( ( ) ) ( )£ ( ) s sss
− ⎧ ⎫′′ −− ≥⎨ ⎬
⎩ ⎭
H τ I PC 0 , (6.25)
where ( )sC is the resource vector of available capacity. In order to apply dynamic programming, at stage j we need to determine the contribution to the NPV from the current decision jP (or,
equivalently, jP ) when given the state 1j−Q just prior to jt ,
1NPV ( , )j j jP−Δ Q , where 1j−Q is a matrix of previous cumulative n
85

production vectors 1j−P , 2j−P , ... , ˆj n−P , and where is sufficiently large to capture all production decisions that could have taken place during the longest lead time
n
ˆ max iiτ τ= . The revenue (and backlog)
consequences need to be split up into their respective contributions to the NPV at the particular stage, whereas the contributions from production costs, capacity costs and set-up costs are obtained in an immediate straightforward way. As in our introductory example, the recursive optimisation for each stage will be given by
( )1 1( ) max NPV ( , ) ( )j
j j j j j j jPW P− −= Δ +Q Q 1W + Q , (6.26)
where the decision jP must satisfy conditions (6.24)-(6.25).
6.5 Numerical Examples To calculate these examples we have made use of the Swedish National Super Computer. A program was written in C++. 6.5.1 Two-level Serial Product Structure. In our first example, the product structure is given by Figure 6.1 A X2*
Figure 6.1 Two-level serial product structure. The parameters are assumed to have values according to Table 6.1.
86

Planning horizon (time periods) T 10 Lead time of A Aτ . 2Interest continuous rate ρ 0.05Demand rate AD 3Sales revenue Ar 500Set-up costs AK 70Unit production costs Ac 100Variable capacity cost per time unit Xw 20Variable product capacity costs per time unit Aw 40
Table 6.1. Parameter values for one product case.
Cumulative production 4 5 9 10 14 15 19 20Production time 2.1 3.1 4.1 5.1 6.1 7.1 8.1 9.1
Table 6.2. Results from example with constant demand AD =3 and
constant capacity CX = 10. Optimum number of batches= 8. Resulting NPV= 3799.03.
Cumulative production 5 7 12 14 15 21 22 26Production time 2.1 3.1 4.1 5.1 6.1 7.1 8.1 9.1
Table 6.3. Results from example with constant demand AD =3 and
constant capacity CX = 15. Optimum number of batches= 8. Resulting NPV= 4845.18.
87

Cumulative production 7 10 17 20 27 30Production time 2.1 3.3 5.3 6.6 9 10
Table 6.4. Results from example with constant demand AD =3 and
constant capacity CX = 20. Optimum number of batches = 6. Resulting NPV=5573.40.
Demand Available capacity CX NPV Ratio = NPV/ CX
10 3799.03 379.9015 4845.18 323.01
Constant DA=3 20 5573.40 278.67
Table 6.5. Ratio of NPV and available capacity of two-level serial product
structure. . 6.5.2 Three-level Product Structure The lead time of A and B are assumed to be 1, 2A Bτ τ= = , and the product structure given as in Figure 6.2.
X 2*
A
B
X1*
1* X
Figure 6.2. Three-level product structure
88

Planning horizon (time periods) T 10 Initial available inventory , A0R B0R 0, 6Interest rate ρ per time period 0.05Sales revenue Ar 1000Set-up costs AK , BK 80, 50Unit production costs , Ac Bc 100, 70Variable capacity cost per time unit Xw 20Variable capacity cost produced per time Unit A Bˆ ˆ,w w 40, 20
Table 6.6. Parameter values for the three-level product structure.
Item
A Cumulative production 4 6 8 11 14 16 18 22 24 Production time 1.1 2.1 3.1 4.1 5.1 6.1 7.1 8.1 9.1
B Cumulative production 2 6 8 10 12 16 18 Production time 2.1 3.1 4.1 5.1 6.1 7.1 8.1
Table 6.7. Results from example with constant demand AD =3 and
constant capacity CX = 10. Optimum number of batches of A = 9, and of B = 7. Resulting NPV=12449.94.
Item
A Cumulative production 6 8 12 15 18 22 27 30 Production time 1.5 3.1 4.1 5.1 6.3 8.0 9.0 10
B Cumulative production 3 7 10 16 19 21 24 Production time 2.1 3.1 4.1 5.3 7.0 8.0 9.0
Table 6.8. Results from example with constant demand AD =3 and
constant capacity CX = 15. Optimum number of batches of A = 8 and of B = 7. Resulting NPV=14718.63.
89

Item A Cumulative production 6 10 16 21 24 30 Production time 1.5 3.3 5 6 8 10
B Cumulative production 7 10 15 18 24 Production time 2.3 4 5 7 9
Table 6.9. Results from example with constant demand AD =3 and
constant capacity CX = 20. Optimum number of batches of A = 6 and of B = 5. Resulting NPV=14903.58.
Demand Available capacity CX NPV Ratio = NPV/ CX
10 12449.94 1244.9915 14718.63 981.24
Constant DA=3 20 14903.58 745.18
Table 6.10. Ratio of NPV and available capacity of three-level product
structure.
6.6 Summary When applying dynamic programming to the non-zero lead time capacitated lot-sizing problem in continuous time, the complexity of the states increase enormously. In Section 6.3 and Section 6.4, the theoretical analysis is introduced when choosing an appropriate definition of the state space. In the continuous time case, there is not necessarily the same number of earlier decisions to account for during the given lead time for different transitions. Due to the fixed set-up cost K, there also can never be an infinite number of optimum production decisions within any finite time interval. Therefore, by choosing a sufficiently large but finite number of earlier cumulative production vectors as the state description, this will suffice for our purposes, and the transition between states may be written as matrix
n
1j−Q in a similar way as in Chapter 5.
90

But from a numerical perspective, the volume of computations and associated memory requirements has increased substantially. Therefore, we have been forced to examine only very limited structures as in Section 6.4.1 (two-level) and Section 6.4.2 (three-level). In both structures, the three cases chosen have all given solutions the relation between NPV and capacity is close to linear, but with a small degressive element showing "diminishing returns to scale" (Table 6.5, Table 6.10 and Figure 6.3).
10 12 14 16 18 20100
200
300
400
500
600
700
800
900
1000
1100
1200
1300
Two-level product structure
Three-level product structure
Ratio of NPV and Capacity
Capacity
Figure 6.3. NPV over Capacity as Functions of Capacity.
91

92

7 CAPACITY-CONSTRAINED PRODUCTION-INVENTORY SYSTEMS WITH NON-ZERO LEAD TIMES IN CONTINUOUS TIME AND WITH STOCHASTIC DEMAND
We now finalise our attempt to find amounts to produce of each item in a multi-level/multi-stage capacity-constrained production-inventory system in the most general of the cases considered. Below we introduce stochastic external demand to the continuous time case. This is an extension of Chapter 6 by adding stochastic properties to external demand and it represents the thick-line triangle of Table 1.1. We are now turning to the most general, but also most complicated case, and our treatment will therefore be limited to an outline of the procedures involved, and no numerical examples will be provided. The model is based on the assumption that external demand is stochastic. An example treated in Grubbström (1996) concerned demand being a renewal process made up of stochastic events separated by independent stochastic time intervals with a common given probability density function. In this chapter we need to modify our dynamic programming procedure in order to propose a solution to the non-zero lead time problem. The objective is to choose the best production plan maximising the expected net present value of the total cash flow associated with production and demand. However, since the problem now is stochastic, the plan chosen will be an optimal plan as seen from the initial point of time. The decisions computed, are based on maximising the expected NPV from the events taking place later on, not yet known, before the horizon T is reached. Therefore, in a practical case, only the first decision in the plan would be realised, the remaining decisions being part of the strategy determined by the calculations. Which future decisions that will be taken will depend on the realisation of the demand process and the consequences this and previous decisions have on the state at each point in time.
93

Here, we continue applying the combination of Laplace transforms and Input-Output Analysis. 7.1 Objective Function and Constraints In the model developed here, stochastic demand events are assumed to take place as known processes in continuous time. We state the following expression for the expectation of the Net Present Value of the payments concerned. This follows the deterministic model in Chapter 6.
[ ]
1 1 1
1 0
1NPV
E ( ) ( ) E ( )
iiij
nN Mt
i ij i ij k k i iji j k
TNt T
i i i i ii t
ec P K w h P e
r D t B t e dt r B T e
ρτρ
ρ ρ
νρ
−
= = =
− −
= =
⎛ ⎞−′′= − + +⎜ ⎟⎝ ⎠
⎡ ⎤+ − −⎣ ⎦
∑ ∑ ∑
∑ ∫ =
( )( ) ( )( ) / Es
s sρ=
⎡ ⎤⎡ ⎤′′= − + − + + −⎣ ⎦⎣ ⎦c wH τ I P Kν r D B , (7.1)
where E[ ] is the expectation operator. The decision variables are the production vectors P which need be determined as a function of the state, and the setup vectors which are given, when the are given (roughly speaking, ). Equation (7.1) can be looked upon as the net present value consequence of a realisation of the process. The sequence of vectors , in general, will not have unique values at different points in time, since their realisation will depend on the prior stochastic development of the state. Instead, the optimal sequence will be proposed decisions to take as functions of what the state happens to be at a particular point in time.
ν Psgn( )=ν P
P
As before, there are two types of constraints involved in this problem. On the one hand, available inventory must be non-negative in order for the production plan to be feasible. For any realisation, this can be written
P
1 ( (0) ( ) ( ))£ ss
− ⎧ ⎫′+ −≥⎨
⎩ ⎭
R I H τ P 0⎬ , (7.2)
94

meaning that at least internal demand ′H τP always is satisfied. Secondly, there is the set of capacity constraints. The demand for capacity is always internal
{ }1 1( ( ) ) ( )£ ( ) £ ( ) ( ) ( ) 0s ss ss
− −⎧ ⎫′′ − ′′ ′− = −⎨ ⎬⎩ ⎭
H τ I PC C H τ Ps s ≥ , (7.3)
where ( )sτ is the original diagonal lead time matrix having ieρτ in its ith diagonal position, and where we have introduced the short notation
( ) ( ( ) ) /s s′ = −τ τ I s (7.4) for a modified diagonal lead time matrix ( )s′τ when assuming capacities to be used constantly throughout the lead time, rather than as impulses at the point of completion (as previously explained in Section 6.2). Our basic problem is to choose values of the components of including their timing properties , as functions of the state, such that the expectation of the future contribution to the objective function NPV in (7.1) is maximised subject to these two sets of constraints.
Pijt
7.2 Dynamic Programming Solution Procedure As our point of departure, we introduce the state Q(t) as a time dependent set of variables defining the current situation at each point in time. As yet, we have not specified what, or how much information that is contained in Q(t). In the deterministic case, earlier treated (Sections 5.2 and 6.3), we defined Q(t) to be a sequence of past cumulative production vectors, but this definition will not suffice in this stochastic setting. For the moment, we simply assume the existence of a Q(t) containing a sufficient amount of information, so that an optimal production decision P(t) (and ) can be taken when Q(t) is known. ( )tν
95

The state Q(t) will develop stochastically based on stochastic external demand D(t). The NPV function in (7.1) is an integral over time. It is therefore the sum of a set of contributions from intervals of the time scale. Consider a small interval [t, t + dt]. If the state, just prior to the decision at t, is Q(t), the contribution to the NPV may be written
NPV( ( ), ( , ( )))t t tΔ Q P Q , (7.5) since it will depend on the state Q(t) and on the current decision P(t), which at t is to be chosen optimally as a function of t and Q(t), hence the notation P(t, Q(t)) for the second argument of NPVΔ . As a result of the decision P(t, Q(t)), Q(t) will change to Q(t+dt), but this new state also depends on how stochastic demand develops. We therefore need to have probabilities available for the state transition from Q(t) to Q(t+dt). Let these probabilities be written
(( ), ( ), ( , ( ))t )p t t tQ q Q P Q (7.6) where q is one of the opportunities that the new state will take, when given the old state Q(t). These opportunities we collect in the set . If we now introduce ( )t dt+Q [ ]E NPV |t dt+ q for the expected contribution to the NPV from time (t + dt) onwards, if the new state is q and if the remaining sequence of decisions are taken optimally (knowing how they should be when given each future state), then the expected contribution to the NPV from t and onwards will be
NPV( ( ), ( , ( )))t t tΔ +Q P Q + ( ) [ ]( ),
( )
( ), ( , ( )) E NPV |tt dt
t dtp t t t d+∈ +∫∫∫ Q q
q
Q P Q q qQ
, (7.7)
96

where the triple integral symbolically represents taking the expectation of the maximum future NPV over all possible developments of the state during the interval [t, t + dt]. Finally, let us introduce the notation for the set of available decisions P(t) when the state at t, i.e. Q(t), is known, and when available inventory and capacity constraints are taken into account appropriately. The problem at t is thus to choose an optimal P(t) from the set .
( ( ))tQP
( ( ))tQP Hence, the recursive equation governing this optimisation, may be written
[ ]E NPV | ( )t t =Q
= + ( , ( )) ( ( ))
max NPV( ( ), ( , ( )))t t t
t t t∈
⎡Δ⎢
⎣P Q QQ P Q
P
+ ( ) [ ]( ),( )
( ), ( , ( )) E NPV |tt dt
p t t t +∈ +
⎤t dt d ⎥
⎥⎦∫∫∫ Q q
q
Q P Q q qQ
. (7.8)
This is a differential equation determining the development of
[ ]E NPV | ( )t tQ . If, for instance, the value of [ ]E NPV | ( )T TQ is known to be zero (since the process has ended there), in principle, the whole development of [ ]E NPV | ( )t tQ going backwards from T to t = 0 is given by the equation. 7.3 Interpretation of the State and Other Entities The immediate consequences from taking a decision P(t) at t as regards production, are easily found to be
production1 1
1NPV ( ) ( )iN M
ti i i k k i i
i k
eK t c w h P t e dρτ
ρνρ
−
= =
⎛ ⎞⎛ ⎞−′′Δ = − + +⎜ ⎟⎜ ⎟⎜ ⎟⎝ ⎠⎝ ⎠∑ ∑ t , (7.9)
97
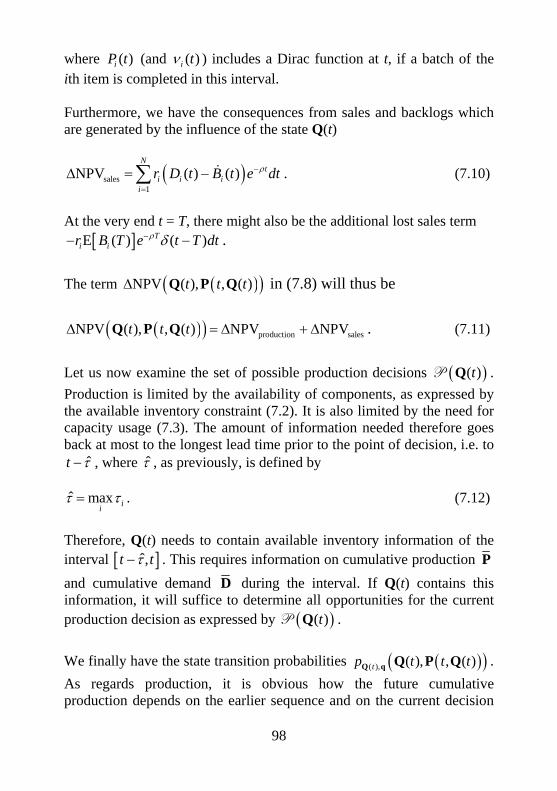
where (and ( )iP t ( )i tν ) includes a Dirac function at t, if a batch of the ith item is completed in this interval. Furthermore, we have the consequences from sales and backlogs which are generated by the influence of the state Q(t)
( )sales1
NPV ( ) ( )N
ti i i
ir D t B t e dtρ−
=
Δ = −∑ . (7.10)
At the very end t = T, there might also be the additional lost sales term
[ ]E ( ) ( )Ti ir B T e t T dtρ δ−− − .
The term ( )( )NPV ( ), , ( )t t tΔ Q P Q in (7.8) will thus be
( )( ) production salesNPV ( ), , ( ) NPV NPVt t tΔ = Δ +Q P Q Δ . (7.11) Let us now examine the set of possible production decisions ( )( )tQP . Production is limited by the availability of components, as expressed by the available inventory constraint (7.2). It is also limited by the need for capacity usage (7.3). The amount of information needed therefore goes back at most to the longest lead time prior to the point of decision, i.e. to
ˆt τ− , where τ , as previously, is defined by ˆ max ii
τ τ= . (7.12)
Therefore, Q(t) needs to contain available inventory information of the interval [ ]ˆ,t tτ− . This requires information on cumulative production P and cumulative demand D during the interval. If Q(t) contains this information, it will suffice to determine all opportunities for the current production decision as expressed by ( )( )tQP . We finally have the state transition probabilities ( )( )( ), ( ), , ( )tp t t tQ q Q P Q . As regards production, it is obvious how the future cumulative production depends on the earlier sequence and on the current decision
98

(in the same way as in Chapters 5 and 6). Only specific combinations will provide an opportunity for a positive probability. However, as regards demand, the transition is dependent on what new demand that appears at t. The transition probabilities must therefore be computed from properties of the demand process. The opportunities for Q(t) to take on new values q in ( )t dt+Q , are also expressed by these considerations. 7.4 Summary In this chapter we have attempted to extend our previous theory to the case of stochastic demand, when the processes take place within a continuous time framework and lead times are non zero. Our treatment has resulted in an outline for such a development, but it is clear that the theory has become so very complex and that the investigation is far from complete. In particular, the concept of the state Q in this stochastic situation needs a substantial amount of additional careful attention.
99

100

8 CAPACITY CONSTRAINTS IN A PAPER MILL (BILLERUD SKÄRBLACKA AB)
8.1 Introduction Skärblacka AB is one of four paper mills of the Billerud company. It is located in Skärblacka, Norrköping, Sweden. The mill was originally built in 1872, but the foundations for the modern mill were laid in the early 1960s. Today the mill comprises three pulp lines, four paper machines and a drying machine for market pulp. Production is focused on brown sack paper, white MG paper, and fluting. Having a large production capacity, the mill consumes huge resources of
Wood: 3900 m3/24h Oil: 68 m3/24h Electricity 1200 MWh/24h Water 75000 m3/24h Truck loads 104/24h
In Table 8.1 is shown the production capacity of the mill in 2004.
Product Quantity (tons)Sack Kraft paper MG Kraft paper Fluting Market pulp
150 000 88 000 90 000 80 000
Number of employees 720
Table 8.1. The production capacity of Billerud Skärblacka AB (2004) The company buys materials from the suppliers of wood. When the logs reach the mill they enter into the wood room. The bark is removed in a rotating drum. Then the logs are cut into chips and the chips are stored in
101

large silos or piles. The bark is used as fuel. The chips are then sent to a digester. In the pulp cooking process, the cellulose fibres in the wood chips must be parted from each other carefully. This takes place by cooking the chips under pressure together with chemicals. The cooking liquid, or white liquor, becomes black during this process. Around half of the wood becomes pulp. The remainder is dissolved in the black liquor and is used as biofuel in a recovery boiler. During subsequent washing and screening stages, the black liquor and chips that have not dissolved in the pulp are washed and screened in several stages to ensure that no impurities remain. The pulp then continues either to a bleaching station or straight to a paper machine if the product is unbleached. Bleaching is a process that produces a cleaner, whiter and more durable pulp. The process takes place in several stages and the chemicals used are oxygen, chlorine dioxide, hydrogen peroxide and caustic soda. The bleached cellulose fibres are now ready to become white paper. The cooking liquid, or black liquor, is first dried, and then burnt in the recovery boiler. This produces heat for creating steam and electricity, during which the chemicals form a solution at the bottom of the boiler. This solution is dissolved in water to produce green liquor. The green liquor is treated with lime and converted into new cooking liquor (white liquor), which can be returned to the pulp digester. This circulation of chemicals in different eco cycles is a key element in the environmental impact as well as for the economy of the mill as a whole. During paper production stages, cellulose fibres are mixed with water and chemicals, and ground together. This mixture (“stock”), is poured onto the wire of the paper machine where it forms a paper web. The web is then led through the paper machine through a system of filters and rollers, where the paper is dewatered, pressed and dried. At the end of the machine, the paper is wound onto massive reels.
102

Wood Room
Sawmill chips, Softwood, Hardwood
PM 9 Sack Paper
PM 4 Fluting
Sulphate cooking 2
Washing
ScreeningReject Handling
Sulphate cooking 1
Washing
Screening
Oxygen Bleaching
Washing
Final Bleaching
Reject from Screening
PM 8 MG Kraft
TM 1 Bleached Pulp
PM 7 MG Kraft
Washing
Semi-chemical Pulp Cooking
Washing
Defibration
Bought Fibre
Figure 8.1. The production flowchart of Billerud Skärblacka AB.
PM 8, PM 7, PM 9, PM 4 are paper machines, and TM 1 is a drying machine for market pulp.
Depending on customer demand, some of the paper is coated in special coating machines. By adding a thin coat of white colouring, the paper becomes smoother and better sealed and thus easier to print on.
103

Winding and packaging are the finishing stages. In the winding stage, the large paper reels (popes) are cut into smaller sizes, and in the packaging stage they are packed to protect the products during storage and transport to the customers. In addition to measures carried out inside the mill to reduce emissions from the various production stages, waste water is also treated externally. The wastewater first enters sedimentation ponds, where particles (mainly wood fibres) are separated from the water. Then the water is treated in a biological process, in which micro organisms break down pollutants. 8.2 Production Planning and Capacity Constraint
Problems. At the mill, production takes place 24 hours a day, every day of the year. Machinery and environmental protection equipment are fine-tuned continuously to meet requirements concerning product quality and the environment. There are several constraints in the mill. Here, we shall focus mainly on production capacity constraints. The pulp cooking equipment always runs at 100% capacity. With a wide range of paper products, the production planner copes with several set-up selections at the bleaching stage and at paper machines. Depending on customers’ demand, there are several different kinds of products according to bleaching grade and extensible (cf Table 8.2) grades. The product must be designed to fulfil the requirements of a multitude of industries, materials, filling machines, climatic conditions and market exposure. The sack paper, for instance, is classified according to some special indices such as Table 8.2 indicates. The fact that capacities are fully utilised corresponds to strict equalities in the relevant rows of the capacity constraint inequalities (such as in (6.3)):
{ }1£ ( ) ( ) ( )s s s− ′−C H τ P 0≥ . (8.1)
104

White and Brown grades
Stretch MD
TEA index geom.
Tear index geom.
Printability Runability at converting
Stiffness at filling
Natural grades
White Performance N •• ••• •••• •• ••••• •••••
Brown Performance N •• ••• •••• • ••••• •••••
White NK •• ••• •••• •• ••••• •••••
Duo white •• • •• ••• •••• ••••
Triple white •• • •• ••• •••• ••••
Print •• •• • •••• ••• •••
GlossPrint • • • ••••• •• ••
Semi-extensible grades
White Performance SE •••• ••••• •••• •• •••• ••••
Brown Performance SE •••• ••••• •••• • •••• ••••
White SQ •••• •••• •••• •• •••• ••••
White XZ •••• •••• •••• •• •••• ••••
Table 8.2. Characteristics of sack paper for open mouth sacks.
Explanations to Terminology used in Table 8.2
Bendtsen ml/min: A measure of surface roughness. Roughness significantly affects the printing quality, lamination and other demanding surface treatment Porosity/air resistance, Gurley seconds: Air resistance is a measurement of the time taken for 100ml of air, under constant pressure, to pass through a specified area of a paper sheet. Short time signifies a highly porous paper. TEA (Tensile Energy Absorption), J/m2: the most important sack paper strength property. This is verified by the correlation between TEA and drop tests. When a sack is dropped, the contents will move when hitting the floor. This movement causes strain on the sack wall. To withstand this strain, the TEA should be high. The energy will then be absorbed by a combination of the tensile strength and the stretch in the paper. Tensile strength, kN/m: The tensile strength is the maximum force that the paper is able to withstand without breaking. Tensile strength is one parameter in the measurement of TEA. Stretch, %: the elongation of the paper extended to rupture.
105

Production in these paper machines is planned depending on customer orders every week (short-term planning) with the aim to minimise the inventory of finish products. In the production planning department, there are two main factors taken into account, in order to hold production cost down.
0
50
100
150
200
250
300
350
Jan Feb Mar Apr May June July Aug Sep Oct Nov Dec
Tons
PM 9PM 8PM 7PM 4
Figure 8.2. Loss of paper quantity due to setup time.
0
5
10
15
20
25
30
Jan Feb Mar Apr May June July Aug Sep Oct Nov Dec
Hours
PM 9PM 8PM 7PM 4
Figure 8.3. Loss of machine time due to setup time.
106

On the one hand, there are setup costs due to setup times. When changing from one kind of product to another kind, there is always some loss at the setup stage. Therefore, to lower the production losses (shown in Figures 8.2 and 8.3), the production planner aims at minimising the frequency of setup changes. Apart from these consequences, there are trimming losses. During the packing stage, this type of loss is incurred, when the orders do not match the pope’s dimension, for instance as illustrated in Figure 8.4. The planner tries several different combinations until he is satisfied with the resulting smaller loss.
lossloss
Order A Order B
Figure 8.4. Pope Cutting. The average total loss per annum because of setup and packing at machines PM 7, PM 8, PM 9 is shown in Table 8.3.
Loss at
setup (tons)Loss at
packing (tons) Total Loss percentage
(%)
PM 7 2842.2 3041.6 5883.8 11.2
PM 8 1813.2 2519.3 4332.5 9.0
PM9 1270.1 1506.9 2777.0 9.6
Table 8.3. Average total loss per annum in paper machines PM7, PM8, PM9.
107

The company always attempts to satisfy all customer demand. In the short term, sometimes the demand is higher than production capacity. The sales department must discuss with customers before accepting an order. The production planning department has to make sure that all machines run as close to 100% capacity as possible. Following the main production flow, various capacity limitations are revealed:
• The storage space for wood is limited. As a total, it is possible to store 80,000 cubic metres of wood, which are distributed according to round timber, purchased chips, and chips made from round timber, which then are stored in chip silos. The normal volume of wood is around 50 % of this maximum limitation. As a whole, around 1,500,000 cubic metres of wood is consumed per annum. Hence, the maximum storage corresponds to approximately three weeks’ requirements and the normal storage to some 1.5 weeks’ requirements. The main limitations are due to the area of the wood yard and to the size of the chip silos.
• In the wood room, there are essentially no capacity limitations.
This stage is currently run according to a continuous two-shift schedule. Occasionally, when running during a third night shift, the noise level of this stage could limit capacity according to environmental regulations. Currently, there is no need for a night shift.
• Externally purchased chemicals, energy, water and other factor
inputs are never envisaged as subject to limitations.
• The sulphate cooking process is basically a chemical/energy process, which affects the succeeding production stages. If this process shows a lower performance, it will have an immediate effect on the maximum capacity of the paper machines, since both energy (steam) and the fibre raw materials are produced in the sulphate process. Reasons for a lower performance would be related to occasional technical problems, such as sedimentation,
108

breakdown, or similar disturbances. On occasion, the sulphate cooking stage needs to be run at a reduced rate due to environmental considerations, for instance if the threshold values for emissions have been reached.
• In the paper machines, the number of different products
(according to different recipes and grammage (basis weight) are around 50 per machine. On top of this, there are the dimensions of width, diameter and reel, which make the diversification extremely large. The latter kind of customisation takes place at the packing stage where the popes are cut, and this only indirectly affects the paper machines. The winding machine might limit the overall capacity, when the frequency of changes in paper variants becomes high. Then, this might also create a storage limitation for the popes between the paper machine and the winding machine. Such an occurrence, however, is extremely rare.
• In the vast majority of cases, a certain product variant will only
be manufactured in a predefined paper machine. There are rare exceptions, when an order might be run in either of two paper machines, but these cases are negligible.
• The storage space of the end product inventory is limited. For
sack paper, the area is around 2,700 square metres and for white MG paper around 3,500 square metres. The internal transportation service within the end product inventory (using fork trucks) also has a limited capacity. This service unit is common for all types of products. If the storage area becomes over full, there are options to rent additional storage space, for instance in the harbour of Norrköping, or elsewhere.
• A final capacity limitation concerns the delivery services from
the mill. These take place either by rail, or by truck.
109

8.3 Some Observations and Suggestions
When having investigated the types of capacity constraints occurring in practice in a paper mill, they may be classified into essentially two categories:
• Limitations in the production process, constraining the flow of products per time unit,
• Limitations in storage facilities, constraining the volume of available inventory.
In our theory developed in previous chapters, only the former type of restriction has been applied when solving related problems. Therefore, there appears to be a need for adding opportunities for additional constraints in the form of upper bounds for inventory. This may relatively easily be done by introducing supplementary inequalities of the type:
{ }1£ t− ≤ RR C ( ) , (8.2)
where (t) captures the upper limitations for available inventory over time.
RC
Furthermore, it appears essential to develop the theory in the direction of including setup times. These times have been neglected earlier, and their existence has only had an indirect effect through the economic parameters by which a setup cost would be subtracted from the NPV at the time of a setup, i.e. by ( ) tt e ρ−Kν , where K is the row vector of setup costs and the setup vector at time t (a column vector). Hence, the relation between and available capacity C(t) need be investigated further.
( )tν( )tν
In the practical choices made available to the production planning department, little attention is given to the economic and monetary consequences of which operational decisions that are taken. Behind the
110

vast majority of decisions, attention is directed mainly towards volume consequences, rather than economic consequences. The quantity of damaged and useless paper is in the forefront of awareness. From our theoretical point of departure, one might wish to estimate the value of losses more accurately. Due to the multiplicity of products having different prices, the quantity measure alone would not reflect the loss accurately. Also, there are products that make a higher profit than others, such as medical paper. Should priorities be given to the high-profit grades when forming the product plan? A similar observation might be made concerning the competition of storage space among different products. In general, it might be suggested that more attention might be given to monetary consequences of operational decisions concerning capacity utilisation.
111

112

9 CONCLUSIONS AND SUGGESTIONS FOR FURTHER STUDIES
The aim of this dissertation has been to provide suggestions for stating and solving the capacitated multi-level multi-period production planning problem. In this final chapter, we summarise our results from Chapter 1 to Chapter 8. We also suggest some further research directions. All through our developments, we have relied upon the scientific base of MRP theory, involving the combination of Input-Output Analysis and Laplace transforms. 9.1 Summary and Conclusions Throughout the dissertation, we have employed the Laplace transform (or z-transform) and Input-Output Analysis as tools for applying MRP theory to the capacitated problems we have formulated. In essentially all cases, the Net Present Value has been stated as the objective to maximise. This choice has been based on the opinion argued in several articles that such an approach must be superior to traditional average cost considerations, the latter overwhelmingly appearing in earlier literature. In Chapter 3, we analysed the previously developed fundamental equations (available inventory, total inventory and backlogs) of MRP Theory, when the basic ordering policies Lot-For-Lot (L4L), Fixed Order Quantity (FOQ) and Fixed Period Requirements (FPR) were to be applied. Having presented a brief overview of the fundamental equations of MRP theory, this was followed by deriving the basic properties of the production plan for the three ordering policies in relation to this theory. For the L4L policy, we found an explicit closed-form Laplace transform expression for the time development of production, when given external demand, whereas for the other two policies, the results were more implicit. The optimal FOQ and optimal FPR were also determined for the case that external demand was stochastic. When leaving the L4L policy, it was shown that relevant expressions are possible to derive, but they become considerably more complicated.
113

All through Chapter 4 until Chapter 7, we have been treating capacitated multi-level, multi-stage production planning problems. In Chapter 4, a four-procedure heuristic method was suggested for the non-zero lead time problem in the discrete-time framework. Numerical examples illustrated how the NPV increases, when available capacity was allowed to increase. However, the increase took place with a small degressive element showing "diminishing returns to scale". This phenomenon repeated itself in the numerical examples treated in subsequent chapters. Instead of using a heuristic, in the three chapters following, a dynamic programming procedure was applied in order to find the optimal solution of the capacitated multi-level multi-stage production planning problem. This development followed the diagram depicted in Table 1.1. In Chapter 5, the model treated concerned external demand being deterministic in a discrete time setting. In order to apply dynamic programming, we formulated the state confronting decisions in each period to be a set of historical vectors of cumulative production, which were collected in matrices , collecting the necessary information for taking optimal future decisions. The array Q in period n, i.e. , was then defined as a sequence of
QnQ
τ previous cumulative production vectors where τ was the maximum of all production lead times. In the continuous-time model of Chapter 6 instead, there was not necessarily the same number of earlier decisions to account for during the given maximum lead time for different transitions. Some decisions, on occasion, might be closer in time than at other times. However, a list of the cumulative production vectors representing decisions during the maximum interval τ would always suffice for providing the necessary amount of information. By choosing a sufficiently large but finite number of earlier cumulative production vectors as the state description, according to our findings, this would suffice for our purposes.
n
In Chapter 7, we have made an attempt to extend our previous theory to the case of stochastic demand, when the processes take place within a continuous time framework and lead times are non-zero. There, we presented an outline for such a development. It was shown that the theory became increasingly complex. Our results from this investigation
114

cannot be considered other than far from complete. In particular, the concept of the state Q in this stochastic situation still will need a substantial amount of additional attention. When computing results from numerical examples in Chapters 5 and 6, the NPV was shown to behave as one might have expected intuitively, namely that there is a close to linear relation between available capacity and NPV. As mentioned above, this relation was perturbed by a small degressive element showing diminishing returns to scale. When introducing non-zero lead times into the capacitated lot-sizing problem, the complexity of the model has been shown to grow dramatically. The theoretical analysis was still manageable to cope with, when choosing an appropriate definition of the state space. We might therefore conclude that an embryo for the existence of a non-zero lead time extension of MRP theory in both discrete time and in continuous time has been established. Results from a study of capacity constraints in a paper mill were presented in Chapter 8. In the practical scenario, a great number of restrictions, many of which were possible to interpret as capacity constraints, proved to be present. The major capacity constraints could be classified into two categories: (i) limitations in the production process, constraining the flow of products per time unit, and (ii) limitations in storage facilities, constraining the volumes of available inventory, such as the limited area of the wood yard. We were also given attention to the importance of capacity losses due to setup frequency and trimming. These observations have also provided ideas for further theoretical extensions of MRP theory. 9.2 Suggestions for Further Studies Relaxing Assumptions During our theoretical developments, we have been forced to make assumptions of various kinds in order to keep complexity down for the sake of managing the problems treated. When addressing extensions of current theory, the first natural choice is to study consequences from
115

relaxing restrictions being based on assumptions. A few of these limitations are listed as follows: Non-Constant Lead Times Lead times have been considered constant throughout our developments. This is in line with Material Requirements Planning methodology from its start. However, in practical situations the true lead time is dependent on the current work load, i.e. on current capacity utilisation. Therefore, lead times also may be considered as consequences of the production plan, and not only the plan a consequence of the given lead times. The way in which this type of interaction takes place is yet to be analysed. Stochastic Elements in Lead Times Lead times are also subject to stochastic influences because of machine breakdowns etc. Extensions of the theory to possible variations in the lead time matrix τ , would be an interesting topic to develop. Variations in Bill-Of-Materials Also the given constant properties of the Bill-Of-Materials (the “technical coefficients”), captured in the various appearances of the matrix H, have been taken as a preset starting point, when stating the capacitated problem. Due to technical development in the longer run, or perturbations such as quality variation and scrap in the shorter run, the elements of H are not necessarily constant. Consequences of the uncertainty in H might be an item for further attention. Remanufacturing and Feedback An increasingly important feature in modern economies is the question of the reuse of resources, including remanufacturing and reprocessing, often called “reverse logistics”. When examining the physical flows involved in remanufacturing, there is a natural element of feedback. This corresponds to product structures with some ingredient disobeying the strict assembly type of product structure usually assumed in MRP. Consequences of non-triangular input matrices H constitute a further line of investigation. Here, we also might study pure disassembly structures, which come close to the arborescent type of product structure.
116

Setup Times The case study in Chapter 8 revealed that the finite setup times were of obvious significance, when taking operational decisions. Inclusion of setup times, and not only setup costs, is an item of additional interest. Storage Limitations Also this study showed, that capacities not only limited flows, but also stock. Developing consequences of upper limits for storage, etc., would comprise a natural extension to current MRP theory. Methodological Developments Although we have presented an outline for the case of stochastic external demand in Chapter 7, this treatment is evidently far from being conclusive. In particular, more attention is needed to investigate the properties of the state Q in this general case, as well as the description of how one state leads to a succeeding state and the stochastic properties of such transitions. Developing suitable numerical examples would be an important piece of work within this line of research.
117

118
REFERENCES Alain, G. (1999), A Primal-Dual Approach for Capacity-constrained Production Planning with Variable and Fixed Costs, Computer & Industrial Engineering, Vol. 37, 93-96. Albritton, M., Shapiro, A., and Spearman M. (2000), Solve the Problem with Two variants of Monte Carlo. Stochastic Programming E-Print Series. Andersson, L. E. and Grubbström, R. W. (1994), Asymptotic Behaviour of a Stochastic Multi-Period Inventory Process with Planned Production, Working Paper WP-210, Department of Production Economics, Linköping Institute of Technology. Aseltine, J. A. (1958), Transform Method in Linear System Analysis, McGraw-Hill, New York. Axsäter, S. and Rosling, K. (1994), Multi-Level Production-Inventory Control: Material Requirement Planning or Reorder Point Policies? European Journal of Operational Research, Vol. 75, 405-412. Axsäter, S., Schneeweiss Ch. and Silver E. (1986), Multi-Stage Production Planning and Inventory Control, Springer-Verlag, Berlin. Bagchi, U., Hayya, J.C. and Ord, J. K. (1983), The Hermite Distribution as a Model of Demand During Lead Time for Slow Moving Items, Decision Sciences, Vol. 14, 447-466. Barbarosoglu G. and Özdamar, L. (2000), Analysis of Solution Space-Dependent Performance of Simulated Annealing: the Case of the Multi-Level Capacitated Lot Sizing Problem, Computer & Operations Research Vol. 27, 895-903. Bogataj, M. (1999), Inventory Allocation and Customer Travelling Problem in Spatial Duopoly, International Journal of Production Economics, Vol. 59, 271-279.
119

Bogataj, M. and Bogataj, L. (2004), The Problems of Optimal Additional Investments in Reduction of Delays in Value Chain Analyzed in Frequency Domain, Informatizacija transportno logističnega grozda, (Mathematical economics, operational reseach and logistics), Serial no 4. University of Ljubljana: Faculty of Economics. Bonney, M. C. and Popplewell, K. (1988), Design of Production Control Systems: Choice of System Structure and Systems Implementation Sequence, Engineering Costs and Production Economics, Vol. 15, 169-173. Brander, P., Levén, E. and Segerstedt, A. (2005), Lot Sizes In a Capacity Constrained Facility – A Simulation Study of Stationary Stochastic Demand, International Journal of Production Economics, Vol. 93-94, 375-386. Buck, J. R. and Hill, T. W. (1971), Laplace transforms for the Economic Analysis of Deterministic Problems in Engineering, The Engineering Economist, Vol. 16, 247-263. Carlson, R. C., Jucker, J. V. and Kropp D. H. (1979), Less Nervous MRP Systems: A Dynamic Economic Lot-Sizing Approach, Management Science, Vol. 25, No 8, pp.129-146. Chen, J. C., Chen, C., Lin, C. J. and Rau, H. (2005), Capacity Planning with Capability for Multiple Semiconductor Manufacturing Fabs, Computer & Industrial Engineering, Vol. 38, 709-732. Choi, S. and Enns, S. T. (2004), Multi-Product Capacity-Constrained Lot-Sizing with Economic Objectives, International Journal of Production Economics, Vol. 91, 47-62. Churchill, R. V. (1958), Operational Mathematics, McGraw-Hill, New York. Churchill, R. V. (1960), Complex Variables and Applications, McGraw-Hill, New York.
120

Clark, A.R. (2003), Optimization Approximations for Capacity Constrained Material Requirements Planning, International Journal of Production Economics, Vol. 84, 115-131. Erol, M. (1999), Analysis of Production Planning in Case of the Random Demand, Computer & Industrial Engineering, Vol. 37, 21-25. Feller, W. (1960), An Introduction to Probability Theory and Its Applications, Vol. I, Second Edition, John Wiley & Sons, New York. Feller, W. (1971), An Introduction to Probability Theory and Its Applications, Vol. II, Second Edition, John Wiley & Sons, New York, p. 439. Foster, T. S. (2002), Material Requirements Planning Course. http://www.freequality.org/. França, P. M., Armentano, V. A., Berretta, R. E., and Clark, A.R. (1997). A Heuristic Method for Lot-Sizing In Multi-Stage Systems, Computers & Operations Research, Vol. 24, 861-874. Grubbström, R. W. (1967), On the Application of the Laplace Transform to Certain Economic Problems, Management Science, Vol. 13, 558-567. Grubbström, R. W. (1980), A Principle for Determining the Correct Capital Costs of Work-In-Progress and Inventory, International Journal of Production Research, Vol. 18, No 2, 259-271. Grubbström, R. W. (1991), A Closed-Form Expression for the Net Present Value of a Time-Power Cash Flow Function, Managerial and Decision Economics, Vol. 12, No 5, 305-316. Grubbström, R. W. (1996), Stochastic Properties of a Production-Inventory Process with Planned Production Using Transform Methodology, International Journal of Production Economics, Vol. 45, 407-419.
121

Grubbström, R. W. (1998a), A Net Present Value Approach to Safety Stocks in a Planned Production, International Journal of Production Economics, Vol. 56-57, 213-229. Grubbström, R. W. (1998b), The Fundamental Equations of MRP Theory in Discrete Time, Working Paper WP-254, Department of Production Economics, Linköping Institute of Technology, December. Grubbström, R. W. (1999a), A Net Present Value Approach to Safety Stocks in a Multi-Level MRP System, International Journal of Production Economics, Vol. 59, 361-375. Grubbström, R. W. (1999b), An Optimal Forward Dynamic Lot-sizing Policy for the NPV and Average Cost Cases in Continuous Time, in Hillery, M. T. and Lewis, H. J., (Eds), The 15th International Conference on Production Research . ICPR-15 Manufacturing for a Global Market, Limerick, Ireland, Vol. 1, 381-384. Grubbström, R. W. and Huynh, Th. (2002), The Stochastic Multi-Level/Multi-Stage Capacity-Constrained Production-Inventory System Extended with Non-Zero Lead Times, Paper presented at the Twelfth International Symposium on Inventories, Budapest, August 19-24. Working Paper WP-306, Dept of Production Economics, Linköping Institute of Technology. Grubbström, R. W. and Huynh, Th. (2005a), Extension of Multi-Level, Multi-Stage Capacity-Constrained Production-Inventory Systems with Non-Zero Lead Times to Continuous Time, Proceedings, 18th International Conference on Production Research, Salerno, Italy, 31st July-4th August, 2005. Grubbström, R. W. and Huynh, Th. (2005b), Analysis of Standard Ordering Policies within the Framework of MRP Theory, Proceedings, 18th International Conference on Production Research, Salerno, Italy, 31st July-4th August, 2005. International Journal of Production Research, forthcoming. Grubbström, R. W. and Huynh, Th. (2006). Multi-Level, Multi-Stage Capacity-Constrained Production-Inventory Systems in Discrete Time
122

with Non-Zero Lead Times using MRP Theory, International Journal of Production Economics, Vol. 101, 53-62. Grubbström, R. W. and Jiang, Y. (1990), A Survey and Analysis of the Application of the Laplace Transform to Present Value Problems, Revista di matematica per le scienze economiche e sociale, Vol. 12, 473-62. Grubbström, R. W. and Kingsman, B. G. (2004). Ordering and Inventory Policies for Step Changes in the Unit Item Cost: a Discounted Cash Flow Approach, Management Science, Vol. 50, pp. 253-267. Grubbström, R. W. and Lundquist, J. (1977), The Axsäter Integrated Production-Inventory Sytem Interpreted in Terms of the Theory of Relatively Closed Systems, Journal of Cybernetics, Vol. 7, 49-67. Grubbström, R. W., and Molinder, A. (1994), Further Theoretical Considerations on the Relationship Between MRP, Input-Output Analysis And Multi-Echelon Inventory Systems, International Journal of Production Economics, Vol. 35, 299-311. Grubbström, R. W., Ovrin, P. (1992), Intertemporal generalization of the relationship between material requirements planning and input-output analysis, International Journal of Production Economics, Vol. 26, 311-318. Grubbström, R. W., Tang, O. (1997), Early Writings Related to the Topics of MRP and Input-Output Analysis, in Bogataj, L., Grubbström, R. W. and Bogataj, M. (Eds), Input-Output Analysis and Laplace Transforms in Material Requirements Planning, Faculty of Maritime Studies and Transport, University of Ljubljana, Portoroz, Slovenia, 33-44. Grubbström, R. W., Tang, O. (2000), An overview of input-output analysis applied to production-inventory systems, Economic Systems Research, Vol. 12, 3-25. Grubbström, R. W. and Wang, Z. (1999), Introducing Capacity Limitations into Multi-Level, Multi-Stage Production-Inventory Systems
123

Applying the Input-Output/Laplace Transform Approach, in Hillery, M. T., Lewis, H. J., (Eds), The 15th International Conference on Production Research . ICPR-15 Manufacturing for a Global Market, Limerick, Ireland, August 9-13, 435-438. Grubbström, R. W. and Wang, Z. (2000a), Modelling capacity-constrained production-inventory systems: A Review, Pre-Prints, Proceedings of the Eleventh International Working Seminar on Production Economics, Igls/Innsbruck, Austria, Vol. 1, 95-105. Grubbström, R. W. and Wang, Z. (2000b), Introducing Capacity Limitations into Multi-Level, Multi-Stage Production-Inventory Systems Applying the Input Output/Laplace Transform Approach, International Journal of Production Research, Vol. 38, No 17, 4227-4234. Grubbström, R. W. and Wang, Z. (2003), A Stochastic Model of Multi-Level/Multi-Stage Capacity-Constrained Production-Inventory Systems, International Journal of Production Economics, Vol. 81-82, 483-494. Hadley, G. and Whitin, T. M. (1963), Analysis of Inventory Systems, Prentice-Hall, Englewood Cliffs. Horvat, L. and Bogataj, L. (1996), Game Theory Aspects of MRP, Input-Output and Multi-Echelon Inventory Systems, Pre-Prints, Ninth International Working Seminar on Production Economics, Vol. 3, Igls/Innsbruck, 1-12. Huynh, Th. (2006), Multi-Level, Multi-Stage Capacity-Constrained Production-Inventory Systems with Non-Zero Lead Times In Continuous Time and with Stochastic Demand, Pre-Prints, Fourteenth International Working Seminar on Production Economics, Vol. 4, Innsbruck. Iida, T. (2002), A Non-stationary Periodic Review Production-Inventory Model with Uncertain Production Capacity and Uncertain Demand, European Journal of Operational Research, Vol. 140, 670-683. Ip, W. H., Li., Y., Man, K. F., and Tang, K. S. (2000), Multi-Product Planning and Scheduling Using Genetic Algorithm Approach, Computer & Industrial Engineering, Vol. 38, 283-296.
124

Jodlbauer, H. (2004). An Approach for Integrated Scheduling and Lot-sizing, European Journal of Operational Research, in press. Jolayemi, J. K. and Olorunniwo, F. O. (2004), A Deterministic Model for Planning Production Quantities in a Multi-Plant, Multi-Warehouse Environment with Extensible Capacities, International Journal of Production Economics, Vol. 87, 99-113. Kern, G. M. and Wei, J. C. (1996), Master Production Rescheduling Policy in Capacity Constrained Just-In-time Make-To-Stock Environments, Decision Sciences, Vol. 27, No 2, 365-387. Lin, N. P. and Krajewski, L. J. (1992), A Model for Master Production Scheduling in Uncertain Environments, Decision Sciences, Vol. 23, 839-861. Maes, J., McClain, J. O. and Van Wassenhove, L. N. (1991), Multi-Level Capacitated Lot Sizing Complexity and LP-Based Heuristics, European Journal of Operational Research, Vol. 53, 131-148. Miller, R. E. and Blair, P. D. (1985), Input-Output Analysis: Foundations and Extensions, Prentice-Hall, Englewood Cliffs. Molinder, A. (1995), Material Requirements Planning Employing, Input-Output Analysis and Laplace Transforms, PROFIL 14, Production-Economic Research in Linköping, Linköping. Mula, J., Poler, R. and Garcia, J.P. (2006), MRP with Flexible Constraints: A Fuzzy Mathematical Programming Approach, Fuzzy Sets and Systems, Vol. 157 (2006), 74-97. Oden, H. W., Langenwalter, G. A. and Lucier, R. A. (1993), Handbook of Material & Capacity Requirements Planning, McGraw-Hill, New York. Orlicky, J. (1975), Material requirement planning, McGraw-Hill, Inc., New York.
125

Peterson, R. and Silver, E. A. (1979), Decision Systems for Inventory Management and Production Planning, John Wiley & Sons, New York. Plossl, G. W. (1985), Production and Inventory Control: Principles and Techniques, Second Edition, Prentice-Hall, Englewood Cliffs. Pongcharoen, P., Hicks, C. and Braiden, P. M. (2004), The Development of Genetic Algorithms for the Finite Capacity Scheduling of Complex Products, with Multiple levels of Product Structure, European Journal of Operational Research, Vol. 152, 215-225. Ross, S. M. (1993), Introduction to Probability Models, Fifth Edition Academic Press, inc., London. Segerstedt, A. (1995). Multi-Level Production and Inventory Control Problems Related to MRP and Cover-Time Planning, PROFIL 13, Production-Economic Research in Linköping, Linköping. Silver, E. D., Pyke, D. And Peterson, R. (1998), Inventory Management and Production Planning and Scheduling, Third Edition, John Wiley & Sons, New York. Sox, C. R. and Muckstadt, J. A. (1996). Multi-item, multi-period production planning with uncertain demand, IIE Transactions, Vol. 28, 891-900. Spiegel, M. R. (1965), Laplace Transforms, McGraw-Hill, New York. Spitz, A. E. (1972), Production Planning, Aurebach, Princeton. Tang, O. (2000), Planning and Replanning within the Material Requirements Planning Environments – A Transform Approach, PROFIL 16, Production-Economic Research in Linköping, Linköping. Tempelmeier, H. and Helber, S. (1994), A Heuristic for Dynamic Multi-Item Multi-Level Capacitated Lot-Sizing for General Product Structures, European Journal of Operational Research, Vol. 75, 296-311.
126

Teunter, R. (2005), A Note On “Khouja and Park, Optimal Lot Sizing Under Continuous Price Decrease, Omega 31 (2003)”, Omega, Vol. 33, 467-471. Van der Laan, E. (2003), An NPV and AC Analysis of a Stochastic Inventory System with Joint Manufacturing and Remanufacturing. International Journal of Production Economics, Vol. 81-82, 317-331. Özdamar, L. and Barbarosoglu, G. (2000), An Integrated Lagrangean Relaxation-Simulated Annealing Approach to the Multi-Level Multi-Item Capacitated Lot Sizing Problem, International Journal of Production Economics, Vol. 68, 319-331. Wang, Z. (2001), Capacity-Constrained Production-Inventory Systems - Using Laplace Transforms and Input-Output Analysis. Linköping Studies in Science and Technology, Licentiate Thesis No 864, Linköping 2001. Wang, Z. (2004), Capacity-Constrained Production-Inventory Systems: Modelling and Analysis in Both a Traditional and an E-Business Context. Linköping Studies in Science and Technology, Dissertations No 889. Winston, W. L. (1995), Introduction to Mathematical Programming, Second Edition, Duxbury, California. Whybark, D. C. and Williams, J. G. (1976), Material Requirements Planning under Uncertainty, Decision Sciences, Vol. 7, 595-606. Yin, K. K., Liu, H. and Yin, G. G. (2003), Stochastic Models and Numerical Solutions for Production Planning with Applications to the Paper Industry, Computer and Chemical Engineering, Vol. 27, 1693-1706. Yan, H. (2000), Hierarchical Stochastic Production Planning for Flexible Automation Workshops, Computer & Industrial Engineering, Vol. 38, 435-455.
127

Xie, J. and Dong, J. (2002), Heuristic Genetic Algorithms for General Capacitated Lot-Sizing Problems, Computers & Mathematics with Applications, Vol. 44, 263-276.
128