9-28-14 alpha 1c optimal offer ibi white paper - final
TRANSCRIPT

© 2014 Intellectual Property of Alpha 1C. All rights reserved
`
Optimizing Your Co-Pay Patient Offer Understanding your Incented but Ineligible patients will change the
way you think about structuring your patient incentive co-pay program
PATIENT INCENTIVE PROGRAMS SERIES
© 2014 Intellectual Property of Alpha 1C. All rights reserved
What is Optimal?
There is a major flaw in the way most companies
evaluate their co-pay incentive programs and it
can cause a brand to spend much more then they
have to.
How would you define the optimal co-pay program? Getting
there involves much more than simply “designing” your next
patient discount offer. It involves understanding your
“patient universe”, matching your offer components to best
meet your brand objectives, and selecting the optimal chan-
nels to reach these patients with your offer. Leveraging ana-
lytics and predictive modeling tools can streamline and opti-
mize the effective planning of your patient co-pay program…
and adopting a comprehensive view of the program impact,
beyond simple “co-pay claims” is critical when trying to un-
derstand the true results of your program.
Claims Data Can Be Misleading The claims data provided by co-pay vendors gives you a
“post offer” look at the patients your offer has been able to
attract. While this is valuable information, it’s not a good
representation of your current patient base, nor does it
paint a picture of the universe of patients trying to make
their journey to optimal therapy utilizing your brand.
In addition, the “claims report” which looks at claims by co-
pay group can be very dependent on what offer has been
put in market:
A “save $” program off will likely attract a higher per-
centage of lower co-pay patients
A Pay No More Than (PNMT) program will likely attract a greater percentage of the higher co-pay patients as will an offer that has a high cap or is open and attractive to cash patients.
More Aggressive Offers May Generate
More Claims, But...
More aggressive offers may generate more “claims”, but these
offers may not deliver the desired impact on “sales”. Analyzing
co-pay programs based solely on the claims generated is not a
sound practice and may encourage the implementation of in-
creasingly more and more aggressive offers…eventually driving
the offer down towards a $0 price point.
Let’s take a look at a couple of examples…
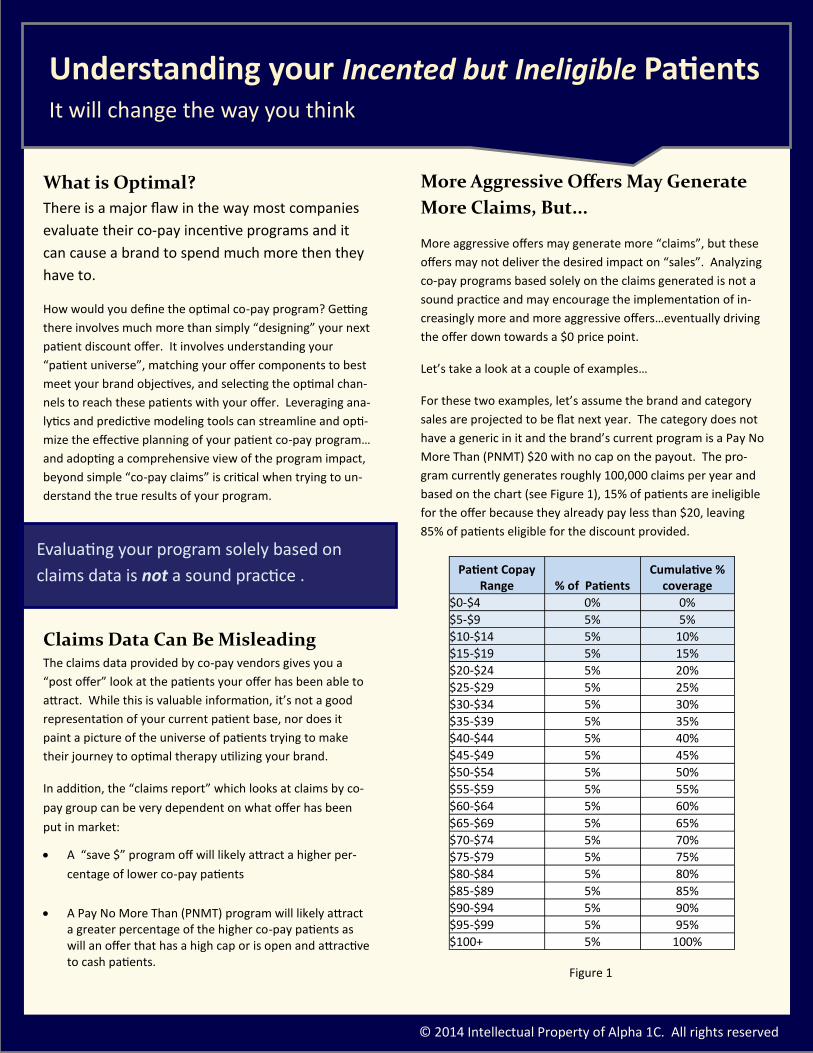
For these two examples, let’s assume the brand and category
sales are projected to be flat next year. The category does not
have a generic in it and the brand’s current program is a Pay No
More Than (PNMT) $20 with no cap on the payout. The pro-
gram currently generates roughly 100,000 claims per year and
based on the chart (see Figure 1), 15% of patients are ineligible
for the offer because they already pay less than $20, leaving
85% of patients eligible for the discount provided.
We asked 5 accomplished managers the things they would’ve done
differently at the onset of their careers
Evaluating your program solely based on
claims data is not a sound practice .
Understanding your Incented but Ineligible Patients It will change the way you think
Patient Copay Range % of Patients
Cumulative % coverage
$0-$4 0% 0%
$5-$9 5% 5%
$10-$14 5% 10%
$15-$19 5% 15%
$20-$24 5% 20%
$25-$29 5% 25%
$30-$34 5% 30%
$35-$39 5% 35%
$40-$44 5% 40%
$45-$49 5% 45%
$50-$54 5% 50%
$55-$59 5% 55%
$60-$64 5% 60%
$65-$69 5% 65%
$70-$74 5% 70%
$75-$79 5% 75%
$80-$84 5% 80%
$85-$89 5% 85%
$90-$94 5% 90%
$95-$99 5% 95%
$100+ 5% 100%
Figure 1

© 2014 Intellectual Property of Alpha 1C. All rights reserved
Example 1: Moving to a More Aggres-
sive Offer When it comes time to renew this program, the brand may
be convinced that they need to increase their patient incen-
tive offer by going to a PNMT $15 offer (no cap) because
they were anticipating “sales” would increase. After making
this change, the program generates 110,000 claims the fol-
lowing year (10,000 more than the previous year). This
looks very much like they increased sales for their program…
but was this new co-pay program structure actually more
successful? Did they really sell more?
In this case, the answer is probably not. Although every
brand’s situation is unique and every brand has their own
price sensitivities, this type of change in offer amount typi-
cally attracts a very small percentage of additional patients
from the higher co-pay groups and tends to reward the pa-
tients in the lower co-pay groups who would have filled the
prescription regardless.
Where did the bulk of the additional ten thousand patient
claims come from in this example? They came from the 5%
of patients in the $15-$19 co-pay range. Previously, the pa-
tients in this co-pay group were not eligible to receive the
discount and there is a high likelihood that previously, they
were not abandoning their prescriptions due to price.
What Does the Better Offer Accom-
plish? Now with the new, more lucrative offer, these patients are
suddenly eligible and they are happy to take advantage of
the extra $5 in savings the brand has provided. But, did this
more aggressive offer
Impact their purchase in a positive way?
Stop them from abandoning the script?
Increase their adherence rates?
Probably not… But these patients are saying “thanks very
much for the extra $5!” Certainly in the case where there
isn’t a generic present, that $5 likely means very little for
many of those low co-pay patients. However, increasing all
110,000 claims by an additional $5 will add substantial dol-
lars to the program budget and will drop the net margin a
few percentage points even with the “supposed” increase in
sales.
How many of these new claims were incremental you might
ask? Likely… not many… Now what happens now that the
brand has moved to a more aggressive offer?
Implementing more and more aggressive offers may encour-
age other brands to follow suit in an effort to be competitive.
So these brands may match the PNMT $15 offer and the
downward spiral of brand profitability continues!
Now hopefully you see where we are going with this. Did
sales actually increase? Or was it only claims that increased?
This is certainly an important distinction and one many
brands can’t answer with any degree of certainty. The fact is,
increased claims don’t necessarily mean increased sales vol-
ume and it’s important to be able to distinguish true incre-
mental volume and halo effect in your numbers.
We asked 5 accomplished managers the things they would’ve done
differently at the onset of their careers
Increased claims don’t necessarily mean increased sales volume. It’s important to be able to
distinguish true incremental volume and halo effect in your numbers.
Making Your Offers More Aggressive You may be surprised at the impact
© 2014 Intellectual Property of Alpha 1C. All rights reserved
Example 2: Moving to a Less Aggres-
sive Offer Now let’s look at the reverse scenario where the brand
moves from a PNMT $20 program to a PNMT $25 offer. This
offer is not as lucrative so you would expect claims to go
down, right? The answer is yes, but maybe not by as much
as you might think.
Using the table in Figure 1, we see only 80% of patients
would be eligible for this new offer (versus 85% before). This
decline in patient eligibility is the reason brand claims will
probably decrease by a little, but that doesn’t mean sales
will be impacted. Does a forecast of declining claims imply a
negative impact on the brand? Not necessarily!
The question to be answered is what would happen to the
5% of patients in the $20-$24 co-pay bucket who may have
received a co-pay card but are no longer eligible for the pro-
moted price. If they fill their script, the fill will be seen in
aggregate TRx data, but these scripts are no longer a part of
co-pay claims data. So based strictly on co-pay claims, these
patients were not impacted by the co-pay program. Is that
reality? No its not.
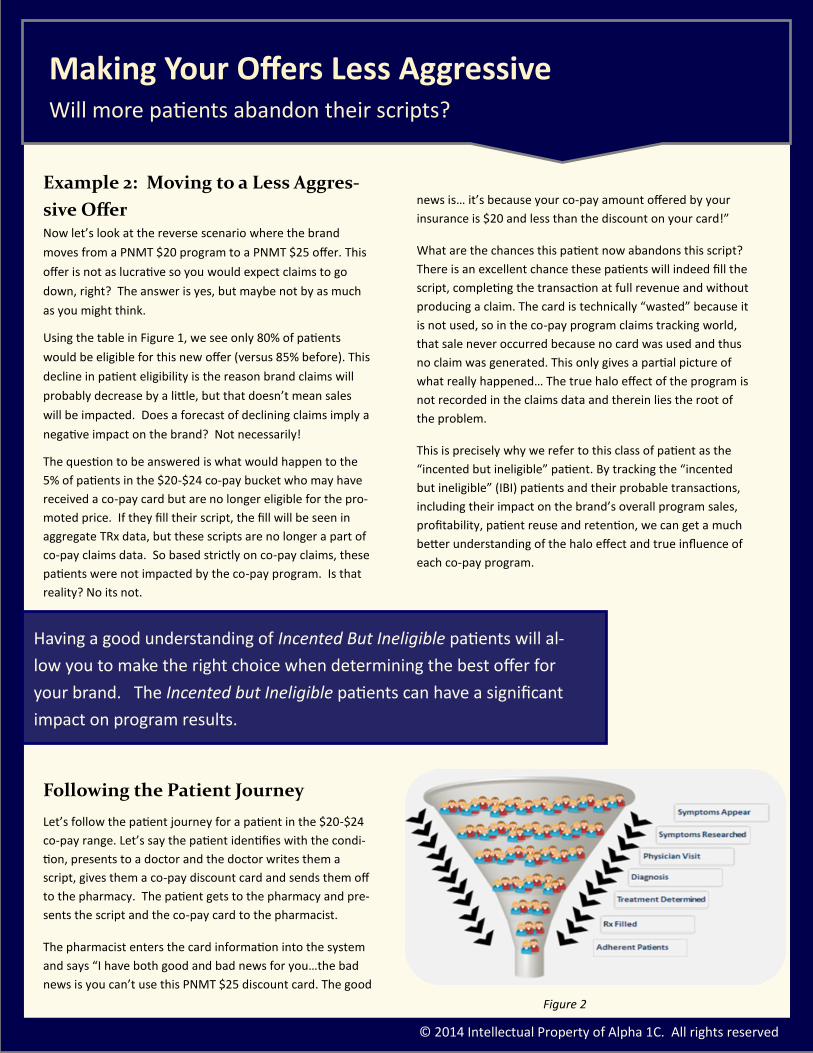
Following the Patient Journey
Let’s follow the patient journey for a patient in the $20-$24
co-pay range. Let’s say the patient identifies with the condi-
tion, presents to a doctor and the doctor writes them a
script, gives them a co-pay discount card and sends them off
to the pharmacy. The patient gets to the pharmacy and pre-
sents the script and the co-pay card to the pharmacist.
The pharmacist enters the card information into the system
and says “I have both good and bad news for you…the bad
news is you can’t use this PNMT $25 discount card. The good
news is… it’s because your co-pay amount offered by your
insurance is $20 and less than the discount on your card!”
What are the chances this patient now abandons this script?
There is an excellent chance these patients will indeed fill the
script, completing the transaction at full revenue and without
producing a claim. The card is technically “wasted” because it
is not used, so in the co-pay program claims tracking world,
that sale never occurred because no card was used and thus
no claim was generated. This only gives a partial picture of
what really happened… The true halo effect of the program is
not recorded in the claims data and therein lies the root of
the problem.
This is precisely why we refer to this class of patient as the
“incented but ineligible” patient. By tracking the “incented
but ineligible” (IBI) patients and their probable transactions,
including their impact on the brand’s overall program sales,
profitability, patient reuse and retention, we can get a much
better understanding of the halo effect and true influence of
each co-pay program.
Making Your Offers Less Aggressive Will more patients abandon their scripts?
Having a good understanding of Incented But Ineligible patients will al-
low you to make the right choice when determining the best offer for
your brand. The Incented but Ineligible patients can have a significant
impact on program results.
Figure 2
© 2014 Intellectual Property of Alpha 1C. All rights reserved
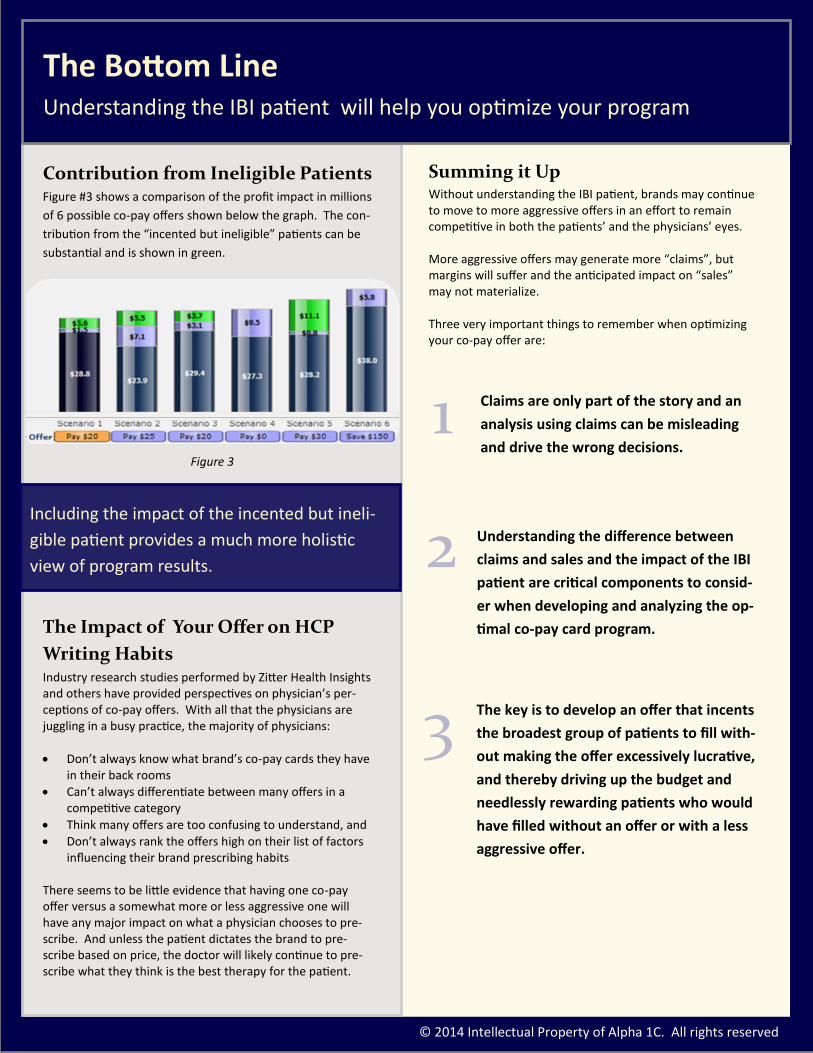
Contribution from Ineligible Patients Figure #3 shows a comparison of the profit impact in millions
of 6 possible co-pay offers shown below the graph. The con-
tribution from the “incented but ineligible” patients can be
substantial and is shown in green.
The Impact of Your Offer on HCP
Writing Habits Industry research studies performed by Zitter Health Insights and others have provided perspectives on physician’s per-ceptions of co-pay offers. With all that the physicians are juggling in a busy practice, the majority of physicians:
Don’t always know what brand’s co-pay cards they have in their back rooms
Can’t always differentiate between many offers in a competitive category
Think many offers are too confusing to understand, and
Don’t always rank the offers high on their list of factors influencing their brand prescribing habits
There seems to be little evidence that having one co-pay offer versus a somewhat more or less aggressive one will have any major impact on what a physician chooses to pre-scribe. And unless the patient dictates the brand to pre-scribe based on price, the doctor will likely continue to pre-scribe what they think is the best therapy for the patient.
Summing it Up Without understanding the IBI patient, brands may continue to move to more aggressive offers in an effort to remain competitive in both the patients’ and the physicians’ eyes. More aggressive offers may generate more “claims”, but margins will suffer and the anticipated impact on “sales” may not materialize. Three very important things to remember when optimizing your co-pay offer are:
Claims are only part of the story and an
analysis using claims can be misleading
and drive the wrong decisions.
Understanding the difference between
claims and sales and the impact of the IBI
patient are critical components to consid-
er when developing and analyzing the op-
timal co-pay card program.
The key is to develop an offer that incents
the broadest group of patients to fill with-
out making the offer excessively lucrative,
and thereby driving up the budget and
needlessly rewarding patients who would
have filled without an offer or with a less
aggressive offer.
We asked 5 accomplished managers the things they would’ve done
differently at the onset of their careers
The Bottom Line Understanding the IBI patient will help you optimize your program
Including the impact of the incented but ineli-
gible patient provides a much more holistic
view of program results.
1
2
3
Figure 3
© 2014 Intellectual Property of Alpha 1C. All rights reserved
About Al Kenney Al Kenney has 30 years experience in sales, marketing, and
analytics within the pharmaceutical, OTC, food, direct mar-
keting, and software industries. Al’s expertise lies in
the areas of marketing, sales, business process redesign,
data, software application design, program implementation,
forecasting, and the analysis and measurement of marketing
and sales spending.
Al is the founder of Alpha1C, an innovative company head-
quartered in Sherman, CT, which does strategic marketing,
predictive modeling and measurement. Prior to this, Al
spent eight years in the software industry specifically fo-
cused on advanced analytics, supply chain, and forecasting.
He owned and operated Performance Wave Inc. a software
company which also specialized in modeling and forecasting.
Performance Wave was sold in 1999. Later, he served as the
General Manager for Demantra Inc., a leading provider of
analytics and program measurement software (which is now
part of Oracle). Al is now applying his knowledge and skills
specifically to the food, drug, pharma and bio-technology
industries.
In addition to evaluating thousands of sales and marketing
programs across many different industries, Al has worked
on, forecasted, and analyzed over 50 incentive programs in
over 20+ therapeutic pharma and specialty pharma catego-
ries.
About Alpha 1C Founded in 2012, we are marketing, sales, and analytical
industry professionals with a deep background in strategy,
predictive forecasting, and post event tracking and analy-
sis for sales and marketing programs. We have vast expe-
rience solving complex problems and providing key in-
sights across more than 20+ core industries. For the last 6
years, we have been focusing our solutions primarily on
the Pharmaceutical and Bio-Tech marketplaces.
Alpha 1C provides key insights to brand teams allowing
them to make more informed decisions that provide a
better ROI. We work closely with your vendors and agen-
cies to execute your brand’s vision
We apply truly innovative thinking and approaches to
your complex business problems and utilize our easy to
use predictive analysis tools so you can quickly identify
the information you need to run your business more pro-
ductively and utilize the most profitable solutions to meet
your business goals.
Alpha 1C has unparalleled experi-
ence in: Strategic Marketing
Marketing Program Optimization
Predictive Modeling & Forecasting
Sales and Marketing Program Measurement and Re-
porting
Brand Building
Our work is easily paid for through the efficiencies and
insights we bring to your business.
To learn more you can contact
Al Kenney @ [email protected]
or at 860-354-7979
About About the Author and Alpha 1C