8th grade curriculum guide module 2014 2015 · pdf filebackground knowledge/examples...
TRANSCRIPT
8th
Grade Curriculum Guide Module
2014-2015
Unit Name: Module 1Rational, Radical and Irrational
Date: 8 / 18 / 14 – 9 / 22 / 14 (Teaching Days: 25 )
Common Core Standards
Background Knowledge/Examples Resources/Sample Lessons/Assessments
Essential Vocabulary
8.NS.1.
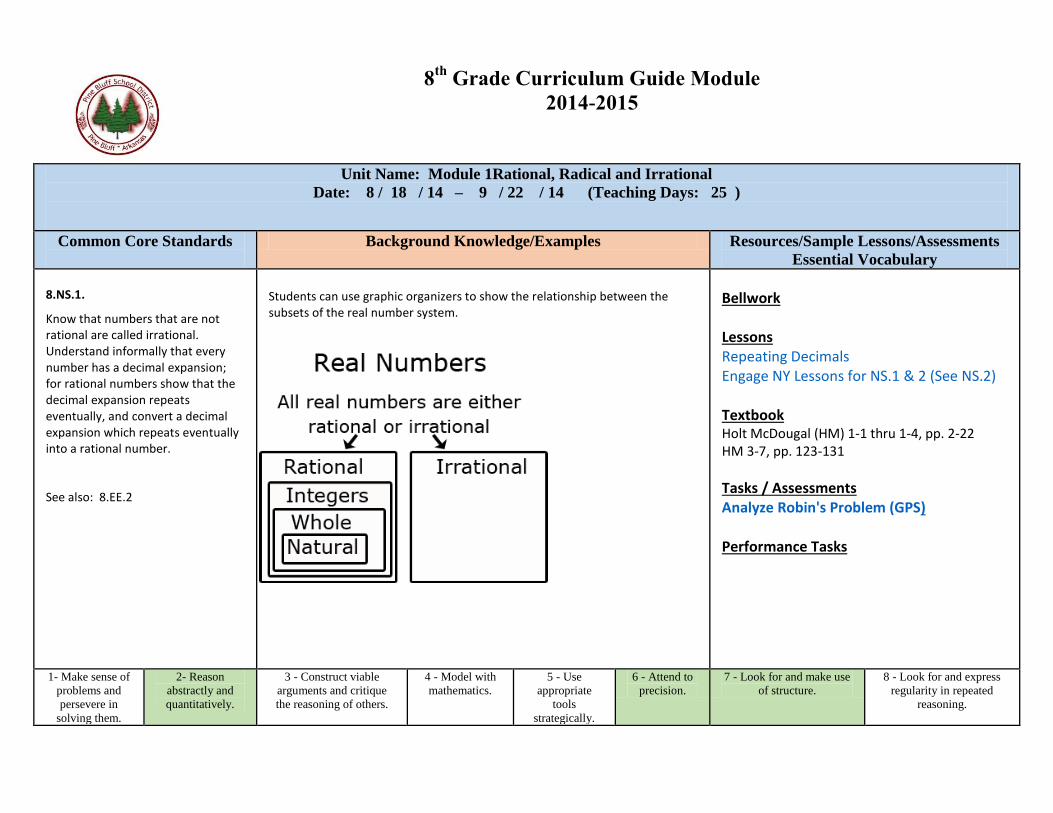
Know that numbers that are not rational are called irrational. Understand informally that every number has a decimal expansion; for rational numbers show that the decimal expansion repeats eventually, and convert a decimal expansion which repeats eventually into a rational number.
See also: 8.EE.2
Students can use graphic organizers to show the relationship between the subsets of the real number system.
Bellwork Lessons Repeating Decimals Engage NY Lessons for NS.1 & 2 (See NS.2) Textbook Holt McDougal (HM) 1-1 thru 1-4, pp. 2-22 HM 3-7, pp. 123-131
Tasks / Assessments Analyze Robin's Problem (GPS) Performance Tasks
1- Make sense of
problems and
persevere in
solving them.
2- Reason
abstractly and
quantitatively.
3 - Construct viable
arguments and critique
the reasoning of others.
4 - Model with
mathematics.
5 - Use
appropriate
tools
strategically.
6 - Attend to
precision.
7 - Look for and make use
of structure.
8 - Look for and express
regularity in repeated
reasoning.
Common Core Standards
Background Knowledge/Examples
Module 1
Resources/Sample Lessons/Assessments
Essential Vocabulary
8.NS.2.
Use rational approximations of irrational numbers to compare the size of irrational numbers, locate them approximately on a number line diagram, and estimate the value
of expressions (e.g., 2). For
example, by truncating the decimal expansion of √2, show that √2 is between 1 and 2, then between 1.4 and 1.5, and explain how to continue on to get better approximations.
See also: 8.EE.2
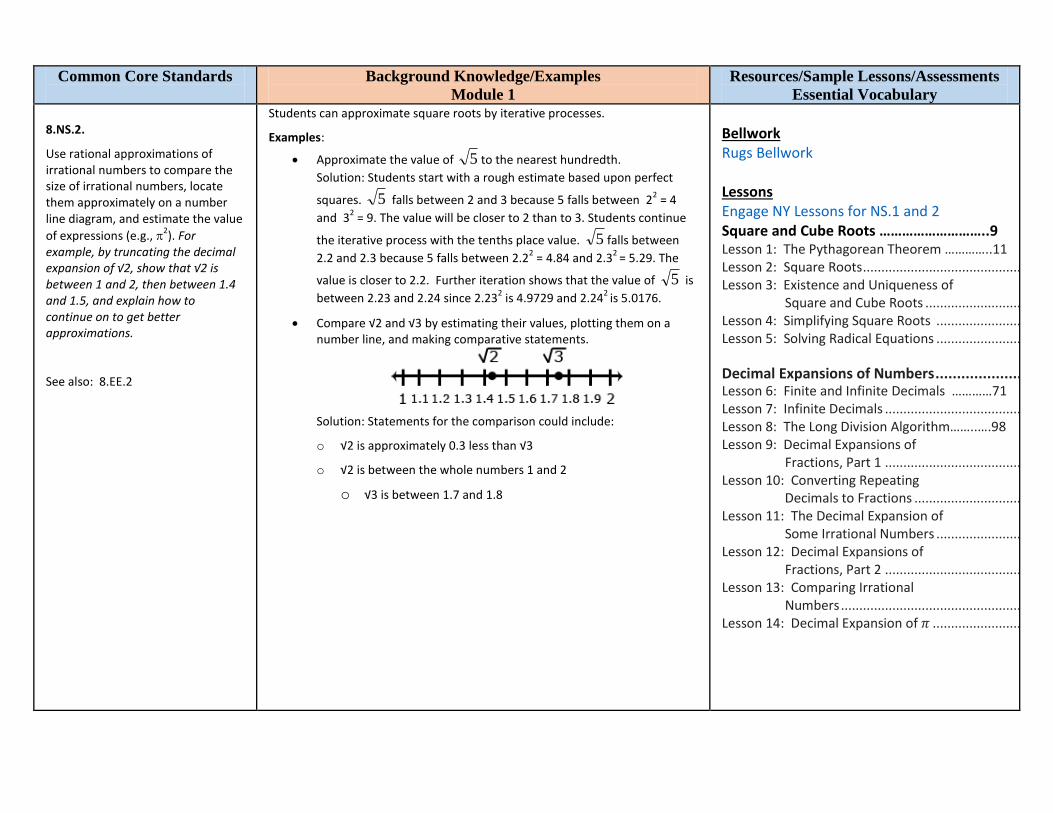
Students can approximate square roots by iterative processes.
Examples:
Approximate the value of to the nearest hundredth.
Solution: Students start with a rough estimate based upon perfect
squares. falls between 2 and 3 because 5 falls between 22 = 4
and 32 = 9. The value will be closer to 2 than to 3. Students continue
the iterative process with the tenths place value. falls between
2.2 and 2.3 because 5 falls between 2.22 = 4.84 and 2.3
2 = 5.29. The
value is closer to 2.2. Further iteration shows that the value of is
between 2.23 and 2.24 since 2.232 is 4.9729 and 2.24
2 is 5.0176.
Compare √2 and √3 by estimating their values, plotting them on a number line, and making comparative statements.
Solution: Statements for the comparison could include:
o √2 is approximately 0.3 less than √3
o √2 is between the whole numbers 1 and 2
o √3 is between 1.7 and 1.8
Bellwork Rugs Bellwork Lessons Engage NY Lessons for NS.1 and 2 Square and Cube Roots ………………………..9 Lesson 1: The Pythagorean Theorem …………..11 Lesson 2: Square Roots ........................................................................................................................................ 27 Lesson 3: Existence and Uniqueness of Square and Cube Roots ....................................................................................................................... 35 Lesson 4: Simplifying Square Roots .................................................................................................................... 49 Lesson 5: Solving Radical Equations .................................................................................................................... 59 Decimal Expansions of Numbers ................................................................................................... 69 Lesson 6: Finite and Infinite Decimals …………71 Lesson 7: Infinite Decimals .................................................................................................................................. 82 Lesson 8: The Long Division Algorithm……..….98 Lesson 9: Decimal Expansions of Fractions, Part 1 ................................................................................................................................ 110 Lesson 10: Converting Repeating Decimals to Fractions ........................................................................................................................ 122 Lesson 11: The Decimal Expansion of Some Irrational Numbers .................................................................................................................. 133 Lesson 12: Decimal Expansions of Fractions, Part 2 ................................................................................................................................ 143 Lesson 13: Comparing Irrational Numbers ............................................................................................................................................ 160 Lesson 14: Decimal Expansion of ................................................................................................................... 169
5
5
5
5
Textbook Holt McDougal (HM) 1-1 thru 1-4, pp. 2-22 HM 3-6, pp. 116-122
Tasks / Assessments Engage NY Lessons for NS.1 and 2 Mid-Module Assessment and Rubric p.182 End-of-Module Assessment and Rubric p. 316 Performance Tasks
1- Make sense of
problems and
persevere in
solving them.
2- Reason
abstractly and
quantitatively.
3 - Construct viable
arguments and critique
the reasoning of others.
4 - Model with
mathematics.
5 - Use
appropriate
tools
strategically.
6 - Attend to
precision.
7 - Look for and make use
of structure.
8 - Look for and express
regularity in repeated
reasoning.
Common Core Standards
Background Knowledge/Examples
Module 1 Resources/Sample Lessons/Assessments
Essential Vocabulary 8.EE.1.
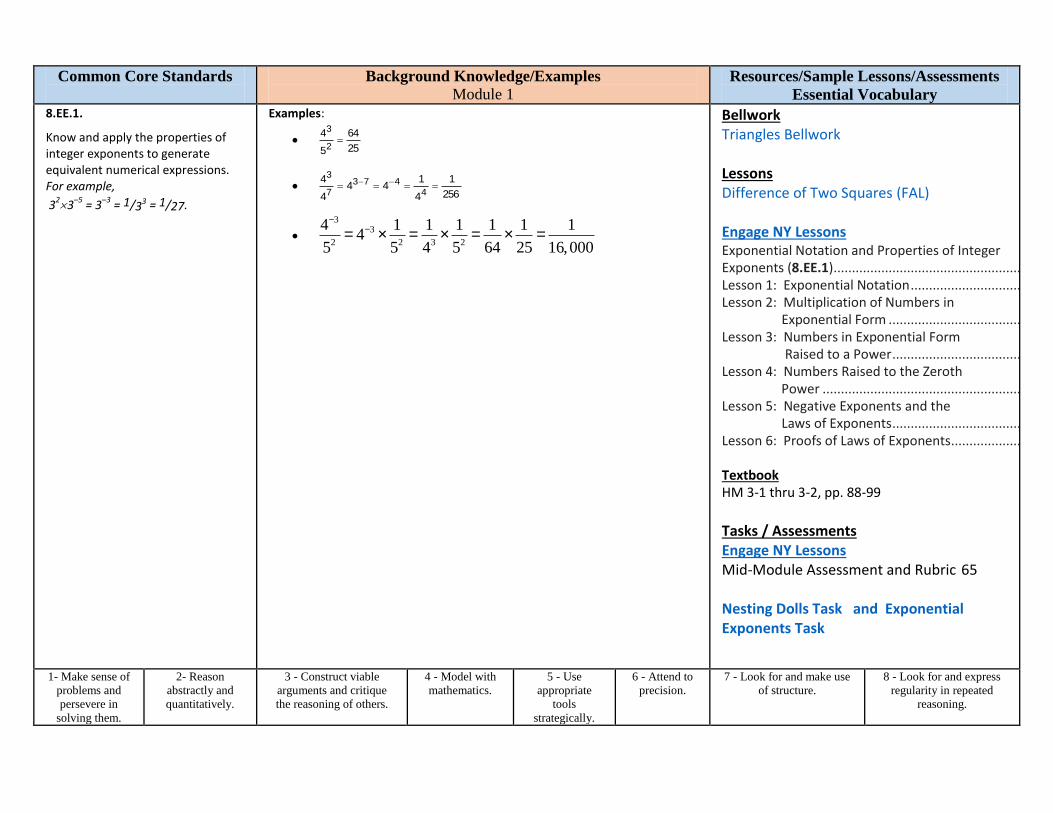
Know and apply the properties of integer exponents to generate equivalent numerical expressions. For example,
323
–5 = 3
–3 = 1/33 = 1/27.
Examples:
Bellwork Triangles Bellwork Lessons Difference of Two Squares (FAL) Engage NY Lessons Exponential Notation and Properties of Integer Exponents (8.EE.1) .................................................................................................................................................. 6 Lesson 1: Exponential Notation ............................................................................................................................. 8 Lesson 2: Multiplication of Numbers in Exponential Form ................................................................................................................................. 16 Lesson 3: Numbers in Exponential Form Raised to a Power ................................................................................................................................ 27 Lesson 4: Numbers Raised to the Zeroth Power ................................................................................................................................................... 35 Lesson 5: Negative Exponents and the Laws of Exponents ................................................................................................................................ 45 Lesson 6: Proofs of Laws of Exponents ................................................................................................................ 55 Textbook HM 3-1 thru 3-2, pp. 88-99
Tasks / Assessments Engage NY Lessons Mid-Module Assessment and Rubric 65 Nesting Dolls Task and Exponential Exponents Task
1- Make sense of
problems and
persevere in
solving them.
2- Reason
abstractly and
quantitatively.
3 - Construct viable
arguments and critique
the reasoning of others.
4 - Model with
mathematics.
5 - Use
appropriate
tools
strategically.
6 - Attend to
precision.
7 - Look for and make use
of structure.
8 - Look for and express
regularity in repeated
reasoning.
25
64
5
4
2
3
256
1
4
144
4
4
4473
7
3
4-3
52= 4-3 ´
1
52=
1
43´
1
52=
1
64´
1
25=
1
16,000

Common Core Standards
Background Knowledge/Examples
Module 1
Resources/Sample Lessons/Assessments
Essential Vocabulary
8.EE.2
Use square root and cube root symbols to represent solutions to equations of the form x
2 = p and x
3 =
p, where p is a positive rational number. Evaluate square roots of small perfect squares and cube roots of small perfect cubes. Know that √2 is irrational.
See also: 8.NS.1-2
Examples:
and
and
Solve
Solution:
Solve
Solution:
Bellwork Multiple Choice Questions Lessons Rational Roots with Task Textbook HM 3-5 thru 3-7, pp. 112-131
Tasks / Assessments Pollygone Tasks Performance Tasks
1- Make sense of
problems and
persevere in
solving them.
2- Reason
abstractly and
quantitatively.
3 - Construct viable
arguments and critique
the reasoning of others.
4 - Model with
mathematics.
5 - Use
appropriate
tools
strategically.
6 - Attend to
precision.
7 - Look for and make use
of structure.
8 - Look for and express
regularity in repeated
reasoning.
932 3 9
27
1
3
1
3
13
33
3
1
27
1
27
13
3
3
92 x
92 x
x2 = ± 9
3 x
83 x
83 x
33 3 8x
2x

Common Core Standards
Background Knowledge/Examples
Module 1
Resources/Sample
Lessons/Assessments Essential
Vocabulary
8.G.6.
Explain a proof of the Pythagorean Theorem and its converse.
Students should verify, using a model, that the sum of the squares of the legs is equal to the square of the hypotenuse in a right triangle. Students should also understand that if the sum of the squares of the 2 smaller legs of a triangle is equal to the square of the third leg, then the triangle is a right triangle.
Bellwork Lessons Engage NY Lessons The Pythagorean Theorem (8.G.6, 8.G.7) ........................................................................................................................................................... 179 Lesson 15: Informal Proof of the Pythagorean Theorem ................................................................................................................................. 180 Lesson 16: Applications of the Pythagorean Theorem ................................................................................................................................. 192
Engage NY Lessons The Pythagorean Theorem (8.G.6, 8.G.7) ........................................................................................................................................................... 183 Lesson 13: Proof of the Pythagorean Theorem ………………………………184 Lesson 14: The Converse of the Pythagorean Theorem …………193
Textbook HM 3-8 thru 3-9, pp. 132-151
Tasks / Assessments Multiple Choice Questions "Prove" the Pythagorean Theorem
1- Make sense of
problems and
persevere in
solving them.
2- Reason
abstractly and
quantitatively.
3 - Construct viable
arguments and critique
the reasoning of others.
4 - Model with
mathematics.
5 - Use
appropriate
tools
strategically.
6 - Attend to precision. 7 - Look for
and make use of
structure.
8 - Look for and express
regularity in repeated
reasoning.
Common Core Standards
Background Knowledge/Examples
Module 1 Resources/Sample
Lessons/Assessments Essential
Vocabulary 8.G.7.
Apply the Pythagorean Theorem to determine unknown side lengths in right triangles in real-world and mathematical problems in two and three dimensions.
Through authentic experiences and exploration, students should use the Pythagorean Theorem to solve problems. Problems can include working in both two and three dimensions. Students should be familiar with the common Pythagorean triplets.
Bellwork First Rate Tasks / Bellwork Between the Lines Task / Bellwork Lessons Engage NY Lessons The Pythagorean Theorem (8.G.6, 8.G.7) ........................................................................................................................................................... 179 Lesson 15: Informal Proof of the Pythagorean Theorem ................................................................................................................................. 180 Lesson 16: Applications of the Pythagorean Theorem ................................................................................................................................. 192
Engage NY Lessons The Pythagorean Theorem (8.G.6, 8.G.7) ........................................................................................................................................................... 183 Lesson 13: Proof of the Pythagorean Theorem ………………………………184 Lesson 14: The Converse of the Pythagorean Theorem …………193
Engage NY Lessons Applications of Radicals and Roots (8.G.7, 8.G.9) ............................................................................................................................................... 253 Lesson 19: Cones and Spheres ........................................................................................................................... 255 Lesson 20: Truncated Cones............................................................................................................................... 272 Lesson 21: Volume of Composite Solids ........................................................................................................................................................... 287 Lesson 22: Average Rate of Change ....................................................................................................................................................... 296 Lesson 23: Nonlinear Motion ............................................................................................................................. 305
End-of-Module Assessment and

Rubric …………………………….316 Lessons: Square Areas Textbook HM 3-8, pp. 132-137 HM 7-1 thru 7-4, pp. 296-333 HM 7-2 thru 7-4, pp. 304-333
Tasks / Assessments First Rate Tasks / Bellwork Between the Lines Task / Bellwork Performance Tasks Patterns in Prague Perf Task
Common Core Standards
Background Knowledge/Examples
Module 1
Resources/Sample
Lessons/Assessments Essential
Vocabulary
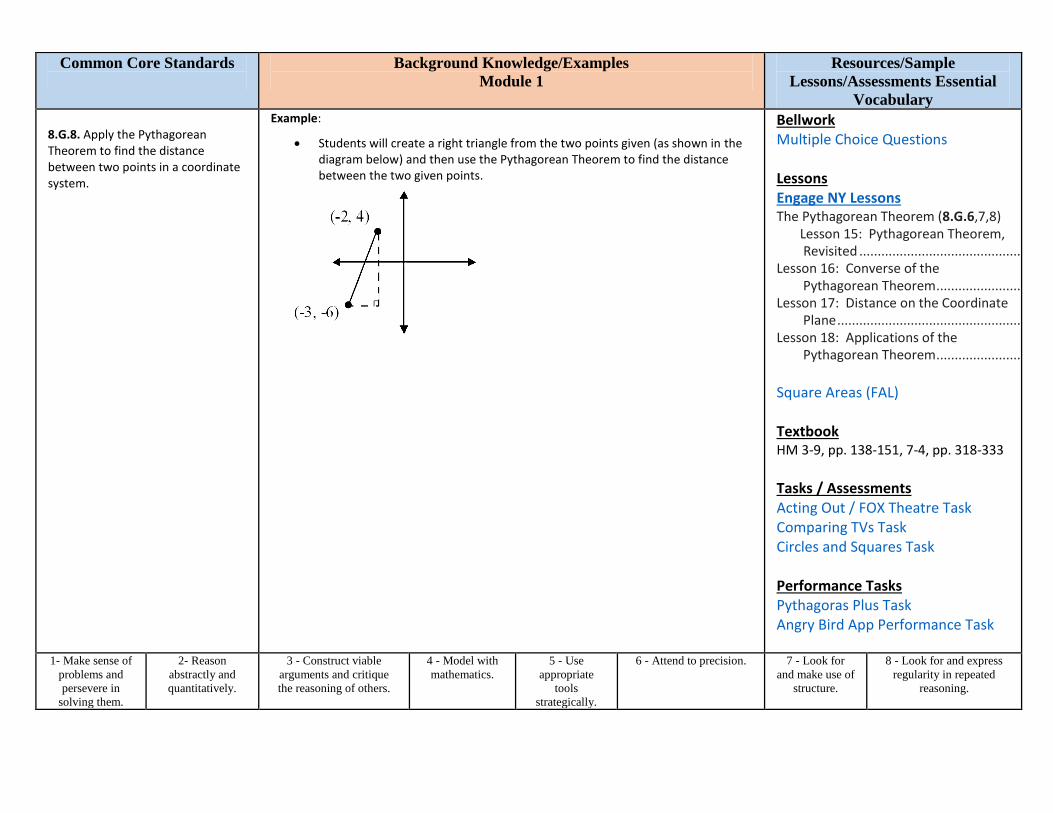
8.G.8. Apply the Pythagorean Theorem to find the distance between two points in a coordinate system.
Example:
Students will create a right triangle from the two points given (as shown in the diagram below) and then use the Pythagorean Theorem to find the distance between the two given points.
Bellwork Multiple Choice Questions Lessons Engage NY Lessons The Pythagorean Theorem (8.G.6,7,8) Lesson 15: Pythagorean Theorem, Revisited ...................................................................................................................................................... 203 Lesson 16: Converse of the Pythagorean Theorem ................................................................................................................................. 217 Lesson 17: Distance on the Coordinate Plane ............................................................................................................................................................ 225 Lesson 18: Applications of the Pythagorean Theorem ................................................................................................................................. 241
Square Areas (FAL) Textbook HM 3-9, pp. 138-151, 7-4, pp. 318-333
Tasks / Assessments Acting Out / FOX Theatre Task Comparing TVs Task Circles and Squares Task Performance Tasks Pythagoras Plus Task Angry Bird App Performance Task
1- Make sense of
problems and
persevere in
solving them.
2- Reason
abstractly and
quantitatively.
3 - Construct viable
arguments and critique
the reasoning of others.
4 - Model with
mathematics.
5 - Use
appropriate
tools
strategically.
6 - Attend to precision. 7 - Look for
and make use of
structure.
8 - Look for and express
regularity in repeated
reasoning.
Unit Name: Module 2: Proportional Relationships, Lines and Linear Equations
Date: 9 / 29 / 14 – 10 / 31 / 14 (Teaching Days: 30 ) Test Nov. 4
Common Core Standards
Background Knowledge/Examples Resources/Sample Lessons/Assessments
Essential Vocabulary
8.EE.3. Use numbers expressed in the form
of a single digit times an integer
power of 10 to estimate very large
or very small quantities, and to express how many times as much
one is than the other. For example,
estimate the population of the
United States as 3108 and the
population of the world as 7109,
and determine that the world
population is more than 20 times
larger.
.
Bellwork Multiple Choice Questions and OR Lessons Engage NY Lessons Magnitude and Scientific Notation (8.EE.3, 8.EE.4) ................................................................................................................................................................... 76 Lesson 7: Magnitude ............................................................................................................................................ 78 Lesson 8: Estimating Quantities ........................................................................................................................... 84 Lesson 9: Scientific Notation ................................................................................................................................ 98
TI-84 Use (GPS) Textbook HM 3-3 thru 3-4, pp. 100-111
Tasks / Assessments Powers of 10 Task (GPS p.18) Multiple Choice Questions and OR Performance Tasks
1- Make sense of
problems and
persevere in
solving them.
2- Reason
abstractly and
quantitatively.
3 - Construct viable
arguments and critique
the reasoning of others.
4 - Model with
mathematics.
5 - Use
appropriate
tools
strategically.
6 - Attend to
precision.
7 - Look for and make use
of structure.
8 - Look for and express
regularity in repeated
reasoning.

Common Core Standards
Background Knowledge/Examples
Module 2
Resources/Sample Lessons/Assessments
Essential Vocabulary
8.EE.4.
Perform operations with numbers expressed in scientific notation, including problems where both decimal and scientific notation are used. Use scientific notation and choose units of appropriate size for measurements of very large or very small quantities (e.g., use millimeters per year for seafloor spreading). Interpret scientific notation that has been generated by technology.
Students can convert decimal forms to scientific notation and apply rules of exponents to simplify expressions. In working with calculators or spreadsheets, it is important that students recognize scientific notation. Students should recognize that the output of 2.45E+23 is 2.45 x 10
23 and
3.5E-4 is 3.5 x 10⁻⁴
. Students enter scientific notation using E or EE (scientific notation), * (multiplication), and ^ (exponent) symbols.
Bellwork E.Coli Bellwork p.25 (GPS) Lessons Estimating Length Using Scientific Notation (FAL) Engage NY Lessons Magnitude and Scientific Notation (8.EE.3, 8.EE.4) ................................................................................................................................................................... 76 Lesson 10: Operations with Numbers in Scientific Notation .............................................................................................................................. 107 Lesson 11: Efficacy of the Scientific Notation .............................................................................................................................................. 114 Lesson 12: Choice of Unit ................................................................................................................................... 122 Lesson 13: Comparison of Numbers Written In Scientific Notation and Interpreting Scientific Notation Using Technology ............................................................................................................... 131
Textbook HM 3-3 thru 3-4, pp. 100-111
Tasks / Assessments (8.EE.1-4) Alien Attack (GPS) Ponzi Pyramid Scheme Task Giant Burgers Task (GPS) p.26 100 People Task (GPS) p.28 Performance Tasks
1- Make sense of
problems and
persevere in
solving them.
2- Reason
abstractly and
quantitatively.
3 - Construct viable
arguments and critique
the reasoning of others.
4 - Model with
mathematics.
5 - Use
appropriate
tools
strategically.
6 - Attend to
precision.
7 - Look for and make use
of structure.
8 - Look for and express
regularity in repeated
reasoning.
Common Core Standards
Background Knowledge/Examples
Module 2 Resources/Sample Lessons/Assessments
Essential Vocabulary 8.EE.5.
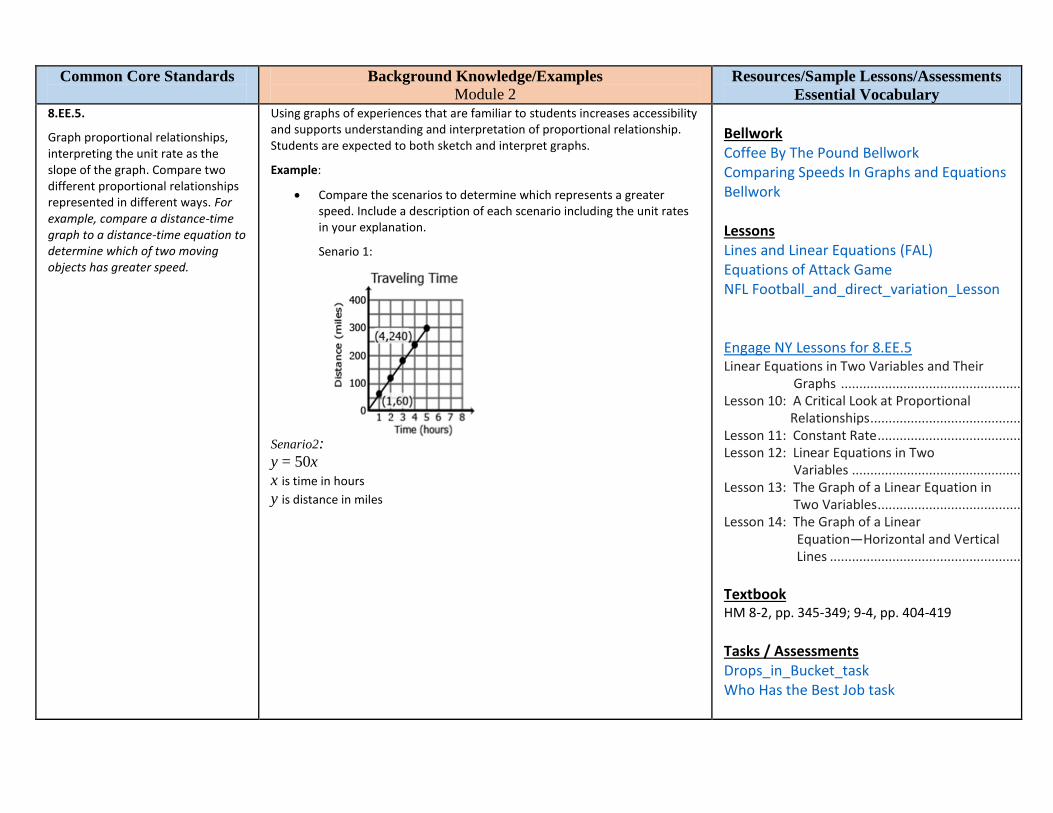
Graph proportional relationships, interpreting the unit rate as the slope of the graph. Compare two different proportional relationships represented in different ways. For example, compare a distance-time graph to a distance-time equation to determine which of two moving objects has greater speed.
Using graphs of experiences that are familiar to students increases accessibility and supports understanding and interpretation of proportional relationship. Students are expected to both sketch and interpret graphs.
Example:
Compare the scenarios to determine which represents a greater speed. Include a description of each scenario including the unit rates in your explanation.
Senario 1:
Senario2:
y = 50x
x is time in hours
y is distance in miles
Bellwork Coffee By The Pound Bellwork Comparing Speeds In Graphs and Equations Bellwork Lessons Lines and Linear Equations (FAL) Equations of Attack Game NFL Football_and_direct_variation_Lesson Engage NY Lessons for 8.EE.5 Linear Equations in Two Variables and Their Graphs ............................................................................................................................................. 104 Lesson 10: A Critical Look at Proportional Relationships ..................................................................................................................................... 105 Lesson 11: Constant Rate ................................................................................................................................... 117 Lesson 12: Linear Equations in Two Variables .......................................................................................................................................... 132 Lesson 13: The Graph of a Linear Equation in Two Variables ................................................................................................................................... 147 Lesson 14: The Graph of a Linear Equation―Horizontal and Vertical Lines ................................................................................................................................................ 163
Textbook HM 8-2, pp. 345-349; 9-4, pp. 404-419
Tasks / Assessments Drops_in_Bucket_task Who Has the Best Job task

Performance Tasks By the Book Performance Task (GPS p.9) Squares and Circles Perf Task
1- Make sense of
problems and
persevere in
solving them.
Scenario 1:
3 - Construct viable
arguments and critique
the reasoning of others.
4 - Model with
mathematics.
5 - Use
appropriate
tools
strategically.
6 - Attend to
precision.
7 - Look for and make use
of structure.
8 - Look for and express
regularity in repeated
reasoning.

Common Core Standards
Background Knowledge/Examples
Module 2 Resources/Sample Lessons/Assessments
Essential Vocabulary 8.EE.6.
Use similar triangles to explain why the slope m is the same between any two distinct points on a non-vertical line in the coordinate plane; derive the equation y = mx for a line through the origin and the equation y = mx + b for a line intercepting the vertical axis at b.
Example:
Explain why is similar to , and deduce that has
the same slope as . Express each line as an equation.
Bellwork Equations_of_lines Bellwork 4 Multiple Choice Questions for Bellwork Lessons Engage NY Lessons Slope and Equations of Lines (8.EE.B.5,6 ............................................................................................................ 189 Lesson 15: The Slope of a Non-Vertical Line ...................................................................................................... 191 Lesson 16: The Computation of the Slope of a Non-Vertical Line ............................................................................................................................. 215 Lesson 17: The Line Joining Two Distinct Points of the Graph Has Slope ..................................................................................................................................... 239 Lesson 18: There is Only One Line Passing Through a Given Point with a Given Slope ...................................................................................................................................... 257 Lesson 19: The Graph of a Linear Equation in Two Variables is a Line ................................................................................................................ 280 Lesson 20: Every Line is a Graph of a Linear Equation ................................................................................................................................ 301 Lesson 21: Some Facts about Graphs of a Linear Equation in Two Variables .......................................................................................................................................... 320 Lesson 22: Constant Rates Revisited.................................................................................................................. 334 Lesson 23: Defining Equation of a Line .............................................................................................................. 348
Textbook HM 8-2, pp. 345-349
Tasks / Assessments Skiing Lesson and Assessment Gamers Task
ACB DFE AB
BE
Drain the Pool Task Filling an Olympic Size Pool Task Performance Tasks
1- Make sense of
problems and
persevere in
solving them.
2- Reason
abstractly and
quantitatively.
3 - Construct viable
arguments and critique
the reasoning of others.
4 - Model with
mathematics.
5 - Use
appropriate
tools
strategically.
6 - Attend to
precision.
7 - Look for and make use
of structure.
8 - Look for and express
regularity in repeated
reasoning.
Common Core Standards
Background Knowledge/Examples
Module 2
Resources/Sample Lessons/Assessments
Essential Vocabulary
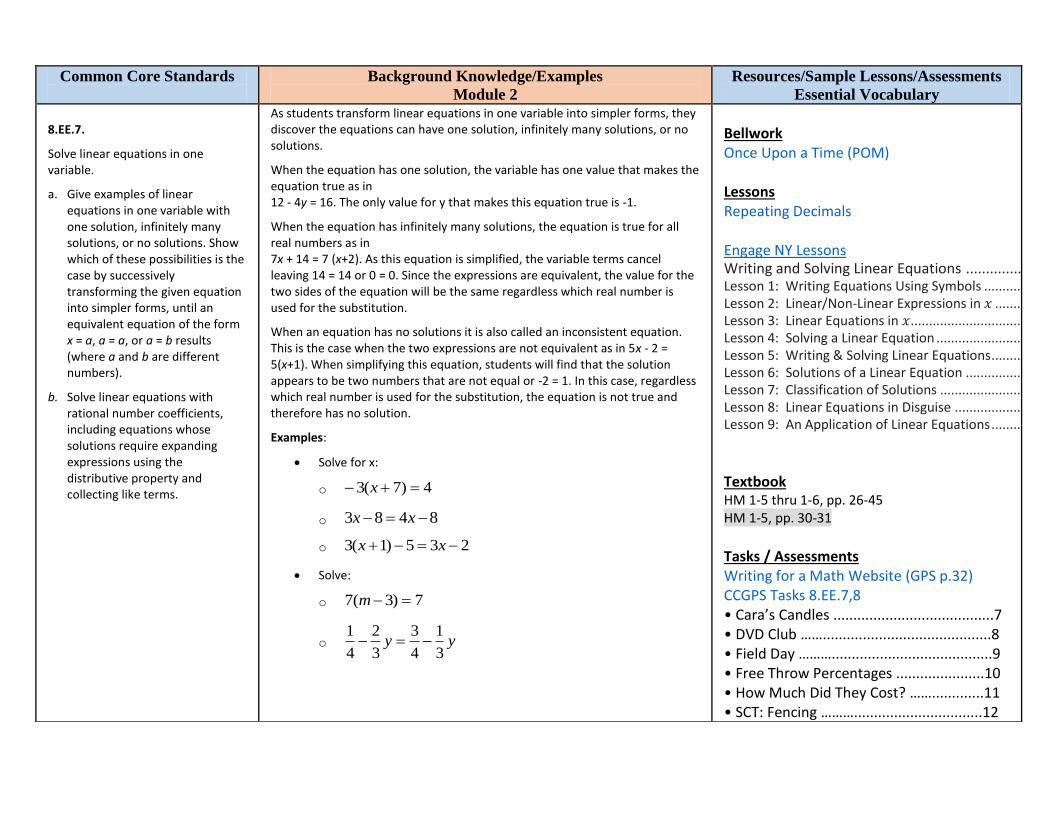
8.EE.7.
Solve linear equations in one variable.
a. Give examples of linear equations in one variable with one solution, infinitely many solutions, or no solutions. Show which of these possibilities is the case by successively transforming the given equation into simpler forms, until an equivalent equation of the form x = a, a = a, or a = b results (where a and b are different numbers).
b. Solve linear equations with rational number coefficients, including equations whose solutions require expanding expressions using the distributive property and collecting like terms.
As students transform linear equations in one variable into simpler forms, they discover the equations can have one solution, infinitely many solutions, or no solutions.
When the equation has one solution, the variable has one value that makes the equation true as in 12 - 4y = 16. The only value for y that makes this equation true is -1.
When the equation has infinitely many solutions, the equation is true for all real numbers as in 7x + 14 = 7 (x+2). As this equation is simplified, the variable terms cancel leaving 14 = 14 or 0 = 0. Since the expressions are equivalent, the value for the two sides of the equation will be the same regardless which real number is used for the substitution.
When an equation has no solutions it is also called an inconsistent equation. This is the case when the two expressions are not equivalent as in 5x - 2 = 5(x+1). When simplifying this equation, students will find that the solution appears to be two numbers that are not equal or -2 = 1. In this case, regardless which real number is used for the substitution, the equation is not true and therefore has no solution.
Examples:
Solve for x:
o
o
o
Solve:
o
o
Bellwork Once Upon a Time (POM) Lessons Repeating Decimals Engage NY Lessons Writing and Solving Linear Equations .................................................................................................... 10 Lesson 1: Writing Equations Using Symbols ........................................................................................................ 12 Lesson 2: Linear/Non-Linear Expressions in ..................................................................................................... 20 Lesson 3: Linear Equations in ............................................................................................................................ 28 Lesson 4: Solving a Linear Equation ..................................................................................................................... 38 Lesson 5: Writing & Solving Linear Equations ...................................................................................................... 50 Lesson 6: Solutions of a Linear Equation ............................................................................................................. 61 Lesson 7: Classification of Solutions .................................................................................................................... 71 Lesson 8: Linear Equations in Disguise ................................................................................................................ 79 Lesson 9: An Application of Linear Equations ...................................................................................................... 92
Textbook HM 1-5 thru 1-6, pp. 26-45 HM 1-5, pp. 30-31
Tasks / Assessments Writing for a Math Website (GPS p.32) CCGPS Tasks 8.EE.7,8 • Cara’s Candles ........................................7 • DVD Club ……..........................................8 • Field Day ………........................................9 • Free Throw Percentages ......................10 • How Much Did They Cost? …….............11 • SCT: Fencing ………................................12
4)7(3 x
8483 xx
235)1(3 xx
7)3(7 m
yy3
1
4
3
3
2
4
1

• Playing with Straws …...........................14 • Planning a Party ……..............................15 • What are the Coefficients? ..................16 • Cell Phone Plans …………........................17 Performance Tasks
1- Make sense of
problems and
persevere in
solving them.
2- Reason
abstractly and
quantitatively.
3 - Construct viable
arguments and critique
the reasoning of others.
4 - Model with
mathematics.
5 - Use
appropriate
tools
strategically.
6 - Attend to
precision.
7 - Look for and make use
of structure.
8 - Look for and express
regularity in repeated
reasoning.

Common Core Standards
Background Knowledge/Examples
Module 2
Resources/Sample
Lessons/Assessments Essential
Vocabulary
8.G.5.
Use informal arguments to establish facts about the angle sum and exterior angle of triangles, about the angles created when parallel lines are cut by a transversal, and the angle-angle criterion for similarity of triangles. For example, arrange three copies of the same triangle so that the sum of the three angles appears to form a line, and give an argument in terms of transversals why this is so.
Students can informally prove relationships with transversals.
Example:
Show that m 3 + m + m = 180˚ if l and m are parallel lines and t1 & t2 are
transversals.
+ + = 180˚. Angle 1 and Angle 5 are congruent because they are
corresponding angles ( ). can be substituted for .
because alternate interior angles are congruent.
can be substituted for .
Therefore m + m + m = 180˚
Students can informally conclude that the sum of a triangle is 180
o (the angle-sum theorem)
by applying their understanding of lines and alternate interior angles.
Bellwork Find the Angle Bellringer Find the Missing Angle Bellringer Lessons Identifying Similar Triangles Engage NY Lessons Congruence and Angle Relationships (8.G.5, 8.G.2) ............................................................................................................................ 128 Lesson 11: Definition of Congruence and Some Basic Properties ....................................................................................................................................................... 129 Lesson 12: Angles Associated with Parallel Lines ................................................................................................................................................... 138 Lesson 13: Angle Sum of a Triangle ........................................................................................................................................................... 147 Lesson 14: More on the Angles of a Triangle ........................................................................................................................................................... 156 End-of-Module Assessment and Rubric .............................................................................................................................................................. 170
Textbook HM 5-1 thru 5-2, pp. 192-205 HM 5-3 thru 5-4, pp. 206-219
Tasks / Assessments Drinking Straws Task Window Pane Task 8.G.5 Multiple Choice Questions Engage NY End-of-Module
4 5
1 2 3
15 1 5
24
4 2
3 4 5

Examples: In the figure below, line x is parallel to line yz:
Angle a is 35
o because it alternates with the angle inside the triangle that measures
35 o
. Angle c is 80 o
because it alternates with the angle inside the triangle that measures 80
o. Because lines have a measure of 180
o, and angles a + b + c form a
straight line, then angle b must be 65 o
(180 – 35 + 80 = 65). Therefore, the sum of the angles of the triangle are 35
o + 65
o + 80
o.
Assessment and Rubric ....................................................................................................................................... 170 (link above)
Performance Tasks Identifying Similar Triangles Performance Task
1- Make sense of
problems &
persevere in solving
them.
2- Reason abstractly
and quantitatively.
3 - Construct viable
arguments and critique the
reasoning of others.
4 - Model with
mathematics.
5 - Use
appropriate tools
strategically.
6 - Attend to
precision.
7 - Look
for and
make use
of structure.
8 - Look for and express regularity in repeated
reasoning.

Unit Name: Module 3: Functions
Date: 11/ 10 / 14 – 1 / 6/ 15 (Teaching Days: 30 ) Test Jan. 7
Common Core Standards
Background Knowledge/Examples
Resources/Sample Lessons/Assessments
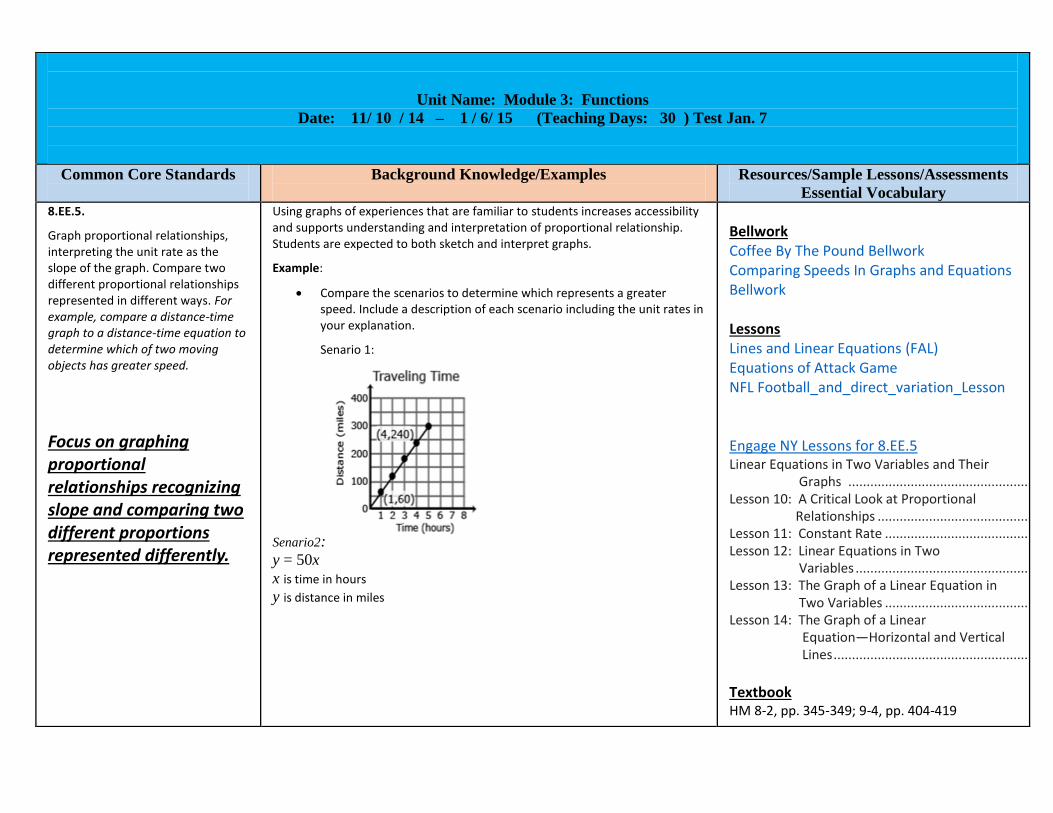
Essential Vocabulary 8.EE.5.
Graph proportional relationships, interpreting the unit rate as the slope of the graph. Compare two different proportional relationships represented in different ways. For example, compare a distance-time graph to a distance-time equation to determine which of two moving objects has greater speed.
Focus on graphing proportional relationships recognizing slope and comparing two different proportions represented differently.
Using graphs of experiences that are familiar to students increases accessibility and supports understanding and interpretation of proportional relationship. Students are expected to both sketch and interpret graphs.
Example:
Compare the scenarios to determine which represents a greater speed. Include a description of each scenario including the unit rates in your explanation.
Senario 1:
Senario2:
y = 50x
x is time in hours
y is distance in miles
Bellwork Coffee By The Pound Bellwork Comparing Speeds In Graphs and Equations Bellwork Lessons Lines and Linear Equations (FAL) Equations of Attack Game NFL Football_and_direct_variation_Lesson Engage NY Lessons for 8.EE.5 Linear Equations in Two Variables and Their Graphs ............................................................................................................................................ 104 Lesson 10: A Critical Look at Proportional Relationships .................................................................................................................................... 105 Lesson 11: Constant Rate .................................................................................................................................. 117 Lesson 12: Linear Equations in Two Variables .......................................................................................................................................... 132 Lesson 13: The Graph of a Linear Equation in Two Variables .................................................................................................................................. 147 Lesson 14: The Graph of a Linear Equation―Horizontal and Vertical Lines ................................................................................................................................................ 163
Textbook HM 8-2, pp. 345-349; 9-4, pp. 404-419

Tasks / Assessments Drops_in_Bucket_task Who Has the Best Job task Performance Tasks By the Book Performance Task (GPS p.9) Squares and Circles Perf Task
1- Make sense of
problems and
persevere in
solving them.
Scenario 1:
3 - Construct viable
arguments and critique the
reasoning of others.
4 - Model with
mathematics.
5 - Use
appropriate
tools
strategically.
6 - Attend to
precision.
7 - Look for and make use
of structure.
8 - Look for and express
regularity in repeated
reasoning.

Common Core Standards
Background Knowledge/Examples
Module 3
Resources/Sample Lessons/Assessments
Essential Vocabulary
8.EE.7.
Solve linear equations in one variable.
c. Give examples of linear equations in one variable with one solution, infinitely many solutions, or no solutions. Show which of these possibilities is the case by successively transforming the given equation into simpler forms, until an equivalent equation of the form x = a, a = a, or a = b results (where a and b are different numbers).
As students transform linear equations in one variable into simpler forms, they discover the equations can have one solution, infinitely many solutions, or no solutions.
When the equation has one solution, the variable has one value that makes the equation true as in 12 - 4y = 16. The only value for y that makes this equation true is -1.
When the equation has infinitely many solutions, the equation is true for all real numbers as in 7x + 14 = 7 (x+2). As this equation is simplified, the variable terms cancel leaving 14 = 14 or 0 = 0. Since the expressions are equivalent, the value for the two sides of the equation will be the same regardless which real number is used for the substitution.
When an equation has no solutions it is also called an inconsistent equation. This is the case when the two expressions are not equivalent as in 5x - 2 = 5(x+1). When simplifying this equation, students will find that the solution appears to be two numbers that are not equal or -2 = 1. In this case, regardless which real number is used for the substitution, the equation is not true and therefore has no solution.
Examples:
Solve for x:
o
o
o
Solve:
o
o
Bellwork Once Upon a Time (POM) Lessons Repeating Decimals Engage NY Lessons Writing and Solving Linear Equations ................................................................................................... 10 Lesson 1: Writing Equations Using Symbols ........................................................................................................ 12 Lesson 2: Linear/Non-Linear Expressions in ..................................................................................................... 20 Lesson 3: Linear Equations in ........................................................................................................................... 28 Lesson 4: Solving a Linear Equation..................................................................................................................... 38 Lesson 5: Writing & Solving Linear Equations ..................................................................................................... 50 Lesson 6: Solutions of a Linear Equation ............................................................................................................. 61 Lesson 7: Classification of Solutions .................................................................................................................... 71 Lesson 8: Linear Equations in Disguise ................................................................................................................ 79 Lesson 9: An Application of Linear Equations ..................................................................................................... 92
Textbook HM 1-5 thru 1-6, pp. 26-45 HM 1-5, pp. 30-31
Tasks / Assessments Writing for a Math Website (GPS p.32) CCGPS Tasks 8.EE.7,8 • Cara’s Candles ........................................7 • DVD Club ……..........................................8 • Field Day ………........................................9 • Free Throw Percentages ......................10 • How Much Did They Cost? …….............11 • SCT: Fencing ………................................12
4)7(3 x
8483 xx
235)1(3 xx
7)3(7 m
yy3
1
4
3
3
2
4
1

• Playing with Straws …...........................14 • Planning a Party ……..............................15 • What are the Coefficients? ..................16 • Cell Phone Plans …………........................17 Performance Tasks
1- Make sense of
problems and
persevere in
solving them.
2- Reason
abstractly and
quantitatively.
3 - Construct viable
arguments and critique the
reasoning of others.
4 - Model with
mathematics.
5 - Use
appropriate
tools
strategically.
6 - Attend to
precision.
7 - Look for and make use
of structure.
8 - Look for and express
regularity in repeated
reasoning.


Common Core Standards
Background Knowledge/Examples
Module 3
Resources/Sample Lessons/Assessments
Essential Vocabulary
8.F.1.
Understand that a function is a rule that assigns to each input exactly one output. The graph of a function is the set of ordered pairs consisting of an input and the corresponding output. (Function notation is not required in Grade 8.)
Example:
The rule that takes x as input and gives x2+5x+4 as output is a
function. Using y to stand for the output we can represent this function with the equation y = x
2+5x+4, and the graph of the equation
is the graph of the function. Students are not yet expected use function notation such as f(x) = x
2+5x+4.
Bellwork Order Matters (CCGPS p. 21) Which is Which? (CCGPS p.25)
Lessons Lines and Linear Equations (FAL) Engage NY Lessons Functions (8.F.A.1, 8.F.A.2, 8.F.A.3) ....................................................................................................................... 7 Lesson 1: The Concept of a Function ..................................................................................................................... 9 Lesson 2: Formal Definition of a Function ........................................................................................................... 20 Lesson 3: Linear Functions and Proportionality .................................................................................................................................... 31 Lesson 4: More Examples of Functions ............................................................................................................... 45 Lesson 5: Graphs of Functions and Equations ..................................................................................................... 57 Lesson 6: Graphs of Linear Functions and Rate of Change.............................................................................................................................................. 74 Lesson 7: Comparing Linear Functions and Graphs .................................................................................................................................................. 84 Lesson 8: Graphs of Simple Non-Linear Functions ............................................................................................................................................. 96
Textbook HM 2-1 thru 2-2, pp. 50-58, 2-4, pp. 66-69 HM 9-3 thru 9-4, pp. 400-419
Tasks / Assessments Vending Machines (CCGPS p.19) Performance Tasks
Secret Codes and Number Rules (CCGPS p.8) 1- Make sense of
problems and
persevere in
solving them.
2- Reason
abstractly and
quantitatively.
3 - Construct viable
arguments and critique the
reasoning of others.
4 - Model with
mathematics.
5 - Use
appropriate
tools
strategically.
6 - Attend to
precision.
7 - Look for and make use of
structure.
8 - Look for and express
regularity in repeated
reasoning.

Common Core Standards
Background Knowledge/Examples
Module 3 Resources/Sample Lessons/Assessments
Essential Vocabulary 8.F.2.
Compare properties of two functions each represented in a different way (algebraically, graphically, numerically in tables, or by verbal descriptions). For example, given a linear function represented by a table of values and a linear function represented by an algebraic expression, determine which function has the greater rate of change.
Examples:
Compare the two linear functions listed below and determine which equation represents a greater rate of change.
Function 1:
Compare the two linear functions listed below and determine which has a negative slope.
Function 1: Gift Card
Samantha starts with $20 on a gift card for the book store. She spends $3.50 per week to buy a magazine. Let y be the amount remaining as a function of the number of weeks, x.
x y
0 20
1 16.50
2 13.00
3 9.50
4 6.00
Function 2: Calculator Rental
The school bookstore rents graphing calculators for $5 per month. It also collects a non-refundable fee of $10.00 for the school year. Write the rule for the total cost (c) of renting a calculator as a function of the number of months (m).
Bellwork Shelves Battery Charging_BW Lessons Generalizing Patterns: The Difference of Two Squares (FAL) Engage NY Lessons Functions (8.F.A.1, 8.F.A.2, 8.F.A.3) ....................................................................................................................... 7 Lesson 1: The Concept of a Function ..................................................................................................................... 9 Lesson 2: Formal Definition of a Function ........................................................................................................... 20 Lesson 3: Linear Functions and Proportionality .................................................................................................................................... 31 Lesson 4: More Examples of Functions ............................................................................................................... 45 Lesson 5: Graphs of Functions and Equations ..................................................................................................... 57 Lesson 6: Graphs of Linear Functions and Rate of Change.............................................................................................................................................. 74 Lesson 7: Comparing Linear Functions and Graphs .................................................................................................................................................. 84 Lesson 8: Graphs of Simple Non-Linear Functions ............................................................................................................................................. 96
Textbook HM 2-5, pp. 70-87 HM 9-3 thru 9-4, pp. 400-419
Tasks / Assessments Summer Job Options Task Music Dilemma
Function 2: The function whose input x and output y are related by
y = 3x + 7

Solution:
Function 1 is an example of a function whose graph has negative slope. Samantha starts with $20 and spends money each week. The amount of money left on the gift card decreases each week. The graph has a negative slope of -3.5, which is the amount the gift card balance decreases with Samantha’s weekly magazine purchase. Function 2 is an example of a function whose graph has positive slope. Students pay a yearly nonrefundable fee for renting the calculator and pay $5 for each month they rent the calculator. This function has a positive slope of 5 which is the amount of the monthly rental fee. An equation for Example 2 could be c = 5m + 10.
Performance Tasks
1- Make sense of
problems and
persevere in
solving them.
2- Reason
abstractly and
quantitatively.
3 - Construct viable
arguments and critique the
reasoning of others.
4 - Model with
mathematics.
5 - Use
appropriate
tools
strategically.
6 - Attend to
precision.
7 - Look for and make use of
structure.
8 - Look for and express
regularity in repeated
reasoning.

Common Core Standards
Background Knowledge/Examples
Module 3
Resources/Sample Lessons/Assessments
Essential Vocabulary
8.F.3.
Interpret the equation y = mx + b as defining a linear function, whose graph is a straight line; give examples of functions that are not linear. For example, the function A = s
2 giving
the area of a square as a function of its side length is not linear because its graph contains the points (1,1), (2,4) and (3,9), which are not on a straight line.
Example:
Determine which of the functions listed below are linear and which are not linear and explain your reasoning.
o y = -2x2
+ 3 non linear
o y = 2x linear
o A = πr2
non linear
o y = 0.25 + 0.5(x – 2) linear
Bellwork 8F3_Multiple Choice Questions Evaluate the Equation Bellwork Lessons Go Big Papa Lesson Engage NY Lessons Functions (8.F.A.1, 8.F.A.2, 8.F.A.3) ....................................................................................................................... 7 Lesson 1: The Concept of a Function ..................................................................................................................... 9 Lesson 2: Formal Definition of a Function ........................................................................................................... 20 Lesson 3: Linear Functions and Proportionality .................................................................................................................................... 31 Lesson 4: More Examples of Functions ............................................................................................................... 45 Lesson 5: Graphs of Functions and Equations ..................................................................................................... 57 Lesson 6: Graphs of Linear Functions and Rate of Change.............................................................................................................................................. 74 Lesson 7: Comparing Linear Functions and Graphs .................................................................................................................................................. 84 Lesson 8: Graphs of Simple Non-Linear Functions ............................................................................................................................................. 96
Textbook HM 8-1 thru 8-6, pp. 334-381; 9-3 thru 9-4, pp. 400-419
Tasks / Assessments Linear Graph Task Performance Tasks What's My Line Performance Task (GPS p.18)
1- Make sense of
problems and
persevere in
solving them.
2- Reason
abstractly and
quantitatively.
3 - Construct viable
arguments and critique the
reasoning of others.
4 - Model with
mathematics.
5 - Use
appropriate
tools
strategically.
6 - Attend to
precision.
7 - Look for and make use of
structure.
8 - Look for and express
regularity in repeated
reasoning.

Common Core Standards
Background Knowledge/Examples
Module 3 Resources/Sample Lessons/Assessments
Essential Vocabulary 8.F.4.
Construct a function to model a linear relationship between two quantities. Determine the rate of change and initial value of the function from a description of a relationship or from two (x, y) values, including reading these from a table or from a graph. Interpret the rate of change and initial value of a linear function in terms of the situation it models, and in terms of its graph or a table of values.
Examples:
The table below shows the cost of renting a car. The company charges $45 a day for the car as well as charging a one-time $25 fee for the car’s navigation system (GPS). Write an expression for the cost in dollars, c, as a function of the number of days, d.
Students might write the equation c = 45d + 25 using the verbal description or by first making a table.
Days (d) Cost (c) in dollars
1 70
2 115
3 160
4 205
Students should recognize that the rate of change is 45 (the cost of renting the car) and that initial cost (the first day charge) also includes paying for the navigation system. Classroom discussion about one time fees vs. recurrent fees will help students to model contextual situations.
When scuba divers come back to the surface of the water, they need to be careful not to ascend too quickly. Divers should not come to the surface more quickly than a rate of 0.75 ft per second. If the divers start at a depth of 100 feet, the equation d = 0.75t – 100 shows the relationship between the time of the ascent in seconds (t) and the distance from the surface in feet (d).
o Will they be at the surface in 5 minutes? How long will it take the divers to surface from their dive?
o Make a table of values showing several times and the corresponding distance of the divers from the surface. Explain what your table shows. How do the values in the table relate to your equation?
Bellwork CCGPS Unit 8.F.4,5 Mini-Problems …………….........................47 Lessons Modeling Situations with Linear Equations (FAL) Interpreting Distance / Time Graph (FAL) Engage NY Lessons Linear Functions (8.F.B.4, 8.F.B.5) .......................................................................................................................... 6 Lesson 1: Modeling Linear Relationships ............................................................................................................... 7 Lesson 2: Interpreting Rate of Change and Initial Value ........................................................................................................................................... 18 Lesson 3: Representations of a Line ..................................................................................................................... 26 Lessons 4–5: Increasing and Decreasing Functions .............................................................................................................................................. 38
Textbook HM 8-1 thru 8-6, pp. 334-381; 9-3 thru 9-4, pp. 400-419
Tasks / Assessments CCGPS Unit 8.F.4,5 • Heartbeats ………….................................20 • Walk the Graph .....................................23 • Heartbeats Too ……................................32 • Mineral Samples ...................................36 • Mini-Problems …………….........................47
• My Cotton Boll Data ………......................49 • Outdoor Theater ………...........................59 • How Long Should Shoe Laces Be? .........61 • Sports and Musical Instruments ..........62 Performance Tasks CCGPS Unit 8.F.4,5 Winter Is Over….....................................11 Walking Race and Making Money..........37 Two-Way Tables ………………………………….64 Summer Camp …………………………………….69
1- Make sense of
problems and
persevere in
solving them.
2- Reason
abstractly and
quantitatively.
3 - Construct viable
arguments and critique the
reasoning of others.
4 - Model with
mathematics.
5 - Use
appropriate
tools
strategically.
6 - Attend to
precision.
7 - Look for and make use
of structure.
Common Core Standards
Background Knowledge/Examples
Module 3
Resources/Sample Lessons/Assessments
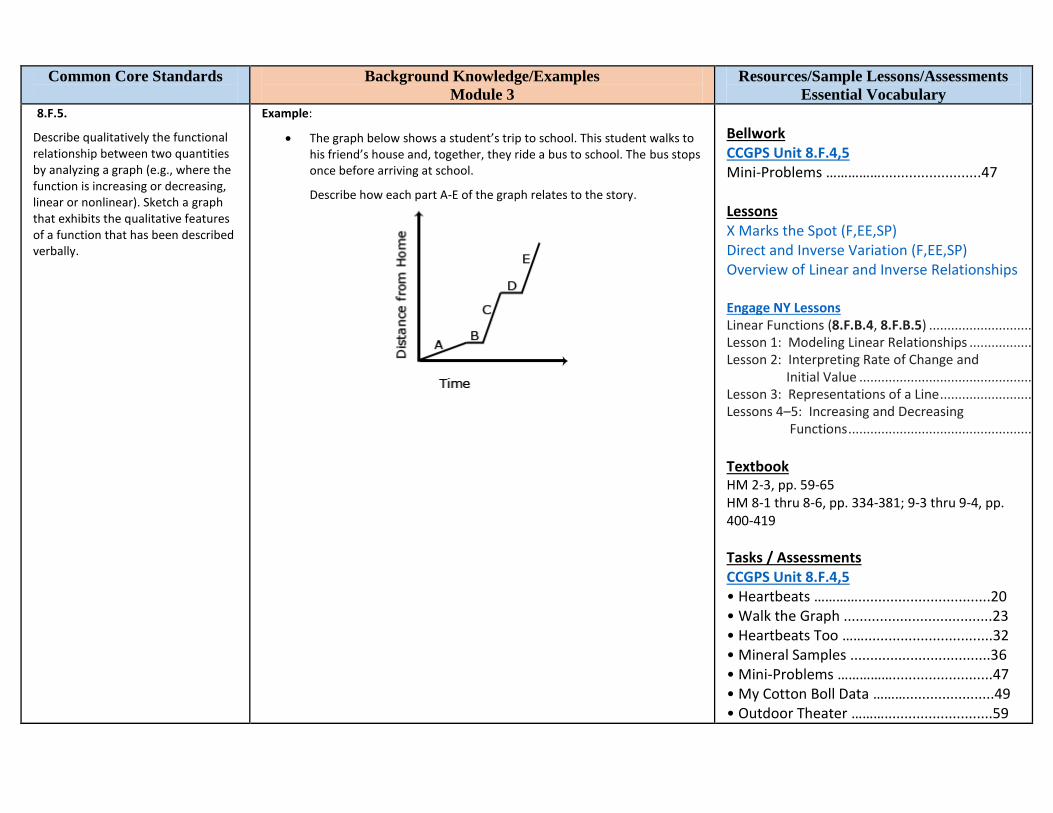
Essential Vocabulary 8.F.5.
Describe qualitatively the functional relationship between two quantities by analyzing a graph (e.g., where the function is increasing or decreasing, linear or nonlinear). Sketch a graph that exhibits the qualitative features of a function that has been described verbally.
Example:
The graph below shows a student’s trip to school. This student walks to his friend’s house and, together, they ride a bus to school. The bus stops once before arriving at school.
Describe how each part A-E of the graph relates to the story.
Bellwork CCGPS Unit 8.F.4,5 Mini-Problems …………….........................47 Lessons X Marks the Spot (F,EE,SP) Direct and Inverse Variation (F,EE,SP) Overview of Linear and Inverse Relationships Engage NY Lessons Linear Functions (8.F.B.4, 8.F.B.5) .......................................................................................................................... 6 Lesson 1: Modeling Linear Relationships ............................................................................................................... 7 Lesson 2: Interpreting Rate of Change and Initial Value ........................................................................................................................................... 18 Lesson 3: Representations of a Line ..................................................................................................................... 26 Lessons 4–5: Increasing and Decreasing Functions .............................................................................................................................................. 38
Textbook HM 2-3, pp. 59-65 HM 8-1 thru 8-6, pp. 334-381; 9-3 thru 9-4, pp. 400-419
Tasks / Assessments CCGPS Unit 8.F.4,5 • Heartbeats ………….................................20 • Walk the Graph .....................................23 • Heartbeats Too ……................................32 • Mineral Samples ...................................36 • Mini-Problems …………….........................47 • My Cotton Boll Data ………......................49 • Outdoor Theater ………...........................59

• How Long Should Shoe Laces Be? .........61 • Sports and Musical Instruments ..........62 Performance Tasks CCGPS Unit 8.F.4,5 Winter Is Over….....................................11 Forget the Formula................................25 Walking Race and Making Money..........37 Two-Way Tables ………………………………….64 Summer Camp …………………………………….69
1- Make sense of
problems and
persevere in
solving them.
2- Reason
abstractly and
quantitatively.
3 - Construct viable
arguments and critique the
reasoning of others.
4 - Model with
mathematics.
5 - Use
appropriate
tools
strategically.
6 - Attend to
precision.
7 - Look for and make use
of structure.

Unit Name: Module 4: Geometry in the Real World
Date: 1/ 12 / 14 – 2 / 20/ 15 (Teaching Days: 30 ) Test Feb.. 24
Common Core Standards
Background Knowledge/Examples Resources/Sample Lessons/Assessments
Essential Vocabulary
8.G.1.
Verify experimentally the properties of rotations, reflections, and translations:
a. Lines are taken to lines, and line segments to line segments of the same length.
b. Angles are taken to angles of the same measure.
Parallel lines are taken to parallel lines.
Students need multiple opportunities to explore the transformation of figures so that they can appreciate that points stay the same distance apart and lines stay at the same angle after they have been rotated, reflected, and/or translated.
Students are not expected to work formally with properties of dilations until high school.
Bellwork Math Counts Bellringer Lessons Engage NY Lessons Definitions and Properties of the Basic Rigid Motions (8.G.1) ....................................................................................................................................................... 7 Lesson 1: Why Move Things Around? .................................................................................................................... 9 Lesson 2: Definition of Translation and Three Basic Properties .................................................................................................................................... 17 Lesson 3: Translating Lines................................................................................................................................... 30 Lesson 4: Definition of Reflection and Basic Properties ............................................................................................................................................. 38 Lesson 5: Definition of Rotation and Basic Properties ............................................................................................................................................ 51 Lesson 6: Rotations of 180 Degrees ..................................................................................................................... 64
Textbook HM 5-6 thru 5-8, pp. 226-255
Tasks / Assessments Aaron's Design Task Introduction to Transformations Performance Tasks
1- Make sense of
problems and
persevere in
solving them.
2- Reason
abstractly and
quantitatively.
3 - Construct viable
arguments and critique
the reasoning of others.
4 - Model with
mathematics.
5 - Use
appropriate
tools
strategically.
6 - Attend to
precision.
7 - Look for and make use
of structure.
8 - Look for and express
regularity in repeated
reasoning.

Common Core Standards
Background Knowledge/Examples
Module 4
Resources/Sample Lessons/Assessments
Essential Vocabulary 8.G.2.
Understand that a two-dimensional figure is congruent to another if the second can be obtained from the first by a sequence of rotations, reflections, and translations; given two congruent figures, describe a sequence that exhibits the congruence between them.
Examples:
Is Figure A congruent to Figure A’? Explain how you know.
Describe the sequence of transformations that results in the transformation of Figure A to Figure A’.
Bellwork Congruent Segments Bellringer Lessons Representing and Combining Transformations (FAL) Engage NY Lessons Sequencing the Basic Rigid Motions (8.G.2) ......................................................................................................... 76 Lesson 7: Sequencing Translations ...................................................................................................................... 77 Lesson 8: Sequencing Reflections and Translations .......................................................................................................................................... 86 Lesson 9: Sequencing Rotations........................................................................................................................... 95 Lesson 10: Sequences of Rigid Motions ............................................................................................................. 104
Mid-Module Assessment and Rubric ……115 Textbook HM 5-5 thru 5-8, pp. 222-255
Tasks / Assessments Pi Multiple Choice Questions Engage NY Assessment and Rubric ……115 (link above) Performance Tasks
1- Make sense of
problems and
persevere in
solving them.
2- Reason
abstractly and
quantitatively.
3 - Construct viable
arguments and critique
the reasoning of others.
4 - Model with
mathematics.
5 - Use
appropriate
tools
strategically.
6 - Attend to
precision.
7 - Look for and make use
of structure.
8 - Look for and express
regularity in repeated
reasoning.
Common Core Standards
Background Knowledge/Examples
Module 4 Resources/Sample Lessons/Assessments
Essential Vocabulary
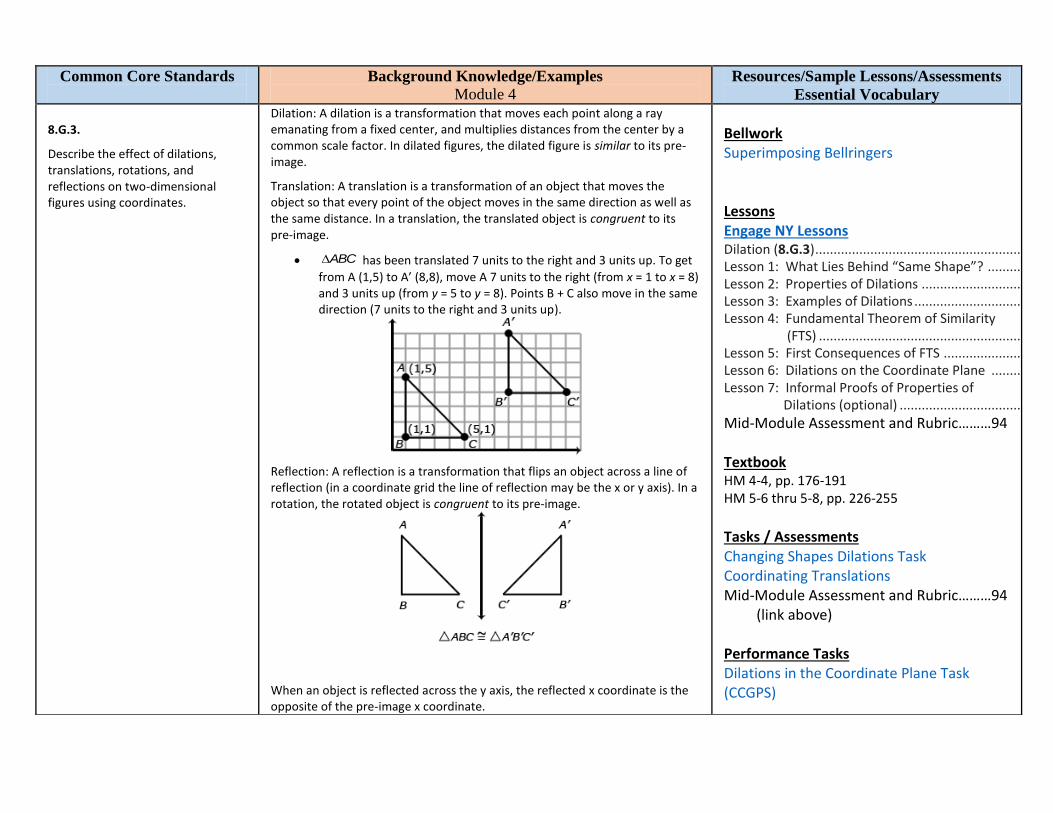
8.G.3.
Describe the effect of dilations, translations, rotations, and reflections on two-dimensional figures using coordinates.
Dilation: A dilation is a transformation that moves each point along a ray emanating from a fixed center, and multiplies distances from the center by a common scale factor. In dilated figures, the dilated figure is similar to its pre-image.
Translation: A translation is a transformation of an object that moves the object so that every point of the object moves in the same direction as well as the same distance. In a translation, the translated object is congruent to its pre-image.
has been translated 7 units to the right and 3 units up. To get
from A (1,5) to A’ (8,8), move A 7 units to the right (from x = 1 to x = 8) and 3 units up (from y = 5 to y = 8). Points B + C also move in the same direction (7 units to the right and 3 units up).
Reflection: A reflection is a transformation that flips an object across a line of reflection (in a coordinate grid the line of reflection may be the x or y axis). In a rotation, the rotated object is congruent to its pre-image.
When an object is reflected across the y axis, the reflected x coordinate is the opposite of the pre-image x coordinate.
Bellwork Superimposing Bellringers Lessons Engage NY Lessons Dilation (8.G.3) ........................................................................................................................................................ 7 Lesson 1: What Lies Behind “Same Shape”? ......................................................................................................... 9 Lesson 2: Properties of Dilations ......................................................................................................................... 19 Lesson 3: Examples of Dilations ........................................................................................................................... 33 Lesson 4: Fundamental Theorem of Similarity (FTS) ..................................................................................................................................................... 45 Lesson 5: First Consequences of FTS ................................................................................................................... 55 Lesson 6: Dilations on the Coordinate Plane ...................................................................................................... 70 Lesson 7: Informal Proofs of Properties of Dilations (optional) ............................................................................................................................... 83
Mid-Module Assessment and Rubric………94 Textbook HM 4-4, pp. 176-191 HM 5-6 thru 5-8, pp. 226-255
Tasks / Assessments Changing Shapes Dilations Task Coordinating Translations Mid-Module Assessment and Rubric………94 (link above) Performance Tasks Dilations in the Coordinate Plane Task (CCGPS)
ABC
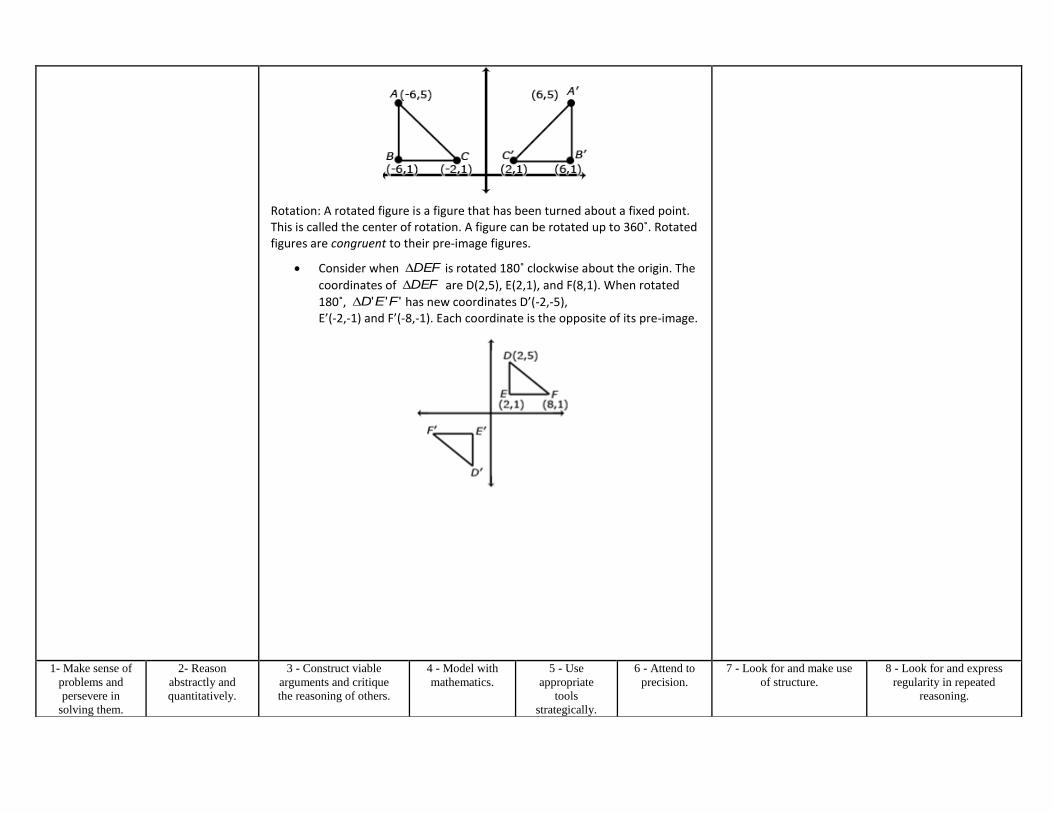
Rotation: A rotated figure is a figure that has been turned about a fixed point. This is called the center of rotation. A figure can be rotated up to 360˚. Rotated figures are congruent to their pre-image figures.
Consider when is rotated 180˚ clockwise about the origin. The
coordinates of are D(2,5), E(2,1), and F(8,1). When rotated
180˚, has new coordinates D’(-2,-5), E’(-2,-1) and F’(-8,-1). Each coordinate is the opposite of its pre-image.
1- Make sense of
problems and
persevere in
solving them.
2- Reason
abstractly and
quantitatively.
3 - Construct viable
arguments and critique
the reasoning of others.
4 - Model with
mathematics.
5 - Use
appropriate
tools
strategically.
6 - Attend to
precision.
7 - Look for and make use
of structure.
8 - Look for and express
regularity in repeated
reasoning.
DEF
DEF
''' FED
Common Core Standards
Background Knowledge/Examples
Module 4
Resources/Sample Lessons/Assessments
Essential Vocabulary
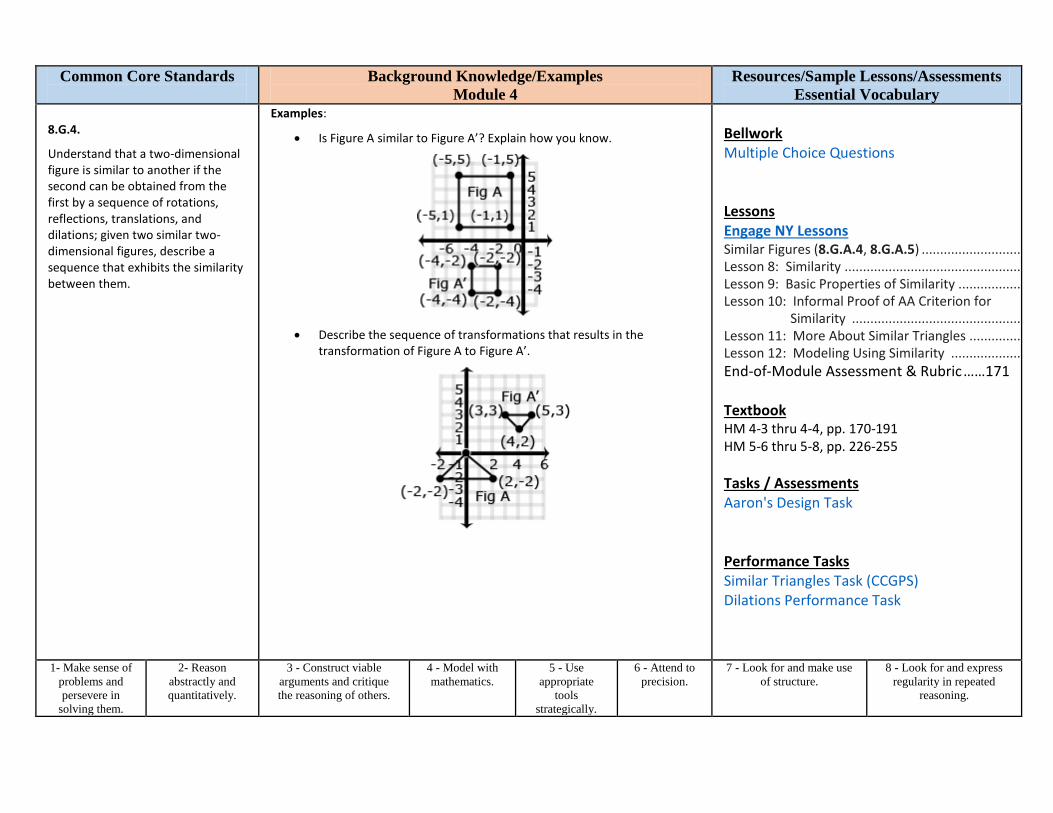
8.G.4.
Understand that a two-dimensional figure is similar to another if the second can be obtained from the first by a sequence of rotations, reflections, translations, and dilations; given two similar two-dimensional figures, describe a sequence that exhibits the similarity between them.
Examples:
Is Figure A similar to Figure A’? Explain how you know.
Describe the sequence of transformations that results in the transformation of Figure A to Figure A’.
Bellwork Multiple Choice Questions Lessons Engage NY Lessons Similar Figures (8.G.A.4, 8.G.A.5) ....................................................................................................................... 107 Lesson 8: Similarity ............................................................................................................................................ 109 Lesson 9: Basic Properties of Similarity ............................................................................................................. 126 Lesson 10: Informal Proof of AA Criterion for Similarity .......................................................................................................................................... 136 Lesson 11: More About Similar Triangles .......................................................................................................... 147 Lesson 12: Modeling Using Similarity ............................................................................................................... 162
End-of-Module Assessment & Rubric ……171 Textbook HM 4-3 thru 4-4, pp. 170-191 HM 5-6 thru 5-8, pp. 226-255
Tasks / Assessments Aaron's Design Task Performance Tasks Similar Triangles Task (CCGPS) Dilations Performance Task
1- Make sense of
problems and
persevere in
solving them.
2- Reason
abstractly and
quantitatively.
3 - Construct viable
arguments and critique
the reasoning of others.
4 - Model with
mathematics.
5 - Use
appropriate
tools
strategically.
6 - Attend to
precision.
7 - Look for and make use
of structure.
8 - Look for and express
regularity in repeated
reasoning.

Common Core Standards
Background Knowledge/Examples
Module 4 Resources/Sample
Lessons/Assessments Essential
Vocabulary
8.G.5.
Use informal arguments to establish facts about the angle sum and exterior angle of triangles, about the angles created when parallel lines are cut by a transversal, and the angle-angle criterion for similarity of triangles. For example, arrange three copies of the same triangle so that the sum of the three angles appears to form a line, and give an argument in terms of transversals why this is so.
Students can informally prove relationships with transversals.
Example:
Show that m 3 + m + m = 180˚ if l and m are parallel lines and t1 & t2 are
transversals.
+ + = 180˚. Angle 1 and Angle 5 are congruent because they are
corresponding angles ( ). can be substituted for .
because alternate interior angles are congruent.
can be substituted for .
Therefore m + m + m = 180˚
Students can informally conclude that the sum of a triangle is 180
o (the angle-sum theorem) by
applying their understanding of lines and alternate interior angles. Examples: In the figure below, line x is parallel to line yz:
Angle a is 35
o because it alternates with the angle inside the triangle that measures 35
o.
Angle c is 80 o
because it alternates with the angle inside the triangle that measures 80 o
. Because lines have a measure of 180
o, and angles a + b + c form a straight line, then
angle b must be 65 o
(180 – 35 + 80 = 65). Therefore, the sum of the angles of the triangle are 35
o + 65
o + 80
o.
Bellwork Find the Angle Bellringer Find the Missing Angle Bellringer Lessons Identifying Similar Triangles Engage NY Lessons Congruence and Angle Relationships (8.G.5, 8.G.2) ............................................................................................................................ 128 Lesson 11: Definition of Congruence and Some Basic Properties ....................................................................................................................................................... 129 Lesson 12: Angles Associated with Parallel Lines ................................................................................................................................................... 138 Lesson 13: Angle Sum of a Triangle ........................................................................................................................................................... 147 Lesson 14: More on the Angles of a Triangle ........................................................................................................................................................... 156 End-of-Module Assessment and Rubric .............................................................................................................................................................. 170
Textbook HM 5-1 thru 5-2, pp. 192-205 HM 5-3 thru 5-4, pp. 206-219
Tasks / Assessments Drinking Straws Task Window Pane Task 8.G.5 Multiple Choice Questions
4 5
1 2 3
15 1 5
24
4 2
3 4 5
Engage NY End-of-Module Assessment and Rubric ....................................................................................................................................... 170 (link above)
Performance Tasks Identifying Similar Triangles Performance Task
1- Make sense of
problems & persevere in solving
them.
2- Reason abstractly
and quantitatively.
3 - Construct viable
arguments and critique the reasoning of others.
4 - Model with
mathematics.
5 - Use
appropriate tools strategically.
6 - Attend to
precision.
7 - Look for and
make use of structure.
8 - Look for and express regularity in repeated
reasoning.

Common Core Standards
Background Knowledge/Examples
Module 4
Resources/Sample
Lessons/Assessments Essential
Vocabulary
8.G.6.
Explain a proof of the Pythagorean Theorem and its converse.
Students should verify, using a model, that the sum of the squares of the legs is equal to the square of the hypotenuse in a right triangle. Students should also understand that if the sum of the squares of the 2 smaller legs of a triangle is equal to the square of the third leg, then the triangle is a right triangle.
Bellwork Lessons Engage NY Lessons The Pythagorean Theorem (8.G.6, 8.G.7) ........................................................................................................................................................... 179 Lesson 15: Informal Proof of the Pythagorean Theorem ................................................................................................................................. 180 Lesson 16: Applications of the Pythagorean Theorem ................................................................................................................................. 192
Engage NY Lessons The Pythagorean Theorem (8.G.6, 8.G.7) ........................................................................................................................................................... 183 Lesson 13: Proof of the Pythagorean Theorem ………………………………184 Lesson 14: The Converse of the Pythagorean Theorem …………193
Textbook HM 3-8 thru 3-9, pp. 132-151
Tasks / Assessments Multiple Choice Questions "Prove" the Pythagorean Theorem
1- Make sense of
problems and
persevere in
solving them.
2- Reason
abstractly and
quantitatively.
3 - Construct viable
arguments and critique
the reasoning of others.
4 - Model with
mathematics.
5 - Use
appropriate
tools
strategically.
6 - Attend to precision. 7 - Look for
and make use of
structure.
8 - Look for and express
regularity in repeated
reasoning.
Common Core Standards
Background Knowledge/Examples
Module 4 Resources/Sample
Lessons/Assessments Essential
Vocabulary 8.G.7.
Apply the Pythagorean Theorem to determine unknown side lengths in right triangles in real-world and mathematical problems in two and three dimensions.
Through authentic experiences and exploration, students should use the Pythagorean Theorem to solve problems. Problems can include working in both two and three dimensions. Students should be familiar with the common Pythagorean triplets.
Bellwork First Rate Tasks / Bellwork Between the Lines Task / Bellwork Lessons Engage NY Lessons The Pythagorean Theorem (8.G.6, 8.G.7) ........................................................................................................................................................... 179 Lesson 15: Informal Proof of the Pythagorean Theorem ................................................................................................................................. 180 Lesson 16: Applications of the Pythagorean Theorem ................................................................................................................................. 192
Engage NY Lessons The Pythagorean Theorem (8.G.6, 8.G.7) ........................................................................................................................................................... 183 Lesson 13: Proof of the Pythagorean Theorem ………………………………184 Lesson 14: The Converse of the Pythagorean Theorem …………193
Engage NY Lessons Applications of Radicals and Roots (8.G.7, 8.G.9) .............................................................................................................................................. 253 Lesson 19: Cones and Spheres........................................................................................................................... 255 Lesson 20: Truncated Cones .............................................................................................................................. 272 Lesson 21: Volume of Composite Solids .......................................................................................................................................................... 287 Lesson 22: Average Rate of Change ....................................................................................................................................................... 296 Lesson 23: Nonlinear Motion ............................................................................................................................ 305
End-of-Module Assessment and

Rubric …………………………….316 Lessons: Square Areas Textbook HM 3-8, pp. 132-137 HM 7-1 thru 7-4, pp. 296-333 HM 7-2 thru 7-4, pp. 304-333
Tasks / Assessments First Rate Tasks / Bellwork Between the Lines Task / Bellwork Performance Tasks Patterns in Prague Perf Task
1- Make sense of
problems and
persevere in
solving them.
2- Reason
abstractly and
quantitatively.
3 - Construct viable
arguments and critique
the reasoning of others.
4 - Model with
mathematics.
5 - Use
appropriate
tools
strategically.
6 - Attend to precision. 7 - Look for
and make use of
structure.
8 - Look for and express
regularity in repeated
reasoning.
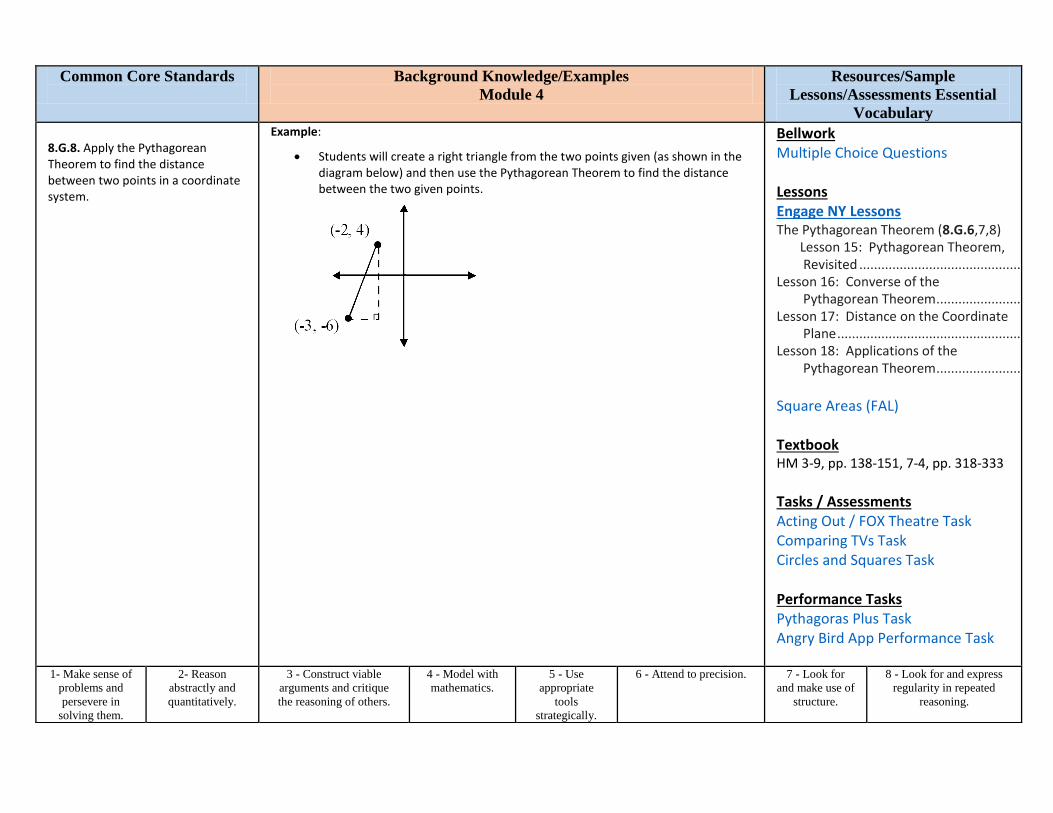
Common Core Standards
Background Knowledge/Examples
Module 4
Resources/Sample
Lessons/Assessments Essential
Vocabulary
8.G.8. Apply the Pythagorean Theorem to find the distance between two points in a coordinate system.
Example:
Students will create a right triangle from the two points given (as shown in the diagram below) and then use the Pythagorean Theorem to find the distance between the two given points.
Bellwork Multiple Choice Questions Lessons Engage NY Lessons The Pythagorean Theorem (8.G.6,7,8) Lesson 15: Pythagorean Theorem, Revisited ...................................................................................................................................................... 203 Lesson 16: Converse of the Pythagorean Theorem ................................................................................................................................. 217 Lesson 17: Distance on the Coordinate Plane ............................................................................................................................................................ 225 Lesson 18: Applications of the Pythagorean Theorem ................................................................................................................................. 241
Square Areas (FAL) Textbook HM 3-9, pp. 138-151, 7-4, pp. 318-333
Tasks / Assessments Acting Out / FOX Theatre Task Comparing TVs Task Circles and Squares Task Performance Tasks Pythagoras Plus Task Angry Bird App Performance Task
1- Make sense of
problems and
persevere in
solving them.
2- Reason
abstractly and
quantitatively.
3 - Construct viable
arguments and critique
the reasoning of others.
4 - Model with
mathematics.
5 - Use
appropriate
tools
strategically.
6 - Attend to precision. 7 - Look for
and make use of
structure.
8 - Look for and express
regularity in repeated
reasoning.

Common Core Standards
Background Knowledge/Examples
Module 4 Resources/Sample
Lessons/Assessments Essential
Vocabulary
8.G.9. Know the formulas for the volumes of cones, cylinders, and spheres and use them to solve real-world and mathematical problems.
Example:
James wanted to plant pansies in his new planter. He wondered how much potting soil he should buy to fill it. Use the measurements in the diagram below to determine the planter’s volume.
Bellwork Comparing Spheres and Cylinders p. 33
Lessons Estimating and Sampling Jelly Beans Calculating the Volume of Compound Objects (FAL) p. 36 Engage NY Lessons Applications of Radicals and Roots (8.G.7, 8.G.9) .............................................................................................................................................. 253 Lesson 19: Cones and Spheres........................................................................................................................... 255 Lesson 20: Truncated Cones .............................................................................................................................. 272 Lesson 21: Volume of Composite Solids .......................................................................................................................................................... 287 Lesson 22: Average Rate of Change ....................................................................................................................................................... 296 Lesson 23: Nonlinear Motion ............................................................................................................................ 305
End-of-Module Assessment and Rubric …………………………….316 Engage NY Lessons Volume (8.G.9) ................................................................................................................................................... 107 Lesson 9: Examples of Functions from Geometry ................................................................................................................................................... 108 Lesson 10: Volumes of Familiar Solids—Cones and Cylinders ..................................................................................................................... 122 Lesson 11: Volume of a Sphere ......................................................................................................................... 135
End-of-Module Assessment and Rubric ………………………….147

Textbook HM 6-1 thru 6-4, pp. 256-295
Tasks / Assessments Engage NY Assessment & Rubric (link above) …………………….147 Performance Tasks
Making Matchsticks (FAL) Greenhouse-Management-Perf Task
1- Make
sense
of
proble
ms and
perseve
re in
solving
them.
2- Reason
abstractly and
quantitatively.
3 - Construct viable
arguments and critique
the reasoning of others.
4 - Model with
mathematics.
5 - Use
appropriate
tools
strategically.
6 - Attend to precision. 7 - Look for
and make use of
structure.
8 - Look for and express
regularity in repeated
reasoning.
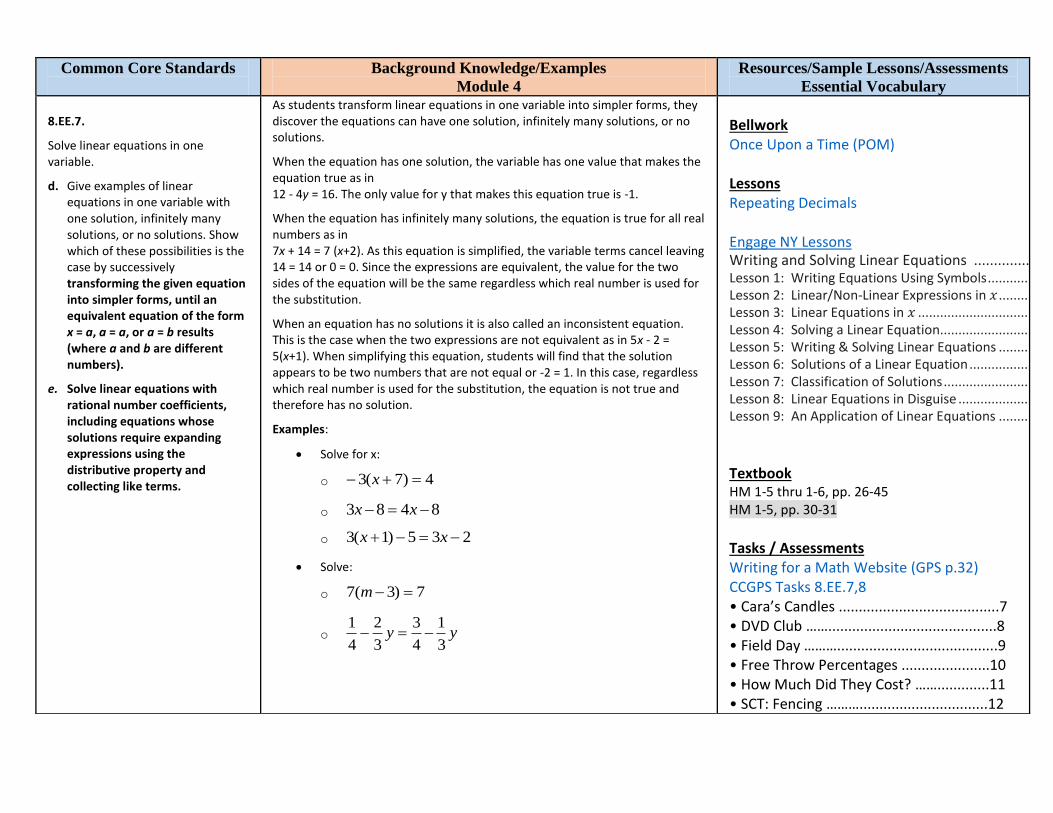
Common Core Standards
Background Knowledge/Examples
Module 4
Resources/Sample Lessons/Assessments
Essential Vocabulary
8.EE.7.
Solve linear equations in one variable.
d. Give examples of linear equations in one variable with one solution, infinitely many solutions, or no solutions. Show which of these possibilities is the case by successively transforming the given equation into simpler forms, until an equivalent equation of the form x = a, a = a, or a = b results (where a and b are different numbers).
e. Solve linear equations with rational number coefficients, including equations whose solutions require expanding expressions using the distributive property and collecting like terms.
As students transform linear equations in one variable into simpler forms, they discover the equations can have one solution, infinitely many solutions, or no solutions.
When the equation has one solution, the variable has one value that makes the equation true as in 12 - 4y = 16. The only value for y that makes this equation true is -1.
When the equation has infinitely many solutions, the equation is true for all real numbers as in 7x + 14 = 7 (x+2). As this equation is simplified, the variable terms cancel leaving 14 = 14 or 0 = 0. Since the expressions are equivalent, the value for the two sides of the equation will be the same regardless which real number is used for the substitution.
When an equation has no solutions it is also called an inconsistent equation. This is the case when the two expressions are not equivalent as in 5x - 2 = 5(x+1). When simplifying this equation, students will find that the solution appears to be two numbers that are not equal or -2 = 1. In this case, regardless which real number is used for the substitution, the equation is not true and therefore has no solution.
Examples:
Solve for x:
o
o
o
Solve:
o
o
Bellwork Once Upon a Time (POM) Lessons Repeating Decimals Engage NY Lessons Writing and Solving Linear Equations ................................................................................................... 10 Lesson 1: Writing Equations Using Symbols ........................................................................................................ 12 Lesson 2: Linear/Non-Linear Expressions in ..................................................................................................... 20 Lesson 3: Linear Equations in ........................................................................................................................... 28 Lesson 4: Solving a Linear Equation..................................................................................................................... 38 Lesson 5: Writing & Solving Linear Equations ..................................................................................................... 50 Lesson 6: Solutions of a Linear Equation ............................................................................................................. 61 Lesson 7: Classification of Solutions .................................................................................................................... 71 Lesson 8: Linear Equations in Disguise ................................................................................................................ 79 Lesson 9: An Application of Linear Equations ..................................................................................................... 92
Textbook HM 1-5 thru 1-6, pp. 26-45 HM 1-5, pp. 30-31
Tasks / Assessments Writing for a Math Website (GPS p.32) CCGPS Tasks 8.EE.7,8 • Cara’s Candles ........................................7 • DVD Club ……..........................................8 • Field Day ………........................................9 • Free Throw Percentages ......................10 • How Much Did They Cost? …….............11 • SCT: Fencing ………................................12
4)7(3 x
8483 xx
235)1(3 xx
7)3(7 m
yy3
1
4
3
3
2
4
1

• Playing with Straws …...........................14 • Planning a Party ……..............................15 • What are the Coefficients? ..................16 • Cell Phone Plans …………........................17 Performance Tasks
1- Make sense of
problems and
persevere in
solving them.
2- Reason
abstractly and
quantitatively.
3 - Construct viable
arguments and critique the
reasoning of others.
4 - Model with
mathematics.
5 - Use
appropriate
tools
strategically.
6 - Attend to
precision.
7 - Look for and make use
of structure.
8 - Look for and express
regularity in repeated
reasoning.
Common Core Standards
Background Knowledge/Examples
Module 4 Resources/Sample Lessons/Assessments
Essential Vocabulary 8.EE.8.
Analyze and solve pairs of simultaneous linear equations.
a. Understand that solutions to a system of two linear equations in two variables correspond to points of intersection of their graphs, because points of intersection satisfy both equations simultaneously.
b. Solve systems of two linear equations in two variables algebraically, and estimate solutions by graphing the equations. Solve simple cases by inspection. For example, 3x + 2y = 5 and 3x + 2y = 6 have no solution because 3x + 2y cannot simultaneously be 5 and 6.
Systems of linear equations can also have one solution, infinitely many solutions or no solutions. Students will discover these cases as they graph systems of linear equations and solve them algebraically.
A system of linear equations whose graphs meet at one point (intersecting lines) has only one solution, the ordered pair representing the point of intersection. A system of linear equations whose graphs do not meet (parallel lines) has no solutions and the slopes of these lines are the same. A system of linear equations whose graphs are coincident (the same line) has infinitely many solutions, the set of ordered pairs representing all the points on the line.
By making connections between algebraic and graphical solutions and the context of the system of linear equations, students are able to make sense of their solutions. Students need opportunities to work with equations and context that include whole number and/or decimals/fractions.
Examples:
Find x and y using elimination and then using substitution.
o 3x + 4y = 7
o -2x + 8y = 10
Plant A and Plant B are on different watering schedules. This affects their rate of growth. Compare the growth of the two plants to determine when their heights will be the same.
Let W = number of weeks
Let H = height of the plant after W weeks
Plant A Plant B
W H W H
0 4 (0,4) 0 2 (0,2)
1 6 (1,6) 1 6 (1,6)
2 8 (2,8) 2 10 (2,10)
3 10 (3,10) 3 14 (3,14)
Given each set of coordinates, graph their corresponding lines.
Solution:
Bellwork Fencing_Bellwork CCGPS Tasks 8.EE.7,8 Field Day ………………………………………… 9 How Much Did They Cost? .............11 Planning a Party ................................15 Lessons Solving Real World Problems: Baseball Jerseys (FAL) Classifying Solutions to System of Equations (FAL) Engage NY Lessons Systems of Linear Equations and Their Solutions (8.EE.8, 8.EE.5, 8.EE.7) ..................................................................................................................... 359 Lesson 24: Introduction to Simultaneous Equations ......................................................................................................................................... 361 Lesson 25: Geometric Interpretation of the Solutions of a Linear System ............................................................................................................ 379 Lesson 26: Charac. of Parallel Lines ................................................................................................................... 395 Lesson 27: Nature of Solutions of a System of Linear Equations............................................................................................................................... 409 Lesson 28: Another Computational Method of Solving a Linear System .................................................................................................................... 425 Lesson 29: Word Problems ................................................................................................................................ 441 Lesson 30: Conversion Between Celsius and Fahrenheit ........................................................................................................................................ 455 Lesson 31: System of Equations Leading to Pythagorean Triples……………….…465
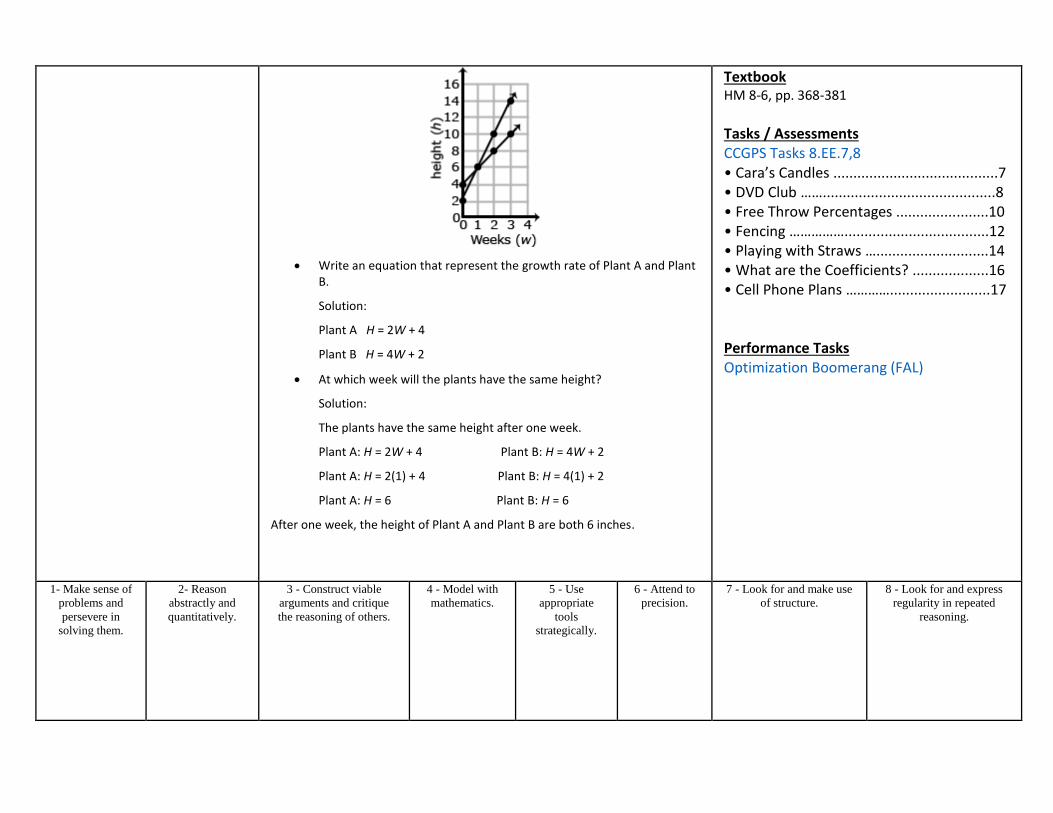
Write an equation that represent the growth rate of Plant A and Plant B.
Solution:
Plant A H = 2W + 4
Plant B H = 4W + 2
At which week will the plants have the same height?
Solution:
The plants have the same height after one week.
Plant A: H = 2W + 4 Plant B: H = 4W + 2
Plant A: H = 2(1) + 4 Plant B: H = 4(1) + 2
Plant A: H = 6 Plant B: H = 6
After one week, the height of Plant A and Plant B are both 6 inches.
Textbook HM 8-6, pp. 368-381
Tasks / Assessments CCGPS Tasks 8.EE.7,8 • Cara’s Candles .........................................7 • DVD Club ……...........................................8 • Free Throw Percentages .......................10 • Fencing ……………....................................12 • Playing with Straws …............................14 • What are the Coefficients? ...................16 • Cell Phone Plans ………….........................17 Performance Tasks Optimization Boomerang (FAL)
1- Make sense of
problems and
persevere in
solving them.
2- Reason
abstractly and
quantitatively.
3 - Construct viable
arguments and critique
the reasoning of others.
4 - Model with
mathematics.
5 - Use
appropriate
tools
strategically.
6 - Attend to
precision.
7 - Look for and make use
of structure.
8 - Look for and express
regularity in repeated
reasoning.

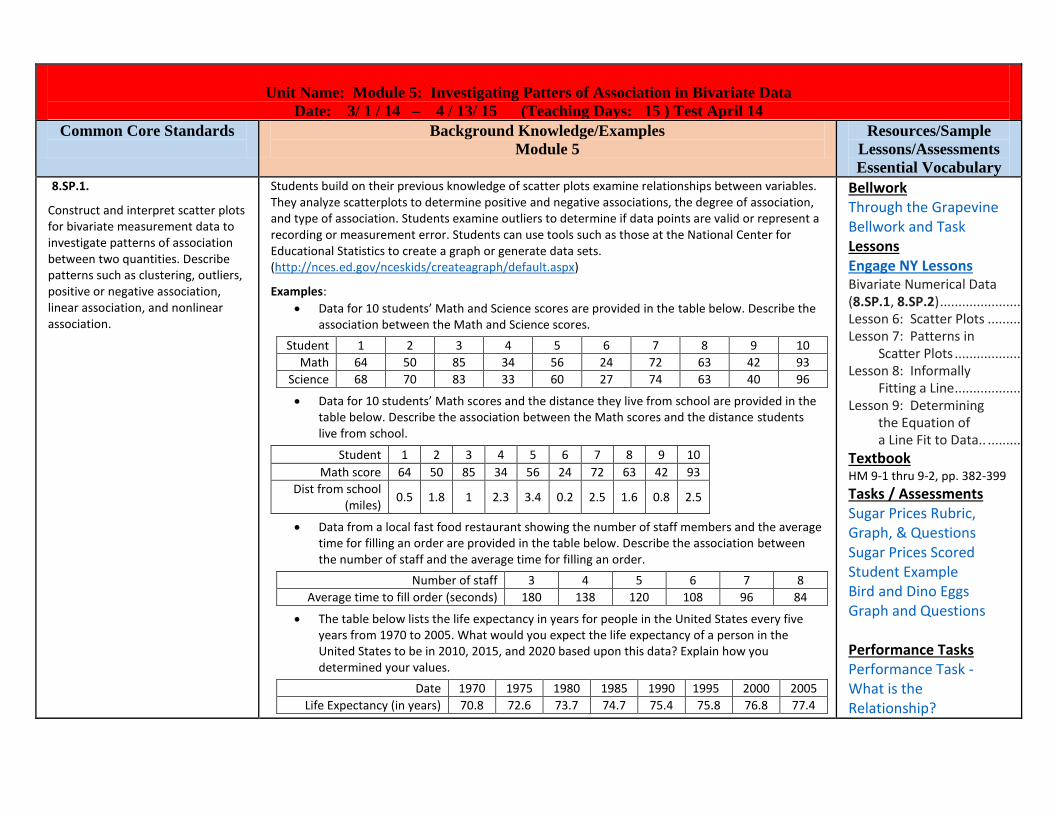
Unit Name: Module 5: Investigating Patters of Association in Bivariate Data
Date: 3/ 1 / 14 – 4 / 13/ 15 (Teaching Days: 15 ) Test April 14
Common Core Standards
Background Knowledge/Examples
Module 5
Resources/Sample
Lessons/Assessments
Essential Vocabulary 8.SP.1.
Construct and interpret scatter plots for bivariate measurement data to investigate patterns of association between two quantities. Describe patterns such as clustering, outliers, positive or negative association, linear association, and nonlinear association.
Students build on their previous knowledge of scatter plots examine relationships between variables. They analyze scatterplots to determine positive and negative associations, the degree of association, and type of association. Students examine outliers to determine if data points are valid or represent a recording or measurement error. Students can use tools such as those at the National Center for Educational Statistics to create a graph or generate data sets. (http://nces.ed.gov/nceskids/createagraph/default.aspx)
Examples:
Data for 10 students’ Math and Science scores are provided in the table below. Describe the association between the Math and Science scores.
Student 1 2 3 4 5 6 7 8 9 10
Math 64 50 85 34 56 24 72 63 42 93
Science 68 70 83 33 60 27 74 63 40 96
Data for 10 students’ Math scores and the distance they live from school are provided in the table below. Describe the association between the Math scores and the distance students live from school.
Student 1 2 3 4 5 6 7 8 9 10
Math score 64 50 85 34 56 24 72 63 42 93
Dist from school (miles)
0.5 1.8 1 2.3 3.4 0.2 2.5 1.6 0.8 2.5
Data from a local fast food restaurant showing the number of staff members and the average time for filling an order are provided in the table below. Describe the association between the number of staff and the average time for filling an order.
Number of staff 3 4 5 6 7 8
Average time to fill order (seconds) 180 138 120 108 96 84
The table below lists the life expectancy in years for people in the United States every five years from 1970 to 2005. What would you expect the life expectancy of a person in the United States to be in 2010, 2015, and 2020 based upon this data? Explain how you determined your values.
Date 1970 1975 1980 1985 1990 1995 2000 2005
Life Expectancy (in years) 70.8 72.6 73.7 74.7 75.4 75.8 76.8 77.4
Bellwork Through the Grapevine Bellwork and Task Lessons Engage NY Lessons Bivariate Numerical Data (8.SP.1, 8.SP.2) ...................................................................................................................................................... 66 Lesson 6: Scatter Plots ......................................................................................................................................... 67 Lesson 7: Patterns in Scatter Plots .................................................................................................................................................. 79 Lesson 8: Informally Fitting a Line .................................................................................................................................................. 96 Lesson 9: Determining the Equation of a Line Fit to Data.. ....................................................................................................................................... 108
Textbook HM 9-1 thru 9-2, pp. 382-399 Tasks / Assessments Sugar Prices Rubric, Graph, & Questions Sugar Prices Scored Student Example Bird and Dino Eggs Graph and Questions Performance Tasks Performance Task - What is the Relationship?

Common Core Standards
Background Knowledge/Examples
Module 5 Resources/Sample
Lessons/Assessments
Essential Vocabulary
8.SP.2.
Know that straight lines are widely used to model relationships between two quantitative variables. For scatter plots that suggest a linear association, informally fit a straight line, and informally assess the model fit by judging the closeness of the data points to the line.
Examples:
The capacity of the fuel tank in a car is 13.5 gallons. The table below shows the number of miles traveled and how many gallons of gas have been used. Describe the relationship between the variables. If the data is linear, determine a line of best fit. Do you think the line represents a good fit for the data set? Why or why not? What is the average fuel efficiency of the car in miles per gallon?
Miles Traveled 0 75 120 160 250 300
Gallons Used 0 2.3 4.5 5.7 9.7 10.7
Bellwork Through the Grapevine Bellwork and Task Lessons Engage NY Lessons Bivariate Numerical Data (8.SP.1, 8.SP.2) ...................................................................................................................................................... 66 Lesson 6: Scatter Plots ......................................................................................................................................... 67 Lesson 7: Patterns in Scatter Plots .................................................................................................................................................. 79 Lesson 8: Informally Fitting a Line ................................................................................................................................................. 96 Lesson 9: Determining the Equation of a Line Fit to Data.. ....................................................................................................................................... 108
Textbook HM 9-1 thru 9-2, pp. 382-399 Tasks / Assessments * Computer Game Task * Birds Eggs Task * Scatter Diagram Task * 8SP2 Multiple Choice Questions Engage NY Lessons Assessment and Rubric ..120 Performance Tasks Heartbeats Too (CCGPS p.32)

Common Core Standards
Background Knowledge/Examples
Module 5
Resources/Sample Lessons/Assessments
Essential Vocabulary
8.SP.3.
Use the equation of a linear model to solve problems in the context of bivariate measurement data, interpreting the slope and intercept. For example, in a linear model for a biology experiment, interpret a slope of 1.5 cm/hr as meaning that an additional hour of sunlight each day is associated with an additional 1.5 cm in mature plant height.
Examples:
Given data from students’ math scores and absences, make a scatterplot.
o Draw a line of best fit, paying attention to the closeness of the data points on either side of the line.
o From the line of best fit, determine an approximate linear
equation that models the given data (about y = 953
25 x )
o Students should recognize that 95 represents the y intercept and
Bellwork Business Activity Bellwork Lessons Engage NY Lessons Linear and Nonlinear Models (8.SP.1, 8.SP.2, 8.SP.3)……………..……………..………..130 Lesson 10: Linear Models.................................................................................................................................... 131 Lesson 11: Using Linear Models in a Data Context ............................................................................................................................................. 142 Lesson 12: Nonlinear Models in a Data Context ………….. ............................................................................................................................... 152
Line of Best Fit Ppt Textbook HM 9-1 thru 9-2, pp. 382-399 Tasks / Assessments Obesity Rate Task Performance Tasks
3
25 represents the slope of the line.
o Students can use this linear model to solve problems. For example, through substitution, they can use the equation to determine that a student with 4 absences should expect to receive a math score of about 62. They can then compare this value to their line.
1- Make sense of
problems and
persevere in
solving them.
2- Reason
abstractly and
quantitatively.
3 - Construct viable
arguments and critique
the reasoning of others.
4 - Model with
mathematics.
5 - Use
appropriate
tools
strategically.
6 - Attend to
precision.
7 - Look for and make use
of structure.
8 - Look for and express
regularity in repeated
reasoning.
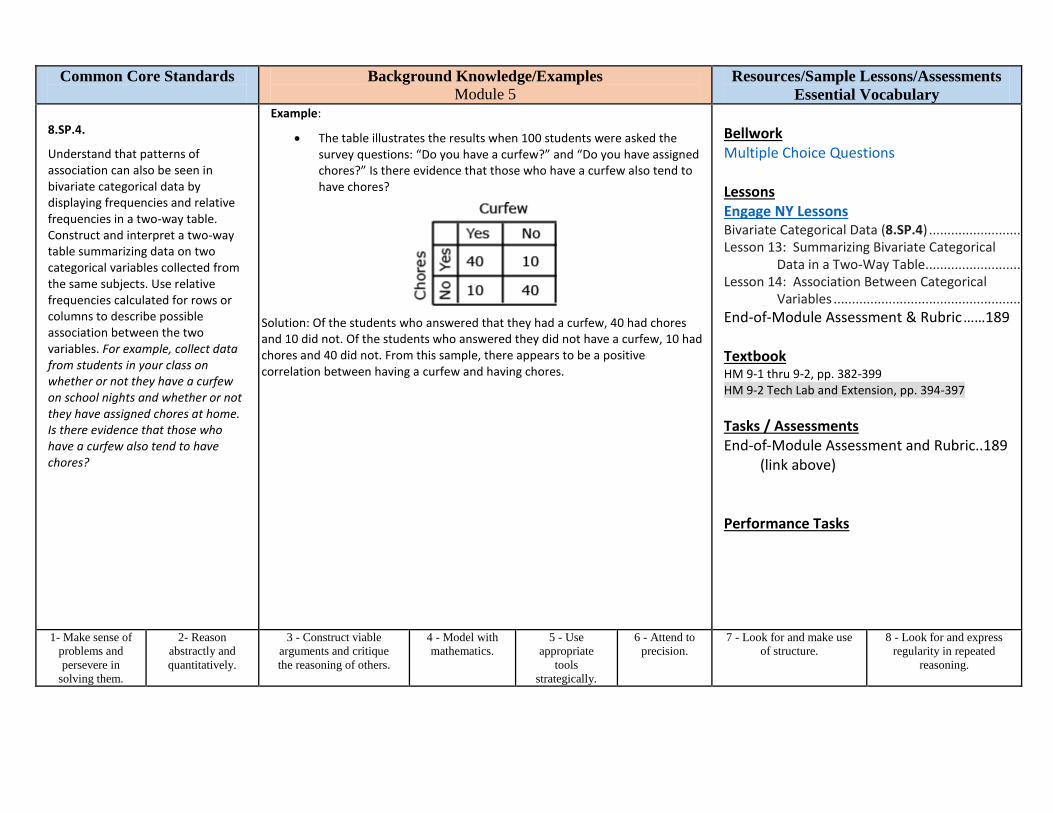
Common Core Standards
Background Knowledge/Examples
Module 5 Resources/Sample Lessons/Assessments
Essential Vocabulary
8.SP.4.
Understand that patterns of association can also be seen in bivariate categorical data by displaying frequencies and relative frequencies in a two-way table. Construct and interpret a two-way table summarizing data on two categorical variables collected from the same subjects. Use relative frequencies calculated for rows or columns to describe possible association between the two variables. For example, collect data from students in your class on whether or not they have a curfew on school nights and whether or not they have assigned chores at home. Is there evidence that those who have a curfew also tend to have chores?
Example:
The table illustrates the results when 100 students were asked the survey questions: “Do you have a curfew?” and “Do you have assigned chores?” Is there evidence that those who have a curfew also tend to have chores?
Solution: Of the students who answered that they had a curfew, 40 had chores and 10 did not. Of the students who answered they did not have a curfew, 10 had chores and 40 did not. From this sample, there appears to be a positive correlation between having a curfew and having chores.
Bellwork Multiple Choice Questions Lessons Engage NY Lessons Bivariate Categorical Data (8.SP.4) ..................................................................................................................... 166 Lesson 13: Summarizing Bivariate Categorical Data in a Two-Way Table ...................................................................................................................... 167 Lesson 14: Association Between Categorical Variables ............................................................................................................................................... 179
End-of-Module Assessment & Rubric ……189 Textbook HM 9-1 thru 9-2, pp. 382-399 HM 9-2 Tech Lab and Extension, pp. 394-397
Tasks / Assessments End-of-Module Assessment and Rubric..189 (link above) Performance Tasks
1- Make sense of
problems and
persevere in
solving them.
2- Reason
abstractly and
quantitatively.
3 - Construct viable
arguments and critique
the reasoning of others.
4 - Model with
mathematics.
5 - Use
appropriate
tools
strategically.
6 - Attend to
precision.
7 - Look for and make use
of structure.
8 - Look for and express
regularity in repeated
reasoning.

Standards for Mathematical Practice
Standards: Students are expected to: Explanations and Examples
8.MP.1. Make sense of problems and persevere in solving them.
In Grade 8, students solve real world problems through the application of algebraic and geometric concepts. Students seek the meaning of a problem and look for efficient ways to represent and solve it. They may check their thinking by asking themselves, “What is the most efficient way to solve the problem?”, “Does this make sense?”, and “Can I solve the problem in a different way?”
8.MP.2. Reason abstractly and quantitatively.
In Grade 8, students represent a wide variety of real world contexts through the use of real numbers and variables in mathematical expressions, equations, and inequalities. They examine patterns in data and assess the degree of linearity of functions. Students contextualize to understand the meaning of the number or variable as related to the problem and decontextualize to manipulate symbolic representations by applying properties of operations.
8.MP.3. Construct viable arguments and critique the reasoning of others.
In Grade 8, students construct arguments using verbal or written explanations accompanied by expressions, equations, inequalities, models, and graphs, tables, and other data displays (e.g., box plots, dot plots, histograms). They further refine their mathematical communication skills through mathematical discussions in which they critically evaluate their own thinking and the thinking of other students. They pose questions like “How did you get that?”, “Why is that true?”, and “Does that always work?” They explain their thinking to others and respond to others’ thinking.
8.MP.4. Model with mathematics.
In Grade 8, students model problem situations symbolically, graphically, tabularly, and contextually. Students form expressions, equations, or inequalities from real world contexts and connect symbolic and graphical representations. Students solve systems of linear equations and compare properties of functions provided in different forms. Students use scatterplots to represent data and describe associations between variables. Students need many opportunities to connect and explain the connections between the different representations. They should be able to use all of these representations as appropriate to a problem context.
8.MP.5. Use appropriate tools strategically.
Students consider available tools (including estimation and technology) when solving a mathematical problem and decide when certain tools might be helpful. For instance, students in grade 8 may translate a set of data given in tabular form to a graphical representation to compare it to another data set. Students might draw pictures, use applets, or write equations to show the relationships between the angles created by a transversal.
8.MP.6. Attend to precision. In Grade 8, students continue to refine their mathematical communication skills by using clear and precise language in their discussions with others and in their own reasoning. Students use appropriate terminology when referring to the number system, functions, geometric figures, and data displays.
8.MP.7. Look for and make use of structure.
Students routinely seek patterns or structures to model and solve problems. In grade 8, students apply properties to generate equivalent expressions and solve equations. Students examine patterns in tables and graphs to generate equations and describe relationships. Additionally, students experimentally verify the effects of transformations and describe them in terms of congruence and similarity.
8.MP.8. Look for and express regularity in repeated reasoning.
In Grade 8, students use repeated reasoning to understand algorithms and make generalizations about patterns. Students use iterative processes to determine more precise rational approximations for irrational numbers. During multiple opportunities to solve and model problems, they notice that the slope of a line and rate of change are the same value. Students flexibly make connections between covariance, rates, and representations showing the relationships between quantities.

