844 brain - stanford university et al. 2013... · brain a journal of ... (whitwell et al., 2007;...
TRANSCRIPT
BRAINA JOURNAL OF NEUROLOGY
Diverging patterns of amyloid deposition andhypometabolism in clinical variants of probableAlzheimer’s diseaseManja Lehmann,1,2,3 Pia M. Ghosh,1,2 Cindee Madison,2 Robert Laforce Jr,1,2
Chiara Corbetta-Rastelli,2 Michael W. Weiner,4 Michael D. Greicius,5 William W. Seeley,1
Maria L. Gorno-Tempini,1 Howard J. Rosen,1 Bruce L. Miller,1 William J. Jagust1,2,6 andGil D. Rabinovici1,2,6
1 Memory and Ageing Centre, Department of Neurology, University of California, San Francisco, CA 94158, USA
2 Helen Wills Neuroscience Institute, University of California, Berkeley, CA 94720, USA
3 Dementia Research Centre, Institute of Neurology, University College London, Queen Square, London, WC1N 3BG, UK
4 Centre for Imaging of Neurodegenerative Diseases, Department of Veterans Affairs Medical Centre, San Francisco, CA 94121, USA
5 Functional Imaging in Neuropsychiatric Disorders (FIND) Laboratory, Department of Neurology and Neurological Sciences, Stanford University
School of Medicine, Stanford, CA 94305, US
6 Lawrence Berkeley National Laboratory, Department of Radiology, University of California, Berkeley, CA 94720, USA
Correspondence to: Manja Lehmann,
UCSF Memory and Ageing Centre,
Department of Neurology,
Box 1207, San Francisco,
CA 94158-1207
E-mail: [email protected]
The factors driving clinical heterogeneity in Alzheimer’s disease are not well understood. This study assessed the relationship
between amyloid deposition, glucose metabolism and clinical phenotype in Alzheimer’s disease, and investigated how these
relate to the involvement of functional networks. The study included 17 patients with early-onset Alzheimer’s disease (age at
onset 565 years), 12 patients with logopenic variant primary progressive aphasia and 13 patients with posterior cortical atrophy
[whole Alzheimer’s disease group: age = 61.5 years (standard deviation 6.5 years), 55% male]. Thirty healthy control subjects
[age = 70.8 (3.3) years, 47% male] were also included. Subjects underwent positron emission tomography with 11C-labelled
Pittsburgh compound B and 18F-labelled fluorodeoxyglucose. All patients met National Institute on Ageing–Alzheimer’s
Association criteria for probable Alzheimer’s disease and showed evidence of amyloid deposition on 11C-labelled Pittsburgh
compound B positron emission tomography. We hypothesized that hypometabolism patterns would differ across variants,
reflecting involvement of specific functional networks, whereas amyloid patterns would be diffuse and similar across variants.
We tested these hypotheses using three complimentary approaches: (i) mass-univariate voxel-wise group comparison of18F-labelled fluorodeoxyglucose and 11C-labelled Pittsburgh compound B; (ii) generation of covariance maps across all subjects
with Alzheimer’s disease from seed regions of interest specifically atrophied in each variant, and comparison of these maps to
functional network templates; and (iii) extraction of 11C-labelled Pittsburgh compound B and 18F-labelled fluorodeoxyglucose
values from functional network templates. Alzheimer’s disease clinical groups showed syndrome-specific 18F-labelled fluoro-
deoxyglucose patterns, with greater parieto-occipital involvement in posterior cortical atrophy, and asymmetric involvement of
left temporoparietal regions in logopenic variant primary progressive aphasia. In contrast, all Alzheimer’s disease variants
showed diffuse patterns of 11C-labelled Pittsburgh compound B binding, with posterior cortical atrophy additionally showing
elevated uptake in occipital cortex compared with early-onset Alzheimer’s disease. The seed region of interest covariance
doi:10.1093/brain/aws327 Brain 2013: 136; 844–858 | 844
Received June 12, 2012. Revised September 24, 2012. Accepted October 17, 2012. Advance Access publication January 28, 2013
� The Author (2013). Published by Oxford University Press on behalf of the Guarantors of Brain. All rights reserved.
For Permissions, please email: [email protected]
at Periodicals Departm
ent/Lane L
ibrary on March 21, 2013
http://brain.oxfordjournals.org/D
ownloaded from
analysis revealed distinct 18F-labelled fluorodeoxyglucose correlation patterns that greatly overlapped with the right
executive-control network for the early-onset Alzheimer’s disease region of interest, the left language network for the logopenic
variant primary progressive aphasia region of interest, and the higher visual network for the posterior cortical atrophy region of
interest. In contrast, 11C-labelled Pittsburgh compound B covariance maps for each region of interest were diffuse. Finally,18F-labelled fluorodeoxyglucose was similarly reduced in all Alzheimer’s disease variants in the dorsal and left ventral default
mode network, whereas significant differences were found in the right ventral default mode, right executive-control (both lower
in early-onset Alzheimer’s disease and posterior cortical atrophy than logopenic variant primary progressive aphasia) and higher-
order visual network (lower in posterior cortical atrophy than in early-onset Alzheimer’s disease and logopenic variant primary
progressive aphasia), with a trend towards lower 18F-labelled fluorodeoxyglucose also found in the left language network in
logopenic variant primary progressive aphasia. There were no differences in 11C-labelled Pittsburgh compound B binding be-
tween syndromes in any of the networks. Our data suggest that Alzheimer’s disease syndromes are associated with degener-
ation of specific functional networks, and that fibrillar amyloid-b deposition explains at most a small amount of the
clinico-anatomic heterogeneity in Alzheimer’s disease.
Keywords: Alzheimer’s disease; posterior cortical atrophy; logopenic variant of PPA; positron emission tomography (PET); functionalnetworks
Abbreviations: FDG = fluorodeoxyglucose; MMSE = Mini-Mental State Examination; PIB = Pittsburgh compound B; PPA = primaryprogressive aphasia
IntroductionAlthough episodic memory loss is considered the clinical hallmark
of Alzheimer’s disease, a significant number of patients with
underlying Alzheimer’s disease pathology present with focal,
non-amnestic clinical syndromes. Patients with early age-of-onset
Alzheimer’s disease (defined as 565 years in most studies) tend to
show more heterogeneous neuropsychological deficits, including
greater impairment in attention, executive, visuospatial and lan-
guage functions, and relatively spared memory compared with
patients with late age-of-onset (Koss et al., 1996; Frisoni et al.,
2007; Koedam et al., 2010). Alzheimer’s disease pathology is also
the most common cause of two focal cortical syndromes asso-
ciated with early age-of-onset: posterior cortical atrophy, a condi-
tion characterized by predominant visuospatial and
visuoperceptual dysfunction (Benson et al., 1988; Crutch et al.,
2012), and the logopenic variant of primary progressive aphasia
(PPA), a progressive disorder of language (Gorno-Tempini et al.,
2008; Mesulam et al., 2008). It has been suggested that up to
15% of patients with Alzheimer’s disease seen in dementia centres
have non-amnestic presentations (Snowden et al., 2007), and the
importance of these syndromes is reflected in their inclusion in
new diagnostic guidelines for Alzheimer’s disease (McKhann
et al., 2011). A better understanding of the factors that drive
the heterogeneity of these clinical phenotypes may yield important
insights into Alzheimer’s disease mechanisms and have direct im-
plications for diagnosis and management of non-amnestic patients
with emerging disease-specific therapies.
The pattern of neurodegeneration in Alzheimer’s disease vari-
ants is highly correlated with the clinical syndrome. Compared
with ‘typical’ amnestic late-onset Alzheimer’s disease, patients
with early-onset Alzheimer’s disease show relative sparing of the
medial temporal lobes and greater atrophy in temporoparietal and
lateral prefrontal cortex (Frisoni et al., 2005; Shiino et al., 2008;
Rabinovici et al., 2010). Patients with posterior cortical atrophy
and logopenic variant PPA show strikingly focal patterns of neu-
rodegeneration, with greater bilateral occipito-parietal atrophy and
hypometabolism in posterior cortical atrophy and highly asymmet-
ric left temporoparietal involvement in logopenic variant PPA
(Whitwell et al., 2007; Rabinovici et al., 2008; Migliaccio et al.,
2009; Rosenbloom et al., 2010; Lehmann et al., 2011).
There have been conflicting reports in the literature regarding
the relationship between the distribution of Alzheimer’s disease
pathology and the region-specific neurodegenerative patterns
seen in Alzheimer’s disease variants. Some autopsy studies have
reported an increased burden of both amyloid plaques and neuro-
fibrillary tangles in visual regions in posterior cortical atrophy
(Levine et al., 1993; Ross et al., 1996; Hof et al., 1997), whereas
others have found increases in tangle, but not plaque burden
(Renner et al., 2004; Tang-Wai et al., 2004). Similarly, pathology
studies in PPA due to Alzheimer’s disease have more frequently
found an increased burden of tangles than plaques in the left
hemisphere compared with amnestic Alzheimer’s disease
(Mesulam et al., 2008; Gefen et al., 2012), though this is highly
variable across patients and between studies (Galton et al., 2000;
Knibb et al., 2006). In vivo studies using PET with the
amyloid-b-specific tracer Pittsburgh compound B (PIB) have re-
ported greater PIB uptake in occipital cortex in posterior cortical
atrophy (Ng et al., 2007; Tenovuo et al., 2008; Kambe et al.,
2010; Formaglio et al., 2011), and left temporoparietal regions
in PPA (Ng et al., 2007) in single cases and small series studies,
whereas larger group studies have found no differences in PIB
retention patterns in posterior cortical atrophy or PPA versus
amnestic Alzheimer’s disease (Rabinovici et al., 2008;
Rosenbloom et al., 2010; de Souza et al., 2011; Leyton et al.,
2011). To our knowledge, no study has compared patterns of
amyloid aggregation and neurodegeneration across three
common clinical phenotypes of early age-of-onset Alzheimer’s dis-
ease. A better characterization of the relationship between
clinico-anatomical heterogeneity in Alzheimer’s disease and
Diverging PIB and FDG patterns in Alzheimer’s disease Brain 2013: 136; 844–858 | 845
at Periodicals Departm
ent/Lane L
ibrary on March 21, 2013
http://brain.oxfordjournals.org/D
ownloaded from

amyloid is particularly timely, given the emergence of therapies
that specifically target amyloid-b pathology (Holmes et al.,
2008; Salloway et al., 2009).
Converging data from animal models and human imaging stu-
dies support the hypothesis that Alzheimer’s disease spreads
through interconnected neural networks (Clavaguera et al.,
2009; de Calignon et al., 2012; Zhou et al., 2012). In transgenic
mice, neurofibrillary pathology appears to spread sequentially from
synapse to synapse, ultimately reflecting the pattern of structural
connectivity (Clavaguera et al., 2009; de Calignon et al., 2012).
Neuroimaging studies in humans demonstrate that disease-specific
atrophy patterns closely match functional connectivity maps in
cognitively normal individuals, suggesting that Alzheimer’s disease
and other neurodegenerative disorders target specific functional
networks (Seeley et al., 2009; Zhou et al., 2012). In Alzheimer’s
disease, many studies have demonstrated disruption of the default
mode network in typical amnestic patients (Greicius et al., 2004;
Wang et al., 2007), including in the pre-dementia phase
(Rombouts et al., 2005; Sorg et al., 2007; Sheline et al., 2010;
Mormino et al., 2011). This finding is particularly compelling con-
sidering that disruptions to the default mode network are asso-
ciated with poor performance on memory tests (Otten and Rugg,
2001; Grady et al., 2006; Miller et al., 2008; Sambataro et al.,
2010). It is therefore conceivable that the disproportionate visual
and language deficits seen in patients with posterior cortical atro-
phy and logopenic variant PPA may reflect spread of disease
through visual and language networks, respectively, whereas the
high incidence of executive and attention difficulties in patients
with early-onset Alzheimer’s disease may indicate involvement of
the executive-control network. This model would suggest that
Alzheimer’s disease pathology may originate in a common net-
work, most likely the default mode network, and that clinical het-
erogeneity in Alzheimer’s disease reflects differential dissemination
of pathology from the default mode network into distinct ‘off-
target’ functional networks.
In this study, we sought to compare patterns of amyloid
deposition (PIB-PET) and neurodegeneration [fluorodeoxyglucose
(FDG)-PET)] across three primary clinical phenotypes of early age-
of-onset Alzheimer’s disease. These less common Alzheimer’s dis-
ease variants were chosen over the more common late-onset
amnestic variant of Alzheimer’s disease to maximize heterogeneity
in our study population and increase the likelihood of identifying
the mechanisms that contribute to the clinico-anatomic variance of
the disease. Our hypothesis was that neurodegeneration in the
three Alzheimer’s disease variants follows distinct patterns that
mirror the involvement of specific functional networks: execu-
tive-control in early-onset Alzheimer’s disease, language in logo-
penic variant PPA and higher-order visual in posterior cortical
atrophy, whereas the default mode network is a core network
that is involved in all three variants. We further predicted that
distinct patterns of neurodegeneration in the three Alzheimer’s
disease variants would not be explained by patterns of amyloid
deposition. We tested these hypotheses using three complimen-
tary approaches: (i) traditional mass-univariate voxel-wise group
comparisons; (ii) generation of covariance maps across all subjects
with Alzheimer’s disease from seed regions of interest shown to be
specifically affected in each variant, and comparison of these maps
with functional network templates; and (iii) extraction of PIB and18F-labelled FDG values from templates of well-described func-
tional networks.
Materials and methods
SubjectsPatients with early-onset Alzheimer’s disease, logopenic variant PPA
and posterior cortical atrophy were recruited from research cohorts at
the University of California San Francisco (UCSF) Memory and Ageing
Centre. All patients underwent a history and physical examination by a
neurologist, a structured caregiver interview by a nurse and a battery
of neuropsychological tests (Kramer et al., 2003). Clinical diagnosis
was assigned by consensus at a multidisciplinary conference.
Clinicians were blinded to PET results at the time of diagnosis.
All patients had at least one usable FDG-PET, PIB-PET and MRI
scan. All subjects fulfilled criteria for probable Alzheimer’s disease
according to the National Institute on Ageing–Alzheimer’s
Association criteria (McKhann et al., 2011) and showed evidence of
amyloid deposition on PIB-PET. Patients were excluded if they pre-
sented with core features of other dementias, such as dementia with
Lewy bodies, therefore reducing the likelihood of underlying
co-pathologies that are associated with amyloid-b deposition.
Patients with posterior cortical atrophy and logopenic variant PPA
were initially selected based on their clinical diagnosis. Clinical and
neuropsychological reports were then reviewed to assess whether pa-
tients fulfilled specific diagnostic criteria (logopenic variant PPA:
Gorno-Tempini et al., 2011; posterior cortical atrophy: Mendez
et al., 2002; Tang-Wai et al., 2004). Patients with early-onset
Alzheimer’s disease had an age of onset 565 years and did not
meet criteria for posterior cortical atrophy and logopenic variant
PPA. Early age-of-onset patients were chosen over late-onset patients
to allow us to match this group to the relatively young logopenic
variant PPA and posterior cortical atrophy groups. The selection of
clinical phenotypes in this study also matched the clinical variants
included in Migliaccio et al. (2009) from which seed regions of interest
for the covariance analysis were identified (see later in the text).
The final cohort consisted of 17 patients with early-onset
Alzheimer’s disease, 12 patients with logopenic variant PPA and 13
patients with posterior cortical atrophy. Demographics and clinical data
are summarized in Table 1. A proportion of these patients were
included in previous PET studies [31% of patients with posterior cor-
tical atrophy and 59% of patients with early-onset Alzheimer’s disease
in Rabinovici et al. (2010); three patients with logopenic variant PPA
(25%) in Rabinovici et al. (2008); 77% of patients with posterior
cortical atrophy and 35% of patients with early-onset Alzheimer’s dis-
ease in Rosenbloom et al. (2010)]. Thirty healthy control subjects were
included for comparison. The majority of the control subjects (27 of
the 30) were recruited as part of the Berkeley Ageing Cohort
(Mormino et al., 2009), with three subjects recruited at the UCSF.
Selection of control participants was primarily based on the availability
of PET scans. Of those control subjects with PET scans, we selected
the youngest 30 participants to match the mean age of the control
group to that of the patient group. The Berkeley Ageing Cohort eli-
gibility criteria include a minimum age of 60 years, which prevented
more accurate age-matching of control subjects to patients. Further
eligibility criteria included normal performance on cognitive tests, ab-
sence of neurological or psychiatric illness and lack of major medical
illnesses and medications that affect cognition (Mormino et al., 2009).
846 | Brain 2013: 136; 844–858 M. Lehmann et al.
at Periodicals Departm
ent/Lane L
ibrary on March 21, 2013
http://brain.oxfordjournals.org/D
ownloaded from
Informed consent was obtained from all subjects or their assigned
surrogate decision-makers, and the study was approved by the
University of California Berkeley, the UCSF and the Lawrence
Berkeley National Laboratory institutional review boards for human
research.
Positron emission tomography imageacquisition and preprocessingAll subjects underwent PET imaging with 11C-PIB and 18F-FDG at
Lawrence Berkeley National Laboratory on a Siemens ECAT EXACT
HR PET scanner in 3D acquisition mode. Tracer synthesis, PET acqui-
sition and preprocessing are described in detail in the online
Supplementary material. For PIB, voxel-wise distribution volume
ratios were calculated using Logan graphical analysis (Logan et al.,
1996) with the grey matter cerebellum time–activity curve used as a
reference tissue input function (Price et al., 2005). FDG-PET frames
were summed and standard uptake volume ratios were calculated by
normalizing the summed FDG image to mean activity in the pons for
each subject (Minoshima et al., 1995). PIB and FDG volumes were
spatially normalized to Montreal Neurological Institute (MNI) space. All
normalized images were smoothed with a 12-mm kernel. In a post hoc
analysis, we corrected PET data for atrophy by applying a
two-compartmental partial volume correction (Meltzer et al., 1990)
(Supplementary material).
Magnetic resonance image acquisitionand processingT1-weighted scans were collected on different MRI units, including
two 1.5 T units (Magnetom Avanto System, Siemens Medical
Systems; Magneton VISION system, Siemens Inc), one 3 T unit
(Siemens Tim Trio scanner) and one 4 T unit (BrukerMedSpec).
Acquisition parameters for all scanners have been previously described
(Rosen et al., 2002; Mueller et al., 2009; Mormino et al., 2012; Zhou
et al., 2012). The proportions of subjects studied on each scanner
were balanced across the three Alzheimer’s disease groups, although
90% of control subjects were studied on a single 1.5 T scanner.
Anatomical scans were processed using FreeSurfer version 4.5
(http://surfer.nmr.mgh.harvard.edu; Dale et al., 1999) to generate
subcortical parcellations used for defining subject-specific reference
regions.
Positron emission tomography imageanalysisPET data were analysed using three different approaches:
(i) mass-univariate voxel-wise group comparisons of FDG and PIB;
(ii) generation of covariance maps across all subjects with
Alzheimer’s disease from seed regions of interest shown to be specif-
ically atrophied in each Alzheimer’s disease variant and comparison of
these maps to functional network templates; and (iii) extraction of PIB
and FDG values from functional network templates. Although differ-
ent, these three approaches provide complimentary data that,
together, strengthen our findings and interpretations about the rela-
tionship between amyloid, hypometabolism, functional networks and
clinical Alzheimer’s disease phenotype.
Voxel-wise group comparisonsVoxel-wise comparisons of PIB distribution volume ratio and FDG
standard uptake volume ratio images were performed in SPM8 using
an analysis of covariance model that included diagnosis (control sub-
jects, early-onset Alzheimer’s disease, logopenic variant PPA and pos-
terior cortical atrophy) as the condition, and age, sex and education as
covariates. Pairwise contrasts were performed among the four groups.
This analysis was repeated including Mini-Mental State Examination
(MMSE) scores (Folstein et al., 1975) as covariate to adjust group-wise
comparisons for disease severity. All voxel-wise comparisons were also
repeated with atrophy-corrected data. Resulting T-maps were dis-
played on an MNI template brain corrected for multiple comparisons
using a family-wise error (FWE) correction at P5 0.05.
Voxel-wise region of interestcorrelation analysisWe extracted PIB and FDG values from regions of interest previously
shown to be specifically affected in each Alzheimer’s disease variant
compared with the other two and applied these values as covariates in
a voxel-wise multi-linear regression model to identify regions that
Table 1 Subject demographics
Control subjects EOAD lvPPA PCA Pa
n 30 17 12 13
Sex % male 47 59 67 46 0.8b
Age, yearsc 70.8 (3.3) 60.7 (5.6) 61.4 (7.0) 62.6 (7.4) 50.0001
Education, years 17.6 (1.7) 16.9 (2.7) 16.6 (3.1) 15.8 (3.0) 0.2
MMSE (/30) 29.4 (0.9) 19.9 (7.2) 22.4 (6.7) 21.7 (5.6) 50.0001
ApoE "4 % carrierd 33 63 25 36 0.2b
Age at onset, years 56.3 (5.6) 56.9 (6.7) 57.8 (7.1) 0.8
Disease duration, yearse 4.5 (2.5) 4.5 (2.0) 4.8 (2.8) 0.9
Shown are mean (standard deviation) unless specified otherwise.a one-way analysis of variance across groups (except sex and ApoE "4).b Fisher’s exact test.c Age at time of PET scan.d ApoE available in 30 control subjects and 39 patients with Alzheimer’s disease (16 with early-onset Alzheimer’s disease, 12 with logopenic variant PPA and11 with
posterior cortical atrophy).e Time between first symptoms and PET scan.EOAD = early-onset Alzheimer’s disease; lvPPA = logopenic variant PPA; PCA = posterior cortical atrophy.
Diverging PIB and FDG patterns in Alzheimer’s disease Brain 2013: 136; 844–858 | 847
at Periodicals Departm
ent/Lane L
ibrary on March 21, 2013
http://brain.oxfordjournals.org/D
ownloaded from
showed correlated PIB or FDG uptake across the brain in all patients
with Alzheimer’s disease. This approach is analogous to the seed
correlation method used to identify networks of structural and func-
tional connectivity (Seeley et al., 2009) and was used to explore
whether we could identify region of interest-specific patterns of PIB
and FDG uptake that were not detected using traditional voxel-wise
comparisons of clinically defined groups.
Region of interest definitions
The seed regions of interest used in this analysis were based on peak
atrophy voxels defined in a previous study (Migliaccio et al., 2009)
that used voxel-based morphometry in early-onset Alzheimer’s
disease, logopenic variant PPA and posterior cortical atrophy to iden-
tify regions that were specifically atrophied in each variant compared
with the other two. These were found to be the right middle frontal
gyrus in early-onset Alzheimer’s disease (MNI 40 42 30), left superior
temporal sulcus in logopenic variant PPA (MNI �56 �40 1) and the
right middle occipital gyrus in posterior cortical atrophy (MNI 39 �88
10). Regions of interest were created by drawing 6-mm spheres
around the peak atrophy voxels (Supplementary Fig. 1). FDG standard
uptake volume ratio and PIB distribution volume ratio values were
extracted for each region of interest, masking by the individual’s
grey matter segmented images to exclude PET counts from white
matter and cerebrospinal fluid. There was some overlap in the cohorts
used in the study by Migliaccio et al. (2009) and the current study [six
patients with early-onset Alzheimer’s disease (four with same scan,
two with scans from different time points), three patients with logo-
penic variant PPA (one with same scan, two with scans from different
time points) and three patients with posterior cortical atrophy (one
with same scan, two with scans from different time points)]. All ana-
lyses were repeated excluding these subjects, producing very similar
results (data not shown).
Correlation analysis
Multiple regressions were performed in SPM8 to assess correlations
between FDG and PIB uptake in each seed region of interest with
FDG and PIB uptake across the brain. Separate models were used
for each seed region of interest and each tracer, resulting in three
correlation models for FDG and three models for PIB. Analyses were
adjusted for age, sex, education and MMSE. Regressions were con-
ducted with all Alzheimer’s disease subjects pooled together (i.e. not
including the control subjects and not distinguishing between
Alzheimer’s disease clinical variants). The decision to perform this ana-
lysis in the subjects with Alzheimer’s disease rather than the control
subjects was based on the fact that there is greater variability of FDG
values in the Alzheimer’s disease group than the control subjects (as
control subjects typically have consistently high FDG values), and there
is a higher number of PIB-positive subjects available in the Alzheimer’s
disease group, which increases the power to detect effects. To assess
whether results are driven by individual clinical phenotypes, the ana-
lysis was repeated adjusting for diagnosis (Supplementary Fig. 2).
These analyses were also repeated using atrophy-corrected data.
T-maps were produced showing statistically significant correlations
using FWE-correction at P5 0.05. Overlap maps were produced by
overlaying correlation maps for each seed region of interest onto the
same MNI template brain.
Goodness of fit
The close resemblance of the correlation maps obtained in the region
of interest covariance analysis with specific functional networks moti-
vated a post hoc analysis in which we assessed the goodness of fit of
the PET correlation maps for each seed region of interest with func-
tional network templates published by the Stanford Functional Imaging
in Neuropsychiatric Disorders Lab (Shirer et al., 2012). As described in
Shirer et al. (2012), these networks were created by applying FSL’s
MELODIC independent component analysis software to resting state
data of 15 healthy control subjects. The resulting network templates
were downloaded as binary regions of interest from http://findlab.
stanford.edu/functional_ROIs.html. A total of 15 network templates
are available: dorsal and ventral default mode network, precuneus
network, primary and higher visual networks, visuospatial network,
language network (which was split into left and right language net-
works), left and right executive-control networks, anterior and poster-
ior salience networks, sensorimotor network, auditory network and
basal ganglia network. Functional connectivity networks have been
shown to be reproducible across centres and validated using diffusion
tensor imaging tractography and activation functional MRI data
(Hampson et al., 2002; Greicius et al., 2009; Smith et al., 2009).
Goodness of fit is expressed as two different variables: (i) as the
difference between the mean z score of all voxels of the region of
interest correlation map (transformed SPM t-maps) that fell inside the
network template (zinside) and the mean z-score of all voxels outside
the network template (zoutside), i.e. goodness of fit = zinside � zoutside;
and (ii) as the ratio between zinside and zoutside (i.e. zinside/zoutside).
Furthermore, to assess the robustness of the overlap between the
region of interest correlation maps and functional network templates,
the goodness of fit analysis was repeated using a second, independent
set of network templates, which consisted of networks identified by the
1000 Functional Connectomes Project (http://fcon_1000.projects.nitrc.
org; Biswal et al., 2010, results shown in the Supplementary material).
Fluorodeoxyglucose and Pittsburghcompound B uptake in functionalnetwork templatesFDG standard uptake volume ratio and PIB distribution volume ratio
values were extracted from the three network templates that showed
the highest fit with the FDG correlation maps (i.e. right
executive-control, left language and higher visual network), as well
as the dorsal and ventral default mode network based on our hypoth-
esis that the default mode network is affected similarly in all variants.
FDG and PIB values in these five networks were compared between
groups.
Statistical analysisStatistical analyses were performed using STATA version 11.2 (STATA
Corporation). Group differences in continuous variables were exam-
ined using two-tailed independent sample t-tests or one-way analysis
of variance (ANOVA) and Tukey post hoc contrasts. Dichotomous
variables were compared with Fisher’s exact test.
Results
Subject characteristicsSubject groups were well matched for sex and education (Table 1).
Although the control group was older than the patients with
Alzheimer’s disease (P50.0001), there was no difference in age
between the three Alzheimer’s disease clinical groups (P = 0.7).
848 | Brain 2013: 136; 844–858 M. Lehmann et al.
at Periodicals Departm
ent/Lane L
ibrary on March 21, 2013
http://brain.oxfordjournals.org/D
ownloaded from
There was no difference in ApoE "4 status between the four
groups; however, there was a trend towards a higher proportion
of ApoE "4 carriers in the group with early-onset Alzheimer’s dis-
ease compared with logopenic variant PPA (P = 0.067). As ex-
pected, MMSE scores (obtained closest to PET date) were higher
in the control subjects compared with Alzheimer’s disease
(P50.0001), but MMSE scores were not different between the
three Alzheimer’s disease clinical groups (P = 0.6). Alzheimer’s dis-
ease groups showed similar age-at-onset and disease duration.
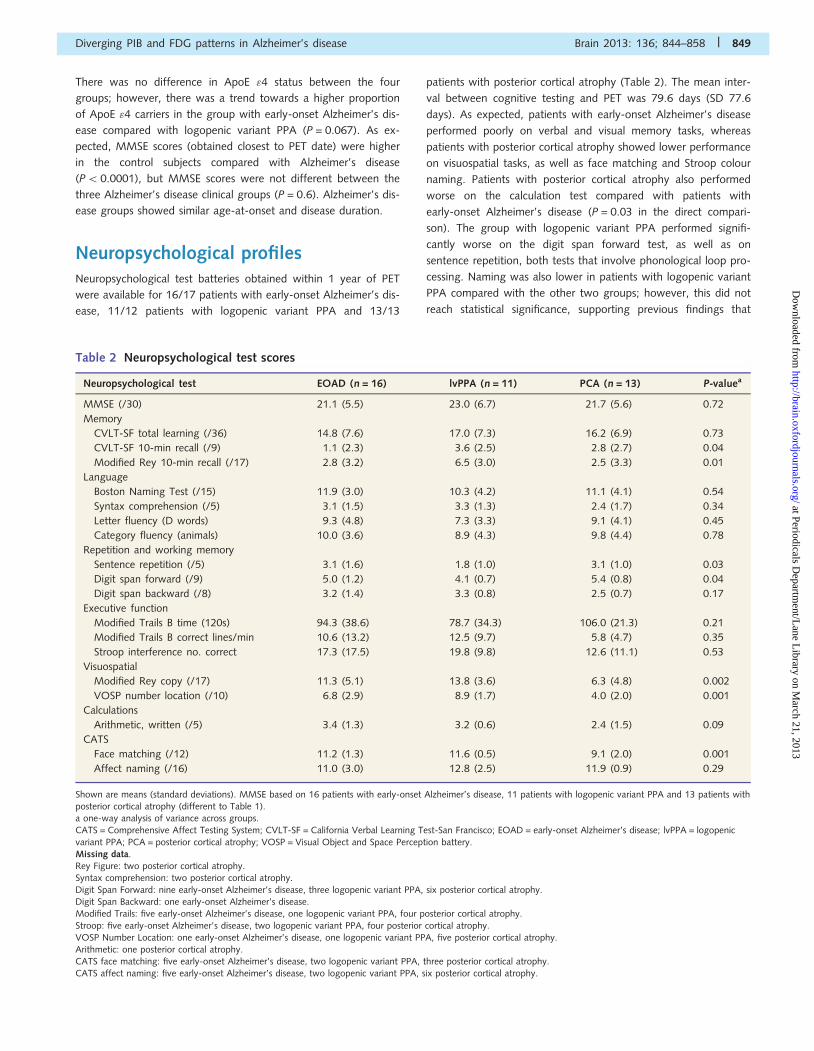
Neuropsychological profilesNeuropsychological test batteries obtained within 1 year of PET
were available for 16/17 patients with early-onset Alzheimer’s dis-
ease, 11/12 patients with logopenic variant PPA and 13/13
patients with posterior cortical atrophy (Table 2). The mean inter-
val between cognitive testing and PET was 79.6 days (SD 77.6
days). As expected, patients with early-onset Alzheimer’s disease
performed poorly on verbal and visual memory tasks, whereas
patients with posterior cortical atrophy showed lower performance
on visuospatial tasks, as well as face matching and Stroop colour
naming. Patients with posterior cortical atrophy also performed
worse on the calculation test compared with patients with
early-onset Alzheimer’s disease (P = 0.03 in the direct compari-
son). The group with logopenic variant PPA performed signifi-
cantly worse on the digit span forward test, as well as on
sentence repetition, both tests that involve phonological loop pro-
cessing. Naming was also lower in patients with logopenic variant
PPA compared with the other two groups; however, this did not
reach statistical significance, supporting previous findings that
Table 2 Neuropsychological test scores
Neuropsychological test EOAD (n = 16) lvPPA (n = 11) PCA (n = 13) P-valuea
MMSE (/30) 21.1 (5.5) 23.0 (6.7) 21.7 (5.6) 0.72
Memory
CVLT-SF total learning (/36) 14.8 (7.6) 17.0 (7.3) 16.2 (6.9) 0.73
CVLT-SF 10-min recall (/9) 1.1 (2.3) 3.6 (2.5) 2.8 (2.7) 0.04
Modified Rey 10-min recall (/17) 2.8 (3.2) 6.5 (3.0) 2.5 (3.3) 0.01
Language
Boston Naming Test (/15) 11.9 (3.0) 10.3 (4.2) 11.1 (4.1) 0.54
Syntax comprehension (/5) 3.1 (1.5) 3.3 (1.3) 2.4 (1.7) 0.34
Letter fluency (D words) 9.3 (4.8) 7.3 (3.3) 9.1 (4.1) 0.45
Category fluency (animals) 10.0 (3.6) 8.9 (4.3) 9.8 (4.4) 0.78
Repetition and working memory
Sentence repetition (/5) 3.1 (1.6) 1.8 (1.0) 3.1 (1.0) 0.03
Digit span forward (/9) 5.0 (1.2) 4.1 (0.7) 5.4 (0.8) 0.04
Digit span backward (/8) 3.2 (1.4) 3.3 (0.8) 2.5 (0.7) 0.17
Executive function
Modified Trails B time (120s) 94.3 (38.6) 78.7 (34.3) 106.0 (21.3) 0.21
Modified Trails B correct lines/min 10.6 (13.2) 12.5 (9.7) 5.8 (4.7) 0.35
Stroop interference no. correct 17.3 (17.5) 19.8 (9.8) 12.6 (11.1) 0.53
Visuospatial
Modified Rey copy (/17) 11.3 (5.1) 13.8 (3.6) 6.3 (4.8) 0.002
VOSP number location (/10) 6.8 (2.9) 8.9 (1.7) 4.0 (2.0) 0.001
Calculations
Arithmetic, written (/5) 3.4 (1.3) 3.2 (0.6) 2.4 (1.5) 0.09
CATS
Face matching (/12) 11.2 (1.3) 11.6 (0.5) 9.1 (2.0) 0.001
Affect naming (/16) 11.0 (3.0) 12.8 (2.5) 11.9 (0.9) 0.29
Shown are means (standard deviations). MMSE based on 16 patients with early-onset Alzheimer’s disease, 11 patients with logopenic variant PPA and 13 patients withposterior cortical atrophy (different to Table 1).a one-way analysis of variance across groups.CATS = Comprehensive Affect Testing System; CVLT-SF = California Verbal Learning Test-San Francisco; EOAD = early-onset Alzheimer’s disease; lvPPA = logopenic
variant PPA; PCA = posterior cortical atrophy; VOSP = Visual Object and Space Perception battery.Missing data.Rey Figure: two posterior cortical atrophy.Syntax comprehension: two posterior cortical atrophy.Digit Span Forward: nine early-onset Alzheimer’s disease, three logopenic variant PPA, six posterior cortical atrophy.Digit Span Backward: one early-onset Alzheimer’s disease.Modified Trails: five early-onset Alzheimer’s disease, one logopenic variant PPA, four posterior cortical atrophy.
Stroop: five early-onset Alzheimer’s disease, two logopenic variant PPA, four posterior cortical atrophy.VOSP Number Location: one early-onset Alzheimer’s disease, one logopenic variant PPA, five posterior cortical atrophy.Arithmetic: one posterior cortical atrophy.CATS face matching: five early-onset Alzheimer’s disease, two logopenic variant PPA, three posterior cortical atrophy.CATS affect naming: five early-onset Alzheimer’s disease, two logopenic variant PPA, six posterior cortical atrophy.
Diverging PIB and FDG patterns in Alzheimer’s disease Brain 2013: 136; 844–858 | 849
at Periodicals Departm
ent/Lane L
ibrary on March 21, 2013
http://brain.oxfordjournals.org/D
ownloaded from

naming may not be the most prominent deficit in logopenic vari-
ant PPA (Gorno-Tempini et al., 2004). No significant differences
were found on tests of executive functioning, possibly owing to
the relatively heterogeneous composition of the early-onset
Alzheimer’s disease group (including amnestic and dysexecutive
patients) and the relatively low performance on these tasks in
the group with posterior cortical atrophy owing to the high
visual demand of these tests.
Voxel-wise group comparisons
Fluorodeoxyglucose-positron emission tomographyresults
Compared with control subjects, all three Alzheimer’s disease
groups showed syndrome-specific patterns of glucose hypometa-
bolism (Fig. 1). Although all Alzheimer’s disease groups showed
hypometabolism in temporoparietal regions, including the angular
gyrus, inferior parietal lobe, posterior cingulate/precuneus and
middle and inferior temporal lobe, the involvement of these re-
gions was asymmetric (left4 right) in logopenic variant PPA and
extended more posteriorly into the occipital lobes bilaterally in the
group with posterior cortical atrophy. Significantly lower glucose
metabolism was also found in inferior and superior frontal regions
bilaterally in early-onset Alzheimer’s disease, on the left in logo-
penic variant PPA, and on the right in posterior cortical atrophy.
The early-onset Alzheimer’s disease group also showed reduced
metabolism in the hippocampus, in particular in the right
hemisphere.
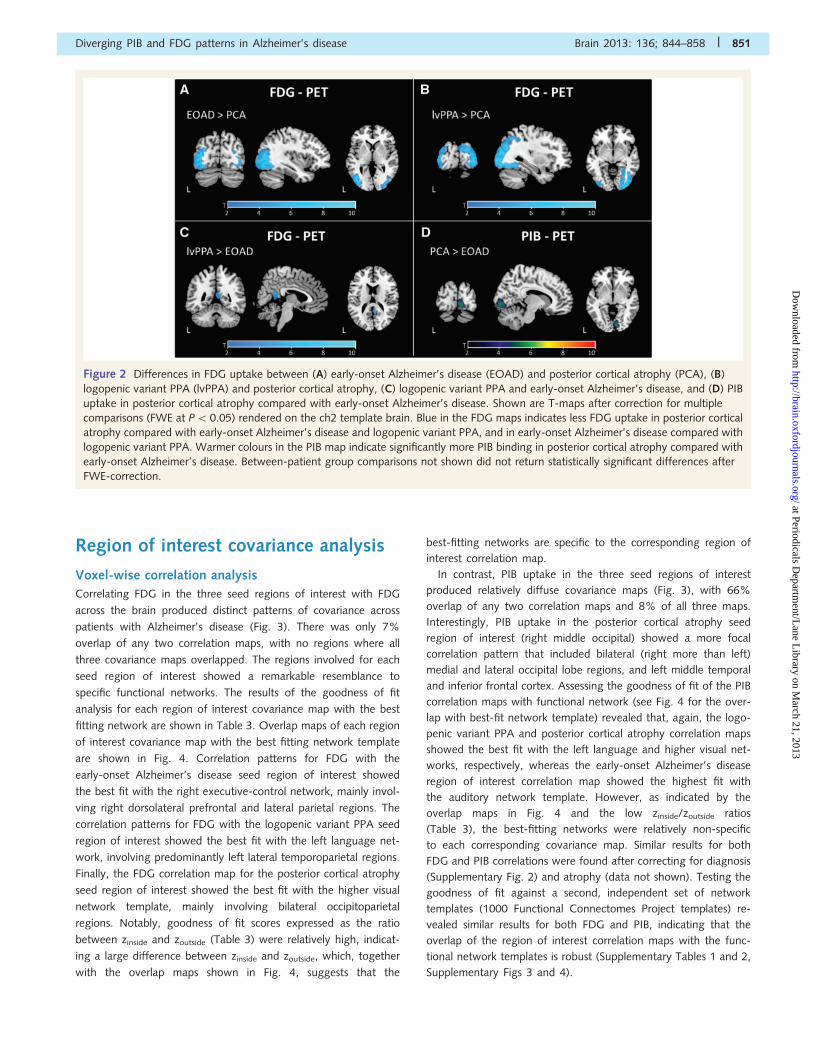
In the direct patient group comparison, patients with posterior
cortical atrophy showed greater hypometabolism in lateral occipital
regions compared with patients with early-onset Alzheimer’s dis-
ease (Fig. 2A) and logopenic variant PPA where differences ex-
tended into the right superior parietal lobule (Fig. 2B). The group
with early-onset Alzheimer’s disease showed reduced metabolism
in a small region in the right posterior cingulate gyrus/retrosplenial
cortex compared with logopenic variant PPA (Fig. 2C). None of
the other between-patient group comparisons were significant
after multiple comparison correction. Similar results were found
after correcting for MMSE and after atrophy correction, although
the spatial extent of between group differences was more re-
stricted on the atrophy-corrected maps (data not shown).
Pittsburgh compound B-positron emission tomographyresults
Compared with control subjects, all three patient groups showed
diffuse patterns of higher PIB uptake across the cortex symmet-
rically in both hemispheres, with some sparing of the sensorimotor
strip, parts of the striate cortex and the medial temporal
lobes (Fig. 1). In the direct patient group comparisons, patients
with posterior cortical atrophy showed higher PIB uptake in the
right posterior lingual gyrus compared with patients with
early-onset Alzheimer’s disease (Fig. 2D), with no significant dif-
ferences after FWE correction found for any of the other patient
group comparisons. Relaxing the statistical threshold to P50.001,
uncorrected did not return any additional differences, with the
exception of lower PIB in the lingual gyrus in logopenic variant
PPA compared with early-onset Alzheimer’s disease. Neither
MMSE correction nor atrophy correction had a substantial
impact on the results, although the statistical significance of the
differences was greater in the atrophy-corrected than the
non-atrophy corrected comparisons (data not shown).
Figure 1 Patterns of FDG and PIB binding in early-onset Alzheimer’s disease (EOAD), logopenic variant PPA (lvPPA) and posterior cortical
atrophy (PCA) compared with healthy controls. Shown are T-maps after correction for multiple comparisons (FWE at P50.05) rendered
on the ch2 template brain. Blue in the FDG maps indicates significantly lower FDG uptake in the patient groups compared with controls,
whereas warmer colours in the PIB maps indicate significantly greater PIB binding in the patient groups.
850 | Brain 2013: 136; 844–858 M. Lehmann et al.
at Periodicals Departm
ent/Lane L
ibrary on March 21, 2013
http://brain.oxfordjournals.org/D
ownloaded from
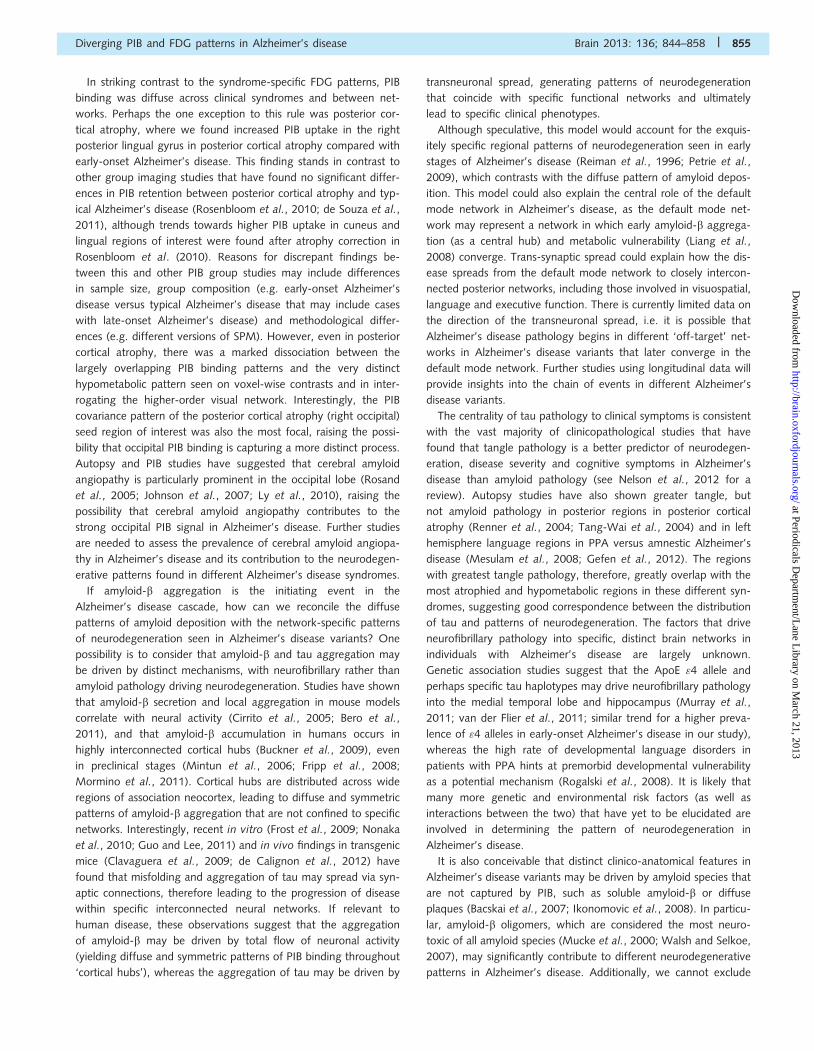
Region of interest covariance analysis
Voxel-wise correlation analysis
Correlating FDG in the three seed regions of interest with FDG
across the brain produced distinct patterns of covariance across
patients with Alzheimer’s disease (Fig. 3). There was only 7%
overlap of any two correlation maps, with no regions where all
three covariance maps overlapped. The regions involved for each
seed region of interest showed a remarkable resemblance to
specific functional networks. The results of the goodness of fit
analysis for each region of interest covariance map with the best
fitting network are shown in Table 3. Overlap maps of each region
of interest covariance map with the best fitting network template
are shown in Fig. 4. Correlation patterns for FDG with the
early-onset Alzheimer’s disease seed region of interest showed
the best fit with the right executive-control network, mainly invol-
ving right dorsolateral prefrontal and lateral parietal regions. The
correlation patterns for FDG with the logopenic variant PPA seed
region of interest showed the best fit with the left language net-
work, involving predominantly left lateral temporoparietal regions.
Finally, the FDG correlation map for the posterior cortical atrophy
seed region of interest showed the best fit with the higher visual
network template, mainly involving bilateral occipitoparietal
regions. Notably, goodness of fit scores expressed as the ratio
between zinside and zoutside (Table 3) were relatively high, indicat-
ing a large difference between zinside and zoutside, which, together
with the overlap maps shown in Fig. 4, suggests that the
best-fitting networks are specific to the corresponding region of
interest correlation map.
In contrast, PIB uptake in the three seed regions of interest
produced relatively diffuse covariance maps (Fig. 3), with 66%
overlap of any two correlation maps and 8% of all three maps.
Interestingly, PIB uptake in the posterior cortical atrophy seed
region of interest (right middle occipital) showed a more focal
correlation pattern that included bilateral (right more than left)
medial and lateral occipital lobe regions, and left middle temporal
and inferior frontal cortex. Assessing the goodness of fit of the PIB
correlation maps with functional network (see Fig. 4 for the over-
lap with best-fit network template) revealed that, again, the logo-
penic variant PPA and posterior cortical atrophy correlation maps
showed the best fit with the left language and higher visual net-
works, respectively, whereas the early-onset Alzheimer’s disease
region of interest correlation map showed the highest fit with
the auditory network template. However, as indicated by the
overlap maps in Fig. 4 and the low zinside/zoutside ratios
(Table 3), the best-fitting networks were relatively non-specific
to each corresponding covariance map. Similar results for both
FDG and PIB correlations were found after correcting for diagnosis
(Supplementary Fig. 2) and atrophy (data not shown). Testing the
goodness of fit against a second, independent set of network
templates (1000 Functional Connectomes Project templates) re-
vealed similar results for both FDG and PIB, indicating that the
overlap of the region of interest correlation maps with the func-
tional network templates is robust (Supplementary Tables 1 and 2,
Supplementary Figs 3 and 4).
Figure 2 Differences in FDG uptake between (A) early-onset Alzheimer’s disease (EOAD) and posterior cortical atrophy (PCA), (B)
logopenic variant PPA (lvPPA) and posterior cortical atrophy, (C) logopenic variant PPA and early-onset Alzheimer’s disease, and (D) PIB
uptake in posterior cortical atrophy compared with early-onset Alzheimer’s disease. Shown are T-maps after correction for multiple
comparisons (FWE at P5 0.05) rendered on the ch2 template brain. Blue in the FDG maps indicates less FDG uptake in posterior cortical
atrophy compared with early-onset Alzheimer’s disease and logopenic variant PPA, and in early-onset Alzheimer’s disease compared with
logopenic variant PPA. Warmer colours in the PIB map indicate significantly more PIB binding in posterior cortical atrophy compared with
early-onset Alzheimer’s disease. Between-patient group comparisons not shown did not return statistically significant differences after
FWE-correction.
Diverging PIB and FDG patterns in Alzheimer’s disease Brain 2013: 136; 844–858 | 851
at Periodicals Departm
ent/Lane L
ibrary on March 21, 2013
http://brain.oxfordjournals.org/D
ownloaded from

Fluorodeoxyglucose and Pittsburghcompound B uptake in functionalnetwork templatesMean FDG and PIB values for the five functional networks exam-
ined for each group are illustrated in Fig. 5. Compared with con-
trols, all Alzheimer’s disease variants showed significantly lower
FDG and higher PIB uptake in all networks (P5 0.0001).
Between Alzheimer’s disease clinical variants, no differences were
found in the dorsal default mode network, indicating that FDG
was similarly reduced in all three groups. Although patients with
logopenic variant PPA showed higher FDG in the ventral default
mode network (P = 0.01 compared with early-onset Alzheimer’s
disease, P = 0.003 compared with posterior cortical atrophy), this
was driven by relative sparing of this network in the right hemi-
sphere in this group. Splitting the ventral default mode network
into left and right-sided components revealed higher FDG uptake
in the right (P50.001) but not left ventral default mode network
(P = 0.26). FDG uptake was also higher in the logopenic variant
PPA group in the right executive-control network (P = 0.02
Figure 3 Region of interest (ROI) correlation maps for FDG (top) and PIB (bottom). Shown are T-values after multiple comparisons
correction (FWE at P50.05) rendered on the ch2 template brain. Red maps show correlations with the early-onset Alzheimer’s disease
(EOAD) seed region of interest (right middle frontal gyrus); blue maps show correlations with the logopenic variant PPA (lvPPA) seed
region of interest (left superior temporal sulcus); green maps show correlations with the posterior cortical atrophy (PCA) seed region of
interest (right middle occipital gyrus). The overlap map shows the overlap of all three correlation maps for each tracer.
Table 3 Results of goodness of fit analysis of region of interest covariance maps with functional network templates
Correlation map Network templatewith best fit
Mean z-scoreinside network(zinside)
Mean z-scoreoutside network(zoutside)
GOF score(zinside � zoutside)
Ratio(zinside/zoutside)
FDG
EOAD seed Right executive-control 3.11 0.36 2.75 8.64
lvPPA seed Left language 4.08 0.18 3.9 22.67
PCA seed Higher visual 10.78 1.07 9.71 10.07
PIB
EOAD seed Auditory 7.52 2.47 5.05 3.04
lvPPA seed Left language 7.95 3.24 4.71 2.45
PCA seed Higher visual 4.97 0.66 4.31 7.53
Zinside and zoutside represent mean z-scores of all voxels of the region of interest correlation map that lie inside and outside the network template. The goodness of fit scorerepresents the difference between zinside and zoutside, whereas the ratio represents the ratio between zinside and zoutside. The greater the difference scores and ratios, the betterthe fit between the correlation map and functional network.
EOAD = early-onset Alzheimer’s disease; lvPPA = logopenic variant PPA; GOF = goodness of fit; PCA = posterior cortical atrophy.
852 | Brain 2013: 136; 844–858 M. Lehmann et al.
at Periodicals Departm
ent/Lane L
ibrary on March 21, 2013
http://brain.oxfordjournals.org/D
ownloaded from

Figure 4 Overlap maps showing each region of interest (ROI) correlation map with the best-fitting network template (i.e. network with
highest goodness-of-fit score) for FDG and PIB. Red, blue and green maps represent T-values for significant (FWE P5 0.05) correlations
with the respective seed regions of interest for early-onset Alzheimer’s disease (EOAD), logopenic variant PPA (lvPPA) and posterior
cortical atrophy (PCA), respectively, whereas yellow represents the corresponding network template.
Figure 5 Mean FDG and PIB values for each group and the functional network templates. All Alzheimer’s disease groups showed
significantly lower FDG and higher PIB compared with controls. Asterisk denote FDG in logopenic variant PPA significantly higher than in
early-onset Alzheimer’s disease and posterior cortical atrophy P5 0.05; double asterisk denotes FDG in logopenic variant PPA significantly
higher than in early-onset Alzheimer’s disease and posterior cortical atrophy P50.01; triple asterisks denote FDG in posterior cortical
atrophy significantly lower than in early-onset Alzheimer’s disease and logopenic variant PPA P50.0001. DMN = default mode network;
ECN = executive-control network.
Diverging PIB and FDG patterns in Alzheimer’s disease Brain 2013: 136; 844–858 | 853
at Periodicals Departm
ent/Lane L
ibrary on March 21, 2013
http://brain.oxfordjournals.org/D
ownloaded from

compared with early-onset Alzheimer’s disease, P = 0.04 com-
pared with posterior cortical atrophy), whereas the posterior cor-
tical atrophy group showed lower FDG in the higher visual
network (P50.0001). A trend for lower FDG in the left language
network was also found in logopenic variant PPA compared with
posterior cortical atrophy on pairwise comparison (P = 0.08).
Notably, within each Alzheimer’s disease group, patients with
early-onset Alzheimer’s disease showed greatest reduction in
FDG in the left executive-control network, whereas the logopenic
variant PPA group showed greatest hypometabolism in the left
language network, and the posterior cortical atrophy group in
the higher visual network. PIB uptake did not differ between
Alzheimer’s disease groups in any of the networks (P40.27).
DiscussionThis is the first study to directly compare glucose metabolism and
amyloid deposition patterns in vivo across three clinical variants of
early age-of-onset Alzheimer’s disease: early-onset Alzheimer’s
disease, logopenic variant PPA and posterior cortical atrophy.
These less common focal variants of Alzheimer’s disease were
chosen to maximize heterogeneity in our study population and
increase the likelihood of identifying mechanisms that contribute
to the clinico-anatomic variance of the disease. We hypothesized
that Alzheimer’s disease syndromes would be characterized by
focal patterns of hypometabolism (FDG-PET), which would closely
mirror specific functional networks and would not be explained by
patterns of amyloid deposition (PIB-PET). We further predicted
that the default mode network would be involved in all three
Alzheimer’s disease variants, whereas the involvement of the
executive-control, language and visual networks would be specific
to early-onset Alzheimer’s disease, logopenic variant PPA and pos-
terior cortical atrophy, respectively. Using a traditional mass-
univariate voxel-wise comparison approach, we found
syndrome-specific patterns of hypometabolism in all three
Alzheimer’s disease variants compared with control subjects,
whereas PIB retention was widespread across association neocor-
tex. The seed region of interest covariance analysis revealed dis-
tinct, syndrome-specific FDG covariance patterns that greatly
overlapped with the predicted functional networks, whereas PIB
correlation maps were diffuse and largely overlapping. Finally,
assessing FDG and PIB uptake in functional network templates
revealed significantly lower FDG and higher PIB in the
Alzheimer’s disease variants compared with control subjects in all
networks. Although FDG uptake was similarly reduced across all
variants in the dorsal and left ventral default mode network, sig-
nificant differences between Alzheimer’s disease variants were
found in the right ventral default mode network, right
executive-control and higher visual networks, with a trend to-
wards lower FDG also found in the left language network in logo-
penic variant PPA. In contrast, PIB uptake did not differ between
Alzheimer’s disease variants in any of the networks. Together,
these findings suggest that clinical variants of Alzheimer’s disease
are characterized by differential involvement of specific functional
networks, whereas the dorsal default mode network is commonly
affected in all variants. Our results also suggest that fibrillar
amyloid-b deposition explains at most a small amount of the
clinico-anatomical heterogeneity in Alzheimer’s disease.
Our three FDG analyses provide converging evidence implicat-
ing differential involvement of specific networks in each clinical
variant of Alzheimer’s disease. Perhaps the most distinct pattern
was found in posterior cortical atrophy, where on voxel-wise
group comparisons, we found greater involvement of lateral
occipital and posterior inferior temporal regions. Patients with pos-
terior cortical atrophy showed lower FDG uptake than other vari-
ants in the higher-order visual network template, and showed the
most dramatic overlap between the seed region of interest correl-
ation map (focused in right middle occipital gyrus) and the
higher-order visual network template. Consistent with previous
reports (Rabinovici et al., 2008; Josephs et al., 2010), patients
with logopenic variant PPA showed hypometabolism in left tem-
poroparietal cortex that was far more asymmetric than the pattern
seen in early-onset Alzheimer’s disease. The region of interest cor-
relation map (seeded by the left superior temporal gyrus) best fit
the left language network template. On voxel-wise comparisons,
patients with early-onset Alzheimer’s disease showed greater
involvement of the hippocampus (versus control subjects) and ret-
rosplenial cortex (versus logopenic variant PPA), and low FDG
uptake in the ventral default mode network. Patients with
early-onset Alzheimer’s disease further demonstrated low FDG in
the right executive-control network, and the region of interest
correlation map (focused in right middle frontal gyrus) demon-
strated a best fit with this network. These findings match the
clinical profile of patients with early-onset Alzheimer’s disease,
which includes amnestic and dysexecutive deficits. Interestingly,
our region of interest correlation maps were not altered when
clinical group was added as a covariate, suggesting that these
correlation maps are not driven by each of the variants, but are
capturing involvement of networks across all subjects with
Alzheimer’s disease.
In addition to metabolic differences, we also found significant
overlap in FDG patterns across Alzheimer’s disease phenotypes.
This was most notable in the dorsal default mode network,
where FDG uptake was similarly reduced across all variants, sug-
gesting that the involvement of this network is a common feature
of Alzheimer’s disease, irrespective of clinical phenotype (Lehmann
et al., 2010; Whitwell et al., 2011). Although there was a signifi-
cant difference in FDG uptake in the ventral default mode net-
work, this was driven by the asymmetric pattern of logopenic
variant PPA, as a post hoc analysis that split the ventral default
mode network into left and right components revealed that FDG
uptake in the left ventral default mode network was as low in
logopenic variant PPA as in early-onset Alzheimer’s disease and
posterior cortical atrophy. Additional overlap occurred in the right
executive-control network in all but the logopenic variant PPA
variant, and also in the language network, although a trend to-
wards lower FDG uptake was found in logopenic variant PPA.
Overlapping involvement of these networks is consistent with
the observation that clinically defined Alzheimer’s disease variants
show some degree of behavioural and anatomical overlap at base-
line that increases with longitudinal evolution (Migliaccio et al.,
2009; Lehmann et al., 2012).
854 | Brain 2013: 136; 844–858 M. Lehmann et al.
at Periodicals Departm
ent/Lane L
ibrary on March 21, 2013
http://brain.oxfordjournals.org/D
ownloaded from
In striking contrast to the syndrome-specific FDG patterns, PIB
binding was diffuse across clinical syndromes and between net-
works. Perhaps the one exception to this rule was posterior cor-
tical atrophy, where we found increased PIB uptake in the right
posterior lingual gyrus in posterior cortical atrophy compared with
early-onset Alzheimer’s disease. This finding stands in contrast to
other group imaging studies that have found no significant differ-
ences in PIB retention between posterior cortical atrophy and typ-
ical Alzheimer’s disease (Rosenbloom et al., 2010; de Souza et al.,
2011), although trends towards higher PIB uptake in cuneus and
lingual regions of interest were found after atrophy correction in
Rosenbloom et al. (2010). Reasons for discrepant findings be-
tween this and other PIB group studies may include differences
in sample size, group composition (e.g. early-onset Alzheimer’s
disease versus typical Alzheimer’s disease that may include cases
with late-onset Alzheimer’s disease) and methodological differ-
ences (e.g. different versions of SPM). However, even in posterior
cortical atrophy, there was a marked dissociation between the
largely overlapping PIB binding patterns and the very distinct
hypometabolic pattern seen on voxel-wise contrasts and in inter-
rogating the higher-order visual network. Interestingly, the PIB
covariance pattern of the posterior cortical atrophy (right occipital)
seed region of interest was also the most focal, raising the possi-
bility that occipital PIB binding is capturing a more distinct process.
Autopsy and PIB studies have suggested that cerebral amyloid
angiopathy is particularly prominent in the occipital lobe (Rosand
et al., 2005; Johnson et al., 2007; Ly et al., 2010), raising the
possibility that cerebral amyloid angiopathy contributes to the
strong occipital PIB signal in Alzheimer’s disease. Further studies
are needed to assess the prevalence of cerebral amyloid angiopa-
thy in Alzheimer’s disease and its contribution to the neurodegen-
erative patterns found in different Alzheimer’s disease syndromes.
If amyloid-b aggregation is the initiating event in the
Alzheimer’s disease cascade, how can we reconcile the diffuse
patterns of amyloid deposition with the network-specific patterns
of neurodegeneration seen in Alzheimer’s disease variants? One
possibility is to consider that amyloid-b and tau aggregation may
be driven by distinct mechanisms, with neurofibrillary rather than
amyloid pathology driving neurodegeneration. Studies have shown
that amyloid-b secretion and local aggregation in mouse models
correlate with neural activity (Cirrito et al., 2005; Bero et al.,
2011), and that amyloid-b accumulation in humans occurs in
highly interconnected cortical hubs (Buckner et al., 2009), even
in preclinical stages (Mintun et al., 2006; Fripp et al., 2008;
Mormino et al., 2011). Cortical hubs are distributed across wide
regions of association neocortex, leading to diffuse and symmetric
patterns of amyloid-b aggregation that are not confined to specific
networks. Interestingly, recent in vitro (Frost et al., 2009; Nonaka
et al., 2010; Guo and Lee, 2011) and in vivo findings in transgenic
mice (Clavaguera et al., 2009; de Calignon et al., 2012) have
found that misfolding and aggregation of tau may spread via syn-
aptic connections, therefore leading to the progression of disease
within specific interconnected neural networks. If relevant to
human disease, these observations suggest that the aggregation
of amyloid-b may be driven by total flow of neuronal activity
(yielding diffuse and symmetric patterns of PIB binding throughout
‘cortical hubs’), whereas the aggregation of tau may be driven by
transneuronal spread, generating patterns of neurodegeneration
that coincide with specific functional networks and ultimately
lead to specific clinical phenotypes.
Although speculative, this model would account for the exquis-
itely specific regional patterns of neurodegeneration seen in early
stages of Alzheimer’s disease (Reiman et al., 1996; Petrie et al.,
2009), which contrasts with the diffuse pattern of amyloid depos-
ition. This model could also explain the central role of the default
mode network in Alzheimer’s disease, as the default mode net-
work may represent a network in which early amyloid-b aggrega-
tion (as a central hub) and metabolic vulnerability (Liang et al.,
2008) converge. Trans-synaptic spread could explain how the dis-
ease spreads from the default mode network to closely intercon-
nected posterior networks, including those involved in visuospatial,
language and executive function. There is currently limited data on
the direction of the transneuronal spread, i.e. it is possible that
Alzheimer’s disease pathology begins in different ‘off-target’ net-
works in Alzheimer’s disease variants that later converge in the
default mode network. Further studies using longitudinal data will
provide insights into the chain of events in different Alzheimer’s
disease variants.
The centrality of tau pathology to clinical symptoms is consistent
with the vast majority of clinicopathological studies that have
found that tangle pathology is a better predictor of neurodegen-
eration, disease severity and cognitive symptoms in Alzheimer’s
disease than amyloid pathology (see Nelson et al., 2012 for a
review). Autopsy studies have also shown greater tangle, but
not amyloid pathology in posterior regions in posterior cortical
atrophy (Renner et al., 2004; Tang-Wai et al., 2004) and in left
hemisphere language regions in PPA versus amnestic Alzheimer’s
disease (Mesulam et al., 2008; Gefen et al., 2012). The regions
with greatest tangle pathology, therefore, greatly overlap with the
most atrophied and hypometabolic regions in these different syn-
dromes, suggesting good correspondence between the distribution
of tau and patterns of neurodegeneration. The factors that drive
neurofibrillary pathology into specific, distinct brain networks in
individuals with Alzheimer’s disease are largely unknown.
Genetic association studies suggest that the ApoE "4 allele and
perhaps specific tau haplotypes may drive neurofibrillary pathology
into the medial temporal lobe and hippocampus (Murray et al.,
2011; van der Flier et al., 2011; similar trend for a higher preva-
lence of "4 alleles in early-onset Alzheimer’s disease in our study),
whereas the high rate of developmental language disorders in
patients with PPA hints at premorbid developmental vulnerability
as a potential mechanism (Rogalski et al., 2008). It is likely that
many more genetic and environmental risk factors (as well as
interactions between the two) that have yet to be elucidated are
involved in determining the pattern of neurodegeneration in
Alzheimer’s disease.
It is also conceivable that distinct clinico-anatomical features in
Alzheimer’s disease variants may be driven by amyloid species that
are not captured by PIB, such as soluble amyloid-b or diffuse
plaques (Bacskai et al., 2007; Ikonomovic et al., 2008). In particu-
lar, amyloid-b oligomers, which are considered the most neuro-
toxic of all amyloid species (Mucke et al., 2000; Walsh and Selkoe,
2007), may significantly contribute to different neurodegenerative
patterns in Alzheimer’s disease. Additionally, we cannot exclude
Diverging PIB and FDG patterns in Alzheimer’s disease Brain 2013: 136; 844–858 | 855
at Periodicals Departm
ent/Lane L
ibrary on March 21, 2013
http://brain.oxfordjournals.org/D
ownloaded from
the possibility that Alzheimer’s disease variants may show focal or
asymmetric patterns of amyloid deposition in preclinical stages of
Alzheimer’s disease. Although the pattern of PIB binding in
amyloid-positive cognitively normal individuals appears relatively
diffuse at a group level (Mintun et al., 2006; Fripp et al., 2008;
Mormino et al., 2012), focal patterns can be seen in individual
cases, and these may be relevant to the subsequent pattern of
neurodegeneration. Interestingly, our PIB covariance analysis
showed best goodness of fit between the logopenic variant PPA
region of interest covariance map and the left language network,
and between the posterior cortical atrophy region of interest map
and the higher-order visual network. However, the PIB goodness
of fit findings should be interpreted with caution, as the high
number of other fits with similar goodness of fit scores suggests
that the best-fit network is relatively non-specific.
Our study has limitations. Autopsy confirmation of Alzheimer’s
disease is not available in any of our subjects, though our selection
criteria were designed to maximize the likelihood of underlying
Alzheimer’s disease pathology (clinical phenotypes highly asso-
ciated with post-mortem Alzheimer’s disease, exclusion of patients
with core features of other degenerative diseases, required evi-
dence of amyloid deposition on PIB-PET scans). Although the
sample size of the different Alzheimer’s disease groups in this
study is relatively large, given the frequency of the syndromes,
subject numbers may have been too small to detect significant
differences in PIB retention between Alzheimer’s disease variants,
although sample sizes were large enough to detect differences in
FDG. Our choice of an early age-of-onset Alzheimer’s disease
group controlled for the effects of age (as logopenic variant PPA
and posterior cortical atrophy typically occur in early-onset pa-
tients) and enhanced comparisons with a previous structural ima-
ging study (Migliaccio et al., 2009). However, this may have
limited our ability to detect behavioural and imaging differences
between ‘typical’ Alzheimer’s disease and logopenic variant PPA/
posterior cortical atrophy, as patients with early-onset Alzheimer’s
disease show early language and visuospatial deficits (Koss et al.,
1996; Koedam et al., 2010). Although the late-onset amnestic
Alzheimer’s disease phenotype is more common than the
early-onset variants, using these variants to study the factors driv-
ing clinical heterogeneity provides important insights into disease
pathogenesis that may be applicable to the more common,
late-onset Alzheimer’s disease. PIB, although a highly validated
tracer, is relatively novel and may have unknown limitations
(e.g. ceiling effects or unknown binding interactions). A further
point of ongoing debate is the potential confounding effects of
atrophy on PIB data. Reassuringly our results were consistent with
and without atrophy correction. MRI scans were acquired on dif-
ferent scanners. However, patient groups were relatively matched
for scanner type, and the use of structural imaging in this study
was limited to definition of regions of interest, spatial normaliza-
tion and atrophy correction of PET data. Finally, although
FDG-PET is closely related to synaptic activity (Jueptner and
Weiller, 1995) and has been widely used to assess brain function,
it is an indirect method of identifying functional neural networks.
Future studies applying both task-free and task-dependent func-
tional MRI data may help to confirm and further elucidate the role
of different functional networks in Alzheimer’s disease variants.
AcknowledgementsThe authors would like to acknowledge Baber Khan and Teresa
Wu for administrative support, and Andrea Long for assistance
with PET scanning.
FundingAlzheimer’s Research UK grant (to M.L.); National Institute on
Aging grants [K23-AG031861] (to G.D.R.), [R01-AG027859] (to
W.J.J.), [P01-AG1972403 and P50-AG023501] (to B.L.M.),
[RO1NS073498] (to M.D.G.); Alzheimer’s Association grants
[NIRG-07-59422] (to G.D.R.) and [ZEN-08-87090] (to W.J.J.);
John Douglas French Alzheimer’s Foundation (to G.D.R.); State
of California Department of Health Services Alzheimer’s Disease
Research Centre of California grant [04-33516] (to B.L.M); and
Hellman Family Foundation (to G.D.R.).
Supplementary materialSupplementary material is available at Brain online.
ReferencesBacskai BJ, Frosch MP, Freeman SH, Raymond SB, Augustinack JC,
Johnson KA, et al. Molecular imaging with Pittsburgh compound B
confirmed at autopsy—a case report. Arch Neurol 2007; 64: 431–4.
Benson F, Davis J, Snyder BD. Posterior cortical atrophy. Arch Neurol
1988; 45: 789–93.
Bero AW, Yan P, Roh JH, Cirrito JR, Stewart FR, Raichle ME, et al.
Neuronal activity regulates the regional vulnerability to amyloid-beta
deposition. Nat Neurosci 2011; 14: 750–6.
Biswal BB, Mennes M, Zuo XN, Gohel S, Kelly C, Smith SM, et al.
Toward discovery science of human brain function. Proc Natl Acad
Sci U S A 2010; 107: 4734–4739.
Buckner RL, Sepulcre J, Talukdar T, Krienen FM, Liu H, Hedden T, et al.
Cortical hubs revealed by intrinsic functional connectivity: mapping,
assessment of stability, and relation to Alzheimer’s disease. J
Neurosci 2009; 29: 1860–73.
Cirrito JR, Yamada KA, Finn MB, Sloviter RS, Bales KR, May PC, et al.
Synaptic activity regulates interstitial fluid amyloid-beta levels in vivo.
Neuron 2005; 48: 913–22.
Clavaguera F, Bolmont T, Crowther RA, Abramowski D, Frank S,
Probst A, et al. Transmission and spreading of tauopathy in transgenic
mouse brain. Nat Cell Biol 2009; 11: 909–13.
Crutch SJ, Lehmann M, Schott JM, Rabinovici GD, Rossor MN, Fox NC.
Posterior cortical atrophy. Lancet Neurol 2012; 11: 170–8.
Dale AM, Fischl B, Sereno MI. Cortical surface-based analysis—I.
Segmentation and surface reconstruction. Neuroimage 1999; 9:
179–94.
de Calignon A, Polydoro M, Suarez-Calvet M, William C,
Adamowicz DH, Kopeikina KJ, et al. Propagation of tau pathology in
a model of early Alzheimer’s disease. Neuron 2012; 73: 685–97.
de Souza LC, Corlier F, Habert MO, Uspenskaya O, Maroy R, Lamari F,
et al. Similar amyloid-{beta} burden in posterior cortical atrophy and
Alzheimer’s disease. Brain 2011; 134 (Pt 7): 2036–43.
Folstein MF, Folstein SE, McHugh PR. Mini-mental state - Practical
method for grading cognitive state of patients for clinician. J
Psychiatr Res 1975; 12: 189–98.
856 | Brain 2013: 136; 844–858 M. Lehmann et al.
at Periodicals Departm
ent/Lane L
ibrary on March 21, 2013
http://brain.oxfordjournals.org/D
ownloaded from

Formaglio M, Costes N, Seguin J, Tholance Y, Le BD, Roullet-Solignac I,
et al. In vivo demonstration of amyloid burden in posterior cortical
atrophy: a case series with PET and CSF findings. J Neurol 2011;
258: 1841–51.
Fripp J, Bourgeat P, Acosta O, Raniga P, Modat M, Pike KE, et al.
Appearance modeling of 11C PiB PET images: characterizing amyloid
deposition in Alzheimer’s disease, mild cognitive impairment and
healthy aging. Neuroimage 2008; 43: 430–9.Frisoni GB, Pievani M, Testa C, Sabattoli F, Bresciani L, Bonetti M, et al.
The topography of grey matter involvement in early and late onset
Alzheimer’s disease. Brain 2007; 130: 720–30.Frisoni GB, Testa C, Sabattoli F, Beltramello A, Soininen H, Laakso MP.
Structural correlates of early and late onset Alzheimer’s disease: voxel
based morphometric study. J Neurol Neurosurg Psychiatry 2005; 76:
112–14.
Frost B, Jacks RL, Diamond MI. Propagation of tau misfolding from the
outside to the inside of a cell. J Biol Chem 2009; 284: 12845–52.
Galton CJ, Patterson K, Xuereb JH, Hodges JR. Atypical and typical
presentations of Alzheimer’s disease: a clinical, neuropsychological,
neuroimaging and pathological study of 13 cases. Brain 2000; 123:
484–98.
Gefen T, Gasho K, Rademaker A, Lalehzari M, Weintraub S, Rogalski E,
et al. Clinically concordant variations of Alzheimer pathology in apha-
sic versus amnestic dementia. Brain 2012; 135: 1554–65.
Gorno-Tempini ML, Brambati SM, Ginex V, Ogar J, Dronkers NF,
Marcone A, et al. The logopenic/phonological variant of primary pro-
gressive aphasia. Neurology 2008; 71: 1227–34.
Gorno-Tempini ML, Dronkers NF, Rankin KP, Ogar JM, Phengrasamy L,
Rosen HJ, et al. Cognition and anatomy in three variants of primary
progressive aphasia. Ann Neurol 2004; 55: 335–46.Gorno-Tempini ML, Hillis AE, Weintraub S, Kertesz A, Mendez M,
Cappa SF, et al. Classification of primary progressive aphasia and its
variants. Neurology 2011; 76: 1006–14.Grady CL, Springer MV, Hongwanishkul D, McIntosh AR, Winocur G.
Age-related changes in brain activity across the adult lifespan. J Cogn
Neurosci 2006; 18: 227–41.
Greicius MD, Srivastava G, Reiss AL, Menon V. Default-mode net-
work activity distinguishes Alzheimer’s disease from healthy aging:
evidence from functional MRI. Proc Natl Acad Sci USA 2004; 101:
4637–42.
Greicius MD, Supekar K, Menon V, Dougherty RF. Resting-state func-
tional connectivity reflects structural connectivity in the default mode
network. Cereb Cortex 2009; 19: 72–8.
Guo JL, Lee VM. Seeding of normal Tau by pathological Tau conformers
drives pathogenesis of Alzheimer-like tangles. J Biol Chem 2011; 286:
15317–31.
Hampson M, Peterson BS, Skudlarski P, Gatenby JC, Gore JC. Detection
of functional connectivity using temporal correlations in MR images.
Hum Brain Mapp 2002; 15: 247–62.
Hof PR, Vogt BA, Bouras C, Morrison JH. Atypical form of Alzheimer’s
disease with prominent posterior cortical atrophy: a review of lesion
distribution and circuit disconnection in cortical visual pathways. Vision
Res 1997; 37: 3609–25.Holmes C, Boche D, Wilkinson D, Yadegarfar G, Hopkins V, Bayer A,
et al. Long-term effects of Abeta42 immunisation in Alzheimer’s dis-
ease: follow-up of a randomised, placebo-controlled phase I trial.
Lancet 2008; 372: 216–23.
Ikonomovic MD, Klunk WE, Abrahamson EE, Mathis CA, Price JC,
Tsopelas ND, et al. Post-mortem correlates of in vivo PiB-PET amyloid
imaging in a typical case of Alzheimer’s disease. Brain 2008; 131:
1630–45.
Johnson KA, Gregas M, Becker JA, Kinnecom C, Salat DH, Moran EK,
et al. Imaging of amyloid burden and distribution in cerebral amyloid
angiopathy. Ann Neurol 2007; 62: 229–34.
Josephs KA, Duffy JR, Fossett TR, Strand EA, Claassen DO, Whitwell JL,
et al. Fluorodeoxyglucose F18 positron emission tomography in pro-
gressive apraxia of speech and primary progressive aphasia variants.
Arch Neurol 2010; 67: 596–605.
Jueptner M, Weiller C. Review: does measurement of regional cerebral
blood flow reflect synaptic activity? Implications for PET and fMRI.
Neuroimage 1995; 2: 148–56.
Kambe T, Motoi Y, Ishii K, Hattori N. Posterior cortical atrophy with
[C-11] Pittsburgh compound B accumulation in the primary visual
cortex. J Neurol 2010; 257: 469–71.
Knibb JA, Xuereb JH, Patterson K, Hodges JR. Clinical and pathological
characterization of progressive aphasia. Ann Neurol 2006; 59: 156–65.
Koedam EL, Lauffer V, van der Vlies AE, van der Flier WM, Scheltens P,
Pijnenburg YA. Early-versus late-onset Alzheimer’s disease: more than
age alone. J Alzheimers Dis 2010; 19: 1401–8.
Koss E, Edland S, Fillenbaum G, Mohs R, Clark C, Galasko D, et al.
Clinical and neuropsychological differences between patients with ear-
lier and later onset of Alzheimer’s disease: a CERAD analysis, Part XII.
Neurology 1996; 46: 136–41.Kramer JH, Jurik J, Sha SJ, Rankin KP, Rosen HJ, Johnson JK, et al.
Distinctive neuropsychological patterns in frontotemporal dementia,
semantic dementia, and Alzheimer disease. Cogn Behav Neurol
2003; 16: 211–8.
Lehmann M, Barnes J, Ridgway GR, Ryan NS, Warrington EK, Crutch SJ,
et al. Global gray matter changes in posterior cortical atrophy: a serial
imaging study. Alzheimers Dement 2012; 8: 502–12.
Lehmann M, Crutch SJ, Ridgway GR, Ridha BH, Barnes J,
Warrington EK, et al. Cortical thickness and voxel-based morphometry
in posterior cortical atrophy and typical Alzheimer’s disease. Neurobiol
Aging 2011; 32: 1466–76.
Lehmann M, Rohrer JD, Clarkson MJ, Ridgway GR, Scahill RI, Modat M,
et al. Reduced cortical thickness in the posterior cingulate gyrus is
characteristic of both typical and atypical Alzheimer’s disease.
J Alzheimers Dis 2010; 20: 587–98.Levine DN, Lee JM, Fisher CM. The visual variant of Alzheimer’s disease:
a clinicopathologic case study. Neurology 1993; 43: 305–13.
Leyton CE, Villemagne VL, Savage S, Pike KE, Ballard KJ, Piguet O, et al.
Subtypes of progressive aphasia: application of the International
Consensus Criteria and validation using beta-amyloid imaging. Brain
2011; 134 (Pt 10): 3030–43.
Liang WS, Reiman EM, Valla J, Dunckley T, Beach TG, Grover A, et al.
Alzheimer’s disease is associated with reduced expression of energy
metabolism genes in posterior cingulate neurons. Proc Natl Acad Sci
USA 2008; 105: 4441–6.
Logan J, Fowler JS, Volkow ND, Wang GJ, Ding YS, Alexoff DL.
Distribution volume ratios without blood sampling from graphical
analysis of PET data. J Cereb Blood Flow Metab 1996; 16: 834–40.
Ly JV, Donnan GA, Villemagne VL, Zavala JA, Ma H, O’Keefe G, et al.
11C-PIB binding is increased in patients with cerebral amyloid
angiopathy-related hemorrhage. Neurology 2010; 74: 487–93.
McKhann GM, Knopman DS, Chertkow H, Hyman BT, Jack CR Jr,
Kawas CH, et al. The diagnosis of dementia due to Alzheimer’s
disease: recommendations from the National Institute on Aging-
Alzheimer’s Association workgroups on diagnostic guidelines for
Alzheimer’s disease. Alzheimers Dement 2011; 7: 263–9.
Meltzer CC, Leal JP, Mayberg HS, Wagner HN Jr, Frost JJ. Correction of
PET data for partial volume effects in human cerebral cortex by MR
imaging. J Comput Assist Tomogr 1990; 14: 561–70.
Mendez MF, Ghajarania M, Perryman KM. Posterior cortical atrophy:
clinical characteristics and differences compared to Alzheimer’s disease.
Dement Geriatr Cogn Disord 2002; 14: 33–40.
Mesulam M, Wicklund A, Johnson N, Rogalski E, Leger GC,
Rademaker A, et al. Alzheimer and frontotemporal pathology in
subsets of primary progressive aphasia. Ann Neurol 2008; 63:
709–19.
Migliaccio R, Agosta F, Rascovsky K, Karydas A, Bonasera S,
Rabinovici GD, et al. Clinical syndromes associated with posterior
atrophy early age at onset AD spectrum. Neurology 2009; 73: 1571–8.
Miller SL, Celone K, DePeau K, Diamond E, Dickerson BC, Rentz D, et al.
Age-related memory impairment associated with loss of parietal de-
activation but preserved hippocampal activation. Proc Natl Acad Sci
USA 2008; 105: 2181–6.
Diverging PIB and FDG patterns in Alzheimer’s disease Brain 2013: 136; 844–858 | 857
at Periodicals Departm
ent/Lane L
ibrary on March 21, 2013
http://brain.oxfordjournals.org/D
ownloaded from
Minoshima S, Frey KA, Foster NL, Kuhl DE. Preserved pontine glucosemetabolism in Alzheimer disease: a reference region for functional
brain image (PET) analysis. J Comput Assist Tomogr 1995; 19: 541–7.
Mintun MA, Larossa GN, Sheline YI, Dence CS, Lee SY, Mach RH, et al.
[11C]PIB in a nondemented population: potential antecedent markerof Alzheimer disease. Neurology 2006; 67: 446–52.
Mormino EC, Brandel MG, Madison CM, Rabinovici GD, Marks S,
Baker SL, et al. Not quite PIB-positive, not quite PIB-negative: slight
PIB elevations in elderly normal control subjects are biologically rele-vant. Neuroimage 2012; 59: 1152–60.
Mormino EC, Kluth JT, Madison CM, Rabinovici GD, Baker SL, Miller BL,
et al. Episodic memory loss is related to hippocampal-mediated-amyloid deposition in elderly subjects. Brain 2009; 132:
1310–23.
Mormino EC, Smiljic A, Hayenga AO, Onami SH, Greicius MD,
Rabinovici GD, et al. Relationships between beta-amyloid and func-tional connectivity in different components of the default mode net-
work in aging. Cereb Cortex 2011; 21: 2399–407.
Mucke L, Masliah E, Yu GQ, Mallory M, Rockenstein EM, Tatsuno G,
et al. High-level neuronal expression of abeta 1-42 in wild-type humanamyloid protein precursor transgenic mice: synaptotoxicity without
plaque formation. J Neurosci 2000; 20: 4050–8.
Mueller SG, Laxer KD, Barakos J, Cheong I, Garcia P, Weiner MW.
Widespread neocortical abnormalities in temporal lobe epilepsy withand without mesial sclerosis. Neuroimage 2009; 46: 353–9.
Murray ME, Graff-Radford NR, Ross OA, Petersen RC, Duara R,
Dickson DW. Neuropathologically defined subtypes of Alzheimer’s dis-ease with distinct clinical characteristics: a retrospective study. Lancet
Neurol 2011; 10: 785–96.
Nelson PT, Alafuzoff I, Bigio EH, Bouras C, Braak H, Cairns NJ, et al.
Correlation of Alzheimer disease neuropathologic changes with cogni-tive status: a review of the literature. J Neuropathol Exp Neurol 2012;
71: 362–81.
Ng SY, Villemagne VL, Masters CL, Rowe CC. Evaluating atypical de-
mentia syndromes using positron emission tomography with carbon 11labeled Pittsburgh Compound B. Arch Neurol 2007; 64: 1140–4.
Nonaka T, Watanabe ST, Iwatsubo T, Hasegawa M. Seeded aggregation
and toxicity of {alpha}-synuclein and tau: cellular models of neurode-generative diseases. J Biol Chem 2010; 285: 34885–98.
Otten LJ, Rugg MD. When more means less: neural activity related to
unsuccessful memory encoding. Curr Biol 2001; 11: 1528–30.
Petrie EC, Cross DJ, Galasko D, Schellenberg GD, Raskind MA,Peskind ER, et al. Preclinical evidence of Alzheimer changes: conver-
gent cerebrospinal fluid biomarker and fluorodeoxyglucose positron
emission tomography findings. Arch Neurol 2009; 66: 632–7.
Price JC, Klunk WE, Lopresti BJ, Lu X, Hoge JA, Ziolko SK, et al. Kineticmodeling of amyloid binding in humans using PET imaging and
Pittsburgh Compound-B. J Cereb Blood Flow Metab 2005; 25:
1528–47.Rabinovici GD, Furst AJ, Alkalay A, Racine CA, O’Neil JP, Janabi M, et al.
Increased metabolic vulnerability in early-onset Alzheimer’s disease is
not related to amyloid burden. Brain 2010; 133 (Pt 2): 512–28.
Rabinovici GD, Jagust WJ, Furst AJ, Ogar JM, Racine CA, Mormino EC,et al. Abeta amyloid and glucose metabolism in three variants of pri-
mary progressive aphasia. Ann Neurol 2008; 64: 388–401.
Reiman EM, Caselli RJ, Yun LS, Chen K, Bandy D, Minoshima S, et al.
Preclinical evidence of Alzheimer’s disease in persons homozygous forthe epsilon 4 allele for apolipoprotein E. N Engl J Med 1996; 334:
752–8.
Renner JA, Burns JM, Hou CE, McKeel DW Jr, Storandt M, Morris JC.
Progressive posterior cortical dysfunction: a clinicopathologic series.Neurology 2004; 63: 1175–80.
Rogalski E, Johnson N, Weintraub S, Mesulam M. Increased frequency of
learning disability in patients with primary progressive aphasia andtheir first-degree relatives. Arch Neurol 2008; 65: 244–8.
Rombouts SA, Barkhof F, Goekoop R, Stam CJ, Scheltens P. Altered
resting state networks in mild cognitive impairment and mild
Alzheimer’s disease: an fMRI study. Hum Brain Mapp 2005; 26:
231–9.
Rosand J, Muzikansky A, Kumar A, Wisco JJ, Smith EE, Betensky RA,
et al. Spatial clustering of hemorrhages in probable cerebral amyloid
angiopathy. Ann Neurol 2005; 58: 459–62.Rosen HJ, Gorno-Tempini ML, Goldman WP, Perry RJ, Schuff N,
Weiner M, et al. Patterns of brain atrophy in frontotemporal dementia
and semantic dementia. Neurology 2002; 58: 198–208.
Rosenbloom MH, Alkalay A, Agarwal N, Baker SL, O’Neill JP, Janabi M,
et al. Distinct clinical and metabolic deficits in PCA and AD are not
related to amyloid distribution. Neurology 2011; 76: 1789–1796.
Ross SJ, Graham N, Stuart Green L, Prins M, Xuereb J, Patterson K, et al.
Progressive biparietal atrophy: an atypical presentation of Alzheimer’s
disease. J Neurol Neurosurg Psychiatry 1996; 61: 388–95.
Salloway S, Sperling R, Gilman S, Fox NC, Blennow K, Raskind M, et al.
A phase 2 multiple ascending dose trial of bapineuzumab in mild to
moderate Alzheimer disease. Neurology 2009; 73: 2061–70.
Sambataro F, Murty VP, Callicott JH, Tan HY, Das S, Weinberger DR,
et al. Age-related alterations in default mode network: impact on
working memory performance. Neurobiol Aging 2010; 31: 839–52.
Seeley WW, Crawford RK, Zhou J, Miller BL, Greicius MD.
Neurodegenerative diseases target large-scale human brain networks.
Neuron 2009; 62: 42–52.Sheline YI, Raichle ME, Snyder AZ, Morris JC, Head D, Wang S, et al.
Amyloid plaques disrupt resting state default mode network connect-
ivity in cognitively normal elderly. Biol Psychiatry 2010; 67: 584–7.
Shiino A, Watanabe T, Kitagawa T, Kotani E, Takahashi J, Morikawa S,
et al. Different atrophic patterns in early- and late-onset Alzheimer’s
disease and evaluation of clinical utility of a method of regional z-score
analysis using voxel-based morphometry. Dement Geriatr Cogn Disord
2008; 26: 175–86.
Shirer WR, Ryali S, Rykhlevskaia E, Menon V, Greicius MD. Decoding
subject-driven cognitive states with whole-brain connectivity patterns.
Cereb Cortex 2012; 22: 158–165.Smith SM, Fox PT, Miller KL, Glahn DC, Fox PM, Mackay CE, et al.
Correspondence of the brain’s functional architecture during activation
and rest. Proc Natl Acad Sci USA 2009; 106: 13040–5.Snowden JS, Stopford CL, Julien CL, Thompson JC, Davidson Y,
Gibbons L, et al. Cognitive phenotypes in Alzheimer’s disease and
genetic risk. Cortex 2007; 43: 835–45.
Sorg C, Riedl V, Muhlau M, Calhoun VD, Eichele T, Laer L, et al.
Selective changes of resting-state networks in individuals at risk for
Alzheimer’s disease. Proc Natl Acad Sci USA 2007; 104: 18760–5.
Tang-Wai DF, Graff-Radford NR, Boeve BF, Dickson DW, Parisi JE,
Crook R, et al. Clinical, genetic, and neuropathologic characteristics
of posterior cortical atrophy. Neurology 2004; 63: 1168–74.
Tenovuo O, Kemppainen N, Aalto S, Nagren K, Rinne JO. Posterior
cortical atrophy: a rare form of dementia with in vivo evidence of
amyloid-beta accumulation. J Alzheimers Dis 2008; 15: 351–5.
van der Flier WM, Pijnenburg YA, Fox NC, Scheltens P. Early-onset
versus late-onset Alzheimer’s disease: the case of the missing APOE
epsilon4 allele. Lancet Neurol 2011; 10: 280–8.Walsh DM, Selkoe DJ. A beta oligomers—a decade of discovery. J
Neurochem 2007; 101: 1172–84.
Wang K, Liang M, Wang L, Tian L, Zhang X, Li K, et al. Altered func-
tional connectivity in early Alzheimer’s disease: a resting-state fMRI
study. Hum Brain Mapp 2007; 28: 967–78.
Whitwell JL, Jack CR Jr, Przybelski SA, Parisi JE, Senjem ML, Boeve BF,
et al. Temporoparietal atrophy: a marker of AD pathology independ-
ent of clinical diagnosis. Neurobiol Aging 2011; 32: 1531–41.
Whitwell JL, Jack CR, Kantarci K, Weigand SD, Boeve BF, Knopman DS,
et al. Imaging correlates of posterior cortical atrophy. Neurobiol Aging
2007; 28: 1051–61.Zhou J, Gennatas ED, Kramer JH, Miller BL, Seeley WW. Predicting re-
gional neurodegeneration from the healthy brain functional connec-
tome. Neuron 2012; 73: 1216–27.
858 | Brain 2013: 136; 844–858 M. Lehmann et al.
at Periodicals Departm
ent/Lane L
ibrary on March 21, 2013
http://brain.oxfordjournals.org/D
ownloaded from