8.20.07 clearwire corp. (clwr) sid parakh > … should soon have the ability to offer bundled...
TRANSCRIPT

Additional required disclosures under NASD Rule 2711 are provided on the last page of this document.
McAdams Wright Ragen > 925 Fourth Avenue, Suite 3900 Seattle, WA 98104 888.567.6297 > www.mwrinc.com Page 1 of 18
▲ Strong Subscriber Growth, ARPU Upside, New Distribution Revenue Streams Clearwire continues to rapidly grow its subscriber base, growing 130% Y/Y in the most recent quarter to just under 300K subscribers. ARPU has increased 10.6% Y/Y and 5.8% Q/Q to $37.93 as an increasing number of markets now offer VoIP services. Over time, all Clearwire markets will offer VoIP services, benefiting ARPU. Additionally, Clearwire, we believe, could establish new and meaningful revenue streams through the distribution of partner offerings (video, cellular services).
• Key Partnerships Should Bolster Product Offering, Distribution and Sourcing Through a series of recent partnerships with Sprint Nextel, EchoStar and DirecTV, Clearwire should soon have the ability to offer bundled services encompassing data, wireless, VoIP and video, essentially creating a level playing field with the likes of Verizon, AT&T, Comcast, etc. Separately, both Intel and Motorola are investees in the company, which we view as a positive for the mobile WiMax infrastructure ecosystem, to the benefit of Clearwire. Overall, we believe that these partnerships will help ensure rapid distribution of mobile broadband services and technical feasibility of mobile WiMax, expected to be available in late 2007.
• Strong Spectrum Position, Aggressive Network Build-out Schedule Clearwire is the 2nd largest owner of the 2.5GHz spectrum covering almost all major towns and cities in the U.S. The company has also acquired rights to a significant amount of spectrum in international geographies. Clearwire has, so far, launched 43 markets, covering a population of over 11 million potential subscribers. Over the next six years, the company is targeting a subscriber base of ~10 million with the network capable of providing mobile broadband services to 115 million consumers, representing more than an 11 fold increase from current coverage.
• Seasoned Management Team, Proven – Scalable and Replicable Model Clearwire was founded by Craig McCaw, a pioneer in cellular communications, with over 35 years of experience in the industry and is now headed by a team with a combined 200 years of relevant industry experience. Clearwire’s strategy of acquiring spectrum and aggressively building out its network is a proven strategy that has previously been successful at earlier McCaw ventures. Additionally, Clearwire has proven that its business model is highly scalable and replicable, as evidenced by the success of its “initial” 25 markets. Fourteen of the 25 markets are now EBITDA positive.
8.20.07
Sid Parakh > [email protected] > 206.664.8885
Wire into Clearwire $23.23 | BUY• We are initiating coverage on Clearwire with a BUY rating and 12-month $28 price target. • Clearwire is the second largest owner of 2.5GHz spectrum in the U.S. and is investing heavily in expanding network
coverage for its wireless broadband and VoIP offerings. • The company is targeting a subscriber base of ~10 million and hoping to generate revenues in excess of $5 billion and
free cash flow of ~$1.5 billion by 2013. Taking a moderate stance, we project 2013 subscribers of 9.1 million and revenues of $4.3 billion.
• Overall, with a seasoned team of professionals, strong spectrum position, an aggressive service rollout schedule, backing from influential partners, and the promise of a true mobile WiMax broadband offering, Clearwire appears well-positioned to benefit from the strong ongoing customer adoption of broadband services, we believe.
52 Week High $35.41 52 Week Low $15.81 P/E FY06A NA FY07E NA FY08E NA 12 Mo. Price Target $28.00 Diluted Shares Out (Mil) 163.3 Market Cap (Mil) $3,793.5 Avg Daily Vol (000s) 1,188.7 Book Value $9.23 Net Cash per Share $2.45 3- 5 yr EPS Growth NA Fiscal Year End DEC
Q U A R T E R L Y C A S H E B I T D A E S T I M A T E S *
E B I T D A F Y 0 7 E F Y 0 8 E F Y 0 9 E
MAR ($51.5)A NA NA JUN (70.2)A NA NA SEP (74.4) NA NA DEC (77.9) NA NA FY ($274.1) ($458.2) ($423.5) * e x c l u d e s s t o c k - b a s e d c o m p e n s a t i o n ,
o t h e r n o n - c a s h c h a r g e s
R E V E N U E E S T I M A T E S
( $ M M ) F Y 0 7 E F Y 0 8 E F Y 0 9 E
MAR $29.3A NA NA JUN $35.5A NA NA SEP $39.6 NA NA DEC $45.6 NA NA FY $149.9 $370.8 $875.2
Clearwire Corp. (CLWR) Init iat ing Coverage
Additional required disclosures under NASD Rule 2711 are provided on the last page of this document.
McAdams Wright Ragen > 925 Fourth Avenue, Suite 3900 Seattle, WA 98104 888.567.6297 > www.mwrinc.com Page 2 of 18
Opinion & Valuation We initiate coverage on Clearwire with a BUY rating and a 12-18 month $28 price target. We believe that Clearwire is strongly positioned in the mobile broadband industry and should be able to drive significant growth over the next few years. Strategic partnerships forged in recent times should also boost Clearwire’s ability to effectively compete against larger established players in the connectivity arena. Clearwire has a strong experienced management team that has successfully executed scalable and replicable business models, as evidenced from prior ventures as well as progress made in several markets launched over the last couple of years, giving us increased conviction in our BUY recommendation. However, Clearwire is still in the early stages of its network build and runs several risks that should be noted, including slower-than-expected adoption of its services, technical evolution of mobile WiMax, strategy execution, in addition to increased competition from other 3G service operators as cellular data offerings get faster and better. Further, from a financial perspective, the large planned network build implies significant capital expenditures in the near-to-mid term resulting in the addition of significant debt (or equity dilution, although less likely) and negative cash flows in the foreseeable future. In the event of a slowdown (economic, as well as in new subscriber additions), high debt levels raise the prospects of financial risk. Additionally, the above risks may jeopardize the achievement of longer-term targets – a primary attraction of investing in Clearwire. Barring the occurrence of the above-mentioned risks, we are optimistic about Clearwire’s long-term prospects and believe that continued success in executing its strategic plan could result in significant revenue and profitability growth (and investor gains) over the next few years. We note that near-term news flow may be subdued, especially after the slew of recent partnership announcements, and as such, we do not anticipate any significant short-term catalysts. As a result, investor focus may revert to progress in the company’s ongoing operations; which in turn may magnify the company’s negative cash flows and lack of profitability over the next few years, we fear. However, patient investors should be well-rewarded over the long-term, we believe. As such, we initiate coverage with a BUY rating and 12-18 month $28 price target. We believe that successful execution and subsequent achievement of long-term operating targets can result in a stock price significantly higher than our $28 price target. Clearwire went public at a valuation of $25 per share earlier this year. We use EV/EBITDA valuation to arrive at our valuation for Clearwire. We are basing our valuation on a multiple of the present value of our 2013 EBITDA estimate of $1.7 billion indicating an EBITDA margin of 40%, at the low-end of management guidance of 40% - 45%. The table (on Page 3) identifies the range of potential valuations for Clearwire. Our analysis of peer companies indicates that they currently trade at EV/EBITDA multiples of 8.3x (average) and 7x (median) on 2007 consensus EBITDA estimates, and 7x (average) and 6.4x (median) on 2008 consensus EBITDA estimates. Recently, Alltel (NYSE: AT), a cellular service provider, announced that it was being taken private at $71.50 per share, translating to EV/EBITDA multiples of 9.1x 2007 consensus EBITDA and 8.4x 2008 consensus EBITDA levels. As such, we believe the highlighted range represents appropriate valuation levels. Note that in addition to growing faster than most of its peers, Clearwire is also a
W ELL -P OSI T I O N E D TO D RI V E LO NG -
T E R M G RO W TH
S U C C E S S F UL E X E C U TI O N S H O U L D
M I N I MI ZE R I SK S
N E A R- T E RM NEW S FL OW MA Y BE
S U B D UE D
Additional required disclosures under NASD Rule 2711 are provided on the last page of this document.
McAdams Wright Ragen > 925 Fourth Avenue, Suite 3900 Seattle, WA 98104 888.567.6297 > www.mwrinc.com Page 3 of 18
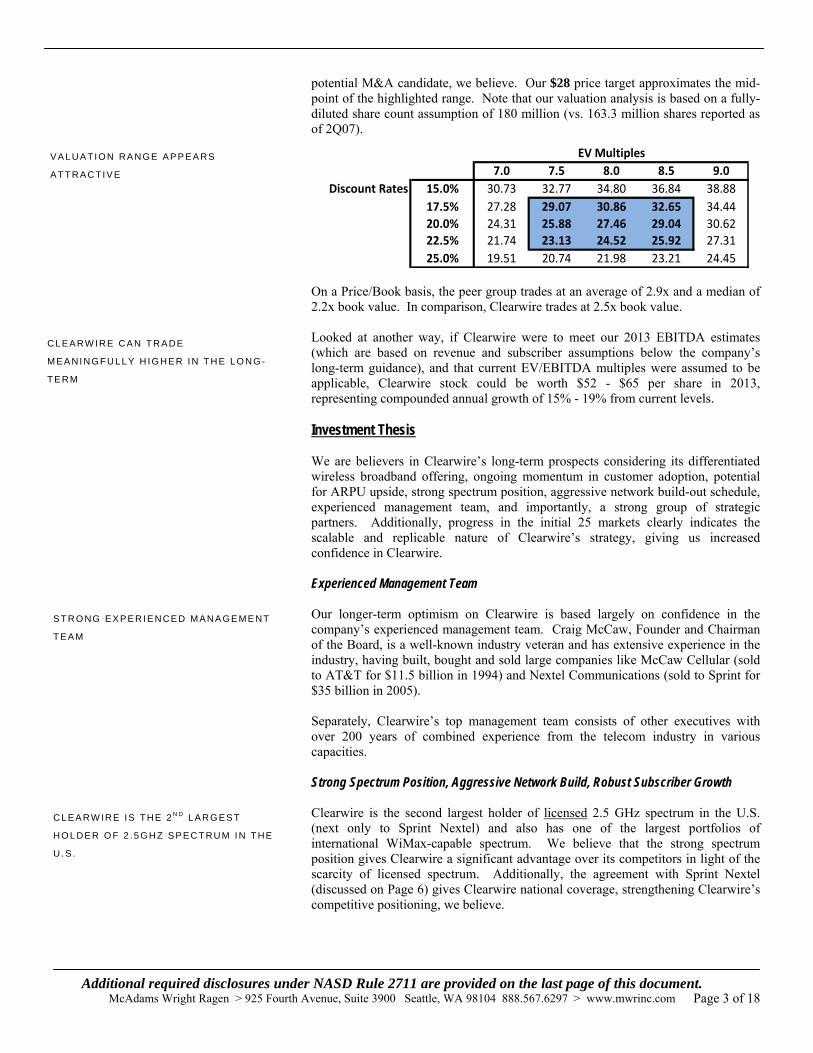
potential M&A candidate, we believe. Our $28 price target approximates the mid-point of the highlighted range. Note that our valuation analysis is based on a fully-diluted share count assumption of 180 million (vs. 163.3 million shares reported as of 2Q07).
7.0 7.5 8.0 8.5 9.0Discount Rates 15.0% 30.73 32.77 34.80 36.84 38.88
17.5% 27.28 29.07 30.86 32.65 34.4420.0% 24.31 25.88 27.46 29.04 30.6222.5% 21.74 23.13 24.52 25.92 27.3125.0% 19.51 20.74 21.98 23.21 24.45
EV Multiples
On a Price/Book basis, the peer group trades at an average of 2.9x and a median of 2.2x book value. In comparison, Clearwire trades at 2.5x book value. Looked at another way, if Clearwire were to meet our 2013 EBITDA estimates (which are based on revenue and subscriber assumptions below the company’s long-term guidance), and that current EV/EBITDA multiples were assumed to be applicable, Clearwire stock could be worth $52 - $65 per share in 2013, representing compounded annual growth of 15% - 19% from current levels. Investment Thesis We are believers in Clearwire’s long-term prospects considering its differentiated wireless broadband offering, ongoing momentum in customer adoption, potential for ARPU upside, strong spectrum position, aggressive network build-out schedule, experienced management team, and importantly, a strong group of strategic partners. Additionally, progress in the initial 25 markets clearly indicates the scalable and replicable nature of Clearwire’s strategy, giving us increased confidence in Clearwire. Experienced Management Team Our longer-term optimism on Clearwire is based largely on confidence in the company’s experienced management team. Craig McCaw, Founder and Chairman of the Board, is a well-known industry veteran and has extensive experience in the industry, having built, bought and sold large companies like McCaw Cellular (sold to AT&T for $11.5 billion in 1994) and Nextel Communications (sold to Sprint for $35 billion in 2005). Separately, Clearwire’s top management team consists of other executives with over 200 years of combined experience from the telecom industry in various capacities. Strong Spectrum Position, Aggressive Network Build, Robust Subscriber Growth Clearwire is the second largest holder of licensed 2.5 GHz spectrum in the U.S. (next only to Sprint Nextel) and also has one of the largest portfolios of international WiMax-capable spectrum. We believe that the strong spectrum position gives Clearwire a significant advantage over its competitors in light of the scarcity of licensed spectrum. Additionally, the agreement with Sprint Nextel (discussed on Page 6) gives Clearwire national coverage, strengthening Clearwire’s competitive positioning, we believe.
V A LU A TI O N RA N GE AP PE A RS
A T T R A C TI V E
C L EA RW I R E CA N T R A DE
M E A NI NG F U LLY H I G HE R I N T H E LO N G-
T E R M
S T R O NG EX PE RI E N CE D M AN A GE M E NT
T E A M
CL EA RW IRE IS THE 2 N D LARG ES T
H O L DE R O F 2 . 5 G H Z S PE C T RU M I N T HE
U . S .

Additional required disclosures under NASD Rule 2711 are provided on the last page of this document.
McAdams Wright Ragen > 925 Fourth Avenue, Suite 3900 Seattle, WA 98104 888.567.6297 > www.mwrinc.com Page 4 of 18
Currently, Clearwire has coverage totaling a population of 11.6 million. The company initially planned to build-out approximately 16 – 18 million POPs, but we expect the number to be slightly lower in light of the agreement announced with Sprint Nextel, under which the company is expected to swap certain markets with Sprint Nextel. Clearwire will continue its network expansion and expects to cover a population of 115 million by 2012/2013, investing ~$2.5 billion over the next few years to expand its networks. A better understanding of the actual spend will be clear when terms for the Sprint Nextel agreement are finalized (mid-to-late September). Sprint Nextel will build out infrastructure to cover an additional population of 185 million allowing Clearwire users to roam on Sprint Nextel’s network, and vice versa. With its concurrent focus on building its international presence, we believe that the large portfolio of international spectrum holdings provides Clearwire with a good head-start to offer mobile broadband services not just in emerging geographies with limited wire-line infrastructure, but also in developed economies. ARPU Growth Potential, Distribution Revenue Upside We believe that Clearwire can continue to drive ARPU growth with expanded coverage of its VoIP offerings (50% incremental EBITDA margins) as well as through adoption of higher priced services. In addition, we believe that Clearwire can establish distribution revenue streams through the distribution of video and 3G cellular services to its subscribers through its partners. However, note that such agreements are yet to be firmed up. Please refer to the detailed discussion on such agreements beginning Page 6. Clearwire announced that it would launch a PC-Card based offering in late 3Q07 / early 4Q07 at a price point of $59.99 per month. The company also announced its intent to launch a 2MB/s home offering for $44.99. Additionally, with the expected roll-out of mobile WiMax services beginning in late-2007, there is added potential to offer higher speed services at relatively higher prices. Overall, we believe that these factors should help increase ARPU going forward, which was $37.93 as of 2Q07. However, given the competitive nature of the industry, there is consistent pressure on pricing and we expect that ARPU growth should stall at some point, and may even decline further out. Nevertheless, we assume ARPU to be flat initially for our modeling purposes despite our belief that Clearwire is still in the early stages of its lifecycle and should continue to experience ARPU growth. Proven Strategy, Differentiated Offering, Scalable and Replicable Model Clearwire’s growth strategy appears simple. Build the network, enter strategic partnerships and aggressively market differentiated services to drive consumer adoption. We believe that this strategy has been adopted by top management in prior ventures and has worked successfully. We believe that Clearwire’s service offerings are differentiated from its competitors. The company emphasizes its plug-and-play install process which is simpler than other broadband installations. Additionally, Clearwire seems to be the only large domestic provider of wireless broadband solutions for the residential market. Most of the cellular-data services offered by competitors are aimed at business customers. Additionally, Clearwire’s operating model appears scalable and replicable, as evidenced by significant progress made in the company’s initial 25 markets. As
L A RG E I N TE RN A TI O NA L O PP O R T U NI T Y
T O O
A R P U G R OW TH HA S B EE N ST R O N G -
M O R E UP SI DE PO TE N TI AL
P O TE N TI AL FO R N EW S I G NI F I CA N T
R E V E N U E S T RE A MS
THE O NL Y L ARG E P R OVI D ER O F
R E SI DE N TI AL W I RE LE SS B RA O DB A N D

Additional required disclosures under NASD Rule 2711 are provided on the last page of this document.
McAdams Wright Ragen > 925 Fourth Avenue, Suite 3900 Seattle, WA 98104 888.567.6297 > www.mwrinc.com Page 5 of 18
such, we believe that network expansion in combination with a proven and replicable marketing strategy, Clearwire should be able to continue to drive strong subscriber growth. We are projecting subscriber growth of ~68% CAGR through 2013, reaching an estimated 9.1 million subscribers. Our view on subscriber growth combined with potential ARPU upside indicates that revenues should grow rapidly over the next few years and that the financials should more-or-less track performance of the company’s initial 25 markets, which we believe to be strong. Explosion of Digital Content Provides Favorable Macro Dynamics Explosion of online digital media content has dramatically increased the need for speed driving significant consumer adoption of, increasingly available and affordable, broadband internet services, domestically and internationally. We believe the positive trends in the broadband space provide macro-level support to Clearwire’s growth prospects. Clearwire’s value proposition lies in providing mobile broadband connectivity that is easy to deploy and use, at a reasonable price. Company Description Headquartered in Kirkland, WA, Clearwire is one of the first domestic providers of broadband internet access based on the WiMax technology. Clearwire, Inc. was founded in October 2003 and the company launched its first market in August 2004. Since then, the company has expanded its service offerings to 43 domestic markets and some international markets including Belgium and Ireland. The company had 1,700 employees as of 2Q07, compared with 1,360 as of 1Q07 and 760 as of 1Q06, an indication of the rapid pace of growth targeted by the company. Four hundred and fifty of the 1,700 employees work in the corporate general & administrative group. Currently, Clearwire is deploying an internally developed technology called Expedience and all networks built to-date feature this technology. Beginning late in 2007, Clearwire is expected to deploy mobile WiMax technology. Initially, only new markets will be based on mobile WiMax, while older Expedience-based networks will be transitioned to WiMax further out in time. Clearwire has already indicated that initial field trials for mobile WiMax, conducted in partnership with Intel, have been successful and that the company is confident of beginning mobile WiMax deployments in late 2007. The company, directly or indirectly, controls a total of 22.9 billion MHz POPS in spectrum holdings domestically and internationally. The company owns 26% of this spectrum whereas the remainder is under long-term (generally ~30 year) leases. Clearwire’s current spectrum holdings are capable of providing service coverage to ~115 million subscribers (or 50 million households) and these holdings make it the second largest spectrum holder in the U.S., behind Sprint.
W E P ROJ E CT S U BS C RI BE R G R OW TH O F
~ 6 8% C AG R TH R O U GH T O 20 1 3
A N I N C R E A S I N G N E E D F O R S P E E D
R A PI D E M PL OYE E G ROW T H
M O BI L E W I MAX C O MI NG LAT E 2 00 7
Additional required disclosures under NASD Rule 2711 are provided on the last page of this document.
McAdams Wright Ragen > 925 Fourth Avenue, Suite 3900 Seattle, WA 98104 888.567.6297 > www.mwrinc.com Page 6 of 18
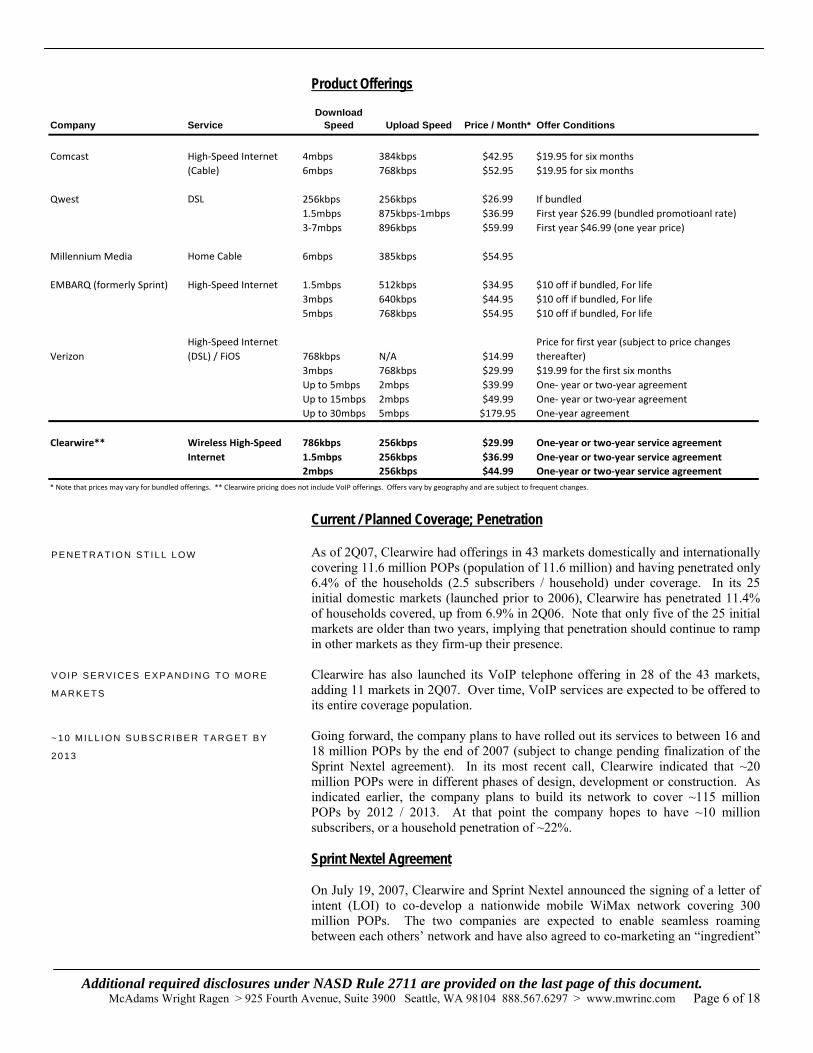
Product Offerings
Company ServiceDownload
Speed Upload Speed Price / Month* Offer Conditions
Comcast 4mbps 384kbps $42.95 $19.95 for six months6mbps 768kbps $52.95 $19.95 for six months
Qwest DSL 256kbps 256kbps $26.99 If bundled1.5mbps 875kbps‐1mbps $36.99 First year $26.99 (bundled promotioanl rate)3‐7mbps 896kbps $59.99 First year $46.99 (one year price)
Millennium Media Home Cable 6mbps 385kbps $54.95
EMBARQ (formerly Sprint) High‐Speed Internet 1.5mbps 512kbps $34.95 $10 off if bundled, For life3mbps 640kbps $44.95 $10 off if bundled, For life5mbps 768kbps $54.95 $10 off if bundled, For life
VerizonHigh‐Speed Internet (DSL) / FiOS 768kbps N/A $14.99
Price for first year (subject to price changes thereafter)
3mbps 768kbps $29.99 $19.99 for the first six monthsUp to 5mbps 2mbps $39.99 One‐ year or two‐year agreementUp to 15mbps 2mbps $49.99 One‐ year or two‐year agreementUp to 30mbps 5mbps $179.95 One‐year agreement
Clearwire** 786kbps 256kbps $29.99 One‐year or two‐year service agreement1.5mbps 256kbps $36.99 One‐year or two‐year service agreement2mbps 256kbps $44.99 One‐year or two‐year service agreement
* Note that prices may vary for bundled offerings. ** Clearwire pricing does not include VoIP offerings. Offers vary by geography and are subject to frequent changes.
Wireless High‐Speed Internet
High‐Speed Internet (Cable)
Current / Planned Coverage; Penetration As of 2Q07, Clearwire had offerings in 43 markets domestically and internationally covering 11.6 million POPs (population of 11.6 million) and having penetrated only 6.4% of the households (2.5 subscribers / household) under coverage. In its 25 initial domestic markets (launched prior to 2006), Clearwire has penetrated 11.4% of households covered, up from 6.9% in 2Q06. Note that only five of the 25 initial markets are older than two years, implying that penetration should continue to ramp in other markets as they firm-up their presence. Clearwire has also launched its VoIP telephone offering in 28 of the 43 markets, adding 11 markets in 2Q07. Over time, VoIP services are expected to be offered to its entire coverage population. Going forward, the company plans to have rolled out its services to between 16 and 18 million POPs by the end of 2007 (subject to change pending finalization of the Sprint Nextel agreement). In its most recent call, Clearwire indicated that ~20 million POPs were in different phases of design, development or construction. As indicated earlier, the company plans to build its network to cover ~115 million POPs by 2012 / 2013. At that point the company hopes to have ~10 million subscribers, or a household penetration of ~22%. Sprint Nextel Agreement On July 19, 2007, Clearwire and Sprint Nextel announced the signing of a letter of intent (LOI) to co-develop a nationwide mobile WiMax network covering 300 million POPs. The two companies are expected to enable seamless roaming between each others’ network and have also agreed to co-marketing an “ingredient”
P E NE T R A TI O N ST I L L L OW
V OIP SE RVI CES EX PA NDI N G TO MO RE
M A R KE T S
~ 1 0 MI L L I O N S U BS C RI BE R T A R GE T B Y
2 0 13

Additional required disclosures under NASD Rule 2711 are provided on the last page of this document.
McAdams Wright Ragen > 925 Fourth Avenue, Suite 3900 Seattle, WA 98104 888.567.6297 > www.mwrinc.com Page 7 of 18
brand. Further, under the agreement, Clearwire will offer mobile WiMax services in its territories using Sprint Nextel’s retail stores in addition to its own distribution channels. The initial agreement also contains the possibility of Clearwire offering Sprint Nextel’s 3G voice and data services on a stand-alone basis or as a bundled offering. Note that although a broad agreement has been formulated, details are scarce. A definitive agreement is expected to be inked within 60 days of the announcement (mid-to-late September).
Clearwire is expected to focus on covering 115 million (~38%) of the 300 million POPs while Sprint Nextel will be responsible for the remainder. Sprint Nextel’s build-out will cover 75% of the people covered by the 50 largest markets. The two companies anticipate combined coverage of ~100 million POPs by the end of 2008. As a part of the build-out, both companies are expected to engage in the exchange of 2.5 GHz spectrum to optimize the development and operation of the network. In addition, some already developed markets are also expected to change hands as a part of this agreement. We view this agreement as a significant long-term positive for Clearwire for several reasons: • The agreement provides Clearwire a national footprint through the combined
network. Additionally, this partnership should also help reduce capital expenditures and ongoing operating expenses (related to the network build out), establishing distribution and otherwise having to market its own brand (vs. the current co-marketing agreement).
CL EA RW IRE MA Y BE AB LE TO O F FE R
C E L L U L A R S E R V I C E S
1 0 0 M IL L IO N PO PS TO B E CO VE RE D B Y
2 0 08
A G RE E ME N T GI VE S CL EA RW IRE
C R I T I CA L NA T I O N AL F OO T PR I N T

Additional required disclosures under NASD Rule 2711 are provided on the last page of this document.
McAdams Wright Ragen > 925 Fourth Avenue, Suite 3900 Seattle, WA 98104 888.567.6297 > www.mwrinc.com Page 8 of 18
• The planned co-marketing aspect should help boost Clearwire’s marketing and distribution efforts, giving increased confidence in the achievement of targeted penetration and subscriber levels.
• This partnership enables faster time-to-market as both Sprint Nextel and Clearwire build the combined network simultaneously.
• Clearwire now has access to Sprint Nextel’s strong retail presence giving Clearwire an excellent established distribution infrastructure.
• The agreement (in combination with agreements with DirecTV and EchoStar, discussed below) should eventually allow Clearwire to offer bundled services, making it competitive with other providers.
• The agreement mutes prior concerns over competitive overlap with Sprint Nextel’s wireless broadband network.
• The agreement raises the possibility of a down-the-road M&A transaction between the two.
EchoStar / DirecTV Agreements In June 2007, Clearwire entered into distribution agreements with DirecTV (NYSE: DTV) and EchoStar Communications (NASDAQ: DISH). This complementary agreement enables DirecTV and EchoStar to offer Clearwire’s wireless broadband and VoIP offering to their customers either on a stand-alone basis or as a bundle. Simultaneously, the agreement enables Clearwire to sell DirecTV’s and EchoStar’s satellite video services to Clearwire customers. We believe these agreements to be of a revenue-sharing nature. The launch is planned for later this year. As in the case of the Sprint Nextel partnership, the agreements with DirecTV and EchoStar should boost distribution of Clearwire’s wireless broadband and VoIP. Additionally, as indicated earlier, these agreements combined with the Sprint Nextel agreement allow Clearwire to offer all consumer entertainment and connectivity services – internet (data), video, voice (VoIP) and wireless. This ability should enable Clearwire to effectively compete with bundled offerings from other national competitors like Comcast, AT&T, Verizon, etc. Intel / Motorola / BCE Investments Other partners (and also investors) include Intel ($600 million), Motorola ($300 million) and Bell Canada ($100 million). Intel has agreed to jointly develop, promote and market a mobile WiMax service offering as a co-branded offering on Clearwire’s network for users of laptops, ultra-mobile PCs and other mobile computing devices. Intel has further agreed to develop WiMax chips to be embedded in laptops and other mobile computing devices using its microprocessors. We believe Intel’s participation should boost the availability of WiMax-compatible devices, potentially boosting subscriber uptake of mobile WiMax services, to the benefit of Clearwire. On the other hand, Motorola is working to develop mobile WiMax infrastructure equipment to be utilized by Clearwire as it builds its network. Deployments for mobile WiMax are planned to begin late 2007. Bell Canada is expected to supply hardware, software and other services necessary for Clearwire to be able to provide VoIP services in the U.S. Bell Canada will also be the preferred VoIP services and applications provider for Clearwire in markets beyond the U.S.
S EV E RA L O T HE R A DV A N TA GE S
B R OA D E NI NG D I S T RI B U TI O N; AB I L I T Y
TO SE LL V I DEO SE RVI CE S
O T H E R P A R TNE R S HE LP C RE A TE A
S T R O NG W I MAX EC OS YS T EM
Additional required disclosures under NASD Rule 2711 are provided on the last page of this document.
McAdams Wright Ragen > 925 Fourth Avenue, Suite 3900 Seattle, WA 98104 888.567.6297 > www.mwrinc.com Page 9 of 18
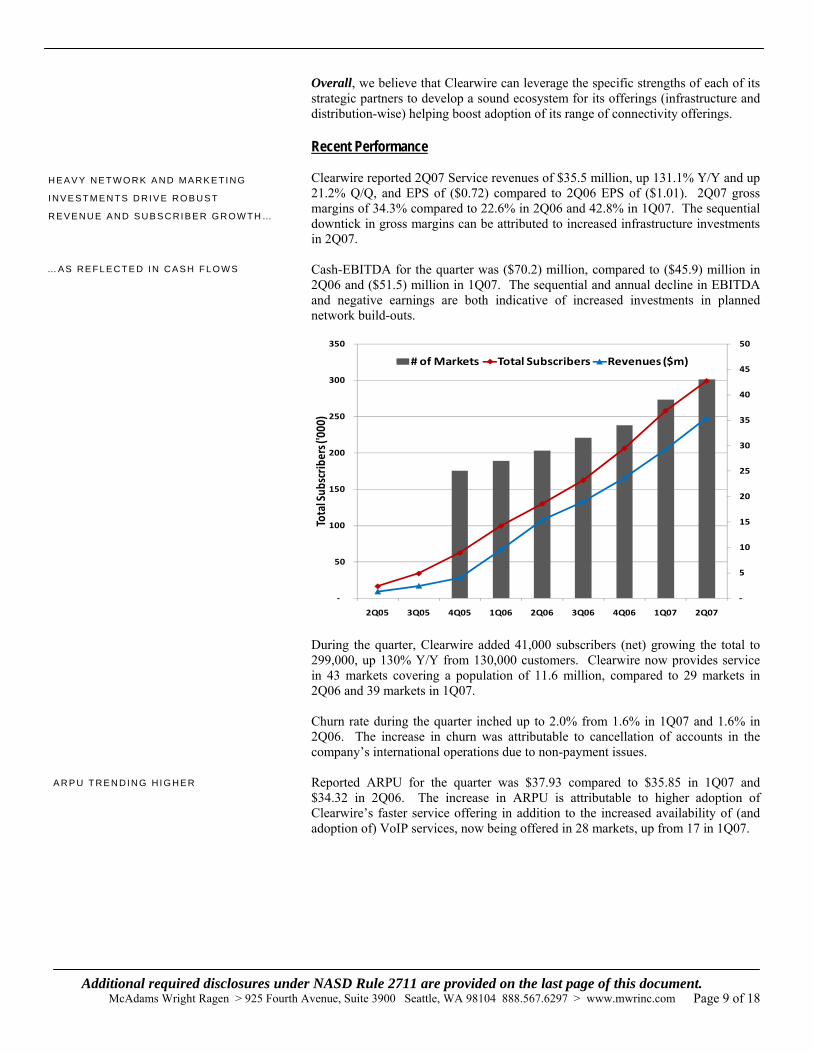
Overall, we believe that Clearwire can leverage the specific strengths of each of its strategic partners to develop a sound ecosystem for its offerings (infrastructure and distribution-wise) helping boost adoption of its range of connectivity offerings. Recent Performance Clearwire reported 2Q07 Service revenues of $35.5 million, up 131.1% Y/Y and up 21.2% Q/Q, and EPS of ($0.72) compared to 2Q06 EPS of ($1.01). 2Q07 gross margins of 34.3% compared to 22.6% in 2Q06 and 42.8% in 1Q07. The sequential downtick in gross margins can be attributed to increased infrastructure investments in 2Q07. Cash-EBITDA for the quarter was ($70.2) million, compared to ($45.9) million in 2Q06 and ($51.5) million in 1Q07. The sequential and annual decline in EBITDA and negative earnings are both indicative of increased investments in planned network build-outs.
‐
5
10
15
20
25
30
35
40
45
50
‐
50
100
150
200
250
300
350
2Q05 3Q05 4Q05 1Q06 2Q06 3Q06 4Q06 1Q07 2Q07
Total Sub
scrib
ers ('000
)
# of Markets Total Subscribers Revenues ($m)
During the quarter, Clearwire added 41,000 subscribers (net) growing the total to 299,000, up 130% Y/Y from 130,000 customers. Clearwire now provides service in 43 markets covering a population of 11.6 million, compared to 29 markets in 2Q06 and 39 markets in 1Q07. Churn rate during the quarter inched up to 2.0% from 1.6% in 1Q07 and 1.6% in 2Q06. The increase in churn was attributable to cancellation of accounts in the company’s international operations due to non-payment issues. Reported ARPU for the quarter was $37.93 compared to $35.85 in 1Q07 and $34.32 in 2Q06. The increase in ARPU is attributable to higher adoption of Clearwire’s faster service offering in addition to the increased availability of (and adoption of) VoIP services, now being offered in 28 markets, up from 17 in 1Q07.
HE AV Y NE TW O R K A N D MA RK E TI NG
I NV ES T M E N TS D RI V E RO B US T
R E V E N U E A ND S U B S C RI B E R G R O W TH …
… AS RE FL E C TE D IN CAS H FL OW S
A R P U T RE N DI N G H I G HE R

Additional required disclosures under NASD Rule 2711 are provided on the last page of this document.
McAdams Wright Ragen > 925 Fourth Avenue, Suite 3900 Seattle, WA 98104 888.567.6297 > www.mwrinc.com Page 10 of 18
20.00
22.00
24.00
26.00
28.00
30.00
32.00
34.00
36.00
38.00
40.00
2Q05 3Q05 4Q05 1Q06 2Q06 3Q06 4Q06 1Q07 2Q07
ARPU ($, excl. legacy revenues)
The company had debt of $656 million and cash and cash equivalents of $1.1 billion as of 2Q07. Separately, the company had also issued ~16 million warrants to debt holders. Clearwire will use proceeds from a recent $1 billion debt offering to pay down the $656 million in debt as well as to redeem the 16 million warrants. The remainder (~$200 million) from new borrowings will be used for network expansion purposes. Initial Markets Performance The performance of Clearwire’s initial 25 markets – markets launched prior to 2006 – provides a rough idea of the progression cycle in the company’s markets over time. The performance of these markets can also be used as a benchmark to analyze the future performance of other markets that are in the process of being launched, or were launched in the recent past. Here are some metrics:
• Revenues improved 107.7% Y/Y and 17.5% Q/Q to $21.2 million, indicating the benefits from continued customer adoption and increased ARPU levels.
• In 2Q07, the company had 195,000 subscribers, up 77.8% Y/Y and up 9.7% Q/Q.
• As a result, household penetration was up to 11.4% in 2Q07 compared to 6.9% in 2Q06 and 10.4% in 1Q07.
• 2Q07 ARPU of $37.99 was up 9.3% Y/Y and 4.3% Q/Q. • Gross margins increased from 48.3% in 1Q06 to 75.6% in the latest
quarter, indicating leverage of network infrastructure. • The group as a whole is cash-EBITDA positive for the first time at a
modest $1.1 million. • Importantly, 14 of the 25 markets are now cash-EBITDA positive,
compared to 10 in 1Q07 and just four in 4Q06.
L E VE RA GE D BA L ANCE S H EET
I N I T I AL 25 M AR K E TS P RO VI D E I N S I G H T
I N TO F U T U RE P E R FO R MA N CE

Additional required disclosures under NASD Rule 2711 are provided on the last page of this document.
McAdams Wright Ragen > 925 Fourth Avenue, Suite 3900 Seattle, WA 98104 888.567.6297 > www.mwrinc.com Page 11 of 18
Overall, it appears that Clearwire’s strategy of building-out its network and aggressively marketing its services is paying off through increased customer adoption of its services, which has subsequently resulted in better financial performance. Clearwire seeks to replicate this model throughout its other markets, an effort we believe should be successful. Long-Term Targets / Capital Requirements Clearwire does not issue quarterly or annual guidance. However, the company has established long-term (2012 / 2013 timeframe) targets as follows:
• Cover a population of ~115 million (~125 million prior to the Sprint agreement)
• Achieve a subscriber base of > 10 million • Revenues > $5 billion • 40% - 45% EBITDA margins • Free Cash Flow of >$1.5 billion
Note that management targets, and our estimates, do not assume any revenue contributions from the distribution of partner offerings. As such, there is potential for notable upside revision of the abovementioned targets, over time, assuming successful execution of its strategic plan. Additionally, note that these targets are subject to adjustments pending the finalization of the Sprint Nextel agreement. At the end of 2006, Clearwire laid out cash requirements of ~$1.6 billion ($1.4 billion after recent debt raise) to fulfill its network expansion plan. As such, despite the recent $1 billion debt raise, we believe that Clearwire may tap the debt market again in the near future. Note that Clearwire appears conservative with respect to equity dilution, and although we can’t rule-out a future equity offering (especially in light of the current credit crunch), it appears unlikely. It is possible that capital requirements may change in light of the company’s recent agreement with Sprint Nextel, with a bias towards a reduction in capital spending from currently expected levels. Additionally, Clearwire has also stated that if raising capital becomes a major issue for whatever reason, the company has the option to slow network and marketing investments, allaying potential financial concerns. With hard infrastructure assets, we believe that Clearwire should be attractive to lenders, although it is hard to predict the actual outcome based on the current tough credit environment. Estimates We project revenues to grow ~75% CAGR to $4.3 billion in 2013 driven by subscriber growth of ~68% CAGR to 9.1 million subscribers. Longer-term ARPU is estimated to decline in the last three years of our forecast period. Near-term, we expect Clearwire to continue to report significant EBITDA losses as the company expands its network and invests aggressively in marketing its products. We expect cash-EBITDA to turn positive in 2011 and increase to $1.7 billion in 2013, representing an EBITDA margin of 40%, towards the low-end of management guidance.
A M BI T IO U S, BUT A C HI EV ABL E, LO NG -
T E R M T A RGE TS
L T T A RG E TS A N D O U R E S TI MA T ES
E X CL U D E P O TE N TI AL U P S I DE F R O M
D I S T RI B U TI O N- R EL A TE D R EV E N UE S
~ $ 1 . 4 B I LL I O N I N A DDIT I O NA L F UNDI NG
R E Q UI RE D; SU BJ E C T TO CH A N GE
O U R P ROJ E CTI O N S A R E B ELOW
M A N A G E M E N T P L A N

Additional required disclosures under NASD Rule 2711 are provided on the last page of this document.
McAdams Wright Ragen > 925 Fourth Avenue, Suite 3900 Seattle, WA 98104 888.567.6297 > www.mwrinc.com Page 12 of 18
Note that both our 2013 revenue and subscriber estimates are notably below management guidance as we account for potential uncertainties in light of the multi-year forecast horizon. Management Craig O. McCaw, Founder and Chairman of the Board Mr. McCaw founded the company in October 2003. Previously, Mr. McCaw served as Clearwire’s CEO from October 2003 until May 2006 and as Co-CEO from May 2006 to January 2007. Since May 2000, Mr. McCaw has served as a Director and Chairman of ICO Global Communications (Holdings) Limited, or ICO, and has served as a director of ICO North America, Inc. since December 2004. Mr. McCaw is also Chairman, CEO and a member of Eagle River Investments, LLC, Eagle River Holdings (ERH), and Eagle River Inc. and its affiliates, which are private investment companies that focus on strategic investments in the communications industry. Mr. McCaw currently serves as a Director of RadioFrame Networks, Inc. and Tello Corp. He is a former director of Nextel Communications, Inc. and XO Communications, Inc., or XO, formerly known as NEXTLINK Communications, Inc. Benjamin G. Wolff, Chief Executive Officer and Director Mr. Wolff has served as CEO and Director since January 2007. Mr. Wolff previously served as Co-President and Chief Strategy Officer from October 2005 to January 2007, and Clearwire’s Co-CEO from May 2006 to January 2007. Prior to that, Mr. Wolff served as EVP from April 2004 to October 2005. Mr. Wolff is also a principal of Eagle River Holdings (ERH), the President of ERH and Eagle River Investments, and a director of ICO and ICO North America. From August 1994 until April 2004, Mr. Wolff was a lawyer with Davis Wright Tremaine LLP, where he became a partner in January 1998 and was focused on mergers and acquisitions, corporate finance and strategic alliance transactions. While with Davis Wright Tremaine LLP, he co-chaired the firm’s Business Transactions Department, served on the firm’s Executive Committee, and had primary responsibility for representing clients such as 360 Networks, Allied Signal, Eagle River, ICO, Intel, NEXTLINK and Starbucks Coffee Company in various corporate and transactional matters. Perry S. Satterlee, President and COO Mr. Satterlee has served as President since January 2007, COO since July 2004 and as the President and CEO of Clearwire US LLC, since May 2006. Mr. Satterlee served as the company’s Co-President from October 2005 to January 2007. Prior to that, Mr. Satterlee was COO from July 2002 to July 2004, and VP-Sales and Marketing, from August 1998 to July 2004, of Nextel Partners Inc. Prior to joining Nextel Partners, Mr. Satterlee was the President-Pacific Northwest Area of Nextel. Before that, Mr. Satterlee served from 1992 to 1996 as VP and GM of Central California District of AT&T Wireless Services, formerly McCaw Cellular. From 1990 to 1992, he was General Manager of McCaw Cellular’s Ventura/Santa Barbara market. From 1988 to 1990, Mr. Satterlee was Director of Planning for McCaw Cellular, where he led the company’s planning and budgeting processes. John A. Butler, CFO Mr. Butler has served as the company’s CFO since March 2005. Prior to that, Mr. Butler served as EVP and CFO of Valor Communications Group, Inc. from 2000 to 2005. From 1998 to 2000, Mr. Butler served as EVP and CFO of Commonwealth Telephone Enterprises, Inc. Prior to 1998, he was a director at First Union Capital Markets (Wachovia) in the Media and Communications Group. Mr. Butler has been employed by a number of financial institutions, and began his career at Arthur Andersen & Co.
S EA SO N E D MA N AG E ME N T T E A M

Additional required disclosures under NASD Rule 2711 are provided on the last page of this document.
McAdams Wright Ragen > 925 Fourth Avenue, Suite 3900 Seattle, WA 98104 888.567.6297 > www.mwrinc.com Page 13 of 18
Risks Concentrated Voting Structure: 79% of the voting power of the company’s outstanding capital stock is controlled by Mr. Craig McCaw and Intel Capital Corp., a wholly-owned subsidiary of Intel Corp. Based on the combined voting power, Mr. McCaw and Intel Capital can designate five to six members (depending on certain criteria) to the Clearwire Board. Additionally, Clearwire is deemed to be a “controlled entity” under the NASDAQ Marketplace rules, and hence is exempt from certain corporate governance requirements, including requirements for independent directors. As such, shareholders may have little influence in issues relating to strategy and executive compensation. Potential Increase in Churn Rates: With service offerings having begun in 2004, a majority of Clearwire’s markets have been in operation for under two years – the typical customer contract life. As such, customers bound under the two-year contracts may be unable to cancel (or to avoid paying cancellation charges) their service while under contract, as a result of which current customer churn rates may not necessarily be indicative of longer-term churn rates. Only 5/43 markets are two-years or older as of 2Q07. Sixteen existing markets will be over two-years old by the end of 3Q07. Existing churn of <2% is primarily a result of bad debts and subscriber relocation to geographies not covered by Clearwire. Current churn rates appear to be within the ballpark experienced by other carriers. Unsuccessful Evolution of Mobile WiMax: Mobile WiMax (based on IEEE 802.16e) is still an unproven and evolving technology, but is at the heart of Clearwire’s future offerings. As such, the unsuccessful, or delayed, development of this technology and its vendor ecosystem may significantly impact Clearwire’s future network evolution and service offering plans. Clearwire has already announced the successful conclusion of initial trials and believes that it will be able to deploy mobile WiMax networks beginning late 2007. Competition / Pricing Pressure: With a set of generally similar service offerings, Clearwire is subject to intense competition from significantly larger and well-established competitors like AT&T, Verizon, Comcast, etc. However, we believe that Clearwire’s ability to wirelessly deliver broadband services differentiates it from the majority of its competitors. Most other wireless broadband offerings are via a cellular network that typically has lower data speeds. Additionally, Clearwire appears to be the only service provider offering wireless broadband services to residential customers. Most cellular-data plans are targeted at businesses. The proposed auction of 700 MHz band spectrum by the U.S. Federal Communications Commission (FCC) may result in additional competition. Generally speaking, competition, we believe, adds risk to achievement of financial targets in the event of intense price-based competition amongst the group of competitors. Further, cellular networks are fast progressing to higher bandwidth speeds potentially posing a significant competitive technological alternative for subscribers. Note that a majority of Clearwire’s large competitors already have established cellular data networks and offerings. Significant Capital Expenditure Requirements: Clearwire proposes to spend well over $2 billion over the next few years as a part of its network expansion plans. As such, during a majority of this time, we expect Clearwire to be significantly cash flow negative, despite a ramping subscriber base. We are projecting Clearwire to be EBITDA positive in 2011. Negative Cash Flows, Time to Profitability, Large Capital Expenditures Raise Stock Volatility: Given the lengthy expected time to profitability (2012-2013),

Additional required disclosures under NASD Rule 2711 are provided on the last page of this document.
McAdams Wright Ragen > 925 Fourth Avenue, Suite 3900 Seattle, WA 98104 888.567.6297 > www.mwrinc.com Page 14 of 18
significant capital expenditures, expected negative cash flows from operations, and potential variations in achievement of financial and non-financial benchmarks, we believe that Clearwire stock will be subject to inherent volatility, in addition to external market related factors. Finalization of / Execution of Agreements by Partners: Clearwire has recently entered into several partnerships (as discussed) that are in the process of being finalized. As such, our assumption of Clearwire being able to offer partner offerings (video, cellular service), although currently contemplated in the initial agreements, may not necessarily come to fruition. Additionally, execution issues, either infrastructure-related (delays in network build, poor coverage, etc.) or service quality related (in the case of video and cellular offerings) on the part of partners, may negatively impact Clearwire’s business. Other risks to our opinion, estimates and price target include: an economic slowdown, lower than expected adoption of services, execution risks, integration of future acquisitions, departure of key executives, and other regulatory and financial risks associated with running a business.
Additional required disclosures under NASD Rule 2711 are provided on the last page of this document.
McAdams Wright Ragen > 925 Fourth Avenue, Suite 3900 Seattle, WA 98104 888.567.6297 > www.mwrinc.com Page 15 of 18
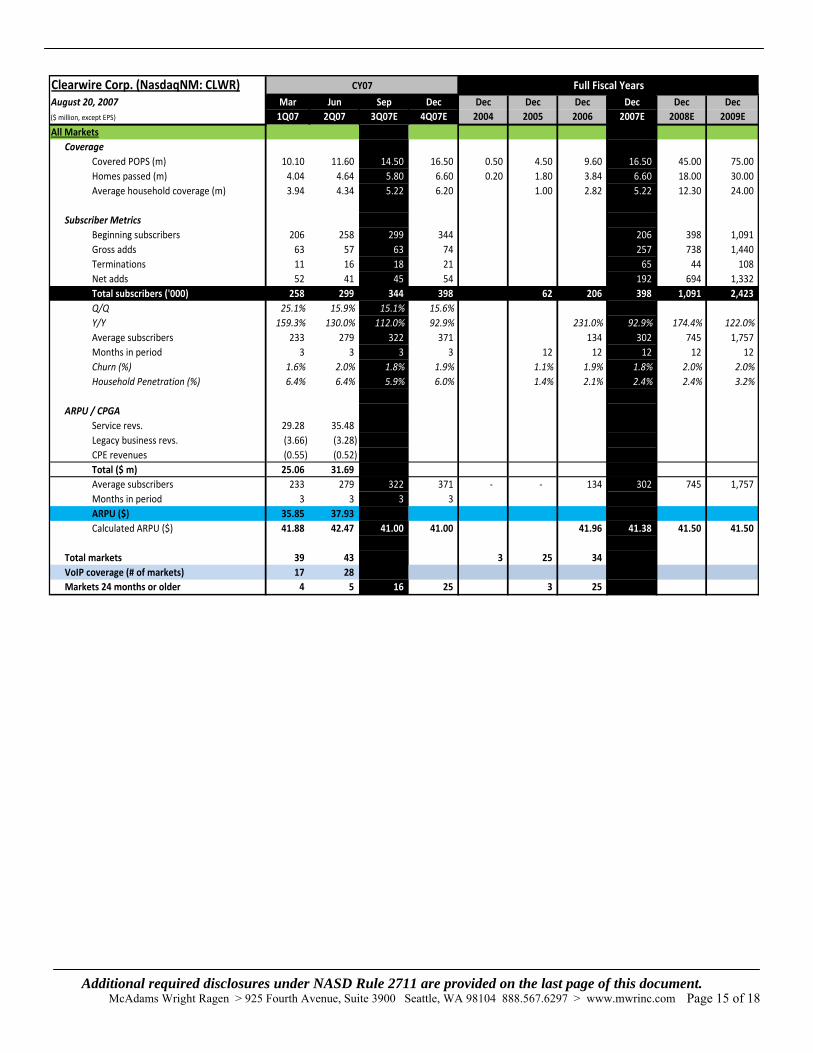
Clearwire Corp. (NasdaqNM: CLWR)August 20, 2007 Mar Jun Sep Dec Dec Dec Dec Dec Dec Dec($ million, except EPS) 1Q07 2Q07 3Q07E 4Q07E 2004 2005 2006 2007E 2008E 2009EAll Markets
CoverageCovered POPS (m) 10.10 11.60 14.50 16.50 0.50 4.50 9.60 16.50 45.00 75.00 Homes passed (m) 4.04 4.64 5.80 6.60 0.20 1.80 3.84 6.60 18.00 30.00 Average household coverage (m) 3.94 4.34 5.22 6.20 1.00 2.82 5.22 12.30 24.00
Subscriber MetricsBeginning subscribers 206 258 299 344 206 398 1,091 Gross adds 63 57 63 74 257 738 1,440 Terminations 11 16 18 21 65 44 108 Net adds 52 41 45 54 192 694 1,332 Total subscribers ('000) 258 299 344 398 62 206 398 1,091 2,423 Q/Q 25.1% 15.9% 15.1% 15.6%Y/Y 159.3% 130.0% 112.0% 92.9% 231.0% 92.9% 174.4% 122.0%Average subscribers 233 279 322 371 134 302 745 1,757 Months in period 3 3 3 3 12 12 12 12 12 Churn (%) 1.6% 2.0% 1.8% 1.9% 1.1% 1.9% 1.8% 2.0% 2.0%Household Penetration (%) 6.4% 6.4% 5.9% 6.0% 1.4% 2.1% 2.4% 2.4% 3.2%
ARPU / CPGAService revs. 29.28 35.48 Legacy business revs. (3.66) (3.28) CPE revenues (0.55) (0.52) Total ($ m) 25.06 31.69 Average subscribers 233 279 322 371 ‐ ‐ 134 302 745 1,757 Months in period 3 3 3 3 ARPU ($) 35.85 37.93 Calculated ARPU ($) 41.88 42.47 41.00 41.00 41.96 41.38 41.50 41.50
Total markets 39 43 3 25 34 VoIP coverage (# of markets) 17 28 Markets 24 months or older 4 5 16 25 3 25
CY07 Full Fiscal Years
Additional required disclosures under NASD Rule 2711 are provided on the last page of this document.
McAdams Wright Ragen > 925 Fourth Avenue, Suite 3900 Seattle, WA 98104 888.567.6297 > www.mwrinc.com Page 16 of 18
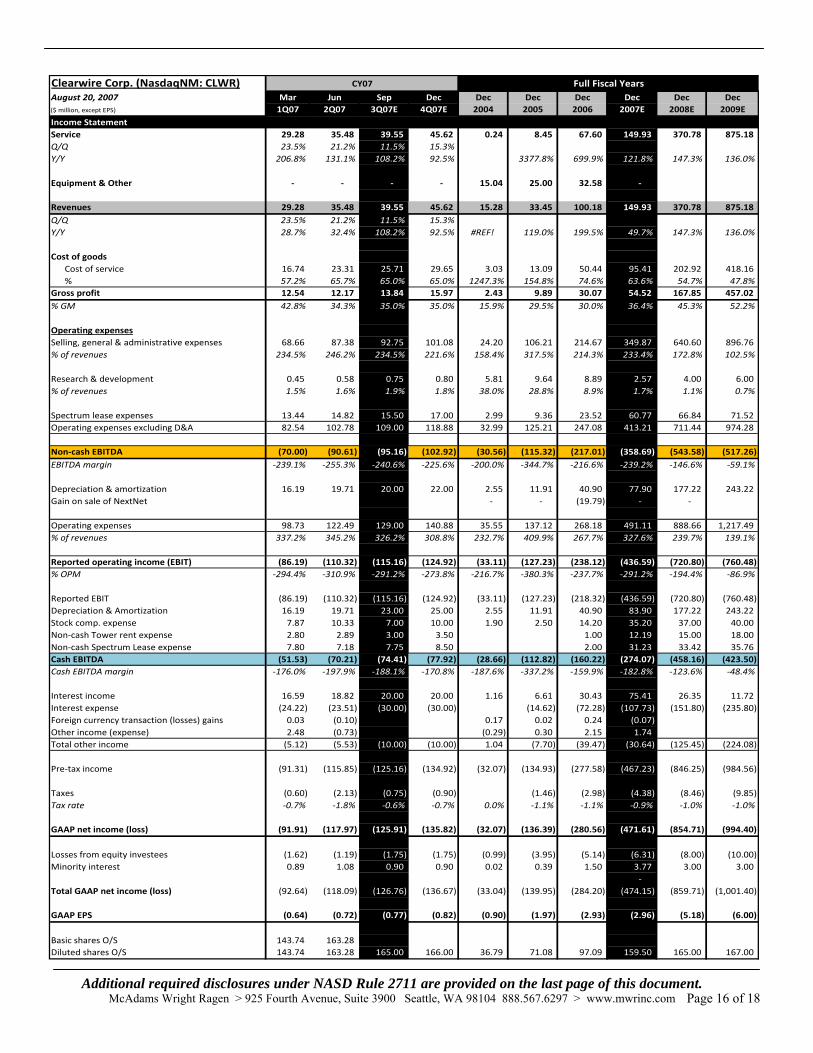
Clearwire Corp. (NasdaqNM: CLWR)August 20, 2007 Mar Jun Sep Dec Dec Dec Dec Dec Dec Dec($ million, except EPS) 1Q07 2Q07 3Q07E 4Q07E 2004 2005 2006 2007E 2008E 2009EIncome StatementService 29.28 35.48 39.55 45.62 0.24 8.45 67.60 149.93 370.78 875.18 Q/Q 23.5% 21.2% 11.5% 15.3%Y/Y 206.8% 131.1% 108.2% 92.5% 3377.8% 699.9% 121.8% 147.3% 136.0%
Equipment & Other ‐ ‐ ‐ ‐ 15.04 25.00 32.58 ‐
Revenues 29.28 35.48 39.55 45.62 15.28 33.45 100.18 149.93 370.78 875.18 Q/Q 23.5% 21.2% 11.5% 15.3%Y/Y 28.7% 32.4% 108.2% 92.5% #REF! 119.0% 199.5% 49.7% 147.3% 136.0%
Cost of goodsCost of service 16.74 23.31 25.71 29.65 3.03 13.09 50.44 95.41 202.92 418.16% 57.2% 65.7% 65.0% 65.0% 1247.3% 154.8% 74.6% 63.6% 54.7% 47.8%
Gross profit 12.54 12.17 13.84 15.97 2.43 9.89 30.07 54.52 167.85 457.02 % GM 42.8% 34.3% 35.0% 35.0% 15.9% 29.5% 30.0% 36.4% 45.3% 52.2%
Operating expensesSelling, general & administrative expenses 68.66 87.38 92.75 101.08 24.20 106.21 214.67 349.87 640.60 896.76 % of revenues 234.5% 246.2% 234.5% 221.6% 158.4% 317.5% 214.3% 233.4% 172.8% 102.5%
Research & development 0.45 0.58 0.75 0.80 5.81 9.64 8.89 2.57 4.00 6.00 % of revenues 1.5% 1.6% 1.9% 1.8% 38.0% 28.8% 8.9% 1.7% 1.1% 0.7%
Spectrum lease expenses 13.44 14.82 15.50 17.00 2.99 9.36 23.52 60.77 66.84 71.52 Operating expenses excluding D&A 82.54 102.78 109.00 118.88 32.99 125.21 247.08 413.21 711.44 974.28
Non‐cash EBITDA (70.00) (90.61) (95.16) (102.92) (30.56) (115.32) (217.01) (358.69) (543.58) (517.26) EBITDA margin ‐239.1% ‐255.3% ‐240.6% ‐225.6% ‐200.0% ‐344.7% ‐216.6% ‐239.2% ‐146.6% ‐59.1%
Depreciation & amortization 16.19 19.71 20.00 22.00 2.55 11.91 40.90 77.90 177.22 243.22 Gain on sale of NextNet ‐ ‐ (19.79) ‐ ‐
Operating expenses 98.73 122.49 129.00 140.88 35.55 137.12 268.18 491.11 888.66 1,217.49 % of revenues 337.2% 345.2% 326.2% 308.8% 232.7% 409.9% 267.7% 327.6% 239.7% 139.1%
Reported operating income (EBIT) (86.19) (110.32) (115.16) (124.92) (33.11) (127.23) (238.12) (436.59) (720.80) (760.48) % OPM ‐294.4% ‐310.9% ‐291.2% ‐273.8% ‐216.7% ‐380.3% ‐237.7% ‐291.2% ‐194.4% ‐86.9%
Reported EBIT (86.19) (110.32) (115.16) (124.92) (33.11) (127.23) (218.32) (436.59) (720.80) (760.48) Depreciation & Amortization 16.19 19.71 23.00 25.00 2.55 11.91 40.90 83.90 177.22 243.22 Stock comp. expense 7.87 10.33 7.00 10.00 1.90 2.50 14.20 35.20 37.00 40.00 Non‐cash Tower rent expense 2.80 2.89 3.00 3.50 1.00 12.19 15.00 18.00 Non‐cash Spectrum Lease expense 7.80 7.18 7.75 8.50 2.00 31.23 33.42 35.76 Cash EBITDA (51.53) (70.21) (74.41) (77.92) (28.66) (112.82) (160.22) (274.07) (458.16) (423.50) Cash EBITDA margin ‐176.0% ‐197.9% ‐188.1% ‐170.8% ‐187.6% ‐337.2% ‐159.9% ‐182.8% ‐123.6% ‐48.4%
Interest income 16.59 18.82 20.00 20.00 1.16 6.61 30.43 75.41 26.35 11.72 Interest expense (24.22) (23.51) (30.00) (30.00) (14.62) (72.28) (107.73) (151.80) (235.80) Foreign currency transaction (losses) gains 0.03 (0.10) 0.17 0.02 0.24 (0.07) Other income (expense) 2.48 (0.73) (0.29) 0.30 2.15 1.74 Total other income (5.12) (5.53) (10.00) (10.00) 1.04 (7.70) (39.47) (30.64) (125.45) (224.08)
Pre‐tax income (91.31) (115.85) (125.16) (134.92) (32.07) (134.93) (277.58) (467.23) (846.25) (984.56)
Taxes (0.60) (2.13) (0.75) (0.90) (1.46) (2.98) (4.38) (8.46) (9.85) Tax rate ‐0.7% ‐1.8% ‐0.6% ‐0.7% 0.0% ‐1.1% ‐1.1% ‐0.9% ‐1.0% ‐1.0%
GAAP net income (loss) (91.91) (117.97) (125.91) (135.82) (32.07) (136.39) (280.56) (471.61) (854.71) (994.40)
Losses from equity investees (1.62) (1.19) (1.75) (1.75) (0.99) (3.95) (5.14) (6.31) (8.00) (10.00) Minority interest 0.89 1.08 0.90 0.90 0.02 0.39 1.50 3.77 3.00 3.00
‐ Total GAAP net income (loss) (92.64) (118.09) (126.76) (136.67) (33.04) (139.95) (284.20) (474.15) (859.71) (1,001.40)
GAAP EPS (0.64) (0.72) (0.77) (0.82) (0.90) (1.97) (2.93) (2.96) (5.18) (6.00)
Basic shares O/S 143.74 163.28Diluted shares O/S 143.74 163.28 165.00 166.00 36.79 71.08 97.09 159.50 165.00 167.00
CY07 Full Fiscal Years

Additional required disclosures under NASD Rule 2711 are provided on the last page of this document.
McAdams Wright Ragen > 925 Fourth Avenue, Suite 3900 Seattle, WA 98104 888.567.6297 > www.mwrinc.com Page 17 of 18
Clearwire Corp. (NasdaqNM: CLWR)Balance Sheet, August 20, 2007($ in million) 3Q06 2006 1Q07 2Q07AssetsCurrent assets: Cash and cash equivalents 29.19 438.03 892.44 380.04 Short‐term investments 96.46 663.64 613.12 676.27 Restricted cash 0.67 10.73 11.61 11.66 Restricted investments 28.32 69.40 51.38 51.94 Accounts receivables 9.15 2.77 3.01 3.50 Notes receivables 4.41 4.12 4.21 Inventory 10.25 1.40 1.35 1.67 Prepaid and other assets 9.74 19.22 24.06 30.63
Total current assets 183.78 1,209.60 1,601.08 1,159.90
Property, plant and equipment, net 145.58 302.80 361.16 427.62 Restricted cash ‐ long‐term 8.34 0.12 0.16 0.16 Restricted investments ‐ long‐term 27.03 16.27 Prepaid spectrum license fees 101.73 241.15 298.36 423.76 Spectrum licenses and other intangible assets 115.26 222.98 239.04 432.21 Goodwill 16.62 30.91 31.24 31.58 Investments in equity investees 18.92 14.98 13.31 16.27 Other assets 10.66 29.57 27.99 27.22
Total assets 627.92 2,068.37 2,572.32 2,518.73
Liabilities & Shareholder's equityCurrent liabilities: Accounts payable 75.18 108.22 89.03 126.64 Deferred rent 0.34 6.99 8.48 10.32 Deferred revenue 3.00 5.60 6.88 8.02 Due to affiliate 0.35 0.53 0.14 0.13 Current portion of long‐term debt 1.25 1.25 1.25
Total current liabilities 78.87 122.58 105.78 146.35
Long‐term debt 209.96 644.44 649.26 654.65 Other long‐term liabilities 19.12 42.39 48.26 56.61 Total liabilities 307.94 809.41 803.29 857.61
Minority interest 1.28 1.36 15.10 14.11 Commitments and contingencies
Shareholders’ equity: Common stock
Class A 436.46 1,474.76 2,063.25 2,072.16 Class B 56.07 234.38 234.38 234.38
Common stock and warrants payable 1.67 0.17 0.04 0.01 Deferred compensation (0.66) (0.12) (0.80) (0.70) Accumulated other comprehensive income (0.48) 6.99 8.27 10.44 Accumulated deficit (174.36) (458.57) (551.20) (669.29)
Total shareholders’ equity 319.97 1,258.97 1,769.03 1,661.12 Total liabilities and shareholders’ equity 627.92 2,068.37 2,572.33 2,518.73
McAdams Wright Ragen > 925 Fourth Avenue, Suite 3900 Seattle, WA 98104 888.567.6297 > www.mwrinc.com Page 18 of 18
Required Disclosures: Sid Parakh, [email protected], (206) 664-8885
• I, Sid Parakh, hereby certify (1) that the views in this research note accurately reflect my personal views about any or all of the subject securities or issuers referred to in this note and (2) no part of my compensation was, is, or will be directly or indirectly related to the specific recommendations or views in this note.
• MWR was a member of the underwriting syndicate for Clearwire's initial public offering on March 8, 2007. MWR received underwriting compensation from the company for its participation in the offering.
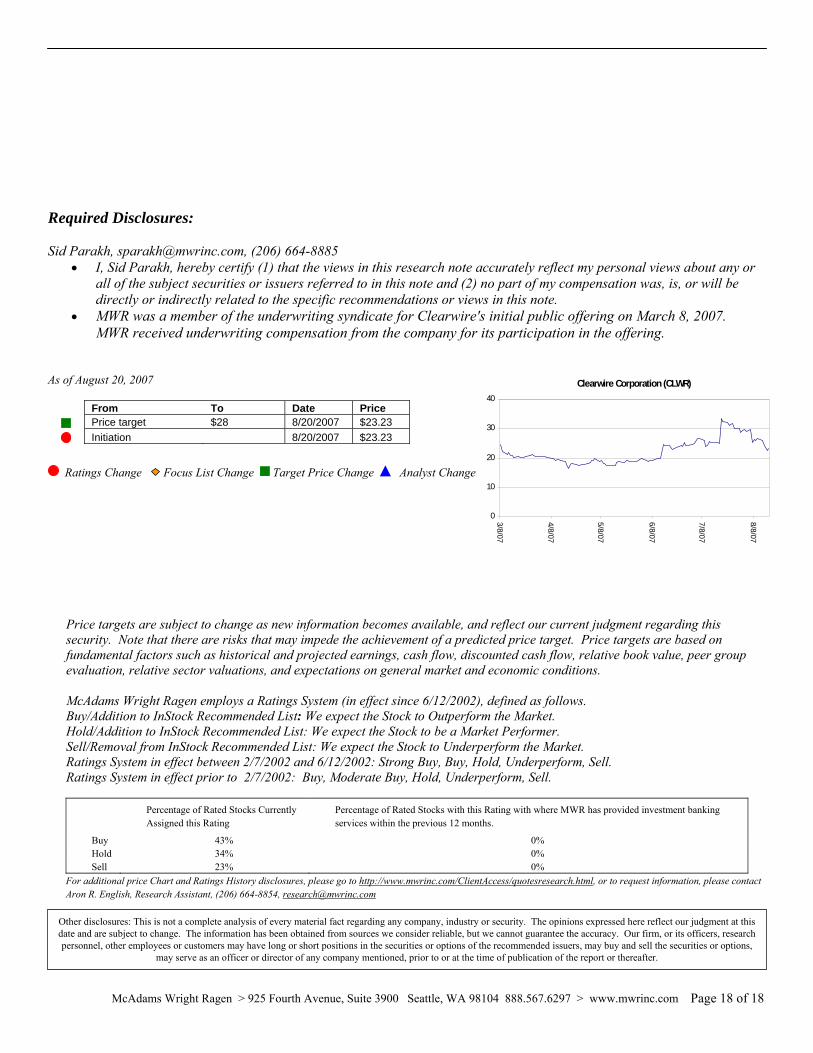
As of August 20, 2007
From To Date Price Price target $28 8/20/2007 $23.23 Initiation 8/20/2007 $23.23
Ratings Change Focus List Change Target Price Change ▲ Analyst Change
Price targets are subject to change as new information becomes available, and reflect our current judgment regarding this security. Note that there are risks that may impede the achievement of a predicted price target. Price targets are based on fundamental factors such as historical and projected earnings, cash flow, discounted cash flow, relative book value, peer group evaluation, relative sector valuations, and expectations on general market and economic conditions.
McAdams Wright Ragen employs a Ratings System (in effect since 6/12/2002), defined as follows. Buy/Addition to InStock Recommended List: We expect the Stock to Outperform the Market. Hold/Addition to InStock Recommended List: We expect the Stock to be a Market Performer. Sell/Removal from InStock Recommended List: We expect the Stock to Underperform the Market. Ratings System in effect between 2/7/2002 and 6/12/2002: Strong Buy, Buy, Hold, Underperform, Sell. Ratings System in effect prior to 2/7/2002: Buy, Moderate Buy, Hold, Underperform, Sell.
Percentage of Rated Stocks Currently Assigned this Rating
Percentage of Rated Stocks with this Rating with where MWR has provided investment banking services within the previous 12 months.
Buy 43% 0% Hold 34% 0% Sell 23% 0%
For additional price Chart and Ratings History disclosures, please go to http://www.mwrinc.com/ClientAccess/quotesresearch.html, or to request information, please contact Aron R. English, Research Assistant, (206) 664-8854, [email protected]
Other disclosures: This is not a complete analysis of every material fact regarding any company, industry or security. The opinions expressed here reflect our judgment at this date and are subject to change. The information has been obtained from sources we consider reliable, but we cannot guarantee the accuracy. Our firm, or its officers, research personnel, other employees or customers may have long or short positions in the securities or options of the recommended issuers, may buy and sell the securities or options,
may serve as an officer or director of any company mentioned, prior to or at the time of publication of the report or thereafter.
Clearwire Corporation (CLWR)
0
10
20
30
40
3/8/07
4/8/07
5/8/07
6/8/07
7/8/07
8/8/07