8.1 scientific and technical coordination guidelines€¦ · 8.1 scientific and technical...
TRANSCRIPT
Deliverable 3.1 - State-of-the-art assessment and specification of data requirements for electrical system architectures
8.1 Scientific and Technical coordination Guidelines
Fundacion Tecnalia Research & Innovation
The University of Edinburgh
University College Cork, National University of Ireland, Cork
Fraunhofer-Gesellschaft zur Foerderung der Angewandten Forschung E.V.
DTOcean - "Optimal Design Tools for
Ocean Energy Arrays" is funded by the
European Commission’s 7th Framework
Programme.
Grant agreement number: 608597
Deliverable 3.1: State-of-the-art
assessment and specification of data
requirements for electrical system
architectures

Deliverable 3.1 - State-of-the-art assessment and specification of data requirements for electrical system architectures
2
Doc: DTO_WP3_ECD_D3.1 Rev: 1.0 Date: 27.01.2014
D3.1: State-of-the-art assessment and specification of data requirements
for electrical system architectures
Project: DTOcean - Optimal Design Tools for Ocean Energy Arrays
Code: DTO_WP3_ECD_D3.1
Name Date
Prepared Work Package 3 13/01/2014
Checked HMRC_UCC 25/01/2014
Approved Project Coordinator 27/01/2014
The research leading to these results has received funding from the European Community’s Seventh Framework Programme under grant agreement No. 608597 (DTOcean). No part of this publication may be reproduced, stored in a retrieval system, or transmitted in any form – electronic, mechanical, photocopy or otherwise without the express permission of the copyright holders. This report is distributed subject to the condition that it shall not, by way of trade or otherwise, be lent, re-sold, hired-out or otherwise circulated without the publishers prior consent in any form of binding or cover other than that in which it is published and without a similar condition including this condition being imposed on the subsequent purchaser.

Deliverable 3.1 - State-of-the-art assessment and specification of data requirements for electrical system architectures
3
Doc: DTO_WP3_ECD_D3.1 Rev: 1.0 Date: 27.01.2014
DOCUMENT CHANGES RECORD
Edit./Rev. Date Chapters Reason for change
A/0 07/01/2014 All New Document
1 26/01/2014 All Review

Deliverable 3.1 - State-of-the-art assessment and specification of data requirements for electrical system architectures
4
Doc: DTO_WP3_ECD_D3.1 Rev: 1.0 Date: 27.01.2014
Abstract
This deliverable will consist of two major parts:
• A comprehensive review (Chapters 1-4) of all the electrical infrastructure
technologies between the converter and the point of connection to the onshore
electrical grid, including technologies currently used in offshore electrical networks,
as well as those foreseen to be deployed in the near future.
• A set of operating regimes of the ocean energy conversion arrays in terms of their
output power (given as a statistical representation and as a set of representative
time series), for the scenarios to be considered in the next tasks, as defined by WP1
and WP2 (Chapter 5).
Deliverable 3.1 - State-of-the-art assessment and specification of data requirements for electrical system architectures
5
Doc: DTO_WP3_ECD_D3.1 Rev: 1.0 Date: 27.01.2014
Table of Contents
Introduction ..................................................................................................................... 11 1
Offshore Electrical Network Technologies ...................................................................... 14 2
2.1 General Description................................................................................................... 14
2.2 Cables ........................................................................................................................ 15
2.2.1 Transmission Cables ........................................................................................... 15
a. Submarine cables ............................................................................................... 15
b. Load Capacity ..................................................................................................... 18
c. Cable Type .......................................................................................................... 19
d. Conductor .......................................................................................................... 20
e. Insulation ........................................................................................................... 20
f. Cable Screen .......................................................................................................... 22
g. Wet / Dry Design ................................................................................................ 23
h. Subsea Cable Protection .................................................................................... 23
2.2.2 Umbilical Cables ................................................................................................. 26
a. Oil and gas industry umbilicals .......................................................................... 27
b. Devices piled onto the ground ........................................................................... 28
c. Floating Devices ................................................................................................. 28
d. Composition of Power Umbilical Cables ............................................................ 30
2.3 Connectors ................................................................................................................ 31
2.4 Ancillary components (bend stiffeners, bend restrictors, marking buoys) .............. 38
2.4.1 Bend stiffeners (Taken from [1]) ........................................................................ 38
2.4.2 Bend restrictors (Taken from [1]) ...................................................................... 39
2.4.3 Marking Buoys ................................................................................................... 40
2.5 Hubs ........................................................................................................................... 42
2.5.1 Subsea hub (no offshore substation/transformer)............................................ 42
2.5.2 Subsea Substations ............................................................................................ 45
2.5.3 Offshore Substation (transformer and switchgear above water) ..................... 49
2.6 Transformers & Switchgear ....................................................................................... 50
Deliverable 3.1 - State-of-the-art assessment and specification of data requirements for electrical system architectures
6
Doc: DTO_WP3_ECD_D3.1 Rev: 1.0 Date: 27.01.2014
2.6.1 Transformers ...................................................................................................... 50
2.6.2 Switchgear & Protection equipment ................................................................. 51
2.6.3 Subsea Transformers and Switchgear ............................................................... 53
2.7 Energy Storage Systems ............................................................................................ 54
2.7.1 Mechanical Energy Storage ............................................................................... 56
a. Pumped Hydroelectric Storage (PHES) .............................................................. 56
b. Compressed Air Energy Storage (CAES) ............................................................. 56
c. Flywheel Energy Storage (FES) ........................................................................... 57
2.7.2 Electric Energy Storage ...................................................................................... 58
a. Supercapacitors ................................................................................................. 58
b. Superconductive magnetic Energy Storage (SMES)........................................... 58
2.7.3 (Electro-)Chemical Energy Storage .................................................................... 59
a. Battery Energy Storage ...................................................................................... 59
b. Hydrogen Energy Storage .................................................................................. 59
2.8 Power transmission options: HVAC and HVDC ......................................................... 60
Offshore Electrical Network Architecture ....................................................................... 64 3
3.1 Voltage level of connection to the inter-array network ........................................... 64
3.2 Electrical layouts ....................................................................................................... 64
3.2.1 Cluster layouts ................................................................................................... 65
3.2.2 Transmission to Coast ........................................................................................ 68
Onshore Electrical Network Architecture ........................................................................ 70 4
4.1 Onshore Substation ................................................................................................... 70
4.2 Onshore Network ...................................................................................................... 70
Power generation as input to the design of the offshore electrical network ................. 72 5
5.1 Power generation from tidal energy converter farms .............................................. 73
5.1.1 Resource characteristics .................................................................................... 73
5.1.2 Power characteristics of a single device ............................................................ 74
5.1.3 Power characteristics of arrays and farms of TECs ............................................ 77
5.1.4 Limitations and assumptions ............................................................................. 77
Deliverable 3.1 - State-of-the-art assessment and specification of data requirements for electrical system architectures
7
Doc: DTO_WP3_ECD_D3.1 Rev: 1.0 Date: 27.01.2014
5.1.5 Similar techno-economic studies ....................................................................... 77
5.2 Power generation from wave energy converter (WEC) farms.................................. 78
5.2.1 Resource characteristics .................................................................................... 78
5.2.2 Power characteristics of a single device ............................................................ 79
5.2.3 Power characteristics of arrays and farms of WECs .......................................... 80
5.2.4 Limitations and assumptions ............................................................................. 81
5.2.5 Similar techno-economic studies ....................................................................... 81
Conclusions ...................................................................................................................... 83 6
References ....................................................................................................................... 84 7
Deliverable 3.1 - State-of-the-art assessment and specification of data requirements for electrical system architectures
8
Doc: DTO_WP3_ECD_D3.1 Rev: 1.0 Date: 27.01.2014
Index of Figures
Figure 1: Operational structure and interrelation of the Work Packages in DTOcean ........... 11
Figure 2 Example of electrical connection of wave energy converter [1] ............................... 15
Figure 3: Cable redundancy in an offshore farm [4]. ............................................................... 16
Figure 4: Three-core XLPE cable [10] ....................................................................................... 20
Figure 5: Submarine Oil-filled Cable (Courtesy of EXSYM) ...................................................... 21
Figure 6: Submarine XLPE Cable (Courtesy of EXSYM) ............................................................ 22
Figure 7: Concrete bags protection (left) and Mattress protection (right). (Pictures courtesy
of Malcolm Sharples) ............................................................................................................... 24
Figure 8: Marine Charts: Symbols Relating To Submarine Cables (pictures courtesy of New
Zealand Boating Website [12]) ................................................................................................ 24
Figure 9: Well-protected submarine cable (Picture courtesy of Nexans Cables [13]) ............ 25
Figure 10. Submarine cable installation [15]. .......................................................................... 26
Figure 11:Scheme of connection [1] ........................................................................................ 27
Figure 12: Umbilical arrangements for floating structures [22]. ............................................. 30
Figure 13: Typical umbilical power cable cross section ........................................................... 31
Figure 14: Hydro Group Connector (courtesy of Hydro group plc. [24]) ................................. 32
Figure 15: : Hydro Group 11 kV Dry-Mate Connector [24] ...................................................... 33
Figure 16: MacArtney 11 kV Wet-Mate Connector (courtesy of MacArtney Technology [25])
.................................................................................................................................................. 34
Figure 17: J+S Repair Joint for 36 kV submarine cable (see [26]) . .......................................... 37
Figure 18:Bend stiffeners and bend restrictor example [1] ..................................................... 38
Figure 19: Bending Stiffener example [1]................................................................................. 38
Figure 20: Bending Restrictors [1] ............................................................................................ 39
Figure 21: BIMEP delimitation buoys (photography of Imanol Touzon, Tecnalia) .................. 42
Figure 22: Schematic of the Wave Hub test site [33]. ............................................................. 43
Figure 23: Wave Hub structure [33] ........................................................................................ 44
Figure 24: MacArtney Hub (courtesy of MacArtney [25]) ....................................................... 44
Figure 25: Wave Farm Layout with Underwater Substation ................................................... 45
Figure 26: Uppsala Marine Substation for Lysekil Wave Power Project (96 kVA, 1 kV) [34] .. 46
Figure 27: OPT Substation (1,5 MW, 11 kV) [35] ..................................................................... 46
Figure 28: Schneider Subsea Power Distribution [36] ............................................................. 47
Figure 29: VetcoGray (General Electric) Subsea Power Systems [37] .................................... 48
Figure 30 Siemens Subsea Power Grid [38] Offshore Substation (transformer and switchgear
above water) ............................................................................................................................ 48
Figure 31: Baltic 1 Offshore Wind Farm (Germany) ................................................................ 50
Figure 32: Turbine switchgear arrangement [4]. ..................................................................... 52
Deliverable 3.1 - State-of-the-art assessment and specification of data requirements for electrical system architectures
9
Doc: DTO_WP3_ECD_D3.1 Rev: 1.0 Date: 27.01.2014
Figure 33: Farm switchgear arrangement [15]. ....................................................................... 52
Figure 34: ABB Subsea Transformer for Ormen Lange gas field [40] ...................................... 53
Figure 35: ABB Subsea Circuit Breaker (24 kV / 500 A) [23] based on patent [42] ................ 54
Figure 36: Bennex Anguila Changeover Switch (7,2 kV / 275 A) [43] ...................................... 54
Figure 37: Working principle of a PHS (from [48]) ................................................................... 56
Figure 38: Working principle of a CAES (from [50]) ................................................................. 57
Figure 39: Pentadyne GTX Flywheel, from [54]. ...................................................................... 58
Figure 40: HVDC vs. HVAC costs and efficiency [15]. ............................................................... 61
Figure 41: Transmission capacity of different HVAC cables and voltage levels [61]. .............. 61
Figure 42: AC collection system example [15]. ........................................................................ 63
Figure 43: String Series Cluster. Medium and Large Farms (AC and DC) [1] ........................... 65
Figure 44: Star (Radial) Cluster [1] ........................................................................................... 66
Figure 45: Full String Cluster [1] ............................................................................................... 66
Figure 46: Redundant String Cluster (AC & DC) [1] .................................................................. 66
Figure 47: Series DC Cluster. [1] ............................................................................................... 67
Figure 48: Radial cluster type with no redundancy [4] ............................................................ 67
Figure 49: Radial cluster type with redundancy [4]. ................................................................ 67
Figure 50: Marine energy farm integration topologies [6]. ..................................................... 69
Figure 51: Generic tidal current speed distribution [64]. ........................................................ 74
Figure 52: Power curves for different tidal current speeds [68]. ............................................ 75
Figure 53: Typical figure of TEC output versus tidal current speed [64]. ................................ 76
Figure 54: Power curve of the SeaGen TEC tested at the Strangford Narrows [71]. .............. 76
Figure 55: Scatter diagram of Hs and Tz at a site off the UK [65]. ............................................ 79
Figure 56: The power matrix of the 750 kW Pelamis device [104].......................................... 80

Deliverable 3.1 - State-of-the-art assessment and specification of data requirements for electrical system architectures
10
Doc: DTO_WP3_ECD_D3.1 Rev: 1.0 Date: 27.01.2014
Index of Tables
Table 1: Example of ABB Submarine Cable Ratings [9] 19
Table 2: Voltage level options in farms of marine energy converters [6]. 29
Table 3: Non-exhaustive list of the manufacturers of wet and/or dry connectors 35
Table 4: Synoptic Comparative Table Among different Power Transmission technologies (AC
vs. DC LCC vs. DC VSC) 63
Table 5: Choice of a Single Circuit (SC) or Double Circuit (DC) for a 132 kV overhead line [3].
70
Table 6: Choice of a Single Circuit (SC) or Double Circuit (DC) for a 220 kV overhead line [3].
71
Deliverable 3.1 - State-of-the-art assessment and specification of data requirements for electrical system architectures
11
Doc: DTO_WP3_ECD_D3.1 Rev: 1.0 Date: 27.01.2014
Introduction 1
This deliverable (D3.1) represents the first outcome within Work Package 3 (WP3) in
DTOcean (Optimal Design Tools for Ocean Energy Arrays).
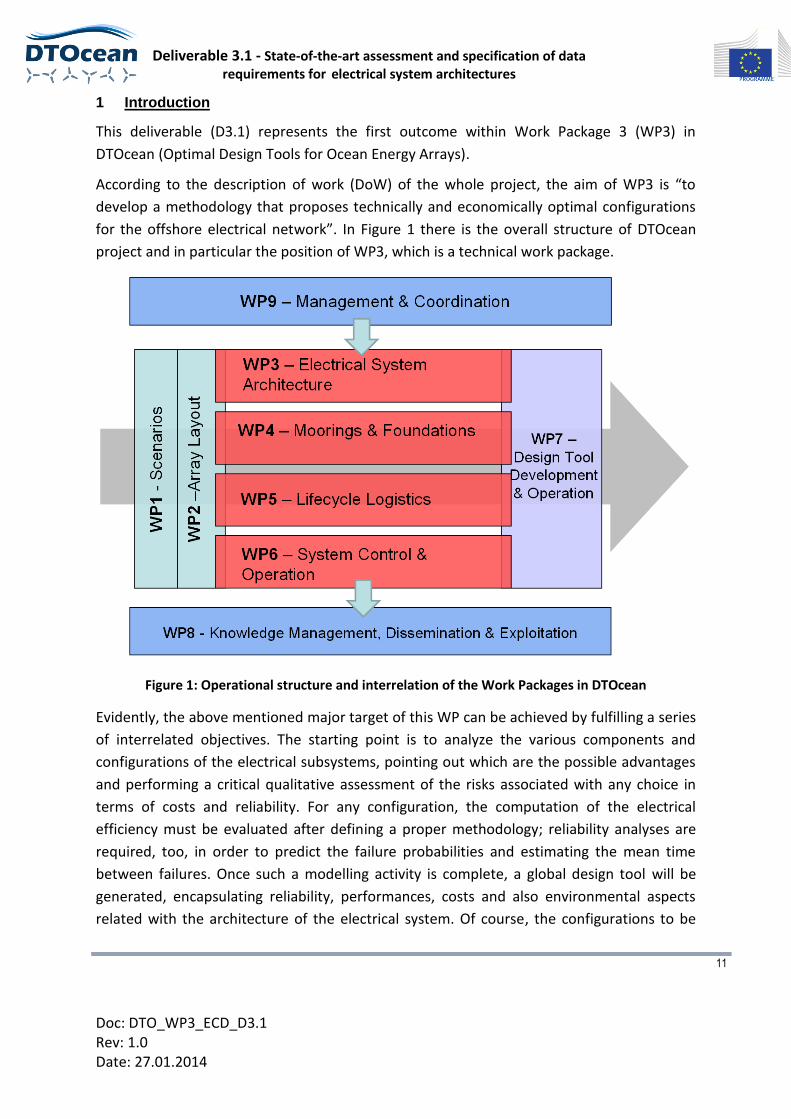
According to the description of work (DoW) of the whole project, the aim of WP3 is “to
develop a methodology that proposes technically and economically optimal configurations
for the offshore electrical network”. In Figure 1 there is the overall structure of DTOcean
project and in particular the position of WP3, which is a technical work package.
Figure 1: Operational structure and interrelation of the Work Packages in DTOcean
Evidently, the above mentioned major target of this WP can be achieved by fulfilling a series
of interrelated objectives. The starting point is to analyze the various components and
configurations of the electrical subsystems, pointing out which are the possible advantages
and performing a critical qualitative assessment of the risks associated with any choice in
terms of costs and reliability. For any configuration, the computation of the electrical
efficiency must be evaluated after defining a proper methodology; reliability analyses are
required, too, in order to predict the failure probabilities and estimating the mean time
between failures. Once such a modelling activity is complete, a global design tool will be
generated, encapsulating reliability, performances, costs and also environmental aspects
related with the architecture of the electrical system. Of course, the configurations to be

Deliverable 3.1 - State-of-the-art assessment and specification of data requirements for electrical system architectures
12
Doc: DTO_WP3_ECD_D3.1 Rev: 1.0 Date: 27.01.2014
examined within this WP are the most relevant in terms of possible exploitation in the next
10 years for Ocean Energy Converter Arrays and they include all the components and
subsystems of the electrical architecture: the umbilical, the subsea cables, the offshore
substation including transformers, switchgear and power conditioning, and finally the link to
the onshore grid.
D3.1. is a public report and essentially it collects the outcomes of the first two tasks
developed in WP3 (Task 3.1 and Task 3.2). In D3.1., first, a state of art of all the electrical
subsystems used for Ocean Energy Converters will be illustrated, starting from the
technologies currently used in offshore electrical networks, as well as those proposed by the
research community, aiming to a comprehensive assessment of the available and proposed
offshore network technologies. Subsequently, the experience from previous projects (EPSRC
Supergen Marine 1-2, FP7 MARINA etc.) will be collected in order to identify the operating
regimes of the ocean energy conversion arrays in terms of their output power, for each of
the scenarios defined in the WP1 and WP2. The objective is to define the electrical power
output of each converter and the farm as a whole to be provided as inputs to the rest of the
Tasks of WP3. In this sense, the methodology to define the power output characteristics of
OECs will be illustrated within D3.1.
Essentially D3.1 follows the same structure. It can be separated into two major parts:
i. A comprehensive review of all the electrical infrastructure technologies between the
converter and the point of connection to the onshore electrical grid, including
technologies currently used in offshore electrical networks, as well as those foreseen
to be deployed in the near future. In this section, experience and models from
offshore wind energy research and industry, being more advanced, has been taken
as an example critically, evaluating possible applications for wave and current
marine energy farms.
ii. A set of operating regimes of the ocean energy conversion arrays in terms of their
output power (given as a statistical representation and as a set of representative
time series), for the scenarios to be considered in the next tasks, as defined by WP1
and WP2.
D3.1. consists of 7 major chapters, each of them divided into paragraphs and other
partitioning as needed:
1) Chapter 1 is the present introduction, which elucidates the objectives of WP3 within
DTOcean, but also the content of D3.1 and its structure.
2) Chapter 2 is entitled “Offshore Electrical Network Technologies”. In it, the state of
art of electrical subsystems is included. In particular, specific attention is given to:

Deliverable 3.1 - State-of-the-art assessment and specification of data requirements for electrical system architectures
13
Doc: DTO_WP3_ECD_D3.1 Rev: 1.0 Date: 27.01.2014
cables (transmission and umbilicals); connectors; ancillary components; hubs (subsea
without transformers and offshore substation); transformers & switchgears; storage
systems; reactive power compensation; HVAC and HVDC.
3) Chapter 3 is entitled “Offshore Electrical Network Architecture” and it is mainly a
topological chapter describing layouts, costs and reliability of the possible inter-array
cluster distribution.
4) Chapter 4 is a very short Chapter, herein included just for the sake of completeness,
about the architecture of the onshore electrical network
5) Chapter 5 constitutes mainly the second major part of D3.1, which elucidates the
methodology to define the power output characteristics of Ocean Energy Converters
(OECs) for tidal and wave resource.
6) In Chapter 6 some conclusions will be presented with the perspective of the work to
be done in the other tasks of WP3 and the interconnections with other WPs.
7) Finally, in Chapter 7 a list of References is included.
Deliverable 3.1 - State-of-the-art assessment and specification of data requirements for electrical system architectures
14
Doc: DTO_WP3_ECD_D3.1 Rev: 1.0 Date: 27.01.2014
Offshore Electrical Network Technologies 2
2.1 General Description
Marine energy devices must be electrically connected to the onshore grid system in order to
make use of the energy generated. The marine environment both above and below the
water surface poses particular challenges in terms of the harsh environmental conditions
that the connection equipment must withstand. In addition, access to the equipment for
inspection, maintenance and repair will probably be weather-dependent and therefore
sporadic and unpredictable. Access costs will be high due to the requirement for sea-going
vessels and divers and/or submersible vehicles.
From a theoretical point of view any marine energy device might be directly connected to
the grid without any additional element, assuming that a proper power converter is installed
on board. However, for efficiency and economic reasons, it is likely that power produced by
arrays of converters will be collected and transformed before transmitting it on-shore.
Another option is to deliver the energy extracted from several devices through a cable into a
submarine hub. This can be achieved in several ways and through several possible
configurations that will be introduced in the rest of this document.
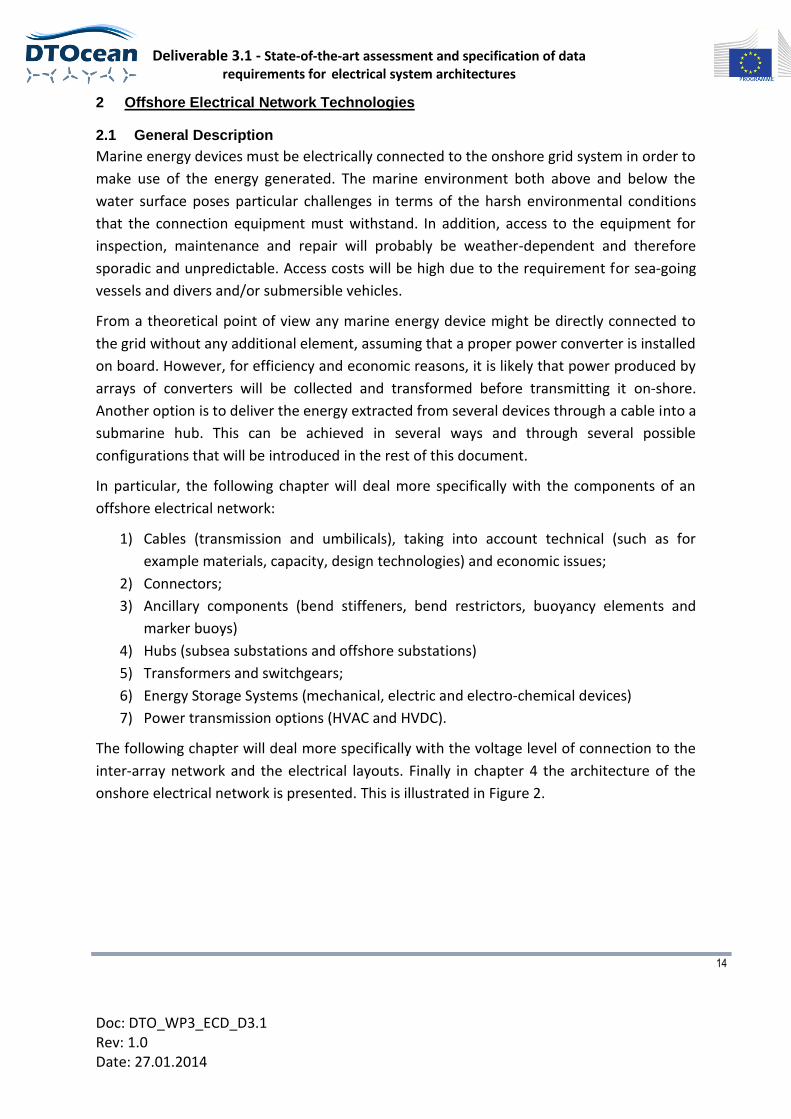
In particular, the following chapter will deal more specifically with the components of an
offshore electrical network:
1) Cables (transmission and umbilicals), taking into account technical (such as for
example materials, capacity, design technologies) and economic issues;
2) Connectors;
3) Ancillary components (bend stiffeners, bend restrictors, buoyancy elements and
marker buoys)
4) Hubs (subsea substations and offshore substations)
5) Transformers and switchgears;
6) Energy Storage Systems (mechanical, electric and electro-chemical devices)
7) Power transmission options (HVAC and HVDC).
The following chapter will deal more specifically with the voltage level of connection to the
inter-array network and the electrical layouts. Finally in chapter 4 the architecture of the
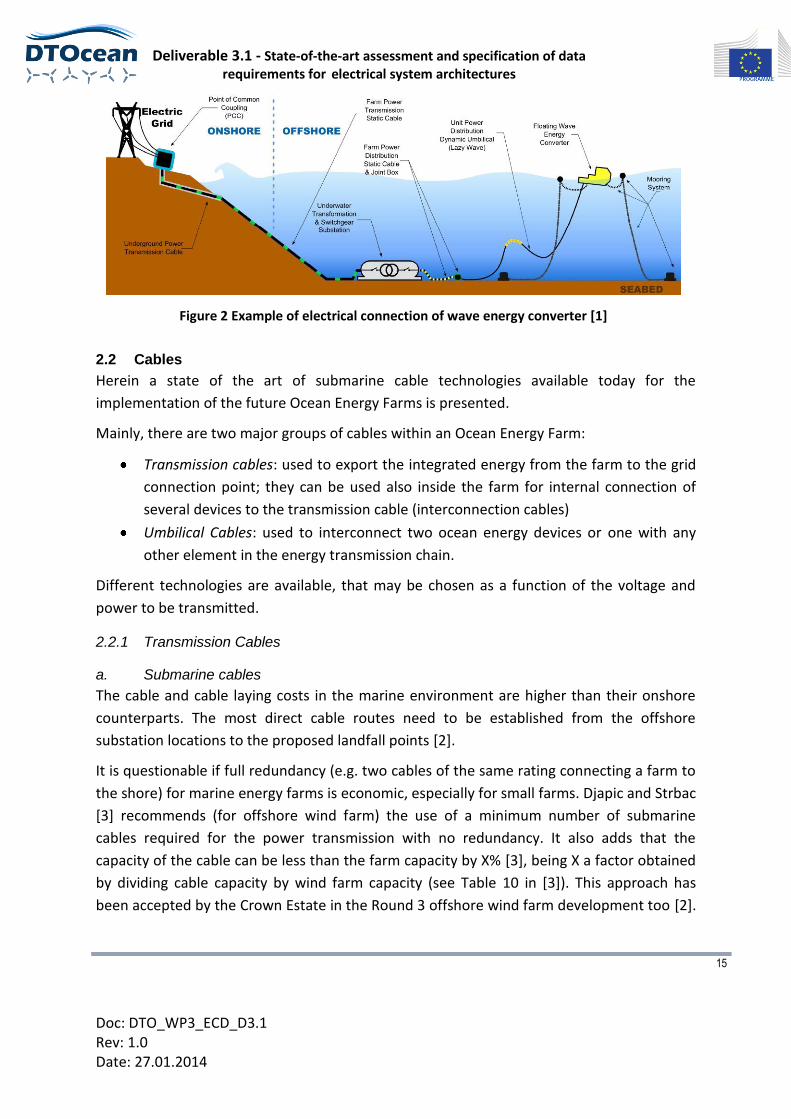
onshore electrical network is presented. This is illustrated in Figure 2.
Deliverable 3.1 - State-of-the-art assessment and specification of data requirements for electrical system architectures
15
Doc: DTO_WP3_ECD_D3.1 Rev: 1.0 Date: 27.01.2014
Figure 2 Example of electrical connection of wave energy converter [1]
2.2 Cables
Herein a state of the art of submarine cable technologies available today for the
implementation of the future Ocean Energy Farms is presented.
Mainly, there are two major groups of cables within an Ocean Energy Farm:
Transmission cables: used to export the integrated energy from the farm to the grid
connection point; they can be used also inside the farm for internal connection of
several devices to the transmission cable (interconnection cables)
Umbilical Cables: used to interconnect two ocean energy devices or one with any
other element in the energy transmission chain.
Different technologies are available, that may be chosen as a function of the voltage and
power to be transmitted.
2.2.1 Transmission Cables
a. Submarine cables
The cable and cable laying costs in the marine environment are higher than their onshore
counterparts. The most direct cable routes need to be established from the offshore
substation locations to the proposed landfall points [2].
It is questionable if full redundancy (e.g. two cables of the same rating connecting a farm to
the shore) for marine energy farms is economic, especially for small farms. Djapic and Strbac
[3] recommends (for offshore wind farm) the use of a minimum number of submarine
cables required for the power transmission with no redundancy. It also adds that the
capacity of the cable can be less than the farm capacity by X% [3], being X a factor obtained
by dividing cable capacity by wind farm capacity (see Table 10 in [3]). This approach has
been accepted by the Crown Estate in the Round 3 offshore wind farm development too [2].
Deliverable 3.1 - State-of-the-art assessment and specification of data requirements for electrical system architectures
16
Doc: DTO_WP3_ECD_D3.1 Rev: 1.0 Date: 27.01.2014
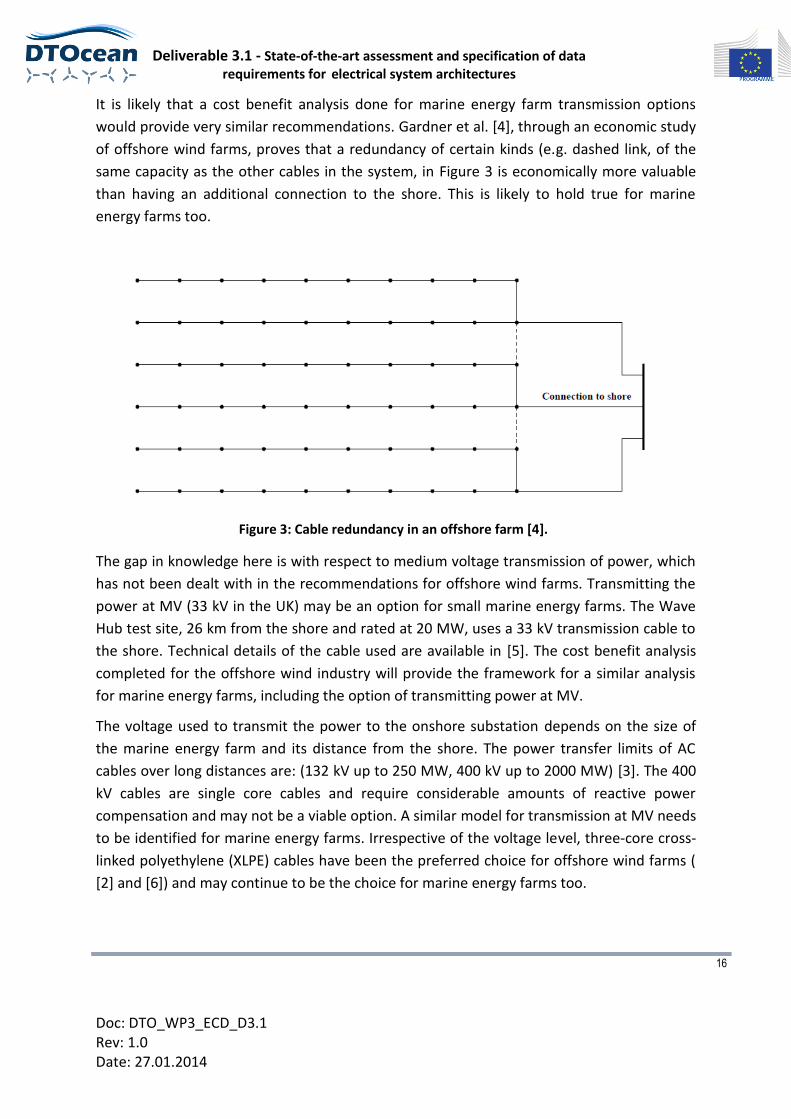
It is likely that a cost benefit analysis done for marine energy farm transmission options
would provide very similar recommendations. Gardner et al. [4], through an economic study
of offshore wind farms, proves that a redundancy of certain kinds (e.g. dashed link, of the
same capacity as the other cables in the system, in Figure 3 is economically more valuable
than having an additional connection to the shore. This is likely to hold true for marine
energy farms too.
Figure 3: Cable redundancy in an offshore farm [4].
The gap in knowledge here is with respect to medium voltage transmission of power, which
has not been dealt with in the recommendations for offshore wind farms. Transmitting the
power at MV (33 kV in the UK) may be an option for small marine energy farms. The Wave
Hub test site, 26 km from the shore and rated at 20 MW, uses a 33 kV transmission cable to
the shore. Technical details of the cable used are available in [5]. The cost benefit analysis
completed for the offshore wind industry will provide the framework for a similar analysis
for marine energy farms, including the option of transmitting power at MV.
The voltage used to transmit the power to the onshore substation depends on the size of
the marine energy farm and its distance from the shore. The power transfer limits of AC
cables over long distances are: (132 kV up to 250 MW, 400 kV up to 2000 MW) [3]. The 400
kV cables are single core cables and require considerable amounts of reactive power
compensation and may not be a viable option. A similar model for transmission at MV needs
to be identified for marine energy farms. Irrespective of the voltage level, three-core cross-
linked polyethylene (XLPE) cables have been the preferred choice for offshore wind farms (
[2] and [6]) and may continue to be the choice for marine energy farms too.
Deliverable 3.1 - State-of-the-art assessment and specification of data requirements for electrical system architectures
17
Doc: DTO_WP3_ECD_D3.1 Rev: 1.0 Date: 27.01.2014
Energy losses in the cable, due to ohmic losses in the conductor and the metallic screen, can
be reduced by using a larger conductor [7]. This has not been considered in the work
completed for offshore wind farms [3] and might not prove to be an economically viable
option for marine energy farms. Dielectric losses of the XLPE insulation, also present at no
load, depend on the operating voltage and can be significant over 100 kV [7]. Dielectric
losses in XLPE cables are lower than for Ethylene Propylene Rubber and fluid-filled cables
[7].
The IEC 60287 series of standards on submarine cables recommends:
One three-core cable or one three-phase group of single core cables
Temperature in sea bed 20°C
Laying depth in sea bed 1.0 m
Sea bed thermal resistivity 1.0 K x m/W
Not many models for estimating costs are available in scientific literature. Among all, one of
the most adopted reference is [8], and subsequent models are based on . Costs were
derived for different components in a wind park, but for the electrical components it could
be assumed that the same may apply to the marine energy field. However, no reference to
the sources such models are based on is made. All the constants and costs reported in [8]
are expressed in Swedish Krona as for the year 2003, so when using the constant they
should be adequately actualized.
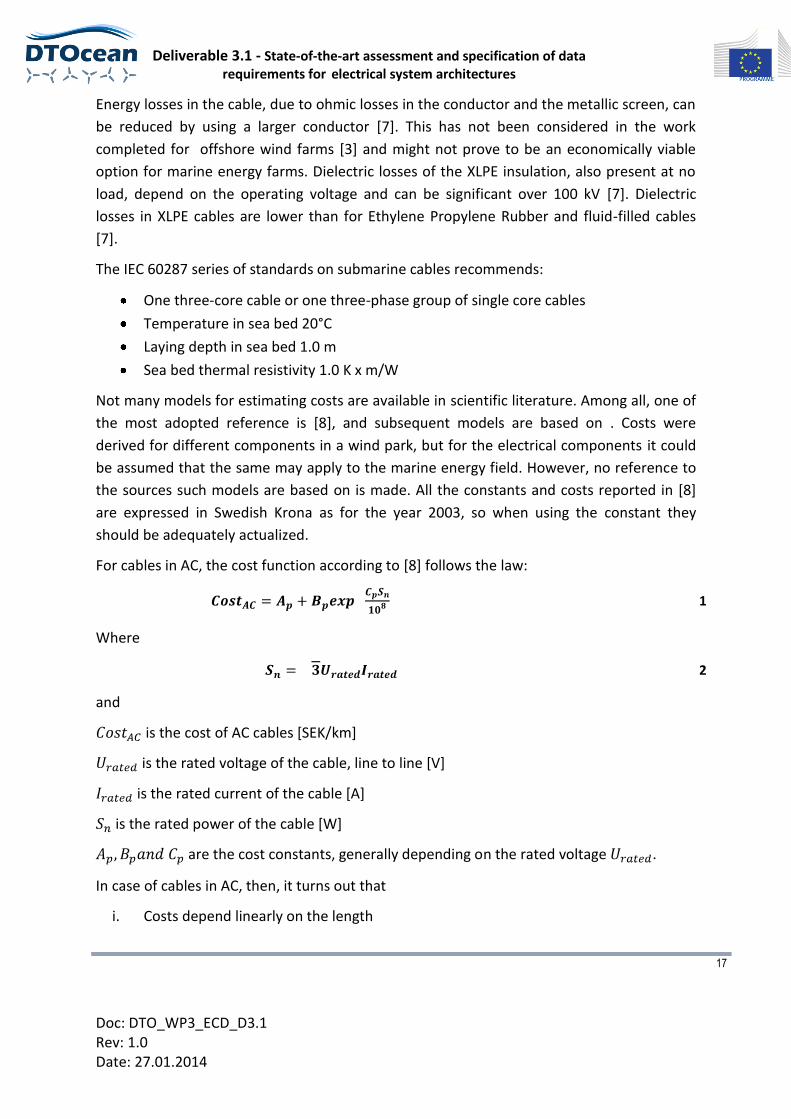
For cables in AC, the cost function according to [8] follows the law:
1
Where
2
and
is the cost of AC cables [SEK/km]
is the rated voltage of the cable, line to line [V]
is the rated current of the cable [A]
is the rated power of the cable [W]
are the cost constants, generally depending on the rated voltage .
In case of cables in AC, then, it turns out that
i. Costs depend linearly on the length
Deliverable 3.1 - State-of-the-art assessment and specification of data requirements for electrical system architectures
18
Doc: DTO_WP3_ECD_D3.1 Rev: 1.0 Date: 27.01.2014
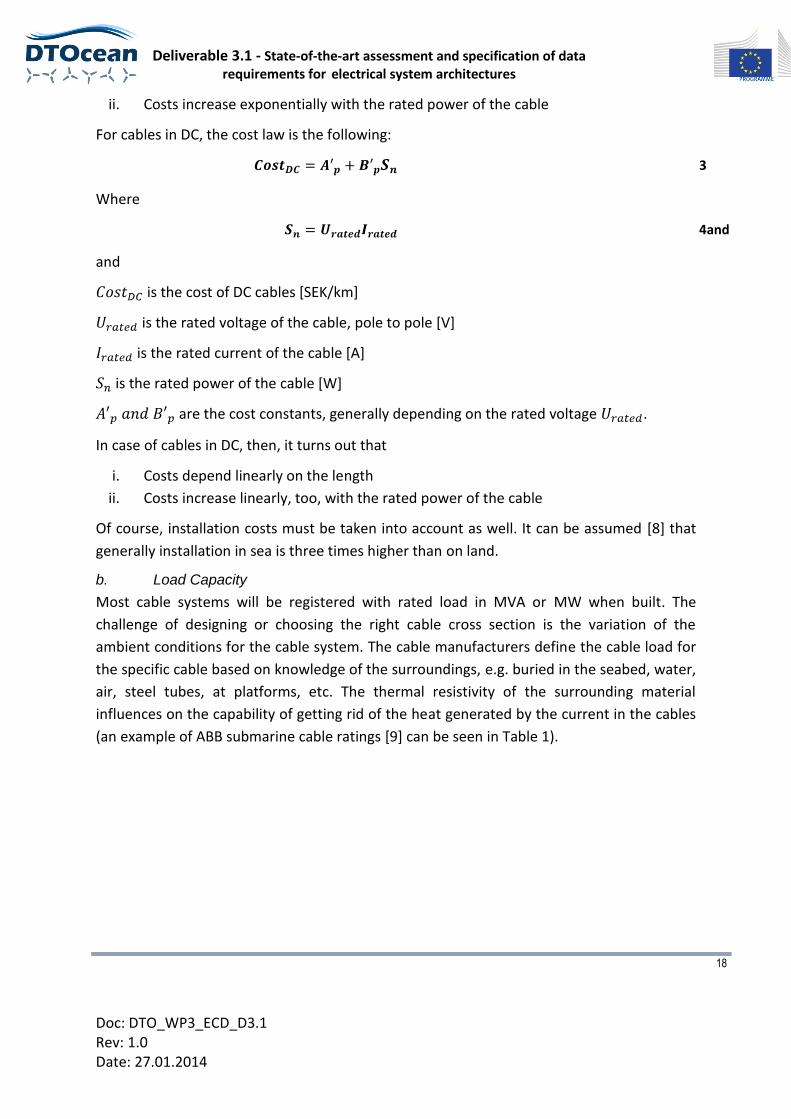
ii. Costs increase exponentially with the rated power of the cable
For cables in DC, the cost law is the following:
3
Where
4and
and
is the cost of DC cables [SEK/km]
is the rated voltage of the cable, pole to pole [V]
is the rated current of the cable [A]
is the rated power of the cable [W]
are the cost constants, generally depending on the rated voltage .
In case of cables in DC, then, it turns out that
i. Costs depend linearly on the length
ii. Costs increase linearly, too, with the rated power of the cable
Of course, installation costs must be taken into account as well. It can be assumed [8] that
generally installation in sea is three times higher than on land.
b. Load Capacity
Most cable systems will be registered with rated load in MVA or MW when built. The
challenge of designing or choosing the right cable cross section is the variation of the
ambient conditions for the cable system. The cable manufacturers define the cable load for
the specific cable based on knowledge of the surroundings, e.g. buried in the seabed, water,
air, steel tubes, at platforms, etc. The thermal resistivity of the surrounding material
influences on the capability of getting rid of the heat generated by the current in the cables
(an example of ABB submarine cable ratings [9] can be seen in Table 1).
Deliverable 3.1 - State-of-the-art assessment and specification of data requirements for electrical system architectures
19
Doc: DTO_WP3_ECD_D3.1 Rev: 1.0 Date: 27.01.2014
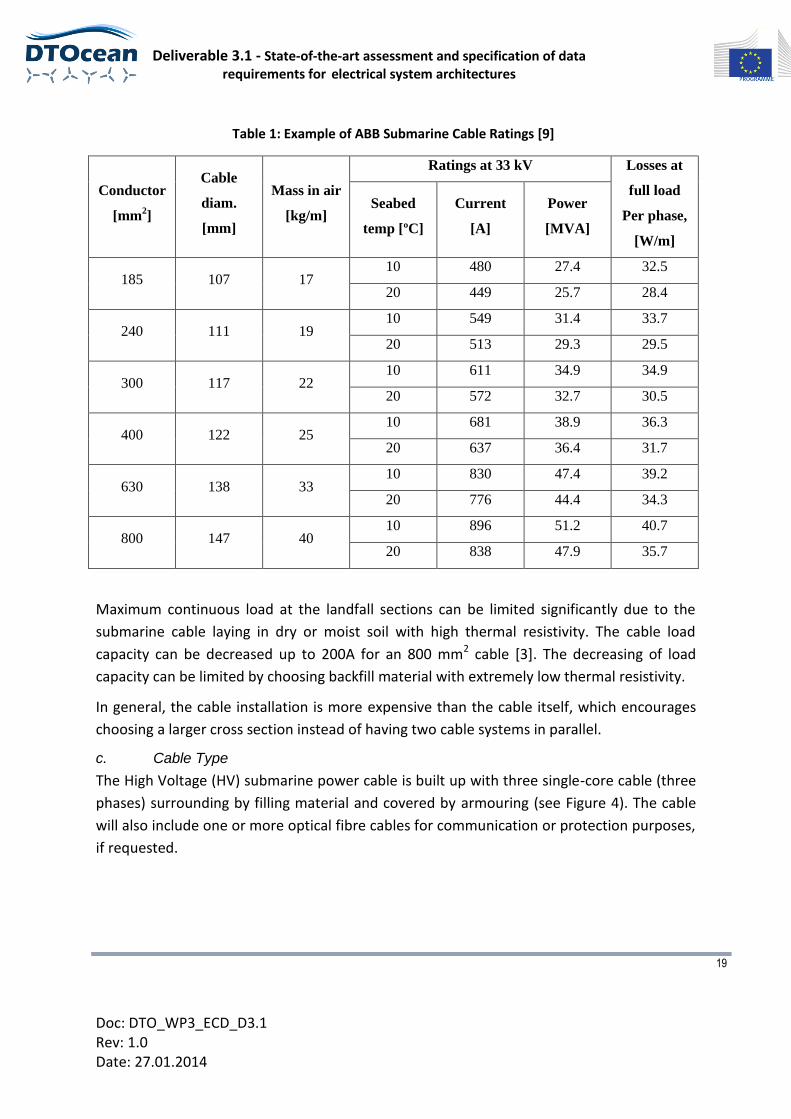
Table 1: Example of ABB Submarine Cable Ratings [9]
Conductor
[mm2]
Cable
diam.
[mm]
Mass in air
[kg/m]
Ratings at 33 kV Losses at
full load
Per phase,
[W/m]
Seabed
temp [ºC]
Current
[A]
Power
[MVA]
185 107 17 10 480 27.4 32.5
20 449 25.7 28.4
240 111 19 10 549 31.4 33.7
20 513 29.3 29.5
300 117 22 10 611 34.9 34.9
20 572 32.7 30.5
400 122 25 10 681 38.9 36.3
20 637 36.4 31.7
630 138 33 10 830 47.4 39.2
20 776 44.4 34.3
800 147 40 10 896 51.2 40.7
20 838 47.9 35.7
Maximum continuous load at the landfall sections can be limited significantly due to the
submarine cable laying in dry or moist soil with high thermal resistivity. The cable load
capacity can be decreased up to 200A for an 800 mm2 cable [3]. The decreasing of load
capacity can be limited by choosing backfill material with extremely low thermal resistivity.
In general, the cable installation is more expensive than the cable itself, which encourages
choosing a larger cross section instead of having two cable systems in parallel.
c. Cable Type
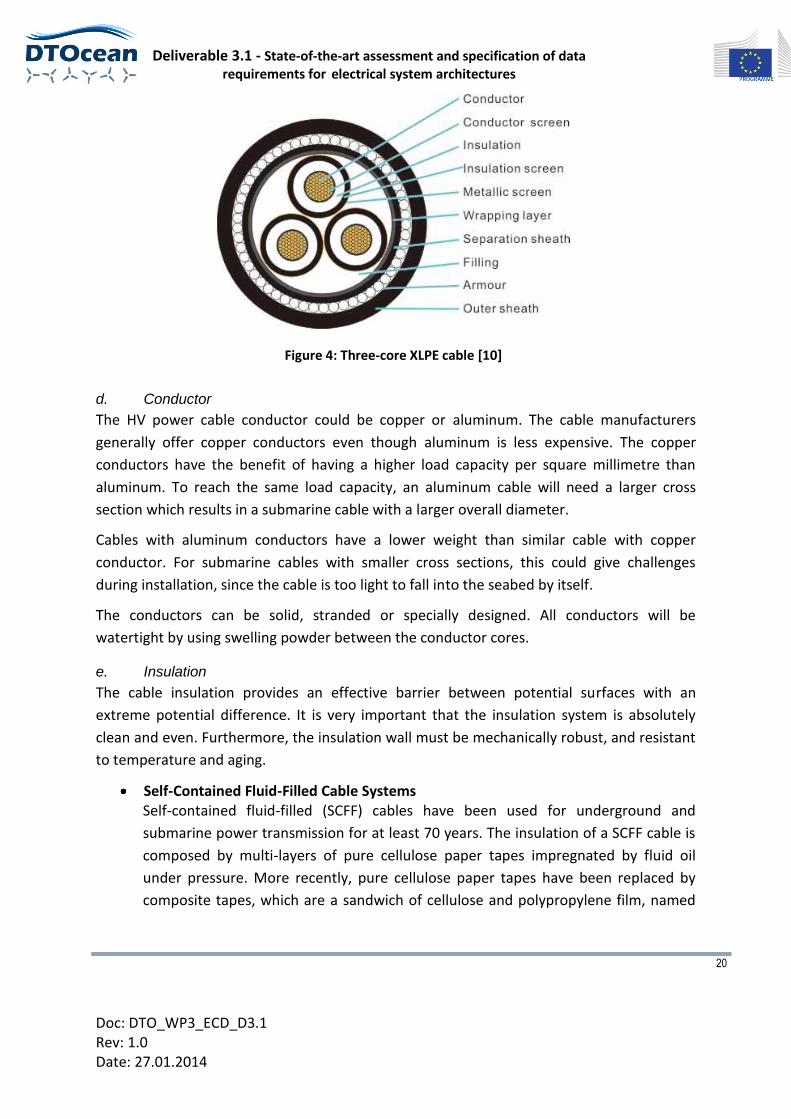
The High Voltage (HV) submarine power cable is built up with three single-core cable (three
phases) surrounding by filling material and covered by armouring (see Figure 4). The cable
will also include one or more optical fibre cables for communication or protection purposes,
if requested.
Deliverable 3.1 - State-of-the-art assessment and specification of data requirements for electrical system architectures
20
Doc: DTO_WP3_ECD_D3.1 Rev: 1.0 Date: 27.01.2014
Figure 4: Three-core XLPE cable [10]
d. Conductor
The HV power cable conductor could be copper or aluminum. The cable manufacturers
generally offer copper conductors even though aluminum is less expensive. The copper
conductors have the benefit of having a higher load capacity per square millimetre than
aluminum. To reach the same load capacity, an aluminum cable will need a larger cross
section which results in a submarine cable with a larger overall diameter.
Cables with aluminum conductors have a lower weight than similar cable with copper
conductor. For submarine cables with smaller cross sections, this could give challenges
during installation, since the cable is too light to fall into the seabed by itself.
The conductors can be solid, stranded or specially designed. All conductors will be
watertight by using swelling powder between the conductor cores.
e. Insulation
The cable insulation provides an effective barrier between potential surfaces with an
extreme potential difference. It is very important that the insulation system is absolutely
clean and even. Furthermore, the insulation wall must be mechanically robust, and resistant
to temperature and aging.
Self-Contained Fluid-Filled Cable Systems Self-contained fluid-filled (SCFF) cables have been used for underground and
submarine power transmission for at least 70 years. The insulation of a SCFF cable is
composed by multi-layers of pure cellulose paper tapes impregnated by fluid oil
under pressure. More recently, pure cellulose paper tapes have been replaced by
composite tapes, which are a sandwich of cellulose and polypropylene film, named
Deliverable 3.1 - State-of-the-art assessment and specification of data requirements for electrical system architectures
21
Doc: DTO_WP3_ECD_D3.1 Rev: 1.0 Date: 27.01.2014
paper–polypropylene laminated (PPL) tape that offers some improved properties in
terms of capability.
SCFF cables have an excellent record of reliability in service and for many years have
represented the only solution for difficult connections.
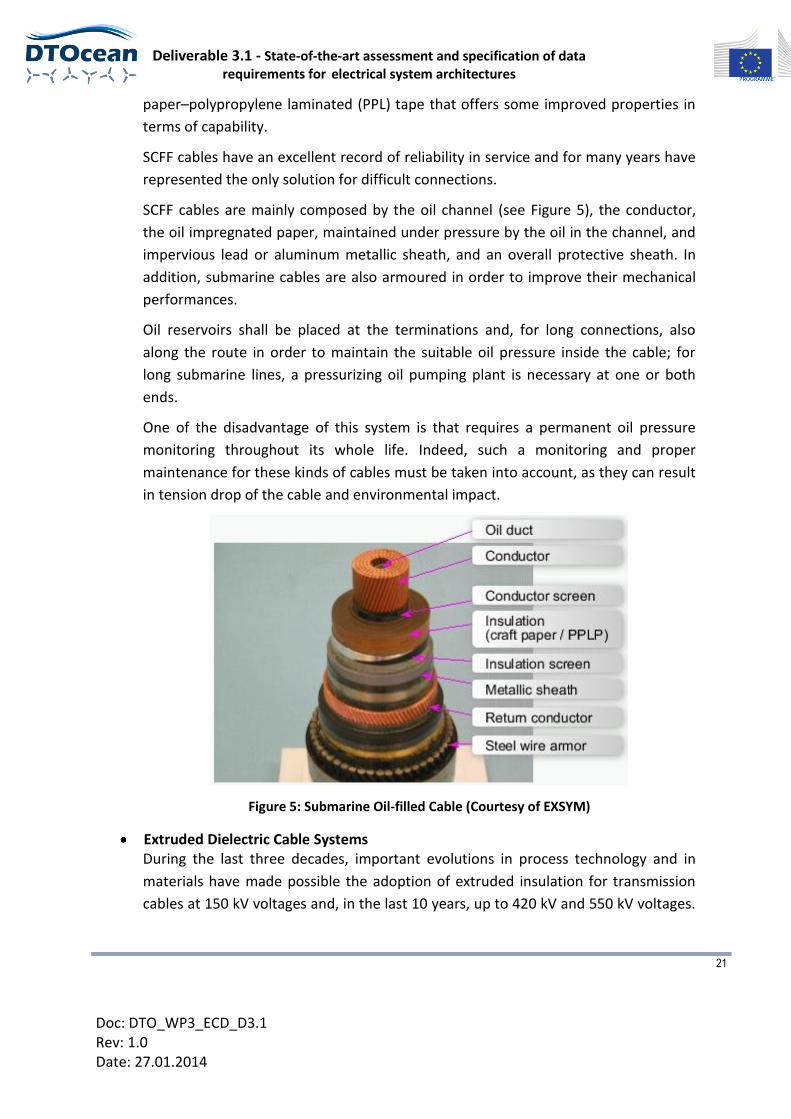
SCFF cables are mainly composed by the oil channel (see Figure 5), the conductor,
the oil impregnated paper, maintained under pressure by the oil in the channel, and
impervious lead or aluminum metallic sheath, and an overall protective sheath. In
addition, submarine cables are also armoured in order to improve their mechanical
performances.
Oil reservoirs shall be placed at the terminations and, for long connections, also
along the route in order to maintain the suitable oil pressure inside the cable; for
long submarine lines, a pressurizing oil pumping plant is necessary at one or both
ends.
One of the disadvantage of this system is that requires a permanent oil pressure
monitoring throughout its whole life. Indeed, such a monitoring and proper
maintenance for these kinds of cables must be taken into account, as they can result
in tension drop of the cable and environmental impact.
Figure 5: Submarine Oil-filled Cable (Courtesy of EXSYM)
Extruded Dielectric Cable Systems During the last three decades, important evolutions in process technology and in
materials have made possible the adoption of extruded insulation for transmission
cables at 150 kV voltages and, in the last 10 years, up to 420 kV and 550 kV voltages.
Deliverable 3.1 - State-of-the-art assessment and specification of data requirements for electrical system architectures
22
Doc: DTO_WP3_ECD_D3.1 Rev: 1.0 Date: 27.01.2014
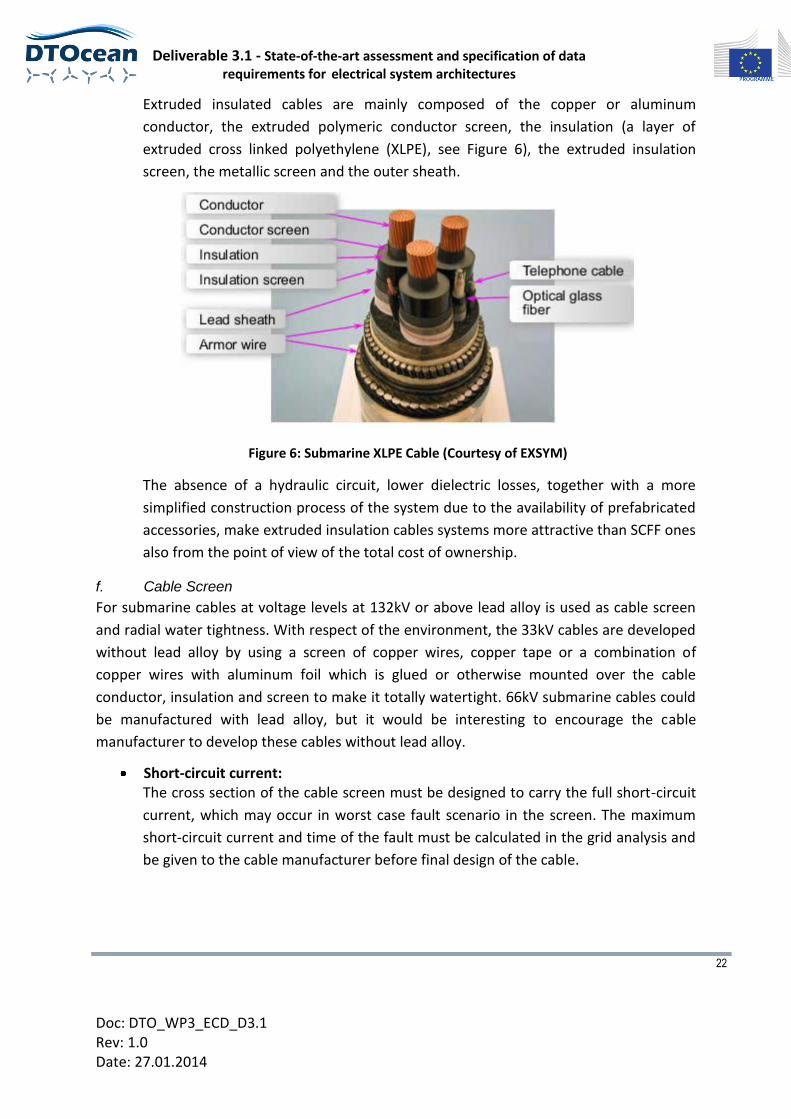
Extruded insulated cables are mainly composed of the copper or aluminum
conductor, the extruded polymeric conductor screen, the insulation (a layer of
extruded cross linked polyethylene (XLPE), see Figure 6), the extruded insulation
screen, the metallic screen and the outer sheath.
Figure 6: Submarine XLPE Cable (Courtesy of EXSYM)
The absence of a hydraulic circuit, lower dielectric losses, together with a more
simplified construction process of the system due to the availability of prefabricated
accessories, make extruded insulation cables systems more attractive than SCFF ones
also from the point of view of the total cost of ownership.
f. Cable Screen
For submarine cables at voltage levels at 132kV or above lead alloy is used as cable screen
and radial water tightness. With respect of the environment, the 33kV cables are developed
without lead alloy by using a screen of copper wires, copper tape or a combination of
copper wires with aluminum foil which is glued or otherwise mounted over the cable
conductor, insulation and screen to make it totally watertight. 66kV submarine cables could
be manufactured with lead alloy, but it would be interesting to encourage the cable
manufacturer to develop these cables without lead alloy.
Short-circuit current: The cross section of the cable screen must be designed to carry the full short-circuit
current, which may occur in worst case fault scenario in the screen. The maximum
short-circuit current and time of the fault must be calculated in the grid analysis and
be given to the cable manufacturer before final design of the cable.
Deliverable 3.1 - State-of-the-art assessment and specification of data requirements for electrical system architectures
23
Doc: DTO_WP3_ECD_D3.1 Rev: 1.0 Date: 27.01.2014
The short-circuit current will normally not influence the cross section of the cable
conductor, since the cable conductor will normally carry a high load during normal
operation and have a significant size.
g. Wet / Dry Design
Export cables at high voltage levels at or above 132kV are always of the dry type. Discussing
advantages and disadvantages of wet and dry design for submarine array cables, the
concern is to have water ingress into the insulation and hereby reduce the insulation
effectiveness.
In principle, this is a question for the individual cable manufacturer to document that the
used insulation material has the electrical withstand throughout the cable lifetime even if
wet design is offered. References to similar cables in operation or tests must be provided.
In general, the HV cables are longitudinally watertight which avoids water to ingress more
than one metre into the cable during possible cable damage.
The other issue is radial water tightness where the possibility for the polyethylene to absorb
water during the lifetime even though this will take years. By adding an extruded lead alloy
screen around each cable core, the radial water tightness is achieved.
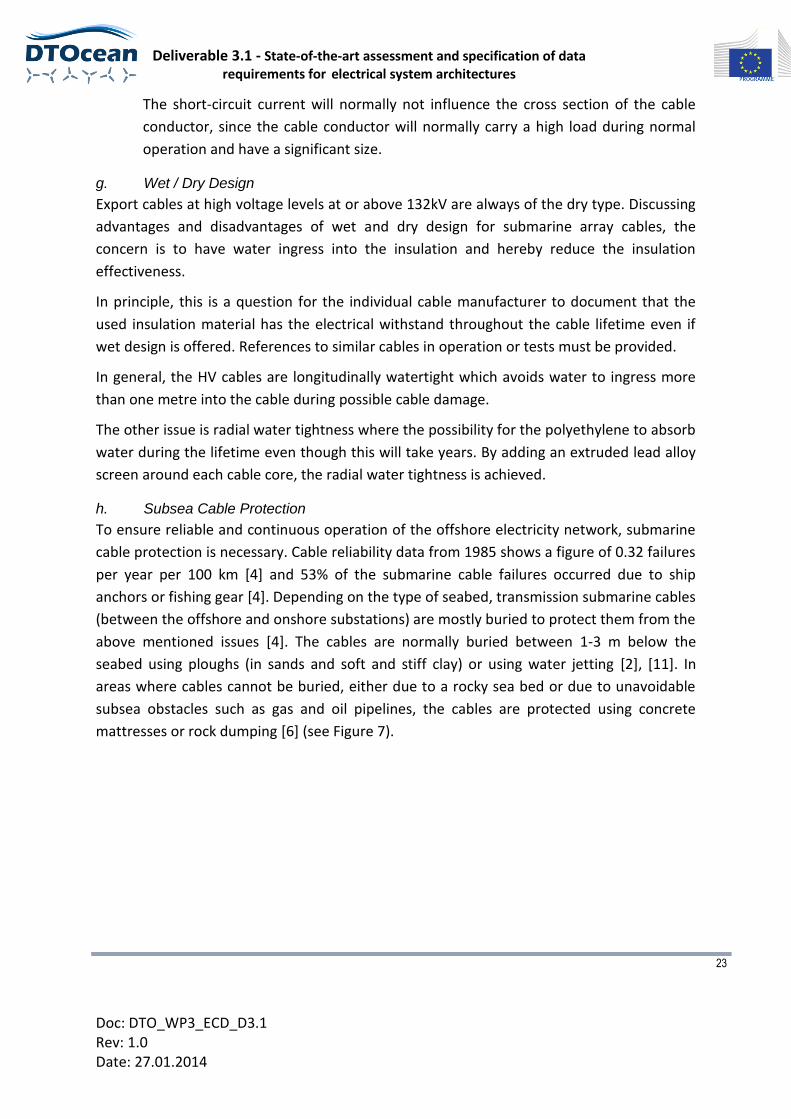
h. Subsea Cable Protection
To ensure reliable and continuous operation of the offshore electricity network, submarine
cable protection is necessary. Cable reliability data from 1985 shows a figure of 0.32 failures
per year per 100 km [4] and 53% of the submarine cable failures occurred due to ship
anchors or fishing gear [4]. Depending on the type of seabed, transmission submarine cables
(between the offshore and onshore substations) are mostly buried to protect them from the
above mentioned issues [4]. The cables are normally buried between 1-3 m below the
seabed using ploughs (in sands and soft and stiff clay) or using water jetting [2], [11]. In
areas where cables cannot be buried, either due to a rocky sea bed or due to unavoidable
subsea obstacles such as gas and oil pipelines, the cables are protected using concrete
mattresses or rock dumping [6] (see Figure 7).
Deliverable 3.1 - State-of-the-art assessment and specification of data requirements for electrical system architectures
24
Doc: DTO_WP3_ECD_D3.1 Rev: 1.0 Date: 27.01.2014
Figure 7: Concrete bags protection (left) and Mattress protection (right). (Pictures courtesy of Malcolm Sharples)
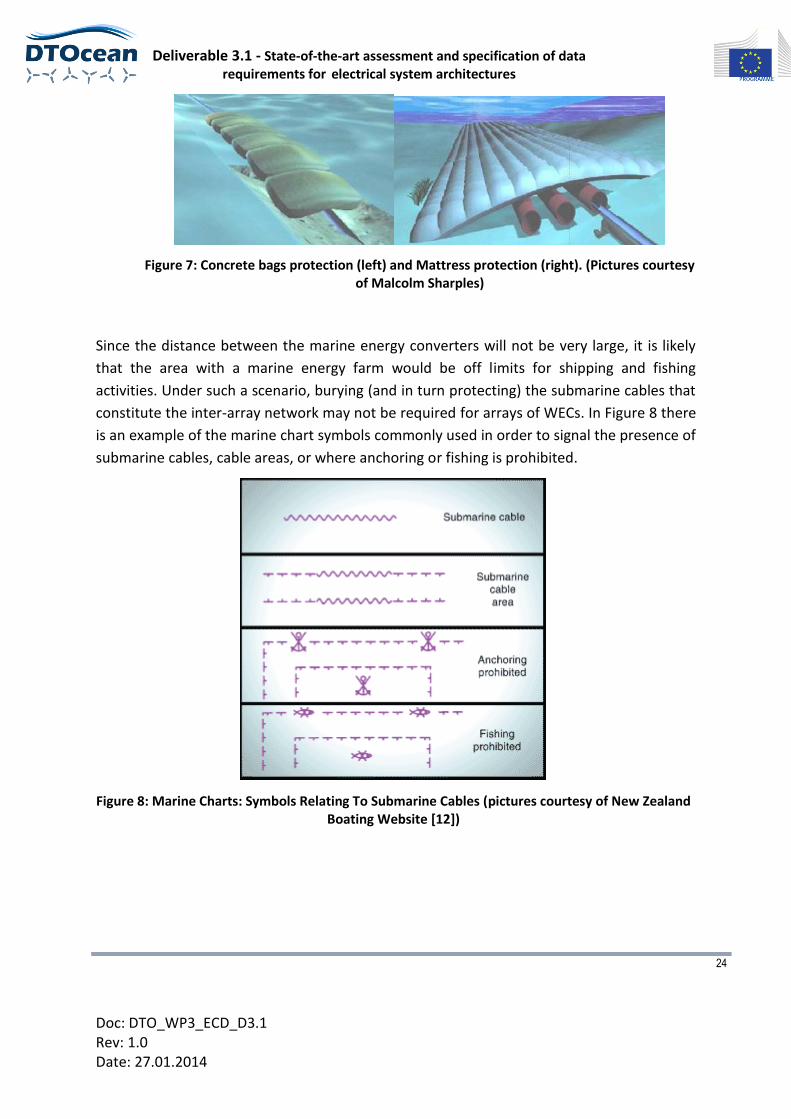
Since the distance between the marine energy converters will not be very large, it is likely
that the area with a marine energy farm would be off limits for shipping and fishing
activities. Under such a scenario, burying (and in turn protecting) the submarine cables that
constitute the inter-array network may not be required for arrays of WECs. In Figure 8 there
is an example of the marine chart symbols commonly used in order to signal the presence of
submarine cables, cable areas, or where anchoring or fishing is prohibited.
Figure 8: Marine Charts: Symbols Relating To Submarine Cables (pictures courtesy of New Zealand Boating Website [12])
Deliverable 3.1 - State-of-the-art assessment and specification of data requirements for electrical system architectures
25
Doc: DTO_WP3_ECD_D3.1 Rev: 1.0 Date: 27.01.2014
When the spacing between the marine energy converters in an array is regular, spare
sections of cables of the appropriate length may be stored at a shore depot or on the
offshore substation platform [4].
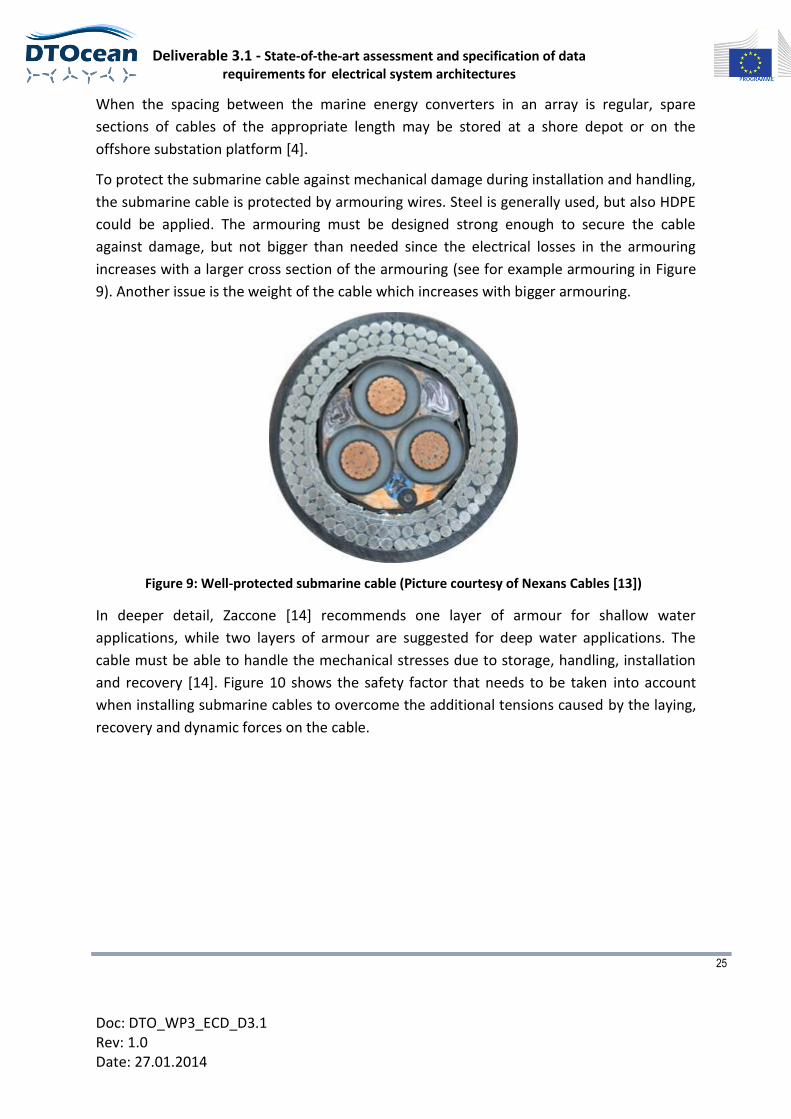
To protect the submarine cable against mechanical damage during installation and handling,
the submarine cable is protected by armouring wires. Steel is generally used, but also HDPE
could be applied. The armouring must be designed strong enough to secure the cable
against damage, but not bigger than needed since the electrical losses in the armouring
increases with a larger cross section of the armouring (see for example armouring in Figure
9). Another issue is the weight of the cable which increases with bigger armouring.
Figure 9: Well-protected submarine cable (Picture courtesy of Nexans Cables [13])
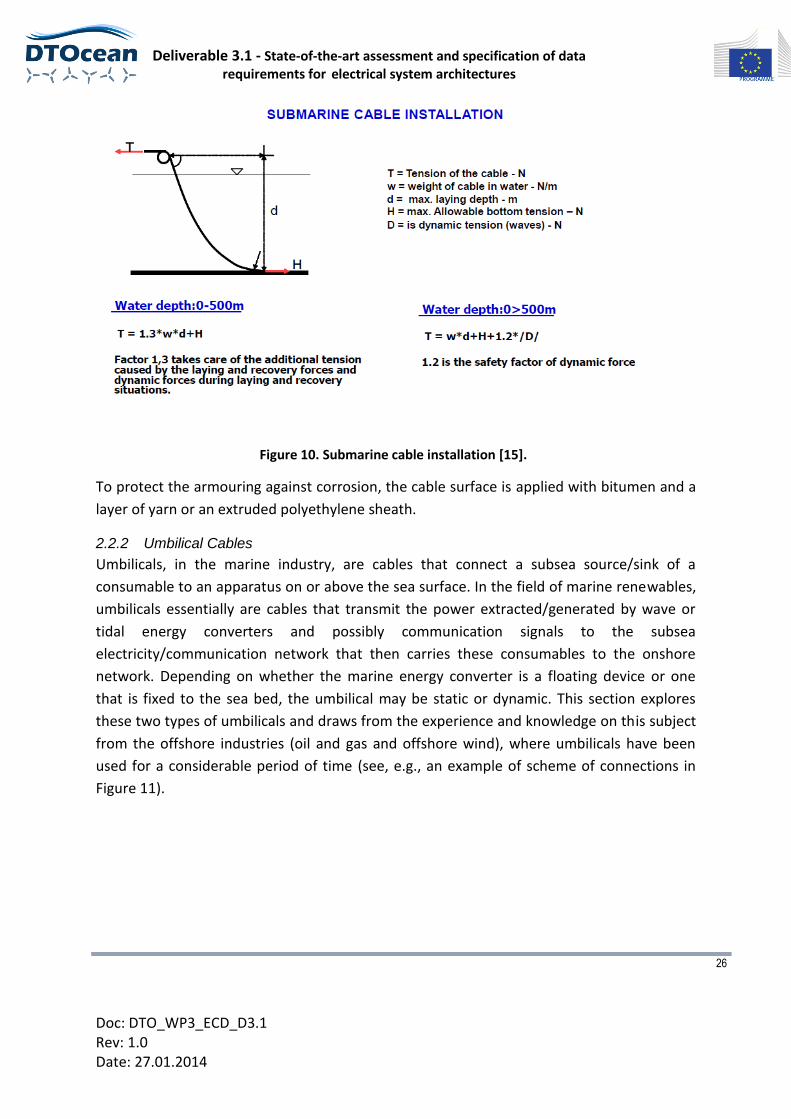
In deeper detail, Zaccone [14] recommends one layer of armour for shallow water
applications, while two layers of armour are suggested for deep water applications. The
cable must be able to handle the mechanical stresses due to storage, handling, installation
and recovery [14]. Figure 10 shows the safety factor that needs to be taken into account
when installing submarine cables to overcome the additional tensions caused by the laying,
recovery and dynamic forces on the cable.
Deliverable 3.1 - State-of-the-art assessment and specification of data requirements for electrical system architectures
26
Doc: DTO_WP3_ECD_D3.1 Rev: 1.0 Date: 27.01.2014
Figure 10. Submarine cable installation [15].
To protect the armouring against corrosion, the cable surface is applied with bitumen and a
layer of yarn or an extruded polyethylene sheath.
2.2.2 Umbilical Cables
Umbilicals, in the marine industry, are cables that connect a subsea source/sink of a
consumable to an apparatus on or above the sea surface. In the field of marine renewables,
umbilicals essentially are cables that transmit the power extracted/generated by wave or
tidal energy converters and possibly communication signals to the subsea
electricity/communication network that then carries these consumables to the onshore
network. Depending on whether the marine energy converter is a floating device or one
that is fixed to the sea bed, the umbilical may be static or dynamic. This section explores
these two types of umbilicals and draws from the experience and knowledge on this subject
from the offshore industries (oil and gas and offshore wind), where umbilicals have been
used for a considerable period of time (see, e.g., an example of scheme of connections in
Figure 11).
Deliverable 3.1 - State-of-the-art assessment and specification of data requirements for electrical system architectures
27
Doc: DTO_WP3_ECD_D3.1 Rev: 1.0 Date: 27.01.2014
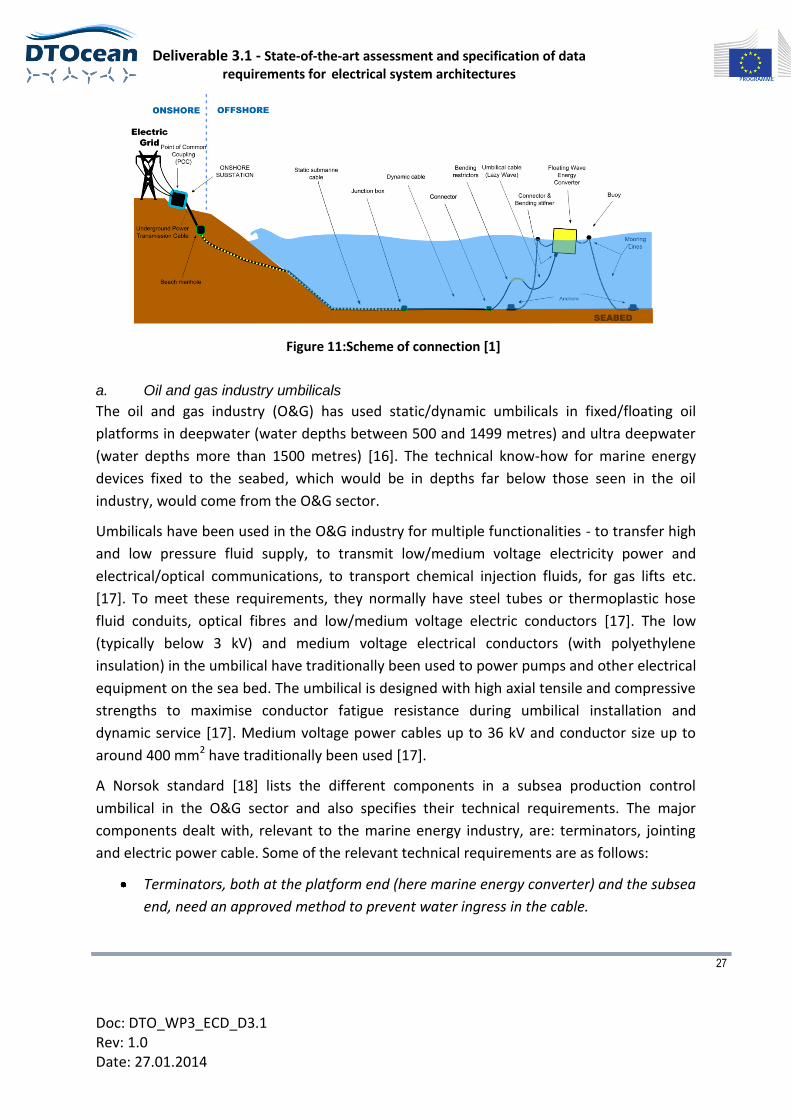
Figure 11:Scheme of connection [1]
a. Oil and gas industry umbilicals
The oil and gas industry (O&G) has used static/dynamic umbilicals in fixed/floating oil
platforms in deepwater (water depths between 500 and 1499 metres) and ultra deepwater
(water depths more than 1500 metres) [16]. The technical know-how for marine energy
devices fixed to the seabed, which would be in depths far below those seen in the oil
industry, would come from the O&G sector.
Umbilicals have been used in the O&G industry for multiple functionalities - to transfer high
and low pressure fluid supply, to transmit low/medium voltage electricity power and
electrical/optical communications, to transport chemical injection fluids, for gas lifts etc.
[17]. To meet these requirements, they normally have steel tubes or thermoplastic hose
fluid conduits, optical fibres and low/medium voltage electric conductors [17]. The low
(typically below 3 kV) and medium voltage electrical conductors (with polyethylene
insulation) in the umbilical have traditionally been used to power pumps and other electrical
equipment on the sea bed. The umbilical is designed with high axial tensile and compressive
strengths to maximise conductor fatigue resistance during umbilical installation and
dynamic service [17]. Medium voltage power cables up to 36 kV and conductor size up to
around 400 mm2 have traditionally been used [17].
A Norsok standard [18] lists the different components in a subsea production control
umbilical in the O&G sector and also specifies their technical requirements. The major
components dealt with, relevant to the marine energy industry, are: terminators, jointing
and electric power cable. Some of the relevant technical requirements are as follows:
Terminators, both at the platform end (here marine energy converter) and the subsea
end, need an approved method to prevent water ingress in the cable.
Deliverable 3.1 - State-of-the-art assessment and specification of data requirements for electrical system architectures
28
Doc: DTO_WP3_ECD_D3.1 Rev: 1.0 Date: 27.01.2014
Electrical terminations shall have two independent barriers against water ingress,
which shall be separately tested during qualification and final product assembly.
The axial load requirements shall not allow structural damage to the termination or
template landing structure.
The J-tube seal shall withstand 100 year maximum wave and internal pressure from
the filled up J- tube.
Sufficient cushioning shall be provided to prevent damaging of the copper
conductors, insulation and sheeting during umbilical manufacturing processes,
installation and its operational life.
All electrical conductors shall be insulated with an appropriate thermoplastic
material suitable for subsea operation.
Please note that considering the short lengths of umbilicals necessary for marine energy
application, it is not envisaged that umbilical jointing would be required.
The standard also discusses different mechanical loading tests - torque balance, tensile test,
bending and tensile test, bend cycling test - and the required umbilical performance from
these tests. These would be relevant for umbilicals in the marine energy industry too.
b. Devices piled onto the ground
In the marine energy industry, umbilicals will only have electrical conductors and fibre optic
communication cables. For devices fixed to the sea bed (e.g. tidal current turbines and
offshore substations on monopiles or similar structures) the umbilical would be taken to the
subsea unit using the structure itself. The umbilical is, thus, not dynamic and may only have
to deal with the wave and current loads on it. The umbilical requirements for offshore
substation platforms would be very similar to the requirements for marine energy
converters fixed to the sea bed.
The point where the umbilical cable enters the structure (which depends on the type of
structure and the loads on the cable) needs careful design, because this can determine the
cable rating [4]. J-tubes are often used here and the cables that run through J-tubes will
need to be de-rated [2]. The Norsok standard [18] mentions the design requirement of J-
tubes (in the O&G industry). They have been listed in the preceding section.
The offshore wind and the oil and gas industries have used static umbilical systems for
decades now and would be the best source of any design information.
c. Floating Devices
With respect to floating wave energy converters (WECs, TECs) or floating tidal devices (TECs)
designing the umbilical system would be more challenging since the umbilical here has to
endure bigger forces and stresses due to loads from waves, currents and marine energy
Deliverable 3.1 - State-of-the-art assessment and specification of data requirements for electrical system architectures
29
Doc: DTO_WP3_ECD_D3.1 Rev: 1.0 Date: 27.01.2014
converter induced motions. The forces due to induced motions of energy converter would
be very different from the forces on umbilicals used in offshore floating O&G platforms.
O&G platforms are designed to remain as stationary as possible. The main features of
umbilicals for floating devices can be resumed as follows:
The cable must withstand, without deterioration, the severe bending under tension,
twisting and coiling which may occur during operation, manufacture and installation.
The cable must also withstand, without significant deformation, the external water
pressure at the deepest part of the route.
The cable should be designed in such a way that its dynamic behaviour has a minimal
effect on the global performance of the device.
The weight of the cable in water must be sufficient to inhibit movement on the sea
bed under the influence of tidal currents. Movement would cause abrasion and
fatigue damage to the cable.
Cable components and terminations (including connectors) should be designed
taking into account possible economic constraints (oil and gas solutions might not be
cost-effective for application to marine renewable energy)
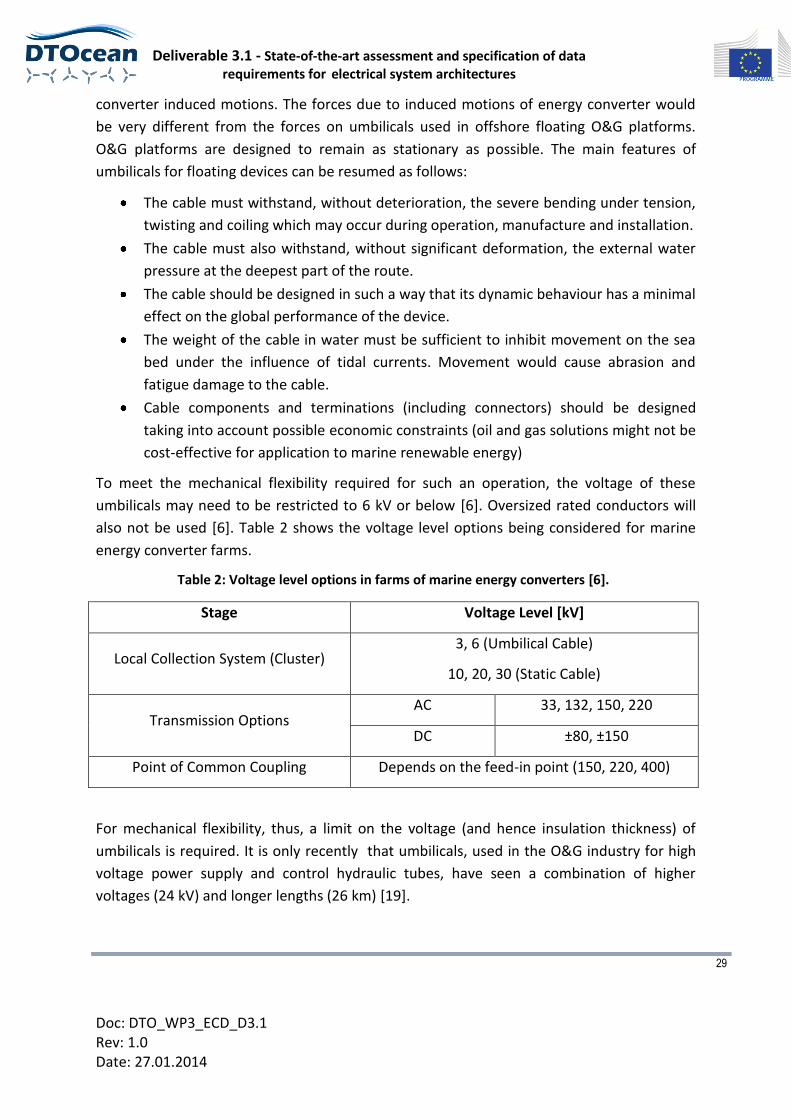
To meet the mechanical flexibility required for such an operation, the voltage of these
umbilicals may need to be restricted to 6 kV or below [6]. Oversized rated conductors will
also not be used [6]. Table 2 shows the voltage level options being considered for marine
energy converter farms.
Table 2: Voltage level options in farms of marine energy converters [6].
Stage Voltage Level [kV]
Local Collection System (Cluster) 3, 6 (Umbilical Cable)
10, 20, 30 (Static Cable)
Transmission Options AC 33, 132, 150, 220
DC ±80, ±150
Point of Common Coupling Depends on the feed-in point (150, 220, 400)
For mechanical flexibility, thus, a limit on the voltage (and hence insulation thickness) of
umbilicals is required. It is only recently that umbilicals, used in the O&G industry for high
voltage power supply and control hydraulic tubes, have seen a combination of higher
voltages (24 kV) and longer lengths (26 km) [19].
Deliverable 3.1 - State-of-the-art assessment and specification of data requirements for electrical system architectures
30
Doc: DTO_WP3_ECD_D3.1 Rev: 1.0 Date: 27.01.2014
ABB has recently installed the longest (1.5 km long) dynamic three-core power cable
connecting the Goliat platform to the static AC cable 350 metres below the surface [20]. An
innovative corrugated copper sheath has been used for mechanical strength [20]. The
umbilical, before installation, was tested in one of MARINTEK's advanced rigs for six months
and no damage to critical components was found [21].
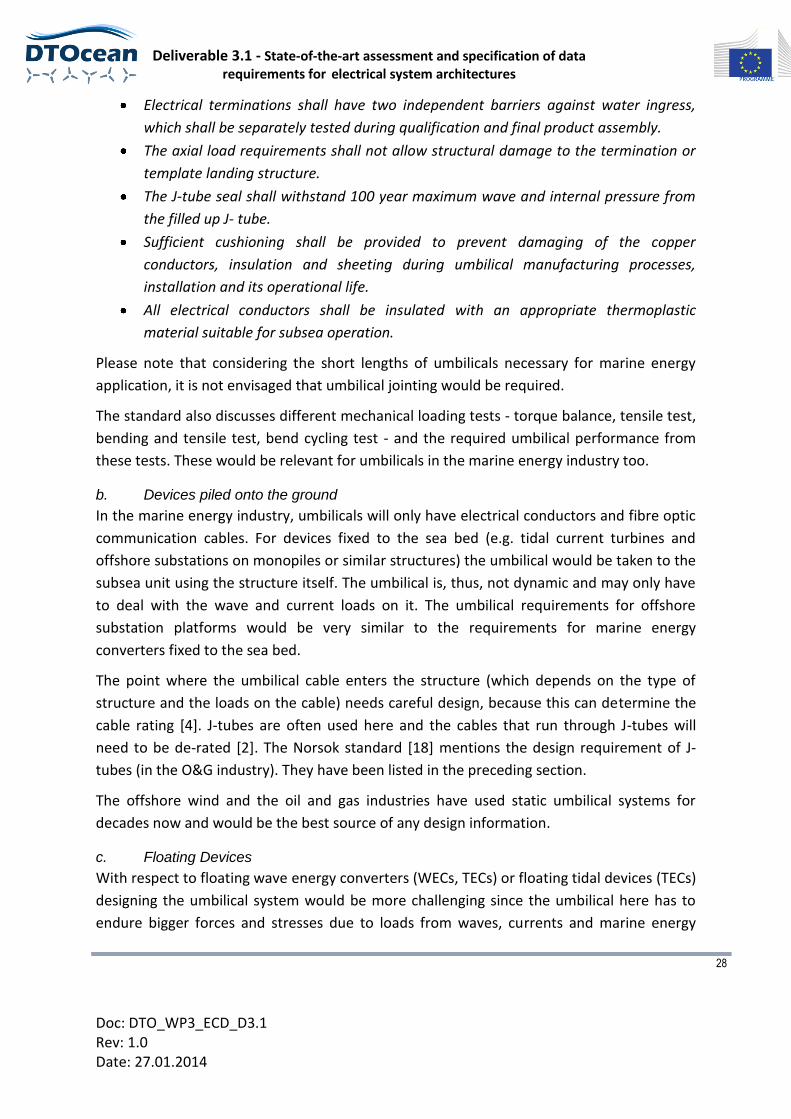
The hydrodynamics of different flexible umbilical configurations for floating structures were
studied in [22]. Figure 12 shows the three options considered. The study focused on the
mechanical loading regimes and fatigue life of umbilical cables for floating WECs. It
concluded that most mechanical failures occur at the attachment/hang off point of the
umbilical. Considering the type of umbilical operation required for floating wave energy
converters, such as buoyancy devices on umbilicals, to reduce stresses, will need to be
studied further.
Figure 12: Umbilical arrangements for floating structures [22].
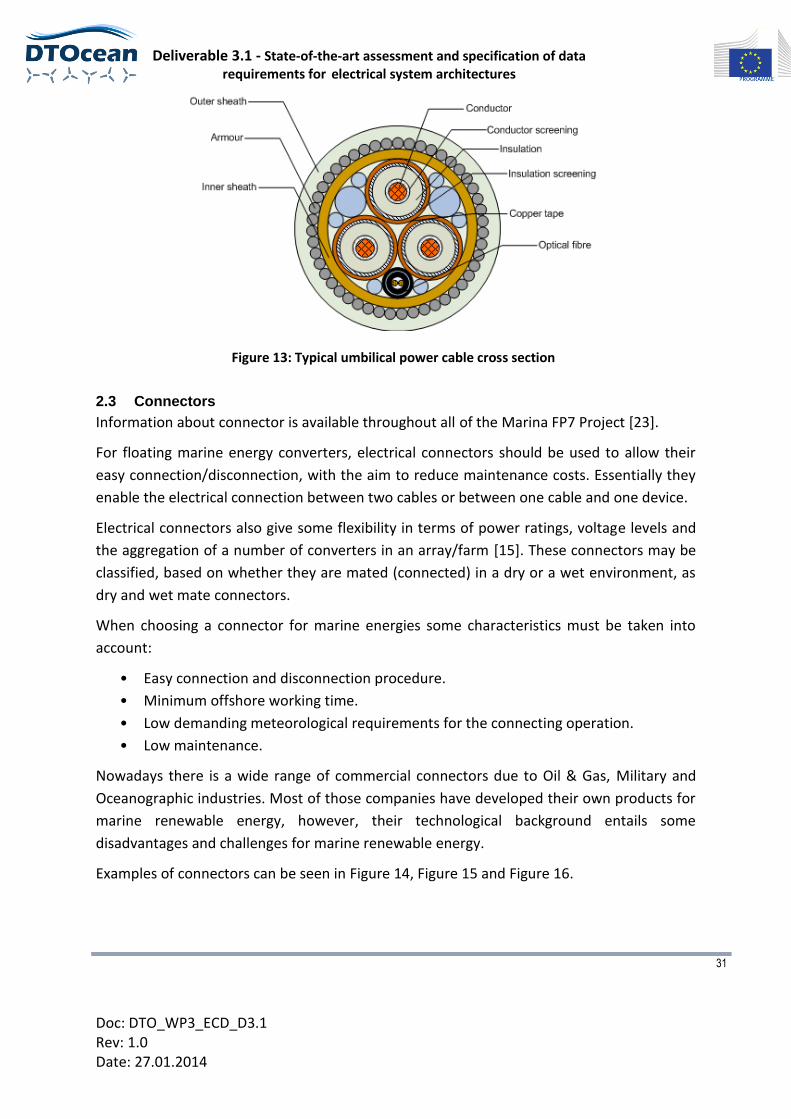
d. Composition of Power Umbilical Cables
Power umbilical cables are generally made up of several layers, whose composition and
relative importance is changing dependent on the application.
Since the primary function is the transmission of electrical power (and possibly
communication or measurement signals) the cross-section (see Figure 13) is generally
composed by one or more central cores containing the conductor.
Each core would require appropriate insulation and possibly a screening layer to keep the
electrical field stress homogeneous. The whole ensemble is typically enveloped within a
sheath.
Armouring is usually required for protection and structural support. Steel armours are
practically always necessary for subsea dynamic cable configurations due to the high
occurring loads. An outer oversheath, generally polymeric, is also necessary for protection
from corrosion of the armour.
Deliverable 3.1 - State-of-the-art assessment and specification of data requirements for electrical system architectures
31
Doc: DTO_WP3_ECD_D3.1 Rev: 1.0 Date: 27.01.2014
Figure 13: Typical umbilical power cable cross section
2.3 Connectors
Information about connector is available throughout all of the Marina FP7 Project [23].
For floating marine energy converters, electrical connectors should be used to allow their
easy connection/disconnection, with the aim to reduce maintenance costs. Essentially they
enable the electrical connection between two cables or between one cable and one device.
Electrical connectors also give some flexibility in terms of power ratings, voltage levels and
the aggregation of a number of converters in an array/farm [15]. These connectors may be
classified, based on whether they are mated (connected) in a dry or a wet environment, as
dry and wet mate connectors.
When choosing a connector for marine energies some characteristics must be taken into
account:
• Easy connection and disconnection procedure.
• Minimum offshore working time.
• Low demanding meteorological requirements for the connecting operation.
• Low maintenance.
Nowadays there is a wide range of commercial connectors due to Oil & Gas, Military and
Oceanographic industries. Most of those companies have developed their own products for
marine renewable energy, however, their technological background entails some
disadvantages and challenges for marine renewable energy.
Examples of connectors can be seen in Figure 14, Figure 15 and Figure 16.
Deliverable 3.1 - State-of-the-art assessment and specification of data requirements for electrical system architectures
32
Doc: DTO_WP3_ECD_D3.1 Rev: 1.0 Date: 27.01.2014
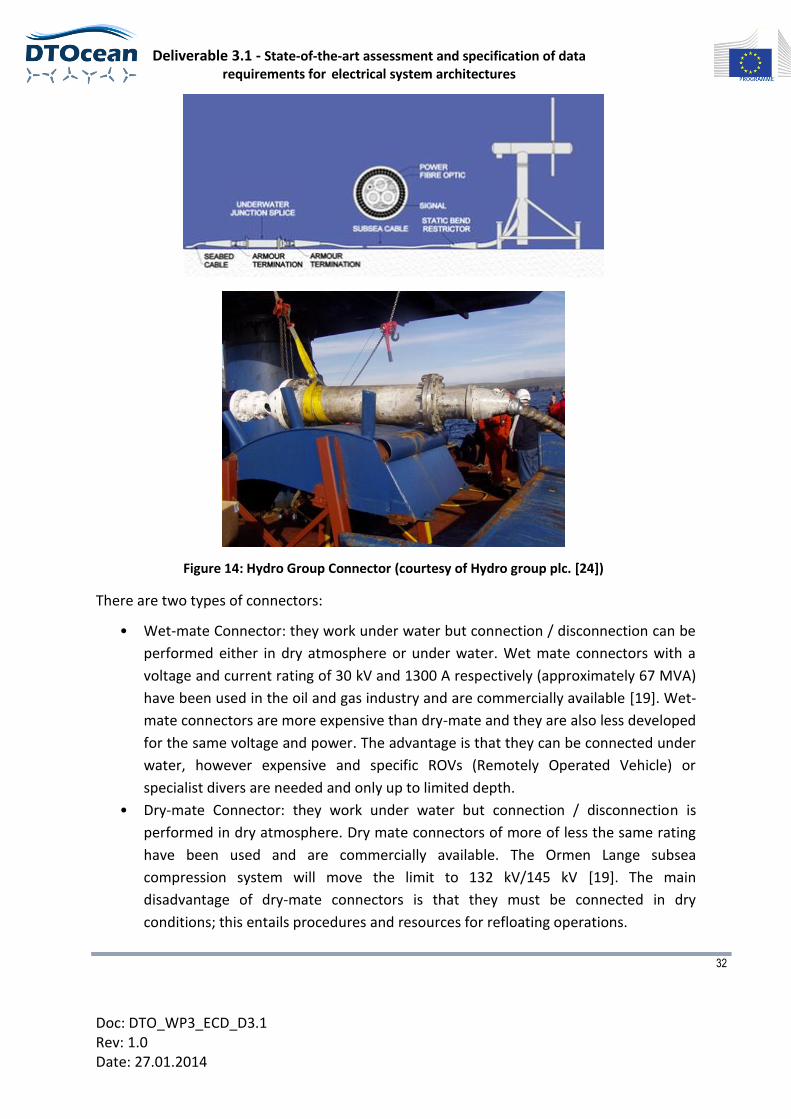
Figure 14: Hydro Group Connector (courtesy of Hydro group plc. [24])
There are two types of connectors:
• Wet-mate Connector: they work under water but connection / disconnection can be
performed either in dry atmosphere or under water. Wet mate connectors with a
voltage and current rating of 30 kV and 1300 A respectively (approximately 67 MVA)
have been used in the oil and gas industry and are commercially available [19]. Wet-
mate connectors are more expensive than dry-mate and they are also less developed
for the same voltage and power. The advantage is that they can be connected under
water, however expensive and specific ROVs (Remotely Operated Vehicle) or
specialist divers are needed and only up to limited depth.
• Dry-mate Connector: they work under water but connection / disconnection is
performed in dry atmosphere. Dry mate connectors of more of less the same rating
have been used and are commercially available. The Ormen Lange subsea
compression system will move the limit to 132 kV/145 kV [19]. The main
disadvantage of dry-mate connectors is that they must be connected in dry
conditions; this entails procedures and resources for refloating operations.
Deliverable 3.1 - State-of-the-art assessment and specification of data requirements for electrical system architectures
33
Doc: DTO_WP3_ECD_D3.1 Rev: 1.0 Date: 27.01.2014
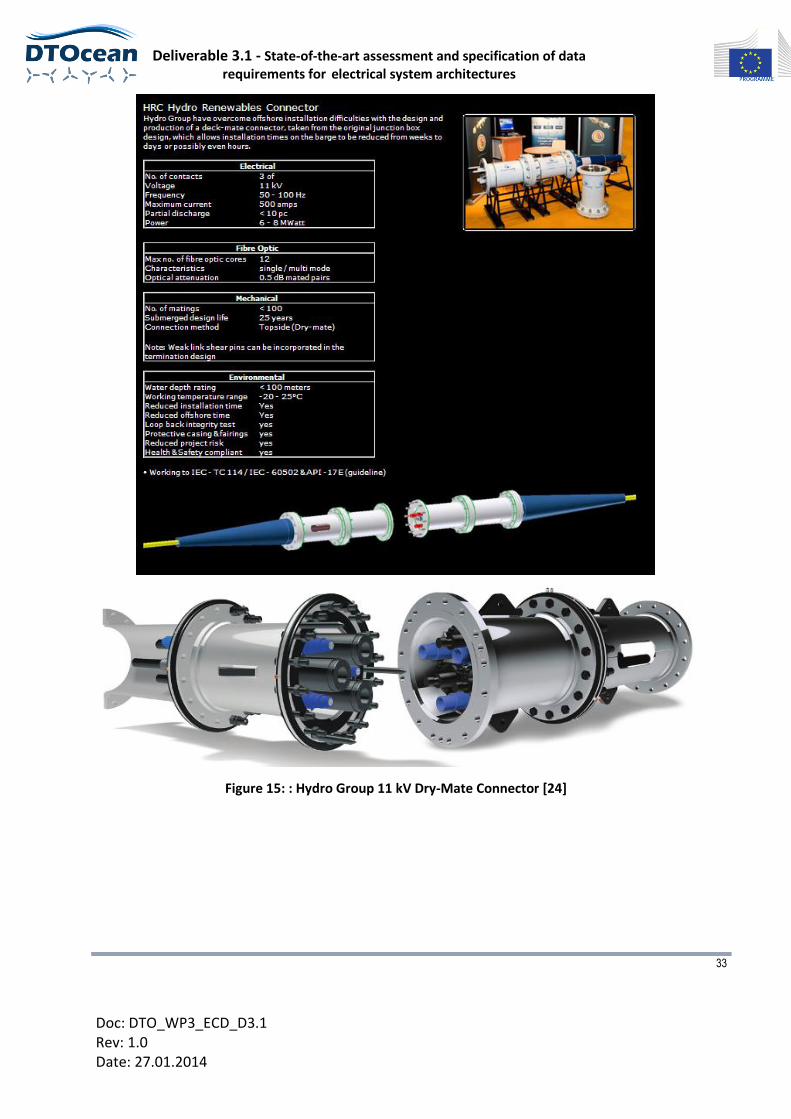
Figure 15: : Hydro Group 11 kV Dry-Mate Connector [24]
Deliverable 3.1 - State-of-the-art assessment and specification of data requirements for electrical system architectures
34
Doc: DTO_WP3_ECD_D3.1 Rev: 1.0 Date: 27.01.2014
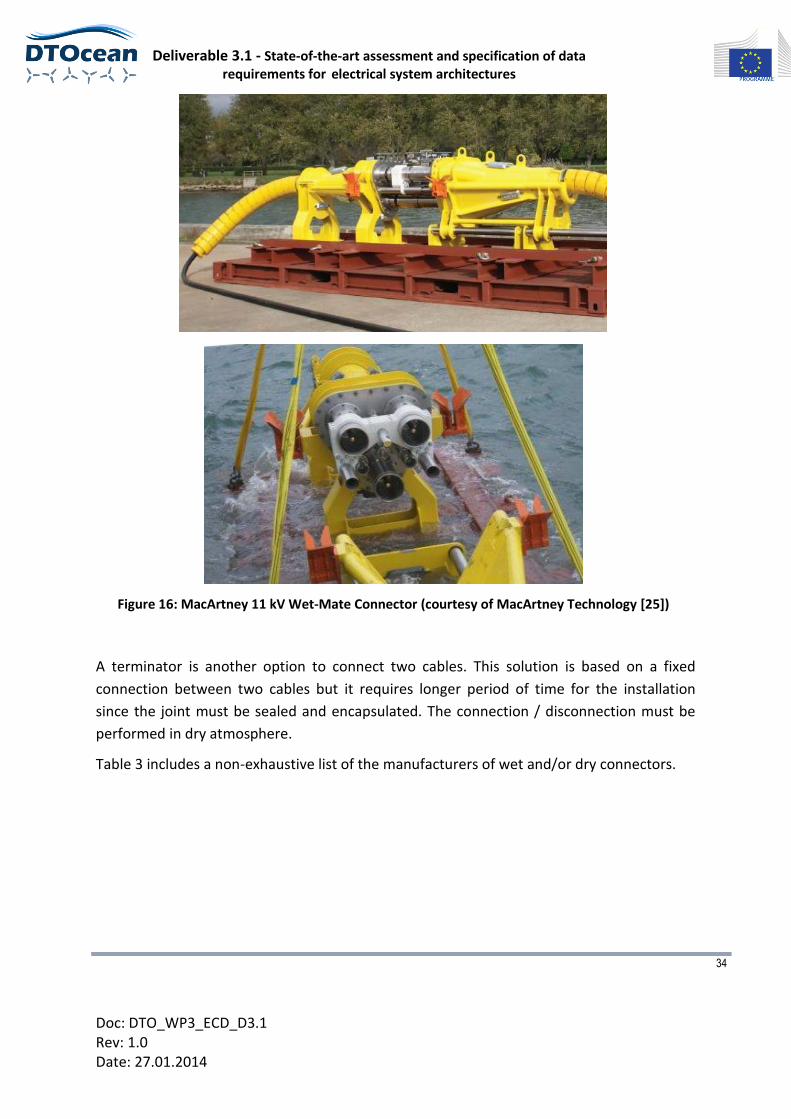
Figure 16: MacArtney 11 kV Wet-Mate Connector (courtesy of MacArtney Technology [25])
A terminator is another option to connect two cables. This solution is based on a fixed
connection between two cables but it requires longer period of time for the installation
since the joint must be sealed and encapsulated. The connection / disconnection must be
performed in dry atmosphere.
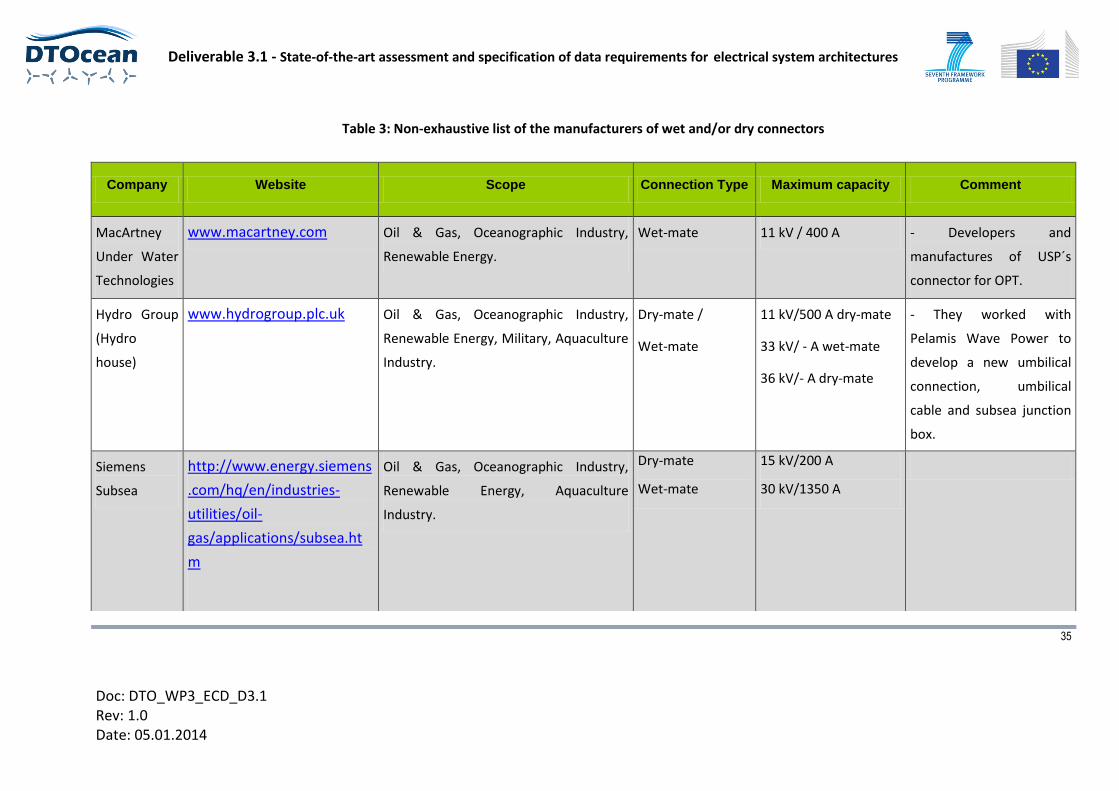
Table 3 includes a non-exhaustive list of the manufacturers of wet and/or dry connectors.
Deliverable 3.1 - State-of-the-art assessment and specification of data requirements for electrical system architectures
35
Doc: DTO_WP3_ECD_D3.1 Rev: 1.0 Date: 05.01.2014
Table 3: Non-exhaustive list of the manufacturers of wet and/or dry connectors
Company Website Scope Connection Type Maximum capacity Comment
MacArtney
Under Water
Technologies
www.macartney.com Oil & Gas, Oceanographic Industry,
Renewable Energy.
Wet-mate 11 kV / 400 A - Developers and
manufactures of USP´s
connector for OPT.
Hydro Group
(Hydro
house)
www.hydrogroup.plc.uk
Oil & Gas, Oceanographic Industry,
Renewable Energy, Military, Aquaculture
Industry.
Dry-mate /
Wet-mate
11 kV/500 A dry-mate
33 kV/ - A wet-mate
36 kV/- A dry-mate
- They worked with
Pelamis Wave Power to
develop a new umbilical
connection, umbilical
cable and subsea junction
box.
Siemens
Subsea
http://www.energy.siemens
.com/hq/en/industries-
utilities/oil-
gas/applications/subsea.ht
m
Oil & Gas, Oceanographic Industry,
Renewable Energy, Aquaculture
Industry.
Dry-mate
Wet-mate
15 kV/200 A
30 kV/1350 A
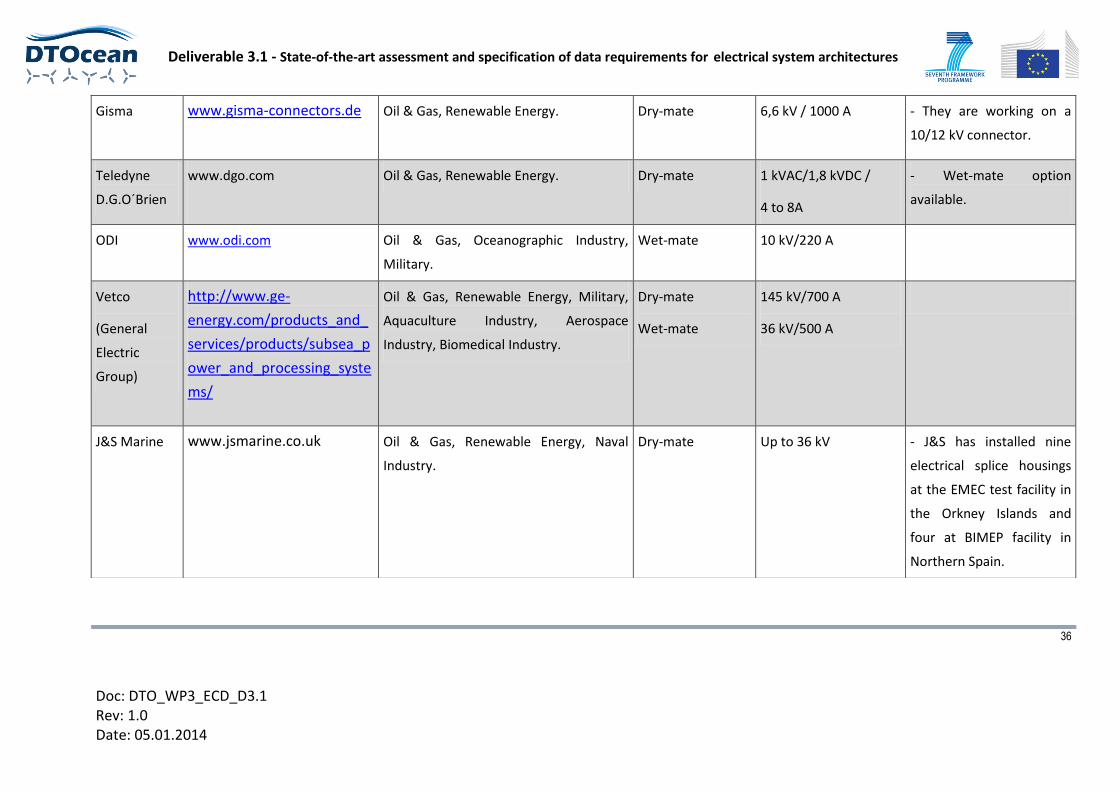
Deliverable 3.1 - State-of-the-art assessment and specification of data requirements for electrical system architectures
36
Doc: DTO_WP3_ECD_D3.1 Rev: 1.0 Date: 05.01.2014
Gisma www.gisma-connectors.de
Oil & Gas, Renewable Energy. Dry-mate 6,6 kV / 1000 A - They are working on a
10/12 kV connector.
Teledyne
D.G.O´Brien
www.dgo.com
Oil & Gas, Renewable Energy. Dry-mate 1 kVAC/1,8 kVDC /
4 to 8A
- Wet-mate option
available.
ODI www.odi.com Oil & Gas, Oceanographic Industry,
Military.
Wet-mate 10 kV/220 A
Vetco
(General
Electric
Group)
http://www.ge-
energy.com/products_and_
services/products/subsea_p
ower_and_processing_syste
ms/
Oil & Gas, Renewable Energy, Military,
Aquaculture Industry, Aerospace
Industry, Biomedical Industry.
Dry-mate
Wet-mate
145 kV/700 A
36 kV/500 A
J&S Marine www.jsmarine.co.uk
Oil & Gas, Renewable Energy, Naval
Industry.
Dry-mate Up to 36 kV - J&S has installed nine
electrical splice housings
at the EMEC test facility in
the Orkney Islands and
four at BIMEP facility in
Northern Spain.
Deliverable 3.1 - State-of-the-art assessment and specification of data requirements for electrical system architectures
37
Doc: DTO_WP3_ECD_D3.1 Rev: 1.0 Date: 05.01.2014
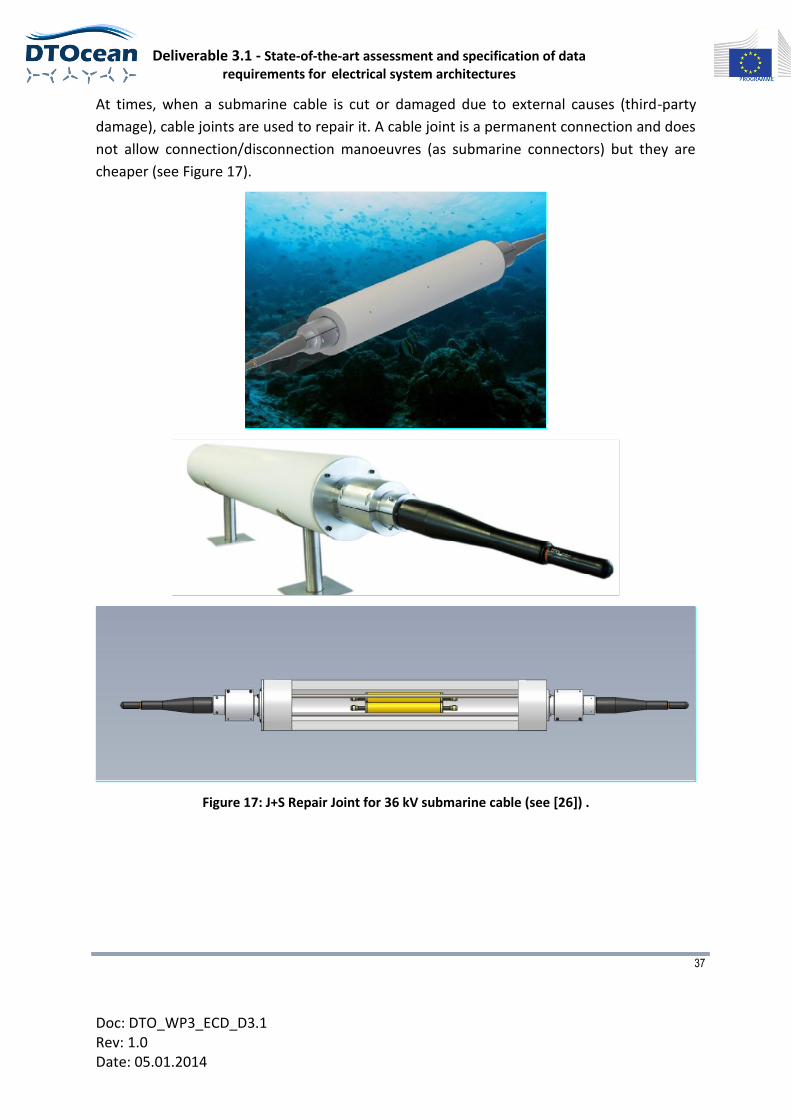
At times, when a submarine cable is cut or damaged due to external causes (third-party
damage), cable joints are used to repair it. A cable joint is a permanent connection and does
not allow connection/disconnection manoeuvres (as submarine connectors) but they are
cheaper (see Figure 17).
Figure 17: J+S Repair Joint for 36 kV submarine cable (see [26]) .
Deliverable 3.1 - State-of-the-art assessment and specification of data requirements for electrical system architectures
2.4 Ancillary components (bend stiffeners, bend restrictors, marking buoys)
2.4.1 Bend stiffeners (Taken from [1])
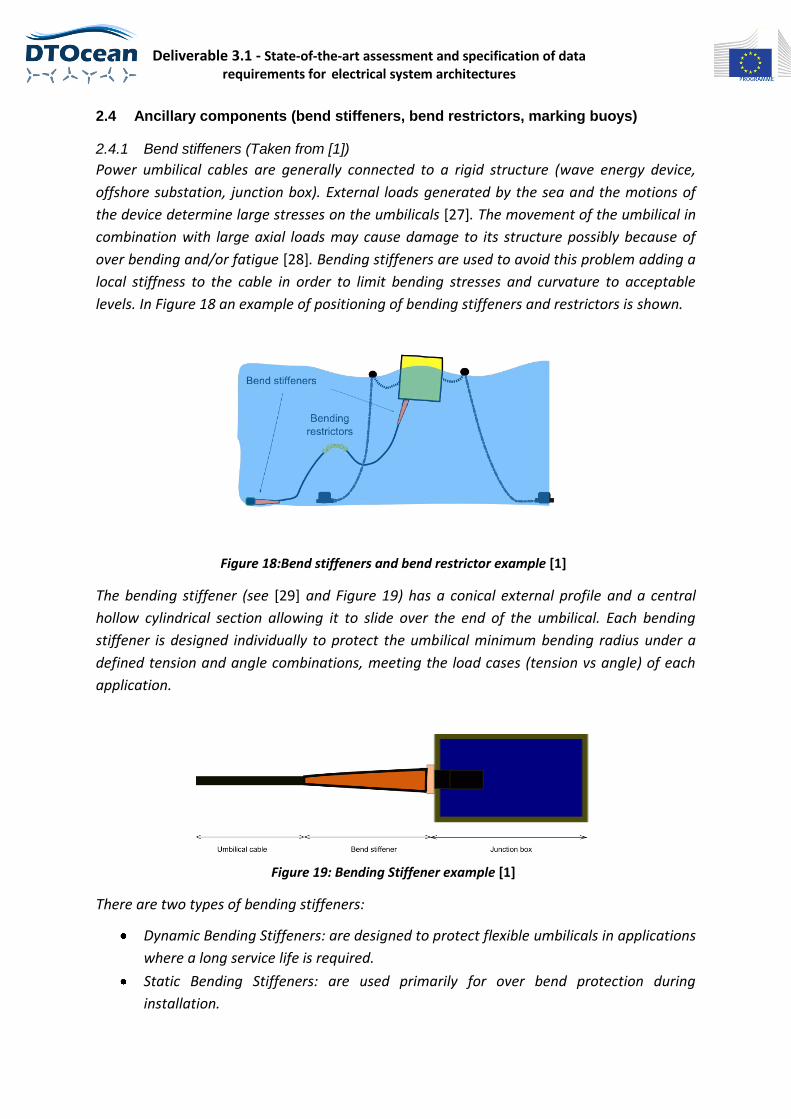
Power umbilical cables are generally connected to a rigid structure (wave energy device,
offshore substation, junction box). External loads generated by the sea and the motions of
the device determine large stresses on the umbilicals [27]. The movement of the umbilical in
combination with large axial loads may cause damage to its structure possibly because of
over bending and/or fatigue [28]. Bending stiffeners are used to avoid this problem adding a
local stiffness to the cable in order to limit bending stresses and curvature to acceptable
levels. In Figure 18 an example of positioning of bending stiffeners and restrictors is shown.
Figure 18:Bend stiffeners and bend restrictor example [1]
The bending stiffener (see [29] and Figure 19) has a conical external profile and a central
hollow cylindrical section allowing it to slide over the end of the umbilical. Each bending
stiffener is designed individually to protect the umbilical minimum bending radius under a
defined tension and angle combinations, meeting the load cases (tension vs angle) of each
application.
Figure 19: Bending Stiffener example [1]
There are two types of bending stiffeners:
Dynamic Bending Stiffeners: are designed to protect flexible umbilicals in applications
where a long service life is required.
Static Bending Stiffeners: are used primarily for over bend protection during
installation.
Deliverable 3.1 - State-of-the-art assessment and specification of data requirements for electrical system architectures
39
Doc: DTO_WP3_ECD_D3.1 Rev: 1.0 Date: 27.01.2014
An alternative to the elastomeric bend stiffener is the Gimbal system [30] which can
accommodate large angular deflexion and high axial load, by separating the axial load
capacity of the assembly from the components.
The bending stiffener body is usually manufactured from moulded polyurethane elastomers.
The typical choice of polyurethane elastomer is based on its low modulus and high
elongation at break.
The main information required for the design of a bending stiffener includes:
Umbilical diameter
Load cases (tensions vs angle)
Operational environment (water)
Interface requirements with load bearing steelwork/end termination
Fatigue loads and cycles. (for dynamic bend stiffener design)
Tension and angle combination. (for dynamic bend stiffener design)
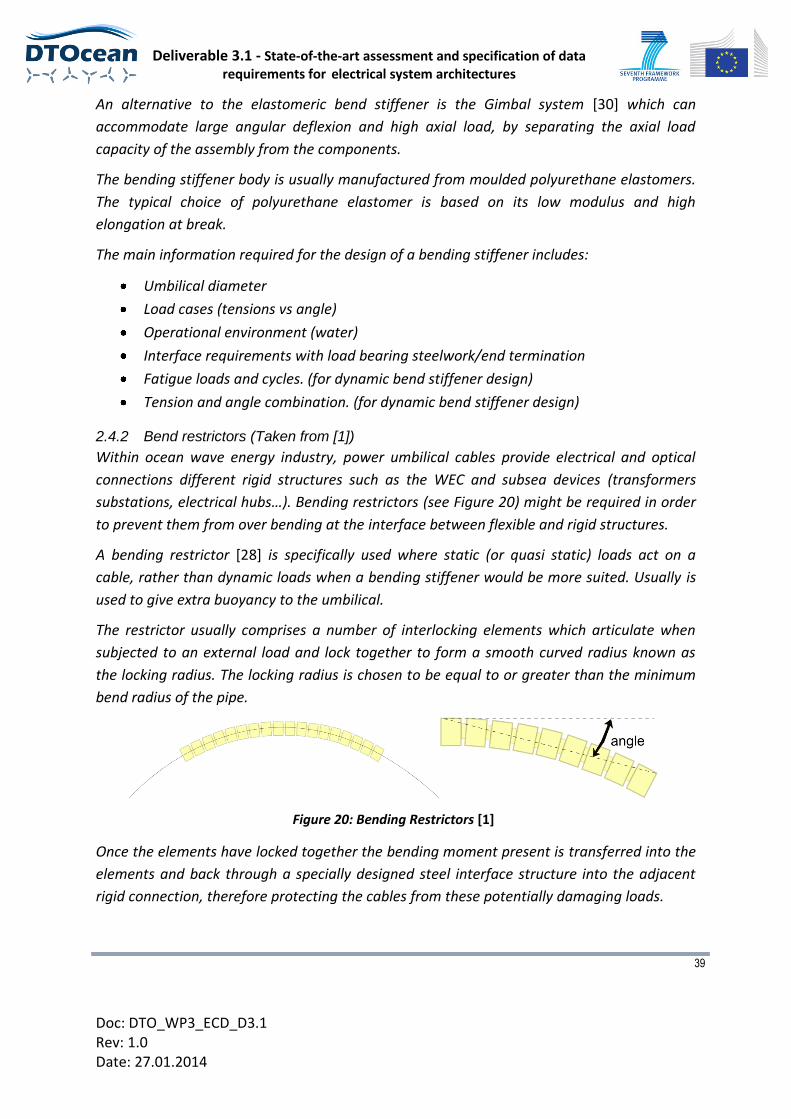
2.4.2 Bend restrictors (Taken from [1])
Within ocean wave energy industry, power umbilical cables provide electrical and optical
connections different rigid structures such as the WEC and subsea devices (transformers
substations, electrical hubs…). Bending restrictors (see Figure 20) might be required in order
to prevent them from over bending at the interface between flexible and rigid structures.
A bending restrictor [28] is specifically used where static (or quasi static) loads act on a
cable, rather than dynamic loads when a bending stiffener would be more suited. Usually is
used to give extra buoyancy to the umbilical.
The restrictor usually comprises a number of interlocking elements which articulate when
subjected to an external load and lock together to form a smooth curved radius known as
the locking radius. The locking radius is chosen to be equal to or greater than the minimum
bend radius of the pipe.
Figure 20: Bending Restrictors [1]
Once the elements have locked together the bending moment present is transferred into the
elements and back through a specially designed steel interface structure into the adjacent
rigid connection, therefore protecting the cables from these potentially damaging loads.

Deliverable 3.1 - State-of-the-art assessment and specification of data requirements for electrical system architectures
40
Doc: DTO_WP3_ECD_D3.1 Rev: 1.0 Date: 27.01.2014
Bending restrictors need to follow some design criteria such as:
Split design, allowing installation of the restrictor after umbilical termination.
Easy installation onshore and offshore.
Neutral buoyant in water, eliminating self-weight loading on the cable.
The main variables and cable parameters to take into account in order to select optimal
bending restrictors for specific utilization are:
Minimum bend radius.
Outside diameter.
Loads (bending moments, shear loads).
Length of coverage.
Operating temperature.
The materials used in the manufacture of the rending restrictor components are:
Elements - structural polyurethane.
Element fasteners - super duplex stainless steel.
Interface steelwork - high strength structured steel.
The structural polyurethane and super duplex stainless steel fasteners are corrosion
resistant in seawater. The interface steelwork is the part of the structure that requires
corrosion protection. This can be provided by a subsea coating system and either
connection to an adjacent cathodic protection system or by attachment of its own
dedicated anodes. For polyurethane elements usually yellow or alternatively orange is used
because both colours provide excellent subsea visibility.
2.4.3 Marking Buoys
Reference [31] highlights the issues to be taken into account when planning and
undertaking voyages in the vicinity of offshore renewable energy installations (OREIs) off the
UK coast.
Visibility will depend on the device type. Some installations are totally submerged while
others may only protrude slightly above the sea surface. Marking will be based on IALA
Recommendation 0-139 [32] on the marking of Man-Made Offshore Structures, including
offshore wave and tidal energy devices, which states that:
“Wave and Tidal energy extraction devices should be marked as a single unit or as a block or
field as follows:
Deliverable 3.1 - State-of-the-art assessment and specification of data requirements for electrical system architectures
41
Doc: DTO_WP3_ECD_D3.1 Rev: 1.0 Date: 27.01.2014
When structures are fixed to the seabed and extend above the surface, they should
be marked in accordance with the IALA recommendations contained in the marking
of offshore wind farms – O-139.
Areas containing surface or sub-surface energy extraction devices (wave and/or tidal)
should be marked by appropriate navigation buoys in accordance with the IALA
Buoyage System, fitted with the corresponding topmarks and lights. In addition,
active or passive radar reflectors, retro reflecting material, racons and/or AIS
transponders should be fitted as the level of traffic and degree of risk requires.
The boundaries of the wave and tidal energy extraction field should be marked by lit
Navigational Lighted Buoys, so as to be visible to the mariner from all relevant
directions in the horizontal plane, by day and by night. Taking the results of a risk
assessment into account, lights should have a nominal range of at least 5 (five)
nautical miles. The northerly, easterly, southerly and westerly boundaries should
normally be marked with the appropriate IALA Cardinal mark. However, depending
on the shape and size of the field, there may be a need to deploy intermediate lateral
or special marks.
In the case of a large or extended energy extraction field, the distance between
navigation buoys that mark the boundary should not normally exceed 3 (three)
nautical miles.
Taking into account environmental considerations, individual wave and tidal energy
devices within a field which extend above the surface should be painted yellow above
the waterline. Depending on the boundary marking, individual devices within the
field need not be marked. However, if marked, they should have flashing yellow lights
so as to be visible to the mariner from all relevant directions in the horizontal plane.
The flash character of such lights should be sufficiently different from those displayed
on the boundary lights with a range of not less than 2 nautical miles.
Consideration should be given to the provision of AIS as an Aid to Navigation (IALA
Recommendation A-126) on selected peripheral wave and/or tidal energy devices.
A single wave and/or tidal energy extraction structure, standing alone, that extends
above the surface should be painted black, with red horizontal bands, and should be
marked as an Isolated Danger as described in the IALA Maritime Buoyage System.
If a single wave and/or tidal energy device which is not visible above the surface but
is considered to be a hazard to surface navigation, it should be marked by an IALA
special mark yellow buoy with flashing yellow light with a range of not less than 5
nautical miles, in accordance with the IALA Buoyage System. It should also be noted
that many tidal concepts have fast-moving sub-surface elements such as whirling
blades.
Deliverable 3.1 - State-of-the-art assessment and specification of data requirements for electrical system architectures
42
Doc: DTO_WP3_ECD_D3.1 Rev: 1.0 Date: 27.01.2014
The Aids to Navigation described herein should comply with IALA Recommendations
and have an appropriate availability, normally not less than 99.0% (IALA Category 2).
The relevant Hydrographic Office should be informed of the establishment of an
energy extraction device or field, to permit appropriate charting of same.
Notices to Mariners should be issued to publicise the establishment of a wave and/or
tidal energy device or field. The Notice to Mariners should include the marking,
location and extent of such devices/fields.
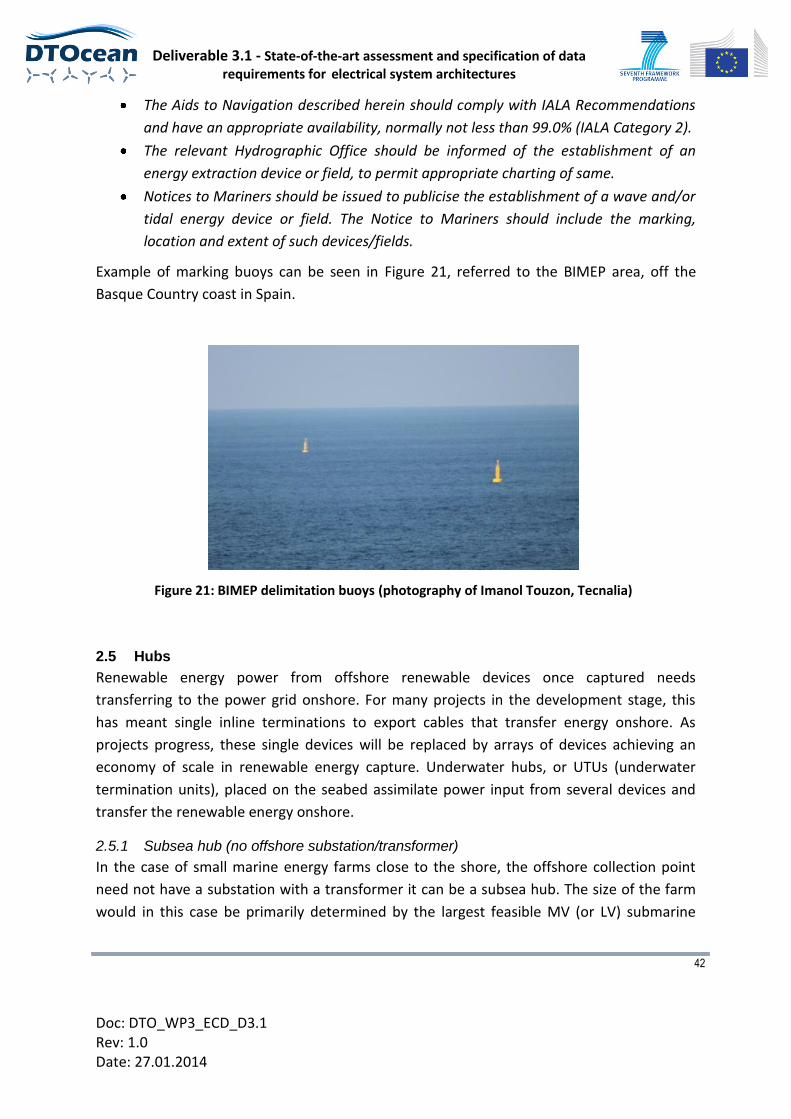
Example of marking buoys can be seen in Figure 21, referred to the BIMEP area, off the
Basque Country coast in Spain.
Figure 21: BIMEP delimitation buoys (photography of Imanol Touzon, Tecnalia)
2.5 Hubs
Renewable energy power from offshore renewable devices once captured needs
transferring to the power grid onshore. For many projects in the development stage, this
has meant single inline terminations to export cables that transfer energy onshore. As
projects progress, these single devices will be replaced by arrays of devices achieving an
economy of scale in renewable energy capture. Underwater hubs, or UTUs (underwater
termination units), placed on the seabed assimilate power input from several devices and
transfer the renewable energy onshore.
2.5.1 Subsea hub (no offshore substation/transformer)
In the case of small marine energy farms close to the shore, the offshore collection point
need not have a substation with a transformer it can be a subsea hub. The size of the farm
would in this case be primarily determined by the largest feasible MV (or LV) submarine
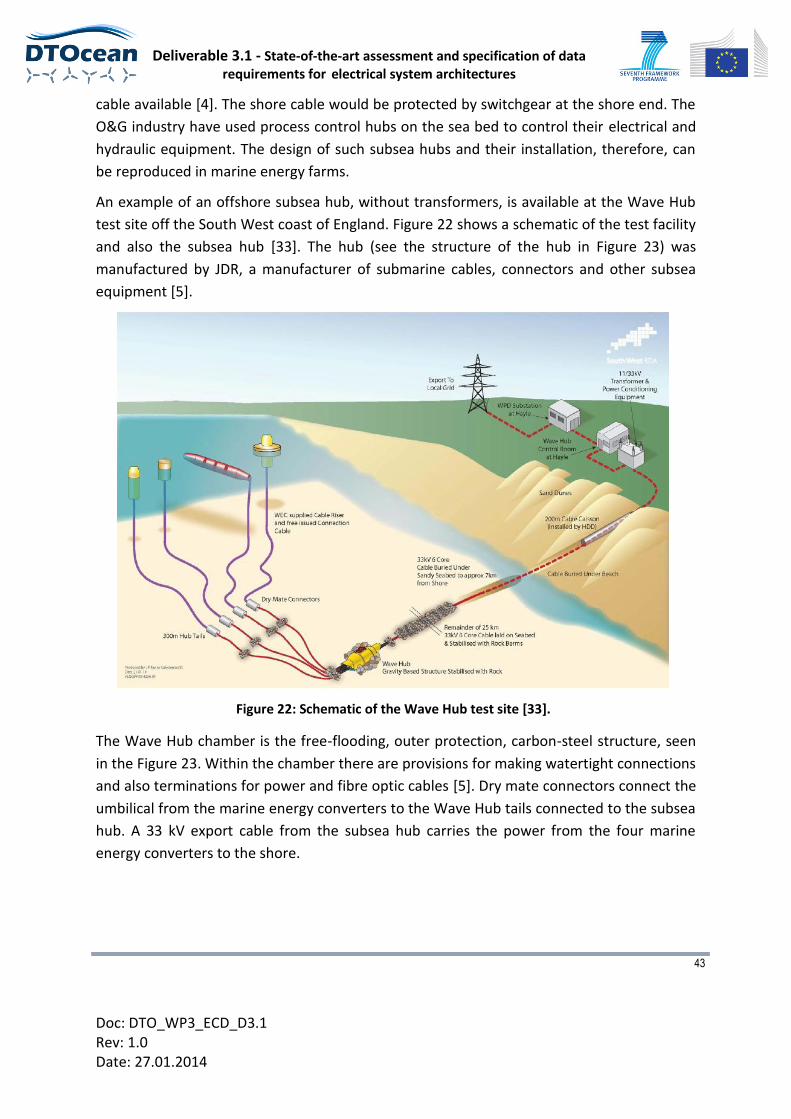
Deliverable 3.1 - State-of-the-art assessment and specification of data requirements for electrical system architectures
43
Doc: DTO_WP3_ECD_D3.1 Rev: 1.0 Date: 27.01.2014
cable available [4]. The shore cable would be protected by switchgear at the shore end. The
O&G industry have used process control hubs on the sea bed to control their electrical and
hydraulic equipment. The design of such subsea hubs and their installation, therefore, can
be reproduced in marine energy farms.
An example of an offshore subsea hub, without transformers, is available at the Wave Hub
test site off the South West coast of England. Figure 22 shows a schematic of the test facility
and also the subsea hub [33]. The hub (see the structure of the hub in Figure 23) was
manufactured by JDR, a manufacturer of submarine cables, connectors and other subsea
equipment [5].
Figure 22: Schematic of the Wave Hub test site [33].
The Wave Hub chamber is the free-flooding, outer protection, carbon-steel structure, seen
in the Figure 23. Within the chamber there are provisions for making watertight connections
and also terminations for power and fibre optic cables [5]. Dry mate connectors connect the
umbilical from the marine energy converters to the Wave Hub tails connected to the subsea
hub. A 33 kV export cable from the subsea hub carries the power from the four marine
energy converters to the shore.

Deliverable 3.1 - State-of-the-art assessment and specification of data requirements for electrical system architectures
44
Doc: DTO_WP3_ECD_D3.1 Rev: 1.0 Date: 27.01.2014
Figure 23: Wave Hub structure [33]
MacArtney has also in the market a modular hub (see Figure 24) with the following
specifications:
Standard working voltage range: 6 - 36kV
Up to 1250 amp.
Conductor range: 35 – 630mm2
Working depth: 100m
Material: S355, painted and corrosion protected
Other materials available on request
Lifetime submerged: 5 years, depending on demands and maintenance scheduling
Straight line pull SWL: 100kn per termination
Pull out / lift SWL: 50t
The hub can be supplied with switch gear or switch gear with protection
The hub can be dry, oil, gel or nitrogen filled as required
Figure 24: MacArtney Hub (courtesy of MacArtney [25])
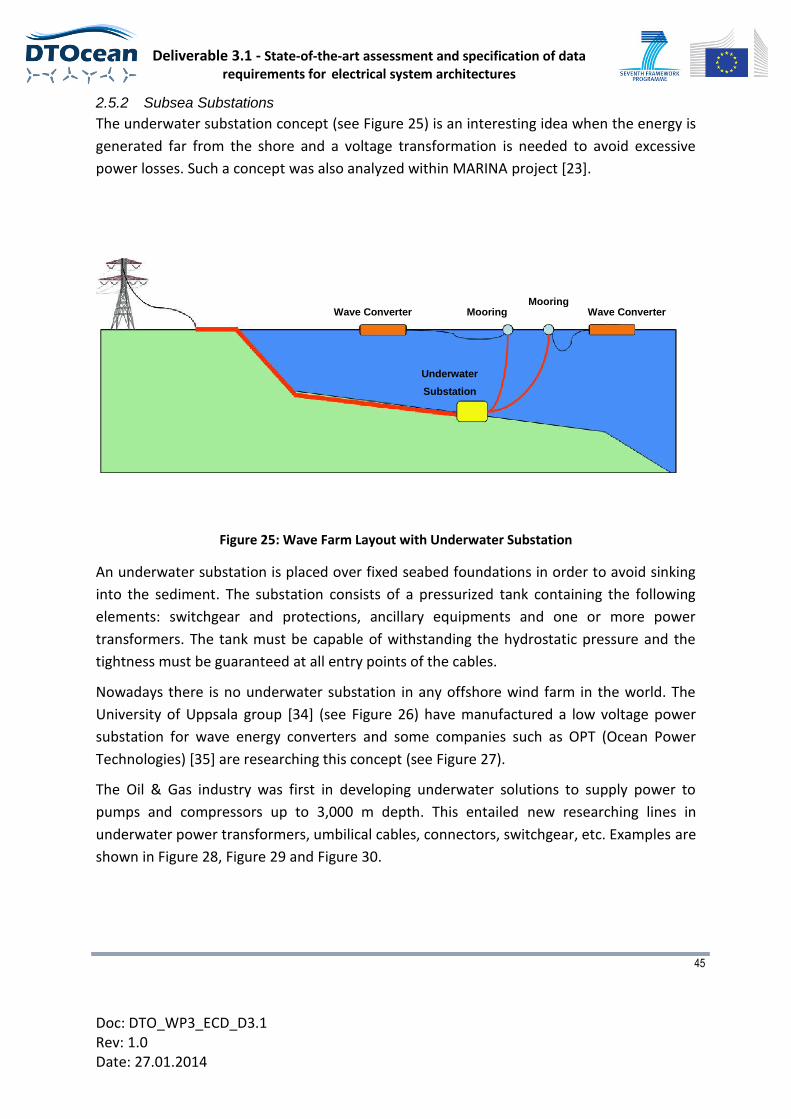
Deliverable 3.1 - State-of-the-art assessment and specification of data requirements for electrical system architectures
45
Doc: DTO_WP3_ECD_D3.1 Rev: 1.0 Date: 27.01.2014
2.5.2 Subsea Substations
The underwater substation concept (see Figure 25) is an interesting idea when the energy is
generated far from the shore and a voltage transformation is needed to avoid excessive
power losses. Such a concept was also analyzed within MARINA project [23].
Figure 25: Wave Farm Layout with Underwater Substation
An underwater substation is placed over fixed seabed foundations in order to avoid sinking
into the sediment. The substation consists of a pressurized tank containing the following
elements: switchgear and protections, ancillary equipments and one or more power
transformers. The tank must be capable of withstanding the hydrostatic pressure and the
tightness must be guaranteed at all entry points of the cables.
Nowadays there is no underwater substation in any offshore wind farm in the world. The
University of Uppsala group [34] (see Figure 26) have manufactured a low voltage power
substation for wave energy converters and some companies such as OPT (Ocean Power
Technologies) [35] are researching this concept (see Figure 27).
The Oil & Gas industry was first in developing underwater solutions to supply power to
pumps and compressors up to 3,000 m depth. This entailed new researching lines in
underwater power transformers, umbilical cables, connectors, switchgear, etc. Examples are
shown in Figure 28, Figure 29 and Figure 30.
Mooring Mooring
Wave Converter Wave Converter
Underwater
Substation
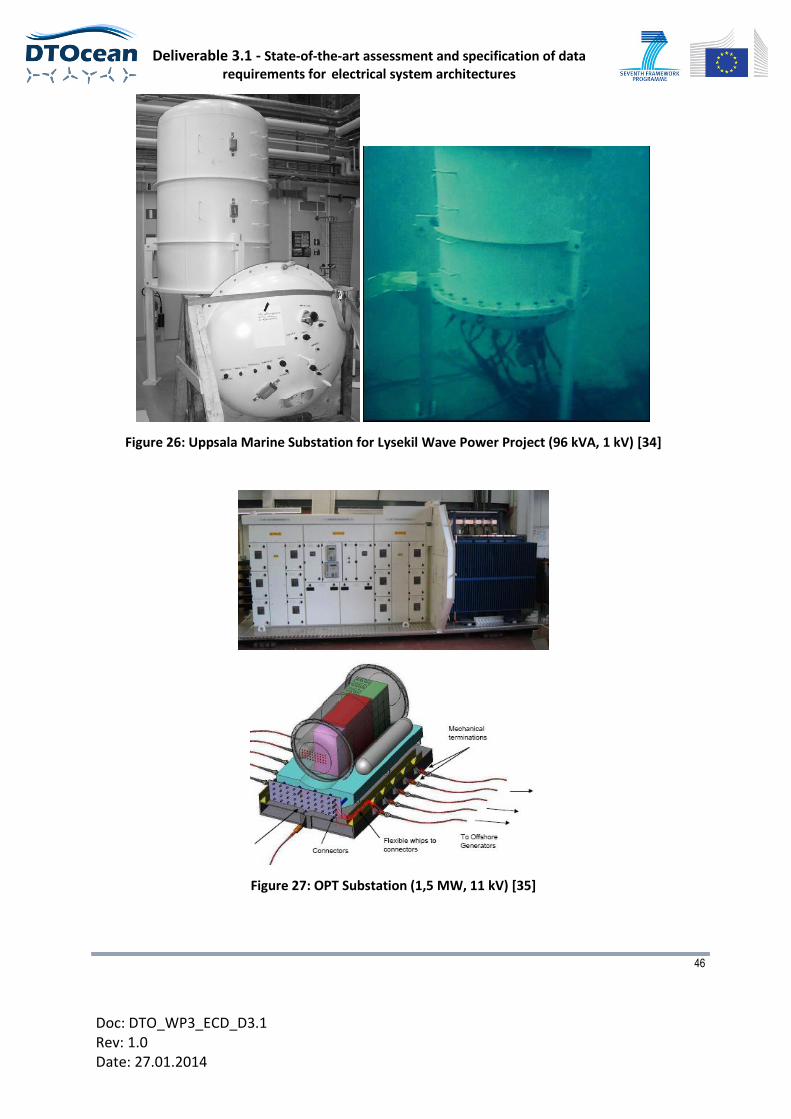
Deliverable 3.1 - State-of-the-art assessment and specification of data requirements for electrical system architectures
46
Doc: DTO_WP3_ECD_D3.1 Rev: 1.0 Date: 27.01.2014
Figure 26: Uppsala Marine Substation for Lysekil Wave Power Project (96 kVA, 1 kV) [34]
Figure 27: OPT Substation (1,5 MW, 11 kV) [35]
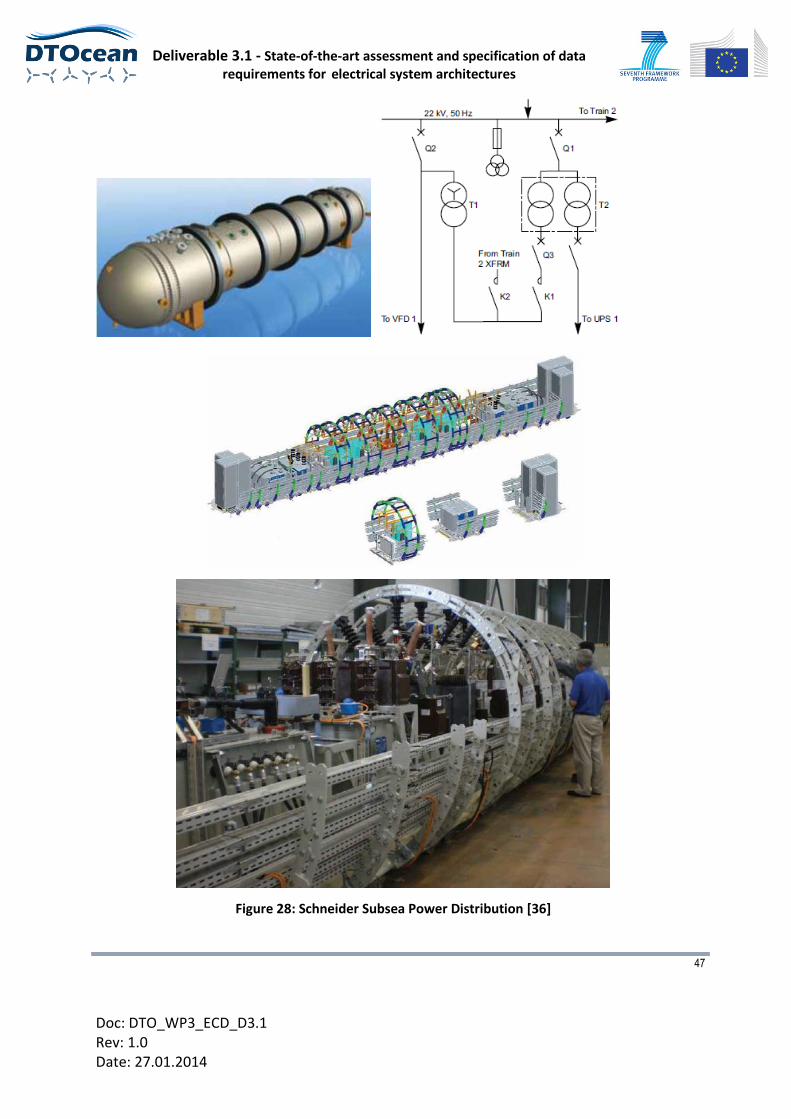
Deliverable 3.1 - State-of-the-art assessment and specification of data requirements for electrical system architectures
47
Doc: DTO_WP3_ECD_D3.1 Rev: 1.0 Date: 27.01.2014
Figure 28: Schneider Subsea Power Distribution [36]
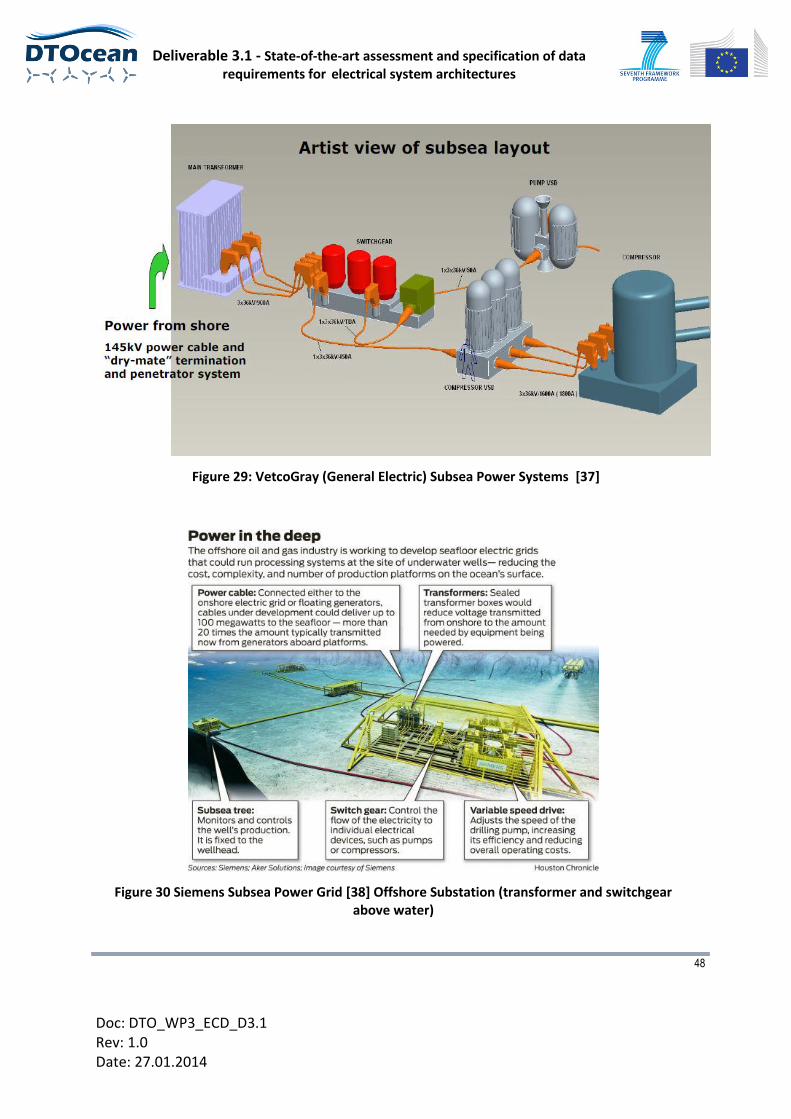
Deliverable 3.1 - State-of-the-art assessment and specification of data requirements for electrical system architectures
48
Doc: DTO_WP3_ECD_D3.1 Rev: 1.0 Date: 27.01.2014
Figure 29: VetcoGray (General Electric) Subsea Power Systems [37]
Figure 30 Siemens Subsea Power Grid [38] Offshore Substation (transformer and switchgear above water)
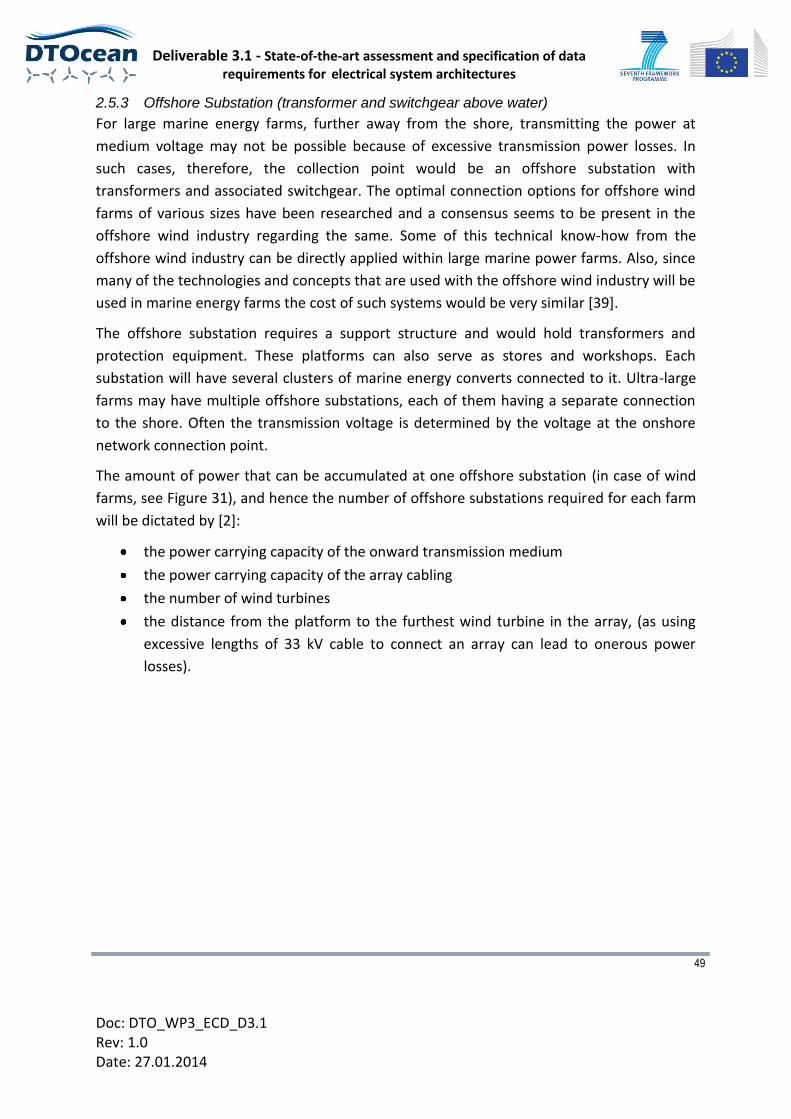
Deliverable 3.1 - State-of-the-art assessment and specification of data requirements for electrical system architectures
49
Doc: DTO_WP3_ECD_D3.1 Rev: 1.0 Date: 27.01.2014
2.5.3 Offshore Substation (transformer and switchgear above water)
For large marine energy farms, further away from the shore, transmitting the power at
medium voltage may not be possible because of excessive transmission power losses. In
such cases, therefore, the collection point would be an offshore substation with
transformers and associated switchgear. The optimal connection options for offshore wind
farms of various sizes have been researched and a consensus seems to be present in the
offshore wind industry regarding the same. Some of this technical know-how from the
offshore wind industry can be directly applied within large marine power farms. Also, since
many of the technologies and concepts that are used with the offshore wind industry will be
used in marine energy farms the cost of such systems would be very similar [39].
The offshore substation requires a support structure and would hold transformers and
protection equipment. These platforms can also serve as stores and workshops. Each
substation will have several clusters of marine energy converts connected to it. Ultra-large
farms may have multiple offshore substations, each of them having a separate connection
to the shore. Often the transmission voltage is determined by the voltage at the onshore
network connection point.
The amount of power that can be accumulated at one offshore substation (in case of wind
farms, see Figure 31), and hence the number of offshore substations required for each farm
will be dictated by [2]:
the power carrying capacity of the onward transmission medium
the power carrying capacity of the array cabling
the number of wind turbines
the distance from the platform to the furthest wind turbine in the array, (as using
excessive lengths of 33 kV cable to connect an array can lead to onerous power
losses).
Deliverable 3.1 - State-of-the-art assessment and specification of data requirements for electrical system architectures
50
Doc: DTO_WP3_ECD_D3.1 Rev: 1.0 Date: 27.01.2014
Figure 31: Baltic 1 Offshore Wind Farm (Germany)
2.6 Transformers & Switchgear
2.6.1 Transformers
Recommendations on transformers used in offshore substations and in the device [4] (from
the offshore wind industry):
The IEE offshore regulations forbid oil-filled transformers, because of the risk of fire.
Other liquid-filled transformers must have a bund to prevent discharges to sea.
The GL rules prefer dry-type transformers, but do not forbid oil-filled units for
offshore wind.
Offshore wind farms built to the date of the reference have used both liquid and dry-
type transformers [3]. In the future though, it is envisaged that cast-resin
transformers, with a narrower structure easier for integration or removal, will find
widespread use in the offshore wind. The experience with respect to offshore
substation transformers from the offshore wind industry will play a vital role in the
development of marine energy farms too.
Through a detailed cost-benefit analysis study of offshore wind farms of different sizes it
was found that the maximum rating of a single transformer substation for offshore platform
is 90 MW [3]. The minimum rating for a multi-transformer substation is 50% of the wind
farm rating. References [3] and [2] recommend no full redundancy, with respect to offshore
substation transformers, and ask for the installation of the minimum number of
transformers required. They also add that the capacity of the transformer can be less than
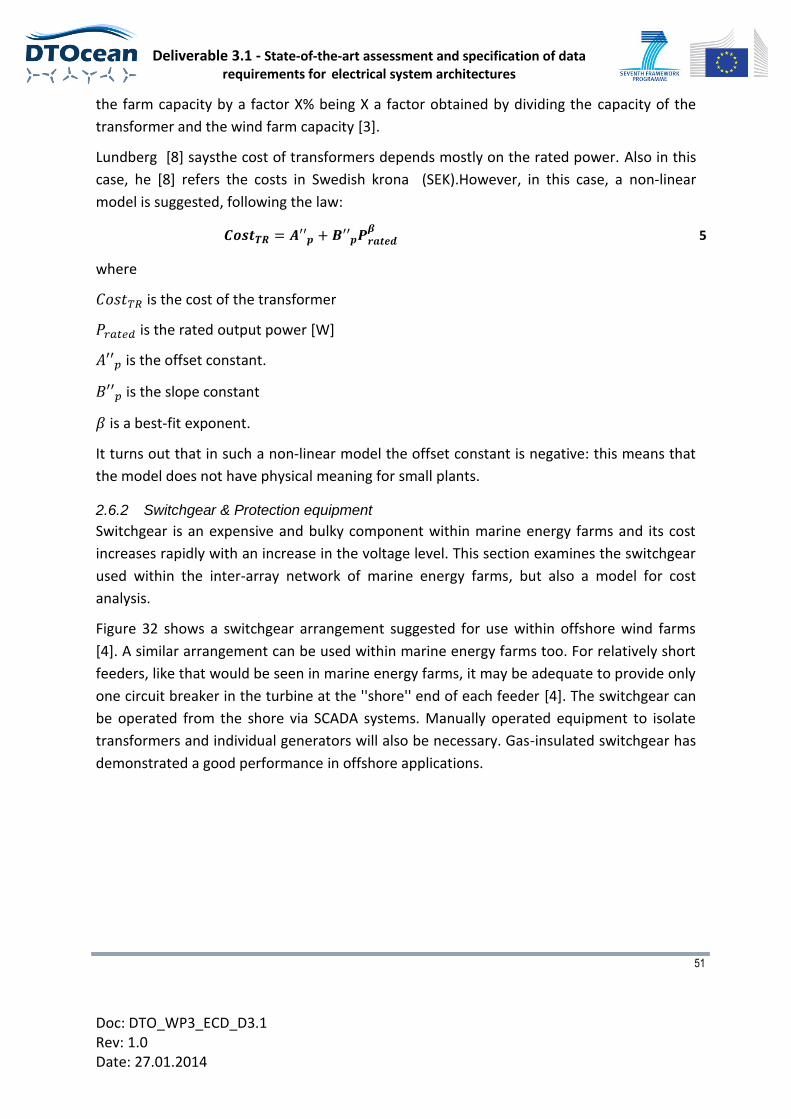
Deliverable 3.1 - State-of-the-art assessment and specification of data requirements for electrical system architectures
51
Doc: DTO_WP3_ECD_D3.1 Rev: 1.0 Date: 27.01.2014
the farm capacity by a factor X% being X a factor obtained by dividing the capacity of the
transformer and the wind farm capacity [3].
Lundberg [8] saysthe cost of transformers depends mostly on the rated power. Also in this
case, he [8] refers the costs in Swedish krona (SEK).However, in this case, a non-linear
model is suggested, following the law:
5
where
is the cost of the transformer
is the rated output power [W]
is the offset constant.
is the slope constant
is a best-fit exponent.
It turns out that in such a non-linear model the offset constant is negative: this means that
the model does not have physical meaning for small plants.
2.6.2 Switchgear & Protection equipment
Switchgear is an expensive and bulky component within marine energy farms and its cost
increases rapidly with an increase in the voltage level. This section examines the switchgear
used within the inter-array network of marine energy farms, but also a model for cost
analysis.
Figure 32 shows a switchgear arrangement suggested for use within offshore wind farms
[4]. A similar arrangement can be used within marine energy farms too. For relatively short
feeders, like that would be seen in marine energy farms, it may be adequate to provide only
one circuit breaker in the turbine at the ''shore'' end of each feeder [4]. The switchgear can
be operated from the shore via SCADA systems. Manually operated equipment to isolate
transformers and individual generators will also be necessary. Gas-insulated switchgear has
demonstrated a good performance in offshore applications.
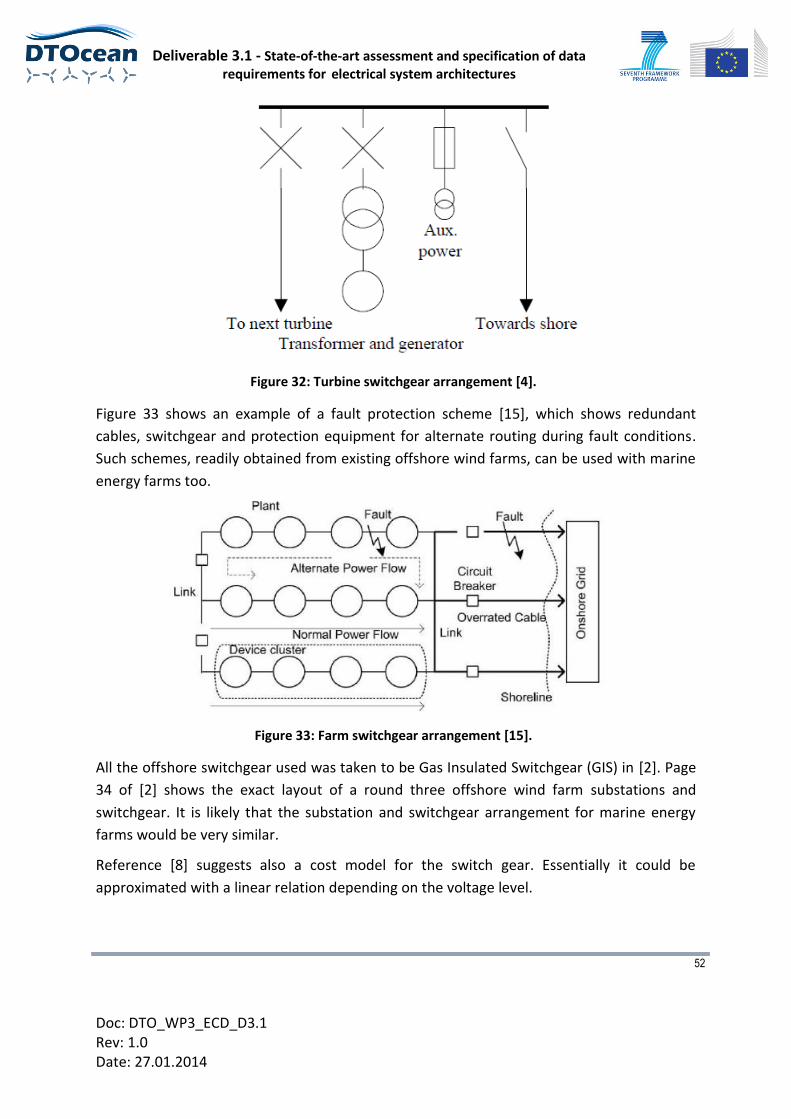
Deliverable 3.1 - State-of-the-art assessment and specification of data requirements for electrical system architectures
52
Doc: DTO_WP3_ECD_D3.1 Rev: 1.0 Date: 27.01.2014
Figure 32: Turbine switchgear arrangement [4].
Figure 33 shows an example of a fault protection scheme [15], which shows redundant
cables, switchgear and protection equipment for alternate routing during fault conditions.
Such schemes, readily obtained from existing offshore wind farms, can be used with marine
energy farms too.
Figure 33: Farm switchgear arrangement [15].
All the offshore switchgear used was taken to be Gas Insulated Switchgear (GIS) in [2]. Page
34 of [2] shows the exact layout of a round three offshore wind farm substations and
switchgear. It is likely that the substation and switchgear arrangement for marine energy
farms would be very similar.
Reference [8] suggests also a cost model for the switch gear. Essentially it could be
approximated with a linear relation depending on the voltage level.
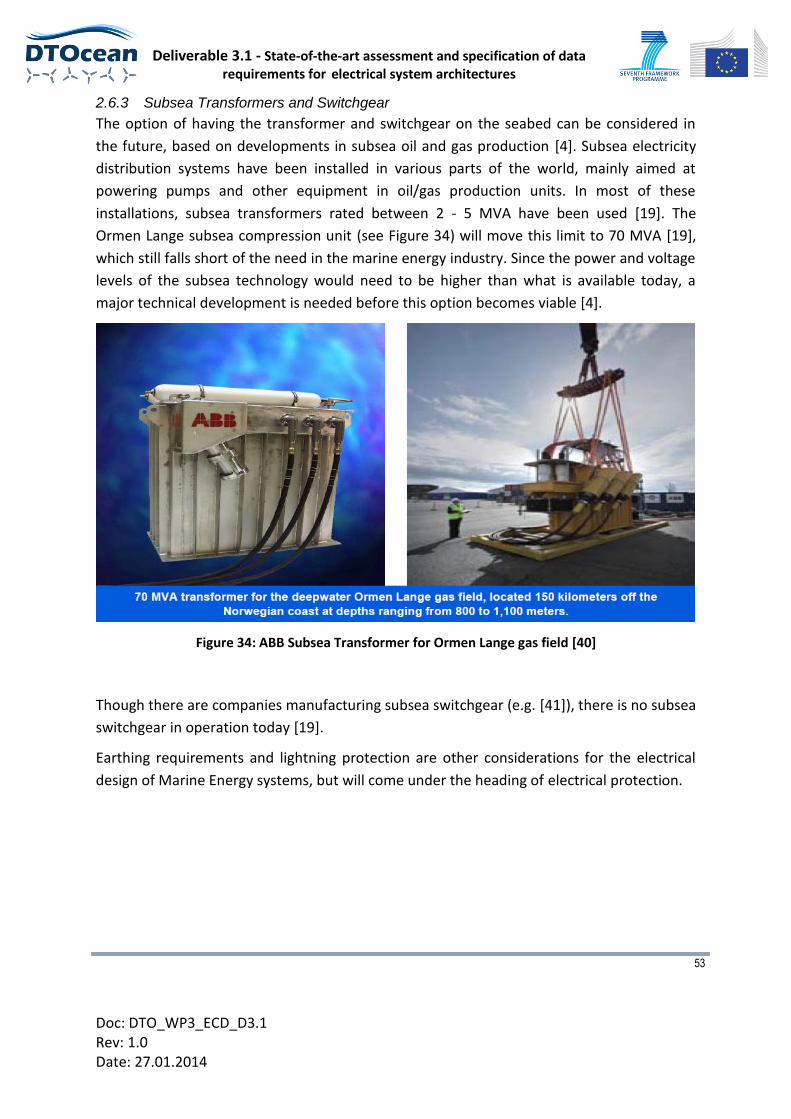
Deliverable 3.1 - State-of-the-art assessment and specification of data requirements for electrical system architectures
53
Doc: DTO_WP3_ECD_D3.1 Rev: 1.0 Date: 27.01.2014
2.6.3 Subsea Transformers and Switchgear
The option of having the transformer and switchgear on the seabed can be considered in
the future, based on developments in subsea oil and gas production [4]. Subsea electricity
distribution systems have been installed in various parts of the world, mainly aimed at
powering pumps and other equipment in oil/gas production units. In most of these
installations, subsea transformers rated between 2 - 5 MVA have been used [19]. The
Ormen Lange subsea compression unit (see Figure 34) will move this limit to 70 MVA [19],
which still falls short of the need in the marine energy industry. Since the power and voltage
levels of the subsea technology would need to be higher than what is available today, a
major technical development is needed before this option becomes viable [4].
Figure 34: ABB Subsea Transformer for Ormen Lange gas field [40]
Though there are companies manufacturing subsea switchgear (e.g. [41]), there is no subsea
switchgear in operation today [19].
Earthing requirements and lightning protection are other considerations for the electrical
design of Marine Energy systems, but will come under the heading of electrical protection.
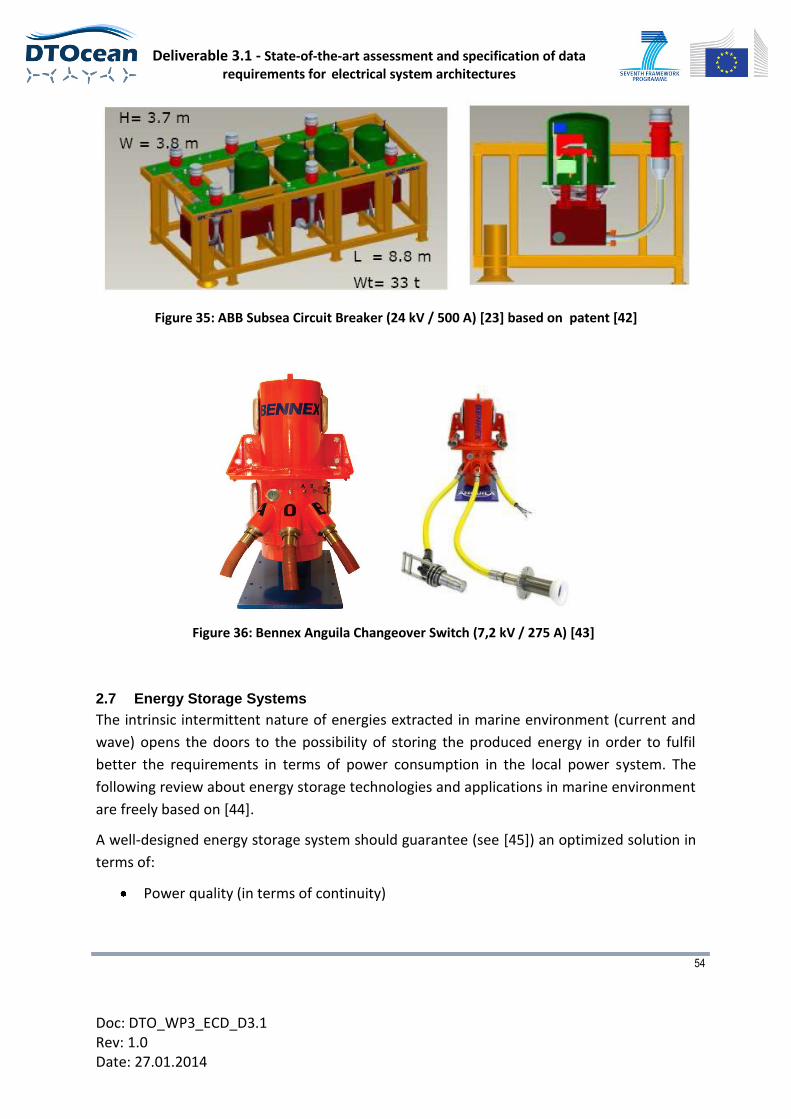
Deliverable 3.1 - State-of-the-art assessment and specification of data requirements for electrical system architectures
54
Doc: DTO_WP3_ECD_D3.1 Rev: 1.0 Date: 27.01.2014
Figure 35: ABB Subsea Circuit Breaker (24 kV / 500 A) [23] based on patent [42]
Figure 36: Bennex Anguila Changeover Switch (7,2 kV / 275 A) [43]
2.7 Energy Storage Systems
The intrinsic intermittent nature of energies extracted in marine environment (current and
wave) opens the doors to the possibility of storing the produced energy in order to fulfil
better the requirements in terms of power consumption in the local power system. The
following review about energy storage technologies and applications in marine environment
are freely based on [44].
A well-designed energy storage system should guarantee (see [45]) an optimized solution in
terms of:
Power quality (in terms of continuity)
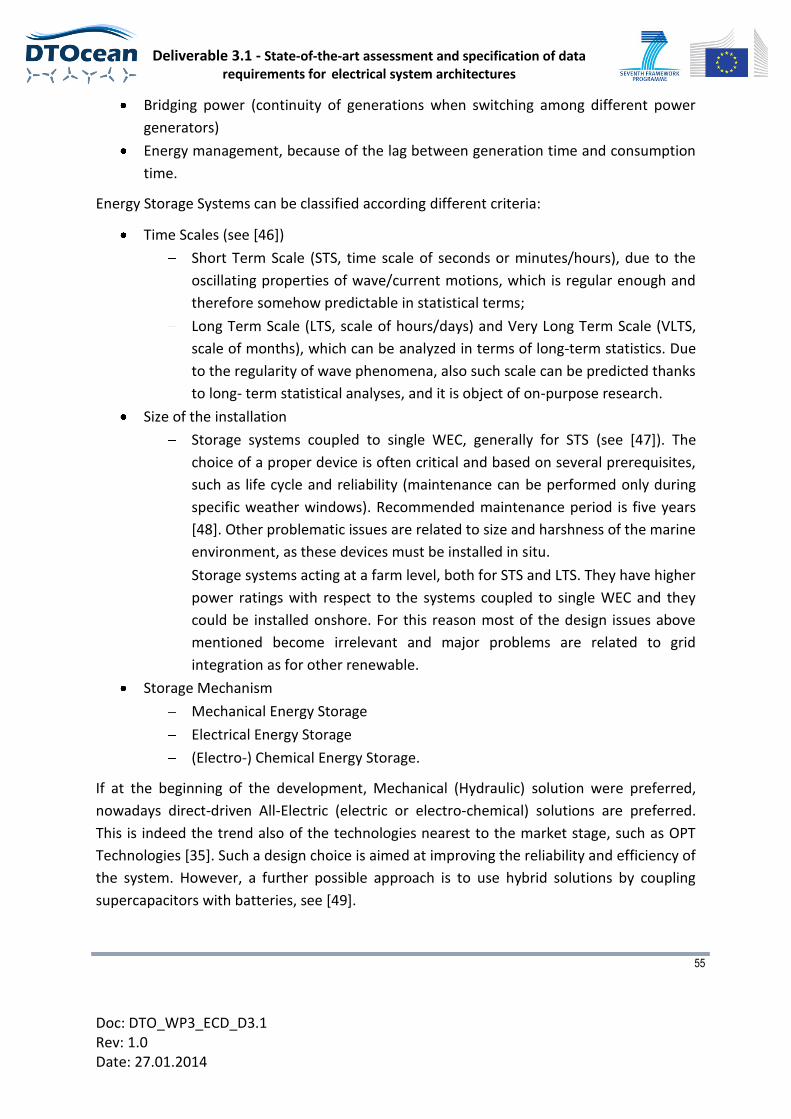
Deliverable 3.1 - State-of-the-art assessment and specification of data requirements for electrical system architectures
55
Doc: DTO_WP3_ECD_D3.1 Rev: 1.0 Date: 27.01.2014
Bridging power (continuity of generations when switching among different power
generators)
Energy management, because of the lag between generation time and consumption
time.
Energy Storage Systems can be classified according different criteria:
Time Scales (see [46])
Short Term Scale (STS, time scale of seconds or minutes/hours), due to the
oscillating properties of wave/current motions, which is regular enough and
therefore somehow predictable in statistical terms;
Long Term Scale (LTS, scale of hours/days) and Very Long Term Scale (VLTS,
scale of months), which can be analyzed in terms of long-term statistics. Due
to the regularity of wave phenomena, also such scale can be predicted thanks
to long- term statistical analyses, and it is object of on-purpose research.
Size of the installation
Storage systems coupled to single WEC, generally for STS (see [47]). The
choice of a proper device is often critical and based on several prerequisites,
such as life cycle and reliability (maintenance can be performed only during
specific weather windows). Recommended maintenance period is five years
[48]. Other problematic issues are related to size and harshness of the marine
environment, as these devices must be installed in situ.
Storage systems acting at a farm level, both for STS and LTS. They have higher
power ratings with respect to the systems coupled to single WEC and they
could be installed onshore. For this reason most of the design issues above
mentioned become irrelevant and major problems are related to grid
integration as for other renewable.
Storage Mechanism
Mechanical Energy Storage
Electrical Energy Storage
(Electro-) Chemical Energy Storage.
If at the beginning of the development, Mechanical (Hydraulic) solution were preferred,
nowadays direct-driven All-Electric (electric or electro-chemical) solutions are preferred.
This is indeed the trend also of the technologies nearest to the market stage, such as OPT
Technologies [35]. Such a design choice is aimed at improving the reliability and efficiency of
the system. However, a further possible approach is to use hybrid solutions by coupling
supercapacitors with batteries, see [49].
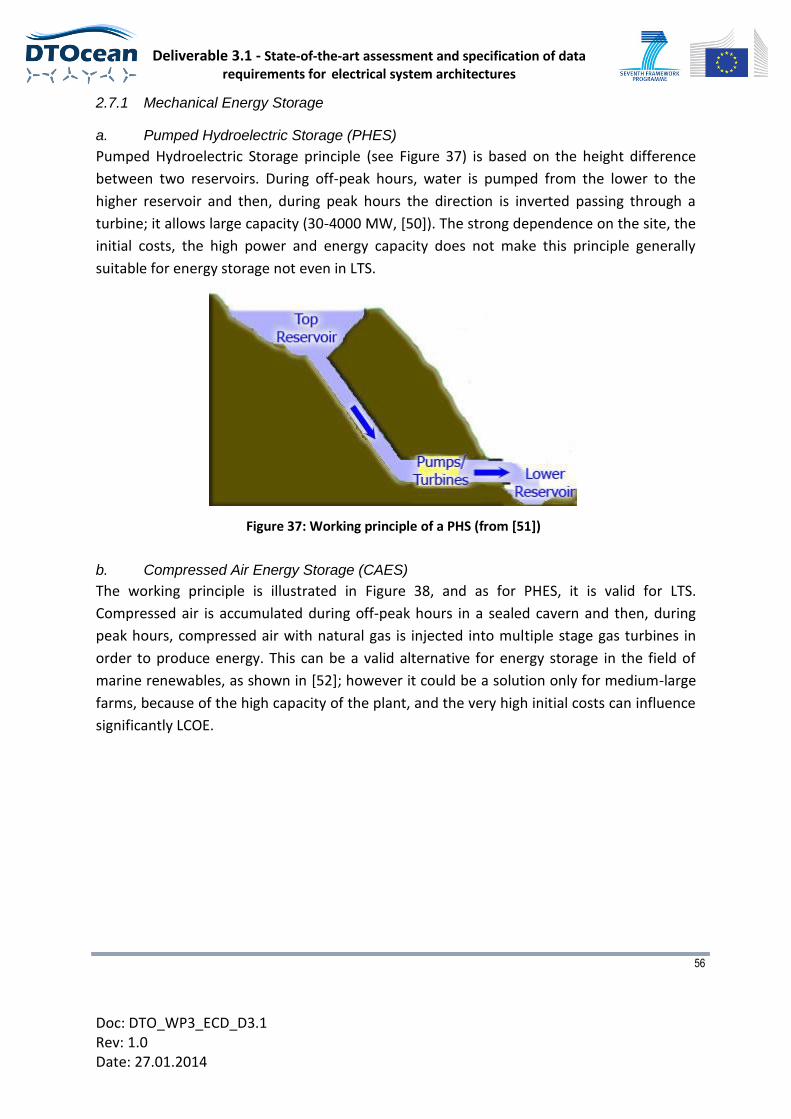
Deliverable 3.1 - State-of-the-art assessment and specification of data requirements for electrical system architectures
56
Doc: DTO_WP3_ECD_D3.1 Rev: 1.0 Date: 27.01.2014
2.7.1 Mechanical Energy Storage
a. Pumped Hydroelectric Storage (PHES)
Pumped Hydroelectric Storage principle (see Figure 37) is based on the height difference
between two reservoirs. During off-peak hours, water is pumped from the lower to the
higher reservoir and then, during peak hours the direction is inverted passing through a
turbine; it allows large capacity (30-4000 MW, [50]). The strong dependence on the site, the
initial costs, the high power and energy capacity does not make this principle generally
suitable for energy storage not even in LTS.
Figure 37: Working principle of a PHS (from [51])
b. Compressed Air Energy Storage (CAES)
The working principle is illustrated in Figure 38, and as for PHES, it is valid for LTS.
Compressed air is accumulated during off-peak hours in a sealed cavern and then, during
peak hours, compressed air with natural gas is injected into multiple stage gas turbines in
order to produce energy. This can be a valid alternative for energy storage in the field of
marine renewables, as shown in [52]; however it could be a solution only for medium-large
farms, because of the high capacity of the plant, and the very high initial costs can influence
significantly LCOE.
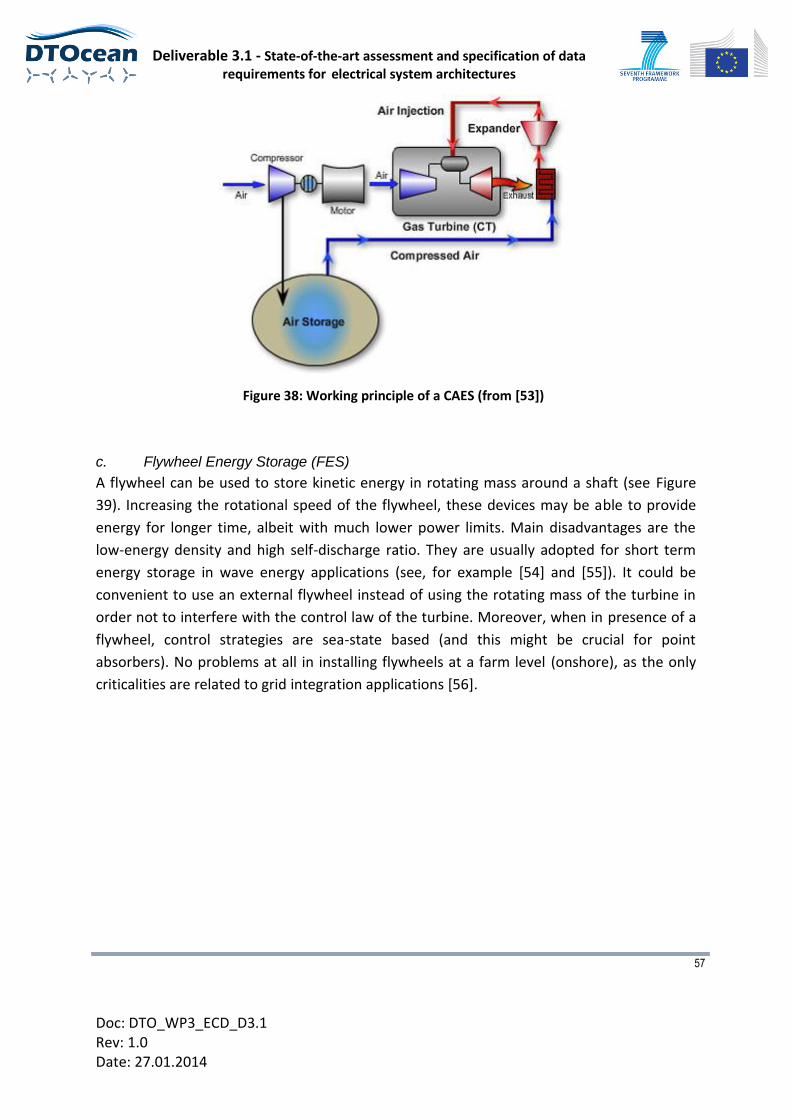
Deliverable 3.1 - State-of-the-art assessment and specification of data requirements for electrical system architectures
57
Doc: DTO_WP3_ECD_D3.1 Rev: 1.0 Date: 27.01.2014
Figure 38: Working principle of a CAES (from [53])
c. Flywheel Energy Storage (FES)
A flywheel can be used to store kinetic energy in rotating mass around a shaft (see Figure
39). Increasing the rotational speed of the flywheel, these devices may be able to provide
energy for longer time, albeit with much lower power limits. Main disadvantages are the
low-energy density and high self-discharge ratio. They are usually adopted for short term
energy storage in wave energy applications (see, for example [54] and [55]). It could be
convenient to use an external flywheel instead of using the rotating mass of the turbine in
order not to interfere with the control law of the turbine. Moreover, when in presence of a
flywheel, control strategies are sea-state based (and this might be crucial for point
absorbers). No problems at all in installing flywheels at a farm level (onshore), as the only
criticalities are related to grid integration applications [56].
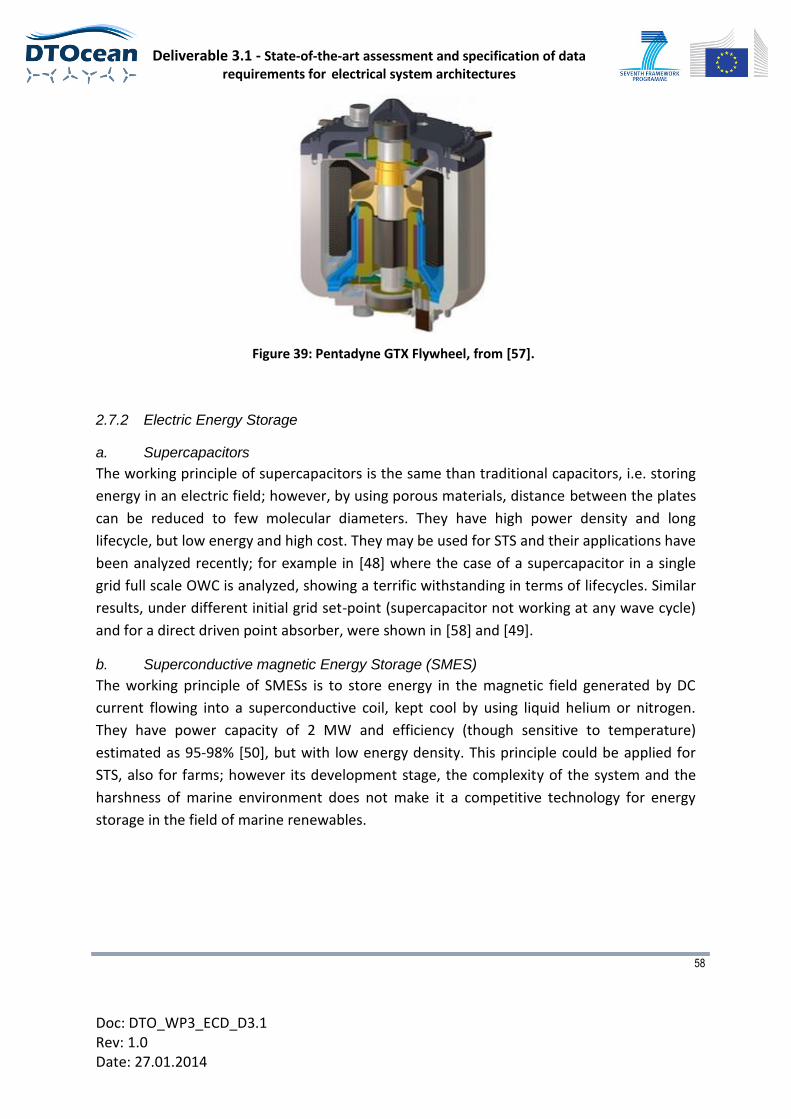
Deliverable 3.1 - State-of-the-art assessment and specification of data requirements for electrical system architectures
58
Doc: DTO_WP3_ECD_D3.1 Rev: 1.0 Date: 27.01.2014
Figure 39: Pentadyne GTX Flywheel, from [57].
2.7.2 Electric Energy Storage
a. Supercapacitors
The working principle of supercapacitors is the same than traditional capacitors, i.e. storing
energy in an electric field; however, by using porous materials, distance between the plates
can be reduced to few molecular diameters. They have high power density and long
lifecycle, but low energy and high cost. They may be used for STS and their applications have
been analyzed recently; for example in [48] where the case of a supercapacitor in a single
grid full scale OWC is analyzed, showing a terrific withstanding in terms of lifecycles. Similar
results, under different initial grid set-point (supercapacitor not working at any wave cycle)
and for a direct driven point absorber, were shown in [58] and [49].
b. Superconductive magnetic Energy Storage (SMES)
The working principle of SMESs is to store energy in the magnetic field generated by DC
current flowing into a superconductive coil, kept cool by using liquid helium or nitrogen.
They have power capacity of 2 MW and efficiency (though sensitive to temperature)
estimated as 95-98% [50], but with low energy density. This principle could be applied for
STS, also for farms; however its development stage, the complexity of the system and the
harshness of marine environment does not make it a competitive technology for energy
storage in the field of marine renewables.
Deliverable 3.1 - State-of-the-art assessment and specification of data requirements for electrical system architectures
59
Doc: DTO_WP3_ECD_D3.1 Rev: 1.0 Date: 27.01.2014
2.7.3 (Electro-)Chemical Energy Storage
a. Battery Energy Storage
A battery consists in one or more electrochemical cells that convert the stored chemical
energy into electrical energy. The two electrodes are plunged into an electrolyte allowing
ions to move between the electrodes and terminals. These terminals allow current
(electrons) to flow out of the battery through an external circuit to perform work.
There are several types of standard storage batteries:
Lead-Acid (LA) batteries, using lead dioxide for the cathode and lead for the anode in
sulphuric acid as electrolyte. They can reach efficiency levels up to 75-85%, low life-
cycle capacity, power up to 10MW and energy capacity up to 40MWh [50].
Nickel-based batteries have nickel hydroxide for the cathode, aqueous solution of
potassium hydroxide for electrolyte and different material as for anode (cadmium,
metal hydride or zinc). In general they have lower efficiency than lead-acid batteries
and higher self-discharge rate.
Lithium-based batteries, which have higher energy density, higher energy efficiency
and lower self-discharge [59].
Sodium Sulphur batteries, characterised by high efficiency, and high life-cycle. They
can reach 200MW of power and energy capacity of 1200 MWh [50];
ZEBRA (Sodium Nickel Chloride) batteries, classified as high temperature batteries, as
for Sodium Sulphur batteries, have very high energy density.
Flow batteries (Vanadium Redox, Polysuphide Bromide, Zinc Bromine), in which
power and energy capacity are decoupled. For this reason they can reach high values
in power and capacity (see [50]). They have fast reaction time, no self-discharge and
no degradation from deep discharge.
Only few papers have treated battery storage as a solution for wave energy converter farms
both for LST and STS. However battery systems are the canonical solution for autonomous
point absorbers [49].
b. Hydrogen Energy Storage
Just for the sake of completeness, this technology is included here: indeed, at the present
stage this concept is immature. It does not consist of a self-contained device; indeed it
would be better to talk about as a whole system of devices, including hydrogen creation
system, hydrogen storage system and hydrogen use system. For this reason it is unpractical
in marine energy field.

Deliverable 3.1 - State-of-the-art assessment and specification of data requirements for electrical system architectures
60
Doc: DTO_WP3_ECD_D3.1 Rev: 1.0 Date: 27.01.2014
2.8 Power transmission options: HVAC and HVDC
Based on the type of power transmission between offshore and onshore locations, a first
distinction can be made according to whether the electrical energy is transported by
alternating current (AC) or direct current (DC).
For offshore plants the choice of whether to use a DC or AC transmission line is mainly
determined by the distance to shore and the installed capacity ( [60], [61], [62], [63]). For
projects located far from the grid connection point, or of several hundred megawatts in
capacity, AC transmission becomes very expensive or, in some cases, practically impossible
due to cable-generated reactive power using up much of the transmission capacity.
In such cases, high voltage DC (HVDC) transmission is becoming an option. Such a system
requires an AC/DC converter station both offshore and onshore; both stations are large
installations whose building and operation might impose a number of engineering and
economical challenges.
Currently most of the existing offshore transmission systems use HVAC for the transport of
electrical power from the farm to the shore. Usually, an offshore substation is used to
increase transmission voltage and therefore limit losses. Nevertheless, when the farm is not
very distant from shore and the energy generator voltage transformer is high enough,
offshore transforming substations may not be necessary. (Taken by [1]).
There are two different preliminary issues to take into account for selection of the
transmission options: capital costs associated with the initial investment and the efficiency
of the transmission line (transmitted power divided by power produced). A general
feasibility analysis should primarily include the understanding of these two parameters.
Other evaluation criteria should be considered as well but might be strongly site-specific
and therefore difficult to accommodate under a general approach.
Figure 40 shows the cost and efficiency comparison of these two options. It is evident from
the figure that for farms less than approximately 100 km from the shore the HVAC solution
still is more cost effective. Other publications give similar figures for this breakeven point
(50 km in [6] and 100 km in [2]).
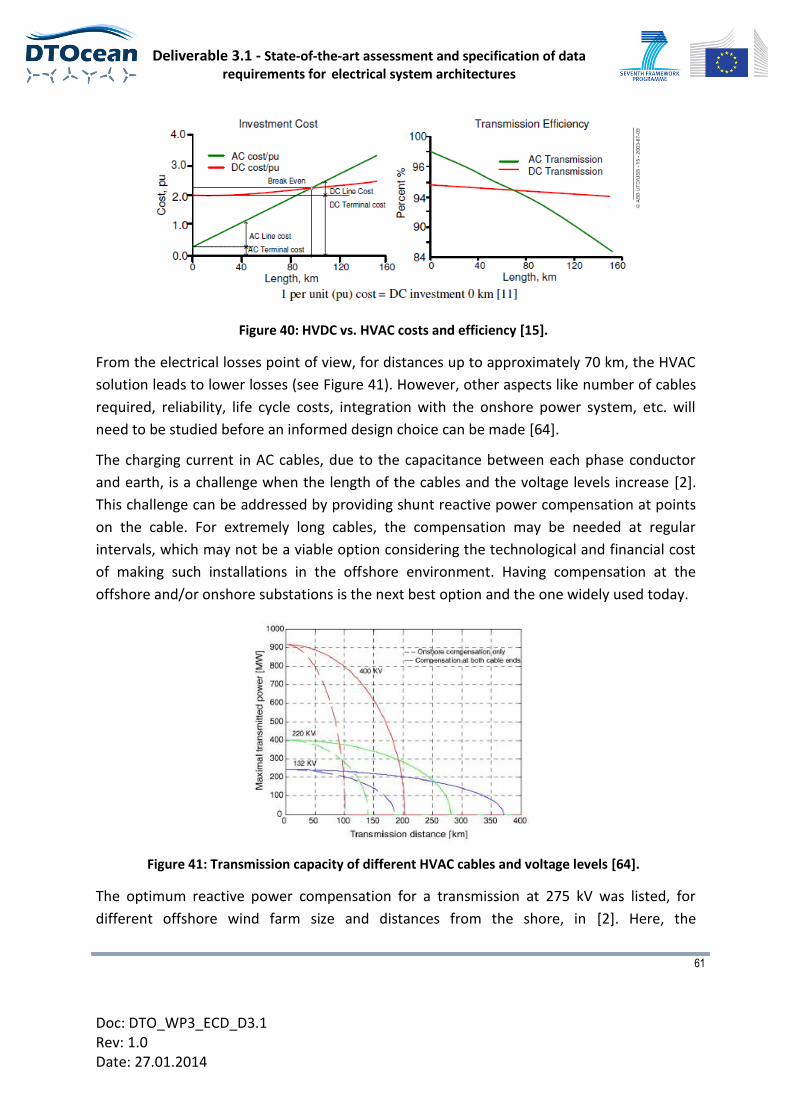
Deliverable 3.1 - State-of-the-art assessment and specification of data requirements for electrical system architectures
61
Doc: DTO_WP3_ECD_D3.1 Rev: 1.0 Date: 27.01.2014
Figure 40: HVDC vs. HVAC costs and efficiency [15].
From the electrical losses point of view, for distances up to approximately 70 km, the HVAC
solution leads to lower losses (see Figure 41). However, other aspects like number of cables
required, reliability, life cycle costs, integration with the onshore power system, etc. will
need to be studied before an informed design choice can be made [64].
The charging current in AC cables, due to the capacitance between each phase conductor
and earth, is a challenge when the length of the cables and the voltage levels increase [2].
This challenge can be addressed by providing shunt reactive power compensation at points
on the cable. For extremely long cables, the compensation may be needed at regular
intervals, which may not be a viable option considering the technological and financial cost
of making such installations in the offshore environment. Having compensation at the
offshore and/or onshore substations is the next best option and the one widely used today.
Figure 41: Transmission capacity of different HVAC cables and voltage levels [64].
The optimum reactive power compensation for a transmission at 275 kV was listed, for
different offshore wind farm size and distances from the shore, in [2]. Here, the
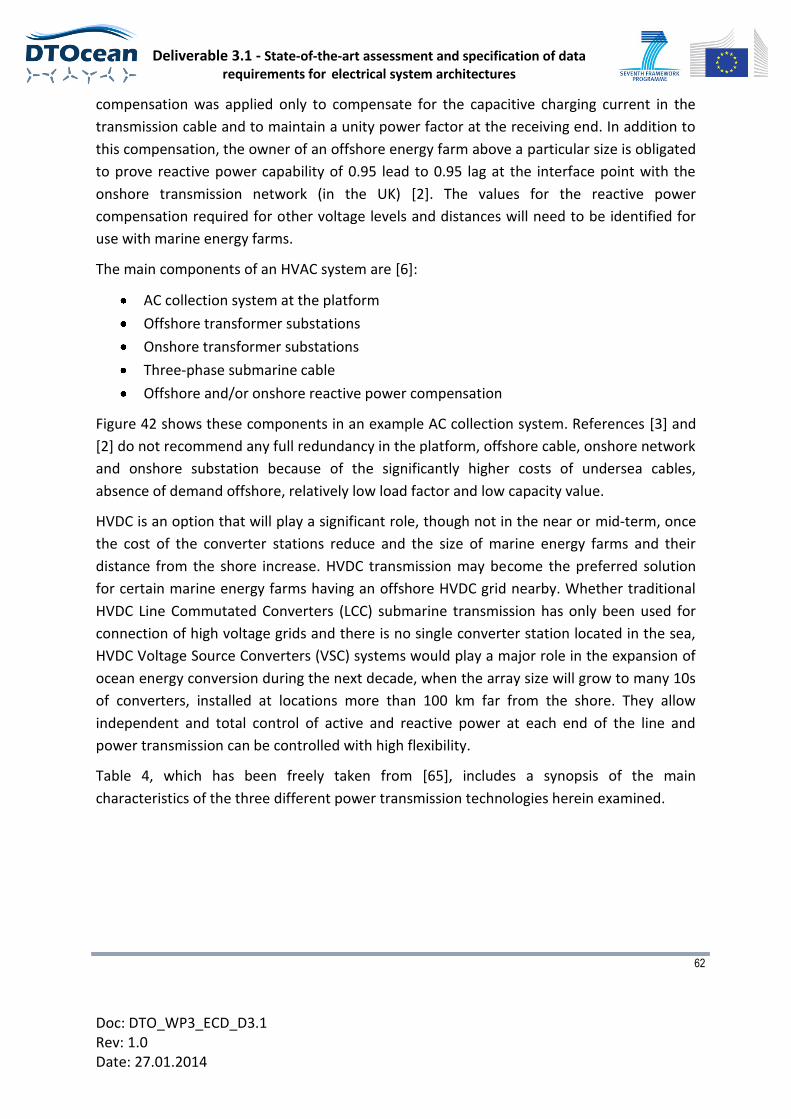
Deliverable 3.1 - State-of-the-art assessment and specification of data requirements for electrical system architectures
62
Doc: DTO_WP3_ECD_D3.1 Rev: 1.0 Date: 27.01.2014
compensation was applied only to compensate for the capacitive charging current in the
transmission cable and to maintain a unity power factor at the receiving end. In addition to
this compensation, the owner of an offshore energy farm above a particular size is obligated
to prove reactive power capability of 0.95 lead to 0.95 lag at the interface point with the
onshore transmission network (in the UK) [2]. The values for the reactive power
compensation required for other voltage levels and distances will need to be identified for
use with marine energy farms.
The main components of an HVAC system are [6]:
AC collection system at the platform
Offshore transformer substations
Onshore transformer substations
Three-phase submarine cable
Offshore and/or onshore reactive power compensation
Figure 42 shows these components in an example AC collection system. References [3] and
[2] do not recommend any full redundancy in the platform, offshore cable, onshore network
and onshore substation because of the significantly higher costs of undersea cables,
absence of demand offshore, relatively low load factor and low capacity value.
HVDC is an option that will play a significant role, though not in the near or mid-term, once
the cost of the converter stations reduce and the size of marine energy farms and their
distance from the shore increase. HVDC transmission may become the preferred solution
for certain marine energy farms having an offshore HVDC grid nearby. Whether traditional
HVDC Line Commutated Converters (LCC) submarine transmission has only been used for
connection of high voltage grids and there is no single converter station located in the sea,
HVDC Voltage Source Converters (VSC) systems would play a major role in the expansion of
ocean energy conversion during the next decade, when the array size will grow to many 10s
of converters, installed at locations more than 100 km far from the shore. They allow
independent and total control of active and reactive power at each end of the line and
power transmission can be controlled with high flexibility.
Table 4, which has been freely taken from [65], includes a synopsis of the main
characteristics of the three different power transmission technologies herein examined.
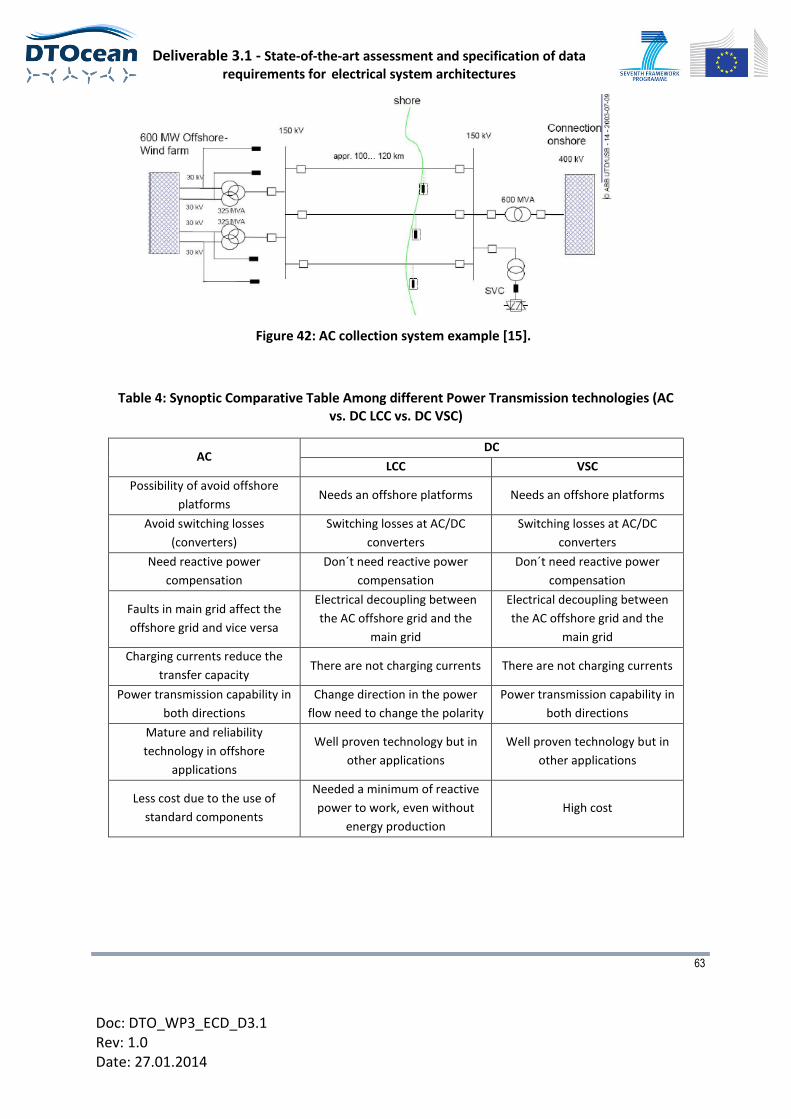
Deliverable 3.1 - State-of-the-art assessment and specification of data requirements for electrical system architectures
63
Doc: DTO_WP3_ECD_D3.1 Rev: 1.0 Date: 27.01.2014
Figure 42: AC collection system example [15].
Table 4: Synoptic Comparative Table Among different Power Transmission technologies (AC vs. DC LCC vs. DC VSC)
AC DC
LCC VSC
Possibility of avoid offshore
platforms Needs an offshore platforms Needs an offshore platforms
Avoid switching losses
(converters)
Switching losses at AC/DC
converters
Switching losses at AC/DC
converters
Need reactive power
compensation
Don´t need reactive power
compensation
Don´t need reactive power
compensation
Faults in main grid affect the
offshore grid and vice versa
Electrical decoupling between
the AC offshore grid and the
main grid
Electrical decoupling between
the AC offshore grid and the
main grid
Charging currents reduce the
transfer capacity There are not charging currents There are not charging currents
Power transmission capability in
both directions
Change direction in the power
flow need to change the polarity
Power transmission capability in
both directions
Mature and reliability
technology in offshore
applications
Well proven technology but in
other applications
Well proven technology but in
other applications
Less cost due to the use of
standard components
Needed a minimum of reactive
power to work, even without
energy production
High cost
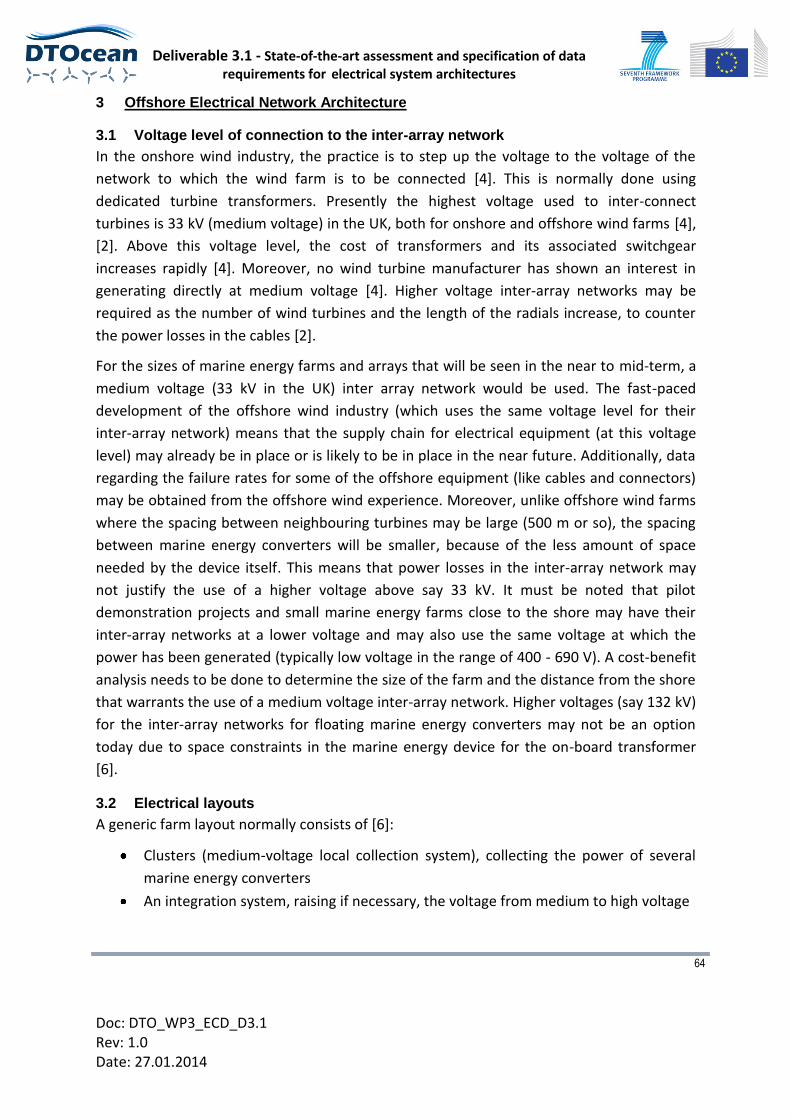
Deliverable 3.1 - State-of-the-art assessment and specification of data requirements for electrical system architectures
64
Doc: DTO_WP3_ECD_D3.1 Rev: 1.0 Date: 27.01.2014
Offshore Electrical Network Architecture 3
3.1 Voltage level of connection to the inter-array network
In the onshore wind industry, the practice is to step up the voltage to the voltage of the
network to which the wind farm is to be connected [4]. This is normally done using
dedicated turbine transformers. Presently the highest voltage used to inter-connect
turbines is 33 kV (medium voltage) in the UK, both for onshore and offshore wind farms [4],
[2]. Above this voltage level, the cost of transformers and its associated switchgear
increases rapidly [4]. Moreover, no wind turbine manufacturer has shown an interest in
generating directly at medium voltage [4]. Higher voltage inter-array networks may be
required as the number of wind turbines and the length of the radials increase, to counter
the power losses in the cables [2].
For the sizes of marine energy farms and arrays that will be seen in the near to mid-term, a
medium voltage (33 kV in the UK) inter array network would be used. The fast-paced
development of the offshore wind industry (which uses the same voltage level for their
inter-array network) means that the supply chain for electrical equipment (at this voltage
level) may already be in place or is likely to be in place in the near future. Additionally, data
regarding the failure rates for some of the offshore equipment (like cables and connectors)
may be obtained from the offshore wind experience. Moreover, unlike offshore wind farms
where the spacing between neighbouring turbines may be large (500 m or so), the spacing
between marine energy converters will be smaller, because of the less amount of space
needed by the device itself. This means that power losses in the inter-array network may
not justify the use of a higher voltage above say 33 kV. It must be noted that pilot
demonstration projects and small marine energy farms close to the shore may have their
inter-array networks at a lower voltage and may also use the same voltage at which the
power has been generated (typically low voltage in the range of 400 - 690 V). A cost-benefit
analysis needs to be done to determine the size of the farm and the distance from the shore
that warrants the use of a medium voltage inter-array network. Higher voltages (say 132 kV)
for the inter-array networks for floating marine energy converters may not be an option
today due to space constraints in the marine energy device for the on-board transformer
[6].
3.2 Electrical layouts
A generic farm layout normally consists of [6]:
Clusters (medium-voltage local collection system), collecting the power of several
marine energy converters
An integration system, raising if necessary, the voltage from medium to high voltage
Deliverable 3.1 - State-of-the-art assessment and specification of data requirements for electrical system architectures
65
Doc: DTO_WP3_ECD_D3.1 Rev: 1.0 Date: 27.01.2014
A transmission system (AC or DC) transferring the marine power to shore (to the grid
integration point or point of common coupling)
3.2.1 Cluster layouts
Connecting individual wave or tidal power converters to the shore using a power cable each
is the most reliable connection option for farms of marine energy converters. The
implementation of a complex offshore hub or an offshore substation is avoided using this
approach. The excessive cabling and cable laying costs in this approach would make it cost
prohibitive, which means that the individual marine energy converters would need to be
integrated into a common local collection system, or clusters, from where the power is
transmitted to the shore. Even for the four-device Wave Hub test site in South West England
(26 km from the shore) such a cluster has been used to transmit the power to the shore [5].
As discussed earlier, clusters in marine energy farms would be a medium (or low) voltage
collection network. The following types of cluster layouts may be used [6], [1]:
Connecting individually the different devices to shore will not be an acceptable option in the
majority of wave farms, mainly because cabling and transmission efficiency losses. There are
several types of clustering (kept from [1]):
String clustering without redundancy (see Figure 43): The devices are connected in
parallel along a single collection cable. The main advantage is that if one arm of the
system breaks the overall system continues working. This option is one of the most
used in wind farms.
Figure 43: String Series Cluster. Medium and Large Farms (AC and DC) [1]
Star clustering (see Figure 44): The devices are connected independently to a cluster
nodal platform. The advantage is that several parts are independent one to each
other so that in case of failure the overall infrastructure will continue working.
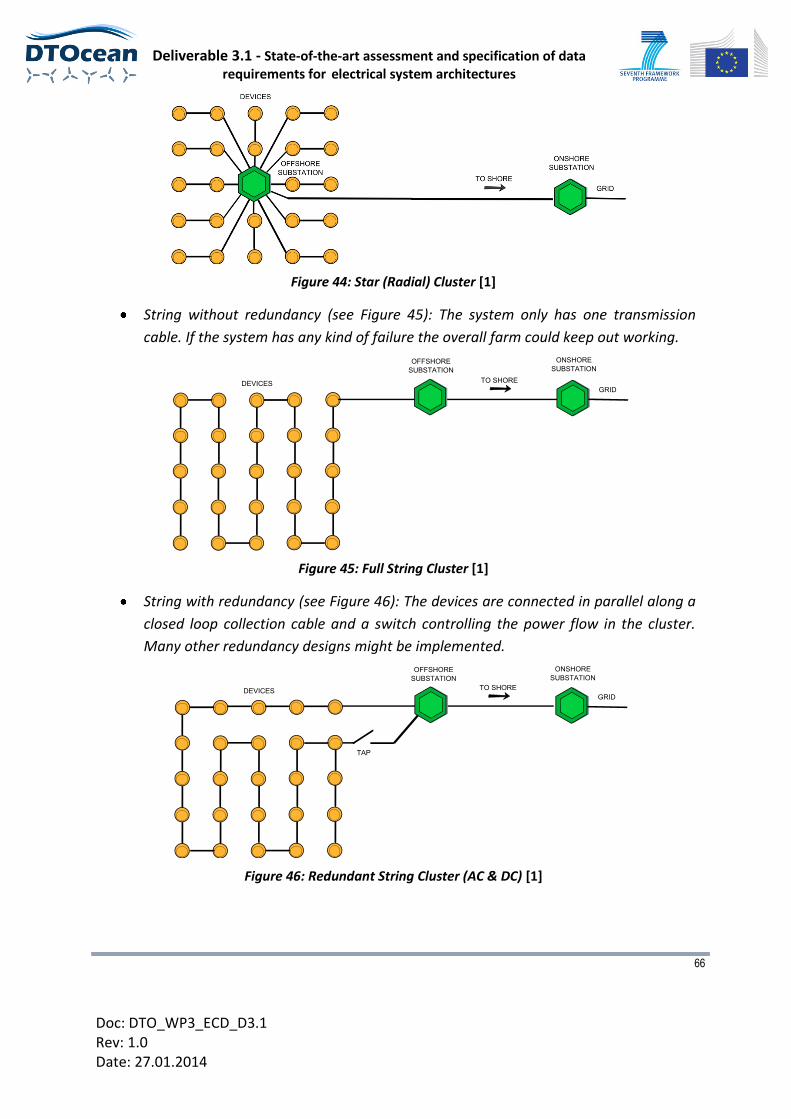
Deliverable 3.1 - State-of-the-art assessment and specification of data requirements for electrical system architectures
66
Doc: DTO_WP3_ECD_D3.1 Rev: 1.0 Date: 27.01.2014
Figure 44: Star (Radial) Cluster [1]
String without redundancy (see Figure 45): The system only has one transmission
cable. If the system has any kind of failure the overall farm could keep out working.
Figure 45: Full String Cluster [1]
String with redundancy (see Figure 46): The devices are connected in parallel along a
closed loop collection cable and a switch controlling the power flow in the cluster.
Many other redundancy designs might be implemented.
Figure 46: Redundant String Cluster (AC & DC) [1]
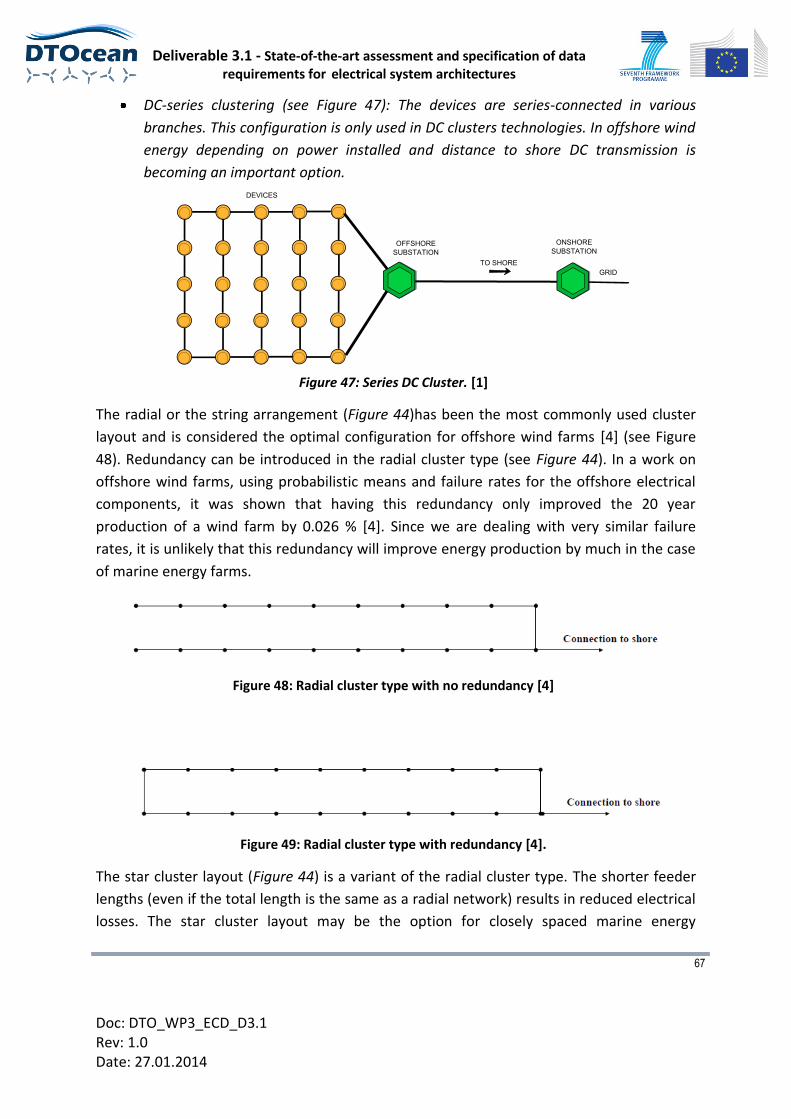
Deliverable 3.1 - State-of-the-art assessment and specification of data requirements for electrical system architectures
67
Doc: DTO_WP3_ECD_D3.1 Rev: 1.0 Date: 27.01.2014
DC-series clustering (see Figure 47): The devices are series-connected in various
branches. This configuration is only used in DC clusters technologies. In offshore wind
energy depending on power installed and distance to shore DC transmission is
becoming an important option.
Figure 47: Series DC Cluster. [1]
The radial or the string arrangement (Figure 44)has been the most commonly used cluster
layout and is considered the optimal configuration for offshore wind farms [4] (see Figure
48). Redundancy can be introduced in the radial cluster type (see Figure 44). In a work on
offshore wind farms, using probabilistic means and failure rates for the offshore electrical
components, it was shown that having this redundancy only improved the 20 year
production of a wind farm by 0.026 % [4]. Since we are dealing with very similar failure
rates, it is unlikely that this redundancy will improve energy production by much in the case
of marine energy farms.
Figure 48: Radial cluster type with no redundancy [4]
Figure 49: Radial cluster type with redundancy [4].
The star cluster layout (Figure 44) is a variant of the radial cluster type. The shorter feeder
lengths (even if the total length is the same as a radial network) results in reduced electrical
losses. The star cluster layout may be the option for closely spaced marine energy
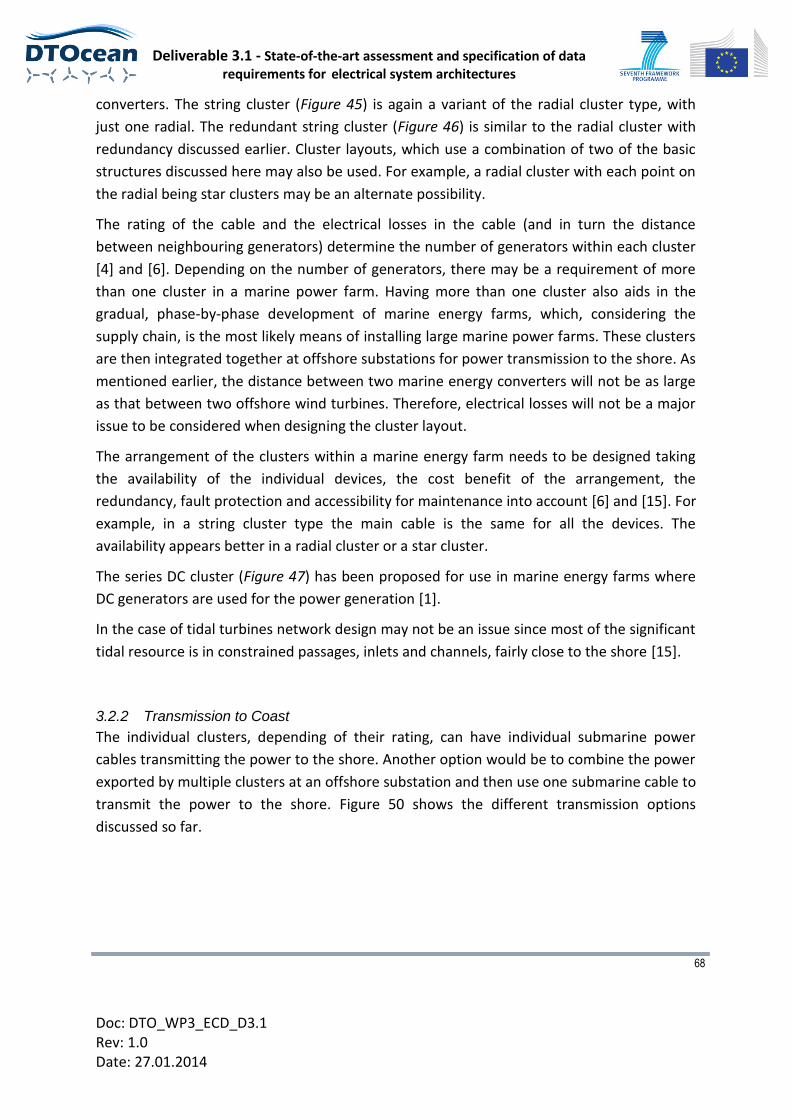
Deliverable 3.1 - State-of-the-art assessment and specification of data requirements for electrical system architectures
68
Doc: DTO_WP3_ECD_D3.1 Rev: 1.0 Date: 27.01.2014
converters. The string cluster (Figure 45) is again a variant of the radial cluster type, with
just one radial. The redundant string cluster (Figure 46) is similar to the radial cluster with
redundancy discussed earlier. Cluster layouts, which use a combination of two of the basic
structures discussed here may also be used. For example, a radial cluster with each point on
the radial being star clusters may be an alternate possibility.
The rating of the cable and the electrical losses in the cable (and in turn the distance
between neighbouring generators) determine the number of generators within each cluster
[4] and [6]. Depending on the number of generators, there may be a requirement of more
than one cluster in a marine power farm. Having more than one cluster also aids in the
gradual, phase-by-phase development of marine energy farms, which, considering the
supply chain, is the most likely means of installing large marine power farms. These clusters
are then integrated together at offshore substations for power transmission to the shore. As
mentioned earlier, the distance between two marine energy converters will not be as large
as that between two offshore wind turbines. Therefore, electrical losses will not be a major
issue to be considered when designing the cluster layout.
The arrangement of the clusters within a marine energy farm needs to be designed taking
the availability of the individual devices, the cost benefit of the arrangement, the
redundancy, fault protection and accessibility for maintenance into account [6] and [15]. For
example, in a string cluster type the main cable is the same for all the devices. The
availability appears better in a radial cluster or a star cluster.
The series DC cluster (Figure 47) has been proposed for use in marine energy farms where
DC generators are used for the power generation [1].
In the case of tidal turbines network design may not be an issue since most of the significant
tidal resource is in constrained passages, inlets and channels, fairly close to the shore [15].
3.2.2 Transmission to Coast
The individual clusters, depending of their rating, can have individual submarine power
cables transmitting the power to the shore. Another option would be to combine the power
exported by multiple clusters at an offshore substation and then use one submarine cable to
transmit the power to the shore. Figure 50 shows the different transmission options
discussed so far.
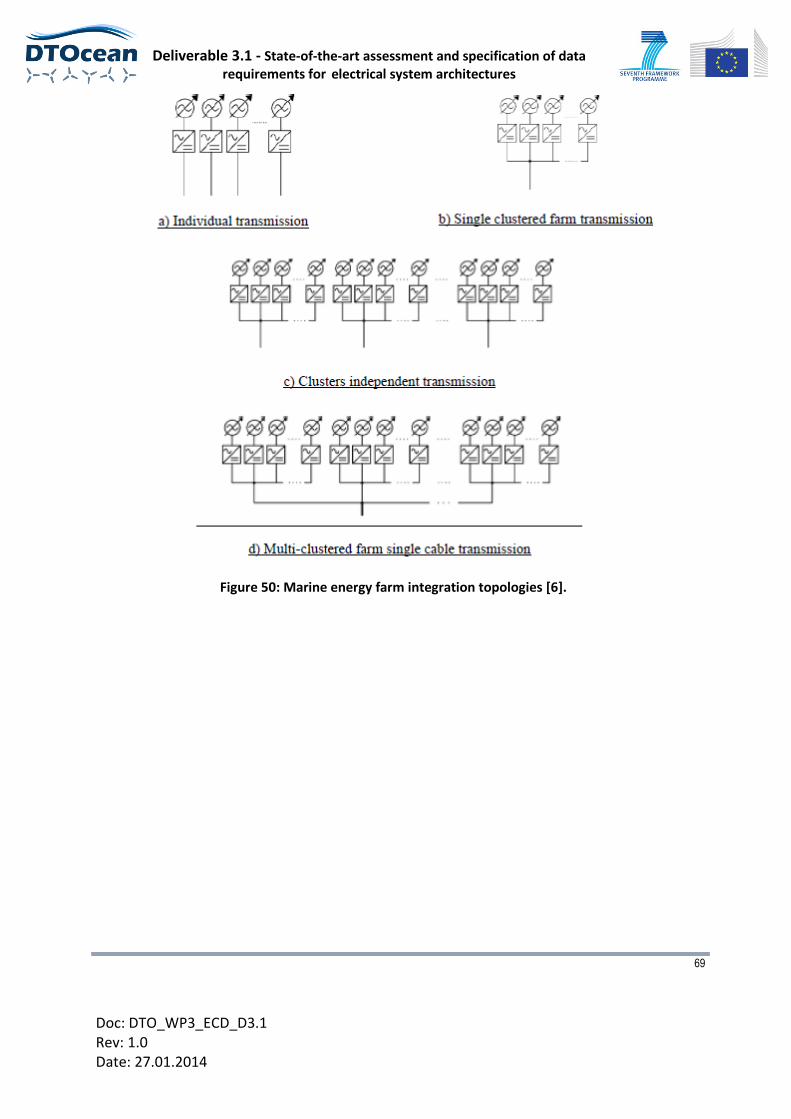
Deliverable 3.1 - State-of-the-art assessment and specification of data requirements for electrical system architectures
69
Doc: DTO_WP3_ECD_D3.1 Rev: 1.0 Date: 27.01.2014
Figure 50: Marine energy farm integration topologies [6].
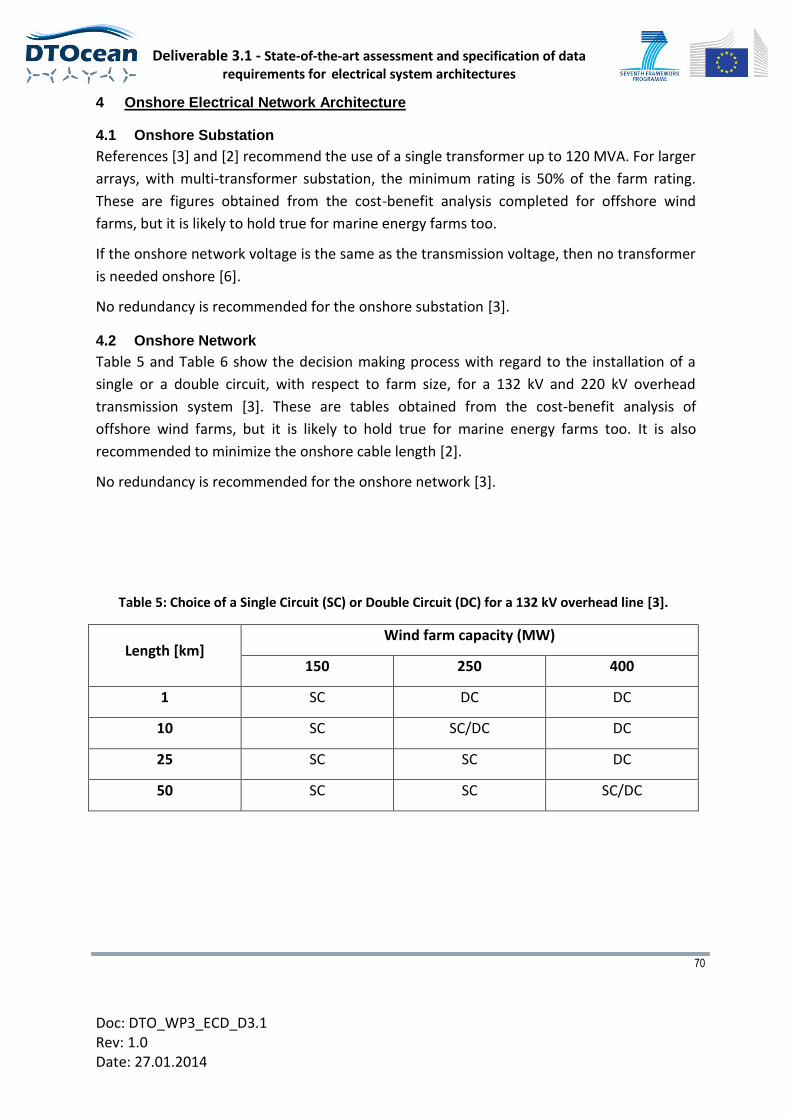
Deliverable 3.1 - State-of-the-art assessment and specification of data requirements for electrical system architectures
70
Doc: DTO_WP3_ECD_D3.1 Rev: 1.0 Date: 27.01.2014
Onshore Electrical Network Architecture 4
4.1 Onshore Substation
References [3] and [2] recommend the use of a single transformer up to 120 MVA. For larger
arrays, with multi-transformer substation, the minimum rating is 50% of the farm rating.
These are figures obtained from the cost-benefit analysis completed for offshore wind
farms, but it is likely to hold true for marine energy farms too.
If the onshore network voltage is the same as the transmission voltage, then no transformer
is needed onshore [6].
No redundancy is recommended for the onshore substation [3].
4.2 Onshore Network
Table 5 and Table 6 show the decision making process with regard to the installation of a
single or a double circuit, with respect to farm size, for a 132 kV and 220 kV overhead
transmission system [3]. These are tables obtained from the cost-benefit analysis of
offshore wind farms, but it is likely to hold true for marine energy farms too. It is also
recommended to minimize the onshore cable length [2].
No redundancy is recommended for the onshore network [3].
Table 5: Choice of a Single Circuit (SC) or Double Circuit (DC) for a 132 kV overhead line [3].
Length [km] Wind farm capacity (MW)
150 250 400
1 SC DC DC
10 SC SC/DC DC
25 SC SC DC
50 SC SC SC/DC
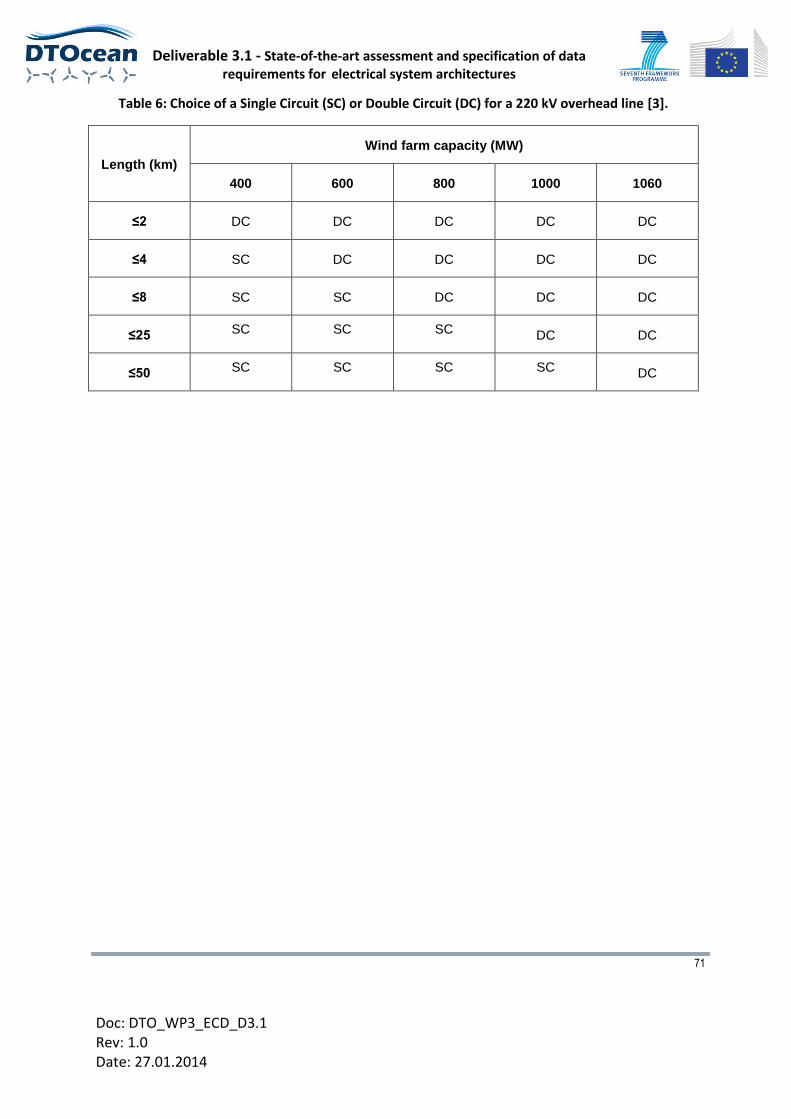
Deliverable 3.1 - State-of-the-art assessment and specification of data requirements for electrical system architectures
71
Doc: DTO_WP3_ECD_D3.1 Rev: 1.0 Date: 27.01.2014
Table 6: Choice of a Single Circuit (SC) or Double Circuit (DC) for a 220 kV overhead line [3].
Length (km)
Wind farm capacity (MW)
400 600 800 1000 1060
≤2 DC DC DC DC DC
≤4 SC DC DC DC DC
≤8 SC SC DC DC DC
≤25 SC SC SC DC DC
≤50 SC SC SC SC DC
Deliverable 3.1 - State-of-the-art assessment and specification of data requirements for electrical system architectures
72
Doc: DTO_WP3_ECD_D3.1 Rev: 1.0 Date: 27.01.2014
Power generation as input to the design of the offshore electrical network 5
The aim of this project is to develop a techno-economic decision making tool, suggesting the
offshore electrical network layout and design for tidal and wave energy converter farms,
based on the levelised cost of electricity generation. The levelised cost of electricity
generation is defined as the ratio between the total cost of a generating plant, including the
capital and operational costs, and the total energy yield expected over the plant’s lifetime
[66]. For such a techno-economic decision making tool, the power generation from the farm
is required as an input. Accessing the reliability and the expected energy constraint
associated with the different layout options also requires this information.
Considering that the energy yield over the lifetime of the plant is required, the expected or a
forecasted time-series of the power generated by the marine energy converter farm with an
acceptable resolution is needed. The resolution of this time-series needs to be decided
depending on the question being addressed and its computational intensity/feasibility. Since
the lifetime of a marine energy converter farm may be between 20-30 years, a time-series
with power generation values estimated every 30 minutes or an hour would be appropriate.
The resolution suggested here has been used in similar techno-economic work completed
for the onshore and offshore wind industries [3], [85].
The power output of marine energy converter farms depends both on the resource
characteristics (current velocity and direction in the case of tidal current devices and
significant wave height, average/peak wave period and wave direction in the case of wave
devices) and the power extraction/generation characteristics of the device, which should
also include the effects of control. The resource characteristics for both tidal and wave are
expected to be statistically represented, based on historic measurement archives and
modelling based forecasts made at sites where the farms are being considered.
There are many individual tidal and wave energy converters that have been tested in tanks
and in real seas. Additionally, a lot of computer based numerical modelling work, with both
individual and arrays of wave and tidal devices, has been completed. Experience obtained
from these sources will be used to determine the power output characteristics of the
different wave and tidal devices selected for each of the scenarios defined by WP1 and
WP2. The resource characteristics and the device power characteristics, once available, can
be used to obtain the power output of the wave or tidal device and also of farms of these
devices. This information may be represented either statistically or as a set of
representative time-series.
This section examines how the power output data from both wave and tidal energy
converter farms (and also individual converters) can be represented for use as input to the
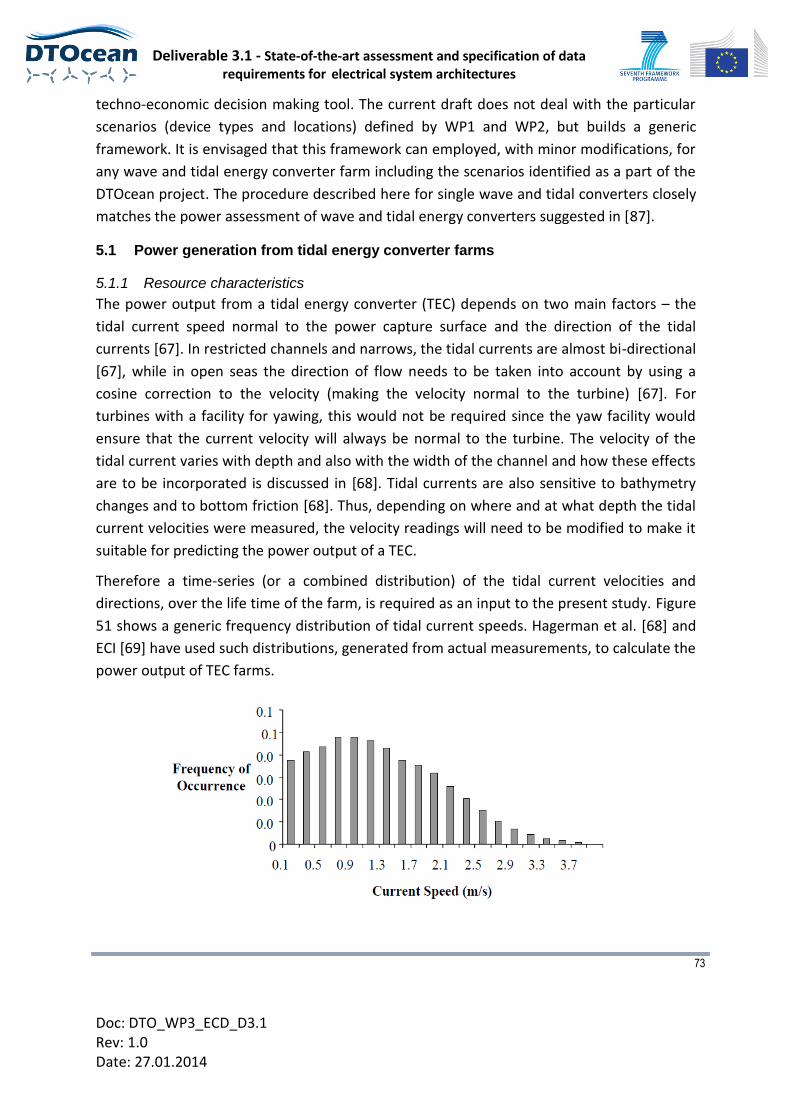
Deliverable 3.1 - State-of-the-art assessment and specification of data requirements for electrical system architectures
73
Doc: DTO_WP3_ECD_D3.1 Rev: 1.0 Date: 27.01.2014
techno-economic decision making tool. The current draft does not deal with the particular
scenarios (device types and locations) defined by WP1 and WP2, but builds a generic
framework. It is envisaged that this framework can employed, with minor modifications, for
any wave and tidal energy converter farm including the scenarios identified as a part of the
DTOcean project. The procedure described here for single wave and tidal converters closely
matches the power assessment of wave and tidal energy converters suggested in [87].
5.1 Power generation from tidal energy converter farms
5.1.1 Resource characteristics
The power output from a tidal energy converter (TEC) depends on two main factors – the
tidal current speed normal to the power capture surface and the direction of the tidal
currents [67]. In restricted channels and narrows, the tidal currents are almost bi-directional
[67], while in open seas the direction of flow needs to be taken into account by using a
cosine correction to the velocity (making the velocity normal to the turbine) [67]. For
turbines with a facility for yawing, this would not be required since the yaw facility would
ensure that the current velocity will always be normal to the turbine. The velocity of the
tidal current varies with depth and also with the width of the channel and how these effects
are to be incorporated is discussed in [68]. Tidal currents are also sensitive to bathymetry
changes and to bottom friction [68]. Thus, depending on where and at what depth the tidal
current velocities were measured, the velocity readings will need to be modified to make it
suitable for predicting the power output of a TEC.
Therefore a time-series (or a combined distribution) of the tidal current velocities and
directions, over the life time of the farm, is required as an input to the present study. Figure
51 shows a generic frequency distribution of tidal current speeds. Hagerman et al. [68] and
ECI [69] have used such distributions, generated from actual measurements, to calculate the
power output of TEC farms.
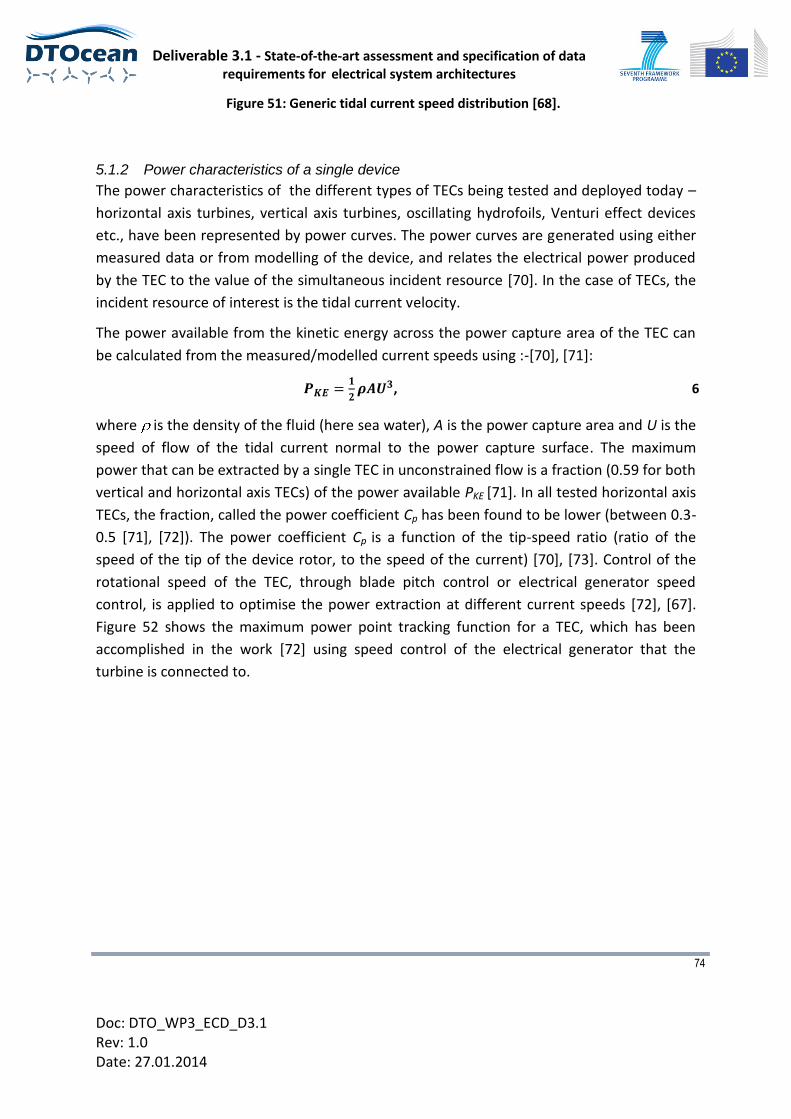
Deliverable 3.1 - State-of-the-art assessment and specification of data requirements for electrical system architectures
74
Doc: DTO_WP3_ECD_D3.1 Rev: 1.0 Date: 27.01.2014
Figure 51: Generic tidal current speed distribution [68].
5.1.2 Power characteristics of a single device
The power characteristics of the different types of TECs being tested and deployed today –
horizontal axis turbines, vertical axis turbines, oscillating hydrofoils, Venturi effect devices
etc., have been represented by power curves. The power curves are generated using either
measured data or from modelling of the device, and relates the electrical power produced
by the TEC to the value of the simultaneous incident resource [70]. In the case of TECs, the
incident resource of interest is the tidal current velocity.
The power available from the kinetic energy across the power capture area of the TEC can
be calculated from the measured/modelled current speeds using :-[70], [71]:
, 6
where is the density of the fluid (here sea water), A is the power capture area and U is the
speed of flow of the tidal current normal to the power capture surface. The maximum
power that can be extracted by a single TEC in unconstrained flow is a fraction (0.59 for both
vertical and horizontal axis TECs) of the power available PKE [71]. In all tested horizontal axis
TECs, the fraction, called the power coefficient Cp has been found to be lower (between 0.3-
0.5 [71], [72]). The power coefficient Cp is a function of the tip-speed ratio (ratio of the
speed of the tip of the device rotor, to the speed of the current) [70], [73]. Control of the
rotational speed of the TEC, through blade pitch control or electrical generator speed
control, is applied to optimise the power extraction at different current speeds [72], [67].
Figure 52 shows the maximum power point tracking function for a TEC, which has been
accomplished in the work [72] using speed control of the electrical generator that the
turbine is connected to.
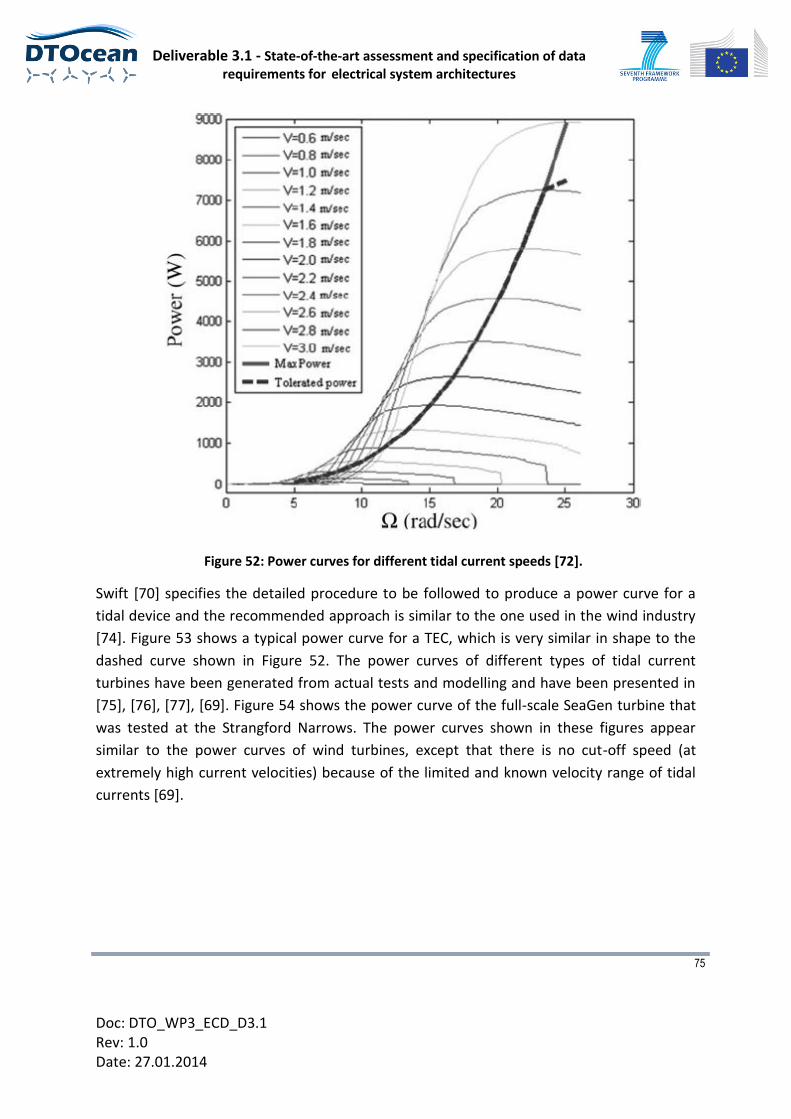
Deliverable 3.1 - State-of-the-art assessment and specification of data requirements for electrical system architectures
75
Doc: DTO_WP3_ECD_D3.1 Rev: 1.0 Date: 27.01.2014
Figure 52: Power curves for different tidal current speeds [72].
Swift [70] specifies the detailed procedure to be followed to produce a power curve for a
tidal device and the recommended approach is similar to the one used in the wind industry
[74]. Figure 53 shows a typical power curve for a TEC, which is very similar in shape to the
dashed curve shown in Figure 52. The power curves of different types of tidal current
turbines have been generated from actual tests and modelling and have been presented in
[75], [76], [77], [69]. Figure 54 shows the power curve of the full-scale SeaGen turbine that
was tested at the Strangford Narrows. The power curves shown in these figures appear
similar to the power curves of wind turbines, except that there is no cut-off speed (at
extremely high current velocities) because of the limited and known velocity range of tidal
currents [69].
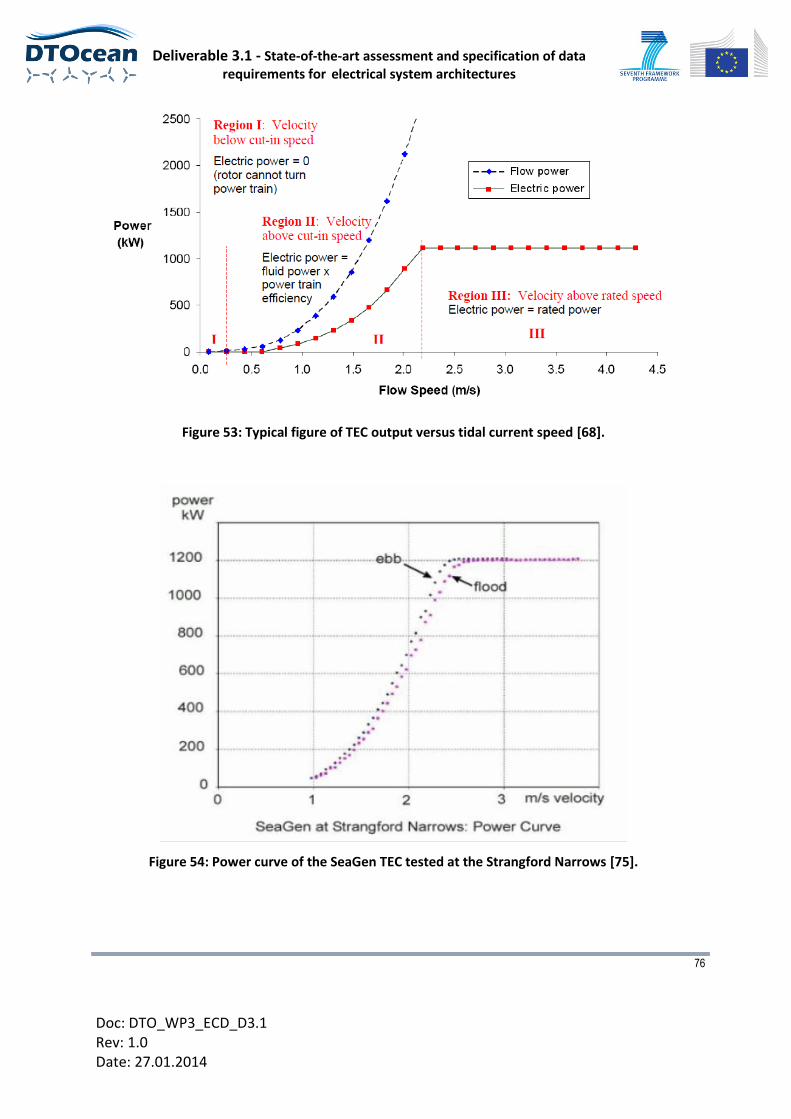
Deliverable 3.1 - State-of-the-art assessment and specification of data requirements for electrical system architectures
76
Doc: DTO_WP3_ECD_D3.1 Rev: 1.0 Date: 27.01.2014
Figure 53: Typical figure of TEC output versus tidal current speed [68].
Figure 54: Power curve of the SeaGen TEC tested at the Strangford Narrows [75].
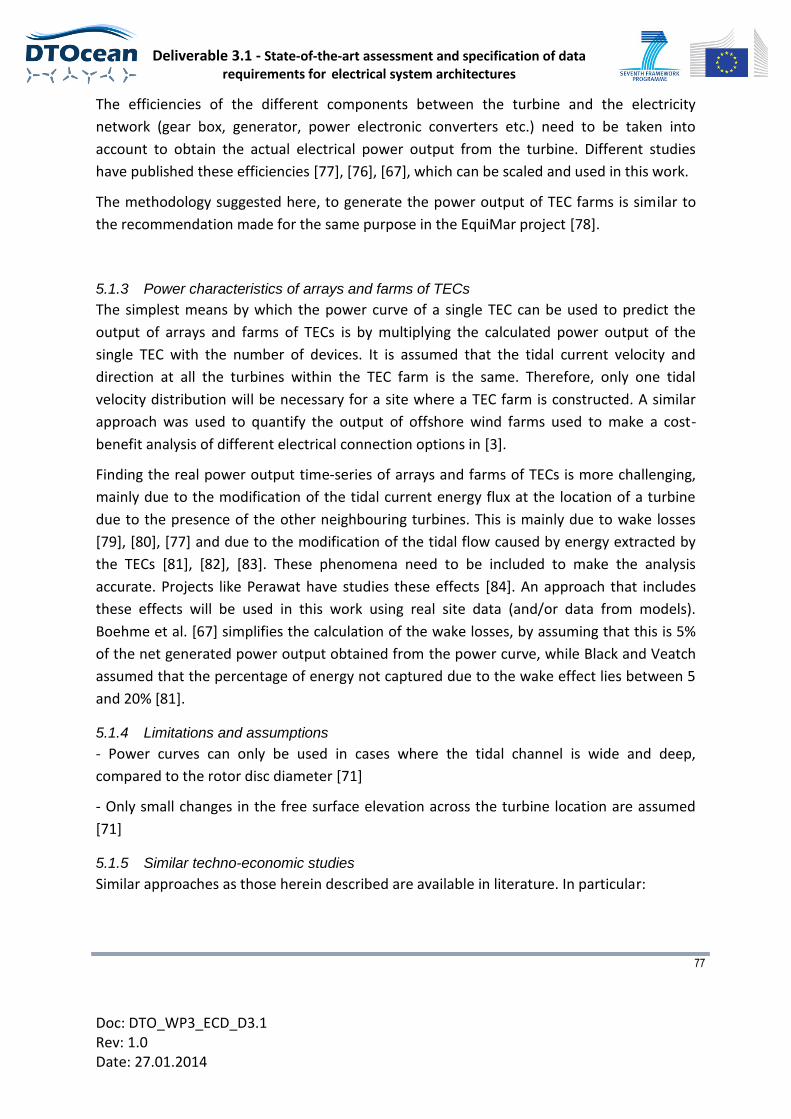
Deliverable 3.1 - State-of-the-art assessment and specification of data requirements for electrical system architectures
77
Doc: DTO_WP3_ECD_D3.1 Rev: 1.0 Date: 27.01.2014
The efficiencies of the different components between the turbine and the electricity
network (gear box, generator, power electronic converters etc.) need to be taken into
account to obtain the actual electrical power output from the turbine. Different studies
have published these efficiencies [77], [76], [67], which can be scaled and used in this work.
The methodology suggested here, to generate the power output of TEC farms is similar to
the recommendation made for the same purpose in the EquiMar project [78].
5.1.3 Power characteristics of arrays and farms of TECs
The simplest means by which the power curve of a single TEC can be used to predict the
output of arrays and farms of TECs is by multiplying the calculated power output of the
single TEC with the number of devices. It is assumed that the tidal current velocity and
direction at all the turbines within the TEC farm is the same. Therefore, only one tidal
velocity distribution will be necessary for a site where a TEC farm is constructed. A similar
approach was used to quantify the output of offshore wind farms used to make a cost-
benefit analysis of different electrical connection options in [3].
Finding the real power output time-series of arrays and farms of TECs is more challenging,
mainly due to the modification of the tidal current energy flux at the location of a turbine
due to the presence of the other neighbouring turbines. This is mainly due to wake losses
[79], [80], [77] and due to the modification of the tidal flow caused by energy extracted by
the TECs [81], [82], [83]. These phenomena need to be included to make the analysis
accurate. Projects like Perawat have studies these effects [84]. An approach that includes
these effects will be used in this work using real site data (and/or data from models).
Boehme et al. [67] simplifies the calculation of the wake losses, by assuming that this is 5%
of the net generated power output obtained from the power curve, while Black and Veatch
assumed that the percentage of energy not captured due to the wake effect lies between 5
and 20% [81].
5.1.4 Limitations and assumptions
- Power curves can only be used in cases where the tidal channel is wide and deep,
compared to the rotor disc diameter [71]
- Only small changes in the free surface elevation across the turbine location are assumed
[71]
5.1.5 Similar techno-economic studies
Similar approaches as those herein described are available in literature. In particular:
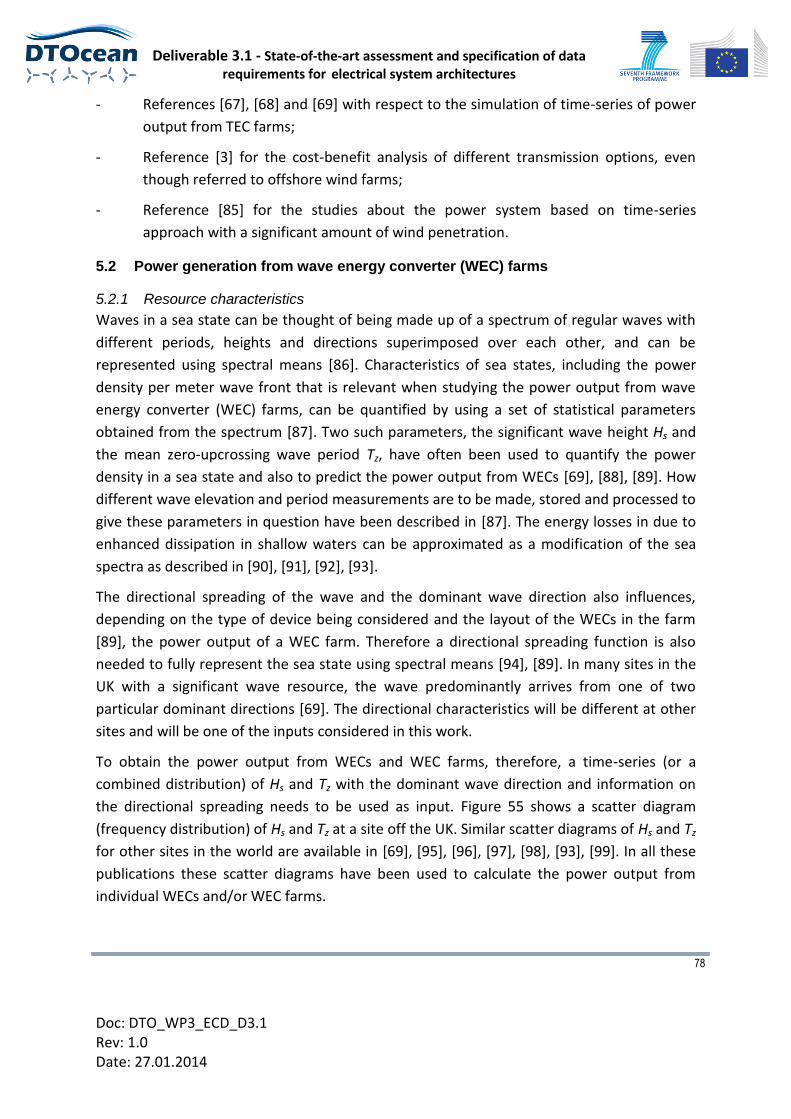
Deliverable 3.1 - State-of-the-art assessment and specification of data requirements for electrical system architectures
78
Doc: DTO_WP3_ECD_D3.1 Rev: 1.0 Date: 27.01.2014
- References [67], [68] and [69] with respect to the simulation of time-series of power
output from TEC farms;
- Reference [3] for the cost-benefit analysis of different transmission options, even
though referred to offshore wind farms;
- Reference [85] for the studies about the power system based on time-series
approach with a significant amount of wind penetration.
5.2 Power generation from wave energy converter (WEC) farms
5.2.1 Resource characteristics
Waves in a sea state can be thought of being made up of a spectrum of regular waves with
different periods, heights and directions superimposed over each other, and can be
represented using spectral means [86]. Characteristics of sea states, including the power
density per meter wave front that is relevant when studying the power output from wave
energy converter (WEC) farms, can be quantified by using a set of statistical parameters
obtained from the spectrum [87]. Two such parameters, the significant wave height Hs and
the mean zero-upcrossing wave period Tz, have often been used to quantify the power
density in a sea state and also to predict the power output from WECs [69], [88], [89]. How
different wave elevation and period measurements are to be made, stored and processed to
give these parameters in question have been described in [87]. The energy losses in due to
enhanced dissipation in shallow waters can be approximated as a modification of the sea
spectra as described in [90], [91], [92], [93].
The directional spreading of the wave and the dominant wave direction also influences,
depending on the type of device being considered and the layout of the WECs in the farm
[89], the power output of a WEC farm. Therefore a directional spreading function is also
needed to fully represent the sea state using spectral means [94], [89]. In many sites in the
UK with a significant wave resource, the wave predominantly arrives from one of two
particular dominant directions [69]. The directional characteristics will be different at other
sites and will be one of the inputs considered in this work.
To obtain the power output from WECs and WEC farms, therefore, a time-series (or a
combined distribution) of Hs and Tz with the dominant wave direction and information on
the directional spreading needs to be used as input. Figure 55 shows a scatter diagram
(frequency distribution) of Hs and Tz at a site off the UK. Similar scatter diagrams of Hs and Tz
for other sites in the world are available in [69], [95], [96], [97], [98], [93], [99]. In all these
publications these scatter diagrams have been used to calculate the power output from
individual WECs and/or WEC farms.
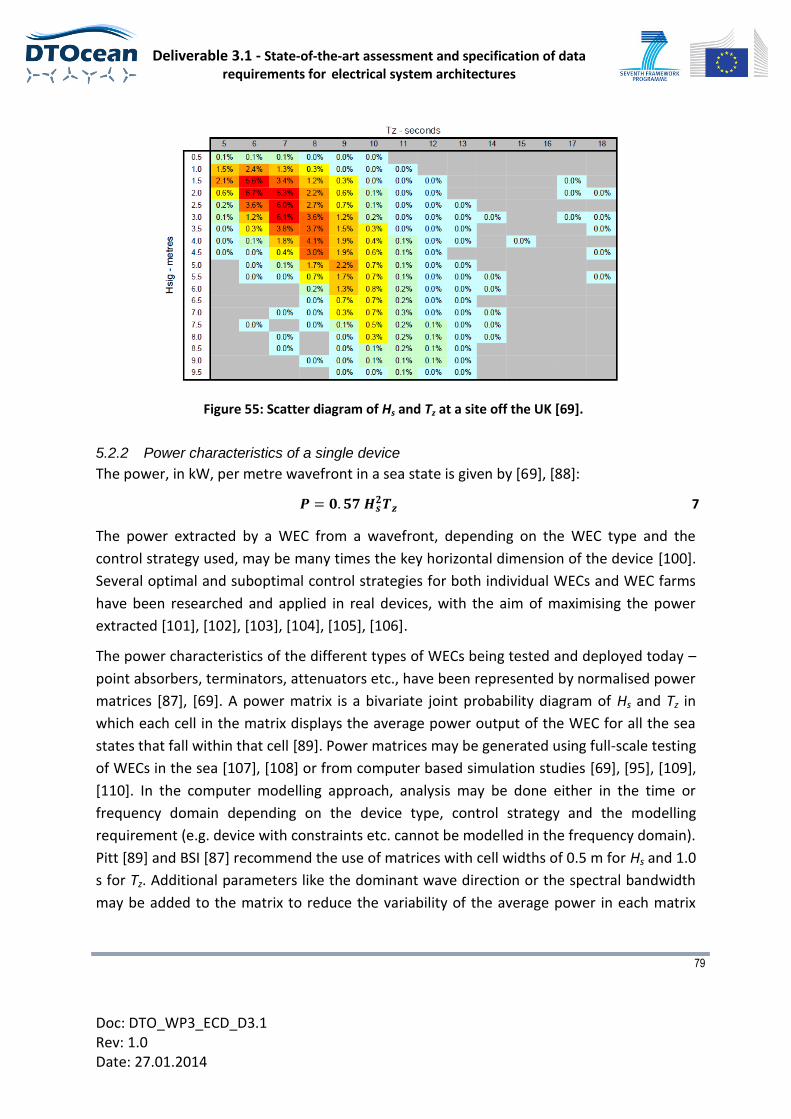
Deliverable 3.1 - State-of-the-art assessment and specification of data requirements for electrical system architectures
79
Doc: DTO_WP3_ECD_D3.1 Rev: 1.0 Date: 27.01.2014
Figure 55: Scatter diagram of Hs and Tz at a site off the UK [69].
5.2.2 Power characteristics of a single device
The power, in kW, per metre wavefront in a sea state is given by [69], [88]:
7
The power extracted by a WEC from a wavefront, depending on the WEC type and the
control strategy used, may be many times the key horizontal dimension of the device [100].
Several optimal and suboptimal control strategies for both individual WECs and WEC farms
have been researched and applied in real devices, with the aim of maximising the power
extracted [101], [102], [103], [104], [105], [106].
The power characteristics of the different types of WECs being tested and deployed today –
point absorbers, terminators, attenuators etc., have been represented by normalised power
matrices [87], [69]. A power matrix is a bivariate joint probability diagram of Hs and Tz in
which each cell in the matrix displays the average power output of the WEC for all the sea
states that fall within that cell [89]. Power matrices may be generated using full-scale testing
of WECs in the sea [107], [108] or from computer based simulation studies [69], [95], [109],
[110]. In the computer modelling approach, analysis may be done either in the time or
frequency domain depending on the device type, control strategy and the modelling
requirement (e.g. device with constraints etc. cannot be modelled in the frequency domain).
Pitt [89] and BSI [87] recommend the use of matrices with cell widths of 0.5 m for Hs and 1.0
s for Tz. Additional parameters like the dominant wave direction or the spectral bandwidth
may be added to the matrix to reduce the variability of the average power in each matrix
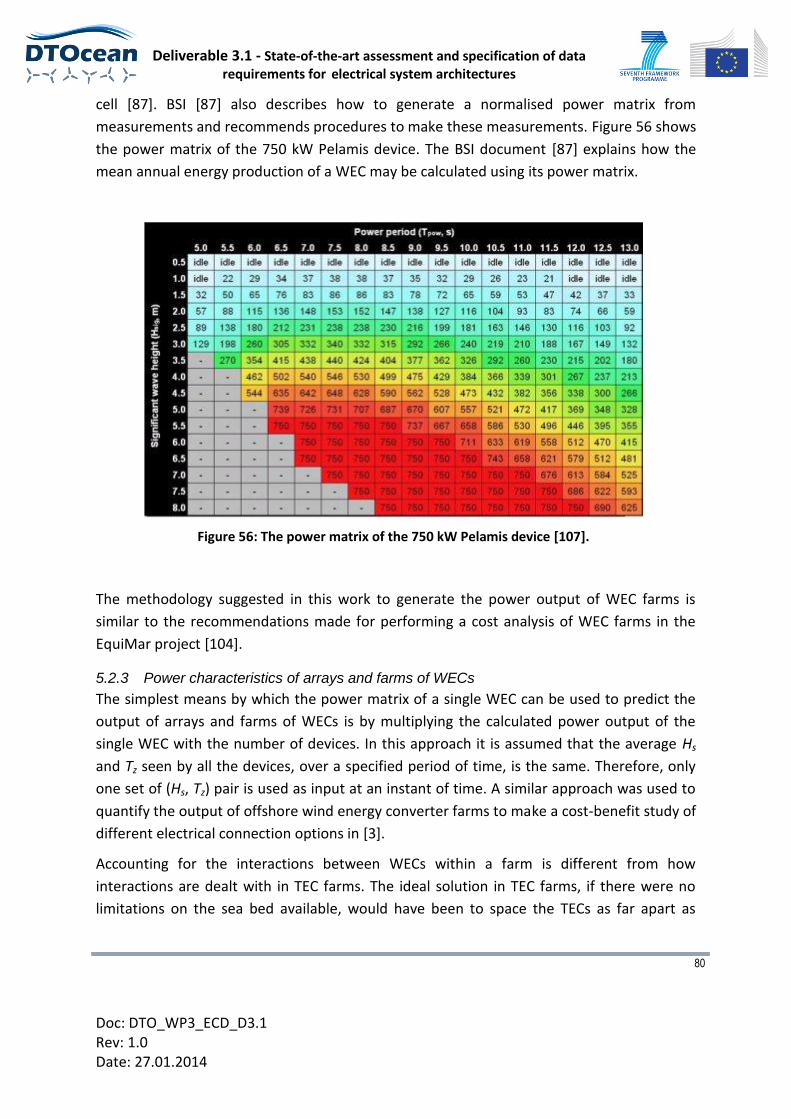
Deliverable 3.1 - State-of-the-art assessment and specification of data requirements for electrical system architectures
80
Doc: DTO_WP3_ECD_D3.1 Rev: 1.0 Date: 27.01.2014
cell [87]. BSI [87] also describes how to generate a normalised power matrix from
measurements and recommends procedures to make these measurements. Figure 56 shows
the power matrix of the 750 kW Pelamis device. The BSI document [87] explains how the
mean annual energy production of a WEC may be calculated using its power matrix.
Figure 56: The power matrix of the 750 kW Pelamis device [107].
The methodology suggested in this work to generate the power output of WEC farms is
similar to the recommendations made for performing a cost analysis of WEC farms in the
EquiMar project [104].
5.2.3 Power characteristics of arrays and farms of WECs
The simplest means by which the power matrix of a single WEC can be used to predict the
output of arrays and farms of WECs is by multiplying the calculated power output of the
single WEC with the number of devices. In this approach it is assumed that the average Hs
and Tz seen by all the devices, over a specified period of time, is the same. Therefore, only
one set of (Hs, Tz) pair is used as input at an instant of time. A similar approach was used to
quantify the output of offshore wind energy converter farms to make a cost-benefit study of
different electrical connection options in [3].
Accounting for the interactions between WECs within a farm is different from how
interactions are dealt with in TEC farms. The ideal solution in TEC farms, if there were no
limitations on the sea bed available, would have been to space the TECs as far apart as
Deliverable 3.1 - State-of-the-art assessment and specification of data requirements for electrical system architectures
81
Doc: DTO_WP3_ECD_D3.1 Rev: 1.0 Date: 27.01.2014
possible so as to make the wake effect, affecting the power capture by a downstream TECs,
negligible. Within WEC farms, the control applied on the individual WECs, the spacing of the
WECs within the farm, the farm layout and the resource characteristics (Hs, Tz and dominant
wave direction) determine how each WEC interacts hydrodynamically with the other WECs.
This in turn influences the power output of the farm. The motion of each WEC, which can be
controlled, determines these hydrodynamic interactions and gives the possibility of applying
different control strategies to maximise the net power output of the farm. Several optimal
and suboptimal control strategies for WEC farms have been researched and applied in real
devices, with the aim of maximising the power extracted [101], [102], [103], [104], [105],
[106]. Projects like Perawat have studied the hydrodynamic interactions between WECs in
farms and its influence on the net power output [84]. Publications on the hydrodynamic
interactions and the park effect in farms of WECs and their influence on the power output of
arrays have been reviewed by Babarit [111]. The effects of hydrodynamic interactions will
be included in this work and will be supported by both modelled data and some real site
data. In some techno-economic analysis with large WEC farms, the interactions between the
WECs have been incorporated as ‘array losses’ that is reduced from the net power output
[67]. AMEC [112] describes a simplified alternate method to include the interactions.
The dominant wave direction needs to be accounted for when generating the power matrix.
The dominant wave direction and the directional spreading have a direct influence on the
power output of WEC farms. One option to include the direction effect would be to have
separate power matrices for a range of dominant wave directions. Another option would be
to treat directionality using an angular attenuation factor as done by Boehme et al. [67].
Borgarino et al. [95] identify two types of power matrices – omnidirectional power matrices
and directionally resolved power matrices. They are to be selected depending on the water
depth at the farm site and the type of WEC under consideration [89]. A simplified method to
approximate the effects of changing wave directions has been discussed by AMEC [112].
5.2.4 Limitations and assumptions
- The statistics involved in generating power matrices for WECs means there would be some
uncertainty involved in the furnished power values [89]
- Using frequency domain analysis enables the use of linear theory, assuming that the wave
elevation is small when compared to the wavelength and the water depth.
5.2.5 Similar techno-economic studies
Similar approaches as those herein described are available in literature. In particular:
Deliverable 3.1 - State-of-the-art assessment and specification of data requirements for electrical system architectures
82
Doc: DTO_WP3_ECD_D3.1 Rev: 1.0 Date: 27.01.2014
- References [88] and [93] with respect to the simulation of time-series of power
output from a WEC;
- Reference [113] for the generation of a time-series of power output from a WEC
farm to be used aimed to the estimation of costs associated with wave energy. See
also for WEC farms References [114], [115] and [116];
- Reference [110] for the estimation of average power output over time for different
WEC types.

Deliverable 3.1 - State-of-the-art assessment and specification of data requirements for electrical system architectures
83
Doc: DTO_WP3_ECD_D3.1 Rev: 1.0 Date: 27.01.2014
Conclusions 6
The work done within this document represents the introductory review of components,
methods and technologies in the field of electrical system architecture all over DTOcean
project and more specifically within Work Packages 3 (Electrical System Architecture) and
the 7 (Design Tool Development & Operation).
The literature survey of components and offshore and onshore electrical networks has been
focused on providing the different technological alternatives, but also some aspects in terms
of cost modelling and reliability have been investigated because of their importance in the
global targets of DTOcean.
The tasks in WP3 which will be exploiting the results of such documents directly will be:
- Task 3.3: Offshore electrical network layout modelling and design, because at that
stage the electrical network layout and technologies considerations studied will be
included in a single cost function.
- Task 3.4: Offshore electrical network components selection
- Task 3.5: Offshore substation design
- Task 3.6: Enabling Technologies
- Task 3.7: Robustness/Reliability Assessment
Similarly, the task in WP7 which will take into account the literature review herein included
is essentially Task 7.3 (Collection of models for ocean energy arrays). It will deal with
distributed parameters algorithms for the calculation of the efficiency of the electrical
connection scheme depending on the transmission voltage, cable section and the presence
of other hardware (transformer, converter etc.) and reliability and cost models for the
electrical components of the connection infrastructure.
Deliverable 3.1 - State-of-the-art assessment and specification of data requirements for electrical system architectures
84
Doc: DTO_WP3_ECD_D3.1 Rev: 1.0 Date: 27.01.2014
References 7
[1] R. Alcorn and D. O'Sullivan, Electrical Design for Ocean Wave and Tidal Energy
Systems, IET- Institution of Engineering and Technology, 2013.
[2] Econnect, "Round 3 Offshore Wind Farm Connection Study Version 1.0," The Crown
Estate, London, 2008.
[3] P. Djapic and G. Strbac, "Cost Benefit Methodology for Optimal Design of Offshore
Transmission Systems," Department for Business, Enterprise and Regulatory
Reforms, 2008.
[4] P. Gardner, L. M. Craig and G. J. Smith, "Electrical Systems for Offshore Wind Farms,"
in 20th BWEA conference, 1998.
[5] JRD Cable Systems Ltd., "Wave Hub Vital Connections for a Ground Breaking Wave
Energy Project," JRD Cable Systems Ltd., 2010. [Online]. Available:
http://www.subseauk.com/. [Accessed 30 Dec 2013].
[6] M. Santos, F. Salcedo, D. Ben Haim, J. Mendia Lopez, P. Ricci, J. L. Villate, J. Khan, D.
Leon, S. Arabi, A. Moshref, G. Bhuyan, A. Blavette, D. O'Sullivan and R. Alcorn,
"Integrating wave and tidal current power : Case Studies Through Modelling and
Simulation," IEA-OES, 2011.
[7] ABB, "XLPE Submarine Cable Systems Attachment to XLPE Land Cable Systems -
Users Guide," ABB, April 2010. [Online]. Available: http://www.abb.com/. [Accessed
30 Dec 2013].
[8] S. Lundberg, "Performance comparison of wind park configurations - Tech. Rep.
30R," August 2003. [Online]. Available:
http://www.elteknik.chalmers.se/Publikationer/EMKE.publ/Abstracts/2003/%Stefan
rapport.pdf.
[9] ABB, «Power cables for land and sea,» ABB, 2013. [En línea]. Available:
http://www.abb.co.uk/. [Último acceso: 30 Dec 2013].
[10] Hahne, «Catalogue 16-33/19kV Three cores Cu/XLPE/SWA/PVC Flame-retardant
Power Cable,» [En línea]. Available: http://en.hanhe-
cable.com/news_detail/newsId=a70f8451-fcef-45bc-9558-5cc873431db4.html.
[11] Oceanteam Engineering, "Oceanteam Engineering," Oceanteam Engineering, August
Deliverable 3.1 - State-of-the-art assessment and specification of data requirements for electrical system architectures
85
Doc: DTO_WP3_ECD_D3.1 Rev: 1.0 Date: 27.01.2014
2012. [Online]. Available: http://www.oceanteam.nl/. [Accessed 30 Dec 2013].
[12] New Zealand Boating Website, [En línea]. Available: http://www.boaties.co.nz.
[13] Nexans Cables, [Online]. Available: http://www.nexans.es/eservice/Spain-
es_ES/navigate_-18/Global_expert_in_cables_and_cabling_system.html.
[14] E. Zaccone, "Mechanical aspects of submarine cable armour," in ICC Submarine
cables, Seattle, 2012.
[15] J. Khan, G. S. Bhuyan and A. Moshref, "Potential opportunities and differences
associated with integration of ocean wave and marine current energy plants in
comparison to wind energy," IEA-OES, 2009.
[16] "Global Perspectives Deep & Ultra-deepwater Technology & Projects Report 2008-
12," Infield Systems, [Online]. Available: http://www.infield.com/. [Accessed 26 12
2013].
[17] "Umbilical Systems," Technip, 07 2011. [Online]. Available:
http://www.technip.com/en. [Accessed 26 12 2013].
[18] Norsok Standard, "Subsea production control umbilical," Norsok Standard, 1995.
[19] A. Pleym, "Electric power supply – challenges and opportunities A possible roadmap
to the Arctic," OG21 National Technology Strategy, [Online]. Available:
http://www.forskningsradet.no/. [Accessed 26 12 2013].
[20] ABB, "World’s longest , most powerful dynamic AC cable Goliat floating oil and gas
platform , Barents Sea," ABB, [Online]. Available: http://www.abb.com/. [Accessed
30 Dec 2013].
[21] MARINTEK, "Testing and verification of dynamic power cables," SINTEF, [Online].
Available: http://www.sintef.no/. [Accessed 30 Dec 2013].
[22] P. R. Thies, L. Johanning and G. H. Smith, "Assessing mechanical loading regimes and
fatigue life of marine power cables in marine energy applications," Proceedings of
the Institution of Mechanical Engineers, Part O: Journal of Risk and Reliability, vol.
226, no. 1, pp. 18-32, 2011.
[23] MARINA Project, "Efficient solutions for energy pickup and transport to grid
connection point on-shore," [Online]. Available: http://www.marina-platform.info/.
Deliverable 3.1 - State-of-the-art assessment and specification of data requirements for electrical system architectures
86
Doc: DTO_WP3_ECD_D3.1 Rev: 1.0 Date: 27.01.2014
[24] Hydro Group plc., [Online]. Available: http://www.hydrogroupplc.com/.
[25] MacArtney Technology, [Online]. Available: http://macartney.com/.
[26] J&S Complete Engineering and equipment support solutions, "Subsea Repair Joint,"
[Online]. Available: http://www.jands.co.uk/files/Subsea%20Repair%20Joint_0.pdf.
[27] Project CORES - Grant Agreements number 213633 - Project Title: Components for
Ocean Renewable Energy, "Deliverable D3.05 - Specification of power umbilical
components," 2009.
[28] Trelleborg, "Bending Restrictors Brochure," [Online]. Available:
http://www.trelleborg.com.
[29] Trelleborg, «Bending Stiffener brochure,» [En línea]. Available:
http://www.trelleborg.com.
[30] C. Diumegard and P. Fellows, "Installation of metallic tube umbilicals in 3,000 meters
water," in Proceedings of the Offshore technology Conference, 5-8 May 2003,
Houston, Texas, U.S.A., 2003.
[31] Marine and Coastguard Agency, "MGN 372. Offshore Renewable Energy Installations
(OREIs): Guidance to Mariners Operating in the Vicinity of UK OREIs," [Online].
Available: http://www.dft.gov.uk/mca/mgn372.pdf.
[32] AISM (Association Internationale de Signalisation Maritime) - IALA (International
Association of Marine Aids to Navigation and Lighthouse Authorities), «IALA
Recommendation O-139 on the marking of Man-Made offshore Structures,» [En
línea]. Available: http://www.orga.nl/pdf/IALA%20O-
139%20The%20marking%20of%20man-
made%20offshore%20structures%20%28Dec%2008%29.pdf .
[33] Wave Hub, "About Wave Hub," Wave Hub, [Online]. Available:
http://www.wavehub.co.uk/. [Accessed 30 Dec 2013].
[34] Uppsala University, "Wave Power Project - Lysekil," [Online]. Available:
http://www.el.angstrom.uu.se/forskningsprojekt/WavePower/Lysekilsprojektet_E.h
tml.
[35] Ocean Power Technologies, [Online]. Available:
http://www.oceanpowertechnologies.com/.

Deliverable 3.1 - State-of-the-art assessment and specification of data requirements for electrical system architectures
87
Doc: DTO_WP3_ECD_D3.1 Rev: 1.0 Date: 27.01.2014
[36] Schneider Electrics, [Online]. Available: http://www.schneider-
electric.com/solutions/WW/en/sol/4665273-subsea-power-distribution-module.
[37] Generic Electric Company, "Subsea Power and processing Systems," [Online].
Available: http://www.ge-
energy.com/products_and_services/products/subsea_power_and_processing_syste
ms/.
[38] Siemens Energy, "Siemens Subsea Power Grid," [Online]. Available:
http://www.energy.siemens.com/hq/en/industries-utilities/oil-
gas/applications/subsea-power-
grid.htm?stc=wwecc120543&ef_id=UtAmRgAAAR5srHoN:20140110165638:s#conte
nt=Description.
[39] J. Khan, G. S. Bhuyan y A. Moshref, «Potential opportunities and differences
associated with integration of ocean wave and marine current energy plants in
comparison to wind energy,» IEA-OES, 2009.
[40] ABB Pereira Factory , «Special Transformers Applications,» [En línea]. Available:
http://www02.abb.com/global/coabb/coabb051.nsf/0/f7daef2a7f60ab07c12577880
06794ae/$file/Transformadores%20para%20Aplicaciones%20Especiales.pdf.
[41] Schneider Electric, "Impact of Subsea Processing Power Distribution: Subsea
Switchgear Module A Key Enabling Component in Subsea Installations," Schneider
Electric, 2011. [Online]. Available: http://www.schneider-electric.com/. [Accessed 30
Dec 2013].
[42] R. Sletten, T. Rønhovd y A. G. Hay, «Subsea switchgear apparatus». USA Patente US
7952855 B2, 2007.
[43] Siemens, «Bennex Subsea Products,» [En línea]. Available:
http://www.energy.siemens.com/hq/en/industries-utilities/oil-
gas/applications/subsea/bennex-subsea-products.htm.
[44] E. Tedeschi, "SEA2GRID project - Grid connection of Wave Energy Converters:
investigation on storage requirements and solutions, Final Report," March 2013.
[45] Electricity Storage association (ESA), "Technology and Comparison," 2003. [Online].
Available: http://www.electricitystorage.org/about/welcome.
[46] International Energy Agency IEA, "Variability of Wind Power and other Renewables:
Deliverable 3.1 - State-of-the-art assessment and specification of data requirements for electrical system architectures
88
Doc: DTO_WP3_ECD_D3.1 Rev: 1.0 Date: 27.01.2014
Management Options and Strategies," 2005. [Online]. Available:
http://www.uwig.org/IEA_Report_on_variability.pdf.
[47] D. O'Sullivan, D. Murray, J. Hayes, M. G. Egan and A. W. Lewis, "The Benefits of
Device Level Short Term Energy Storage in Ocean Wave Energy Converters," in
Energy Storage in the Emerging Era of Smart Grids, R. Carbone, Ed., InTech, 2011.
[48] D. Murray, M. Egan, J. Hayes and D. O'Sullivan, "Application of Supercapacitor
Energy Storage for a Wave Energy Converter System," in Proceedings of the 8th
European Wave and Tidal Energy Conference (EWTEC09), Uppsala, Sweden, 2009.
[49] J. Sjolte, G. Tjensvoll and M. Molinas, "All-electric Wave Energy Converter with
Stand-alone 600 VDC Power System and Ultracapacitor Bank," in Proc. of the Electric
Vehicles and Renewable Energy Conference 2012 (EVER12), Montecarlo, Monaco,
2012.
[50] S. Swierczynski, R. Teodorescu, C. N. Rasmussen, P. Rodriguez and H. Vikelgaard,
"Overview of the Energy Storage Systems for Wind Power Integration
Enhancement," in Proceedings of the International Symposium of Industrial
Electronicss (ISIE 2010), Bari, Italy, 2010.
[51] A. Darvill, "Energy Resources: Pumped storage reservoirs," October 2013. [Online].
Available: http://www.darvill.clara.net/altenerg/pumped.htm.
[52] E. B. Agamloh, I. Husain and A. Safayet, "Investigation of the Electrical System Design
Concept and Grid Connection of Ocean Energy Devices to an Offshore Compressed
Energy Storage System," in Proc. Of the Energy Conversion Conference and
Exposition 2012 (ECCE12), Raleigh, NC, USA, 2012.
[53] MatterNetwork, "2010: The Year of Compressed Air Energy Storage?," [Online].
Available: http://www.matternetwork.com/2010/8/2010-year-compressed-air-
energy.cfm.
[54] A. F. d. O. Falcão, "Control of an oscillating-wave-power column wave power plant
for maximum energy production," Applied Ocean Research, vol. 24, no. 2, pp. 73-82,
2002.
[55] S. Ceballos Recio, D. O’Sullivan and I. Lopez Ropero, "Efficiency and Power Quality
Optimization of a Wells Turbine Oscillating Water Column Device," (in press).
[56] P. Fairley, "Flywheels keep the grid in tune," IEEE Spectrum, vol. 48, no. 7, pp. 16-18,
Deliverable 3.1 - State-of-the-art assessment and specification of data requirements for electrical system architectures
89
Doc: DTO_WP3_ECD_D3.1 Rev: 1.0 Date: 27.01.2014
2011.
[57] Alaska Center for Energy and Power, "Alaska Energy Wiki - Flywheels & Capacitors,"
[Online]. Available: http://energy-alaska.wikidot.com/flywheels-and-capacitors.
[58] J. Aubry, P. Bydlowsky, B. Multon, H. Ben Ahmed and B. Borgarino, "Energy Storage
System Sizing for Smoothing Power Generation of Direct Wave Energy Converters,"
in Proc of the 3rd International Conference on Ocean Energy 2010 (ICOE10), Bilbao,
Spain, 2010.
[59] J. Hadjipaschalis, A. Poullikkas y V. Efthimiou, «Overview of current and future
energy storage technologies for electric power applications,» Renewable and
Sustainable Energy Reviews, vol. 13, pp. 1513-1522, 2009.
[60] J. Lopez Mendia and e. alii, "Preliminary economic assessment and analysis of grid
connection schemes for ocean energy arrays," in 3rd international Conference on
Ocean Energy, Bilbao, Spain, 6 October 2010, 2010.
[61] Project Equimar, "Deliverable 5.1. "Guidance protocols on choosing of electrical
connection configurations"," 2009.
[62] T. Ackermann, N. Barberis Negra, J. Todorovic and L. Lazaridis, "Evaluation of
electrical Trasmission COncepts for large Offshore Wind Farms," in Proceedings of
Copenhagen Offshore Wind COnference and Exhibition, Copenhagen, Denmark,
2005.
[63] F. M. Faria da Silva, Offshore wind parks electrical connection, Lisbon, Portugal:
Instituto Superior Técnico, Master Thesis, 2008.
[64] N. B. Negra, J. Todorovic and T. Ackermann, "Loss evaluation of HVAC and HVDC
transmission solutions for large offshore wind farms," Electric Power Systems
Research, vol. 76, no. 11, 2006.
[65] Project MARINA (Marine Renewable Integrated Application Platform), "DC vs. AC
Transmission System," 2012.
[66] Department of Energy and Climate Change, "Electricity Generation Costs 2013,"
Department of Energy and Climate Change, London, 2013.
[67] T. Boehme, J. Taylor, R. Wallace and J. Bialek, "Matching Renewable Electricity
Generation with Demand," Scottish Executive, Edinburgh, 2006.
Deliverable 3.1 - State-of-the-art assessment and specification of data requirements for electrical system architectures
90
Doc: DTO_WP3_ECD_D3.1 Rev: 1.0 Date: 27.01.2014
[68] G. Hagerman, B. Polagye, R. Bedard and M. Previsic, "Methodology for Estimating
Tidal Current Energy Resources and Power Production by Tidal In-Stream Energy
Conversion ( TISEC ) Devices," Electric Power Research Institute, 2006.
[69] Environmental Change Institute, University of Oxford, "Variability of UK marine
resources," The Carbon Trust, London, 2005.
[70] R. Swift, "Assessment of Performance of Tidal Energy Conversion Systems," British
Standards Institute, London, 2009.
[71] L. S. Blunden and A. S. Bahaj, "Tidal energy resource assessment for tidal stream
generators," Proceedings of the Institution of Mechanical Engineers, Part A: Journal
of Power and Energy, vol. 221, pp. 137-146, 2007.
[72] S. E. Ben Elghali, M. E. H. Benbouzid and J. F. Charpentier, "Modelling and control of
a marine current turbine-driven doubly fed induction generator," IET Renewable
Power Generation, vol. 4, no. 1, pp. 1-11, 2008.
[73] RWE npower renewables, "Wind Turbine Power Calculations," [Online]. Available:
http://www.raeng.org.uk/. [Accessed 11 Jan 2014].
[74] IEC, Power Performance Testing, IEC Standards, 2005.
[75] Marine Current Turbines, "DNV Confirms SeaGen's Powerful Performance," Marine
Current Turbines, [Online]. Available: http://www.marineturbines.com/. [Accessed
11 Jan 2014].
[76] R. Bedard, M. Previsic, O. Siddiqui, G. Hagerman and M. Robinson, "Survey and
Characterization Tidal In Stream Energy Conversion (TISEC) Devices," Electric Power
Research Institute, 2005.
[77] The Engineering Business Ltd, "Stingray tidal stream energy device - phase 3,"
Department of Trade and Industry, 2005.
[78] P. Ricci, J. Lopez, J. L. Villate and T. Stallard, "Deliverable D7.1 Summary of Attributes
of Cost Models used by different Stakeholders," EquiMar, 2009.
[79] L. Bai, R. R. G. Spence and G. Dudziak, "Investigation of the influence of array
arrangement and spacing on tidal energy converter (TEC) performance using a 3-
dimensional CFD model," in 8th European Wave and Tidal Energy, Uppsala, 2009.
[80] P. Mycek, B. Gaurier, G. Germain, G. Pinon and E. Rivoalen, "Numerical and
Deliverable 3.1 - State-of-the-art assessment and specification of data requirements for electrical system architectures
91
Doc: DTO_WP3_ECD_D3.1 Rev: 1.0 Date: 27.01.2014
Experimental Study of the Interaction between Two Marine Current Turbines," in 9th
European Wave and Tidal Energy Conference, Southampton, 2011.
[81] Black & Veatch Limited, "UK Tidal Current Resource & Economics," The Carbon Trust,
2011.
[82] S. Couch and I. Bryden, "The impact of energy extraction on tidal flow development,"
in 3rd International Conference on Marine Renewable Energy, Blyth, 2004.
[83] Black & Veatch Limited, "Phase II UK tidal stream energy resource assessment," The
Carbon Trust, 2005.
[84] R. R. Smith, I. Bryden, M. Folley, V. Martin and et al, "The PerAWaT project:
Performance Assessment of Wave and Tidal Array Systems," in 3rd International
Conference on Ocean Energy, Bilbao, 2010.
[85] T. Boehme, R. Wallace and G. Harrison, "Applying Time Series to Power Flow Analysis
in NetworksWith HighWind Penetration," IEEE Transactions on Power Systems, vol.
22, no. 3, pp. 951-957, 2007.
[86] D. J. T. Carter, "Estimation of wave spectra from wave height and period," Institute
of Oceanographic Sciences, 1982.
[87] British Standards Institute, "Marine energy – Wave, tidal and other water current
converters (PD IEC/TS 62600-100:2012 and PD IEC/TS 62600-200:2012)," British
Standards Institute, 2012.
[88] G. Hagerman and R. Bedard, "Guidelines for Preliminary Estimation of Power
Production by Offshore Wave Energy Conversion Devices," Electric Power Research
Institute, 2003.
[89] E. Pitt, "Assessment of Performance of Wave Energy Conversion Systems," British
Standards Institute, London, 2009.
[90] E. Bouws, H. Gunther and W. Rosenthal, "Similarity of the wind wave spectrum in
finite water depth: 1. Spectral form," Journal of Geophysical Research, vol. 90, no.
C1, pp. 975-986, 1985.
[91] S. A. Kitaigordskii, V. P. Krasitskii and M. M. Zaslavskii, "On Phillips’ theory of
equilibrium range in the spectra of wind-generated gravity waves," Journal of
Physical Oceanography, vol. 5, pp. 410-420, 1975.
Deliverable 3.1 - State-of-the-art assessment and specification of data requirements for electrical system architectures
92
Doc: DTO_WP3_ECD_D3.1 Rev: 1.0 Date: 27.01.2014
[92] E. Bouws, H. Gunther, W. Rosenthal and C. L. Vincent, "Similarity of the wind wave
spectrum in finite water depth: Part 2: Statistical relations between shape and
growth stage parameters," Ocean Dynamics, vol. 40, no. 1, pp. 1-24, 1985.
[93] A. M. Fernandes and N. Fonseca, "Finite depth effects on the wave energy resource
and the energy captured by a point absorber," Ocean Engineering, vol. 2013, pp. 13-
26, 2013.
[94] M. A. Donelan, J. Hamilton and W. H. Hui, "Directional spectra of wind-generated
waves," Philosophical Transactions of the Royal Society of London. Series A,
Mathematical and Physical Sciences, vol. 315, no. 1534, p. 509–562, 1985.
[95] D. Silva, E. Rusu and C. Soares, "Evaluation of Various Technologies for Wave Energy
Conversion in the Portuguese Nearshore," Energies, vol. 6, no. 3, p. 1344–1364,
2013.
[96] J. F. Chozas, N. E. H. Jensen, H. C. Sørensen, J. P. Kofoed and A. Kabuth,
"Predictability of the power output of three wave energy technologies in the Danish
North Sea," International Journal of Marine Energy, vol. 1, p. 84–98, 2013.
[97] R. Carballo and G. Iglesias, "A methodology to determine the power performance of
wave energy converters at a particular coastal location," Energy Conversion and
Management, vol. 61, pp. 8-18, 2012.
[98] B. Borgarino, A. Babarit and P. Ferrant, "Impact of wave interactions effects on
energy absorption in large arrays of wave energy converters," Ocean Engineering,
vol. 41, pp. 79-88, 2012.
[99] F. Sharkey, E. Bannon, M. Conlon and K. Gaughan, "Maximising value of electrical
networks for wave energy converter arrays," International Journal of Marine Energy,
vol. 1, pp. 55-69, 2013.
[100] J. Cruz, "The Theory behind the Conversion of Ocean Wave Energy: A Review," in
Ocean Wave Energy: Current Status and Future Prespectives, Springer, 2008, pp. 41-
92.
[101] G. De Backer, M. Vantorre, C. Beels, J. De Rouck and P. Frigaard, "Power absorption
by closely spaced point absorbers in constrained conditions," IET Renewable Power
Generation, vol. 4, no. 6, pp. 579 - 591, 2010.
[102] R. Antonutti and G. E. Hearn, "Optimisation of point-absorber arrays," in 9th
Deliverable 3.1 - State-of-the-art assessment and specification of data requirements for electrical system architectures
93
Doc: DTO_WP3_ECD_D3.1 Rev: 1.0 Date: 27.01.2014
European Wave and Tidal Energy Conference, Southampton, 2011.
[103] H. Yavuz, T. J. Stallard, A. P. McCabe and G. A. Aggidis, "Time series analysis-based
adaptive tuning techniques for a heaving wave energy converter in irregular seas,"
Proceedings of the IMechE Part A: Journal of Power and Energy, vol. 1, pp. 77-90,
2007.
[104] P. Ricci , J. B. Saulnier and A. Falcao, "Point-absorber arrays: a configuration study off
the Portuguese West-Coast," in 7th European Wave and Tidal Energy Conference,
2007.
[105] J. Cruz, R. Sykes, P. Siddorn and R. E. Taylor, "Estimating the loads and energy yield
of arrays of wave energy converters under realistic seas," IET Renewable Power
Generation, vol. 4, no. 6, pp. 488-497, 2010.
[106] E. Vidal, R. H. Hansen and M. M. Kramer, "Early performance assessment of the
electrical output of Wavestar's prototype," in 4th International Conference on Ocean
Energy, 2012.
[107] Pelamis Wave Power, "Pelamis P750 Wave Energy Converter," Pelamis Wave Power,
[Online]. Available: http://educypedia.karadimov.info/library/pelamisbrochure.pdf.
[Accessed 12 Jan 2014].
[108] Wavestar, "Projects," Wavestar, [Online]. Available:
http://wavestarenergy.com/projects. [Accessed 12 Jan 2014].
[109] B. Teillant, R. Costello, J. Weber and J. Ringwood, "Productivity and economic
assessment of wave energy projects through operational simulations," Renewable
Energy, vol. 48, pp. 220-230, 2012.
[110] A. Babarit, J. Hals, M. J. Muliawan, A. Kurniawan, T. Moan and J. Krokstad,
"Numerical benchmarking study of a selection of wave energy converters,"
Renewable Energy, vol. 41, p. 44–63, 2012.
[111] A. Babarit, "On the park effect in arrays of oscillating wave energy converters,"
Renewable Energy, vol. 58, pp. 68-78, 2013.
[112] AMEC Environment and Infrastructure UK Ltd., "UK Wave Energy Resource," The
Carbon Trust, London, 2012.
[113] M. Previsic, J. Epler, M. Hand, D. Heimiller and et al, "The Future Potential of Wave
Power in the United States," United States Department of Energy, Washington DC,
Deliverable 3.1 - State-of-the-art assessment and specification of data requirements for electrical system architectures
94
Doc: DTO_WP3_ECD_D3.1 Rev: 1.0 Date: 27.01.2014
2012.
[114] A. Babarit, H. BenHamed, A. H. Clément, V. Debusschere and et al, "Simulation of
electricity supply of an Atlantic island by offshore wind turbines and wave energy
converters associated with a medium scale local energy storage," Renewable Energy,
vol. 31, no. 2, pp. 153-160, 2006.
[115] T. Stallard , R. Rothschild and G. A. Aggidis, "A comparative approach to the
economic modelling of a large-scale wave power scheme," European Journal of
Operational Research, vol. 185, pp. 884-898, 2008.
[116] G. J. Dalton, R. Alcorn and T. Lewis, "Case study feasibility analysis of the Pelamis
wave energy convertor in Ireland, Portugal and North America," Renewable Energy,
vol. 35, pp. 443-455, 2010.