8. correlation maths dept. m.j.college · 2017-10-05 · perfect positive correlation. we denote...
TRANSCRIPT

8. CORRELATION
Definitions:1. Correlation Analysis attempts to determine the degree of relationship between variables- Ya-Kun-Chou.2. Correlation is an analysis of the covariation between two or more variables.- A.M.Tuttle.
Correlation expresses the inter-dependence of two sets ofvariables upon each other. One variable may be called as (subject)
independent and the other relative variable (dependent). Relativevariable is measured in terms of subject.
Uses of correlation: 1. It is used in physical and social sciences. 2. It is useful for economists to study the relationship between variables like price, quantity etc. Businessmen estimates costs, sales, price etc. using correlation. 3. It is helpful in measuring the degree of relationship between the variables like income and expenditure, price and supply, supply and demand etc.
4. Sampling error can be calculated.5. It is the basis for the concept of regression.
Scatter Diagram:It is the simplest method of studying the relationship
between two variables diagrammatically. One variable isrepresented along the horizontal axis and the second variable alongthe vertical axis. For each pair of observations of two variables, weput a dot in the plane. There are as many dots in the plane as thenumber of paired observations of two variables. The direction ofdots shows the scatter or concentration of various points. This willshow the type of correlation.1. If all the plotted points form a straight line from lower left hand
LECTURE NOTES by DR. J.S.V.R. KRISHNA PRASAD------------------------------------------------------------------------
M.Sc.- PAGE-01
MATHS DEPT.
M.J.COLLEGE

corner to the upper right hand corner then there isPerfect positive correlation. We denote this as r = +1
Perfect positive Perfect Negative Correlation Correlation
r = +1
(r = −1)
OX
YY
XO O X axisX axisX axis
2. If all the plotted dots lie on a straight line falling from upperleft hand corner to lower right hand corner, there is a perfectnegative correlation between the two variables. In this casethe coefficient of correlation takes the value r = -1.
Merits:1. It is a simplest and attractive method of finding the nature
of correlation between the two variables.2. It is a non-mathematical method of studying correlation. It
is easy to understand.3. It is not affected by extreme items.4. It is the first step in finding out the relation between the two
variables.5. We can have a rough idea at a glance whether it is a positive
correlation or negative correlation.
Demerits:By this method we cannot get the exact degree or
correlation between the two variables.Types of Correlation:
Correlation is classified into various types. The mostimportant ones are
LECTURE NOTES by DR. J.S.V.R. KRISHNA PRASAD------------------------------------------------------------------------
M.Sc.- PAGE-02
MATHS DEPT.
M.J.COLLEGE

195
Linear and Non-linear correlation:If the ratio of change between the two variables is a
constant then there will be linear correlation between them.Consider the following.X 2 4 6 8 10 12Y 3 6 9 12 15 18
Here the ratio of change between the two variables is thesame. If we plot these points on a graph we get a straight line.
Computation of correlation:When there exists some relationship between two
variables, we have to measure the degree of relationship. Thismeasure is called the measure of correlation (or) correlationcoefficient and it is denoted by ‘ r’ .Co-variation:
The covariation between the variables x and y is defined as
Cov( x,y) = ( )( )x x y yn
∑ − − where ,x y are respectively means of
x and y and ‘ n’ is the number of pairs of observations.
If the amount of change in one variable does not bear aconstant ratio of the amount of change in the other. Then therelation is called Curvi-linear (or) non-linear correlation. Thegraph will be a curve.
i) Positive and negative.ii) Linear and non-linear.iii) Partial and total.iv) Simple and Multiple.
LECTURE NOTES by DR. J.S.V.R. KRISHNA PRASAD------------------------------------------------------------------------
M.Sc.- PAGE-03
MATHS DEPT.
M.J.COLLEGE

196
Karl pearson’ s coefficient of correlation:Karl pearson, a great biometrician and statistician,
suggested a mathematical method for measuring the magnitude oflinear relationship between the two variables. It is most widelyused method in practice and it is known as pearsonian coefficient ofcorrelation. It is denoted by ‘ r’ . The formula for calculating ‘ r’ is
(i) r = ov( , )σ .σx y
C x y where ,σ σx y are S.D of x and y
respectively.
(ii) r = ∑σ σx y
xyn
(iii) r =2 2
XYX . YΣ
∑ ∑ , X = x x− , Y = y y−
when the deviations are taken from the actual mean we can applyany one of these methods. Simple formula is the third one.
The third formula is easy to calculate, and it is notnecessary to calculate the standard deviations of x and y seriesrespectively.Steps:
1. Find the mean of the two series x and y.2. Take deviations of the two series from x and y.
X = x x− , Y = y y−3. Square the deviations and get the total, of the respective
squares of deviations of x and y and denote by X2 ,Y2 respectively.
4. Multiply the deviations of x and y and get the total andDivide by n. This is covariance.
5. Substitute the values in the formula.
r = cov( , ).σ σx y
x y =
2 2
( ) ( - ) /
) ).
∑ −
∑( − ∑( −
x x y y n
x x y yn n
LECTURE NOTES by DR. J.S.V.R. KRISHNA PRASAD------------------------------------------------------------------------
M.Sc.- PAGE-04
MATHS DEPT.
M.J.COLLEGE

197
The above formula is simplified as follows
r =2 2
XYX . YΣ
∑ ∑, X = x x− , Y = y y−
Example 1:Find Karl Pearson’ s coefficient of correlation from the followingdata between height of father (x) and son (y).
X 64 65 66 67 68 69 70Y 66 67 65 68 70 68 72Comment on the result.
Solution:x Y X = x x−
X = x – 67X2
Y = y y−Y = y - 68
Y2 XY
64 66 -3 9 -2 4 665 67 -2 4 -1 1 266 65 -1 1 -3 9 367 68 0 0 0 0 068 70 1 1 2 4 2 69 68 2 4 0 0 0 70 72 3 9 4 16 12469 476 0 28 0 34 25
469 47667 687 7
x y= = = = ;
Σ= = = =
×∑ ∑
XY =X Y
...
r2 2
25 25 25 0 8130 8528 34 952
Since r = + 0.81, the variables are highly positively correlated. (ie)Tall fathers have tall sons.Working rule (i)We can also find r with the following formula
We have r = ov( , )σ .σx y
C x y
Cov( x,y) = ( )( )x x y yn
∑ − − =n
yxxyyxxy )( −−+Σ
LECTURE NOTES by DR. J.S.V.R. KRISHNA PRASAD------------------------------------------------------------------------
M.Sc.- PAGE-05
MATHS DEPT.
M.J.COLLEGE

198
= xy y x x y yn n n n
Σ Σ Σ Σx - - +
Cov(x,y) = xy yn
Σ− x x y x y - + = xy x y
nΣ
−
x2σ2 22 xx x
nσ
Σ= - , y2σ
2 22 yy yn
σΣ
= -
Now r = ov( , )σ .σx y
C x y
2 22 2.
xy x ynr
x yx yn n
Σ−
= Σ Σ
- -
r2 2 2 2
- ( ) ( )[ ( ) ][ - ( ) ]
n xy x yn x x n y y
Σ Σ Σ=
Σ − Σ Σ ΣNote: In the above method we need not find mean or standarddeviation of variables separately.
Example 2:Calculate coefficient of correlation from the following data.
X 1 2 3 4 5 6 7 8 9Y 9 8 10 12 11 13 14 16 15
x y x2 y2 xy1 9 1 81 92 8 4 64 163 10 9 100 304 12 16 144 485 11 25 121 556 13 36 169 787 14 49 196 988 16 64 256 1289 15 81 225 135
45 108 285 1356 597
LECTURE NOTES by DR. J.S.V.R. KRISHNA PRASAD------------------------------------------------------------------------
M.Sc.- PAGE-06
MATHS DEPT.
M.J.COLLEGE

199
r2 2 2 2
- ( ) ( )[ ( ) ][ - ( ) ]
n xy x yn x x n y y
Σ Σ Σ=
Σ − Σ Σ Σ
( )2 2
9 597 - 45 108
9 285 (45) .(9 1356 (108) )r × ×
× − × − =
5373 - 4860(2565 2025).12204 11664)
r =− −(
513 513 0.95540540 540
= = =×
Working rule (ii) (shortcut method)
We have r = ov( , )σ .σx y
C x y
where Cov( x,y) = ( )( )x x y yn
∑ − −
Take the deviation from x as x – A and the deviation from y asy − B
Cov(x,y) [( - ) - ( )] [( - ) - ( )]x A x A y B y Bn
Σ − −=
1 [( - ) ( - ) - ( - ) ( - )
- ( )( ) ( )( )]
x A y B x A y Bn
x A y B x A y B
= Σ
− − + − −
1 ( - )[( - ) ( - ) - ( - )
( - ) ( - )( )( )
x Ax A y B y Bn n
y B x A y Bx An n
Σ= Σ
Σ Σ −− − +
=
( - )( - ) ( ) ( )
( ) ( ) ( ) ( )
x A y B nAy B xn n
nBx A y x A y Bn
Σ− − −
− − − + − −
LECTURE NOTES by DR. J.S.V.R. KRISHNA PRASAD------------------------------------------------------------------------
M.Sc.- PAGE-07
MATHS DEPT.
M.J.COLLEGE

=( - )( - ) ( ) ( )
( ) ( )
x A y B y B x An
x A y B
Σ− − −
− − − ( ) ( )x A y B+ − −
= ( - )( - ) ( ) ( )x A y B x A y Bn
Σ− − −
Let x- A = u ; y - B = v; x A u y B v− = − = ;
∴Cov (x,y) = uv uvn
Σ−
xσ2 22 2ux u u
nσ σ
Σ= − =
yσ2 22 2vy v v
nσ σ
Σ= − =
2 2 2 2
( )( )
( ) . ( ) ( )
Σ − Σ Σ=
Σ − Σ Σ − Σ ∴ n uv u vr
n u u n v v
X 64 65 66 67 68 69 70Y 66 67 65 68 70 68 72Comment on the result.
Solution:x Y X = x x−
X = x – 67X2
Y = y y−Y = y - 68
Y2 XY
64 66 -3 9 -2 4 665 67 -2 4 -1 1 266 65 -1 1 -3 9 367 68 0 0 0 0 068 70 1 1 2 4 2 69 68 2 4 0 0 0 70 72 3 9 4 16 12469 476 0 28 0 34 25
469 47667 687 7
x y= = ; = =
Σ= = = =
×∑ ∑
XY =X Y
...
r2 2
25 25 25 0 8128 34 952 30 85
Example 3:Find Karl Pearson’ s coefficient of correlation from the followingdata between height of father (x) and son (y).
LECTURE NOTES by DR. J.S.V.R. KRISHNA PRASAD------------------------------------------------------------------------
M.Sc.- PAGE-08
MATHS DEPT.
M.J.COLLEGE

201
r =])([)]([
)()(n2222 vvnuun
vuuvΣ−ΣΣ−Σ
ΣΣ−Σ
2 2(1414 11 (2) ) (1865 11 ( 49) )r × ×
=× − × × − −
11 1393 - 2 (-49)
15421 15421 0.9216783.1115550 18114
= = = +×
X 45 55 56 58 60 65 68 70 75 80 85Y 56 50 48 60 62 64 65 70 74 82 90
X Y u = x-A v = y-B u2 v2 uv45 56 -20 -14 400 196 28055 50 -10 -20 100 400 20056 48 -9 -22 81 484 19858 60 -7 -10 49 100 7060 62 -5 -8 25 64 4065 64 0 -6 0 36 068 65 3 -5 9 25 -1570 70 5 0 25 0 075 74 10 4 100 16 4080 82 15 12 225 144 18085 90 20 20 400 400 400
2 -49 1414 1865 1393
Example 4: Calculate Pearson’ s Coefficient of correlation.
LECTURE NOTES by DR. J.S.V.R. KRISHNA PRASAD------------------------------------------------------------------------
M.Sc.- PAGE-09
MATHS DEPT.
M.J.COLLEGE

Calculate the correlation co-efficient for the followingheights (in inches) of fathers(X) and their sons(Y).
X : 65 66 67 67 68 69 70 72Y : 67 68 65 68 72 72 69 71
Solution :
8544
nX X =Σ= = 68
8552
nY Y =Σ= = 69
X Y x=X− X y=Y− Y x2 y2 xy65 67 -3 -2 9 4 666 68 -2 -1 4 1 267 65 -1 -4 1 16 467 68 -1 -1 1 1 168 72 0 3 0 9 069 72 1 3 1 9 370 69 2 0 4 0 072 71 4 2 16 4 8544 552 0 0 36 44 24
Karl Pearson Correlation Co-efficient,
r(x, y) = x2 y 2
xy
Σ ΣΣ
= 36 44
24 = .603
Since r(x, y) = .603, the variables X and Y are positivelycorrelated. i.e. heights of fathers and their respective sons are saidto be positively correlated.
X : 1 2 3 4 5 6 7 8 9 Y : 9 8 10 12 11 13 14 16 15
Solution :
X Y X2 Y2 XY1 9 1 81 92 8 4 64 163 10 9 100 304 12 16 144 485 11 25 121 556 13 36 169 787 14 49 196 988 16 64 256 1289 15 81 225 135
45 108 285 1356 597
Example 5
Example 6Calculate the correlation co-efficient from the data below:
LECTURE NOTES by DR. J.S.V.R. KRISHNA PRASAD------------------------------------------------------------------------
M.Sc.- PAGE-10
MATHS DEPT.
M.J.COLLEGE

X 1 2 3 4 5 6 7 8 9Y 9 8 10 12 11 13 14 16 15
x y x2 y2 xy1 9 1 81 92 8 4 64 163 10 9 100 304 12 16 144 485 11 25 121 556 13 36 169 787 14 49 196 988 16 64 256 1289 15 81 225 135
45 108 285 1356 597
r2 2 2 2
- ( ) ( )[ ( ) ][ - ( ) ]
n xy x yn x x n y y
Σ Σ Σ=
Σ − Σ Σ Σ
( )2 2
9 597 - 45 108
9 285 (45) .(9 1356 (108) )r × ×
× − × − =
5373 - 4860(2565 2025).12204 11664)
r =− −(
513 513 0.95540 540 540
= = =×
Example 8:Calculate coefficient of correlation from the following data.
LECTURE NOTES by DR. J.S.V.R. KRISHNA PRASAD------------------------------------------------------------------------
M.Sc.- PAGE-11
MATHS DEPT.
M.J.COLLEGE

r (X,Y) = 2222 )Y(Y)X(XN
Y X -XYNΣΣΣΣ
ΣΣΣ−− N
= 22 )108()1356(9)45()285(9
(108) (45) -(597)9
−− = .95
∴ X and Y are highly positively correlated.
Calculate the correlation co-efficient for the ages ofhusbands (X) and their wives (Y)
X : 23 27 28 29 30 31 33 35 36 39
Y : 18 22 23 24 25 26 28 29 30 32
Solution :
Let A = 30 and B = 26 then dx = X− Α dy = Y−Β
X Y dx dy d 2x d 2
y dxdy
23 18 -7 -8 49 64 5627 22 -3 -4 9 16 1228 23 -2 -3 4 9 629 24 -1 -2 1 4 230 25 0 -1 0 1 031 26 1 0 1 0 033 28 3 2 9 4 635 29 5 3 25 9 1536 30 6 4 36 16 2439 32 9 6 81 36 54
11 −−3 215 159 175
r (x, y) = 2222 )()(
dydNdxdN
dydxdxdyN
yx Σ−ΣΣ−ΣΣΣ−Σ
Example 9
= 10(215) (11)2 10(159) ( 3)2
10(175) (11)( 3)
− − −− −
= 1790.81783 = 0.99
∴ X and Y are highly positively correlated. i.e. the ages ofhusbands and their wives have a high degree of correlation.
LECTURE NOTES by DR. J.S.V.R. KRISHNA PRASAD------------------------------------------------------------------------
M.Sc.- PAGE-12
MATHS DEPT.
M.J.COLLEGE

Example 9
Calculate the correlation co-efficient from the followingdata
N = 25, ΣΣX = 125, ΣΣY = 100
ΣΣX2 = 650 ΣΣY2 = 436, ΣΣXY = 520
Solution :
We know,
r = 2222 )Y(Y)X(XN
ÓY ÓX -XYNΣ−ΣΣ−Σ
ΣN
= 22 )100()436(25)125()650(25
(100) (125) -5(520)2
−−
r = −0.667
Properties of Correlation:1. Correlation coefficient lies between –1 and +1(i.e) –1 ≤ r ≤ +1
Let x’ = −σ x
x x ; y’ = −σ y
y y
Since (x’ +y’ )2 being sum of squares is always non-negative.(x’ +y’ )2 ≥0x’ 2 + y’ 2 +2 x’ y’ ≥ 0
22
x y x y
x x y y x x y yσ σ σ σ
− − − −Σ Σ Σ
+ + 2 ≥ 0
2 2
( )2 2( ) 2 ( ) ( )
x yx y
x x y y x x Y Yσ σ σ σ
Σ − Σ − Σ − −+ + ≥ 0
dividing by ‘ n’ we get
2 2
1 1 2 21 1. ( ) . ( ) Σ − + Σ −x y
x x y yn nσ σ
2 1. ( ) ( )x y
x x y yσ σ n
+ Σ − − ≥
0
2 2
2 2
1 1 2.x y
.cov( , )x yx y
σ σ x yσ σ σ σ
+ + ≥ 0
1 + 1 + 2r ≥ 0 2 + 2r ≥ 0 2(1+r) ≥ 0 (1 + r) ≥ 0–1 ≤ r -------------(1)
LECTURE NOTES by DR. J.S.V.R. KRISHNA PRASAD------------------------------------------------------------------------
M.Sc.- PAGE-13
MATHS DEPT.
M.J.COLLEGE

Note: r = +1 perfect +ve correlation. r = −1 perfect –ve correlation between the variables.
Property 2: ‘ r’ is independent of change of origin and scale.Property 3: It is a pure number independent of units of
measurement.Property 4: Independent variables are uncorrelated but the converse is not true.Property 5: Correlation coefficient is the geometric mean of two
regression coefficients.Property 6: The correlation coefficient of x and y is symmetric.
rxy = ryx.Limitations:1. Correlation coefficient assumes linear relationship regardless of the assumption is correct or not.2. Extreme items of variables are being unduly operated on correlation coefficient.3. Existence of correlation does not necessarily indicate cause- effect relation.
Similarly, (x’ –y’ )2 ≥ 0 2(l-r) ≥0 l - r ≥0 r ≤ +1 --------------(2)(1) +(2) gives –1 ≤ r ≤ 1
LECTURE NOTES by DR. J.S.V.R. KRISHNA PRASAD------------------------------------------------------------------------
M.Sc.- PAGE-14
MATHS DEPT.
M.J.COLLEGE

208
Rank Correlation:It is studied when no assumption about the parameters of
the population is made. This method is based on ranks. It is usefulto study the qualitative measure of attributes like honesty, colour,beauty, intelligence, character, morality etc.The individuals in thegroup can be arranged in order and there on, obtaining for eachindividual a number showing his/her rank in the group. Thismethod was developed by Edward Spearman in 1904. It is defined
as r =2
3
61 Dn n
Σ−
− r = rank correlation coefficient.
Note: Some authors use the symbol ρ for rank correlation.D2 = sum of squares of differences between the pairs of ranks.
n = number of pairs of observations.The value of r lies between –1 and +1. If r = +1, there is
complete agreement in order of ranks and the direction of ranks isalso same. If r = -1, then there is complete disagreement in order ofranks and they are in opposite directions.Computation for tied observations: There may be two or moreitems having equal values. In such case the same rank is to begiven. The ranking is said to be tied. In such circumstances anaverage rank is to be given to each individual item. For example ifthe value so is repeated twice at the 5th rank, the common rank to
be assigned to each item is 5 62+ = 5.5 which is the average of 5
and 6 given as 5.5, appeared twice. If the ranks are tied, it is required to apply a correction
factor which is 112
(m3-m). A slightly different formula is used
when there is more than one item having the same value.
The formula is
r =2 3 3
3
1 16[ ( ) ( ) ....]12 121
D m m m m
n n
Σ + − + − +−
−
LECTURE NOTES by DR. J.S.V.R. KRISHNA PRASAD------------------------------------------------------------------------
M.Sc.- PAGE-15
MATHS DEPT.
M.J.COLLEGE

209
Where m is the number of items whose ranks are commonand should be repeated as many times as there are tiedobservations.
Price of tea 88 90 95 70 60 75 50Price of coffee 120 134 150 115 110 140 100
Price oftea
Rank Price ofcoffee
Rank D D2
88 3 120 4 1 190 2 134 3 1 195 1 150 1 0 070 5 115 5 0 060 6 110 6 0 075 4 140 2 2 450 7 100 7 0 0
D2 = 6
r =2
3
61 Dn n
Σ−
− = 3
6 617 7
×−
−
= 361336
− = 1 − 0.1071
= 0.8929The relation between price of tea and coffee is positive at
0.89. Based on quality the association between price of tea andprice of coffee is highly positive.
2nd 84 90 88 55 48 85 82 72
Example 10:In a marketing survey the price of tea and coffee in a town based onquality was found as shown below. Could you find any relationbetween and tea and coffee price.
Example 11:In an evaluation of answer script the following marks are awardedby the examiners.1st 88 95 70 960 50 80 75 85
LECTURE NOTES by DR. J.S.V.R. KRISHNA PRASAD------------------------------------------------------------------------
M.Sc.- PAGE-16
MATHS DEPT.
M.J.COLLEGE

210
Do you agree the evaluation by the two examiners is fair?x R1 y R2 D D2
88 2 84 4 2 495 1 90 1 0 070 6 88 2 4 1660 7 55 7 0 050 8 48 8 0 080 4 85 3 1 185 3 75 6 3 9
30
r =2
3
61 Dn n
Σ−
− = 3
618 8
× 30−
−
= 1801504
− = 1 − 0.357 = 0.643
Calculate the rank correlation coefficient between the marks of two tests.Student Test 1 R1 Test 2 R2 D D2
A 70 3 65 5.5 -2.5 6.25B 68 4 65 5.5 -1.5 2.25C 67 5 80 1.0 4.0 16.00D 55 10 60 8.5 1.5 2.25E 60 8 68 4.0 4.0 16.00F 60 8 58 10.0 -2.0 4.00G 75 1 75 2.0 -1.0 1.00H 63 6 62 7.0 -1.0 1.00I 60 8 60 8.5 0.5 0.25J 72 2 70 3.0 -1.0 1.00
50.00
r = 0.643 shows fair in awarding marks in the sense that uniformityhas arisen in evaluating the answer scripts between the twoexaminers.Example 12:Rank Correlation for tied observations. Following are the marksobtained by 10 students in a class in two tests.Students A B C D E F G H I JTest 1 70 68 67 55 60 60 75 63 60 72Test 2 65 65 80 60 68 58 75 63 60 70
LECTURE NOTES by DR. J.S.V.R. KRISHNA PRASAD------------------------------------------------------------------------
M.Sc.- PAGE-17
MATHS DEPT.
M.J.COLLEGE

211
60 is repeated 3 times in test 1.60,65 is repeated twice in test 2.m = 3; m = 2; m = 2
r =2 3 3 3
3
1 1 16[ ( ) ( ) ( )12 12 121
D m m m m m m
n n
Σ + − + − + −−
−
=3 3 3
3
1 1 16[50 (3 3) (2 2) (2 2)]12 12 121
10 10
+ − + − + −−
−
= 6[50 2 0.5 0.5]1990
+ + +−
= ×− = = .6 53 6721 0 68
990 990
Interpretation: There is uniformity in the performance of studentsin the two tests.
Exercise – 8I. Choose the correct answer:1.Limits for correlation coefficient.
(a) –1 ≤ r ≤ 1 (b) 0 ≤ r ≤ 1(c) –1 ≤ r ≤ 0 (d) 1 ≤ r ≤ 2
2. The coefficient of correlation. (a) cannot be negative (b) cannot be positive (c) always positive (d)can either be positive or negative3. The product moment correlation coefficient is obtained by
(a) XYrxy
Σ= (b)
x y
XYrn σ σ
Σ=
(c)x
XYrn σΣ
= (d) none of these
4. If cov(x,y) = 0 then (a) x and y are correlated (b) x and y are uncorrelated (c) none (d) x and y are linearly related
LECTURE NOTES by DR. J.S.V.R. KRISHNA PRASAD------------------------------------------------------------------------
M.Sc.- PAGE-18
MATHS DEPT.
M.J.COLLEGE

212
5. If r = 0 the cov (x,y) is (a) 0 (b) -1 (c) 1 (d) 0.26. Rank correlation coefficient is given by
(a)2
3
61 Dn n
Σ+
−(b)
2
2
61 Dn n
Σ−
−(c)
2
3
61 Dn n
Σ−
−
(d)2
3
61 Dn n
Σ−
+7. If cov (x,y) = σx σy then (a) r = +1 (b) r = 0 (c) r = 2 (d) r = -18. If D2 = 0 rank correlation is
(a) 0 (b) 1 (c)0.5 (d) -19. Correlation coefficient is independent of change of (a) Origin (b) Scale (c) Origin and Scale (d) None10. Rank Correlation was found by
(a) Pearson (b) Spearman (c) Galton (d) Fisher
II. Fill in the blanks:11 Correlation coefficient is free from _________.12 The diagrammatic representation of two variables
is called _________13 The relationship between three or more variables is studied
with the help of _________ correlation.14 Product moment correlation was found by _________15 When r = +1, there is _________ correlation.16 If rxy = ryx, correlation between x and y is _________17 Rank Correlation is useful to study ______characteristics.18 The nature of correlation for shoe size and IQ is _________III. Answer the following :19 What is correlation?20 Distinguish between positive and negative correlation.21 Define Karl Pearson’ s coefficient of correlation. Interpret r,
when r = 1, -1 and 0.22 What is a scatter diagram? How is it useful in the study of
Correlation?
LECTURE NOTES by DR. J.S.V.R. KRISHNA PRASAD------------------------------------------------------------------------
M.Sc.- PAGE-19
MATHS DEPT.
M.J.COLLEGE

213
23 Distinguish between linear and non-linear correlation.24 Mention important properties of correlation coefficient.25 Prove that correlation coefficient lies between –1 and +1.26 Show that correlation coefficient is independent of change of
origin and scale.27 What is Rank correlation? What are its merits and demerits?28 Explain different types of correlation with examples.29 Distinguish between Karl Pearson’ s coefficient of correlation
and Spearman’ s correlation coefficient.30 For 10 observations x = 130; y = 220; x2 = 2290;
y2 = 5510; xy = 3467. Find ‘ r’ .31 Cov (x,y) = 18.6; var(x) = 20.2; var(y) = 23.7. Find ‘ r’ .32 Given that r = 0.42 cov(x,y) = 10.5 v(x) = 16; Find the
standard deviation of y.33 Rank correlation coefficient r = 0.8. D2 = 33. Find ‘ n’ .
Karl Pearson Correlation:34. Compute the coefficient of correlation of the following score of
A and B.A 5 10 5 11 12 4 3 2 7 1B 1 6 2 8 5 1 4 6 5 2
35. Calculate coefficient of Correlation between price and supply.Interpret the value of correlation coefficient.
Price 8 10 15 17 20 22 24 25Supply 25 30 32 35 37 40 42 45
36. Find out Karl Pearson’ s coefficient of correlation in the following series relating to prices and supply of a commodity.
Price(Rs.) 11 12 13 14 15 16 17 18 19 20Supply(Rs.) 30 29 29 25 24 24 24 21 18 15
37. Find the correlation coefficient between the marks obtained byten students in economics and statistics.
Marks (ineconomics
70 68 67 55 60 60 75 63 60 72
Marks (instatistics
65 65 80 60 68 58 75 62 60 70
LECTURE NOTES by DR. J.S.V.R. KRISHNA PRASAD------------------------------------------------------------------------
M.Sc.- PAGE-20
MATHS DEPT.
M.J.COLLEGE

RANK CORRELATION:46. Two judges gave the following ranks to eight competitors in a
beauty contest. Examine the relationship between theirjudgements.
Judge A 4 5 1 2 3 6 7 8Judge B 8 6 2 3 1 4 5 7
47. From the following data, calculate the coefficient of rank correlation.
X 36 56 20 65 42 33 44 50 15 60Y 50 35 70 25 58 75 60 45 80 38
48. Calculate spearman’ s coefficient of Rank correlation for thefollowing data.
X 53 98 95 81 75 71 59 55Y 47 25 32 37 30 40 39 45
49. Apply spearman’ s Rank difference method and calculatecoefficient of correlation between x and y from the data givenbelow.
X 22 28 31 23 29 31 27 22 31 18Y 18 25 25 37 31 35 31 29 18 20
50. Find the rank correlation coefficients.
Marks inTest I
70 68 67 55 60 60 75 63 60 72
Marks inTest II
65 65 80 60 68 58 75 62 60 70
51. Calculate spearman’ s Rank correlation coefficient for thefollowing table of marks of students in two subjects.
Firstsubject
80 64 54 49 48 35 32 29 20 18 15 10
Secondsubject
36 38 39 41 27 43 45 52 51 42 40 52
LECTURE NOTES by DR. J.S.V.R. KRISHNA PRASAD------------------------------------------------------------------------
M.Sc.- PAGE-21
MATHS DEPT.
M.J.COLLEGE
Answers:I.
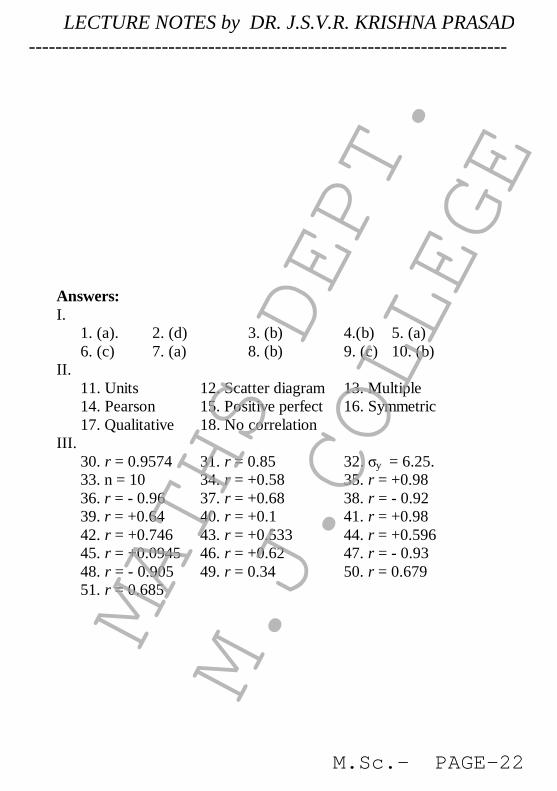
1. (a). 2. (d) 3. (b) 4.(b) 5. (a)6. (c) 7. (a) 8. (b) 9. (c) 10. (b)
II.11. Units 12. Scatter diagram 13. Multiple14. Pearson 15. Positive perfect 16. Symmetric17. Qualitative 18. No correlation
III.30. r = 0.9574 31. r = 0.85 32. y = 6.25.33. n = 10 34. r = +0.58 35. r = +0.9836. r = - 0.96 37. r = +0.68 38. r = - 0.9239. r = +0.64 40. r = +0.1 41. r = +0.9842. r = +0.746 43. r = +0.533 44. r = +0.59645. r = +0.0945 46. r = +0.62 47. r = - 0.9348. r = - 0.905 49. r = 0.34 50. r = 0.67951. r = 0.685
LECTURE NOTES by DR. J.S.V.R. KRISHNA PRASAD------------------------------------------------------------------------
M.Sc.- PAGE-22
MATHS DEPT.
M.J.COLLEGE