7klvhohfwurqlfwkhvlvru … you believe that this document breaches copyright please contact...
TRANSCRIPT

This electronic thesis or dissertation has been
downloaded from the King’s Research Portal at
https://kclpure.kcl.ac.uk/portal/
The copyright of this thesis rests with the author and no quotation from it or information derived from it
may be published without proper acknowledgement.
Take down policy
If you believe that this document breaches copyright please contact [email protected] providing
details, and we will remove access to the work immediately and investigate your claim.
END USER LICENCE AGREEMENT
This work is licensed under a Creative Commons Attribution-NonCommercial-NoDerivatives 4.0
International licence. https://creativecommons.org/licenses/by-nc-nd/4.0/
You are free to:
Share: to copy, distribute and transmit the work Under the following conditions:
Attribution: You must attribute the work in the manner specified by the author (but not in any way that suggests that they endorse you or your use of the work).
Non Commercial: You may not use this work for commercial purposes.
No Derivative Works - You may not alter, transform, or build upon this work.
Any of these conditions can be waived if you receive permission from the author. Your fair dealings and
other rights are in no way affected by the above.
The role of chemokine ligand 5 and GPR75 on islet function
Hassan, Zoheb
Awarding institution:King's College London
Download date: 17. Jun. 2018

0
The role of chemokine ligand 5 and GPR75 on islet function
A thesis submitted by
Zoheb Hassan
For the degree of Doctor of Philosophy
from King’s College London
Diabetes Research Group
Division of Diabetes and Nutritional Sciences
School of Medicine
King’s College London

1

2
Dedicated to my father…
We did it!
Thank you

Acknowledgements
3
I would sincerely like to thank Professor Shanta Persaud and Professor Peter Jones for giving
me the fantastic opportunity to apply, develop and express myself as a person and scientist at
the Diabetes Research Group. Their trust, expert advice and dedication to nurture science are
invaluable qualities in which I can only hope to emulate in the future.
My heartfelt thank you to my wonderful parents for showing me that hard-work, discipline and
patience are the foundation for any accomplishment. Your unconditional financial and moral
support has been invaluable, and this simply would not have been possible without you. Also a
huge thank you to my mum for fuelling me day and night by preparing all those delicious meals!
A special thank you to Bo Liu, whom I have had the pleasure of working alongside throughout
my PhD. You have taught me everything from day one, and have always helped me in a
composed and dedicated manner, befitting of your fantastic personality. Your personal support,
generosity, kind nature, wisdom oh and let’s not forget your stubbornness, has shaped me as a
person and scientist alike.
In addition, I would personally like to thank Mrs Kanta Sharma for instilling the correct moral
foundation expected of any student and making me believe in my abilities, which have guided
me to this very day. The success of this PhD is a testament to your inspirational teaching
methods and hard work that you dedicatedly poured into my education.
Thank you to Mustafa Dogan and Shuang Song (the boys) for accompanying me throughout
my PhD. Along with Bo, we have enjoyed and shared so many wonderful moments together
especially of our road trips across Europe and Turkey, which included visiting places such as the
‘Cotton Castle’ of Pammukale, to the serene lake of Geneva, to the winding hills of Monte
Carlo, to sipping Turkish tea at night alongside the majestic Bosphorus of Istanbul, and let’s not
forget to mention all the wonderful cuisines that we have diligently consumed on our travels. It
has been a great journey!
Finally, I would like to thank the entire Diabetes Research Group, especially Alina
Bocianowska, Zbrog, Saima, Ajaz, Anna Czaika, Pam Dhadda, Altaf Al-Romaiyan, Chen Li, Jai
Gondi, Alan Kerby, Ross Hawkes, Carolyn Johnson, Kerry Mclaughlin and Stefan Amisten, all
of whom have created a wonderful working environment day in, day out!

4
[This page has been intentionally left blank]

5
“Here's to the crazy ones, the misfits, the rebels, the troublemakers, the round pegs in the
square holes... the ones who see things differently -- they're not fond of rules... You can quote
them, disagree with them, glorify or vilify them, but the only thing you can't do is ignore them
because they change things... they push the human race forward, and while some may see them
as the crazy ones, we see genius, because the ones who are crazy enough to think that they can
change the world, are the ones who do.”
“Stay hungry, stay foolish.”
STEVE JOBS
(1955-2011)

Table of Contents
6
Abstract ......................................................................................................................................................................... 14
Chapter 1: Introduction ............................................................................................................................................. 16
1.1: Diabetes Mellitus ............................................................................................................................................ 17
1.1.1: What is Diabetes Mellitus?.................................................................................................................... 17
1.1.2: Type 1 DM .............................................................................................................................................. 20
1.1.3: Type 2 DM .............................................................................................................................................. 20
1.1.4: Therapies for DM .................................................................................................................................. 21
1.2: Regulation of hormone secretion from islets of Langerhans ................................................................. 26
1.2.1: Islet cytoarchitecture .............................................................................................................................. 26
1.2.2: Glucose homeostasis: Insulin and glucagon action .......................................................................... 28
1.2.3: Biosynthesis and storage of insulin and glucagon ............................................................................ 29
1.2.4: Nutrient regulation of insulin and glucagon secretion. ................................................................... 31
1.2.5: Non-nutrient regulation of islet hormone secretion and intra-islet hormone communication. .............................................................................................................................................................................. 35
1.2.6: Importance of calcium and protein kinases in beta cell stimulus-secretion coupling ................ 39
1.3: Regulation of beta cell mass ......................................................................................................................... 46
1.3.1: Beta cell mass in DM ............................................................................................................................. 46
1.3.2: Beta cell apoptosis and apoptotic signalling pathways .................................................................... 46
1.3.3: Beta cell proliferation ............................................................................................................................ 51
1.4: G-protein coupled receptor (GPCR) signalling ........................................................................................ 56
1.4.1: GPCRs as potential T2DM therapeutic targets ................................................................................ 56
1.4.2: GPCR-mediated stimulus secretion coupling in beta cells ............................................................. 58
1.4.3: GPCR-mediated regulation of beta cell mass ................................................................................... 60
1.4.4: Why target GPR75? ............................................................................................................................... 61
1.5. Aims .................................................................................................................................................................. 65
Chapter 2: Materials and Methods ........................................................................................................................... 66
2.1: MIN6 beta-cells ......................................................................................................................................... 67
2.1.1: Cryopreservation and thawing of MIN6 cells from frozen storage .............................................. 68
2.1.2: Maintaining and sub-culturing MIN6 cells ........................................................................................ 69
2.1.3: Cell counting ........................................................................................................................................... 70
2.2: Islet isolation ................................................................................................................................................... 71
2.2.1: Mouse islet isolation .............................................................................................................................. 71
2.2.2: Human islet isolation ............................................................................................................................. 72
2.3: Gene expression ............................................................................................................................................. 73
2.3.1: Total RNA extraction ............................................................................................................................ 73
2.3.2: Measuring RNA concentration and integrity .................................................................................... 75
2.3.3: cDNA synthesis ........................................................................................................................................... 75
2.3.4: Polymerase Chain Reaction (PCR) ...................................................................................................... 77
2.3.5: Amplicon visualisation and DNA sequencing .................................................................................. 80
2.3.6 Gel DNA extraction ............................................................................................................................... 81

7
2.3.7 Quantitative PCR (qRT-PCR) ............................................................................................................... 82
2.4: Protein Expression ......................................................................................................................................... 83
2.4.1: Protein extraction ................................................................................................................................... 83
2.4.2: Protein quantification ............................................................................................................................ 84
2.4.3: Sodium dodecyl sulphate polyacrylamide gel electrophoresis (SDS-PAGE) .............................. 85
2.4.4: Western Blotting ..................................................................................................................................... 87
2.4.5: Immunohistochemistry ......................................................................................................................... 89
2.4.5b Fluorescent immunostaining ............................................................................................................... 92
2.5: Beta cell and islet function ............................................................................................................................ 93
2.5.1: Single cell calcium microfluorimetry ................................................................................................... 93
2.5.2: Transient transfection - siRNA mediated GPR75 depletion ........................................................ 95
2.6 Hormone secretion ......................................................................................................................................... 95
2.6.1 Static incubation ...................................................................................................................................... 95
2.6.2 Perifusion .................................................................................................................................................. 96
2.6.3 Islet hormone radioimmunoassay ........................................................................................................ 97
2.7 Cell apoptosis and proliferation .................................................................................................................... 99
2.7.1: Measurement of cell apoptosis ............................................................................................................ 99
2.7.2: Measurement of cell proliferation ..................................................................................................... 100
2.8: Statistical analysis .......................................................................................................................................... 101
Results ......................................................................................................................................................................... 102
Chapter 3: Expression of CCL5 and its receptors by islet cells ........................................................................ 102
3.1: Introduction .................................................................................................................................................. 103
3.2: Methods.......................................................................................................................................................... 105
3.2.1: RT-PCR.................................................................................................................................................. 105
3.2.2: Western blotting ................................................................................................................................... 105
3.2.3: Chromogenic and fluorescent immunohistochemistry ................................................................. 105
3.3: Results............................................................................................................................................................. 106
3.3.1: Detection of CCL5 mRNA in MIN6 beta cells, and mouse and human islets ......................... 106
3.3.2: Protein localisation of CCL5 in mouse and human islets ............................................................. 108
3.3.3: Detection of CCL5 receptor mRNAs in MIN6 beta-cells, and mouse and human islets. ...... 114
3.3.4: Detection of GPR75 proteins and localisation in mouse and human islets. ............................. 121
3.3.5: Discussion ............................................................................................................................................. 129
Chapter 4: The effect of CCL5 on insulin and glucagon secretion. ................................................................. 132
4.1: Introduction .................................................................................................................................................. 133
4.2: Methods.......................................................................................................................................................... 134
4.2.1: Insulin and glucagon secretion: Static incubation .......................................................................... 134
4.2.2: Insulin secretion: Perifusion ............................................................................................................... 134
4.3: Results............................................................................................................................................................. 135
4.3.1: Effect of CCL5 on mouse islet hormone secretion ....................................................................... 135

8
4.3.2: Effect of exogenous CCL5 on human islet hormone secretion .................................................. 141
4.4: Discussion ................................................................................................................................................. 145
Chapter 5: Elucidating the GPR75 signalling pathway in beta cells. ............................................................... 151
5.1: Introduction .................................................................................................................................................. 152
5.2: Methods.......................................................................................................................................................... 154
5.2.1: Down-regulation of GPR75: Transient transfection ..................................................................... 154
5.2.2: Calcium Microfluorimetry .................................................................................................................. 154
5.2.3: Measurement of insulin secretion: Static incubation ..................................................................... 154
5.3: Results............................................................................................................................................................. 157
5.3.1: The effect of CCL5 on intracellular calcium levels in MIN6 beta cells, mouse islets and human islets. .................................................................................................................................................................. 157
5.3.2: The effect of GPR75 down-regulation on beta cell function....................................................... 164
5.3.3: Identification of a calcium ion influx component in the beta cell GPR75 signalling pathway. ............................................................................................................................................................................ 169
5.3.4: Effect of opening beta cell KATP channels on CCL5-induced insulin secretion. ...................... 174
5.3.5: Involvement of PLC in the stimulus-secretion coupling of CCL5. ............................................ 176
5.3.6: Involvement of protein kinases in the GPR75 signalling pathway. ............................................ 181
5.4: Discussion ...................................................................................................................................................... 195
Chapter 6: GPR75 activation regulates beta cell mass........................................................................................ 206
6.1: Introduction .................................................................................................................................................. 207
6.2: Methods.......................................................................................................................................................... 209
6.3: Results............................................................................................................................................................. 210
6.3.1: The effect of CCL5 on cytokine-induced apoptosis in MIN6 beta cells as well as mouse and human islets. .................................................................................................................................................... 210
6.3.2: The effect of GPR75 down-regulation on MIN6 beta cell apoptosis. ....................................... 214
6.3.3: Effect of CCL5 on MIN6 beta cell proliferation. .......................................................................... 215
6.4: Discussion ...................................................................................................................................................... 216
Chapter 7: General discussion ................................................................................................................................ 221
7.1: Summary ........................................................................................................................................................ 222
7.2 Future perspectives ....................................................................................................................................... 227
References .............................................................................................................. Error! Bookmark not defined.
Abbreviations
9
Abbreviation Definition
α
alpha
aa Amino acids
AA arachidonic acid
Ab antibody
AC adenylate cyclase
ACh acetylcholine
ADP ADP
Akt Murine thymoma viral oncogene homolog
Ag antigen
ATP adenosine triphosphate
Apaf-1 apoptosin protease activating factor-1
Bax BCL2-associated X protein
Bcl2 B-cell leukemia/lymphoma 2
BH Bcl-2 homology domains
Bid BH3 interacting domain death agonist
β beta
B0 maximum binding
bp base pair
BSA bovine serum albumin
°C degrees centigrade
CAD caspase-activated DNase
Ca2+ calcium ion
CaM calmodulin
CaMK Ca2+/calmodulin-dependent kinase
CARD caspase recruitment domain
CB1 cannabinoid receptor 1
CB2 cannabinoid receptor 2
CCL5 chemokine ligand 5
CMRL Connaught Medical Research Laboratories
CHOP C/EBP homologous protein
cIAP Cellular inhibitor of apoptosis
cAMP cyclic adenosine 3’, 5’- monophosphate
CCK cholecystokinin
cDNA complementary DNA
CNS central nervous system
CO2 carbon dioxide
cpm counts per minute
Δ delta

10
DD death domain
DED death effector domain
DISC death-inducing signaling complex
DAB 3,3’-diaminobenzidine
DAG diacylglycerol
dH2O dionised water
DMEM Dulbecco’s modified Eagle’s medium
DMSO dimethylsulphoxide
DPP-4 dipeptidyl peptidase-4
DNA deoxyribonucleic acid
dNTPs deoxynucleoside triphosphates
DTT dithiothreitol
ε epsilon
ECL enhanced chemiluminescence
EDTA ethylenediaminetetraacetic acid
EGTA ethyleneglycol bis (aminoethylether)-N,N,N’,N-tetra-acetate
ELISA enzyme-linked immunosorbent assay
Epac cAMP-activated GTP-exchange factor
ER endoplasmic reticulum
FADD Fas-associated death domain
FBS fetal bovine serum
FITC fluorescein isothiocyanate
Fura-2 AM Fura-2 acetoxymethyl derivative
γ gamma
GIP glucose-dependent insulinotropic polypeptide/gastric inhibitory polypeptide
GI-tract gastrointestinal tract
GLP-1 glucagon-like peptide-1
GluR glucagon receptor
GSIS glucose stimulated insulin secretion
GLUT-1 glucose transporter-1
GLUT-2 glucose transporter-2
GLUT-3 glucose transporter-3
GLUT-4 glucose transporter-4
GLUT-5 glucose transporter-5
GPCR G-protein-coupled receptor
GPR119 G-protein receptor 119
GPR75 G-protein receptor 75
GPR40 G-protein receptor 40
GPR54 G-protein receptor 54
GRP gastric-releasing peptide
GTP guanosine triphosphate
11
HbA1c haemoglobin A1C (glycated haemoglobin)
hr hour
HCl hydrochloric acid
INS-1 cell line established from X-ray-induced rat transplantable insulinoma
I iodine
IAPP islet amyloid polypeptide
IAPs inhibitors of apoptosis proteins
ICAD inhibitor of caspase-activated DNase
IP3 inositol 1,4,5,-trisphosphate
IP3R inositol 1,4,5-trisphosphate receptor
InsR insulin receptor
IRS insulin receptor substrate
IL-1β Interleukin-1β
INF-γ interferon-γ
IκB IκB kinase
[Ca2+]i Intracellular Ca2+ concentration
κ kappa
K+ potassium ion
KO knockout
KCNJ11 inwardly rectifying ATP-sensitive potassium channel subfamily J member 11 gene
KATP ATP-sensitive potassium channel
KCl potassium chloride
kDa kilodalton
Kir6.2 inward rectifier K+ channel
LPC lysophosphatidylcholine
MAPKs Mitogen activated protein kinases
μ micro
μg microgram
μM micromolar
mg milligram
MHC major histocompatibility complex
min minute
MIN6 mouse insulinoma cell line derived by targeted expression of the SV40
mM millimolar
MLCK myosin-light chain kinase
M-MLV moloney murine leukemia virus
MOPS 3[N-morpholino]propanesulphonic acid
ml millilitre
mRNA messenger RNA
MW molecular weight
NA noradrenaline

12
NCS Neonatal calf serum
NF-κB Nuclear factor kappa B
ng nanogram
NPY neuropeptide Y
NSB non-specific binding
OGTTs oral glucose tolerant tests
OEA oleylethanol amide
P2Y purinergic G-protein coupled metabotrophic receptor
PAGE polyacrylamide gel electrophoresis
PBS phosphate-buffered saline
PCR polymerase chain reaction
PDEs cyclic nucleotide phosphodiesterases
PEG polyethylene glycol
PI3K phosphatidylinositol-3-kinase
PKA cyclic-AMP-dependent protein kinase A
PKB protein kinase B
PKC protein kinase C
PKCα, protein kinase alpha
PKCβ protein kinase beta
PKCγ protein kinase gamma
PKCδ protein kinase delta
PKCε protein kinase epsilon
PKCζ protein kinase zeta
PKCη protein kinase eta
PKCθ protein kinase theta
PKCι/λ protein kinase iota/ lambda
PKCμ Protein kinase mu
PLA2 phospholipase A2
PLC phospholipase C
PLD phospholipase D
PMA phorbol 12-myristate 13-acetate
PP pancreatic polypeptide
PTX pertussis toxin
PVDF polyvinylidene fluoride
PIP3 phosphatidyl inositol 3,4,5 triphosphate
PIP2 phosphatidyl inositol 3,4 bisphosphate
PIP phosphatidyl inositol 3-phosphate
RIA radioimmunoassay
RINm5F a cell line derived from a rat transplantable insulinoma developed in recipient nude
mice
RANTES regulated upon activation T-cell expressed and secreted

13
RNA ribonucleic acid
RPMI Roswell Park Memorial Institute medium
RRP readily releasable pool
RT reverse transcription
RyR ryanodine receptor
SDS sodium dodecylsulphate
SEM standard error of the mean
SGLT2 type 2 sodium-glucose co-transporter
SNAP-25 synaptosome-associated protein of 25,000 daltons
SNARE soluble N-ethylmaleimide-sensitive factor attachment protein receptor
SST somatostatin
SV40 Simian Virus 40
SUR1 ATP-sensitive sulphonylurea receptor
βTC β tumour cell lines derived by targeted expression of the SV40 T-antigen to β-cells of
transgenic mice
θ theta
T1DM type 1 diabetes mellitus
T2DM type 2 diabetes mellitus
TBE tris-boric acid-EDTA
TBS-T tris-buffered saline Tween
TNF-α tumor necrosis factor-α
Tris tris(hydroxymethyl)aminomethane
Tween 20 polyethylene sorbitan monolaurate
TZD thiazolidinedione
VAMP vesicle-associated membrane protein
VOCC voltage-operated Ca2+ channel
VIP vasoactive intestinal polypeptide
v/v volume for volume
WHO world health organization
w/v weight for volume
Xiap X-linked inhibitor of apoptosis
ζ zeta
14
Abstract
Chemokine Ligand 5 (CCL5), also known as RANTES (Regulated Upon Activation T-cell
Expressed and Secreted), was originally thought to be a T-cell specific protein, however, it is
now known to be synthesized by a variety of cells such as smooth muscle cells, neurons and
endothelial cells. CCL5 is a potent chemoattractive cytokine (chemokine) that attracts
leukocytes such as monocytes and eosinophils and lymphocytes such as T-cells to sites of
inflammation and infection by acting via inhibitory G-protein coupled chemokine receptors
CCR1, CCR3 and CCR5. Most studies have focused on the pro-inflammatory role of CCL5 and
its role towards beta cell destruction in type 1 diabetes but in this instance we present evidence
for an alternative role for CCL5 emphasized on improving beta cell function by activating the
atypical chemokine receptor, GPR75.
Our initial studies demonstrated that CCL5 was expressed and endogenously synthesized by
mouse and human islets and that GPR75 was the most abundantly expressed CCL5 receptor,
compared to CCR1, CCR3 and CCR5, in mouse and human islets, and mouse insulinoma beta
cell line (MIN6). It has been established that GPR75 couples to the Gαq protein and
subsequently elevates intracellular calcium, a vital signal for stimulus-secretion coupling of
insulin in beta cells. This led us to investigate whether the GPR75 signal transduction pathway
was elicited in beta cells by CCL5 and whether it had any influence on beta cell physiology.
Immunohistochemistry revealed that GPR75 localized to the alpha and beta cells of mouse and
human islets whereas CCL5 was localized to the alpha and beta cells of human islets but only to
alpha cells of mouse islets. Functional studies focusing on beta cell function revealed that CCL5
stimulated insulin secretion and elevated intracellular calcium in beta cells at sub-stimulatory and
stimulatory glucose levels. Down-regulation of GPR75 using siRNAs significantly perturbed the
stimulatory effect of CCL5 highlighting GPR75 as the predominant CCL5 receptor activated by
CCL5 for elevating cytosolic calcium and stimulating insulin secretion. Furthermore, the
stimulatory effect of CCL5 was abrogated in mouse and human islets following inhibition of
Phospholipase C (PLC), removal of calcium from the extracellular environment, blockade of L-
type calcium channels, depletion of PKC and inhibition of calcium- calmodulin kinase II
(CAMK II).
CCL5 also stimulates glucagon secretion from alpha cells suggesting a possible paracrine role in
regulating CCL5 induced stimulation of insulin secretion. Furthermore, CCL5 has significant
cell protective effects in MIN6 beta cells as well as isolated mouse and human islets by
protecting against cytokine-induced apoptosis. This protective effect is lost when GPR75 is
down-regulated in MIN6 beta cells. This supports previous findings that GPR75 activation

15
enhances cell viability in murine hippocampal cells by activating the pro survival pathway of
PLC/PI3K/Akt/MAPK.
In summary, our studies reveal a novel role for CCL5 in improving beta cell function and beta
cell mass via GPR75 activation. We have identified that GPR75 predominantly acts via the Gq
pathway and subsequent PKC activation along with calcium influx via L-type calcium channels
and CAMK II activation, are central to the stimulus secretion-coupling between CCL5 and
insulin. CCL5 also influences glucagon secretion suggesting an expansive role for CCL5 within
the intra islet environment and has considerable cell protective and proliferative effects on beta
cells possibly via GPR75 activation. This makes GPR75 an attractive therapeutic target for
improving beta cell function and beta cell mass, two features that contribute towards the onset
of type 2 diabetes (T2DM).

16
Chapter 1: Introduction

Chapter 1: Introduction
17
1.1: Diabetes Mellitus
1.1.1: What is Diabetes Mellitus?
Diabetes Mellitus (DM) is a chronic disorder that is characterised by high blood glucose levels
(hyperglycaemia) as a result of defects in insulin secretion and/or insulin action (ADA, 2010,
Hoppener and Lips, 2006). The majority of DM cases fall into two major categories: Type 1
DM (T1DM), which is responsible for 5-10% of DM cases, and is defined by the absolute
deficiency of insulin secretion. Type 2 DM (T2DM), accounts for 90-95% of those with DM,
and is defined by the relative deficiency of insulin secretion and impairment of insulin action,
known as insulin resistance (ADA, 2010). According to the World Health Organisation (WHO),
DM is only diagnosed if fasting plasma glucose concentration exceeds 7mM or plasma glucose
concentration exceeds 11mM two hours after consuming 75g of glucose in an oral glucose
tolerance test (OGTT) or random venous plasma glucose concentrations exceed 11mM.
Hyperglycaemia can cause pathological and functional changes in various metabolic tissues
without clinical symptoms before diabetes is diagnosed (ADA, 2010). This pre-DM state is
defined by impaired glucose tolerance (IPGT) and/or impaired fasting glucose (IFG).
Individuals with IPGT are diagnosed if fasting plasma glucose is below 7mM but remains
between >7mM and <11mM after OGTT (WHO/IDF, 2006).
The current estimate for the number of adults with DM has reached 382 million with a global
increase in fasting plasma glucose levels of 0.07mM per decade (Danaei et al., 2011, IDF, 2013).
DM is predicted to reach 592 million by 2035 and contributed to more than 4.6 million deaths
in 2011 (IDF, 2011, IDF, 2013). Although the global prevalence of DM has generally increased
there is disparity in the incidence of DM between regions, countries and gender of populations
as illustrated by Figure 1, which may implicate genetic or environmental factors associated with
DM (Danaei et al., 2011). It is predicted that by 2030, DM will be the seventh leading cause of
global death, accounting for 3% of total deaths, and fourth leading cause in high-income
countries, accounting for 4.8% of total deaths (Mathers and Loncar, 2006). In the UK 3.2
million people have been diagnosed with DM and is estimated to increase to 5 million by 2025
of which 90% of these cases are estimated to be T2DM (DUK, 2014). Chronic hyperglycaemia
in DM has been linked to an increase in risk of cardiovascular diseases, foot neuropathy that
can result in ulcers and possible limb amputation, kidney failure and retinopathy, which is an
important cause for blindness (Forbes and Cooper, 2013).

Chapter 1: Introduction
18

Chapter 1: Introduction
19
Figure 1: Trends in age-standardised DM prevalence (%) for men (A) and women (B) between 1980 and
2008 in different geographical regions (High income regions of Australia, North America, and Western
Europe, Central and eastern Europe, Sub-Saharan Africa, Central Asia, north Africa and Middle East,
South Asia, East Asia and southwest Asia, Southern and tropical Latin America, Central and Andean
Latin America and the Caribbean, High-income Asia-Pacific, Oceania) and the overall global prevalence
of DM (Danaei et al., 2011).

Chapter 1: Introduction
20
1.1.2: Type 1 DM
T1DM is a chronic autoimmune disorder in which the body’s own immune system attacks
pancreatic beta cells in islets of Langerhans leading to their destruction and this results in
absolute depletion of insulin (Van Belle et al., 2011, Atkinson and Eisenbarth, 2001). At the
point of clinical diagnosis, approximately 60-80% of beta cells have been destroyed by
infiltrating immune cells such as CD8 T cells and macrophages (Notkins et al., 2001). T1DM is
often diagnosed in patients younger than 30 years of age including children (Van Belle et al.,
2011). The incidence of T1DM is highly variable between different regions and ethnic
populations and is on the increase in countries that have historically displayed a low incidence
of T1DM (LaPorte et al., 1985). The disparity of T1DM incidence between regions and/or
ethnic populations suggest that genetic or environmental factors may contribute to the onset of
this disease (Atkinson and Eisenbarth, 2001). For example, Human leukocyte antigen (HLA)
class II genes located on chromosome 6 (also known as the IDDM1, insulin-dependent DM
locus 1) has been linked to T1DM susceptibility. These genes promote the encoding of
antigenic peptides, which present themselves to T-cells, and account for approximately 45% of
the genetic susceptibility to T1DM (Noble et al., 1996, Buzzetti et al., 1998, Atkinson and
Eisenbarth, 2001). A non-HLA loci known as IDDM2 is located on chromosome 11, which
also contains the insulin gene region, and contributes approximately 10% towards the genetic
susceptibility to T1DM (Van Belle et al., 2011). Another T1DM risk allele (IDDM12) is CTLA-
4 (cytotoxic T lymphocyte associated protein 4), which is located on chromosome 2 (Nisticò et
al., 1996, Ueda et al., 2003). It is important for negative regulation of immune responses and
CTLA-4 knock-out mice have been shown to increase lymphocyte proliferation (Waterhouse et
al., 1995). To date no environmental factors have been associated with triggering T1DM.
However, there is growing evidence that certain factors increase the risk of developing T1DM,
which can be classified into three groups: viral infections (e.g. coxsackievirus), early infant diet
(e.g. early introduction of cow’s milk) and toxins (Ellis and Atkinson, 1996, Dahlquist, 1997,
Knip and Akerblom, 1999, Lang et al., 2008).
1.1.3: Type 2 DM
There are approximately 360 million people who have T2DM worldwide and global health
expenditure due to T2DM is in excess of one trillion US dollars (IDF, 2013). T2DM is
characterised by insulin resistance of metabolically active tissues, reduction in insulin synthesis
in beta cells, reduction in beta cell mass and eventual beta cell failure (Kahn, 1994, Robertson,
1995, Lingohr et al., 2002). Beta cell failure coupled with insulin resistance results in elevated
fasting and post-prandial blood glucose levels as a result of increased glucose production from
the liver and decrease in glucose transport into muscle and adipose tissue (Olokoba et al., 2012,
Fujioka, 2007). Beta cells also show remarkable ability of plasticity, in which they can adjust beta

Chapter 1: Introduction
21
cell growth and survival to maintain a balance between metabolic demand and insulin supply.
For example, in obese individuals who do not develop T2DM, their beta cell mass increases to
compensate for the increase in metabolic demand. However, this adaptation is lost in obese
individuals that develop T2DM (Butler et al., 2003a, Maclean and Ogilvie, 1955, Lingohr et al.,
2002). The rise in the incidence of T2DM is largely attributed to lifestyle, environmental and
genetic factors (Hu et al., 2001). Environmental factors include sedentary lifestyle, alcohol
consumption, physical inactivity, excess calorie consumption and smoking (Hu et al., 2001).
Environmental toxins such as bisphenol A (bpA), which is a constituent of plastics, has also
been associated with increased concentrations in urine and the incidence of T2DM (Mean bpA
concentration in healthy control: 4.53-4.66ng/ml; T2DM: 8ng/ml) (Lang et al., 2008). Several
genetic factors have also been associated with the increased incidence of T2DM. For example,
KCNJ11 (potassium inwardly rectifying channel, subfamily J, member 11), which encodes the
islet ATP-sensitive potassium channel Kir.6.2 pore-forming subunit and TCL7L2 (transcription
factor 7-like 2), which regulates expression of glucagon and glucagon-like peptide-1 (GLP-1)
synthesis are known risk factor genes for T2DM (McCarthy, 2010). As mentioned earlier,
approximately 90-95% of all DM cases are related to T2DM (ADA, 2010) and thus there is an
onus within the biomedical, medical and pharmaceutical profession to develop therapies that
not only both stimulate insulin secretion but also maintain or increase beta cell mass by either
stimulating beta cell proliferation or suppressing beta cell apoptosis.
1.1.4: Therapies for DM
Treatment for T1DM patients involve insulin replacement therapy, in which the administered
insulin directly compensates for the loss of insulin secretion from beta cells by reducing blood
glucose levels through stimulation of glucose uptake and storage, and suppression of hepatic
glucose production. The introduction of long lasting (glargine) and rapid acting (lispro and
aspart) insulin analogues provides alternative options for improved glycaemic control compared
to regular insulin (Burge and Schade, 1997, Cameron and Bennett, 2009). Recent U.S. Food and
Drug Administration (FDA) approval of an inhaled form of insulin can be used for T1DM and
T2DM treatment, which is more effective and rapidly acting than intravenously administered
short acting insulin (Black et al., 2007, Rosenstock et al., 2010).
Treatment of T2DM is managed by modifications to lifestyle management and/or in
combination with hypoglycaemic drugs. Maintenance of body mass index (BMI) of 25kg/m2 as
well as dietary modifications such as increased fibre consumption, increased unsaturated fats,
reduced saturated fats and diets low in glycaemic index coupled with regular exercise and
abstinence from smoking and alcohol consumption have been shown to significantly reduce the
incidence of T2DM (Hu et al., 2001, Willi et al., 2007, Yoon et al., 2006, Boffetta et al., 2011).

Chapter 1: Introduction
22
However, failure to make lifestyle modifications can exacerbate complications associated with
sustained hyperglycaemia such as atherosclerosis, obesity, dyslipidaemia and hypertension
(Ferrannini et al., 1991, Modan et al., 1985, Swislocki et al., 1989, Reaven et al., 1967, Zavaroni
and Reaven, 1981). Therefore, glycaemic control by hypoglycaemic agents has become the front
line of T2DM therapeutic intervention, which fall into four major categories: insulin sensitisers,
insulin secretagogues, glucose absorption inhibitors and glucose excretion stimulators (Figure
2).
Insulin sensitisers
Biguanides such as, metformin, are commonly used in overweight and obese patients. Their
principal function is to enhance sensitivity of hepatic and other peripheral insulin-sensitive
tissues. Biguanides inhibit hepatic glycogenolysis and gluconeogenesis, resulting in an overall
reduction in blood glucose levels. They also enhance the uptake of glucose into muscle due to
increased expression of GLUT4. Although, metformin has been reported to cause Lactic
acidosis as a rare side-effect associated with its use, it is effective in reducing macrovascular
complications and reducing weight (DeFronzo et al., 1991, Stumvoll et al., 1995, Wollen and
Bailey, 1988, Rossetti et al., 1990, Viollet et al., 2012, DeFronzo, 1999).
Insulin secretagogues
Sulphonylureas have been the main therapy for treating T2DM and have been in commercial
use for over 50 years. Their principal mechanism of action is to stimulate insulin secretion by
binding to the sulphonylurea receptor 1 (SUR1) on the beta cell, and subsequently close the
KATP channel. This causes a decrease in potassium efflux and elicits depolarisation of the beta
cell membrane resulting in calcium influx via VOCCs, which promote insulin granule exocytosis
(Siconolfi-Baez et al., 1990). Although, sulphonylureas are the least expensive of all oral
hypoglycaemic drugs, they have notable side effects of weight gain and hypoglycaemia
(DeFronzo, 1999). Glimepride, is a third generation sulphonylurea currently used clinically.
However, there are concerns associated with the use of sulphonylureas as they stimulate insulin
secretion in the absence of elevated blood glucose levels resulting in hypoglycaemic episodes,
weight gain and have been implicated in increased beta cell apoptosis (Efanova et al., 1998,
Maedler et al., 2005).
Meglitinides such as repaglinide and nateglinide are non-sulphonylurea secretagogues that have
a similar mode of action to sulphonylureas. They close KATP channels via an alternative binding
site to sulphonylureas (Fuhlendorff et al., 1998). They have a rapid onset and short duration (4-
6 hours) making them ideal for post-prandial glycaemic control and they are associated with a
lower risk of hypoglycaemia (DeFronzo, 1999).

Chapter 1: Introduction
23
Thiazolidinediones (TZDs) such as troglitazone, pioglitazone and rosiglitazone, are a class of
peroxisome proliferator activated receptor γ (PPARγ) agonists, which enhance sensitivity to
insulin especially in muscle by stimulating GLUT4 expression (Saltiel and Olefsky, 1996) and
they also reduce hepatic glucose production. In addition, TZDs have been reported to improve
beta cell function (Ovalle and Bell, 2002, Gastaldelli et al., 2007) However, TZDs also increase
adipocyte numbers, which explains the weight gain associated with its use (Spiegelman, 1998).
Troglitazone was associated with liver toxicity and has since been withdrawn (Gitlin et al., 1998,
DeFronzo, 1999). Recent developments have also resulted in the withdrawal of rosiglitazone in
the UK due to significant risk of myocardial infarction associated with its use (Nissen and
Wolski, 2007) and the use of pioglitazone is also associated with an increased risk of bladder
cancer in T2DM subjects (Azoulay et al., 2012), which has also led to its withdrawal in India,
Germany and France.
Glucagon-like peptide 1 (GLP-1) mimetics such as exenatide and liraglutide form the
foundation of incretin-based therapies, which were adopted for clinical use in 2005 in the US
and 2007 in the UK. Endogenous GLP-1 is released by L-cells in response to food intake and it
is detected by islet GLP-1 receptors (GLP-1R). It potentiates nutrient-induced insulin secretion,
suppresses glucagon secretion, and also enhances insulin sensitivity by up-regulating GLUT 1
and GLUT 4 expression (Wang et al., 1997). However, GLP-1 is rapidly degraded by dipeptidyl-
peptidase IV (DPP-4), which significantly reduces its half-life and therefore its efficacy. The
GLP-1 analogue exenatide shares approximately 50% amino acid sequence homology to GLP-1
and activation of the GLP-1R results in cAMP elevations, which is the prominent mechanism
of stimulating insulin secretion in beta cells. GLP-1 also stimulates insulin secretion via cAMP-
independent effects by closing the KATP channels (Suga et al., 2000). Exenatide has recently
been implicated in the increased risk of acute pancreatitis (Denker and Dimarco, 2006, Singh et
al., 2013) and has been issued with a safety alert by the FDA.
DPP-4 inhibitors such as sitagliptin and vildagliptin have been developed to prolong the half-
life of GLP-1 and therefore the use of long lasting GLP-1 analogues and DPP-4 inhibitors serve
as an attractive therapy for T2DM. Furthermore, their ability to improve insulin secretion in a
glucose-dependent manner, increase beta cell mass and their once-daily administration are
making them attractive therapeutic options. However, approval of vildagliptin has been delayed
by the FDA in the US due to reduced renal function observed in animal studies (Hughes, 2008).
Glucose absorption inhibitors
Alpha-glucosidase inhibitors (acarbose, miglitol) inhibit the activity of digestive enzymes
(maltase, isomaltase, sucrase and glucoamylase), located in the brush border of the

Chapter 1: Introduction
24
gastrointestinal (GI) tract. These enzymes are responsible for breaking down carbohydrate
disaccharides into monosaccharides, and their inhibition delays the absorption of glucose into
the systemic circulation. This provides the beta cells ample time to release insulin to cope with
the blunted elevation in plasma glucose levels and they are therefore effective post-prandial
hyperglycaemic agents (Clissold and Edwards, 1988, Coniff et al., 1995). However, they are
associated with side-effects such as diarrhoea and flatulence but they are not associated with
weight gain (DeFronzo, 1999).
Glucose excretion stimulators
Inhibitors of sodium glucose co-transporter 2 (SGLT-2) such as, Dapagliflozin (Forxiga),
Canagliflozin (Invokana) and Empagliflozinare (Jardiance), are used to lower blood glucose
levels by inhibiting glucose reabsorption in the proximal convoluted tubule of the kidney, which
accounts for 90% of glucose reabsorption (Marsenic, 2009). However, there are certain
limitations associated with their use, for example, SGLT-1 is expressed in various tissues
including kidney and thus restrict the use of SGLT inhibitors that are not selective for SGLT-2.
Furthermore, glycosuria associated with use of SGLT-2 inhibitors has been implicated in the
development of bacterial urinary tract infections and genital infections (Geerlings et al., 2014).

Chapter 1: Introduction
25
Figure 2: Different classes of therapies currently available for T2DM.

Chapter 1: Introduction
26
1.2: Regulation of hormone secretion from islets of Langerhans
1.2.1: Islet cytoarchitecture
Pancreatic islets are highly-vascularised micro-organs and form the endocrine portion of the
pancreas, which is crucial for glucose homeostasis (Bonner-Weir, 1988, Lammert et al., 2003).
Islets typically consist of four major endocrine cell types, insulin-secreting beta (β) cells,
glucagon-secreting alpha (α) cells, somatostatin-secreting delta (δ) cells and pancreatic
polypeptide-secreting (PP) cells. As illustrated in Figure 3, mouse (Mus musculus) and rat (Rattus
norvegicus) islets exhibit distinct islet architecture compared to human islets, with a clear
segregation between beta cells and non-beta cells. Rodent islets retain 60-80% of beta cells in
the core of the islet whereas non-beta cells such as alpha cells (10-20%), delta cells (<10%) and
PP cells (<1%) are predominantly localised to the periphery (mantle) of the islet. Human islets,
which are composed of a higher proportion of alpha cells (40%) and lower proportion of beta
cells (<50%), have a more disorganised cytoarchitecture compared to rodent islets and do not
retain a segregated formation between beta cells and non-beta cells like their rodent
counterparts. The dispersed nature of beta cells in human islets has been suggested to improve
islet sensitivity to low blood glucose concentrations (1mM) to which mouse islets are insensitive
(Cabrera et al., 2006, Brissova et al., 2005).
As mentioned earlier, islets are highly-vascularised micro-organs and it has been theorised that
islet cytoarchitecture could influence intra-islet microcirculatory patterns. Three models have
been proposed; (1) Mantle to core: non-beta cells are able to detect changes in glucose
concentrations before signalling to the beta cell core to invoke an appropriate insulin secretory
response (Ballian and Brunicardi, 2007), (2) Core to mantle: beta cells detect changes in glucose
concentrations first and initiate an insulin secretory response for it to be appropriately
modulated by non-beta cells localised to the mantle (Samols et al., 1988), and (3) Artery to vein:
blood enters the islets from the artery and is drained away into a vein irrespective of cellular
composition (Liu et al., 1993).
The number of cells that form an islet and islet size can vary from between 10 or fewer cells to
thousands of cells in the same population, with mean size 116±80µm for mouse islets and
50±29µm for human islets (Kim et al., 2009). The multicellular environment within islets,
containing beta cells and non-beta cells, enables integrative secretory responses to various
nutrient and non-nutrient stimuli (section 1.1.4 and 1.1.5). Single islet cells can regulate their
own physiological action in response to their own by-products (autocrine effect) or by exerting
their effects on neighbouring islet cells (paracrine effect), which are essential for maintaining
proper islet function. For example, the dissociation of rodent islets into monolayers results in
Chapter 1: Introduction
27
beta cells being unable to respond to stimulatory glucose concentrations but re-aggregation into
pseudoislets restores normal secretory function (Hopcroft et al., 1985, Halban et al., 1982,
Lernmark, 1974, Hauge-Evans et al., 1999). The presence of gap junctions, adhesion molecules
(E-cadherins, N-CAM) and connexins 36 and 43 have also been attributed to normal islet
secretory function and islet morphology, which permit a synchronised mechanism of cell to cell
communication and allows for an appropriate beta cell response to various stimuli (Leite et al.,
2005, Dahl et al., 1996, Yamagata et al., 2002, Esni et al., 1999, Meda, 2003, Hauge-Evans et al.,
1999). Insulin secretion, which is a multicellular process, requires sufficient release of insulin
under normal physiological and pathophysiological conditions that cannot be achieved by
individual cells alone (Bavamian et al., 2007). Therefore, the co-ordinated cytoarchitecture, cell-
cell communication and the prominent intra-islet vasculature enable islets to serve as the
primary micro-organ to effectively regulate glucose homeostasis.
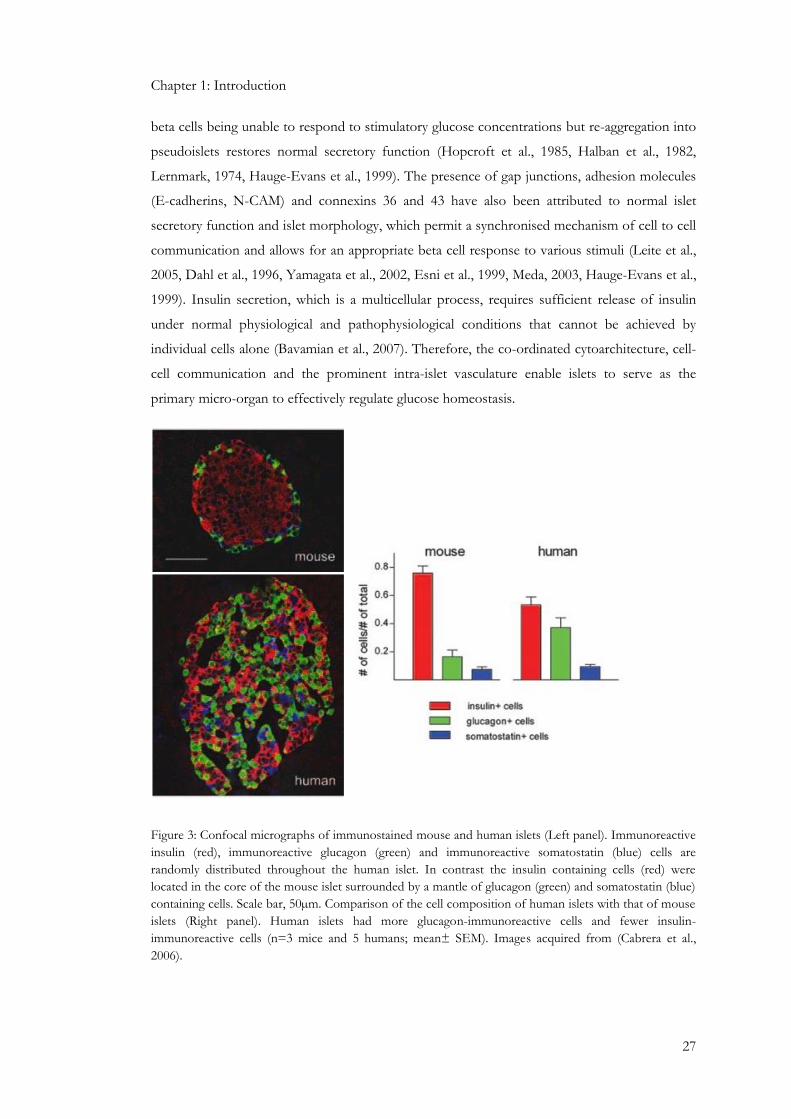
Figure 3: Confocal micrographs of immunostained mouse and human islets (Left panel). Immunoreactive
insulin (red), immunoreactive glucagon (green) and immunoreactive somatostatin (blue) cells are
randomly distributed throughout the human islet. In contrast the insulin containing cells (red) were
located in the core of the mouse islet surrounded by a mantle of glucagon (green) and somatostatin (blue)
containing cells. Scale bar, 50µm. Comparison of the cell composition of human islets with that of mouse
islets (Right panel). Human islets had more glucagon-immunoreactive cells and fewer insulin-
immunoreactive cells (n=3 mice and 5 humans; mean± SEM). Images acquired from (Cabrera et al.,
2006).

Chapter 1: Introduction
28
1.2.2: Glucose homeostasis: Insulin and glucagon action
Glucose is the main energy source for mammalian cells with the mammalian brain requiring a
constant supply of glucose to function appropriately (Bogan, 2012). Plasma glucose
concentration is finely balanced between glucose entry into the circulatory system from the
absorption of glucose in the gastrointestinal (GI) tract and glucose clearance from the
circulatory system. Circulating glucose is derived from three sources; gastric emptying after food
intake, which accounts for the majority of glucose entry into the circulatory system as well as
hepatic processes such as gluconeogenesis, which is the synthesis of glucose from amino acids
and lactate, and glycogenolysis, which is the breakdown of the polymerised form of glucose
(Aronoff et al., 2004). Physiological glucose concentrations are tightly regulated to prevent
chronic elevations in glucose, which is detrimental to beta cell health (glucotoxicity) and can
promote the onset of type 2 diabetes mellitus (T2DM), and thus underlies the importance of
glucoregulatory hormones such as insulin, glucagon, GLP-1, GIP, adrenaline, cortisol and
amylin (Aronoff et al., 2004, Bensellam et al., 2012).
Insulin, the primary hormone secreted from beta cells of islets, lowers postprandial blood
glucose concentrations by promoting the storage and synthesis of carbohydrates, lipids and
proteins (Saltiel and Kahn, 2001). The physiological action of insulin is mediated by its binding
to the insulin receptor (InsR), which is a heterotetrameric structure consisting of two
extracellular insulin-binding alpha subunits, and two transmembrane beta subunits with tyrosine
kinase activity. Insulin binding to the alpha subunits results in the trans-phosphorylation of beta
subunit tyrosine residues in an activation loop (autophosphorylation), which increases the
overall catalytic activity of the kinase (Watson et al., 2004, Saltiel and Pessin, 2003). Activation
of InsR phosphorylates downstream intracellular targets such as insulin receptor substrate (IRS)
on multiple tyrosine residues. IRS-1 and IRS-2 are widely expressed throughout insulin-sensitive
tissues (Taniguchi et al., 2005), whilst IRS-3 is predominantly expressed in adipocytes (Lavan et
al., 1997). IRS-1 knock out mice show signs of growth retardation (Tamemoto et al., 1994) but
do not develop DM, but IRS-2 knockout mice are insulin resistant, develop T2DM and show
impaired beta cell function (Withers et al., 1998). IRS phosphorylation recruits downstream
effectors that influence phosphatidylinositol-kinase 3 (PI3K), PKB/Akt or MAPK cascades.
IRS1/2 recruits PI3K at the plasma membrane, which produces PIP3 and activates a
serine/threonine phosphorylation cascade targeting PDK1, PKB/Akt and PKC (White, 2002,
Alessi and Downes, 1998, Vanhaesebroeck and Alessi, 2000, Beeson et al., 2003), which
stimulate the translocation of glucose transporter-4 (GLUT-4) to the plasma membrane and
thus enhance glucose uptake. PKB/Akt activation can also activate glycogen synthase to
promote glycogen synthesis, which prevents glucose release into the circulation (Brady et al.,
1998, Sano et al., 2003, Beeson et al., 2004).

Chapter 1: Introduction
29
Elevations in plasma glucose levels increase glucose uptake and utilisation predominantly by
skeletal muscle, which is responsible for 75% of all glucose uptake at euglycaemia and 95% at
hyperglycaemia, and to a lesser extent adipose tissue (Baron et al., 1988). Glucose is a
hydrophilic molecule, which cannot cross the plasma membrane freely, and is rapidly
phosphorylated by hexokinase much faster than its uptake into the cell. Furthermore,
intracellular glucose concentration is negligible compared to the extracellular compartment
(5mM) and therefore large glucose concentration gradients are established between the
intracellular and extracellular compartments (Klip and Paquet, 1990). Glucose transporters 1
and 4 (GLUT 1 and GLUT 4) are expressed by skeletal muscle (Zorzano et al., 1996), and the
fructose transporter (GLUT 5) is also expressed in human skeletal muscle (Hundal et al., 1992).
GLUT 4 is responsible for 60-70% of basal glucose uptake (Rudich et al., 2003). Under basal
conditions most of the GLUT 4 are localised in their intracellular membranes but their
translocation from the endosomal compartment to the cell membrane is induced by InsR
activation by insulin and thus facilitates glucose uptake into the skeletal muscle. The liver is an
important tissue for glucose homeostasis as it is responsible for glucose production, glucose
utilisation, and it is the sole site for the glucoregulatory action of glucagon. GLUT 2 is
responsible for the major glucose transport role in hepatocytes, as well as beta cells, whilst
insulin stimulates glycogen synthesis as well as inhibiting glycogenolysis and gluconeogenesis by
stimulating glycogen synthase and simultaneously inhibiting liver glycogen phosphorylase, thus
regulating blood glucose levels. (Ortmeyer et al., 1997, Chiasson et al., 1976).
Glucagon, which is secreted by islet alpha cells, is a key glucoregulatory hormone that opposes
the physiological actions of insulin. Glucagon release is stimulated in response to low blood
glucose concentrations and its main function is to stimulate hepatic glucose production (Jiang
and Zhang, 2003). This is achieved by promoting glycogenolysis and gluconeogenesis (Rosa et
al., 1992). Glucagon binds to the G-protein coupled glucagon receptor (GluR), which is
associated with two classes of G-proteins, Gαs and Gαq (Jiang and Zhang, 2003). Glucagon
promotes glycogenolysis by binding to the GluR resulting in its association with Gαs, which
stimulates adenylate cyclase (AC) to generate cAMP, which activates the downstream effector
protein kinase A (PKA), resulting in decreased glycogen synthesis, increased glycogenolysis and
gluconeogenesis, and elevated circulating blood glucose levels (Jiang and Zhang, 2003).
1.2.3: Biosynthesis and storage of insulin and glucagon
Insulin is a 51 amino acid protein with a molecular weight of 5.8kDa and it contains two chains:
A chain (21 residues) and B chain (30 residues) joined together by a 31 amino acid C-peptide.
The insulin gene encodes a 110 amino acid insulin precursor known as preproinsulin (PPI)
(Egea et al., 2005). Translocation of PPI across the rough endoplasmic reticulum (ER) and into

Chapter 1: Introduction
30
the lumen results in the cleavage of the signal peptide by a signal peptidase to liberate
proinsulin. The proinsulin undergoes protein folding along with the formation of three
disulphide bonds, which are essential for insulin stability and bioactivity, and the action of
prohormone convertase (PC) 1/3 and PC2, cleave the C-peptide away from the A and B chains
(Ozawa et al., 2014, Huang and Arvan, 1994). Proinsulin is then transported from the ER to the
golgi apparatus where it enters immature secretory granules for it to be cleaved into insulin and
C-peptide (Huang and Arvan, 1994). The insulin stored in these secretory granules await
exocytosis in response to an external stimuli (Weiss, 2009, Nishi et al., 1990).
Glucose metabolism is the most important regulator of insulin gene transcription and
translation (Poitout et al., 2006). A mouse beta cell contains approximately 13,000 insulin
granules, occupying 10% of total cell volume. Each granule contains approximately 200,000
insulin molecules (Dean, 1973, Howell, 1984). Insulin content of beta cells is a dynamic event
and increases in response to nutrients and decreases in response to nutrient suppression. As the
insulin concentration in secretory granules increases the insulin monomer form dimers and then
hexamers, which are secreted from the beta cell and pass into the circulatory system, where
insulin dissociates into monomers. Therefore, the monomer is the active form of insulin and the
hexamer is the storage form of insulin (Fu et al., 2013).
Glucagon is a 29 amino acid protein that is secreted by islet alpha cells. It is derived from the
precursor molecule proglucagon, which is expressed in brain, pancreas and intestine (Jiang and
Zhang, 2003). Proglucagon is processed differentially in pancreatic alpha cells and intestinal L-
cells, in that it is converted to mature glucagon in alpha cells and glucagon-like peptide-1 (GLP-
1) in L-cells. A prohormone converatase (PC2) is responsible for the proteolytic processing of
proglucagon to the biologically active glucagon (Rouille et al., 1997).

Chapter 1: Introduction
31
1.2.4: Nutrient regulation of insulin and glucagon secretion.
In T2DM the secretion of glucagon and insulin are perturbed, which results in elevated plasma
glucose levels (Nolan and O’Dowd, 2009). The reduction in glucose-induced insulin secretion is
attributed to a defect in glucose sensing by beta cells (Cerasi, 1975). In normal healthy subjects,
glucose entry into beta cells is a carrier-mediated process through GLUT 2 in rodents and
GLUT 1, 2 and 3 in humans (De Vos et al., 1995, Coppieters et al., 2011). Once inside the beta
cells the glucose is phosphorylated by a series of enzymatic steps. The rate limiting step of
glucose metabolism is its phosphorylation to glucose-6-phosphate. Mouse islet beta cells
express three enzymes that regulate this step; 1) hexokinase, which has a low Km for glucose
(0.1mM); 2) glucokinase, which has a high Km for glucose (10mM); 3) glucose-6-phosphatase,
which is inhibited by glucose (Hedeskov, 1980).
In brief, glucose-6-phosphate undergoes glycolysis and results in the generation of the end
product pyruvate, which enters the tricarboxylic (TCA) cycle in the mitochondria, resulting in
the elevation of cytosolic ATP:ADP ratio, which is essential for nutrient-induced insulin
exocytosis. Inhibition of oxidative phosphorylation, the process in which the majority to ATP is
generated, using anoxia or 2,4-dinitrophenol inhibits glucose-induced insulin secretion (Coore
and Randle, 1964). The elevation in intracellular ATP concentration inhibits potassium (K+)
efflux due to the binding of ATP to the pore-forming Kir6.2 subunit of ATP-sensitive K+
channels (KATP). This results in beta cell membrane depolarisation, which activates voltage
operated calcium channels (VOCCs), predominantly L-type VOCCs (Rorsman and Renström,
2003, Wiser et al., 1999). The influx of calcium into the cytosol triggers insulin exocytosis
(Sakurada et al., 1993), and it has been shown that a readily releasable pool (RRP) of insulin
containing granules are tightly coupled to the L-type VOCCs, with evidence of synaptic proteins
of the insulin exocytotic machinery such as syntaxin 1A and SNAP-25 that interact with L-type
VOCCs and tether and direct calcium entry via VOCCs to the RRP insulin containing granules
(Wiser et al., 1999, Wiser et al., 1996).
Insulin granule fusion at the beta cell membrane is due to the interaction of soluble N-
ethylmaleimide-sensitive factor attachment protein receptors (SNAREs), which form complexes
at the cell membrane. SNARE proteins are expressed on the plasma membrane (T-SNARES)
such as syntaxin and synaptosomal-associated protein of 25kDa (SNAP-25). SNARES are also
expressed on the vesicle membrane (V-SNARES) such as vesicle-associated membrane protein
2 (VAMP-2) and synaptobrevin-2. Synaptotagmins are believed to be important for calcium
sensing in vesicle fusion, which contain two calcium binding sites (C2A and C2B). Although
synaptotagmins I and II are expressed by beta cell lines they are not present in primary beta cells
and therefore their role in insulin exocytosis is unclear (Rorsman and Renström, 2003). In beta

Chapter 1: Introduction
32
cells, a family of small GTP-binding Rab proteins such as Rab3A have been implicated in
regulating insulin exocytosis. Rab3A localises to the cytoplasmic face of secretory granules and
is thought to act as a ‘brake’ on insulin granule exocytosis. The Rab3-interacting molecule
(Rim) is also present in beta cells and has the ability to interact with L-type VOCCs, SNAP-25
and synaptotagmin (Rorsman and Renström, 2003).
As illustrated by Figure 4, glucose-induced insulin release from beta cells exhibits a biphasic
pattern, which involves an initial transient first phase followed by a sustained second phase.
This characteristic biphasic response of insulin secretion is attributed to the activation of
different pools of insulin granules. The first phase involves the RRP of granules and typically
accounts for 1-5% of total granules in the beta cell. The second pool of insulin containing
granules is known as the non-readily releasable pool, which accounts for >95% of total
granules. These granules become release-competent by mobilisation from the reserve pool,
docking to the beta cell membrane and priming prior to release (Rorsman and Renström, 2003).
Figure 4: Schematic diagram illustrating biphasic glucose-induced insulin secretion. The transient first
phase is attributed to the release of insulin from the readily releasable pool (RRP) of granules (green). The
sustained second phase is attributed to the mobilisation of secretory granules from the reserve pool (red),
and these granules must undergo docking and priming at the beta cell membrane before release
competency is achieved. Image acquired and modified from (Rorsman and Renström, 2003).

Chapter 1: Introduction
33
Glucagon secretion is maximally inhibited at blood glucose levels of 3mM in mouse and human
islets, which are concentrations known not to stimulate insulin secretion. Alpha cells contain a
set of sodium and calcium channels that generate action potentials in the absence of glucose or
at low glucose concentrations, which triggers calcium influx and glucagon secretion (Gromada
et al., 1997a). Elevations in glucose concentration inhibit all these events. As illustrated in Figure
5, glucose enters the alpha cell through the GLUT 1 transporter. At low glucose concentrations,
the activity of KATP channels remains moderate and this maintains the membrane potential
within a range that can open VOCCs (Quesada et al., 2008). Calcium entry through the N-type
VOCCs induces glucagon secretion. However, in human alpha cells the P/Q-type VOCCs are
predominantly responsible for promoting glucagon secretion (Walker et al., 2011). An increase
in extracellular glucose results in the elevation of ATP:ADP ratio, which blocks KATP channels
and depolarises the alpha cell to a membrane potential where channels involved in action
potential generation are inactivated which consequently inhibits electrical activity, calcium influx
and glucagon secretion (Gromada et al., 1997a, MacDonald et al., 2007, Quesada et al., 2008).
Furthermore, alpha cells contain more voltage gated sodium channels than beta cells and they
are inactivated at membrane potentials more positive than -50mV, leading to reduced action
potential firing and subsequent glucagon secretion (Göpel et al., 2000). The repolarisation of
alpha cells is mediated by the efflux of potassium (K+) via K+ channels (Quesada et al., 2008).

Chapter 1: Introduction
34
Figure 5: Schematic diagram of glucose-dependent regulation of glucagon secretion from alpha
cells low glucose concentrations. Glucose enters alpha cells through glucose transporter 1 (GLUT1)
resulting in the generation of ATP from the mitochondria. At low glucose concentrations the activity of
KATP channels is moderate, which keeps the membrane potential within range to activate VOCCs. This
results in the influx of calcium and subsequently triggers glucagon secretion. The repolarisation of alpha
cells is mediated by the efflux of potassium (K+) via K+ channels.

Chapter 1: Introduction
35
1.2.5: Non-nutrient regulation of islet hormone secretion and intra-islet hormone
communication.
Neurotransmitters
Parasympathetic, sympathetic and sensory nerves innervate islet endocrine cells that regulate
islet hormone secretion (Ahrén et al., 2006). Parasympathetic innervation of islets emanates
from the pancreatic ganglia, which are innervated from the preganglionic nerves stemming from
the dorsal motor nucleus of the vagus (Ahrén et al., 2006). The cholinergic nerves enter the
pancreas along blood vessels and terminate at the intrapancreatic ganglia, from which post-
ganglionic nerves penetrate the islet and innervate endocrine cells. Cholinergic stimulation
elevates both insulin and glucagon secretion (Ahrén, 2000, Bloom and Edwards, 1981, Honey
and Weir, 1980, Duttaroy et al., 2004). Activation of parasympathetic nerves releases the
neurotransmitter acetylcholine (Ach), which transmits its stimulatory effect on glucose-induced
insulin secretion by binding to the Gq coupled muscarinic (M3) receptor expressed on beta cells.
M3 activation in islets stimulates protein kinase C (PKC) following phospholipid hydrolysis
(Persaud et al., 1989). Neuropeptides are also released by parasympathetic nerves, which include
vasoactive intestinal peptide (VIP), gastrin-releasing peptide (GRP) and pituitary adenylate
cyclase activating polypeptide (PACAP), which stimulate both insulin and glucagon secretion
(Honey and Weir, 1980, Ahren and Lundquist, 1981, Filipsson et al., 1998a, Schebalin et al.,
1977, Filipsson et al., 1997). VIP and PACAP stimulate insulin secretion by binding to their
respective Gs-coupled receptors VIP2 and PAC1, which are expressed by beta cells (Filipsson et
al., 1998b), and elevate cAMP levels as a result of adenylate cyclase (AC) activation (Klinteberg
et al., 1996). GRP stimulates glucose-induced insulin secretion by binding to the GRP receptor,
activating phospholipase C and D, promoting the release of calcium from intracellular stores
and calcium influx from the extracellular compartment by stimulating DAG-sensitive PKC
isoforms (Gregersen and Ahren, 1996).
Post ganglionic sympathetic nerves, which stem from the preganglionic nerves originating from
the hypothalamus, also innervate islets. Activation of sympathetic nerves, which release the
neurotransmitter noradrenaline, inhibits glucose-induced insulin secretion (Porte and Williams,
1966). Activation of the α2-adrenoreceptor results in the hyperpolarisation of beta cells by
opening KATP channels and thereby inhibiting calcium influx (Nilsson et al., 1988). α2-
adrenoreceptor activation has also been shown to reduce islet cAMP levels (Nakaki et al., 1981)
whereas activation of β2-adrenoreceptor has been reported to increase cAMP formation and
stimulate insulin secretion in beta cells (Kuo et al., 1973). Furthermore, β2-adrenoreceptor
activation can also stimulate insulin secretion indirectly by directly stimulating β2-
adrenoreceptor-mediated glucagon secretion from alpha cells (Lacey et al., 1991).

Chapter 1: Introduction
36
Neuropeptides such as neuropeptide Y (NPY) and galanin are also released upon sympathetic
stimulation. NPY inhibits insulin secretion most likely through the activation of NPY receptor
1(Y1), which is known to reduce cAMP levels by inhibiting AC (Morgan et al., 1998). Galanin is
a potent inhibitor of insulin secretion, through activation of the galanin receptor 1 (GalR1)
expressed by beta cells (Parker et al., 1995), resulting in hyperpolarisation, reduction in cytosolic
calcium and reduction in cAMP formation (Ahrén and Lindskog, 1992).
Insulin
Glucose is the main regulator of insulin secretion from beta cells. Moreover, intra-islet
communication via paracrine or autocrine processes can also influence islet hormone secretion.
Insulin can act in an autocrine fashion on beta cells by binding to beta cell InsR (Gazzano et al.,
1985, Verspohl and Ammon, 1980, Harbeck et al., 1996), to stimulate insulin gene transcription,
elevate insulin biosynthesis and insulin content (Xu and Rothenberg, 1998). It can also stimulate
InsR tyrosine kinase activity followed by IRS-1 phosphorylation to transmit the insulin signal in
the beta cell and stimulate insulin secretion via a calcium-dependent mechanism (Aspinwall et
al., 1999), however it has been reported that insulin does not have an autocrine effect on insulin
secretion but has been shown to decrease apoptosis in human islets (Persaud et al., 2008)
Insulin also inhibits glucagon mRNA expression and glucagon secretion from neighbouring
alpha cells, by stimulating IRS-1 phosphorylation and activation of phosphatidylinositol 3-kinase
(PI3K) in R1-G9 cells, a pancreatic alpha cell line (Kawamori et al., 2009, Diao et al., 2005,
Kaneko et al., 1999). Insulin also stimulates somatostatin (SST) secretion (Honey and Weir,
1979). It has also been shown that insulin can suppress SST secretion in the presence of SST
stimulators such as glucose and arginine (Gerber et al., 1981).
Glucagon
Glucagon stimulates insulin and somatostatin secretion, and GluR are expressed by beta cells
and delta cells (Kawai et al., 1995, Wojtusciszyn et al., 2008, Kieffer et al., 1996). Binding of
glucagon to the Gαs-coupled GluR results in activation of AC and elevations of two second
messengers; cAMP and calcium (Jelinek et al., 1993, Huypens et al., 2000, Authier and
Desbuquois, 2008). Studies have shown that the increases in intracellular calcium may be
mediated through cAMP-dependent (Staddon and Hansford, 1989) or cAMP-independent
signal transduction pathways (Mine et al., 1988, Wakelam et al., 1986), such as stimulation of
inositol triphosphate (IP3), a component of the Gq signalling pathway associated with calcium
mobilisation (Wakelam et al., 1986). Glucagon can also regulate glucagon synthesis and
secretion in an autocrine fashion by signalling through its own receptor followed by PKC or
PKA activation (Leibiger et al., 2012, Ma et al., 2005).

Chapter 1: Introduction
37
Somatostatin (SST)
SST secreted from delta cells is a potent inhibitor of insulin and glucagon. In rats, SST is also
secreted from D-cells of the gastrointestinal tract, brain and pancreas, which account for 65%,
25% and 5% of its production, respectively (Patel and Reichlin, 1978). SST exerts its effects
through SST receptors (SSTRs), which are G-protein coupled receptors (GPCRs). To date, five
members of the SSTR (SSTR1 – SSTR5) family have been identified (Watt et al., 2008,
Ludvigsen et al., 2004), all of which are expressed by rodent islets. SSTR1, SSTR2 and SSTR5
are expressed by beta cells in mouse islets whereas SSTR1-SSTR5 are expressed by alpha cells,
with abundant expression of SSTR2 and SSTR5 (Ludvigsen et al., 2004). SSTRs couple to the
Gαi protein, to decrease cAMP levels, inhibit VOCCs and activate KATP channels, which tightly
couple SSTRs to exocytotic vesicle release from delta cells (Watt et al., 2008).
Pancreatic polypeptide
Pancreatic polypeptide (PP) is secreted from islet PP cells, but its physiological significance in
regulating islet hormone secretion remains unclear. However, PP has been shown to stimulate
gastric motility (McTigue and Rogers, 1995) and stimulate food intake in rats (Clark et al., 1984).
Ghrelin
Ghrelin is 28-amino acid protein secreted by a small population of islet ε-cells, which stimulates
beta cells to elevate cytosolic calcium concentrations as well as insulin secretion (Date et al.,
2002). However, it has been shown that ghrelin released into the intra islet microcirculation
inhibits insulin release in rodents and humans (Tong et al., 2010, Reimer et al., 2003). Ghrelin
signals through Gαi, which attenuates glucose-induced cAMP elevations and PKA activation
subsequently supressing glucose-induced insulin secretion (Dezaki et al., 2011). Furthermore,
ghrelin has also been shown to stimulate food intake in rats (Wren et al., 2000).

Chapter 1: Introduction
38
Incretins
Incretins are peptide hormones secreted from the gastrointestinal tract and into the
bloodstream in response to ingestion of food, which modulate insulin secretion and thus is
known as the incretin effect. It accounts for at least 50% of total insulin secretion after an oral
glucose intake (Holst and Gromada, 2004, Kim and Egan, 2008). Two major candidates
responsible for the insulinotropic properties of incretins are glucagon-like peptide-1 (GLP-1)
and gastric inhibitory polypeptide (GIP).
GLP-1 is a product of the glucagon gene and is transcribed and synthesised in L-cells located in
the intestinal mucosa, in which the translational product proglucagon is cleaved to generate
GLP-1 and GLP-2, and not glucagon as in pancreatic islet alpha cells (Mojsov et al., 1986). Both
GLPs share approximately 50% sequence homology to that of glucagon and GLP-1 secretion is
stimulated by nutrients in the lumen of the gut as well as neural and endocrine mechanisms
(Holst and Gromada, 2004). GLP-1 is a highly potent glucose-dependent insulinotropic peptide
with half-maximal effective concentrations observed in beta cells as low as 10pM (Fehmann et
al., 1995). Mice with targeted deletion of GLP-1 exhibit glucose intolerance and fasting
hyperglycaemia (Scrocchi et al., 1996). GLP-1 activity is transmitted via the G-protein coupled
GLP-1 receptor (GLP-1R), which is expressed by beta cells. Upon GLP-1R activation cAMP
levels are increased by AC activation, which subsequently activates the downstream effectors
PKA and Epac2 (cAMP-regulated guanine nucleotide exchange factor II), to regulate ion
channel conductance, cytosolic calcium handling and promote exocytosis of insulin-containing
granules (Holz, 2004). GLP-1 also stimulates insulin gene transcription by up-regulating
transcription factors such as pancreatic duodenal homeobox-1 (PDX-1), which promotes
insulin biosynthesis and up-regulates components associated with the insulin secretory
machinery such as glucokinase and GLUT 2 (Fehmann and Habener, 1992, Buteau et al., 1999).
GIP, which has insulinotropic properties, is secreted from intestinal K-cells and is abundantly
localised in the duodenum and the intestinal mucosa.. The GIP receptor (GIP-R) is a G-protein
coupled receptor, which is expressed by islets, brain, adipose tissue, heart, gut, pituitary and
adrenal cortex (Mayo et al., 2003, Mortensen et al., 2003). GIP secretion is stimulated by
carbohydrates and lipids and is usually elevated 10-20 fold following meal ingestion (Holst and
Gromada, 2004). The activation of GIP-R by GIP causes elevations in cAMP levels in beta
cells, which increases cytosolic calcium and promotes insulin exocytosis (Ding and Gromada,
1997, Wheeler et al., 1995). Other signal transduction pathways have been implicated in the
secretagogue effects of GIP including activation of mitogen-activated protein kinases (MAPK)
and PI3K (Trumper et al., 2001, Ehses et al., 2002).

Chapter 1: Introduction
39
1.2.6: Importance of calcium and protein kinases in beta cell stimulus-secretion
coupling
Calcium-dependent regulation of insulin secretion
Intracellular calcium concentration in beta cells are maintained between 50-100nM in an
unstimulated state and can increase to 500nM when stimulated by secretagogues (Draznin,
1988, Henquin, 2000). Elevations in intracellular calcium concentrations are central to
stimulating insulin exocytosis (Figure 6). The second messenger property of calcium lies in the
capability of beta cells to rapidly elevate cytosolic calcium levels when challenged with a
stimulus that either opens VOCCs in the plasma membrane or mobilises calcium from the
endoplasmic reticulum (ER) membrane. The influx of calcium down large electrochemical
gradients elevates cytosolic calcium by entering via L-type, P/Q-type, T-type and R-type
VOCCs in beta cells (Braun et al., 2008). The L-type VOCCs are considered to be the
predominant VOCC responsible for mediating glucose-induced insulin secretion with up to
90% decrease in insulin secretion observed following their pharmacological blockade in human
beta cells, and it has been suggested that they are important for first-phase insulin secretion
(Braun et al., 2008, Schulla et al., 2003). The R-type VOCCs play a more important role in
second-phase insulin secretion (Jing et al., 2005). Calcium plays an important role in second-
phase insulin secretion, which is responsible for sustaining insulin secretion by translocating
insulin-containing vesicles from the reserve pool to the readily releasable pool (RRP) and
maturation of insulin secretory granules (Henquin, 2000). It has also been shown that there are
calcium pools highly sensitive to calcium such as high calcium-sensitive pool (HCSP) and
immediately releasable pool (IRP), which are believed to be in close proximity and/or tethered
to L-type and R-type VOCCs or the insulin secretory machinery (Pedersen and Sherman, 2009,
Wiser et al., 1999).
Furthermore, the second messenger action of calcium can further stimulate calcium release
from the ER (calcium mobilisation). The ER is filled with calcium from the cytosol by
sarcoplasmic/ER calcium ATPase (SERCA), which is responsible for up to 64% of calcium
removal from the cytosol in mouse beta cells (Chen et al., 2003). The release of calcium from
the ER into the cytosol in beta cells can be achieved by two mechanisms. Firstly, calcium can be
mobilised by IP3 generation in response to receptors coupled to PLC, which activates IP3
receptor-gated calcium channels present in the ER membrane (Biden et al., 1984, Prentki et al.,
1984). Secondly, calcium can also be mobilised from the ER via ryanodine (RyR)-sensitive
calcium stores, which are located in the ER membrane and are gated by calcium itself (Zucchi
and Ronca-Testoni, 1997). This allows increases in cytosolic calcium to further mobilise calcium
from the ER, a process known as calcium-induced calcium release (CICR) (Graves and Hinkle,

Chapter 1: Introduction
40
2003). The functional importance of calcium mobilisation was made evident when inhibiting the
SERCA pump with thapsigargin, which showed an inhibition of cytosolic calcium in response
to depolarising concentrations of potassium chloride (KCl) in islet cells of ob/ob mice, implying
CICR from the ER is essential to elevating cytosolic calcium concentrations upon activation of
L-type VOCCs (Lemmens et al., 2001).
The role of calcium/calmodulin-dependent protein kinases (CAMKs) in the regulation
of insulin secretion from beta cells.
Changes in intracellular calcium concentrations are central to nutrient and non-nutrient
regulation of insulin secretion. Beta cells express calcium-sensitive proteins that sense and
respond to changing calcium concentrations within the cytosol. A family of calcium-sensitive
kinases, known as calcium/calmodulin-dependent proteins kinase (CaMK), are activated by
calcium and the calcium-binding protein calmodulin (CaM) and are involved in transducing
calcium mobilising signals into a secretory response (Figure 6). In particular CAMK II and
CAMK IV have been identified as being expressed by islet beta cells (Jones and Persaud,
1998b). Glucose and depolarising concentrations of K+ cause rapid increases in CAMK II
activity due to calcium entry through VOCCs (Wenham et al., 1994, Babb et al., 1996, Dadi et
al., 2014). Furthermore, KN-62, which is a CAMK II inhibitor that competitively binds to the
calmodulin binding site, blocks nutrient-induced insulin secretion (Li et al., 1992, Wenham et al.,
1992, Wenham et al., 1994, Niki et al., 1993). CAMK II also mediates its downstream effect on
insulin exocytosis by phosphorylating serine/threonine residues of synapsin-1 and microtubule-
associated protein-2 (MAP-2), which are involved in the trafficking of insulin containing vesicles
(Easom, 1999).
Chapter 1: Introduction
41
The role of calcium/phospholipid-dependent kinases in the regulation of insulin
secretion.
As illustrated by Figure 6, glucose also stimulates calcium-dependent phospholipase C (PLC)
under physiological conditions, which generates two second messengers as a result of
phosphatidylinositol 4,5-bisphosphate (PIP2) hydrolysis: inositol,3,4,5-triphosphate (IP3) and
diacylglycerol (DAG). DAG is an endogenous activator of calcium/phospholipid-dependent
kinases known as protein kinase C (PKC) (Biden et al., 1987). The PKC family is classified into
three groups: 1) Calcium-dependent and DAG-sensitive (conventional) PKC isoforms: α, β, γ:
2) Calcium-independent and DAG-sensitive (novel) PKC isoforms: δ, ε, η, θ, and 3) Calcium
and DAG-insensitive (atypical) PKC isoforms: ζ, λ, ι, μ (Jones and Persaud, 1998b). Islets
express and insulin secreting beta cell lines express PKC α, β, δ, ε, ι and ζ (Lord and Ashcroft,
1984, Tanigawa et al., 1982, Knutson and Hoenig, 1994, Tian et al., 1996, Tang and Sharp, 1998,
Kaneto et al., 2002, Carpenter et al., 2004). Stimulation of DAG-sensitive PKC isoforms results
in translocation of PKC from a predominantly cytosolic form to a membrane-bound form
(Persaud et al., 1989). A variety of beta cell receptor-operated secretagogues such as CCh and
CCK, activate PLC via Gαq interaction leading to generation of DAG (Biden et al., 1987,
Zawalich and Zawalich, 1996). Nutrient secretagogues can also increase DAG content in beta
cells via direct stimulation of DAG synthesis and calcium-dependent activation of PLC (Peter-
Riesch et al., 1988, Wolf et al., 1990). DAG-sensitive PKC isoforms are also activated by AA,
which can be converted to DAG by the activation of DAG lipase (Band et al., 1992, Landt et
al., 1992). Nutrient and non-nutrient secretagogues also stimulate PLA2 by generating AA from
phosphatidylcholine hydrolysis (Konrad et al., 1993, Konrad et al., 1992), however it has been
reported that PLA2 is not required for initiating insulin secretion but is important for
maintaining normal insulin stores in beta cells (Jones et al., 2004). Activation of conventional
PKC isoforms modestly stimulates glucose-induced insulin secretion, with targeted inhibition of
conventional PKC isoforms showing only minor alterations in glucose-induced insulin secretion
(Carpenter et al., 2004, Harris et al., 1996). However, deletion of novel PKCδ isoform and
atypical PKC ι/λ isoforms have been shown to inhibit glucose-induced insulin secretion
(Hashimoto et al., 2005, Uchida et al., 2007). PKC modulates the insulin secretory process by
phosphorylating proteins such as SUR1 subunit of KATP channels (Inagaki et al., 1995a,
Wollheim et al., 1988), VOCCs (Wang et al., 1993, Wollheim et al., 1988) and cytosolic PLA2
(Dunlop and Clark, 1995). Furthermore, PKCε associates with insulin secretory granules and it
is reported to be essential for stimulating insulin secretion (Mendez et al., 2003, Yu et al., 2000,
Brocklehurst and Hutton, 1984).

Chapter 1: Introduction
42
Figure 6: Schematic diagram demonstrating signalling pathways involved in glucose-induced
insulin secretion. Glucose enters beta cells via GLUT2 and is metabolised inside the mitochondria to
increase the ATP:ADP ratio, which closes ATP-sensitive K+ channels. This results in membrane
depolarisation and stimulates opening of L-type voltage-dependent calcium channels (VOCCs). The
calcium influx causes primed vesicles containing insulin to fuse with the plasma membrane and secrete
insulin. Glucose-induced elevation in [Ca2+]i and ligand-induced activation of Gq-dependent G protein-
coupled receptors (GPCRs) activate phospholipase C (PLC), which catalyses the breakdown of
phosphatidylinositol 4,5-bisphosphate (PIP2) into inositol 1,4,5-trisphosphate (IP3) and diacylglycerol
(DAG). IP3 mobilises Ca2+ from the ER by binding to IP3 receptors (IP3R). DAG activates DAG-
sensitive calcium (Ca2+)-dependent protein kinase C (PKC) isoforms, which phosphorylate and activate a
set of substrates, such as the SUR1 subunit of KATP channels and VOCCs. Both IP3 and DAG elevate
[Ca2+]i and thus promote insulin granule exocytosis and stimulate insulin secretion.
Chapter 1: Introduction
43
The role of PKA in the regulation of insulin secretion.
The second messenger cyclic adenosine monophosphate (cAMP) mediates diverse cellular
processes such as exocytosis, cell proliferation and gene transcription by activating cAMP-
dependent protein kinase A (PKA) (Skalhegg and Tasken, 2000, Daniel et al., 1998). cAMP is
generated from ATP hydrolysis following activation of adenylate cyclases (ACs). Activation of
PKA occurs when cAMP binds to two regulatory subunits of the tetrameric PKA holoenzyme,
which results in the release of the catalytic subunits. Three catalytic subunit Cα, Cβ and Cγ
isoforms and four regulatory subunit RIα, RIβ, RIIα and RIIβ isoforms have been identified
(Gamm et al., 1996). The PKA isoforms that are expressed by islet beta cells have not been
investigated in detail although it has been shown that RI and RII PKA subunit isoforms are
expressed by rat islets (Sugden et al., 1979). Eight AC isoforms (type I-VIII) have been
identified in islets and beta cell lines (Delmeire et al., 2003, Guenifi et al., 2000). Furthermore,
cAMP levels can also be regulated by cAMP degradation by phosphodiesterases (PDEs), which
hydrolyse the phosphodiester bond of cyclic nucleotides. There are approximately 50 PDEs and
some such as PDE1C, PDE3B, PDE4A, PDE4D and PDE10A have been identified in islets
and beta cell lines. They are physiologically important for glucose-induced insulin secretion,
supported by the observation of enhanced cAMP-induced potentiation of insulin secretion
following inhibition of PDE1C (Han et al., 1999, Härndahl et al., 2002, Pyne and Furman,
2003). Stimuli that signal through the Gαs/AC pathway, such as glucagon and GLP-1, can
potentiate glucose-mediated insulin secretion by elevating cAMP levels, but elevation in cAMP
in the absence of calcium is not sufficient to stimulate insulin secretion (Szaszák et al., 2008).
Elevations in cAMP levels potentiate glucose-induced insulin secretion via PKA-dependent and
PKA-independent mechanisms (Figure 7). Activation of PKA results in the phosphorylation of
substrate serine/threonine residues, such as the L-type VOCCs and IP3-receptor gated calcium
channels that elevate intracellular calcium, thus potentiating insulin secretion (Bünemann et al.,
1999, Ding and Gromada, 1997, Skelin and Rupnik, 2011). PKA decreases KATP channel activity
by phosphorylating the pore-forming Kir6.2 subunit and regulatory SUR1 subunit of the KATP
channel resulting in KATP channel closure (Gromada et al., 1997b, Ribalet et al., 1989, Béguin et
al., 1999).
As illustrated in Figure 7, an alternative signalling mechanism of cAMP that is independent of
PKA activation has been identified in beta cells, and it has been shown to be mediated by
cAMP-regulated guanine nucleotide exchange factors are directly activated by cAMP (Epacs)
(Holz, 2004, Holz et al., 2006). Epac variants Epac1 and Epac2 couple cAMP production via
Rap1 activation, which is a small GTPase of the ras family (Holz, 2004, de Rooij et al., 1998,
Bos, 2006). Epac2 knock-out studies in mouse have shown a marked reduction in first-phase

Chapter 1: Introduction
44
insulin secretion showing the essential role of Epac2-mediated activation of Rap1 in cAMP-
dependent potentiation of glucose-induced insulin secretion from beta cells, in which
Epac2/Rap1 signalling has also been implicated in the regulation of granule density at the
plasma membrane (Shibasaki et al., 2007). Epac2 also interacts with Rim2 and Rab3 (Ozaki et
al., 2000, Kashima et al., 2001), which are proteins involved in the docking of vesicles to the
plasma membrane. Furthermore, Epac2 controls ryanodine-sensitive calcium channels activated
in calcium-induced calcium release from the endoplasmic reticulum of beta cells (Kang et al.,
2001, Holz et al., 1999).
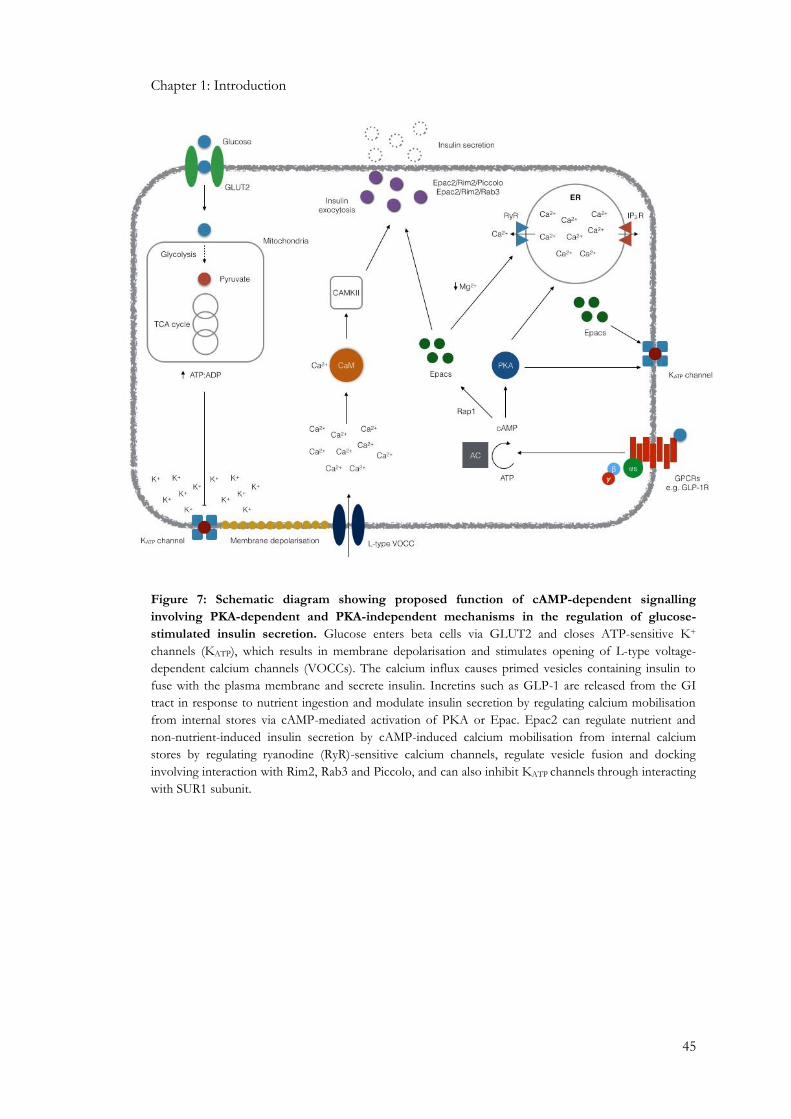
Chapter 1: Introduction
45
Figure 7: Schematic diagram showing proposed function of cAMP-dependent signalling
involving PKA-dependent and PKA-independent mechanisms in the regulation of glucose-
stimulated insulin secretion. Glucose enters beta cells via GLUT2 and closes ATP-sensitive K+
channels (KATP), which results in membrane depolarisation and stimulates opening of L-type voltage-
dependent calcium channels (VOCCs). The calcium influx causes primed vesicles containing insulin to
fuse with the plasma membrane and secrete insulin. Incretins such as GLP-1 are released from the GI
tract in response to nutrient ingestion and modulate insulin secretion by regulating calcium mobilisation
from internal stores via cAMP-mediated activation of PKA or Epac. Epac2 can regulate nutrient and
non-nutrient-induced insulin secretion by cAMP-induced calcium mobilisation from internal calcium
stores by regulating ryanodine (RyR)-sensitive calcium channels, regulate vesicle fusion and docking
involving interaction with Rim2, Rab3 and Piccolo, and can also inhibit KATP channels through interacting
with SUR1 subunit.

Chapter 1: Introduction
46
1.3: Regulation of beta cell mass
1.3.1: Beta cell mass in DM
Beta cell mass is maintained by a balance between cell proliferation and/or neogenesis and
apoptosis and/or necrosis and thus dysregulation of any of these processes can alter beta cell
mass (Lupi and Del Prato, 2008, Stefan et al., 1982). The decline in beta cell secretory function
in T2DM is paralleled by a progressive decline in beta cell mass and it has been shown that
obese patients with impaired fasting glucose and T2DM have a 50% and 63% reduction in beta
cell mass, respectively, compared to non-diabetic controls, whereas lean diabetic patients show a
41% deficit in beta cell mass (Butler et al., 2003a). Although beta cell proliferation is important
in maintaining beta cell mass (Hussain et al., 2006) it is widely accepted that apoptosis is the
predominant mediator of beta cell mass regulation as obese and lean T2DM patients show
elevated levels of beta cell apoptosis (Butler et al., 2003a, Marchetti et al., 2004).
1.3.2: Beta cell apoptosis and apoptotic signalling pathways
Apoptosis is a series of cellular events present in all cell types and results in self-destruction of
the cell. It is a rapid process, which is 20 times faster than the rate of mitosis (Lawen, 2003). It is
associated with distinct changes to the nucleus, cytoplasm and plasma membrane. Early
morphological features of an apoptotic cell involve cells losing their contact with neighbouring
cells, cell shrinkage, ER dilation in the cytoplasm, plasma membrane cell junctions are
disintegrated and the membrane itself starts to become convoluted and show signs of blebbing
(Lawen, 2003). Furthermore, chromatin condenses and aggregates into dense compact masses
and exhibits nuclear fragmentation by the action of endonucleases within the nucleus. The
nucleus itself starts to become convoluted and buds off into several fragments that are
incorporated inside encapsulated apoptotic bodies, which are formed due to cell disruption
(Lawen, 2003). These apoptotic bodies stimulate the recruitment of phagocytic cells such as
macrophages resulting in their engulfment but without triggering an inflammatory response
(Lawen, 2003). The trigger for apoptosis-induced events inside the cell requires the activation of
a family of proteases known as caspases.
Caspases are cysteine proteases that exhibit primary specificity for aspartic acid residues of
protein substrates, and they are expressed as single chain pro-enzymes, known as pro-caspases
(zymogens). Pro-caspases are converted to their active caspase form via autoproteolysis of
aspartic acid residues or proteolysis by other caspases. The caspase family can be subdivided
into two groups: those that are activated during apoptosis (caspase 2, 3, 6, 7, 8, 9 and 10) and
those that are activated during inflammation (caspase 1, 4, 5 and 11). The caspases activated
during apoptosis can be further subdivided into caspases responsible for initiating activation-
cascades (caspase 2, 8, 9 and 10), which contain long pro-domains containing protein-protein

Chapter 1: Introduction
47
interaction motifs such as caspase recruitment domains (CARDs) exhibited by caspase 2 and 9
or death effector domains (DED) exhibited by caspase 8 and 10. The other group contains the
executioner or effector caspases (caspase 3, 6 and 7), which contain short or absent pro-
domains and are responsible for the actual dismantling and/or destruction of the cell (Lawen,
2003, Creagh et al., 2003). One of the final targets of caspases is the inhibitor of caspase-
activated DNase (ICAD). These are inactivated by caspases resulting in the release of their
DNAase subunits (CAD), which enter the nucleus and fragment the DNA, a hallmark of cell
apoptosis (Creagh et al., 2003). It has been reported that a loss in beta cell number is due to
increased activation of caspase 3 and caspase 8 (Marchetti et al., 2004, Liadis et al., 2005,
Yamada et al., 1999), although other caspases are likely to be involved.
Apoptosis can be triggered by various stimuli, which induce caspase activation by four major
pathways: 1) mitochondrial/apoptosome pathway (intrinsic), 2) death-receptor pathway
(extrinsic), 3) ER stress pathway and 4) granzyme B-mediated cell death. It is worth noting that
both intrinsic and extrinsic apoptotic signals converge at the levels of caspase activation (Lawen,
2003), as illustrated by Figure 8.
Mitochondrial/apoptosome pathway
This intrinsic apoptotic pathway can be triggered by various stimuli such as heat shock,
cytotoxicity and ionising radiation, which result in the permeabilisation of the outer
mitochondrial membrane. This causes the release of mitochondrial content into the cell cytosol
such as cytochrome c, which primes caspase-9 activating complex. Release of cytochrome c
results in its binding to apoptosis protease-activating factor-1 (Apaf-1), and together with pro-
caspase-9 and deoxyadenosine triphosphate (dATP) a caspase-activating wheel-like complex
referred to as an apoptosome is formed. The permeability of the mitochondrial membrane and
regulation of cytochrome c release depends on the Bcl-2 family, which contains anti- (Bcl-2 and
Bcl-XL) and pro-apoptotic members (Bax, Bad, Bim, Bak and Bid). Apoptosome activation of
caspase-9 propagates the death signal by activating downstream effector caspase 3 and caspase
7. Caspase 3 goes on to activate caspase 2 and caspase 6, of which caspase 6 further activates
caspase 8 and caspase 10 (Creagh et al., 2003). It has been reported that chronic high glucose
levels induce cytochrome c release by increasing Bax binding to the mitochondrial membrane
(Kim et al., 2005).
Death receptor pathway
Death receptors, which are part of the tumour necrosis factor (TNF) receptor superfamily, are
cell surface receptors that transduce the death signal induced by extracellular ligands such as
TNF, Fas ligand and TNF-related apoptosis-inducing ligand (TRAIL). Upon death receptor

Chapter 1: Introduction
48
activation an intracellular death receptor-inducing signalling complex (DISC) is formed by the
recruitment of adaptor molecules such as FADD (Fas-associated death domain protein).
Caspase 8 is recruited by DISC due to caspase 8 and FADD interaction via the death effector
domain (DED) present in both proteins. DISC/caspase-8 activation propagates the death signal
by two mechanisms which are dependent on cell type (Scaffidi et al., 1998). In type I cells, the
death signal is propagated after death receptor activation robustly activates caspase 8 resulting in
downstream activation of effector caspases (Scaffidi et al., 1998). In type II cells, caspase 8 is
not sufficiently activated within the DISC to allow direct activation of effector caspases but
instead it propagates the death signal by proteolysis of Bid, a pro-apoptotic member of the Bcl-
2 family, which translocates to the mitochondria where it promotes Bax/Bak-dependent release
of cytochrome c, resulting in the apoptosome formation (Scaffidi et al., 1998). This
demonstrates the amplifying potential of an apoptotic signal by cross-talk between extrinsic and
intrinsic apoptotic pathways (Creagh et al., 2003). Furthermore, evidence of this pathway has
been identified in islet beta cells, which show that Fas ligand interaction with its receptor
triggers beta cell apoptosis by activating caspase-3 (Yamada et al., 1999, Zhang et al., 2008).
Granzyme B-mediated cell death
Another major apoptotic pathway that triggers apoptosis in target cells involves the release of
cytotoxic granules. These granules contain perforin, which is a pore-forming protein that
facilitates the entry of granule components into target cells. Furthermore, another granule
component is granzyme B, which is a serine protease for aspartic acid-containing caspase 3 and
caspase 8 (Froelich et al., 1998, Van De Craen et al., 1997). Granzyme B can promote the
release of cytochrome c and induce apoptosome assembly (Creagh et al., 2003, Barry et al.,
2000, Heibein et al., 2000, Sutton et al., 2000, Pinkoski et al., 2001). This pathway has been
implicated in pancreatic beta cells in which granzyme B has been shown to cleave Bid and
promote cytochrome C release from the mitochondria to initiate caspase activation and thus
apoptosis (Estella et al., 2006).
ER stress-mediated caspase activation
The ER is an important organelle for the post-translational modifications, folding and assembly
of newly synthesised proteins as well as serving as an internal calcium store. Therefore, defects
in its function result in ER stress followed closely by cell death. ER stress can be induced by
various events such as misfolding of proteins, calcium depletion, formation of disulphide bonds,
protein glycation and impairment of protein transportation from ER and the golgi apparatus.
The transcription of the growth arrest and DNA damage-inducible gene (GADD) such as
GADD153 is up-regulated in response to ER stress. This reduces anti-apoptotic Bcl2 protein

Chapter 1: Introduction
49
expression and stimulates Bax translocation into the mitochondria to promote cytochrome c
release. It has been shown that inducing ER stress in beta cells using nitric oxide results in
apoptosis via the GADD153-mediated pathway and contributes to the beta cell failure observed
in T2DM (Araki et al., 2003, Laybutt et al., 2007). In addition, a majority of the insulin
biosynthesis events occur in the ER lumen such as proinsulin protein folding and thus any
imbalance between the demand for insulin translation and the protein folding capacity of the
ER results in defective beta cell function and induces ER stress (Fonseca et al., 2007). This
results in the preference to activate ER stress-dependent caspase 12, which is only localised to
the ER and functions as an initiator caspase, which activates caspase 9 independent of Apaf-1
stimulation (Creagh et al., 2003, Araki et al., 2003).
Inhibitors of apoptosis (IAPs)
Another family of proteins termed inhibitors of apoptosis (IAPs) are important in regulating
beta cell apoptosis. They are anti-apoptotic proteins that are activated by nuclear factor κB (NF-
κB) and act as endogenous inhibitors of caspases (Wei et al., 2008). So far eight IAPs have been
identified in humans with XIAP being the best characterised and most potent IAP. It inhibits
caspase 3 activation, interferes with apoptosome formation by binding to pro-caspase 9 and
directly inhibits caspase 9. XIAP expression is up-regulated by pro-apoptotic members of the
Bcl2 family (Bax), which promotes cytochrome c release from the mitochondria (Wei et al.,
2008). IAPs also inhibit caspase 2 and caspase 9 in the ER-stress mediated pathway (Cheung et
al., 2006). It has been reported that over expression of XIAP enhances beta cell survival by
inhibiting apoptosis (Emamaullee et al., 2005, Plesner et al., 2010).

Chapter 1: Introduction
50
Figure 8: Schematic diagram showing the major apoptotic signalling pathways identified in beta
cells. The apoptotic signal in beta cells can be induced by: (1) death receptor activation forms the
intracellular death receptor-inducing signalling complex (DISC), which activates caspase 8 (Cas8). This
goes onto activate downstream effector Cas to propagate the death signal. (2) Bcl2 family of pro-
apoptotic proteins (Bid, Bad, Bak, and Bim) are countered by the effects of the Bcl2 anti-apoptotic
proteins (Bcl-2 and Bcl-xl), which permeabilise the mitochondrial membrane to release cytochrome c
(Cyto C), which forms an apoptosome by binding to the apoptosis protease-activating factor-1 (Apaf-1).
This activates Cas9, which activates Cas3 and Cas7 to execute cell apoptosis. This pathway is elicited in
response to chronic high glucose in beta cells (3) Granzyme B propagates the death signal by activating
Cas3 and Cas8 as well as activating Bcl2 pro-apoptotic proteins to promote apoptosome formation by
inducing the release of Cyto C from the mitochondria. (4) ER stress can up-regulate growth arrest and
DNA damage-inducible gene (GADD153), which activates the pro-apoptotic Bcl2 proteins and can also
activate the ER-specific Cas12, which activates Cas9. The transcription factor nuclear factor κB (NF-κB)
up-regulates inhibitors of apoptosis (IAPs), which regulate cell survival by inhibiting Cas2, 3, and 9 as well
as being up-regulated by pro-apoptotic Bcl2 proteins. There is also cross-talk between these apoptotic
signalling pathways.

Chapter 1: Introduction
51
1.3.3: Beta cell proliferation
Beta cell replication is another major event responsible for maintaining beta cell mass. Although
the molecular mechanisms remain unclear, mounting evidence suggests that stimulation of
PI3K is important for regulating beta cell mass (Fatrai et al., 2006, Hakonen et al., 2014, Li et
al., 2014). PI3K can activate Akt/PKB, a serine/threonine kinase and Akt overexpression in
mouse beta cells has been reported to increase beta cell proliferation, mass, neogenesis and cell
size (Tuttle et al., 2001, Bernal-Mizrachi et al., 2001).
PI3K/Akt cell survival pathway
PI3K exists as a heterodimer consisting of a catalytic (110kDa) and regulatory (85kDa) subunit,
and it is activated by receptor tyrosine kinases (Kim and Chung, 2002). Receptor tyrosine kinase
autophosphorylation following ligand binding recruits PI3K to the cytosolic side of the plasma
membrane, which phosphorylates phosphatidylinositol 4,5-bisphosphate (PIP2) to generate
phosphatidylinositol 3,4,5-trisphosphate (PIP3). PIP3 recruits Akt and PDK1 to the plasma
membrane resulting in Akt activation (Kim and Chung, 2002, Franke et al., 1997, Stokoe et al.,
1997). PI3K activity can be regulated by a variety of stimuli such as growth factors, GPCR
activation, cAMP and zinc (Murga et al., 1998, Kim et al., 2000, Kim et al., 2001, Wang et al.,
2001). CAMK can also directly phosphorylate Akt, independently of PI3K activation (Yano et
al., 1998). Akt regulates cell survival by regulating the activity of proteins associated with
apoptosis (Figure 9a).
Akt has been shown to block cytochrome c release from the mitochondria by inhibiting the
association of anti-apoptotic Bad with the pro-survival Bcl-XL, which would normally induce cell
death (Kharbanda et al., 1997, Kennedy et al., 1999) as well as up-regulating anti-apoptotic Bcl-2
family members (Pugazhenthi et al., 2000). Akt also phosphorylates pro-apoptotic Bcl-2 family
member Bad by Akt prevents its binding to Bcl-XL on the mitochondrial membrane and pro-
caspase 9, which is activated by cytochrome c and Apaf-1, and thus prevents the propagation of
the caspase 9-induced apoptotic cascade (Cardone et al., 1998). Akt can also directly
phosphorylate and inhibit caspases, and several caspases have been identified to contain Akt-
specific phosphorylation sites (Lawlor and Alessi, 2001). Akt can inhibit the action of caspase 9
and it has been reported that activation of caspase 9 cleaves procaspase 3 to form the bioactive
caspase 3, which further cleaves downstream proteins in order to execute cell death (Slee et al.,
1999). Forkhead transcription factors, which normally enter the nucleus and transcribe cell
death-related genes such as Fas, are also phosphorylated by Akt, which sequesters these pro-
apoptotic transcription factors to the cell cytosol (Brunet et al., 1999, Biggs et al., 1999). As
mentioned earlier, NF-κB, which are transcription factors that induce the expression of genes
involved in cell survival such as anti-apoptotic Bcl2 family members (Bfl-1), regulate IAP
Chapter 1: Introduction
52
expression such as c-IAP1 and c-IAP2 by activating endogenous IAPs, and has been shown to
regulate beta cell survival (Wang et al., 1998, Zong et al., 1999). NF-κB is usually sequestered to
the cell cytosol when bound to IκB. However, phosphorylation of IκB results in its dissociation
from NF-κB allowing NF-κB to enter the nucleus and promote expression of pro-survival
genes. Although the exact involvement of Akt activation of NF-κB remains unclear it has been
reported that Akt may phosphorylate IκB to indirectly activate NF-κB (Ozes et al., 1999, Kane
et al., 1999).
Akt also regulates cell-cycle progression (Figure 9b). The cell cycle consists of a quiescent phase
(G0), followed by cell entry into the G1 phase in which protein synthesis begins. Once the cells
reach the late G1 phase they reach restriction point (R); beyond this point the cells are
irreversibly committed to DNA replication (S phase), in which they progress to the cell dividing
phase (M phase) (Kim and Chung, 2002). Cell cycle progression is coordinated by interaction of
regulatory proteins which include cyclin, cyclin-dependent kinases (cdks) and cdk inhibitors
(Braun-Dullaeus et al., 1998). Akt can activate various targets such as the oncogene c-myc,
which promotes cell progression from the G0 phase to the G1 replication phase (Ahmed et al.,
1997). Akt also phosphorylates cyclin D1 and promotes cell cycle progression by allowing the
cell to exit the G0 phase and progress past the G1 phase. This is achieved by binding to cyclin
dependent kinases (cdks) to form cyclin/cdk complexes, which inactivate tumour suppressing
protein retinoblastoma (Rb) (Hatakeyama et al., 1994, Resnitzky and Reed, 1995). In addition,
Akt can also regulate and thus inhibit cdk inhibitors such as p21, p27 and the downstream
effector p57, which prevent the formation of cyclin/cdk complexes (Kim and Chung, 2002).
Furthermore, Akt can sequester cdk inhibitors to the cytosolic compartment and thus inhibits
their entry into the nucleus and prevent p21 from inhibiting cell proliferation (Zhou et al.,
2001).
Mitogen-activated protein kinases (MAPK)
Mitogen-activated protein kinases (MAPK) are serine/threonine protein kinases that can
mediate the effects of extracellular signals on a variety of biological processes such as apoptosis,
proliferation, motility, metabolism and gene expression (Cargnello and Roux, 2011). In
mammals, 14 MAPKs have been characterised to date, and classified into conventional and
atypical groups (Cargnello and Roux, 2011). The conventional group is split into three
subfamilies and is the most widely studied MAPK group, which consists of MAPKs p38,
p42/p44 or ERK1/2 and the stress-activated c-Jun amino (N)-terminal kinase (JNKs)
(Cargnello and Roux, 2011, Robinson and Dickenson, 2001). The p42/p44 MAPKs pathway is
associated with regulation of cell proliferation and differentiation, whereas the p38 and JNKs
are associated with environmental stress, apoptosis and inflammation (Ono and Han, 2000, Paul

Chapter 1: Introduction
53
et al., 1997). Many Gαq-coupled protein receptors are involved in the regulation of p42/p44,
p38 and JNK signalling pathways (Sugden and Clerk, 1997, van Biesen et al., 1996). p42/p44
MAPK nuclear translocation is predominant in relaying the mitogenic signal from the cytoplasm
into the nucleus (Chen et al., 1992, Lenormand et al., 1993) and is activated by a cascade of
small G protein Ras-Raf followed by MAP3K activation. Gαs and Gαq-protein coupled
receptors have been implicated in regulating Raf activity, and it has been reported that Raf
activity is attenuated in cardiac myocytes when treated with PTX or DAG-sensitive PKCs are
depleted (Bogoyevitch et al., 1995). Although the coupling of GPCRs to p42/p44 are yet to be
identified in beta cells it has been reported that ghrelin, which is a peptide hormone also
secreted by islets, has been shown to activate p42/p44 MAPKs by activating growth hormone
secretagogue receptor type 1a (GHS-R1a) in HEK293 cells, which is also expressed by rodent
and human islets (Granata and Ghigo, 2013), in a Gαq –dependent pathway involving calcium-
dependent PKC isoforms (PKCα/β) (Camina et al., 2007). It has been reported that p42/p44
MAPK activation promotes MIN6 beta cell proliferation upon activation (Burns et al., 2000). In
addition, p42/p44 promotes cell cycle progression from the G1 to the S-phase in fibroblasts
(Brondello et al., 1995) via cyclin D1 stimulation (Lavoie et al., 1996). Moreover, p42/p44
MAPK can also inhibit pro-apoptotic Bcl-2 family members Bad (Harada et al., 2001) and Bim
(Biswas and Greene, 2002).

Chapter 1: Introduction
54
a
b

Chapter 1: Introduction
55
Figure 9: Schematic diagram representing PI3K/Akt-mediated signalling pathways involved in
cell survival. (a) PI3K can be stimulated by various stimuli such as zinc, cAMP and CAMK, to
phosphorylate PIP2 to PIP3, which recruits Akt and the Akt activator PDK1 to the plasma membrane to
mediate downstream effectors. Akt and enhance cell survival by interfering with apoptotic signalling
pathways by inhibiting Caspase (Cas) 9 (Cas9) activation by the apoptosome and thus inhibits the
propagation of the death signal along downstream Cas cascades. It can also inhibit the prop-apoptotic
Bcl2 family members (Bid, Bad, Bak and Bax), which would normally promote apoptosome formation by
promoting the release of cytochrome C from the mitochondria. Akt can also sequester forkhead
transcription factors, which transcribe pro-apoptotic proteins such as Fas, to the cytosolic compartment
and prevent its entry in to the nucleus as well as promoting entry of the transcription factor nuclear factor
κB (NF-κB) by releasing it from IκB, and thus up-regulate inhibitors of apoptosis (IAPs), which regulate
cell survival by inhibiting Cas2, 3, and 9. (b) Akt can also promote cell proliferation by stimulating cell
cycle progression. It can activate cdk/cyclinD1 complex, which promote the cell to exit the G0 phase and
enter cell cycle G1 phase. Akt can also inhibit cdk inhibitors (p21, p27 and P57), which would normally
prevent cdk/cyclinD1 complex formation and thus cell cycle progression.

Chapter 1: Introduction
56
1.4: G-protein coupled receptor (GPCR) signalling
1.4.1: GPCRs as potential T2DM therapeutic targets
The use of hypoglycaemic agents mentioned in section 1.1.4, have limitations associated with
their use such as cost and side-effects such as hypoglycaemic episodes, weight gain and GI
discomfort, and there is some evidence that GLP-1 analogues induce pancreatitis (Ahren, 2009,
Rendell, 2004, Diamant and Heine, 2003, Hussein et al., 2004). Existing treatments do not kerb
T2DM progression, which has now reached approximately 360 million cases worldwide (IDF,
2013, Bailey, 2005). A major limitation with current T2DM treatment is deterioration of long-
term glycaemic control. In addition, patient constraints such as age, organ function, and timing
of drug administration may affect therapeutic effectiveness. This partially explains why
combination therapies are required to achieve an acceptable level of glycaemic control in
patients. Therefore, in order to kerb the rapid increase in the global incidence of T2DM, future
therapeutic approaches will require multiple levels of action by not only focusing to maintain
normoglycaemia but to also minimise side-effects especially weight gain. They must also be
cost-effective so that they are available to all socio-economic groups. New therapies that can
correct glycaemia over a long period of time with minimised side-effects are highly desirable and
actively sought by the pharmaceutical industry. Therapeutic strategies that counteract the
reduction in insulin secretion and beta cell mass are key to the development of effective T2DM
therapies (Ahren, 2009).
One such strategy has been the successful targeting of GPCRs, which are the largest family of
cell surface receptors and they represent the single largest set of membrane proteins in the
human genome. Their sole physiological function is to transmit extracellular stimuli into an
intracellular signal. There are over 800 GPCRs encoded by the human genome and a large
majority of these GPCRs are of unknown physiological function (orphan GPCRs), which makes
them a promising group of targets for the pharmaceutical industry. GPCRs share a common
structural identity of seven hydrophobic alpha helical transmembrane domains with an
extracellular N-terminal and an intracellular C-terminal. Their respective ligands range from
photons, ions, small organic molecules to peptides and proteins, and they therefore regulate
many physiological functions such as vision, taste, smell, cardiovascular function, energy
homeostasis, hormone regulation, learning and memory. Approximately 40-50% of drugs within
the pharmaceutical industry target GPCRs and thus have become the most common drug
target. For example, GLP-1 mimetics have become a successful therapy for T2DM by acting at
GLP-1 receptors to stimulate insulin secretion, inhibit glucagon secretion, and regulate beta cell
mass. (Dunning et al., 2005, Heller and Aponte, 1995, Stoffers et al., 2000, Buteau et al., 1999).
Chapter 1: Introduction
57
However, exenatide has recently been implicated in the increased risk of acute pancreatitis, as
mentioned in section 1.1.4.
Human islets have been shown to express approximately 300 GPCRs and 28% of these are
classified as orphan receptors (Amisten et al., 2013). GPCR ligands can be classified into four
main categories according to their molecular structures: peptides/proteins, small organic
molecules (free fatty acids, nucleotides, amino acids), monatomic ions (H+, Zn2+, Ca2+) and
large biological macromolecules (Amisten et al., 2013). To date several GPCRs expressed by
islets have shown potential as future T2DM therapeutic targets. For example, GPR54 is
activated by the neuropeptide kisspeptin, is expressed by islets and activation of the
GPR54/kisspeptin system in beta cells potentiates glucose-induced insulin secretion by
stimulating signalling cascades involving PLC, calcium and p42/p44 MAPKs (Hauge-Evans et
al., 2006, Bowe et al., 2009). GPR40 is expressed by beta cells and long chain free-fatty acids
that bind to this receptor potentiate glucose-induced insulin secretion by signalling via a calcium
influx-dependent mechanism (Itoh and Hinuma, 2005, Itoh et al., 2003). GPR119, another
GPCR that is expressed by beta cells has been shown to potentiate glucose-induced insulin
secretion and it also stimulates GLP-1 secretion via an AC/cAMP-dependent pathway. It also
has potent anti-diabetic effects in ICR mice and db/db mice when activated by endogenous
ligands such as lysophosphatidylcholine (LPC), oleylethanol amide (OEA) as well as the novel
ligand AS1669058 (Oshima et al., 2013, Jones et al., 2009, Soga et al., 2005). Furthermore,
endocannabinoid CB1 and CB2 receptors are also expressed by human islet beta cells and their
activation by the endocannabinoid 2-arachidonoylglycerol (2-AG) and the CB1 selective agonist
(ACEA) and CB2 selective agonist (JWH015), have all been shown to stimulate insulin secretion
(Li et al., 2011).

Chapter 1: Introduction
58
1.4.2: GPCR-mediated stimulus secretion coupling in beta cells
Although there are many GPCRs they interact with only a small number of G-proteins to
transmit their extracellular stimuli into intracellular signalling cascades. There are three G-
protein subunits namely Gα, Gβ and Gγ, and in humans there are 21 Gα subunits (Downes and
Gautam, 1999), 6 Gβ subunits and 12 Gγ subunits, which usually co-exist together as
heterotrimers in an unstimulated state. There are four main classes of Gα subunits: Gαs, Gαi,
Gαq and Gα12/13, which bind to guanosine diphosphate (GDP) to form a complex with the Gβγ
subunits. Each Gα subunit contains a highly conserved GTPase domain, and upon GPCR
activation the conformational change to the receptor results in the Gα subunit releasing GDP in
exchange for GTP. This results in the dissociation of the Gα subunit from the newly formed
Gβγ complex, and both can affect various downstream signalling cascades that regulate islet
hormone secretion in islets, as outlined below.
Gαs subunits
Activation of islet GPCRs coupled to Gαs elevate cAMP through adenylyl cyclase (AC)
activation, which subsequently stimulates PKA and/or Epacs to further transmit the
intracellular signal required for insulin secretion. For example, GLP-1 and GIP stimulate insulin
secretion via a cAMP-dependent signalling cascade (Heller and Aponte, 1995, Szecówka et al.,
1982, Miura and Matsui, 2003). Glucagon also signals via the Gαs-subunit coupled glucagon
receptor (GluR), and its activation in the liver promotes glycogenolysis and gluconeogenesis
while inhibiting glycogen synthesis via a PKA-dependent mechanism (Jiang and Zhang, 2003).
The GluR is also expressed by beta cells and its activation stimulates insulin secretion (Kawai et
al., 1995) by elevating cAMP (Moens et al., 1998), while GluR knockout impairs beta cell
function (Sorensen et al., 2006). GPR119, which is activated by free fatty acids, is also coupled
to Gαs and stimulates insulin secretion in a cAMP-dependent manner (Moran et al., 2014,
Oshima et al., 2013).
Gαi subunits
The Gαi subunits act in an opposite manner to that of Gαs by inhibiting AC and thus decreasing
cAMP levels. Activation of islet GPCRs coupled to Gαi results in the inhibition of insulin
secretion. The neuropeptide Y receptor, which couples to the Gαi subunit, inhibits insulin
secretion in a calcium-independent manner by blocking AC activation (Morgan et al., 1998,
Schwetz et al., 2013). The α2A-adrenoreceptor subtype, which is activated by the
neurotransmitter noradrenaline, inhibits insulin secretion by lowering cAMP via inhibition of
AC in mouse islets (Peterhoff et al., 2003).

Chapter 1: Introduction
59
Gαq subunits
Islet GPCRs coupled to the Gαq subunit stimulate insulin exocytosis by elevating intracellular
calcium levels and/or activation of PKC via PLC activation, which enzymatically promotes IP3
and DAG formation from the hydrolysis of PIP2. The M3 muscarinic receptor is coupled to the
Gαq subunit and is expressed by beta cells. Ach-induced M3 receptor activation stimulates
insulin secretion by IP3-mediated calcium mobilisation from the ER as well as DAG-mediated
activation of PKC (Gautam et al., 2006, Gilon and Henquin, 2001, Persaud et al., 1989). The
kisspeptin receptor GPR54, also potentiates glucose-induced insulin secretion via PLC
activation and elevations in intracellular calcium (Bowe et al., 2009).
Gα12/13 subunits
Activation of GPCRs coupled to Gα12/13 subunit results in activation of the Rho small GTPase
family such as Rac, Rho and Cdc42, which are involved in the dynamic remodelling and
organisation of the actin cytoskeleton of cells. Both Rac and Cdc42 have been shown to
stimulate insulin secretion from beta cells (Kowluru et al., 1997b, Li et al., 2004, Nevins and
Thurmond, 2005), whilst Rho inhibits insulin secretion via its downstream effector ROCK
(Rho-associated kinase) (Hammar et al., 2009).
Gβγ subunits
The focus of this section up to now has been entirely on the ability of Gα subunits to regulate
insulin secretion via multiple signalling cascades. However, mounting evidence suggests that the
Gβγ subunit complex, which dissociates from the Gα subunit upon GPCR activation, can also
regulate insulin secretion. The Gγ subunit is modified in the presence of glucose and calcium in
beta cells implying an important role in beta cell function (Kowluru et al., 1997a). Furthermore,
the Gβγ subunit complex has been shown to elevate cAMP in human fibroblasts (Ahmed and
Heppel, 1997) and thus it is plausible that it may play an important role in regulating cAMP
levels and insulin exocytosis via PKA-dependent mechanisms. The Gβγ complex can also
activate L-type VOCCs in rat vascular myocytes by activating PLC and PI3K (Viard et al.,
2001), which as mentioned earlier, have been implicated in improving beta cell function and cell
survival.

Chapter 1: Introduction
60
1.4.3: GPCR-mediated regulation of beta cell mass
In T2DM, pathways regulating and maintaining beta cell mass (proliferation, neogenesis,
apoptosis, necrosis) are perturbed. GPCRs expressed by islets can regulate signalling pathways
that are important in controlling beta cell mass as mentioned below. This makes GPCRs
attractive therapeutic drug targets for the treatment of T2DM. For example, GLP-1 activation
of GLP-1R, stimulates beta cell proliferation in vitro (Buteau et al., 1999, Buteau et al., 2001),
while acute and chronic administration of GLP-1 in vivo increased beta cell mass by up to 2-fold
in normal and diabetic mice, which is further supported by the ability of GLP-1R agonists to
augment beta cell mass in glucose-intolerant rats (Stoffers et al., 2000, Rolin et al., 2002, Perfetti
et al., 2000). The mechanism(s) by which GLP-1 regulates beta cell mass involves three
potential pathways that: 1) enhance beta cell proliferation, 2) inhibit apoptosis and 3) stimulate
neogenesis. The proliferative effect of GLP-1 and GIP on beta cells has been associated with
the activation of PI3K, MAPK and PKCζ (Buteau et al., 1999, Buteau et al., 2001, Trumper et
al., 2002, Hui et al., 2003). GLP-1 also inhibits beta cell apoptosis in a PI3K/cAMP/PKA-
dependent manner by inhibiting DNA fragmentation, and it enhances cell survival by up-
regulating the expression of anti-apoptotic proteins Bcl-2 and Bcl-XL (Hui et al., 2003). GLP-1
also up-regulates the expression of beta cell transcription factor PDX-1 (pancreatic-duodenum
homeobox-1), which is important for pancreatic development, and it has been implicated in
stimulating beta-cell neogenesis (Stoffers et al., 2000).
GPR119 is another potential T2DM therapeutic target as it is highly expressed by islet beta cells
(Soga et al., 2005) and intestinal L-cells (Chu et al., 2008). Phospholipids such as LPC and OEA
are endogenous ligands for GPR119, and they elevate cAMP levels to promote insulin secretion
in response to receptor activation (Overton et al., 2006, Soga et al., 2005). GPR119 agonists
have been shown to stimulate GLP-1 secretion from the L-cells and its activation stimulates
beta cell proliferation in vitro and in vivo (Gao et al., 2011).

Chapter 1: Introduction
61
1.4.4: Why target GPR75?
A novel human chemokine GPCR identified as GPR75 was shown to be expressed at the
mRNA level by various tissues of mouse such as brain, skeletal muscle and liver (Ignatov et al.,
2006), as illustrated by Figure 10. Many are tissues implicated in the regulation of glucose
homeostasis, as mentioned in section 1.2.2. GPR75 mRNAs were also shown to be expressed
by human islets (Amisten et al., 2013). The corresponding GPR75 gene locates to human
chromosome 2p16, and encodes for a 540 amino acid protein that shares 87% amino acid
sequence homology with mouse GPR75 located on chromosome 11A4 (Tarttelin et al., 1999,
Ignatov et al., 2006).
GPR75 serves as a receptor for a large family of cytokines known as chemokines that play
regulatory roles in the inflammatory process by recruiting lymphocytes to sites of inflammation
(Schall et al., 1990, Conti et al., 1997). GPR75 is activated by chemokine ligand 5 (CCL5), also
known as Regulated Upon Activation T-Cell Expressed And Secreted (RANTES), which is a 68
amino acid protein that belongs to the CC-chemokine subfamily (Schall et al., 1988, Cartier et
al., 2005). CCL5 is synthesised and secreted by a variety of non T-cells such as endothelial cells,
platelets, and neurons (Johnstone et al., 1999) and it activates conventional Gαi-protein coupled
chemokine receptors (CCRs) 1, 3 and 5 in addition to GPR75. GPR75 exhibits atypical
characteristics compared to conventional CCRs. Thus, it is almost 200 amino acids longer,
shares only 12-16% amino acid sequence homology with CCRs, and it has a considerably longer
C-terminal tail and a longer third intracellular loop (Pease, 2006), as illustrated by Figure 11.
Furthermore, GPR75 has been established as a Gαq coupled receptor, and its activation leads to
IP3 formation and elevations in cytosolic calcium (Myers et al., 1995, Ignatov et al., 2006), which
are second messengers involved in the stimulus-secretion coupling of insulin (Section 1.1.6). As
mentioned earlier (Section 1.3.3), activation of Akt and MAPK promote cell survival and
proliferation, and GPR75 activation by CCL5 has been shown to enhance viability of mouse
hippocampus cells, which is a primary target for patients with Alzheimer’s disease (Ignatov et
al., 2006). Proliferative and protective effects have been identified in cells that overexpress
GPR75, and this is mediated through the activation of a PLC/PI3K/Akt/MAPK cell survival
pathway. Consistent with this GPR75-mediated cell protection via this pathway is lost when
cells are treated with a PLC inhibitor (U73122) and a PI3K inhibitor (wortmannin) (Ignatov et
al., 2006).
CCL5 has been implicated in promoting autoimmune destruction of beta cells in T1DM by
recruiting lymphocytes and stimulating secretion of other inflammatory cytokines. These effects
of CCL5 are mediated by the activation of conventional CCL5 receptors (Carvalho-Pinto et al.,
2004). In addition, chronic low-grade inflammation normally precedes the development of

Chapter 1: Introduction
62
T2DM and circulating concentrations of CCL5 are significantly elevated it T2DM (Herder et al.,
2005), which have been associated with an increase in T2DM incidence (Nomura et al., 2000).
Therefore, earlier studies have focused on the pro-inflammatory role of CCL5 in the
pathogenesis of T2DM, which is predominantly mediated through the activation of
conventional CCL5 receptors (CCR1, CCR3 and CCR5).
The pharmaceutical potential of islet GPCRs, have been implicated in the regulation of islet
hormone secretion, which regulate blood glucose levels. The identification of a novel CCL5
receptor, GPR75, which has been implicated in signalling through the Gq/PLC, elevating
cytosolic calcium and activating a PLC/PI3K/Akt/MAPK cell survival pathway (Figure 12),
suggests a potential role for GPR75 for improving beta cell function and beta cell mass and thus
makes GPR75 a potential therapeutic target for T2DM.

Chapter 1: Introduction
63
Figure 10: GPR75 mRNA expression in various mouse tissues detected by PCR GPR75 specific primers
(upper panel). GAPDH specific primers were used as a positive control (lower panel). Image acquired
and adapted from (Ignatov et al., 2006).
Figure 11: Schematic representation showing amino acid sequence of the seven transmembrane domains
of GPR75 protein. Image acquired from (Sauer, 2001).
GPR75
GAPDH

Chapter 1: Introduction
64
Figure 12: Schematic diagram showing the
proposed CCL5 signalling pathway mediated by
GPR75 and its possible role in regulating beta
cell secretory function and beta cell mass.

Chapter 1: Introduction
65
1.5. Aims
The primary objective of the experiments described in this thesis was to determine the
expression and function of GPR75 in islets of Langerhans. The focus on islet function centred
around the influence of GPR75 activation on regulation of beta cell secretory function and beta
cell mass. Furthermore, experiments detailed in this thesis were aimed at identifying the
intracellular signalling mechanisms mediated by CCL5 activation of GPR75. An outline of the
aims of this thesis is given below.
To determine the mRNA expression of CCL5 and CCL5 receptors (CCR1, CCR3,
CCR5 and GPR75) in islets of Langerhans and MIN6 beta cells.
To determine the protein expression and localisation of CCL5 and GPR75 in mouse
and human islets of Langerhans.
To identify the effect of exogenous CCL5 on islet hormone secretion and beta cell
mass.
To investigate the effect of GPR75 down-regulation on islet hormone secretion and
beta cell mass.

66
Chapter 2: Materials and Methods

Chapter 2: Materials and Methods
67
2.1: MIN6 beta-cells
There are many resource and technical limitations for the use of primary beta cells in research
such as the availability of pancreatic endocrine tissue, isolation of individual pancreatic cells, cell
purification from islets, which are a mixture of several cell types, and maintenance of
characteristics native to beta cells (Miyazaki et al., 1990, Skelin et al., 2010). Cell lines offer an
animal-free alternative to study cell physiology and pathophysiology. The advantages of the use
of cell lines range from investigating physiological and biochemical properties of a cell,
identifying the effects of chemical compounds or drugs, the ability to manipulate cells to
determine the role of various genes and their ability to reproduce consistent results (Skelin et al.,
2010). However, there are disadvantages associated with the use of cell lines. For example, cell
to cell interaction is disrupted, which influences cell function especially within islets, which are
3D micro-organs. Also changes in cell characteristics such as abnormalities in chromosomal
content, genetic mutations, abnormal protein expression and altered cell metabolism have all
been associated with the use of MIN6 beta cells (Skelin et al., 2010).
The MIN6 beta cell line was derived from a transgenic C57BL/6 mouse insulinoma, which
expresses an insulin promoter/SV40 T-antigen construct. It is one of a few beta cell lines that
display appropriate beta cell characteristics. For example, MIN6 beta cells express GLUT-2 and
glucokinase, which are both pivotal to glucose uptake and metabolism, they retain high levels of
insulin mRNA, all cells stain for insulin in immunohistochemical analyses and most importantly,
they secrete mature insulin in response to increasing glucose concentrations (Miyazaki et al.,
1990, Skelin et al., 2010, Cheng et al., 2012). MIN6 beta cells, which generally grow as
monolayers, also have the ability to aggregate into islet-like structures termed pseudo islets,
which have been shown to enhance glucose-stimulated insulin secretion (GSIS) compared to
MIN6 beta cells grown as monolayers (Hauge-Evans et al., 1999, Luther et al., 2006).
The use of MIN6 beta cells also has its limitations, especially those used at high passage (60-70)
at which MIN6 beta cells exhibit impaired GSIS, reduced glucose uptake and oxidation as well
as reduced expression of genes involved in glucose and lipid utilization (Cheng et al., 2012).
High passage MIN6 beta cells have decreased insulin content attributed to reduced insulin
granule formation and pro-insulin mRNA expression (Cheng et al., 2012). In addition, a
reduction in ATP generation following glucose stimulation of MIN6 beta cells has been related
to decreased glucose uptake. This has been attributed to reduced glut2 gene expression, and to
decreased glucose oxidation due to lower levels of genes encoding glucokinase and
phosphofructokinase, which are pivotal in providing substrates to the Krebs cycle and ATP
generation via oxidative phosphorylation (Cheng et al., 2012). It is important to note that MIN6
beta cells do retain normal beta cell function at lower passages generally between 30-40 (Cheng
et al., 2012). Therefore, MIN6 beta cells are a useful tool in beta cell research towards
Chapter 2: Materials and Methods
68
elucidation of beta cell function and the molecular mechanisms involved in regulating GSIS but
only if they are used over a range in which beta cell-like function is retained (Miyazaki et al.,
1990, Cheng et al., 2012).
2.1.1: Cryopreservation and thawing of MIN6 cells from frozen storage
Cell lines are susceptible to genetic mutations as generation number (passage number) increases.
They become more vulnerable to microbial contamination, and some cell lines have a finite
generation number, therefore, it is vital to maintain the supply of cells for experimental use.
This can be achieved by cryopreservation, which involves slow programmable freezing and long
term storage of cells at -196°C in liquid nitrogen. Cells at this temperature are rendered
biologically and biochemically inactive but can be recovered again in the future simply by
thawing the cells when required. For experiments described in this thesis, MIN6 beta cells were
cryopreserved once they had reached 70-80% confluence and were trypsinised and re-
suspended in 10ml Dulbecco’s Modified Eagles Medium (DMEM), see Table 1. The cells were
then centrifuged and the supernatant aspirated before re-suspending them in freezing media
(Table 1). DMSO is a cryoprotective agent, which reduces the freezing point of the medium,
and allows for a slower cooling rate, thereby greatly reducing the risk of ice crystal formation,
which can cause cell damage and death. Cells were re-suspended by pipetting up and down and
aliquoted into cryovials at a density of 1x10⁶ cells/ml, which were placed into a Nalgene “Mr.
Frosty” cryogenic freezing container containing 100% isopropanol that allows for a cooling rate
of -1°C/minute, which is optimal for cell preservation. The cells were left overnight at -80°C
and the cryovials were placed in liquid nitrogen for long term storage.
Thawing of MIN6 beta cells involved removing the cryovials from liquid nitrogen storage and
they were immediately placed in a water bath at 37°C and gently shaken until thawed. Cells were
removed from the cryovials and placed in a sterile 15ml centrifuge tube followed by gentle
addition of 10ml chilled DMEM (Table 1). The cells were then centrifuged and the supernatant
discarded before re-suspending with fresh medium and then pipetted into a T25 tissue culture
flask and incubated overnight at 37°C. Once the cells had adhered to the flask surface the media
was replaced to remove any non-adherent cells, replenish nutrients, and remove any residual
DMSO.
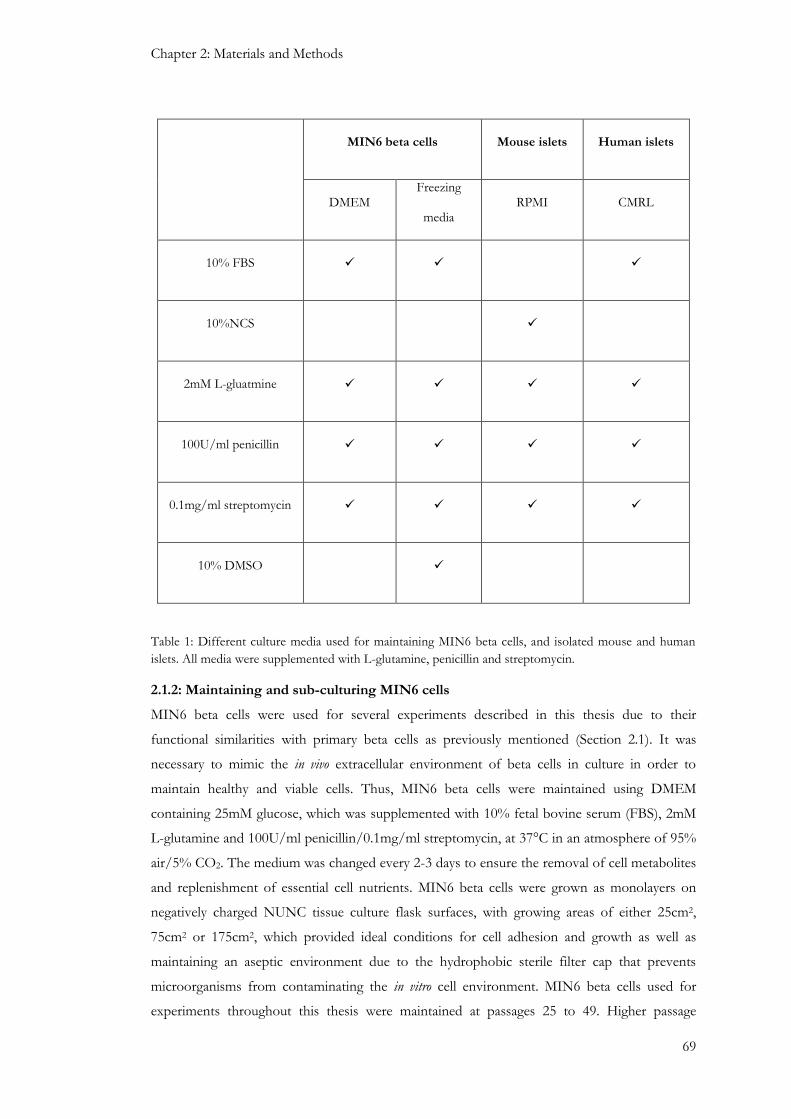
Chapter 2: Materials and Methods
69
MIN6 beta cells Mouse islets Human islets
DMEM Freezing
media RPMI CMRL
10% FBS
10%NCS
2mM L-gluatmine
100U/ml penicillin
0.1mg/ml streptomycin
10% DMSO
Table 1: Different culture media used for maintaining MIN6 beta cells, and isolated mouse and human
islets. All media were supplemented with L-glutamine, penicillin and streptomycin.
2.1.2: Maintaining and sub-culturing MIN6 cells
MIN6 beta cells were used for several experiments described in this thesis due to their
functional similarities with primary beta cells as previously mentioned (Section 2.1). It was
necessary to mimic the in vivo extracellular environment of beta cells in culture in order to
maintain healthy and viable cells. Thus, MIN6 beta cells were maintained using DMEM
containing 25mM glucose, which was supplemented with 10% fetal bovine serum (FBS), 2mM
L-glutamine and 100U/ml penicillin/0.1mg/ml streptomycin, at 37°C in an atmosphere of 95%
air/5% CO2. The medium was changed every 2-3 days to ensure the removal of cell metabolites
and replenishment of essential cell nutrients. MIN6 beta cells were grown as monolayers on
negatively charged NUNC tissue culture flask surfaces, with growing areas of either 25cm2,
75cm2 or 175cm2, which provided ideal conditions for cell adhesion and growth as well as
maintaining an aseptic environment due to the hydrophobic sterile filter cap that prevents
microorganisms from contaminating the in vitro cell environment. MIN6 beta cells used for
experiments throughout this thesis were maintained at passages 25 to 49. Higher passage

Chapter 2: Materials and Methods
70
numbers (50-70) were refrained from use due to reported alterations in beta cell functionality
(Cheng et al., 2012).
Continuous growth of MIN6 beta cells within a limited growth area such as that of a tissue
culture flask requires cells to be sub-cultured, so cells that had reached a confluence of 70-80%
were detached from the culture surface by trypsinisation using 0.1% trypsin/0.02% EDTA.
Briefly, medium was aspirated from the cells and briefly washed with phosphate buffered saline
(PBS) to remove residual media supplemented with serum, which inhibits the action of trypsin.
The PBS was aspirated and the cells were incubated for 3-4 minutes with 0.04ml/cm2 of
trypsin/EDTA at 37°C, which provided ample time for cell detachment. The cells were re-
suspended with 7ml DMEM (Table 1), which inhibited further action of trypsin. The cell
suspension was pipetted into a 15ml sterile centrifuge tube and centrifuged for 3 minutes at
1500rpm before discarding the supernatant and re-suspending the cells with fresh DMEM. The
cells were either sub-cultured into fresh tissue culture flasks for continued growth or counted
for experimental use (2.1.3: Cell counting).
.
Figure 13: Image of MIN6 β-cells maintained in culture as a monolayer (Passage 34). Cells were visualised
under a light microscope with a x10 objective.
2.1.3: Cell counting
A Neubauer haemocytometer was used to quantify the number of cells used for experiments.
Briefly, MIN6 beta cells were re-suspended in 1ml DMEM following trypsinisation and a 10µl
aliquot of cell suspension was added to 190µl DMEM (1:20 dilution), from which 10µl was
loaded onto a haemocytometer grid via capillary action. Cells were counted in four chambers of
equivalent volumes of 0.1mm3 each. The total cell number per ml was calculated using the
formula below:
Total cell number per ml = Mean cell number per 0.1mm3 x 104 x dilution factor

Chapter 2: Materials and Methods
71
2.2: Islet isolation
2.2.1: Mouse islet isolation
The three stages towards successful islet isolation and their functional use involve: (1)
collagenase digestion of surrounding exocrine tissue connected to islets; (2) purification of islets
from non-islet tissue; (3) maintenance of viable islets in culture.
Mouse islets used for functional experiments throughout this thesis were isolated from male
(25g) ICR mice aged 6-8 weeks (Figure 14). Briefly, mice were terminated by cervical dislocation
followed by surgical exposure of the abdominal cavity. The duodenum was exposed and
clamped at the ampulla of Vater (hepatopancreatic ampulla), which is formed by the unification
of the pancreatic duct and the common bile duct, upon joining the duodenum. Ice cold
collagenase (3mg/3ml/mouse) was injected via the common bile duct to perfuse the pancreas,
which was then carefully extracted from the abdominal cavity and placed in a 50ml centrifuge
tube and stored on ice. The collagenase-perfused pancreatic tissue was placed in a water bath at
37°C for 10 minutes to promote digestion, which was terminated by transferring the tissue onto
ice and re-suspending the digest with chilled Minimum Eagles Medium (MEM) supplemented
with 10% NCS, 2mM L-glutamine and 100U/ml penicillin/0.1mg/ml streptomycin. The tubes
containing the pancreatic tissue were shaken vigorously and centrifuged (1400rpm, 10°C, 1.5
minutes) before passing the suspension through a sieve to separate non-digested fat and
exocrine tissue from passing through. Islets were further purified by gradient centrifugation
using histopaque, a polysucrose solution adjusted to a density of 1.077g/ml. Islets were
collected at the interface between the histopaque and MEM, washed several times in MEM
before being hand-picked and washed with sterile RPMI, supplemented with 10% NCS, 2mM
L-glutamine and 100U/ml penicillin/0.1mg/ml streptomycin. Islets were maintained in culture
overnight at 37°C (95% air/ 5% CO2) before being used for experiments.
Figure 14: Image of mouse islets isolated from ICR mice. Mouse islets were isolated from collagenase
digested pancreta before being sterile washed several times with MEM and maintained in RPMI and
cultured at 37°C (95% air/ 5% CO2). x10 magnification.

Chapter 2: Materials and Methods
72
2.2.2: Human islet isolation
Human islets (Figure 15) were generously provided by Dr GC Huang at the King’s College
Hospital islet isolation unit. Pancreata were donated from healthy, non-diabetic, heart-beating
cadavers and islets were isolated by collagenase digestion of the pancreas under aseptic
conditions (Huang et al., 2004). Isolated islets were maintained in culture in Connaught Medical
Research Laboratories (CMRL) medium at 37C° (95% air/ 5% CO2) for up to 48 hours.
Consent for the use of human islets was acquired from the relatives of donors and the Ethical
Committee of King’s College Hospital.
Figure 15: Image of isolated human islets. Human islets were isolated from collagenase digested pancreata
of healthy heart beating cadavers before being sterile washed several times with MEM and maintained in
CMRL and cultured at 37°C (95% air/ 5% CO2). x10 magnification.

Chapter 2: Materials and Methods
73
2.3: Gene expression
2.3.1: Total RNA extraction
RNA isolation is critical for downstream applications such as reverse transcription and cDNA
amplification, which enable gene expression profiling. RNA was isolated from MIN6 beta cells,
mouse islets, human islets and mouse acinar cells using Qiagen RNeasy mini kits, which utilises
a high affinity special silica-based membrane and its high affinity allows for mRNAs to separate
from smaller RNAs such as transfer RNA, ribosomal RNA and micro RNA, which are shorter
than 200 nucleotides. Details of the kit components are provided in Table 2. Briefly, MIN6 beta
cells were trypsinised (Section 2.1.2) and counted (Section 2.1.3). The maximum number of cells
used for RNA isolation was 1x10⁷, which was to prevent overloading of the silica membrane
and to ensure optimal RNA yield. MIN6 beta cells, islets and exocrine tissue were briefly
washed with PBS, centrifuged (12,000 rpm, 2 minutes) and the supernatant was aspirated before
re-suspending the cells in 350-600l RLT lysis buffer (Table 2), which was supplemented with
beta-mercaptoethanol (0.01%v/v), and vortexed for 2-3 minutes. Islets and exocrine tissue were
homogenised using a QIAshredder spin column. The supernatant, which contained the RNA
was transferred to a fresh 1.5ml tubes and an equivalent volume of ethanol was added before
the lysed cell suspension was transferred to an RNeasy spin column and centrifuged at 12,000
rpm for 2 minutes. The flow through containing RNA was discarded and 350l RW1 buffer
(Table 2) was added to the spin column. The flow through was discarded after brief
centrifugation (12,000 rpm, 2 minutes) and the RNA bound to the column was treated with
DNase (10l DNase in 70l RDD buffer), see table 2, for 15 minutes before 350l RW1 buffer
was added and the flow through was discarded again after centrifugation. The spin column was
centrifuged to dry the column to remove any residual buffer and the RNA was eluted by adding
30l of RNase free water to the column before a final centrifugation process. The flow through,
which contained the RNA, was transferred to a fresh 1.5ml tube and being quantified and
reverse transcribed to cDNA before being stored at -80 C.

Chapter 2: Materials and Methods
74
RLT lysis
buffer
Cell lysis buffer containing guanidine thiocyanate, which promotes the binding of RNA
to the silica membrane. If the cell number is less than 5 x 10⁶ cells then 350μl of RLT
lysis buffer was added. However, if the cell number was between 5 x 10⁶- 1 x 10⁷ cells
then 600μl was added.
RW1 buffer
Contains a guanidine salt and ethanol, which is used as a wash buffer to remove
carbohydrates, fatty acids and proteins etc, that are non-specifically bound to the silica
membrane but at the same time leaving the bound RNA (longer than 200bp) intact.
DNase Provides on-column digestion of DNA during the RNA extraction process.
RDD buffer Buffer RDD ensures efficient digestion of DNA on the column and also ensures that
the RNA remains bound to the column.
Table 2: Reagents used during the RNA extraction process. Briefly, an appropriate volume of RLT lysis
buffer was added to MIN6 beta cells, mouse and human islets, and mouse acinar tissue extracts. Tissue
extracts were homogenised by passing through a QIAshredder spin column and the lysates were loaded
into a Qiagen RNeasy RNA extraction spin column. Through a series of wash and centrifugation steps
including DNase treatment the RNA was eluted from the spin column and RNA content was measured
using Nanodrop -1000 spectrophotometer.

Chapter 2: Materials and Methods
75
2.3.2: Measuring RNA concentration and integrity
A Nanodrop-1000 spectrophotometer was used to measure RNA concentration and integrity of
a 1.5µl sample retrieved from the spin column of the RNA extraction process (2.3.1: Total RNA
extraction). The sample was pipetted onto the end of a fibre optic cable (receiving fibre) and a
second fibre (source fibre) was brought into contact with the sample allowing the liquid RNA
sample to bridge between the two fibre optic ends before a pulse of xenon light was flashed
through the sample for analysis. The sample absorbance ratio of 260nm and 280nm was used to
assess the RNA purity. A ratio within the range of 1.8 to 2.2 was considered pure but a ratio
below this range would indicate protein or phenol contamination as they both absorb at 280nm.
Pure RNA samples were stored at -80°C and subsequently used for cDNA synthesis. RNA was
quantified in ng/µl.
2.3.3: cDNA synthesis
Complementary DNA (cDNA) synthesis involved the reverse transcription of RNA into cDNA
by the action of Moloney Murine Leukemia Virus Reverse Transcriptase (mmLV-RT). In short,
10µl of total RNA (50ng/µl) was primed for cDNA synthesis by mixing the RNA with 2µg/µl
Oligo (dT) and 2µg/µl random primer, which both bind to the polyA tail and random
complementary sequences on the mRNA, respectively, enabling efficient initiation of cDNA
synthesis (Table 3). The sample mixture was incubated at 72°C for 5 minutes and immediately
placed on ice for 1 minute. Master mix (Table 3) was added to the RNA sample mixture, which
was reverse transcribed using a Thermal Cycler (Table 4). Samples were stored at -20°C until
PCR amplification.

Chapter 2: Materials and Methods
76
Table 3: Prime mix and Master Mix composition used for reverse transcription. The prime mix containing
10µl RNA and 0.5µl of Oligo-(dT) and 0.5µl Random Primers were mixed with 9µl Master Mix to make
up a 20µl reaction mix.
Stage Temperature (°C) Time (Minutes)
Incubation and Synthesis 42 50
Heat inactivation 72 15
Cooling 4 5
Table 4: Thermal Cycler settings for reverse transcription
Reagent Volume per reaction
(µl)
Final
concentration
Prime Mix Oligo-(dT) 0.5 0.05μg/μl
Random Primer 0.5 0.05μg/μl
Master mix
5 x RT buffer (Promega mmLV-RT kit) 4µl -
DNase/RNase-free water 0.5µl -
DTT (400mM) 0.5µl 10mM
RNasin (40U/µl) 2µl 4U/µl
dNTP’s (10mM) 1µl 500µM
mmLV-RT (200U/µl) 1µl 10U/µl

Chapter 2: Materials and Methods
77
2.3.4: Polymerase Chain Reaction (PCR)
PCR is a molecular technique that enables a single sequence of DNA to be amplified to produce
thousands or even millions of identical copies of the original DNA sequence. The basic
principle relies on the ability of a heat stable polymerase to join together the nucleotides adenine
(A), thymine (T), guanine (G) and cytosine (C), which are the essential building blocks of DNA.
The polymerases require a constant supply of nucleotides in order to achieve this as well as
primers, which are oligonucleotides that bind to complementary bases on the source DNA and
help initiate polymerase action, which results in the formation of a new DNA strand (Joshi and
Deshpande, 2011). There are three main stages for a single PCR: Denaturation, Annealing and
Extension. The DNA was initially heated to 95°C to separate the strands, which was cooled to
45-60°C to allow the synthesised primers to hybridise to a specified complementary sequence
on each DNA strand. Each strand was then primed for extension and heated to 72°C in the
presence of a heat resistant polymerase along with a supply of nucleotides. This process is
repeated for 30-40 cycles to ensure sufficient amplification of target DNA, effectively doubling
the amount of DNA during each cycle (Joshi and Deshpande, 2011).
PCR experiments in this thesis used cDNAs (50ng/µl) obtained from various tissue sources
(Table 5). DNA primers were designed using Primer3web software (Untergasser et al., 2012,
Koressaar and Remm, 2007). All primers were designed between 18-20 base pairs and with a
guanine: cytosine content between 45-60%. Primers were cross checked with the organism’s
genome using nucleotide BLAST software (NCBI) to ensure that no conflicting transcripts
would amplify undesired or non-specific targets (Table 6).
PCR reactions were prepared in DNase/RNase-free 0.2ml heat sensitive tubes, which contained
PCR water (DNase/RNase-free), Promega Go-Taq® flexi DNA polymerase, Promega Go-
Taq® Green master mix, Promega PCR nucleotide mix, MgCl2, forward and reverse primers,
and either mRNAs of interest or PCR water, which served as a negative control (Table 7). The
amplified cDNA targets and DNA ladder were loaded onto an agarose gel and electrophoresed
for 40 minutes at 65V before being visualised under UV light to detect the presence of
amplicons of interest and the DNA ladder (Figure 16). Amplicons were extracted from the
agarose gel and DNA was isolated using the Qiagen Gel Extraction kit and sequenced by
Source Bioscience UK Limited (Section 2.3.6). The sequence homology of the DNA in query
was compared to the actual gene sequence using Nucleotide BLAST software (NCBI) .

Chapter 2: Materials and Methods
78
cDNA Source
Mouse hypothalamus In house
Mouse islet In house
Mouse exocrine In house
MIN6 beta cell line In house
Human heart Takara Clontech
Human islet King’s College Hospital islet isolation unit
Human exocrine King’s College Hospital islet isolation unit
Human PANC-1 cell line ATCC
Table 5: cDNAs used in PCR amplifications described in this thesis. All cDNAs were used at a
concentration of 50ng/µl. ATCC: American Type Culture Collection.

Chapter 2: Materials and Methods
79
Table 6: Details of primer nucleotide sequences, annealing temperatures and amplicon sizes of primers
required for cDNA amplification used throughout this thesis.
Gene name Primer sequence
Annealing
temperature
(°C)
Amplicon
size (bp)
Mouse Chemokine
Ligand 5 (CCL5)
F- CCCTCACCATCATCCTCACT
R- CCTTCGAGTGACAAACACGA 55 185
Human Chemokine
Ligand 5 (CCL5)
F- CGCTGTCATCCTCATTGCTA
R- GAGCACTTGCCACTGGTGTA 56 150
Mouse GPR75 F- AAGCAGCCTAATTGTACAGC
R- CACAGCAACACAGAAGGTAA 56 204
Human GPR75 F- CAGCTCGTATCAGCCATCAA
R- GCACCAGAGCACTTTCCTTC 56 261
Mouse Chemokine
receptor 1 (CCR1)
F- AGGGCCCGAACTGTTACTTT
R -TTCCACTGCTTCAGGCTCTT 59 161
Human Chemokine
receptor 1 (CCR1)
F- TTTGGTGTCATCACCAGCAT
R- GCCTGAAACAGCTTCCACTC 57 155
Mouse Chemokine
receptor 3 (CCR3)
F- TTTCCTGCAGTCCTCGCTAT
R- ATAAGACGGATGGCCTTGTG 60 181
Human Chemokine
receptor 3 (CCR3)
F- CTACTCCCACTGCTGCATGA
R-CTGCTGTGGATGGAGAGACA 59 173
Mouse Chemokine
receptor 5 (CCR5)
F- GCTGCCTAAACCCTGTCATC
R- GTTCTCCTGTGGATCGGGTA 59 168
Human Chemokine
receptor 5 (CCR5)
F- TAGTCATCTTGGGGCTGGTC
R-TGTAGGGAGCCCAGAAGAGA 59 162
Mouse beta-actin F- AGCCATGTACGTAGCCATCC
R- TCTCAGCTGTGGTGGTGAAG 56 227
Human beta-actin F- AGAAAATCTGGCACCACACC
R-AGAGGCGTACAGGGATAGCA 56 188

Chapter 2: Materials and Methods
80
Table 7: Composition of PCR reaction mix used for cDNA amplification
2.3.5: Amplicon visualisation and DNA sequencing
After PCR amplification 10µl of each product was loaded onto a 2% agarose gel, which was
made up by dissolving 1g agarose in 50ml 1x Tris-Base-EDTA (TBE) supplemented with
ethidium bromide (5µg/ml). A pBluescript II SK DNA ladder was synthesised by digestion of
the pBluescript II SK+ plasmid by the restriction enzyme HapII (Molecular Biology Unit,
King’s College London), which generated thirteen DNA fragments of different known sizes
that each provided a size reference for unknown amplicons.
Figure 16: DNA ladder fragments (bp) generated by Hpa II restriction enzyme digest of pBluecript II
SK+ plasmid. Fragments were made visible on a 2% agarose gel stained with ethidium bromide (5µg/ml).
The 28 and 33 bp fragments are not visible.
Master mix Volume per reaction (µl) Final concentration
PCR water (DNase/RNase-free) 10 -
5 x Green Go Taq® Flexi buffer 4 -
PCR nucleotide mix (40mM) 0.8 1.6mM
Forward primer (100µM) 1 5µM
Reverse primer (100µM) 1 5µM
MgCl2 2 2.5mM
Go Taq® DNA polymerase 0.2 0.05U/µl

Chapter 2: Materials and Methods
81
2.3.6 Gel DNA extraction
DNA extraction from multiple cDNA preparations was achieved by excising amplicons of
interest from agarose gels using Qiagen Gel Extraction kits. In brief, the excised agarose gel
bands were weighed before adding approximately 3 or 6 volumes of buffer QG (100mg ~300µl
buffer QG), Table 8, for 1.8% and 2% agarose gels, respectively. The bands were incubated at
50°C for 10 minutes with brief vortexing every 2-3 minutes to ensure they were completely
dissolved. Equal volumes of isopropanol were added (e.g. 100mg~100µl), and the samples were
transferred into a Qiagen spin column and centrifuged (13,000rpm, 1 minute) before discarding
the flow through and adding 500µl of buffer QG to the spin column. After further
centrifugation (13,000rpm, 1 minute) 750µl of buffer PE (Table 8) was added to the spin
column and left to stand for 2-5 minutes. DNA was eluted from the column after centrifugation
(13,000rpm, 1 minute) by adding 50µl buffer EB (Table 8). DNA was stored it at -20°C.
Reagent Action
Buffer QG
Solubilisation and binding buffer
(with pH indicator). Helps to bind
nucleic acids to spin column
membrane.
Buffer PE Wash buffer for DNA clean up
procedures
Buffer EB
Allows for efficient elution of
nucleic acids from spin column
membrane.
Table 8: Reagents used during DNA extraction process from agarose gel.

Chapter 2: Materials and Methods
82
2.3.7 Quantitative PCR (qRT-PCR)
qRT-PCR was carried out in 96-well plates using the Roche® thermocycler (LightCycler 480)
and LightCycler® FastStart DNA masterPLUS SYBR green I (Roche®, UK). A reaction mix
was prepared by mixing mouse or human islet cDNA, primers and SYBR green master mix
(Table 9). The plate was centrifuged at 1000rpm for 1 minute to ensure all contents were at the
bottom of the well. The cDNAs were amplified by the LightCycler 480 following pre-set
conditions (Table 10). qRT-PCR was performed using QuantiTect primers specific for mouse
and human GPR75, CCR1, CCR3 and CCR5. Primer efficiency, which describes how efficient a
pair of primers are at copying the template sequence, was calculated by serially diluting the
cDNA template and determining the Ct value, which is the cycle number at which fluorescence
increases exponentially. This value was used to determine relative quantification values between
control and treatment groups. Relative expression of mRNAs was determined after
normalisation against GAPDH (Gapdh) as an internal reference and calculated by the 2−ΔΔCt
method (Livak and Schmittgen, 2001).
Reagent Vol. reagent/well (µl)
MasterMix 5
cDNA 1
Water 2
Primers 2
Total volume 10
Table 9: Preparation of SYBR green Mastermix for relative quantification using qRT-PCR
Step Target Temp. (oC) Time Cycles
Pre-incubation 95 5mins 1
Amplification 95 10secs
40 60 30secs
Melting Curve
95 5secs
1 65 1min
97
Cooling 40 30secs
Table 10: Conditions used by qRT-PCR lightcyler for cDNA amplification and melt curve analysis

Chapter 2: Materials and Methods
83
2.4: Protein Expression
2.4.1: Protein extraction
Lysis buffer was prepared by adding one PhosSTOP Phosphatase Inhibitor Cocktail tablet and
one cOmplete Protease Inhibitor Cocktail tablet to 10ml of RIPA buffer (Table 11), which was
kept on ice before commencing cell lysis. The phosphatase inhibitors inhibit alkaline
phosphatases, acid phosphatases, serine/threonine phosphatases, tyrosine phosphatases and
dual-specificity phosphatases, to preserve the phosphorylation status of proteins. The protease
inhibitor contains several protease inhibitors with broad inhibitory specificity serines, cysteines,
and metalloproteases, to limit protein degradation. RIPA buffer (Table 11) ensures efficient cell
lysis and protein solubilisation and simultaneously preserves protein integrity.
MIN6 beta cells were grown on 9cm diameter Petri dishes until 70-80% confluent, briefly
washed with PBS and 500µl of chilled cell lysis buffer was added on ice for 5 minutes. Cells
were scraped off the Petri dish surface using a cell scraper and the cell lysates were collected
into pre-chilled 1.5ml tubes. Islet protein extraction involved briefly washing islets twice with
PBS and transferred into pre-chilled 1.5ml tubes. 100µl lysis buffer was added to islet pellets and
left on ice for 30 minutes with vortexing every 10 minutes. The islet lysate was sonicated for 5-
10 seconds and left on ice for 10-15 minutes to facilitate lysis before being centrifuged
(13,000rpm, 10 minutes) at 4°C. The supernatant was collected and protein quantification was
determined with 10µl MIN6 beta cell and islet extract (Section 2.4.2). The remaining lysates
were stored at -20°C in 4x NuPAGE® sample buffer, which optimises protein separation for
polyacrylamide gel electrophoresis (PAGE) by denaturing and reducing protein disulphide
bonds.
Reagent Concentration
RIPA buffer (Sigma)
NaCl 150mM
Tris-base 50mM
SDS 0.1%
Na-deoxycholate 0.5%
*IGEPAL® CA-630 1%
PhosSTOP Phosphatase Inhibitor Cocktail tablet (Roche) -
cOmplete Protease Inhibitor Cocktail tablet (Roche) -
Table 11: Composition of Cell lysis buffer. pH 8.0. * Nonionic, non-denaturing detergent, chemically
indistinguishable from Nonidet P-40

Chapter 2: Materials and Methods
84
2.4.2: Protein quantification
The BCA (bicinchoninic acid) assay was used to determine protein content of cell extracts. It is
a copper-based protein assay which relies on peptides chelating with cupric ions (Cu2+) in an
alkaline environment to produce a violet complex that absorbs light at 540nm (Biuret reaction).
BCA binds to the reduced cuprous ions (Cu1+) induced by the peptide-mediated biuret reaction
resulting in removal of the weakly bound peptides to generate an intense purple colour. Thus,
the increase in absorbance is directly proportional to the protein concentration. Furthermore,
the released peptides can bind free cupric ions, and therefore the reaction is indefinite subject to
the presence of excess BCA and copper. To overcome this potential obstacle, standards and
unknown samples are assayed simultaneously and receive identical incubation periods and
temperature exposure. The advantage of the BCA assay is that it is highly sensitive and responds
uniformly to different proteins, yielding consistent and reliable results. Samples of cell lysates
extracted from MIN6 beta cells, exocrine cells and islets (2.4.1: Protein extraction) were diluted
to 1:10 and 1:100 with lysis buffer. BSA was used to provide reference standards of known
protein concentrations (0, 0.025, 0.125, 0.25, 0.5, 0.75, 1, 1.5 and 2 mg/ml). and 25µl of either
protein standard or sample was added in triplicate into wells of a clear 96 well plate. 200µl of
BCA solution was added to all wells and the plate was incubated for 30 minutes at 37°C. The
absorbance was measured at 595nm using an ELISA reader (Hidex Chameleon™V). A standard
curve was generated by plotting the average absorbance at 595nm against the concentration of
the BSA standards, and the protein concentration of samples was determined using a standard
curve (Figure 17).
Figure 17: BSA standard curve used for protein quantification of cell extracts. Each BSA concentration
was prepared in triplicate in which the mean absorbance (595nm) was determined using a Chameleon
plate reader.
0
0.1
0.2
0.3
0.4
0.5
0.6
0.7
0.8
0.9
1
0 0.5 1 1.5 2
Ab
sorb
ance
(595n
m)
Protein Concentration (mg/ml)

Chapter 2: Materials and Methods
85
2.4.3: Sodium dodecyl sulphate polyacrylamide gel electrophoresis (SDS-PAGE)
SDS-PAGE is a universally accepted method of separating proteins on the basis of their
molecular weights. It relies on the fact that proteins undergo partial denaturation in the
presence of SDS, which applies an overall net negative charge to all proteins, ensuring that they
are separated according to their molecular weight in the presence of an electric field. This
promotes the migration of negatively charged proteins toward the anode via the porous
polyacrylamide gel matrix, which is characterized by a mixture of acrylamide and bisacrylamide
monomers. Thus, large pore acrylamide gels (5%) are useful for separating large proteins (80-
200kDa) whereas small pore acrylamide gels (15%) are useful for separating smaller proteins
(10-40kDa).
Pre-cast NuPAGE® Novex® Bis-Tris 12% gels were used to separate proteins, with a
separation range of 10-80kDa. Equal amounts of MIN6 beta cell, mouse and human exocrine
and islet protein extracts were loaded onto the polyacrylamide gel (pH 6.4) along with a full-
range rainbow molecular weight marker, which is a mixture of individual coloured proteins of
defined sizes (Figure 17). The gel was placed in an Xcell SureLock® mini-cell electrophoresis
system and the inner chamber was filled with antioxidant buffer (Table 12), which maintains
proteins in a reduced state during PAGE, whilst the outer chamber was filled with 1xMOPS
running buffer (Table 13) before separating the proteins electrophoretically at 200V for 50
minutes.
Figure 18: Full-Range Rainbow Molecular Weight Markers (GE Healthcare Amersham RPN800E)
assessed on a 4 - 20% Tris-glycine gradient SDS-PAGE mini-gel. K: kDa. (Image acquired from GE
healthcare:https://www.gelifesciences.com/gehcls_images/GELS/Related%20Content/Files/13147874
24814/litdocRPN800EPS%20Rev%20A%202007_20110831125742.pdf accessed 02.01.2014, 14:36).

Chapter 2: Materials and Methods
86
Reagent Amount
1X MOPS running buffer 200ml
NuPAGE® Novex® Antioxidant 500µl
Table 12: Preparation of antioxidant buffer used for SDS-PAGE.
Reagent Amount in 500ml Final Concentration
MOPS 104.6g 1M
Tris Base 66.6g 1M
SDS 10g 69.3mM
EDTA 3g 20.5mM
Table 13: MOPS running buffer (20X). Reagents listed were initially dissolved in 400ml dH2O and then
adjusted to a final volume of 500ml. The 20X MOPS running buffer was diluted with dH2O to make 1X
MOPS running buffer for SDS-PAGE and the remaining buffer was stored at 4°C.

Chapter 2: Materials and Methods
87
2.4.4: Western Blotting
Western Blotting enables the detection of a protein of interest from a mixture of proteins by
making use of a specific antibody. Proteins separated by SDS-PAGE were transferred to a
polyvinylidene difluoride (PVDF) membrane, which has a high protein binding capacity, of 50-
150µg/cm2, making it ideal for this application. The gel was placed within a blotting module,
filled with 1x NuPAGE transfer buffer (Table 14) and an electric current of 30V was applied
for 2 hours, which promoted migration of proteins towards the membrane (Figure 19). The
membrane was removed from the blotting module and incubated in a protein-rich blocking
buffer (Table 15) for 1 hour at room temperature to prevent non-specific binding of the
detection antibody to the PVDF membrane. The acrylamide gel was stained with coomassie
blue to verify protein transfer from gel to the membrane. The membrane was incubated with a
primary antibody (For antibody dilution see section 3.2.2: Western blotting) raised against the
target protein overnight at 4°C followed by three subsequent washes with 1x Tris Buffered
Saline (TBS)-Tween20 (Table 16) for 15 minutes. The blot was then incubated for 1 hour with a
horseradish peroxidase-conjugated secondary antibody solution (1:5000 dilution) at room
temperature before being washed with 1x TBS-T. The immunoreactive proteins were identified
by chemiluminescent detection using ECL reagents (GE Healthcare). Photographic film was
exposed to the luminescent protein signal on the membrane and protein size was determined by
comparing migration to the full-range rainbow molecular weight markers (Table 17).
Figure 19: Diagram showing the assembly of the polyacrylamide gel/PVDF membrane within
the blotting module. Briefly, proteins were separated by SDS-PAGE and the acrylamide gel was placed
into a blotting module. A 30V current was applied for 2 hours to allow the proteins to transfer from the
gel to the membrane. The membrane was then used to detect proteins of interest using antibodies.

Chapter 2: Materials and Methods
88
Reagent Amount (ml)
dH2O 849
20x NuPAGE transfer buffer 50
Antioxidant 1
Methanol 100
Table 14: NuPAGE transfer buffer (1x) composition
Table 15: Composition of blocking buffer solution, which was adjusted to pH 7.4.
Table 16: Composition of 10x TBS-T, which was made by dissolving the reagents listed above in 3L of
dH2O. pH of the solution was adjusted to 7.4 using 1M HCl before being topped up to 4L with dH2O. A
1x working solution was used for western blotting.
Reagent Amount
TBS-T 500ml
Semi-skimmed milk powder (5% w/v) 25g
Reagent Amount for 1l (10x) Final concentration (1xTBS)
Tris base 80g 136mM
NaCl 60g 50mM

Chapter 2: Materials and Methods
89
2.4.5: Immunohistochemistry
Immunohistochemistry (IHC) was used to provide information on CCL5 and GPR75
localisation within islets. Mouse and human pancreata were isolated and fixed in formalin
overnight before being transferred into 70% ethanol and stored at 4°C. The pancreata were
embedded in paraffin wax and cut into 5-7µm sections using a microtome before being
mounted onto tissue section slides. Sections were heated (60°C) and the remaining paraffin wax
was removed by submersion into 100% xylene solution and were gradually rehydrated by a
series of washes with decreasing concentrations of ethanol and dH2O (Table 17). Tissue
sections underwent an antigen retrieval protocol to expose antigenic sites that may have been
masked by formaldehyde induced protein cross-linking during the fixation process. The sections
were then exposed to citric acid buffer (10mM, 0.05% Tween-20, pH6) and heated in a pressure
cooker pot for approximately 10-15 minutes before being washed with running water and
treated with 3% hydrogen peroxide for 10 minutes at room temperature, to block peroxidase
activity, and then finally washed with dH2O for a further 10 minutes. The pancreas sections
were then incubated for a further 10 minutes with swine serum at room temperature (1:5
dilution in 1x TBS) to block non-specific binding of the detection antibodies. Primary
antibodies were diluted in PBS/0.25% (v/v) Triton X-100/0.25% (w/v) BSA and applied to
pancreas sections overnight in a humidifying chamber at 4°C. The slides were subsequently
washed three times with PBS-0.25% (v/v) Triton X-100 (5 minute washes) before commencing
with either diaminobenzidne (DAB) or fluorescent immunostaining.

Chapter 2: Materials and Methods
90
Solution Time (minutes)
Xylene 1 30
Xylene 2 5
100% Alcohol 10
95% Alcohol 5
70% Alcohol 5
dH2O 10
Table 17: Protocol for tissue rehydration of mouse and human pancreas sections.
Reagent Amount Final concentration (1xPBS)
NaCl 80g 136mM
Na2HPO4 11.6g 8mM
NaH2PO4 2g 1.7mM
KCl 2g 2.7mM
Table 18: Preparation of 10x PBS. Reagents were initially dissolved in 900ml dH2O before being adjusted
to a pH of 7.2, and then made up to a final volume of 1l with dH2O). A 1x working solution was used
throughout IHC.
Reagent Amount Final concentration (1xTBS)
NaCl 80g 136mM
Tris base 60g 50mM
Table 19: Preparation of 10x TBS. A 1x working solution was used throughout IHC

Chapter 2: Materials and Methods
91
2.4.5a Diaminobenzidine (DAB) immunostaining
For the detection of immunoreactive proteins by DAB staining, a universal biotinylated link
antibody was applied to the sections for 30 minutes at room temperature. Sections were briefly
washed three times with PBS-0.25% (v/v) Triton X-100 before being incubated with
streptavidin-conjugated horseradish peroxidase for 30 minutes at room temperature after which
it was washed off with PBS-0.25% (v/v) Triton X-100. DAB-substrate-chromagen was applied
to the tissue sections. A brown colour was generated as a result of the reaction between the
peroxidase and the DAB. Once the desired colour development was achieved (10-20 minutes)
the DAB-substrate chromagen was washed off and the slides were briefly counter stained with
haematoxylin and eosin to stain for nuclei and cytoplasmic connective tissue. The sections were
mounted with DPX (1,3-diethyl-8-phenylxanthine) after being gradually dehydrated with
increasing concentrations of ethanol and a final wash with xylene (Table 20).
Solution Time (minutes)
70% ethanol 5
95% ethanol 5
100% ethanol 5
100% Xylene 5
Table 20: Protocol for dehydration process for mounting mouse and human pancreas tissue sections.

Chapter 2: Materials and Methods
92
2.4.5b Fluorescent immunostaining
Pancreas tissue sections that had been exposed to the primary antibodies shown in Table 21,
were immunoprobed for 1 hour at room temperature with either AlexaFluor488® or
AlexaFluor594® antibodies (Table 22), which were made up in PBS/0.25% (v/v) Triton X-
100/0.25% BSA. Immunoreactive protein localisation was determined using a fluorescent
microscope (Nikon Eclipse TE 2000-U).
Primary
antibody Description Manufacturer (Cat number) Dilution range
CCL5 Goat polyclonal IgG R&D systems (AF478) 1:8 to 1:10
GPR75 Rabbit polyclonal IgG Abcam (ab75581) 1:10 to 1:20
Insulin Guinea pig polyclonal DAKO (A0564) 1:50
Glucagon Mouse monoclonal Sigma (G2654) 1:50
Somatostatin Rat monoclonal Abcam (ab30788) 1:25
Table 21: Primary antibodies used for IHC staining. Antibodies were diluted to within working range by
making up in PBS/0.25% (v/v) Triton X-100/0.25% (w/v) BSA.
Protein target Details Manufacturer Dilution
CCL5 AlexaFluor 488® anti-
goat IgG
Jackson ImmunoResearch
Laboratories (705-545-147) 1:250
GPR75 AlexaFluor 488® anti-
rabbit IgG
Jackson ImmunoResearch
Laboratories (711-545-152) 1:100
Insulin AlexaFluor 594® anti-
guinea pig IgG
Jackson ImmunoResearch
Laboratories (706-585-148) 1:250
Glucagon AlexaFluor 594® anti-
mouse IgG
Jackson ImmunoResearch
Laboratories (715-585-150) 1:250
Somatostatin AlexaFluor 594® anti-
rat IgG
Jackson ImmunoResearch
Laboratories (712-585-150) 1:250
Table 22: Fluorescent-conjugated secondary antibodies used for IHC. Antibodies were diluted to the
appropriate dilution in PBS/0.25% (v/v) Triton X-100/0.25% (w/v) BSA.

Chapter 2: Materials and Methods
93
2.5: Beta cell and islet function
2.5.1: Single cell calcium microfluorimetry
Single cell-calcium microfluorimetry allows for real-time calcium ion measurements within cells.
Changes in intracellular calcium are usually monitored by calcium-sensitive dual wavelength
indicators such as FURA-2 (e 2-[6-(bis(carboxymethyl)-amino)-5-methylphenoxy)ethoxy-2-
benzofuranyl]5-oxazole carboxylic acid). When FURA-2 is bound to Ca2+, there is a shift in
peak excitation wavelength from 380nm to 340nm, which causes fluorescent light to be emitted
at a higher wavelength of 510nm. The advantage of using a dual wavelength indicator such as
FURA-2 is because of the ability to detect the Ca2+-free and Ca2+-bound forms of the dye at
two different wavelengths and therefore obtain a ratiometric measurement since artefacts
unrelated to changes in intracellular calcium are minimised. Furthermore, FURA-2 is coupled to
an acetoxy methyl ester (AM), which allows it to cross the plasma membrane and be cleaved by
endogenous esterases that cleave AM allowing high concentrations of the dye to accumulate
within the cell (Limke and Atchison, 2001).
Approximately 50,000 MIN6 beta cells or 80-100 mouse or human islets, which were partially
dispersed using a non-enzymatic (calcium and magnesium free) cell dissociation solution for 15
minutes at 37°C (5% CO2/95% air), were seeded onto acidified ethanol-washed coverslips
(MIN6 beta cells) or Cell-Tak coated acidified ethanol-washed coverslips (islets), Table 24, and
placed in 6-well plates containing serum-free media and maintained for 2-3 hours to allow the
cells to adhere to the coverslips. Serum containing media was then added to the wells before
incubating overnight at 37°C (5% CO2/95% air). The cells were then loaded with 5µM FURA-2
AM at 37°C for 30 minutes and coverslips were transferred to a temperature controlled
chamber maintained at 37°C and perifused with agents of interest. A shutter system was used to
expose the cells/islets to between wavelengths of 340nm and 380nm every 2 seconds. Changes
in fluorescence (emission at 510nm) were monitored by an epi-fluorescence microscope (Zeiss
Axiovert135 Inverted microscope). The 340nm/380nm ratio was measured every 2 seconds and
data were recorded by OptoFluor imaging software. For most protocols, cells were perifused
with a physiological salt solution (Gey and Gey, 1936), Table 23, supplemented with 2mM
glucose to establish a stable baseline of intracellular calcium (Table 25). ATP (100µM) and
Tolbutamide (50µM), served as positive controls.
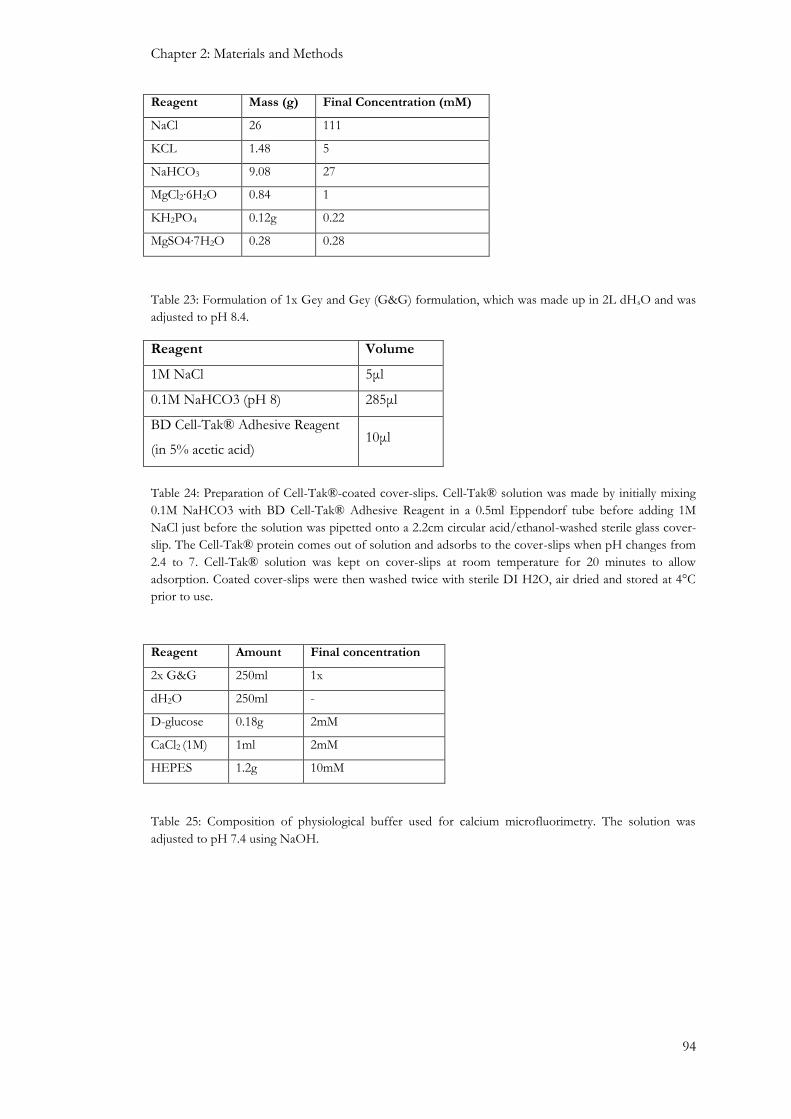
Chapter 2: Materials and Methods
94
Reagent Mass (g) Final Concentration (mM)
NaCl 26 111
KCL 1.48 5
NaHCO3 9.08 27
MgCl2∙6H2O 0.84 1
KH2PO4 0.12g 0.22
MgSO4∙7H2O 0.28 0.28
Table 23: Formulation of 1x Gey and Gey (G&G) formulation, which was made up in 2L dHsO and was
adjusted to pH 8.4.
Reagent Volume
1M NaCl 5μl
0.1M NaHCO3 (pH 8) 285μl
BD Cell-Tak® Adhesive Reagent
(in 5% acetic acid) 10μl
Table 24: Preparation of Cell-Tak®-coated cover-slips. Cell-Tak® solution was made by initially mixing
0.1M NaHCO3 with BD Cell-Tak® Adhesive Reagent in a 0.5ml Eppendorf tube before adding 1M
NaCl just before the solution was pipetted onto a 2.2cm circular acid/ethanol-washed sterile glass cover-
slip. The Cell-Tak® protein comes out of solution and adsorbs to the cover-slips when pH changes from
2.4 to 7. Cell-Tak® solution was kept on cover-slips at room temperature for 20 minutes to allow
adsorption. Coated cover-slips were then washed twice with sterile DI H2O, air dried and stored at 4°C
prior to use.
Reagent Amount Final concentration
2x G&G 250ml 1x
dH2O 250ml -
D-glucose 0.18g 2mM
CaCl2 (1M) 1ml 2mM
HEPES 1.2g 10mM
Table 25: Composition of physiological buffer used for calcium microfluorimetry. The solution was
adjusted to pH 7.4 using NaOH.

Chapter 2: Materials and Methods
95
2.5.2: Transient transfection - siRNA mediated GPR75 depletion
A gene-targeted small interfering RNA (siRNA) was used to down-regulate GPR75 expression
in MIN6 beta cells. MIN6 beta cells were trypsinised and re-suspended in serum-containing
medium before counting cell number (2.1.3: Cell counting). 1x10⁶ cells per sample were
centrifuged (1500rpm, 3 minutes), the remaining supernatant was removed, and the cells were
gently re-suspended in 100µl Amaxa Nucleofector® transfection reagent, which consisted of a
4.5:1 ratio of Nucleofector® solution (82µl) to Nucleofector® supplement (18µl) per 100µl
sample. The cell suspension was combined with 30-300nM gene-targeted siRNA, transferred
into a cuvette and electroporated using a Lonza Amaxa biosystems Nucleofector II. 500µl of
pre-warmed serum-containing medium was added immediately to the cell suspension, which
was transferred into wells of 6 well plates containing 1.5ml pre-warmed serum containing
medium. Cells were maintained at 37°C (5% CO2/95% O2) for 4-48 hours and the extent of
GPR75 down-regulation was determined by qRT-PCR (section 2.3.7) and western blotting
(section 2.4.4). Functional effects of down regulation were observed by calcium
microfluorimetry (section 2.5.1) and insulin secretion (section 2.6) experiments.
2.6 Hormone secretion
Islets of Langerhans are composed of three major endocrine cell types. The glucagon-secreting
alpha cells and the insulin-secreting beta cell are the most abundant islet endocrine cell types
and by secreting these hormones they are crucial for glucose homeostasis (Bosco et al., 2010,
Baetens et al., 1979). Static measurements of insulin secretion allows identification of
compounds that can initiate, potentiate or suppress islet hormone secretion, under conditions
where ranges of concentrations of test agents can be examined using the same batch of islets.
Dynamic measurement of insulin secretion in perifusion is technically more challenging and it
can be used to identify the kinetics of islet hormone secretion to determine whether the effect
on hormone secretion is acute or prolonged and to identify whether the changes in secretion are
rapid in onset and reversible on removal of the test agents. Therefore, measuring islet hormone
secretion is useful towards identifying compounds that influence islet hormone secretion and
thus provide information that may be useful in the development of novel drugs towards the
treatment of type 2 diabetes (Nolan and O’Dowd, 2009).
2.6.1 Static incubation
MIN6 beta cells were trypsinised and seeded into 96 well plates at a density of 30,000cells/well
and maintained in culture overnight at 37°C to allow for cell adherence. The tissue culture
medium was then tapped off and the cells were incubated with 200µl of physiological buffer
supplemented with 2mM glucose (Table 26), for 2 hours at 37°C to establish a baseline level of
insulin secretion. The physiological buffer was aspirated and cells were then treated with 200µl
of agents of interest for 1 hour at 37°C (5%CO2/95%air), after which 160µl of supernatant was

Chapter 2: Materials and Methods
96
collected and assayed by radioimmunoassay for insulin content, where a 1:5 dilution with borate
buffer was required (Table 28).
A similar approach was used for isolated mouse and human islets, in which 3 islets per replicate
were pre-incubated in 600µl physiological buffer supplemented with 2mM glucose (Table 26)
for 1 hour at 37°C before being aspirated and then treated with agents of interest for 1 hour.
After incubation 450µl of supernatant was collected and assayed for insulin content by
radioimmunoassay after a 1:5 dilution in borate buffer.
2.6.2 Perifusion
Isolated mouse and human islets were perifused with a physiological buffer (Table 26) in the
absence and presence of agents of interest to determine the dynamic secretory profile of islet
hormones in response to those test agents. The perifusion system was maintained at 37°C in a
temperature controlled environment and consisted of 8-16 chambers, depending on the
experiment, that contained a 1µm pore membrane that ensured islets cells did not pass into the
perifusate. 80-100 islets were loaded into each chamber and pre-perifused with the physiological
buffer supplemented with 2mM glucose for 70 minutes using a multichannel peristaltic pump
set at a flow rate of 0.5ml/minute during which the perifusate was discarded. The islets were
then treated with agents of interest and the perifusate was collected every 2 minutes from which
insulin and glucagon content were measured by radioimmunoassay (section 2.6.3).
Reagent Amount Final concentration
2x G&G 250ml 1x
dH2O 250ml -
D-glucose 0.36g 2mM
CaCl2 (1M) 1ml 2mM
BSA 0.25g 0.5mg/ml
Table 26: Preparation of physiological buffer used for hormone secretion experiments, which was
adjusted to pH 7.4 using 5%CO2/95%air.

Chapter 2: Materials and Methods
97
2.6.3 Islet hormone radioimmunoassay
Radioimmunoassay (RIA) is used for measuring very low concentrations of immunoreactive
molecules in solution, making it an extremely sensitive technique in biomedical research. The
molecular basis behind immunoassay is founded upon the interaction of an antibody to its
corresponding ligand. The two major islet hormones, insulin and glucagon, are the primary
ligands of interest in this thesis.
RIA consists of three variables; the antibody (Ab), antigen (Ag) and the radiolabelled antigen
(Ag*). The Ag, which is the ligand or molecule of interest, competes with a radiolabelled form
of the same ligand which is referred to as the tracer and both compete for binding to the Ab. A
limited amount of Ab is incubated in solution with a mixture of Ag* and known concentrations
of Ag (Standards) or unknown concentrations of ligand (Samples). The Ab will bind to the Ag
and as the reaction proceeds towards equilibrium there will be competitive binding between Ag
and Ag*, with limited availability of Ab binding sites.
Ab + Ag + Ag* ↔ Ab:Ag + Ab:Ag* + Ag + Ag*
Therefore, increasing the concentration of Ag will increase the probability of Ab:Ag binding
and conversely decrease Ab:Ag* binding due to the limited availability of antibody binding sites.
Furthermore, by keeping the concentrations of Ab and Ag* constant and varying the
concentration of Ag across a fixed range a standard curve can be generated to quantify ligand
content.
To quantify islet hormone content of samples retrieved from static incubations (section 2.6.1)
or perfusion (section 2.6.2), a standard curve was constructed by serially diluting stock 10ng/ml
insulin or glucagon (Table 27) with borate buffer (Table 28). The standards were assayed in
triplicate and samples assayed in duplicate. An equivalent amount of antibody and tracer (125I-
Insulin or 125I-Glucagon) was added to standards, reference tubes and samples, and all assay
tubes were kept at 4°C for 48 hours to establish equilibrium. The reference tubes include: totals
(T), which indicate the total amount of radioactivity; non-specific binding (NSB), which
indicates the binding of antigen in the absence of antibody; and maximum binding B0, which
specifies how much tracer binding takes place in the absence of unlabelled insulin. The antigen-
antibody complexes were then retrieved following the addition of 1ml of precipitant (Table 29),
and centrifuged (3000rpm, 4°C, 15minutes) followed by aspiration of the supernatant. The
radioactivity of the remaining pellet was measured using a Packard Cobra II γ counter as counts
per minute (cpm). The standard curve was generated by plotting cpm against insulin
concentration, and it was used to quantify islet hormone concentration (ng/ml) of test samples.
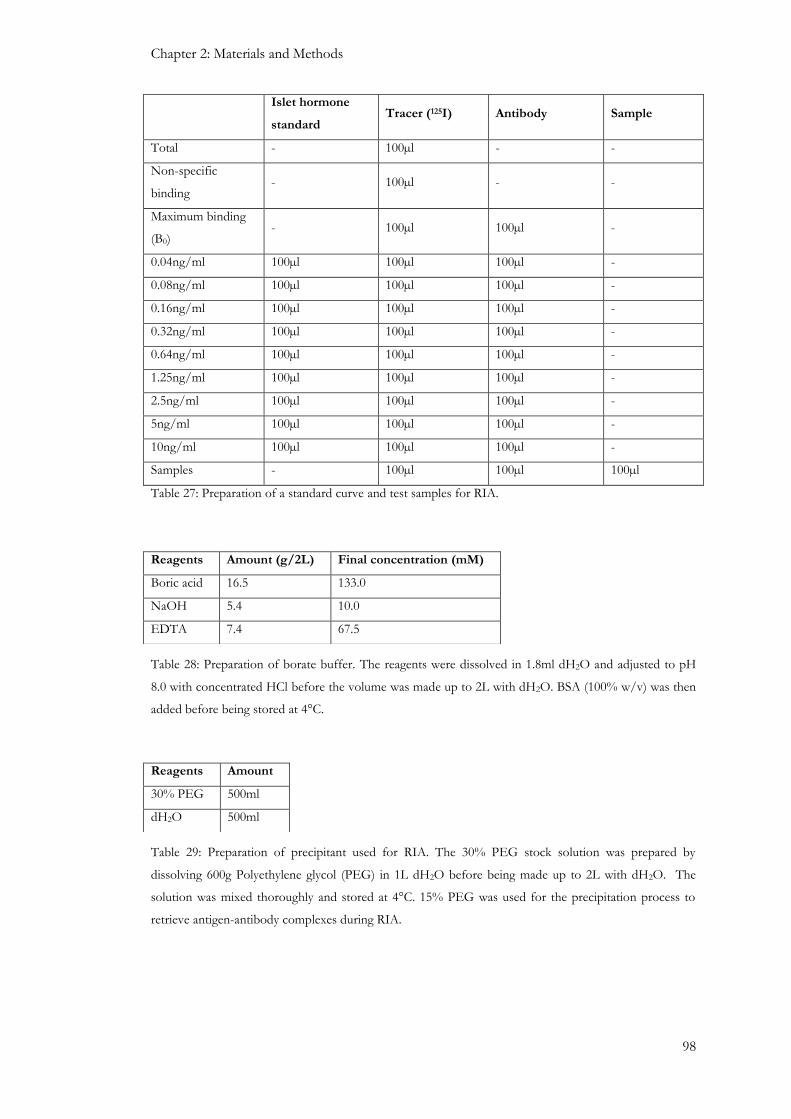
Chapter 2: Materials and Methods
98
Islet hormone
standard Tracer (125I) Antibody Sample
Total - 100µl - -
Non-specific
binding - 100µl - -
Maximum binding
(B0) - 100µl 100µl -
0.04ng/ml 100µl 100µl 100µl -
0.08ng/ml 100µl 100µl 100µl -
0.16ng/ml 100µl 100µl 100µl -
0.32ng/ml 100µl 100µl 100µl -
0.64ng/ml 100µl 100µl 100µl -
1.25ng/ml 100µl 100µl 100µl -
2.5ng/ml 100µl 100µl 100µl -
5ng/ml 100µl 100µl 100µl -
10ng/ml 100µl 100µl 100µl -
Samples - 100µl 100µl 100µl
Table 27: Preparation of a standard curve and test samples for RIA.
Table 28: Preparation of borate buffer. The reagents were dissolved in 1.8ml dH2O and adjusted to pH
8.0 with concentrated HCl before the volume was made up to 2L with dH2O. BSA (100% w/v) was then
added before being stored at 4°C.
Table 29: Preparation of precipitant used for RIA. The 30% PEG stock solution was prepared by
dissolving 600g Polyethylene glycol (PEG) in 1L dH2O before being made up to 2L with dH2O. The
solution was mixed thoroughly and stored at 4°C. 15% PEG was used for the precipitation process to
retrieve antigen-antibody complexes during RIA.
Reagents Amount (g/2L) Final concentration (mM)
Boric acid 16.5 133.0
NaOH 5.4 10.0
EDTA 7.4 67.5
Reagents Amount
30% PEG 500ml
dH2O 500ml

Chapter 2: Materials and Methods
99
2.7 Cell apoptosis and proliferation
During apoptosis a set of cysteine proteases, known as caspases, are activated by pro-apoptotic
stimuli, such that activation of initiator caspases (caspase 8 and 10), cleave and activate effector
caspases (caspase 3 and 7). This results in the degradation of downstream protein substrates
within the cell and causes significant morphological changes associated with apoptosis such as
chromatin condensation, nuclear degeneration and cell dehydration (Emamaullee and Shapiro,
2006). Beta cell mass is regulated by a fine balance between beta cell replication, beta cell
apoptosis and neogenesis (Bonner-Weir, 2000a, Finegood et al., 1995). Disruption of these
finely tuned events, such as reduced beta cell proliferation or enhanced beta cell apoptosis,
would result in reduced beta cell mass and subsequent reduction in insulin output (Leonardi et
al., 2003). A reduced beta cell mass, primarily as a result of increased apoptosis, has been
observed in obese and lean patients with type 2 diabetes, and this is considered to be important
towards the development of type 2 diabetes (Butler et al., 2003b). Furthermore, beta cell
proliferation is essential in increasing beta cell mass with reports observing 40-50 fold increases
in beta cells mass in response to increasing insulin demand (Bruning et al., 1997, Yen et al.,
1994). Type 2 diabetic subjects have been reported to show reduced beta cell mass compared to
control non-diabetic subjects, suggesting that beta cell mass expansion is important for delaying
or preventing the onset of diabetes (Butler et al., 2003b, Kloppel et al., 1985). This provides
strategic opportunities for intervention in preventing type 2 diabetes, by restoring beta cell mass
(Butler et al., 2003b).
2.7.1: Measurement of cell apoptosis
In the experiments described in this thesis, caspase 3/7 activities were measured using a caspase
3/7 Glo® assay kit (Promega). The principle of this assay involves the cleavage of the
luminogenic substrate (Z-DEVD-amino-luciferin) by caspase 3/7, and the released free amino-
luciferin acts as a substrate for the luciferase enzyme. This generates a luminescent signal, which
is directly proportional to caspase 3/7 activities.
MIN6 beta cells were seeded at density of 20,000cells/well, and mouse or human islets were
placed into each well of a white walled 96-well plate. The cells and islets were incubated for 24
hours at 37°C (5% CO2/95% air) in 200µl of DMEM (Table 1) and then treated with agents of
interest in serum-free DMEM in the absence or presence of cytokines (Table 30) for 21 hours at
37°C (5% CO2/95% air). Caspase 3/7 activities were then measured by incubating the cells for
one hour with a mixture containing a Caspase-Glo® substrate and buffer at room temperature.
The luminescent signal generated was detected quantified using a Veritas luminometer (Turner
Biosystems).

Chapter 2: Materials and Methods
100
Cytokine
Stock Concentration Volume used Final Concentration
TNF-α 1000U/μl 2μl 1U/μl
IFN-γ 1000U/μl 2μl 1U/μl
IL-1β 100U/μl 1μl 0.05U/μl
Table 30: Preparation of cytokine cocktail used to induce apoptosis. The cytokine cocktail was prepared
by mixing each cytokine together in a 0.5ml centrifuge tube. The cytokine mixture was then added to the
treatment media in the presence or absence of compounds of interest, which was used to treat MIN6 beta
cells or islets to induce apoptosis.
2.7.2: Measurement of cell proliferation
Cell proliferation was measured using a non-radioactive colorimetric immunoassay based on 5-
bromo-2’-deoxyuridine (BrdU) incorporation into cellular DNA. 15,000 MIN6 beta cells were
seeded per well into a 96 well plate and incubated for 24 hours at 37°C (5% CO2/95% air) in
200µl DMEM (Table 1). Afterwards, the medium was gently tapped off and the cells were
treated with 100µl of agents of interest for a further 24 hours at 37°C (5% CO2/95% air). 10µl
BrdU (10µM) labelling solution was then added to each well and cells were incubated for a
further 2 hours at 37°C. The medium was then tapped off and 200µl of a denaturing solution
that was supplied with the assay kit (FixDenat) was added to each well and the samples were
incubated for 30 minutes at room temperature. The denaturing solution was tapped off and the
cells were incubated with a peroxidase-conjugated anti-BrdU antibody for 90 minutes at room
temperature. Once the DNA had been denatured the antibody was able to bind to the
incorporated BrdU. The antibody conjugate was tapped off and the samples were washed three
times with 200-300µl washing solution (Table 31). The cells were then incubated with a
substrate solution at room temperature until colour development was observed (approximately
20 minutes). The reaction was stopped by adding 25µl of 1M H2SO4 to each well and after
incubation on a plate shaker for 1 minute absorbance was measured at 450nm using an ELISA
reader (Hidex Chameleon™V). Further information regarding the reagents used in this assay are
shown in Table 31.

Chapter 2: Materials and Methods
101
Reagent Preparation Use
BrdU labelling solution (10 mM,
in PBS, pH 7.4)
BrdU labelling solution was
diluted 1:100 with sterile culture
medium (resulting concentration
100µM).
Incorporation into cellular DNA
for labelling proliferating cells
Anti-BrdU POD working
solution [Monoclonal anti-BrdU
antibody conjugated with
peroxidase (POD)]
Anti-BrdU POD was dissolved
in 1.1 ml dH2O for 10 minutes
and mixed thoroughly to make
the stock solution, which was
diluted 1:100 with antibody
dilution solution.
Binding of POD labelled anti-
BrdU antibody to detect
incorporated BrdU.
Washing solution (100ml PBS,
10X concentrate)
Wash buffer concentrate was
diluted 1:10 with dH2O.
Removal of unbound anti-BrdU
POD
Substrate solution (100 ml TMB
(tetramethyl-benzidine) - Detection of immune complexes
FixDenat - Denature DNA
Table 31: Use of Roche BrdU colorimetric immunoassay.reagents for measuring cell proliferation.
2.8: Statistical analysis
Numerical data were expressed as mean ± standard error of mean (SEM) in this thesis.
Statistical analyses were performed using two-tailed unpaired Student’s t tests when comparing
two groups or ANOVA as appropriate for multiple groups, which were followed up by a post
hoc test to identify specific differences between groups. P values less than p<0.05 were
considered significant.

102
Results
Chapter 3: Expression of CCL5 and its receptors by islet cells

Chapter 3: Expression of CCL5 and its receptors by islet cells
103
3.1: Introduction
Chemokines are small chemotactic cytokines that are essential in orchestrating the movement of
leukocytes to sites of inflammation or injury (Viola and Luster, 2008). They exert their effects
by activating chemokine receptors (CCRs), which are GPCRs that are commonly known to
activate Gαi proteins. Although a majority of chemokine responses are inhibited with treatment
of pertussis toxin (PTx), consistent with Gαi coupling, some chemokine-induced responses
persist in the presence of PTx suggesting chemokine receptors may also associate with other G-
proteins, such as Gq/11 (Mellado et al., 2001). The interaction between chemokines and
chemokine receptors are important for the host’s ability to control infection but it can also be
detrimental, as chemokines have been implicated in the pathophysiology of infectious and
inflammatory diseases, such as asthma, atherosclerosis and multiple sclerosis, where
inflammatory cells are directed towards tissue sites resulting in tissue damage due to the
accumulation of leukocytes (Viola and Luster, 2008).
CCL5 is produced by a variety of cells such as T-cells, endothelial cells, smooth muscle cells and
neurons, and it typically recruits a host of immune cells to sites of inflammation (Levy, 2009).
This is achieved by activating the conventional chemokine receptors CCR1, CCR3 and CCR5.
CCL5-induced recruitment of lymphocytes and secretion of inflammatory cytokines by
lymphocytes through CCR activation has been implicated as a contributing factor towards the
development of T1DM by promoting the autoimmune destruction of beta cells (Carvalho-Pinto
et al., 2004). CCR5 is up-regulated in T and B-cells in non-diabetic (NOD) mice. Furthermore,
CCL5 expression is up-regulated in islets of NOD and BALB/c mice, associating CCL5-CCR5
interaction with the recruitment of lymphocytes into islets and subsequent beta cell destruction
and development of diabetes (Carvalho-Pinto et al., 2004).
In 2006, it was established that CCL5 also activated a novel yet atypical chemokine receptor,
named GPR75. This GPCR only shared 12-16% sequence homology with conventional
chemokine receptors, and has an abnormally long C-terminus tail. It also does not possess the
highly acidic N-terminus tail, which is important for basic chemokine interaction (Pease, 2006).
GPR75 is expressed at the mRNA level by brain, spinal cord and retina but absent in traditional
chemokine receptor locations such as thymus, spleen and leukocytes, (Sauer et al., 2001).
Further studies revealed that mouse GPR75 mRNA was expressed in heart, brain, liver, kidney,
skeletal muscle and embryo and it showed preferential coupling to the Gαq protein (Ignatov et
al., 2006). This coupling to PLC was corroborated by CCL5-induced elevations of IP3 in human
embryonic kidney (HEK293) cells and calcium mobilisation in Chinese hamster ovary (CHO-
K1) cells (Ignatov et al., 2006). Additionally, overexpression of GPR75 in murine hippocampal
cells also enhanced their cell viability (Ignatov et al., 2006).

Chapter 3: Expression of CCL5 and its receptors by islet cells
104
It is well-established that the exocytotic release of insulin from beta cells can be regulated by the
activation of GPCRs expressed in islets (Amisten et al., 2013). Thus, ligands that couple to the
Gαs protein cause AC activation and cAMP formation, whereas coupling to Gαq activates PLC
with the subsequent hydrolysis of PIP2 resulting in the generation of IP3 and DAG, both of
which have been associated with increases in intracellular calcium, which is a central messenger
for beta cell stimulus-secretion coupling (Jones and Persaud, 1998b). Furthermore, GPR75 is
expressed by skeletal muscle, liver and kidney, tissues that are associated with metabolic
diseases, including diabetes mellitus (Ignatov et al., 2006). Additionally, CCL5, the endogenous
ligand of GPR75, is also expressed by islets. Thus, if this novel and atypical chemokine receptor
was expressed by islets it may lead to elevations in intracellular calcium and insulin secretion
through Gαq coupling. Additionally, T2DM is also associated with a reduction in beta cell mass
and as overexpression of this receptor has been implicated in enhanced cell survival (Ignatov et
al., 2006). It is possible that activation of GPR75 on beta cells may enhance beta cell survival to
maintain or improve beta cell mass.
The aims of this chapter were to confirm CCL5 expression by islets, to identify CCL5 receptor
mRNA, including GPR75, expression in mouse and human islets and to determine the cellular
localisation of both CCL5 and GPR75 in mouse and human islets.

Chapter 3: Expression of CCL5 and its receptors by islet cells
105
3.2: Methods
3.2.1: RT-PCR
To determine mRNA expression RNAs isolated from MIN6 beta cells, mouse islets, mouse
acinar cells, human islets, human heart and PANC-1 cells, which is an epithelioid cell line from
a human pancreatic carcinoma of ductal cell origin and is representative of a human exocrine
cell line (Lieber et al., 1975), were reverse transcribed to cDNA (50µg/µl) as mentioned earlier
(section 2.3.1 and section 2.3.3). These were amplified either by RT-PCR or qRT-PCR,
respectively, using primers that were designed to detect target sequences of interest. PCR
amplicons were visualised by electrophoretic separation of PCR products on 1.8% or 2%
agarose gels stained with 0.5µg/ml ethidium bromide. Amplicons of interest were extracted,
purified and sequenced (section 2.3.5) to determine nucleotide homologies to those of the target
sequences.
3.2.2: Western blotting
Extracts were obtained from MIN6 beta cells, mouse islets and human islets (section 2.4.1) and
protein levels were quantified using the BCA method (section 2.4.2). Proteins within extracts
were separated by SDS-PAGE (section 2.4.3) before being transferred to PVDF membranes by
western blotting. The blots were immunoprobed with a rabbit polyclonal GPR75 antibody (1:50
dilution) and immunoreactive proteins were detected by ECL (section 2.4.4).
3.2.3: Chromogenic and fluorescent immunohistochemistry
Fixed C57BL/6 mouse and human pancreatic sections were initially deparaffinised and
gradually dehydrated before undergoing antigen retrieval by heating tissue sections in a pressure
cooker pot for 8-15 minutes in citric acid solution (10mM, pH6) until boiling point (section
2.4.5). The tissue sections were then immunoprobed for proteins of interest using primary
antibodies for CCL5 and GPR75 (Table 21), before being detected either by a chromogenic
detection method (section 2.4.5a) or by a fluorescent detection method involving fluorophore-
conjugated antibodies (section 2.4.5b and Table 22). The same sections were immunoprobed
for insulin, glucagon or somatostatin (Table 21) before being immunostained with fluorescent-
conjugated secondary antibodies (Table 22).

Chapter 3: Expression of CCL5 and its receptors by islet cells
106
3.3: Results
3.3.1: Detection of CCL5 mRNA in MIN6 beta cells, and mouse and human islets
RT-PCR analysis identified mRNA expression of the predicted CCL5 185bp amplicon in the
predicted mouse acinar and islet cDNA preparations (Figure 20). CCL5 mRNA was also
detected in the mouse hypothalamus cDNA preparations (Figure 20), which served as a positive
control. An amplicon of the predicted 185bp representing CCL5 was not detected when using
MIN6 beta cell cDNA preparations as the template (Figure 20). As expected no products were
detected in the non-template control, which consisted of molecular grade water (Figure 20). A
150bp amplicon representative of CCL5 was detected when human heart cDNA was used as a
template, which served as a positive control (Figure 21). In addition, human islet and PANC-1
cell cDNAs also produced an amplicon of the correct size, but no products were detected in the
non-template control, which consisted of molecular grade water (Figure 21).
Figure 20: Ethidium bromide stained 1.8% agarose gel showing CCL5 mRNA expression using
hypothalamus (positive control), acinar cells, mouse islet and MIN6 beta cell cDNAs. An amplicon of the
predicted size of 185bp was detected in all cDNA preparations except MIN6 β-cell cDNAs. No products
were detected in the non-template preparation (molecular grade water), which served as a negative
control.
Mar
ker
Hyp
oth
alam
us
Aci
nar
Wat
er
Isle
t
MIN
6 b
eta
cell
185bp

Chapter 3: Expression of CCL5 and its receptors by islet cells
107
Figure 21: Ethidium bromide stained 1.8% agarose gel showing CCL5 mRNA expression using human
heart, PANC-1cells and islet cDNAs. An amplicon of the predicted size of 150bp was detected in all
cDNA preparations, but not in the non-template preparation (molecular grade water), which served as a
negative control.
Mar
ker
Hea
rt
Hum
an is
let
Wat
er
PA
NC
-1
150bp

Chapter 3: Expression of CCL5 and its receptors by islet cells
108
3.3.2: Protein localisation of CCL5 in mouse and human islets
Since PCR amplifications indicated that mouse and human islets expressed CCL5 mRNA,
further experiments were carried out to identify the cellular localisation of this protein within
islet (section 3.3.1) using a signal amplification approach involving streptavidin-conjugated
horseradish peroxidase/biotin-with chromagen DAB. Fixed mouse pancreas sections were
exposed to an antibody directed against CCL5 (Table 21) and immunoreactive proteins were
detected. It was evident that CCL5 was expressed at the periphery of mouse islets with no
expression at the core of the islets Figure 22, suggesting CCL5 was expressed by non-beta cells,
which was consistent with the observation that CCL5 mRNA was not detected in MIN6 beta
cells (Figure 20). Consecutive sections were immunoprobed in the absence of the CCL5
antibody, which served as a negative control, and this confirmed there was no non-specific
immunoreactivity associated with the use of the biotin/HRP/DAB detection system (Figure 22:
right panel).
The use of fluorescent-conjugated secondary antibodies, which allowed immunolocalisation of
CCL5 and islets hormones on the same pancreas sections, using fluorescent-conjugated
antibodies, confirmed CCL5 did not co-express with insulin in beta cells at the core of the islet
(Figure 23), which was consistent with the observation using a chromogenic detection method
(Figure 22). However, CCL5 did co-localise with glucagon secreting alpha cells at the periphery
of mouse islets, as evidenced by the yellow/orange regions following merging of the images in
Figure 24. Furthermore, CCL5 also did not co-express with somatostatin secreting delta cells
(Figure 25). Consecutive mouse pancreas sections were immunoprobed in the absence of the
CCL5 antibody, which served as a negative control, and this indicated that there was no
evidence of any non-specific immunoreactivity associated with the observed CCL5 expression
in mouse islets (Figure 26). Similar immunohistochemical analyses of human pancreas sections
indicated that the expression profile of CCL5 within human islets was distinct from that seen in
mouse islets. Thus, immunoprobing of fixed human pancreas sections with CCL5 antibodies
detected CCL5 expression in both insulin-secreting beta cells (Figure 27) and glucagon-secreting
alpha cells (Figure 28). No co-expression was observed with somatostatin-secreting delta cells
(Figure 29), as observed in mouse islets.

Chapter 3: Expression of CCL5 and its receptors by islet cells
109
Figure 22: Chromogenic staining of CCL5 expression in mouse islets. Paraffin-embedded mouse
pancreas sections were immunoprobed with an antibody directed against CCL5 (1:10 dilution).
Immunoreactivity was detected using an HRP-conjugated secondary antibody, which indicated that CCL5
was expressed by cells at the periphery of the mouse islet (Left panel). A consecutive section was stained
with an HRP-conjugated secondary antibody only, which served as negative control (Right panel). These
sections were 7µm thick and images were taken at x20 magnification.

Chapter 3: Expression of CCL5 and its receptors by islet cells
110
Figure 23: Fluorescent staining of CCL5 and insulin in mouse islets. Paraffin embedded mouse
pancreas sections were immunoprobed with a CCL5 polyclonal goat IgG antibody, which was
subsequently tagged with an AlexaFluor488® anti-goat fluorescent conjugated antibody (Left panel).
This was followed by incubating the pancreas sections with an insulin polyclonal guinea pig antibody and
then subsequently stained with an AlexaFluor594® anti guinea-pig antibody (Middle panel). Both images
were merged to detect for protein co-localisation (Right panel). These sections were 7µm thick and
images were taken at x20 magnification.
Figure 24: Fluorescent staining of CCL5 and glucagon in mouse islets. Paraffin embedded mouse
pancreas sections were immunoprobed with a CCL5 polyclonal goat IgG antibody, which was
subsequently tagged with an AlexaFluor488® anti-goat fluorescent conjugated antibody (Left panel).
This was followed by incubating the pancreas sections with a glucagon monoclonal mouse antibody and
then subsequently stained with an AlexaFluor594® anti-mouse antibody (Middle panel). Both images
were merged to detect for protein co-localisation Yellow/orange areas indicate co-localisation (Right
panel). These sections were 7µm thick and images were taken at x20 magnification.
CCL5 Merged Insulin
CCL5 Merged Glucagon
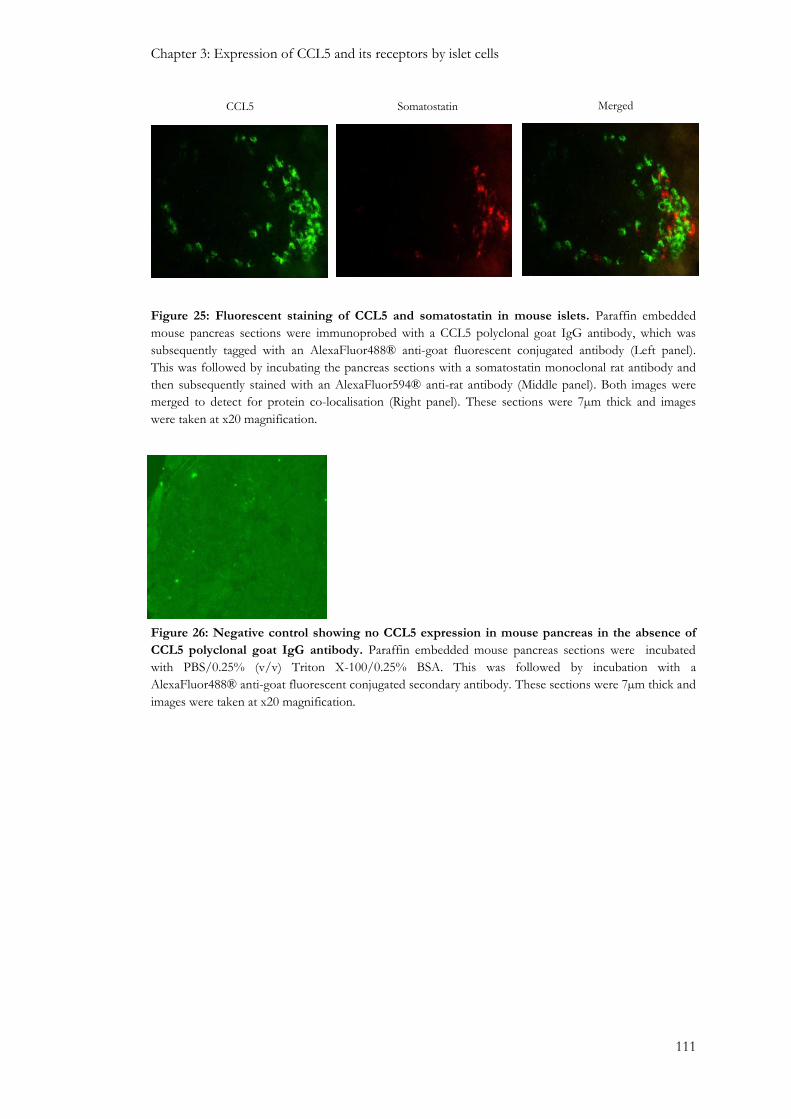
Chapter 3: Expression of CCL5 and its receptors by islet cells
111
Figure 25: Fluorescent staining of CCL5 and somatostatin in mouse islets. Paraffin embedded
mouse pancreas sections were immunoprobed with a CCL5 polyclonal goat IgG antibody, which was
subsequently tagged with an AlexaFluor488® anti-goat fluorescent conjugated antibody (Left panel).
This was followed by incubating the pancreas sections with a somatostatin monoclonal rat antibody and
then subsequently stained with an AlexaFluor594® anti-rat antibody (Middle panel). Both images were
merged to detect for protein co-localisation (Right panel). These sections were 7µm thick and images
were taken at x20 magnification.
Figure 26: Negative control showing no CCL5 expression in mouse pancreas in the absence of
CCL5 polyclonal goat IgG antibody. Paraffin embedded mouse pancreas sections were incubated
with PBS/0.25% (v/v) Triton X-100/0.25% BSA. This was followed by incubation with a
AlexaFluor488® anti-goat fluorescent conjugated secondary antibody. These sections were 7µm thick and
images were taken at x20 magnification.
CCL5 Merged Somatostatin

Chapter 3: Expression of CCL5 and its receptors by islet cells
112
Figure 27: Fluorescent staining of CCL5 and insulin in human islets. Paraffin embedded human
pancreas sections were immunoprobed with a CCL5 polyclonal goat IgG antibody, which was
subsequently tagged with an AlexaFluor488® anti-goat fluorescent conjugated antibody (Left panel).
This was followed by incubating the pancreas sections with an insulin polyclonal guinea pig antibody and
then subsequently stained with an AlexaFluor594® anti guinea-pig antibody (Middle panel). Both images
were merged to detect for protein co-localisation. Yellow/orange areas indicate co-localisation. (Right
panel). These sections were 7µm thick and images were taken at x20 magnification.
Figure 28: Fluorescent staining of CCL5 and glucagon in human islets. Paraffin embedded human
pancreas sections were immunoprobed with a CCL5 polyclonal goat IgG antibody, which was
subsequently tagged with an AlexaFluor488® anti-goat fluorescent conjugated antibody (Left panel).
This was followed by incubating the pancreas sections with a glucagon monoclonal mouse antibody and
then subsequently stained with an AlexaFluor594® anti-mouse antibody (Middle panel). Both images
were merged to detect for protein co-localisation Yellow/orange areas indicate co-localisation (Right
panel). These sections were 7µm thick and images were taken at x20 magnification.
CCL5 Merged Insulin
CCL5 Merged Glucagon

Chapter 3: Expression of CCL5 and its receptors by islet cells
113
Figure 29: Fluorescent staining of CCL5 and somatostatin in human islets. Paraffin embedded
human pancreas sections were immunoprobed with a CCL5 polyclonal goat IgG antibody, which was
subsequently tagged with an AlexaFluor488® anti-goat fluorescent conjugated antibody (Left panel). This
was followed by incubating the pancreas sections with a somatostatin monoclonal rat antibody and then
subsequently stained with an AlexaFluor594® anti-rat antibody (Middle panel). Both images were merged
to detect for protein co-localisation (Right panel). These sections were 7µm thick and images were taken
at x20 magnification.
CCL5 Merged Somatostatin

Chapter 3: Expression of CCL5 and its receptors by islet cells
114
3.3.3: Detection of CCL5 receptor mRNAs in MIN6 beta-cells, and mouse and human
islets.
Confirmation of CCL5 mRNA and protein expression in mouse and human islets led us to
investigate whether mRNAs for the CCL5 receptors GPR75, CCR1, CCR3 and CCR5 were
expressed by mouse and human islets and by MIN6 beta cells. mRNAs encoding these
receptors were detected by qRT-PCR analysis, which revealed that GPR75 was the most
abundantly expressed CCL5 receptor in mouse islets (5.4% of GAPDH expression) compared
to the very low mRNA expression of CCR1, CCR3 and CCR5 (<0.0002%, 0.60%, 0.24% of
GAPDH expression, respectively), Figure 30. A similar expression profile was observed in
human islets, which revealed that GPR75 mRNA was the most abundantly expressed CCL5
receptor (2.5% of GAPDH expression), compared to the low or non-existent levels of CCR1,
CCR3 and CCR5 (0.13%, 0.003%, 0% of GAPDH expression, respectively), Figure 31.
GPR75 mRNA expression was also confirmed in mouse islets and MIN6 beta cells by a
standard RT-PCR approach by the detection of a 204bp amplicon, which was of the predicted
size for the primers used. No amplicon was detected in the non-template control, which
contained molecular grade water only. Furthermore, the cDNA amplicons were extracted and
pooled together for sequencing, which revealed 99% sequence homology to that of the
predicted nucleotide sequence of mouse GPR75 (Figure 32). A predicted amplicon of 261bp
representative of GPR75 mRNA was identified in human islet and PANC-1 cells. GPR75
mRNA was also detected in human heart tissue, which served as a positive control, and no
amplicon was observed in the non-template control. The amplicons were subsequently
extracted and pooled together from human islet and PANC-1 cell cDNA preparations before
being sequenced. This revealed a 99% sequence homology to that of the predicted nucleotide
sequence of human GPR75 (Figure 33). Standard RT-PCR revealed that the mRNA expression
profile of CCL5 receptors corroborated with data from qRT-PCR experiments. CCR1 mRNAs
were detected in human islet cDNA preparations by detecting a 155bp amplicon. No amplicon
was detected in the non-template control (Figure 34). CCR3 mRNAs were also detected in
MIN6 beta cells, mouse islets and human islets. An 181bp amplicon representing CCR3 was
detected in MIN6 beta cells and mouse islets with no detection observed in the non-template
control. Sequencing of the extracted amplicon revealed 100% sequence homology to that of the
predicted nucleotide sequence of CCR3 in mouse (Figure 35). CCR5 mRNAs were also
detected in MIN6 beta cells and mouse islets by detecting a 168bp amplicon, which was further
confirmed by sequencing of these amplicons, which revealed 100% sequence homology to that
of the predicted nucleotide sequence of CCR5 in mouse. No amplicon was detected in the non-
template control (Figure 36).

Chapter 3: Expression of CCL5 and its receptors by islet cells
115
.
Figure 30: mRNA expression of CCL5 receptors by mouse islets. Quantification of CCL5 receptor
mRNA in mouse islets, expressed as a percentage of GAPDH mRNA levels in the same samples; values
are means + SEM; n=3, **p<0.01 vs GPR75.
Figure 31: mRNA expression of CCL5 receptors by human islets. Quantification of CCL5 receptor
mRNA in human islets, expressed as a percentage of GAPDH mRNA levels in the same samples; values
are means + SEM; n=3, **p<0.01 vs GPR75.
** **
**
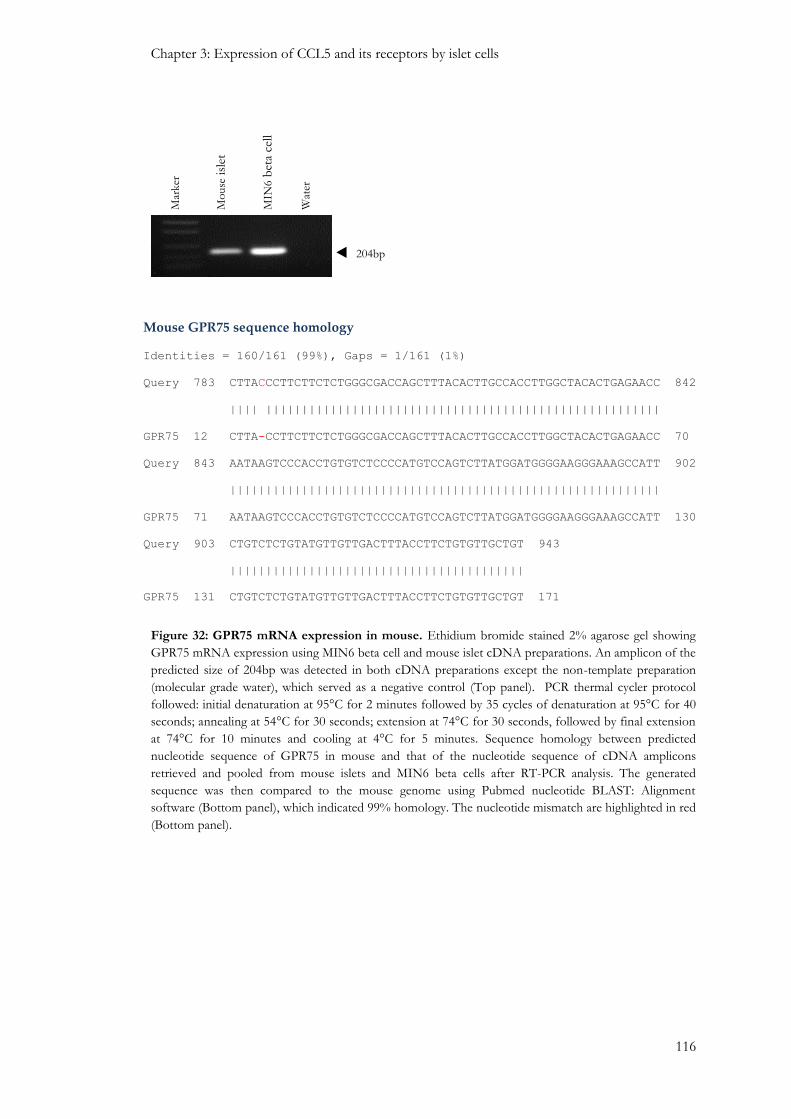
Chapter 3: Expression of CCL5 and its receptors by islet cells
116
Figure 32: GPR75 mRNA expression in mouse. Ethidium bromide stained 2% agarose gel showing
GPR75 mRNA expression using MIN6 beta cell and mouse islet cDNA preparations. An amplicon of the
predicted size of 204bp was detected in both cDNA preparations except the non-template preparation
(molecular grade water), which served as a negative control (Top panel). PCR thermal cycler protocol
followed: initial denaturation at 95°C for 2 minutes followed by 35 cycles of denaturation at 95°C for 40
seconds; annealing at 54°C for 30 seconds; extension at 74°C for 30 seconds, followed by final extension
at 74°C for 10 minutes and cooling at 4°C for 5 minutes. Sequence homology between predicted
nucleotide sequence of GPR75 in mouse and that of the nucleotide sequence of cDNA amplicons
retrieved and pooled from mouse islets and MIN6 beta cells after RT-PCR analysis. The generated
sequence was then compared to the mouse genome using Pubmed nucleotide BLAST: Alignment
software (Bottom panel), which indicated 99% homology. The nucleotide mismatch are highlighted in red
(Bottom panel).
Mar
ker
Mo
use
isle
t
MIN
6
Wat
er
204bp
a
Mouse GPR75 sequence homology
Identities = 160/161 (99%), Gaps = 1/161 (1%)
Query 783 CTTACCCTTCTTCTCTGGGCGACCAGCTTTACACTTGCCACCTTGGCTACACTGAGAACC 842
|||| |||||||||||||||||||||||||||||||||||||||||||||||||||||||
GPR75 12 CTTA-CCTTCTTCTCTGGGCGACCAGCTTTACACTTGCCACCTTGGCTACACTGAGAACC 70
Query 843 AATAAGTCCCACCTGTGTCTCCCCATGTCCAGTCTTATGGATGGGGAAGGGAAAGCCATT 902
||||||||||||||||||||||||||||||||||||||||||||||||||||||||||||
GPR75 71 AATAAGTCCCACCTGTGTCTCCCCATGTCCAGTCTTATGGATGGGGAAGGGAAAGCCATT 130
Query 903 CTGTCTCTGTATGTTGTTGACTTTACCTTCTGTGTTGCTGT 943
|||||||||||||||||||||||||||||||||||||||||
GPR75 131 CTGTCTCTGTATGTTGTTGACTTTACCTTCTGTGTTGCTGT 171
204bp
Mo
use
isl
et
Wat
er
MIN
6 b
eta
cell
Mar
ker
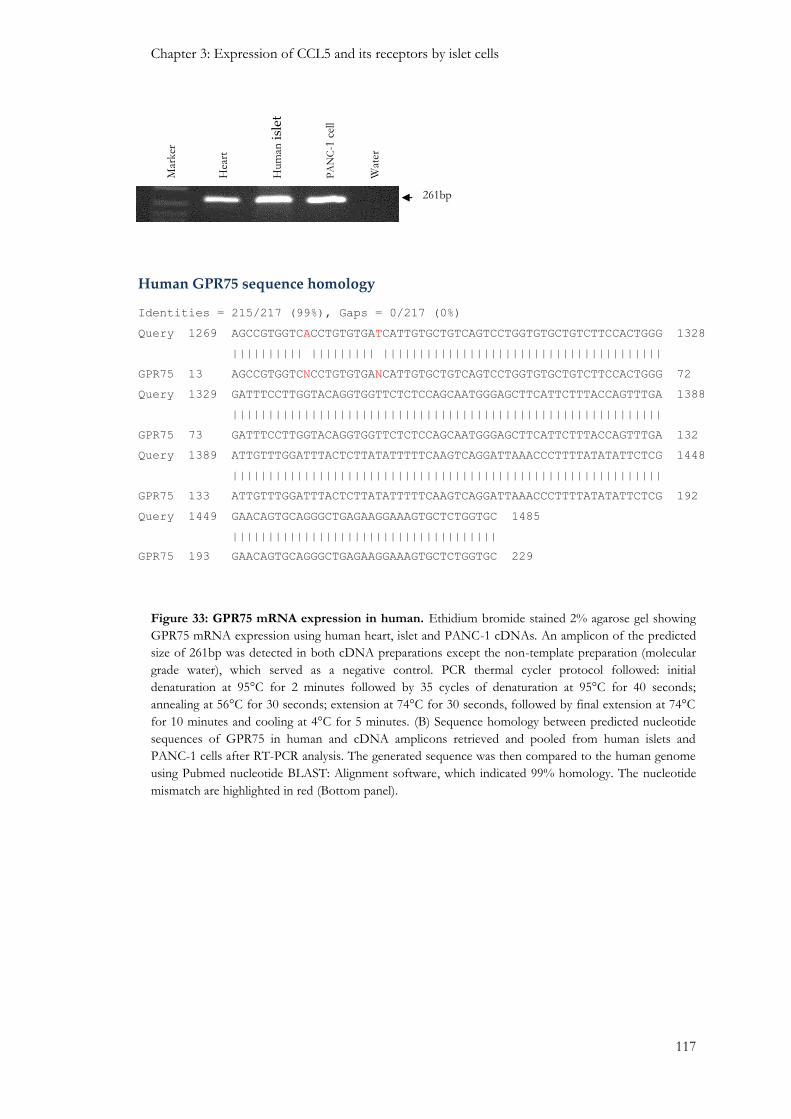
Chapter 3: Expression of CCL5 and its receptors by islet cells
117
Figure 33: GPR75 mRNA expression in human. Ethidium bromide stained 2% agarose gel showing
GPR75 mRNA expression using human heart, islet and PANC-1 cDNAs. An amplicon of the predicted
size of 261bp was detected in both cDNA preparations except the non-template preparation (molecular
grade water), which served as a negative control. PCR thermal cycler protocol followed: initial
denaturation at 95°C for 2 minutes followed by 35 cycles of denaturation at 95°C for 40 seconds;
annealing at 56°C for 30 seconds; extension at 74°C for 30 seconds, followed by final extension at 74°C
for 10 minutes and cooling at 4°C for 5 minutes. (B) Sequence homology between predicted nucleotide
sequences of GPR75 in human and cDNA amplicons retrieved and pooled from human islets and
PANC-1 cells after RT-PCR analysis. The generated sequence was then compared to the human genome
using Pubmed nucleotide BLAST: Alignment software, which indicated 99% homology. The nucleotide
mismatch are highlighted in red (Bottom panel).
Human GPR75 sequence homology
Identities = 215/217 (99%), Gaps = 0/217 (0%)
Query 1269 AGCCGTGGTCACCTGTGTGATCATTGTGCTGTCAGTCCTGGTGTGCTGTCTTCCACTGGG 1328
|||||||||| ||||||||| |||||||||||||||||||||||||||||||||||||||
GPR75 13 AGCCGTGGTCNCCTGTGTGANCATTGTGCTGTCAGTCCTGGTGTGCTGTCTTCCACTGGG 72
Query 1329 GATTTCCTTGGTACAGGTGGTTCTCTCCAGCAATGGGAGCTTCATTCTTTACCAGTTTGA 1388
||||||||||||||||||||||||||||||||||||||||||||||||||||||||||||
GPR75 73 GATTTCCTTGGTACAGGTGGTTCTCTCCAGCAATGGGAGCTTCATTCTTTACCAGTTTGA 132
Query 1389 ATTGTTTGGATTTACTCTTATATTTTTCAAGTCAGGATTAAACCCTTTTATATATTCTCG 1448
||||||||||||||||||||||||||||||||||||||||||||||||||||||||||||
GPR75 133 ATTGTTTGGATTTACTCTTATATTTTTCAAGTCAGGATTAAACCCTTTTATATATTCTCG 192
Query 1449 GAACAGTGCAGGGCTGAGAAGGAAAGTGCTCTGGTGC 1485
|||||||||||||||||||||||||||||||||||||
GPR75 193 GAACAGTGCAGGGCTGAGAAGGAAAGTGCTCTGGTGC 229
Mar
ker
Hea
rt
Hum
an i
slet
Wat
er
PA
NC
-1 c
ell
261bp

Chapter 3: Expression of CCL5 and its receptors by islet cells
118
Figure 34: CCR1 mRNA expression by human islets. An amplicon of the correct size representing
CCR1 (155bp) was detected in human islet cDNA. No amplicon was detected in the non-template
control, which contained molecular grade water. PCR thermal cycler protocol followed: initial
denaturation at 95°C for 2 minutes followed by 35 cycles of denaturation at 95°C for 40 seconds;
annealing at 57°C for 30 seconds; extension at 74°C for 30 seconds. This was followed by final extension
at 74°C for 10 minutes and cooling at 4°C for 5 minutes. PCR products were run on an ethidium
bromide stained 2% agarose gel and a pBluescript II SK+-Hpa II digest marker was used to determine
amplicon sizes.
155bp
Hum
an isl
et
Wat
er
Mar
ker

Chapter 3: Expression of CCL5 and its receptors by islet cells
119
Figure 35: CCR3 mRNA expression by mouse islets and MIN6 beta cells. An amplicon of the
correct size representing CCR3 (181bp) was detected in mouse islet and MIN6 beta cell cDNA
preparations. No amplicon was detected in the non-template control, which contained molecular grade
water. PCR thermal cycler protocol followed: initial denaturation at 95°C for 2 minutes followed by 35
cycles of denaturation at 95°C for 40 seconds; annealing at 60°C for 30 seconds; extension at 74°C for 30
seconds, followed by final extension at 74°C for 10 minutes and cooling at 4°C for 5 minutes. PCR
products were run on an ethidium bromide stained 2% agarose gel and a pBluescript II SK+-Hpa II
digest marker was used to determine amplicon sizes (Top panel). Sequence homology between the
predicted nucleotide sequences of CCR3 in mouse and cDNA amplicons retrieved and pooled from
mouse islet and MIN6 beta cells cDNA preparations after RT-PCR. The generated sequence was
compared to the mouse genome using Pubmed nucleotide BLAST: Alignment software, which indicated
100% homology (Bottom panel).
Mouse CCR3 sequence homology
Identities = 117/117 (100%), Gaps = 0/117 (0%)
Query 831 AATGAATATCTTTGGTCTAGCTCTTCCTCTCCTCATTATGGTTATCTGCTACTCAGGAAT 890
||||||||||||||||||||||||||||||||||||||||||||||||||||||||||||
CCR1 35 AATGAATATCTTTGGTCTAGCTCTTCCTCTCCTCATTATGGTTATCTGCTACTCAGGAAT 94
Query 891 CATTAAAACTCTGCTGAGATGTCCCAATAAAAAAAAACACAAGGCCATCCGTCTTAT 947
|||||||||||||||||||||||||||||||||||||||||||||||||||||||||
CCR1 95 CATTAAAACTCTGCTGAGATGTCCCAATAAAAAAAAACACAAGGCCATCCGTCTTAT 151
181bp M
ou
se i
slet
Wat
er
MIN
6 b
eta
cell
Mar
ker

Chapter 3: Expression of CCL5 and its receptors by islet cells
120
Figure 36: CCR5 mRNA expression by mouse islet and MIN6 beta cell cDNA. An amplicon of the
correct size representing CCR5 (168bp) was detected in mouse islet and MIN6 beta cell cDNA
preparations. No amplicon was detected in the non-template control, which contained molecular grade
water. PCR thermal cycler protocol followed: initial denaturation at 95°C for 2 minutes followed by 35
cycles of denaturation at 95°C for 40 seconds; annealing at 59°C for 30 seconds; extension at 74°C for 30
seconds, followed by final extension at 74°C for 10 minutes and cooling at 4°C for 5 minutes. PCR
products were run on an ethidium bromide stained 2% agarose gel and a pBluescript II SK+-Hpa II
digest marker was used to determine amplicon sizes (Top panel). Sequence homology between the
nucleotide sequences of CCR5 and cDNA amplicons retrieved from mouse acinar cells, mouse islets and
MIN6 beta cells after RT-PCR analysis. The generated sequence was compared to the mouse CCR5
genome using Pubmed nucleotide BLAST: Alignment software, which indicated 100% homology
(Bottom panel).
168bp
Mo
use
isl
et
Wat
er
MIN
6 b
eta
cells
Mar
ker
Mouse CCR5 sequence homology
Identities = 120/120 (100%), Gaps = 0/120 (0%)
Query 1028 TTATCTCTCAGTGTTCTTCCGAAAACACATGGTCAAACGCTTTTGCAAACGGTGTTCAAT 1087
||||||||||||||||||||||||||||||||||||||||||||||||||||||||||||
CCR5 25 TTATCTCTCAGTGTTCTTCCGAAAACACATGGTCAAACGCTTTTGCAAACGGTGTTCAAT 84
Query 1088 TTTCCAGCAAGACAATCCTGATCGTGCAAGCTCAGTCTATACCCGATCCACAGGAGAACA 1147
||||||||||||||||||||||||||||||||||||||||||||||||||||||||||||
CCR5 85 TTTCCAGCAAGACAATCCTGATCGTGCAAGCTCAGTCTATACCCGATCCACAGGAGAACA 144

Chapter 3: Expression of CCL5 and its receptors by islet cells
121
3.3.4: Detection of GPR75 proteins and localisation in mouse and human islets.
As previously shown in section 3.3.3, GPR75 mRNA was detected in mouse and human islets
as well as in MIN6 beta cells, using non-quantitative and quantitative RT-PCR. Therefore, it was
important to investigate GPR75 protein expression in islets and beta cells in particular. Western
blot analysis detected a 59kDa protein representative of GPR75 in MIN6 beta cell, mouse islet
and human islet protein extracts (Figure 37). However, western blotting only confirmed GPR75
protein expression in islets but gave no indication as to the localisation of this receptor within
islets. Therefore, non-fluorescent (chromogenic) and fluorescent IHC detection methods were
used to achieve this. In brief, mouse and human pancreas sections were immunoprobed in the
presence of a GPR75 polyclonal rabbit IgG antibody (Figure 38, top panel, left), or in the
absence of GPR75 primary antibodies which served as a negative control (Figure 38, top panel,
right). Immunoreactive proteins were detected by a streptavidin-conjugated horseradish
peroxidase/biotin-based amplification protocol using chromagen DAB (section 2.4.5a) or using
a fluorophore-linked secondary antibody (Figure 38, bottom panel).
GPR75 was abundantly expressed by mouse islets and its central localisation suggested its
presence in beta cells (Figure 38). Fluorescent staining confirmed that GPR75 co-localised with
insulin-secreting beta cells (Figure 39) and further revealed its presence in glucagon-secreting
alpha cells (Figure 40) in mouse islets, but it did not co-localise with somatostatin in delta cells
(Figure 41). Furthermore, GPR75 did not show any immunoreactivity in the surrounding
exocrine pancreas acinar cells (Figure 38 to Figure 41), which suggested that GPR75 was an
islet-specific receptor within the mouse pancreas. Consecutive mouse pancreas sections that
were incubated in the absence of GPR75 antibodies but with a fluorophore-conjugated
secondary antibody, which served as negative control, confirmed there was no non-specific
immunoreactivity associated with the observed GPR75 expression by mouse islets (Figure 42).
In human islets an identical GPR75 expression profile was observed. Thus, chromogenic
staining revealed that GPR75 was expressed throughout the islet, most likely in beta cells
(Figure 43). This was confirmed by, fluorescent IHC staining, which indicates that GPR75 was
co-expressed with insulin in beta cells (Figure 44) and with glucagon in alpha cells (Figure 45),
but GPR75 did not co-localise with somatostatin in the delta cell population (Figure 46).
Furthermore, no GPR75 expression was observed in the exocrine pancreas, which again
suggested that GPR75 is an islet-specific GPCR within the human pancreas (Figure 43 to Figure
46). Consecutive human pancreas sections that were incubated in the absence of GPR75
antibodies but in the presence of a fluorophore-conjugated secondary antibody, which served as
negative controls, confirmed there was no non-specific immunoreactivity associated with the
observed GPR75 expression by human islets (Figure 47).

Chapter 3: Expression of CCL5 and its receptors by islet cells
122
Figure 37: Detection of GPR75 proteins in MIN6 beta cell, mouse and human islet protein extracts. 50-
60μg protein samples were loaded onto 10% polyacrylamide gels and immunoreactive proteins were
detected by ECL. The proteins were transferred to a PVDF membrane before a GPR75 anti-rabbit
antibody (1:50) followed by incubation with a horseradish peroxidase-conjugated secondary antibody
(1:5000), which was used to identify GPR75 expression in MIN6 beta cell, mouse and human islet protein
extracts by the detection of a 59kDa immunoreactive protein.. The protein size was determined by
comparing protein band migration to a full-range of rainbow molecular weight markers.
Mo
use
isl
et
Hum
an isl
et
MIN
6 b
eta
cell
59kDa

Chapter 3: Expression of CCL5 and its receptors by islet cells
123
Figure 38: Chromogenic staining showing GPR75 and insulin expression by mouse islets.
Paraffin embedded mouse pancreas sections were immunoprobed in the absence (negative control) or
presence of a GPR75 polyclonal rabbit IgG antibody (1:20 dilution). The same sections were then
immunoprobed with a universal biotinylated link antibody and subsequently detected using an HRP-
conjugated secondary antibody. These sections were briefly stained with haemotoxylin (Top panel) or
immunoprobed with an insulin polyclonal guinea pig antibody, and subsequently stained with an
AlexaFluor594® anti guinea-pig antibody (Bottom panel). The sections were cut 7µm thick and images
taken at x20 magnification.
GPR75 Merged Insulin
GPR75 Negative control

Chapter 3: Expression of CCL5 and its receptors by islet cells
124
Figure 39: Fluorescent staining of GPR75 and insulin in mouse islets. Paraffin embedded mouse
pancreas sections were immunoprobed with a GPR75 polyclonal rabbit IgG antibody, which was
subsequently tagged with an AlexaFluor488® anti-rabbit fluorescent conjugated antibody (Left panel).
This was followed by incubating the pancreas sections with an insulin polyclonal guinea pig antibody and
subsequently stained with an AlexaFluor594® anti guinea-pig antibody (Middle panel). Both images were
merged to observe protein co-localisation. Yellow/orange areas indicate co-localisation (Right panel).
Sections were cut 7µm thick and images taken at x20 magnification.
Figure 40: Fluorescent staining of GPR75 and glucagon in mouse islets. Paraffin embedded mouse
pancreas sections were immunoprobed with a GPR75 polyclonal rabbit IgG antibody, which was
subsequently tagged with an AlexaFluor488® anti-rabbit fluorescent conjugated antibody (Left panel).
This was followed by incubating the pancreas sections with a glucagon monoclonal mouse antibody and
subsequently stained with an AlexaFluor594® anti-mouse antibody (Middle panel). Both images were
merged to observe any protein co-localisation Yellow/orange areas indicate co-localisation (Right panel).
Sections were cut 7µm thick and images taken at x20 magnification.
GPR75 Merged Insulin
GPR75 Merged Glucagon

Chapter 3: Expression of CCL5 and its receptors by islet cells
125
Figure 41: Fluorescent staining of GPR75 and somatostatin in mouse islets. Paraffin embedded
mouse pancreas sections were immunoprobed with a GPR75 polyclonal rabbit IgG antibody, which was
subsequently tagged with an AlexaFluor488® anti-rabbit fluorescent conjugated antibody (Left panel).
This was followed by incubating the pancreas sections with a somatostatin monoclonal rat antibody and
subsequently stained with an AlexaFluor594® anti-rat antibody (Middle panel). Both images were merged
to observe any protein co-localisation (Right panel). Sections were cut 7µm thick and images taken at x20
magnification.
Figure 42: Negative control showing no GPR75 expression in mouse pancreas in the absence of
GPR75 polyclonal rabbit IgG antibody. Paraffin embedded mouse pancreas sections were incubated
with PBS/0.25% (v/v) Triton X-100/0.25% BSA. This was followed by incubation with an
AlexaFluor488® anti-rabbit fluorescent conjugated secondary antibody. Sections were cut 7µm thick and
images taken at x20 magnification.
GPR75 Merged Somatostatin

Chapter 3: Expression of CCL5 and its receptors by islet cells
126
Figure 43: Chromogenic staining showing GPR75 and insulin expression by human islets.
Paraffin embedded human pancreas sections were immunoprobed with a GPR75 polyclonal rabbit IgG
antibody (1:20 dilution). The same sections were then immunoprobed with a universal biotinylated link
antibody and subsequently detected using an HRP-conjugated secondary antibody. The same sections
were immunoprobed with an insulin polyclonal guinea pig antibody and subsequently stained with an
AlexaFluor594® anti guinea-pig antibody. The sections were cut 7µm thick and images taken at x20
magnification.
GPR75 Merged Insulin

Chapter 3: Expression of CCL5 and its receptors by islet cells
127
Figure 44: Fluorescent staining of GPR75 and insulin in human islets. Paraffin embedded human
pancreas sections were immunoprobed with a GPR75 polyclonal rabbit IgG antibody, which was
subsequently tagged with an AlexaFluor488® anti-rabbit fluorescent conjugated antibody (Left panel).
This was followed by incubating the pancreas sections with an insulin polyclonal guinea pig antibody and
then subsequently stained with an AlexaFluor594® anti guinea-pig antibody (Middle panel). Both images
were merged to observe any protein co-localisation. Yellow/orange areas indicate co-localisation (Right
panel). Sections were cut 7µm thick and images taken at x20 magnification.
Figure 45: Fluorescent staining of GPR75 and glucagon in human islets. Paraffin embedded human
pancreas sections were immunoprobed with a GPR75 polyclonal rabbit IgG antibody, which was
subsequently tagged with an AlexaFluor488® anti-rabbit fluorescent conjugated antibody (Left panel).
This was followed by incubating the pancreas sections with a glucagon monoclonal mouse antibody and
then subsequently stained with an AlexaFluor594® anti-mouse antibody (Middle panel). Both images
were merged to observe any protein co-localisation Yellow/orange areas indicate co-localisation (Right
panel). Sections were cut 7µm thick and images taken at x20 magnification.
GPR75 Merged Insulin
GPR75 Merged Glucagon

Chapter 3: Expression of CCL5 and its receptors by islet cells
128
Figure 46: Fluorescent staining of GPR75 and somatostatin in human islets. Paraffin embedded
human pancreas sections were immunoprobed with a GPR75 polyclonal rabbit IgG antibody, which was
subsequently tagged with an AlexaFluor488® anti-rabbit fluorescent conjugated antibody (Left panel).
This was followed by incubating the pancreas sections with a somatostatin monoclonal rat antibody and
then subsequently stained with an AlexaFluor594® anti-rat antibody (Middle panel). Both images were
merged to observe any protein co-localisation (Right panel). Sections were cut 7µm thick and images
taken at x20 magnification.
Figure 47: Negative control showing no GPR75 expression in human pancreas in the absence of
GPR75 polyclonal rabbit IgG antibody. Paraffin embedded mouse pancreas sections were incubated
with PBS/0.25% (v/v) Triton X-100/0.25% BSA. This was followed by incubation with an
AlexaFluor488® anti-rabbit fluorescent conjugated secondary antibody. Sections were cut 7µm thick and
images taken at x20 magnification.
GPR75 Merged Somatostatin

Chapter 3: Expression of CCL5 and its receptors by islet cells
129
3.3.5: Discussion
To date, very little is known about GPR75 and there have been no reports implicating it in the
development of, or the protection from, disease states. Circumstantial evidence has so far
indicated that GPR75 may be involved in protecting neuronal cells in Alzheimer patients, but
experiments have only been carried out using mouse models (Ignatov et al., 2006). Apart from
this there has been no other publications associating physiological function with GPR75
activation in primary tissues, even though mRNA encoding this receptor is expressed in a wide
variety of mouse tissues, including those that have been implicated in metabolic diseases, such
as liver, skeletal muscle and kidney (Ignatov et al., 2006, Sauer, 2001). It has been reported that
CCL5, which is the endogenous ligand for GPR75, is also expressed in islets of NOD mice
(Carvalho-Pinto et al., 2004), which show spontaneous development of T1DM due to the attack
and destruction of beta cells by activated immune cells (Kachapati et al., 2012, King and
Sarvetnick, 2011). Therefore, this chapter focused on GPR75 and CCL5 expression by MIN6
beta cells, mouse islets and human islets, which were used as cellular models for functional
analyses later on in this thesis.
CCL5 is expressed by a variety of cell types such as endothelial cells, platelets, T-cells, and
neurons (Johnstone et al., 1999) and it has also been detected in islets in BALB/c and NOD
mice (Carvalho-Pinto et al., 2004). It has been reported that chronic low-grade inflammation
normally precedes T2DM development by several years (Pradhan et al., 2001, Pickup, 2004)
along with the up-regulation of chemokines, which have also been implicated in the
development of T2DM. It has been reported that the circulating concentration of CCL5
significantly increased by 42% in T2DM patients from 19.93ng/ml to 28.29ng/ml (Herder et al.,
2005). Furthermore, CCL5 has also been associated with an increase in T2DM incidence
(Nomura et al., 2000) and genetic polymorphisms associated with the CCL5 gene are associated
with the development of DM (Jeong et al., 2010). Thus, the association of CCL5 with DM
complications led to the investigation of the expression of CCL5 at the mRNA and protein level
in mouse and human islets as well as MIN6 beta cells.
CCL5 mRNA was detected in mouse islets but not in MIN6 beta cells (Figure 20), and
assessment of CCL5 protein expression by mouse islets revealed that it did not co-localise to
beta cells (Figure 23), which was consistent with the absence of CCL5 mRNA expression in
MIN6 beta cells. However, CCL5 was expressed by alpha cells of mouse islets (Figure 24). In
contrast, in human islets CCL5 was present in beta cells (Figure 27) and also in alpha cells
(Figure 28). Furthermore, CCL5 mRNA was also detected in mouse acinar cells (Figure 20) and
the human PANC-1 exocrine cell line (Figure 21) but there was no evidence of its expression in
mouse and human exocrine cells of pancreas sections immunoprobed with an antibody directed
against CCL5. This may be explained by the CCL5 gene being transcribed but not translated in

Chapter 3: Expression of CCL5 and its receptors by islet cells
130
the exocrine pancreas or that the CCL5 protein is expressed at such low levels, that it is
undetectable by IHC methods used in this study.
GPR75 mRNA was identified as the most abundantly expressed CCL5 receptor in mouse and
human islets, whereas, conventional CCL5 receptor mRNAs (CCR1, CCR3 and CCR5) were
detected at very low or non-existent levels in mouse and human islets, with varied expression
between the two species (Figure 30 and Figure 31). The low expression of traditional CCL5
receptors observed in islets may be explained by the fact that healthy islets were used for
experiments throughout this thesis, with evidence suggesting chemokine receptor expression
can be up regulated in certain disease states such as obesity, which is characterised by chronic
low grade inflammation that shows enhanced secretion of inflammatory cytokines and
chemokines (Matter and Handschin, 2007). In addition, mRNA and protein expression of
CCL5 and CCR5 are up-regulated in white adipose tissue of obese humans with metabolic
syndrome (Wu et al., 2007). Similarly, CCR1, CCR3 and CCR5 mRNAs are significantly up-
regulated in adipose tissue of obese patients (Huber et al., 2008). Very little is known about
CCL5 receptor mRNA expression in islets of T2DM patients, but it might be predicted that
conventional CCL5 receptors would be up-regulated in the inflammatory environment, which
might be involved in the islet dysfunction associated with T2DM. Future studies would be of
obvious interest in determining whether expression of CCL5 receptors is modified in islets of
obese and T2DM patients.
mRNA detection methods showed for the first time that GPR75 mRNA was detected in mouse
islets as well as MIN6 beta cells, which demonstrated that GPR75 is a beta cell expressed
receptor (Figure 32). Furthermore, GPR75 mRNA was also detected in human islets and
PANC-1 cells, (Figure 33). This suggested that GPR75 mRNA was not only detectable in
human islets but also in human acinar cells. Protein expression confirmed that GPR75 proteins
were detected in mouse and human islets, consistent with the predicted GPR75 molecular
weight of 59kDa (Figure 37). This was further supported by chromogenic staining experiments,
which revealed abundant GPR75 expression throughout the mouse and human islets (Figure 38
and Figure 43), and co-incubation with insulin (Figure 39 and Figure 44), glucagon (Figure 40
and Figure 45) and somatostatin (Figure 41 and Figure 46) antibodies indicated that it was
expressed by beta cells and alpha cells, but not by delta cells. No GPR75 expression was
observed in human acinar cells even though GPR75 mRNA was detected in PANC-1 exocrine
cells, which suggests that GPR75 might be transcribed by acinar cells but not be translated into
protein or that it may require a particular signal to stimulate GPR75 mRNA translation into
protein. Another explanation could be the low protein expression level of GPR75 in the
exocrine environment, which may not be detectable using current detection methods.

Chapter 3: Expression of CCL5 and its receptors by islet cells
131
CCL5 is secreted by a variety of cells such as T-cells, platelets, endothelial cells and neurons
(Schall et al., 1988, Levy, 2009, Appay and Rowland-Jones, 2001). It has previously been shown
to be expressed by mouse islets (Carvalho-Pinto et al., 2004). So far in this thesis immuno
detection experiments have identified more specifically that CCL5 is expressed by alpha and
beta cell populations. This may suggest that CCL5 is released into the intra-islet environment in
response to an inflammatory insult in order to quickly and efficiently recruit lymphocytes into
the islet. However, this is likely to occur through the activation of Gαi coupled CCR1, CCR3
and/or CCR5 and quantitative PCR experiments have identified that these CCRs are expressed
at very low or undetectable levels in healthy islets. Furthermore, GPR75 is the most abundant
CCL5 receptor in islets and its expression by beta cells strongly suggests that, in healthy islets at
least, CCL5 activation of GPR75 may regulate beta cell function in a non-immunological
environment, which has previously never been identified.
The species difference in CCL5 expression might be explained by different CCL5 modes of
action, with CCL5 activation of GPR75 influencing a possible paracrine signalling mechanism in
mouse islets involving release of CCL5 from alpha cells and activation of GPR75 on alpha and
beta cells whereas in human islets CCL5 could have autocrine and paracrine effects at beta cells
and alpha cells. Mouse islets show evident anatomical subdivisions and they consist of a high
proportion of beta cells ≈80-90%, usually located at the core of the islet, whereas non-beta cells
(alpha cells ≈10-20% and delta cells ≈<10%) are usually located at the islet periphery (Cabrera
et al., 2006). In contrast, human islets retain a lower proportion of beta cells (≈60%) and a
higher proportion of alpha cells (≈30%). Moreover, a larger proportion of beta cells are in close
proximity to non-beta cells, as discussed in section 1.2.1. This may explain why CCL5
expression is limited only to the alpha cell population in mouse islets, as this could be sufficient
to influence beta cell function by activating GPR75, which is expressed by the large number of
beta cells present in the mouse islet and therefore influence beta cell function in a controlled
manner, whereas the broader expression pattern of CCL5 in human islets may be required to
activate GPR75 expressed on beta cells more robustly due to the lower number of beta cells
present in human islets. It is also possible that the species variability in CCL5 expression may
demonstrate an evolutionary adaptation to different diet or calorie intake or other
environmental factors, but further studies are required to support these hypotheses. Therefore,
it is plausible that CCL5 receptor activation in islets may regulate beta cell function and survival
during an inflammatory insult or against infectious agents due to the ability of CCL5 to attract
lymphocytes. However, the CCL5 mode of action on islet function may entirely depend on
whether CCL5 activates either conventional CCL5 receptors or the novel and atypical CCL5
receptor, GPR75. Therefore, the following chapters in this thesis primarily focused on the
functional effects of CCL5 on beta cell and islet function and the possible involvement of
GPR75.

132
Chapter 4: The effect of CCL5 on insulin and glucagon secretion.

Chapter 4: The effect of CCL5 on insulin and glucagon secretion.
133
4.1: Introduction
As demonstrated in the previous chapter, CCL5 is expressed by mouse and human islets.
GPR75 is also abundantly expressed compared to conventional CCL5 receptors in mouse and
human islets. Furthermore, it was determined that GPR75 is specifically expressed by beta cells,
which secrete insulin in response to elevated blood glucose levels, and alpha cells, which secrete
glucagon in response to low blood glucose levels. Therefore, it was important to investigate the
potential effects of CCL5 on islet hormone secretion, which has not been previously studied to
date. However, chemokines have been implicated in the pathogenesis of T2DM and reports
have shown significantly higher circulating concentrations of CCL5 in T2DM patients
compared to healthy control subjects (Nomura et al., 2000, Herder et al., 2005).
Ignatov and colleagues demonstrated that IP3 formation and calcium mobilisation in GPR75
expressing cells were elevated in response to CCL5 (Ignatov et al., 2006), which are typical
hallmarks of receptor association with the Gαq protein that stimulates PLC-mediated hydrolysis
of PIP2. GPCRs that couple to the Gαq protein have been associated with potentiation of
glucose-induced insulin secretion (Sassmann et al., 2010, Amisten et al., 2013, Ahren, 2009).
Activation of Gαq protein coupled receptors results in the activation of PLC, which promotes
IP3 and DAG formation via the hydrolysis of the membrane bound PIP2. IP3 promotes calcium
mobilisation from internal stores and thus elevates cytosolic calcium levels (Burant, 2013),
which is an important signal for promoting the insulin secretory process. For example, GPR40
is activated by free fatty acids to potentiate insulin secretion (Burant, 2013, Itoh et al., 2003) by
primarily signalling through the Gαq-PLC pathway, which stimulates calcium mobilisation from
the endoplasmic reticulum (ER) due to elevations in IP3 formation (Bowe et al., 2009). In
addition, muscarinic (M3) receptor activation by acetylcholine also enhances glucose-induced
insulin secretion (Hauge-Evans et al., 2014, Gautam et al., 2006) through DAG-dependent PKC
activation following PLC cleavage of PIP2 (Jones and Persaud, 1998b). Therefore, identification
that GPR75 is coupled to Gαq protein in CHO cells and is also expressed in mouse and human
islets and in particular by beta cells suggested it was important to investigate the potential novel
role of CCL5 in regulating islet function by mediating islet hormone secretion, which is the
focus of this chapter.

Chapter 4: The effect of CCL5 on insulin and glucagon secretion.
134
4.2: Methods
4.2.1: Insulin and glucagon secretion: Static incubation
MIN6 beta cells, isolated mouse islets and human islets were used for static measurements of
insulin secretion. MIN6 beta cells were seeded at a density of 30,000 cells/well in 96 well plates
and incubated overnight at 37°C (5% CO2/ 95% air) in DMEM (Table 1). MIN6 beta cells were
pre-incubated with a physiological buffer (Table 23) supplemented with 2mM glucose for 2
hours and then treated with 200µl of agents of interest for 1 hour at 37°C (5% CO2/ 95% air).
160µl of supernatant was retrieved and insulin content was quantified by radioimmunoassay
after diluting samples with borate buffer (1:5 dilution).
Islets isolated from ICR mice and human pancreases were incubated overnight at 37°C (5%
CO2/ 95% air) in appropriate media (Table 1). Islets were then pre-incubated with a
physiological buffer (Table 23) supplemented with 2mM glucose at 37°C for 1 hour after which
three or nine islets per replicate for insulin and glucagon secretion experiments, respectively,
were treated with 600µl of agents of interest for 1 hour at 37°C (5% CO2/ 95% air). 450µl of
supernatant was collected and insulin and glucagon release were measured by
radioimmunoassay. For quantifying insulin content samples were diluted (1:5) with borate
buffer, whereas neat samples were used for quantifying glucagon content.
4.2.2: Insulin secretion: Perifusion
Measurement of dynamic insulin secretion from 80-100 isolated mouse and human islets was
carried out by transferring islets into Swinnex chambers containing 1µm pore-size nylon filters
and they were pre-perifused with a physiological buffer (Table 23) supplemented with 2mM
glucose (0.5ml/minute, 70 minutes, 37°C). Islets were then perifused with agents of interest
(section 2.6.2). Perifusate samples were collected every 2 minutes for the duration of the
experiments and insulin released from the islets was measured by radioimmunoassay (section
2.6.3).

Chapter 4: The effect of CCL5 on insulin and glucagon secretion.
135
4.3: Results
4.3.1: Effect of CCL5 on mouse islet hormone secretion
The endogenous expression of CCL5 by mouse islet alpha cells along with the expression of
GPR75 by beta cells and alpha cells suggested the importance of investigating the functional
effects of CCL5 on insulin and glucagon secretion by challenging isolated mouse and human
islets, as well as MIN6 beta cells, with exogenous CCL5.
The effects of exogenous CCL5 on insulin secretion from MIN6 beta cells were determined
prior to experimenting with primary mouse and human islets, due to the limited availability and
cost associated with the use of primary islets. Treatment of MIN6 beta cells with increasing
CCL5 concentrations (0.25nM to 250nM) stimulated insulin secretion by approximately 2-fold
in the presence of 2mM glucose (Figure 48a). Furthermore, 2.5nM CCL5 was also able to
significantly potentiate insulin secretion from MIN6 beta cell by 63% at 20mM glucose (Figure
48b), and a 22% increase in glucose-induced insulin secretion was observed with 25nM CCL5 at
20mM glucose (Figure 48c). The identification of a stimulatory effect of CCL5 on insulin
secretion from MIN6 beta cells suggested that CCL5 may also stimulate insulin release from
mouse islets.
Static incubation experiments using isolated mouse islets demonstrated 25fM to 25nM CCL5
significantly potentiated insulin secretion at 20mM glucose, in a near dose dependent manner
with an approximate 40-150% increase in insulin secretion in response to 25fM and 25nM
CCL5 and an approximate 2.5-fold increase in insulin secretion observed after 2.5pM CCL5
(Figure 49). As illustrated in Figure 50a, dynamic insulin secretion experiments revealed that
CCL5 (20nM) reversibly increased insulin secretion from islets by approximately 2-fold at 2mM
glucose and insulin secretion levels returned to basal upon withdrawal of CCL5. The same islets
showed a robust insulin secretory response when challenged with 20mM glucose, which
demonstrated that CCL5 was not detrimental to islet viability and normal beta cell function was
preserved. In parallel experiments, insulin secretion was potentiated in mouse islets when
challenged with 20mM glucose and responded in a typical biphasic fashion, which consisted of a
transient first phase increase followed by a sustained plateau second phase of insulin secretion.
This secretory response to glucose was further potentiated (1.9-fold) when islets were
challenged with 20nM CCL5 (Figure 50b). Furthermore, when the CCL5 stimulus was removed
insulin secretion failed to return to levels prior to the CCL5 stimulus, which suggested that the
effects of CCL5 at 20mM glucose may be irreversible (Figure 50b).
Glucagon secretion was also measured from isolated mouse islets since GPR75 expression was
identified on alpha cells. Isolated mouse islets were initially treated with 20mM arginine to
stimulate glucagon secretion before treatment with exogenous CCL5. As illustrated in Figure 51,

Chapter 4: The effect of CCL5 on insulin and glucagon secretion.
136
glucagon secretion was significantly stimulated when mouse islets were challenged with 20mM
arginine and this was significantly potentiated by 60% when islets were exposed to 2.5nM
CCL5.

Chapter 4: The effect of CCL5 on insulin and glucagon secretion.
137
Figure 48: The effect of various concentrations of CCL5 on insulin secretion from MIN6 beta
cells at sub-stimulatory and stimulatory glucose concentrations. MIN6 beta cells seeded at a density
of 30,000 cells per well were pre-incubated for 2 hours with a physiological buffer supplemented with
2mM glucose. Cells were then treated with increasing concentrations of CCL5 for 1 hour in a
physiological buffer supplemented with 2mM glucose (a). Data expressed as Mean ± SEM, n=8,
***P<0.001, **P<0.01 one way ANOVA: No CCL5 vs CCL5, or 20mM glucose (b & c). Data expressed
as Mean ± SEM. n=5-8, ***P˂0.001, *P<0.05. Insulin secretion was quantified by radioimmunoassay.
a
b c
0
2
4
6
8
10
12
14
16
Insu
lin s
ecre
tio
n (
ng/
30,0
00ce
lls/
hr)
CCL5 concentration
*** *** *** **
0
1
2
3
4
5
6
7
8
9
10
20mM Glucose 20mM Glucose +2.5nM CCL5
Insu
lin s
ecre
tio
n (
ng/
30,0
00ce
lls/
hr)
***
0
1
2
3
4
5
6
7
8
9
10
20mM Glucose 20mM Glucose +25nM CCL5
Insu
lin s
ecre
tio
n (
ng/
30,0
00ce
lls/
hr)
*

Chapter 4: The effect of CCL5 on insulin and glucagon secretion.
138
Figure 49: The effect of increasing concentrations of CCL5 on insulin secretion from mouse
islets. Isolated mouse islets were pre-incubated with a physiological buffer supplemented with 2mM
glucose for 1 hour at 37°C. Islets were then treated with increasing concentrations of CCL5 for 1 hour at
37°C in a physiological buffer supplemented with 20mM glucose. Insulin secretion was quantified by
radioimmunoassay. Data expressed as Mean ± SEM, n=6-8, ***P<0.001 one way ANOVA: No CCL5 vs
CCL5.
0
0.5
1
1.5
2
2.5
3
3.5
4
Insu
lin s
ecre
tio
n (
ng/
isle
t/h
r)
CCL5 concentration
*** ***
*** *** ***

Chapter 4: The effect of CCL5 on insulin and glucagon secretion.
139
Figure 50: The effect of CCL5 on dynamic insulin secretion from isolated mouse islets at sub-
stimulatory and stimulatory glucose concentrations. Isolated mouse islets were pre-perifused for 70
minutes with a physiological buffer supplemented with 2mM glucose at 37°C before being perifused with
exogenous CCL5 in the presence of 2mM glucose (a) or 20mM glucose (b). Data expressed as Mean ±
SEM. n=4, percentage of insulin secretion at 2mM glucose.*P<0.05: peak GSIS vs basal.
0%
100%
200%
300%
400%
500%
600%
700%
800%
900%
1000%
0 10 20 30 40 50 60 70
Insu
lin s
ecre
tio
n (
% o
f 2m
M g
luco
se)
Time (Minutes)
20nM CCL5
2mM Glucose 20mM Glucose
0%
100%
200%
300%
400%
500%
600%
700%
800%
900%
1000%
0 10 20 30 40 50 60 70
Insu
lin s
ecre
tio
n (
% o
f 2m
M g
luco
se)
Time (Minutes)
20mM Glucose 2mM
Glucose
20nM CCL5
a
b
*
*

Chapter 4: The effect of CCL5 on insulin and glucagon secretion.
140
Figure 51: The effect of CCL5 on arginine-induced glucagon secretion from mouse islets. Isolated
mouse islets were pre-incubated for 1 hour with a physiological buffer supplemented with 2mM glucose.
Islets were then exposed to 20mM arginine in the absence or presence of CCL5 (2.5nM). Glucagon
secretion was quantified by radioimmunoassay. Data expressed as Mean ± SEM, n=8-9, **P<0.01.
0.00
0.02
0.04
0.06
0.08
0.10
0.12
0.14
2mM Glucose 2mM Glucose +20mM Arginine
2mM Glucose +20mM Arginine +
2.5nM CCL5
Glu
cago
n s
ecre
tio
n (
ng/
isle
t/h
r))
**
**
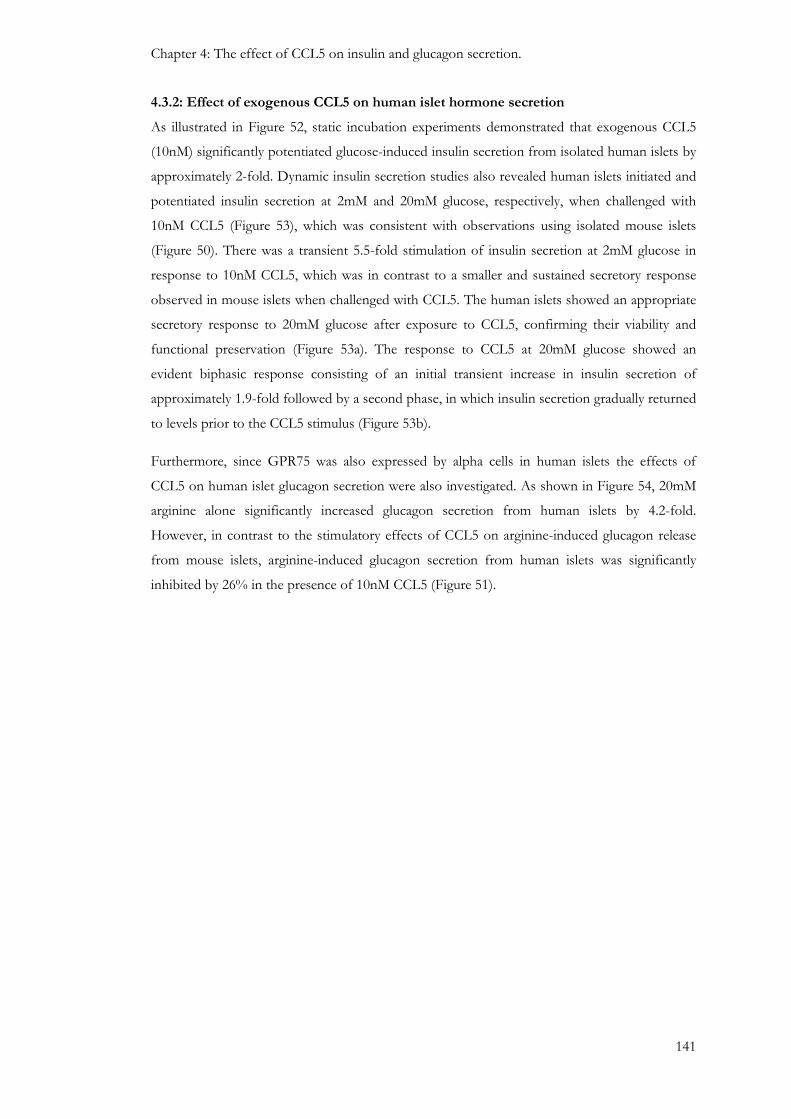
Chapter 4: The effect of CCL5 on insulin and glucagon secretion.
141
4.3.2: Effect of exogenous CCL5 on human islet hormone secretion
As illustrated in Figure 52, static incubation experiments demonstrated that exogenous CCL5
(10nM) significantly potentiated glucose-induced insulin secretion from isolated human islets by
approximately 2-fold. Dynamic insulin secretion studies also revealed human islets initiated and
potentiated insulin secretion at 2mM and 20mM glucose, respectively, when challenged with
10nM CCL5 (Figure 53), which was consistent with observations using isolated mouse islets
(Figure 50). There was a transient 5.5-fold stimulation of insulin secretion at 2mM glucose in
response to 10nM CCL5, which was in contrast to a smaller and sustained secretory response
observed in mouse islets when challenged with CCL5. The human islets showed an appropriate
secretory response to 20mM glucose after exposure to CCL5, confirming their viability and
functional preservation (Figure 53a). The response to CCL5 at 20mM glucose showed an
evident biphasic response consisting of an initial transient increase in insulin secretion of
approximately 1.9-fold followed by a second phase, in which insulin secretion gradually returned
to levels prior to the CCL5 stimulus (Figure 53b).
Furthermore, since GPR75 was also expressed by alpha cells in human islets the effects of
CCL5 on human islet glucagon secretion were also investigated. As shown in Figure 54, 20mM
arginine alone significantly increased glucagon secretion from human islets by 4.2-fold.
However, in contrast to the stimulatory effects of CCL5 on arginine-induced glucagon release
from mouse islets, arginine-induced glucagon secretion from human islets was significantly
inhibited by 26% in the presence of 10nM CCL5 (Figure 51).

Chapter 4: The effect of CCL5 on insulin and glucagon secretion.
142
Figure 52: The effect of CCL5 on insulin secretion from human islets. Isolated human islets were
pre-incubated with a physiological buffer supplemented with 2mM glucose for 1 hour at 37°C. Islets were
then treated with CCL5 (10nM) in the presence of a physiological buffer supplemented with 20mM
glucose for 1 hour at 37°C. Insulin secretion was quantified by radioimmunoassay. Data expressed as
Mean ± SEM, n=5-7, **P<0.01.
0
0.2
0.4
0.6
0.8
1
1.2
1.4
2mM Glucose 20mM Glucose 20mM Glucose + 10nMCCL5
Insu
lin s
ecre
tio
n (
ng/
isle
t/h
r)
**

Chapter 4: The effect of CCL5 on insulin and glucagon secretion.
143
Figure 53: The effect of CCL5 on dynamic human islet insulin secretion at sub-stimulatory and
stimulatory glucose concentrations. Isolated human islets were pre-perifused for 70 minutes at 37°C
with a physiological buffer supplemented with 2mM glucose. Islets were then perifused with CCL5
(10nM) in the presence of a physiological buffer supplemented with either 2mM glucose (a) or 20mM
glucose (b) at 37°C. Insulin secretion was quantified by radioimmunoassay. Data expressed as Mean ±
SEM, n=4, percentage of insulin secretion at 2mM glucose. ***P<0.001: CCL5 peak stimulation vs basal;
##P<0.01: peak GSIS vs basal; $$$P<0.001: peak GSIS vs basal; *P<0.05: peak CCL5 stimulation vs
pre-CCL5 stimulation.
0%
100%
200%
300%
400%
500%
600%
700%
0 10 20 30 40 50 60 70 80 90
Insu
lin s
ecre
tio
n (
% o
f 2m
M g
luco
se)
Time (Minutes)
2mM Glucose 20mM Glucose
10nM CCL5
0%
100%
200%
300%
400%
500%
600%
700%
800%
0 10 20 30 40 50 60 70 80 90
Insu
lin
sec
reti
on
(%
of
2mM
glu
cose
)
Time (Minutes)
2mM Glucose 20mM Glucose
10nM CCL5
a
b
***
##
$$$ *

Chapter 4: The effect of CCL5 on insulin and glucagon secretion.
144
Figure 54: The effect of CCL5 on arginine-induced glucagon secretion from human islets.
Isolated human islets were pre-incubated with a physiological buffer supplemented with 2mM glucose for
1 hour at 37°C. The islets were then treated with a physiological buffer supplemented with 20mM
arginine in the absence or presence of exogenous CCL5 (10nM). Glucagon was quantified by
radioimmunoassay. Data expressed as Mean ± SEM, n=7-8, **P<0.01, ***P<0.001.
0
0.02
0.04
0.06
0.08
0.1
0.12
0.14
0.16
0.18
0.2
0.22
2mM Glucose 2mM Glucose +
20mM Arginine
2mM Glucose +
20mM Arginine +
10nM CCL5
Glu
cag
on
sec
reti
on
(n
g/i
slet
/hr)
** ***
Chapter 4: The effect of CCL5 on insulin and glucagon secretion.
145
4.4: Discussion
GPR75 is coupled to the Gαq protein in CHO-K1 cells and CCL5 stimulated calcium
mobilisation in CHO-K1 cells that overexpressed GPR75 (Ignatov et al., 2006). In addition,
CCL5-induced calcium mobilisation in CHO-K1 cells was inhibited when they were treated
with a PLC inhibitor (U73122) but it was not significantly affected by PTx, indicating effects
independent of Gαi/Gαo signalling (Ignatov et al., 2006). CCL5 also elevated IP3 formation in
HEK293 cells expressing GPR75 (Ignatov et al., 2006). Gαq protein-coupled receptors are
known to promote insulin secretion (Amisten et al., 2013, Sassmann et al., 2010). For example,
cholinergic stimulation of the muscarinic (M3) receptor, which is coupled to Gαq and is
expressed by beta cells, activates PLC and generates IP3 and DAG via PIP2 hydrolysis. IP3
induces calcium mobilisation from internal calcium stores (Gilon and Henquin, 2001), whilst
DAG activates DAG-sensitive PKC isoforms (Gilon and Henquin, 2001, Jones and Persaud,
1998b). Both of these second messengers promote insulin secretion (Gilon and Henquin, 2001).
GPR54 is another Gαq coupled receptor that can potentiate GSIS in mouse islets (Hauge-Evans
et al., 2006, Bowe et al., 2009), and signalling via this receptor can be blocked in the presence of
U73122 (Bowe et al., 2009). This supports the notion that GPR54 can induce insulin secretion
by signalling through the Gαq-PLC pathway, which elevates cytosolic calcium presumably
through IP3 generation and liberation of calcium from the endoplasmic reticulum (Bowe et al.,
2009). Furthermore, GPR54 is also expressed by both alpha and beta cells in mouse islets and is
activated by kisspeptin (Hauge-Evans et al., 2006). It is worth noting that this is similar to the
expression profile of GPR75, which is also expressed by alpha and beta cells of both mouse and
human islets. Therefore, it is possible that GPCRs may regulate islet function in a paracrine
and/or autocrine manner.
CCL5 is also endogenously expressed in islets, but in a species-dependent manner. Thus, it is
expressed in alpha cells of mouse islets, but in alpha and beta cells of human islets. It is
conceivable that CCL5 may activate GPR75, which may go on to regulate intra-islet hormone
secretion in a paracrine and/or autocrine manner. Experiments in this chapter showed that
CCL5 not only initiated insulin secretion but it also potentiated GSIS from MIN6 beta cells
(Figure 48), mouse islets (Figure 50) and human islets (Figure 53). These data demonstrated for
the first time that CCL5, presumably through the activation of GPR75, can stimulate insulin
secretion from beta cells.
Dynamic insulin secretion experiments using mouse islets (Figure 50a) and human islets (Figure
53a) demonstrated that CCL5 could initiate insulin secretion at 2mM glucose. To avoid
inappropriate insulin secretion under hypoglycaemic conditions, receptor-operated
secretagogues usually potentiate GSIS rather than initiate insulin secretion (Henquin, 2011). It is
likely that the stimulatory effect of CCL5 in the absence of a glucose stimulus may highlight a
###
Chapter 4: The effect of CCL5 on insulin and glucagon secretion.
146
potential paracrine effect of glucagon, which is known to be released at low glucose
concentrations and inhibited at high glucose concentrations (Nadal et al., 1999, Ishihara et al.,
2003). It was reported that glucagon could stimulate insulin secretion (Samols et al., 1965) from
an isolated perfused rat pancreas at 5mM glucose by activating glucagon receptors (GluR)
expressed on beta cells (Kawai et al., 1995, Wojtusciszyn et al., 2008). Expression of CCL5 and
GPR75 by alpha cells of mouse and human islets, as described in chapter 3, coupled with
CCL5-induced glucagon secretion from mouse islets (Figure 51), suggests GPR75 activation on
alpha cells stimulates glucagon secretion, which may stimulate insulin secretion in a paracrine
manner. This may be achieved by two possible mechanisms: CCL5 released from alpha cells
may directly activate GPR75 on beta cells to stimulate insulin secretion; or CCL5 stimulates
GPR75 expressed by alpha cells and stimulates glucagon release in an autocrine manner and
thus stimulates insulin secretion by activating GluR expressed on beta cells (Figure 55). This
direct and/or indirect approach of stimulating insulin secretion via CCL5-GPR75 activation
could explain why GPR75 is expressed by beta cell and alpha cell populations of mouse and
human islets. Also, the irreversible effects of CCL5-induced potentiation of insulin secretion at
20mM glucose (Figure 50b), may be explained by elevations in glucagon induced by CCL5,
which may activate beta cell GluR and thus continue to stimulate insulin secretion in the
absence of CCL5.
The insulin secretory profile from human islets differed to that of mouse islets. Exposure of
human islets to CCL5 stimulated insulin secretion by 5.5-fold at sub-stimulatory glucose
concentrations, and also potentiated GSIS by approximately 2-fold (Figure 52 and Figure 53b).
Both responses were transient and returned to pre-stimulatory levels even before withdrawal of
the CCL5 stimulus. This was in contrast to the smaller and sustained responses observed in
mouse islets (Figure 50). The more pronounced stimulatory effect of CCL5 on insulin secretion
at sub-stimulatory glucose concentrations in human islets (Figure 53a) could be explained by a
more robust activation of GPR75 by the controlled effects of exogenously administered CCL5
and that which is endogenously expressed by both beta cell and alpha cell populations in human
islets. This could potentially result in a higher intra-islet concentration of CCL5 compared to
mouse islets and thus stimulate insulin secretion either directly, by activating GPR75 expressed
on beta cells, or indirectly, by stimulating glucagon secretion from alpha cells, which may go
onto stimulate insulin secretion through GluR activation as previously suggested for mouse
islets. In human islets, a majority, if not all beta cells are in contact with alpha and/or delta cells
(Bosco et al., 2010). It has been demonstrated that a single intercellular contact between
individual isolated human beta cells and alpha cells can stimulate insulin secretion, presumably
through activation of GluR expressed on beta cells (Wojtusciszyn et al., 2008, Kawai et al.,
1995). Furthermore, islets rich in glucagon have been reported to have a higher sensitivity to
glucose by secreting more insulin (Jiang and Zhang, 2003, Pipeleers et al., 1985). This indicates a

Chapter 4: The effect of CCL5 on insulin and glucagon secretion.
147
paracrine influence of glucagon on neighbouring beta cells and may explain the higher levels of
insulin secretion from human islets when exposed to CCL5, as previously suggested for mouse
islets. However, experiments using human islets have demonstrated that CCL5 inhibits arginine-
induced glucagon secretion (Figure 54), which is in contrast to the stimulatory response
observed with mouse islets. It is conceivable that the higher CCL5-induced insulin secretory
output observed in human beta cells may activate insulin receptors (InsR) expressed on alpha
cells, resulting in inhibition of glucagon secretion from alpha cells (Diao et al., 2005, Kawamori
et al., 2009, Kaneko et al., 1999). Therefore, excessive insulin secretion may inhibit glucagon
secretion by over-riding the initial stimulatory effect on glucagon secretion associated with
GPR75 activation by CCL5, and thus provide a protective paracrine mechanism by inhibiting
glucagon secretion and restricting further insulin output (Figure 57). One way of elucidating the
true effect of CCL5 on glucagon secretion would be to antagonise the effects of insulin acting
on alpha cells in isolated islets using antibodies directed against InsR.
Also, the excessive insulin secretion in human islets in response to CCL5 may explain the
transient nature of this response by applying the ‘brake’ on CCL5-induced glucagon secretion,
which would prevent further stimulation of GluR on beta cells and restrict insulin output
(Figure 57). It is also possible that the robust activation of GPR75 may result in receptor de-
sensitisation (Kelly et al., 2008, Krupnick and Benovic, 1998, Drake et al., 2006) through
GPR75 internalisation due to high intra-islet concentrations of CCL5 (Figure 57). This would
also explain why insulin secretion levels start to fall towards pre-stimulus levels due to
diminished GPR75 activation which would ultimately restrict CCL5-induced glucagon secretion
followed by a decrease in glucagon-induced insulin secretion. It is worth noting that this is not
observed in mouse islets, in which the CCL5-induced insulin secretory response was smaller but
sustained, possibly due to a lower intra-islet concentration of CCL5. The lower insulin secretory
output may not reach a sufficiently high threshold to activate InsR expressed on mouse islet
alpha cells and thus unable to repress glucagon-stimulated insulin secretion and therefore
continue to stimulate insulin secretion in the absence of CCL5. The proposed signalling
mechanisms downstream of CCL5-induced GPR75 activation in mouse and human alpha and
beta cells are summarised in Figure 55 to Figure 57.
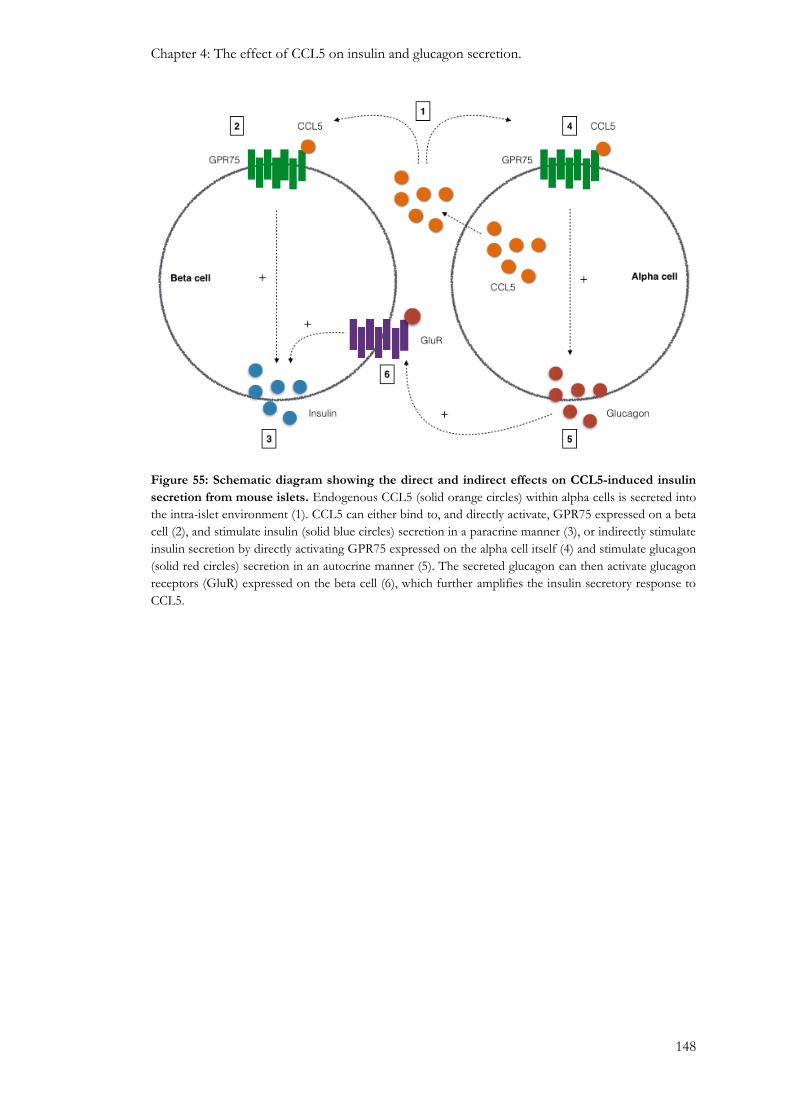
Chapter 4: The effect of CCL5 on insulin and glucagon secretion.
148
Figure 55: Schematic diagram showing the direct and indirect effects on CCL5-induced insulin
secretion from mouse islets. Endogenous CCL5 (solid orange circles) within alpha cells is secreted into
the intra-islet environment (1). CCL5 can either bind to, and directly activate, GPR75 expressed on a beta
cell (2), and stimulate insulin (solid blue circles) secretion in a paracrine manner (3), or indirectly stimulate
insulin secretion by directly activating GPR75 expressed on the alpha cell itself (4) and stimulate glucagon
(solid red circles) secretion in an autocrine manner (5). The secreted glucagon can then activate glucagon
receptors (GluR) expressed on the beta cell (6), which further amplifies the insulin secretory response to
CCL5.

Chapter 4: The effect of CCL5 on insulin and glucagon secretion.
149
Figure 56: Schematic diagram showing the direct and indirect effects on CCL5-induced insulin
secretion from human islets. Endogenous CCL5 (solid orange circles) within an alpha cell and a beta
cell is secreted into the intra-islet environment (1). The high intra-islet concentration of CCL5 may
robustly activate GPR75 expressed on the beta cell (2), and subsequently stimulate insulin (solid blue
circles) secretion in a paracrine manner (3), or indirectly stimulate insulin secretion by activating GPR75
expressed on the alpha cell itself (4) and stimulate glucagon (solid red circles) secretion in an autocrine
manner (5). The secreted glucagon can then activate glucagon receptors (GluR) expressed on the beta cell
(6), which further amplifies the insulin secretory response to CCL5.

Chapter 4: The effect of CCL5 on insulin and glucagon secretion.
150
Figure 57: Schematic diagram showing the effects of high levels of insulin release and its
subsequent inhibition of glucagon secretion. Endogenous CCL5 (solid orange circles) within an alpha
cell and a beta cell is secreted into the intra-islet environment (1). The high intra-islet concentration of
CCL5 may robustly activate GPR75 expressed on the beta cell (2), and subsequently stimulate insulin
(solid blue circles) secretion in a paracrine manner (3). The elevated levels of insulin may then go onto
activate insulin receptors (InsR) expressed on the alpha cell (4) and inhibit glucagon (solid red circles)
secretion (5). Furthermore, the high intra-islet concentration of CCL5 may over-activate GPR75 and lead
to receptor desensitisation by internalising GPR75 and diminishing the stimulatory effects associated with
CCL5 (6). This may explain the transient secretion profile of insulin observed in human islets.

151
Chapter 5: Elucidating the GPR75 signalling pathway in beta cells.

Chapter 5: Elucidating the GPR75 signalling pathway in beta cells.
152
5.1: Introduction
GPR75 coupling to the Gαq protein has been established by demonstrating insensitivity to
pertussis toxin and sensitivity to U73122, a phospholipase C (PLC) inhibitor (Ignatov et al.,
2006). CCL5 also elevates the formation of IP3 in HEK293 cells that overexpress GPR75 as
well as stimulating calcium mobilisation in GPR75-expressing CHO-K1 cells, which was
inhibited in the presence of U73122 but was unaffected by pertussis toxin (Ignatov et al., 2006).
In this thesis, mRNA analysis and protein expression experiments identified GPR75 as the most
abundant CCL5 receptor expressed in mouse and human islets, and that it co-localised with beta
cell and alpha cell populations of mouse and human islets (Chapter 3). Furthermore, CCL5 also
stimulates insulin secretion from mouse islets and human islets as well as from MIN6 beta cells,
whereas, glucagon secretion was stimulated in mouse islets but inhibited in human islets
(Chapter 4). These data indicate that GPR75 signalling influences islet hormone secretion
through autocrine and/or paracrine mechanisms, and therefore CCL5 via GPR75 activation
may influence beta cell function in a non-immunological environment, which has not been
previously identified.
Glucose-induced insulin secretion (GSIS) is achieved when glucose enters beta cells and is
metabolised, which elevates the ATP: ADP ratio and subsequently closes ATP-sensitive K+
channels. This causes depolarisation of the beta cell membrane and activates VOCCs. The
ensuing influx of calcium elevates the cytosolic concentration of calcium, which stimulates
insulin exocytosis through multiple events involving protein kinase activation and insulin
granule docking and priming (Ashcroft FM, 1992, Howell et al., 1994, Wollheim and Sharp,
1981, Rorsman and Renström, 2003). Moreover, non-nutrient stimulation of insulin secretion is
achieved through receptor activation resulting in second messenger generation and/or protein
kinase activation. The activation of Gαq protein-coupled receptors results in the generation of
IP3 and DAG via PIP2 hydrolysis, which mobilise calcium from intracellular calcium stores and
activate DAG-sensitive PKC isoforms, respectively (Jones and Persaud, 1998b). Secretagogues
acting on cell surface receptors work through identical intracellular regulators as nutrient stimuli
to influence insulin secretion (Jones and Persaud, 1998b, Howell et al., 1994). For example,
carbachol (CCh), which activates the Gαq-coupled muscarinic (M3) receptor, induces beta cell
depolarisation and subsequent elevations of the calcium second messenger (Biden et al., 1987).
Furthermore, CCh and peptide hormones such as bombesin, arginine vasopressin (AVP) and
cholecystokinin (CCK) promote the generation of IP3 and DAG from phospholipid hydrolysis
by stimulating PLC (Biden et al., 1987, Best and Malaisse, 1983, Zawalich et al., 1987, Swope
and Schonbrunn, 1988, Gao et al., 1990).

Chapter 5: Elucidating the GPR75 signalling pathway in beta cells.
153
Identification of GPR75 coupling to the Gαq signalling pathway (Ignatov et al., 2006), and the
ability of CCL5 to promote insulin secretion from beta cells (Chapter 4) suggests that activation
of GPR75, which is expressed by beta cells, may potentially restore or preserve normal beta cell
function. Therefore, this chapter focuses on identifying whether the CCL5-inducing effect on
insulin secretion is mediated through GPR75 activation as well as elucidating GPR75 signalling
in beta cells by pharmacologically manipulating components of the Gαq pathway.

Chapter 5: Elucidating the GPR75 signalling pathway in beta cells.
154
5.2: Methods
5.2.1: Down-regulation of GPR75: Transient transfection
Gene targeted siRNAs were designed to down-regulate GPR75 expression in MIN6 beta cells
by using an Amaxa®Cell Line Nucleofector®Kit R (Section 2.5.2). Briefly, 1x10⁶ MIN6 beta
cells per sample were gently re-suspended with 100µl Nucleofector® transfection reagent,
which consisted of a 4.5:1 ratio of Nucleofector® solution (82µl) to Nucleofector® supplement
(18µl) per 100µl sample. The cell suspension was combined with either GPR75 siRNAs
(150nM) or non-coding RNAs (150nM), which served as control, before being transferred into
a cuvette. The cells were then electroporated using an Amaxa Nucleofector (Lonza), after which
500µl of pre-warmed DMEM (Table 1) was immediately added to the cuvette containing the
cell suspension and then gently pipetted into pre-prepared 6 well plates containing 1.5ml pre-
warmed DMEM (Table 1). The transfected cells were incubated for 48 hours at 37°C (5%
CO2/95% air). The extent of GPR75 down-regulation was verified by qRT-PCR and GPR75
mRNA expression was normalised against GAPDH (Gapdh), which served as an internal
reference and calculated by the 2−ΔΔCt method (Section 2.3.7). GPR75 protein expression was
determined by western blotting (Section 2.4.4) using a rabbit anti-GPR75 antibody (1:50
dilution) and equal protein loading was confirmed by immune detection using an anti-beta actin
antibody (1:200 dilution). Functional effects of GPR75 down-regulation were observed in
calcium microfluorimetry and insulin secretion experiments.
5.2.2: Calcium Microfluorimetry
MIN6 beta cells were seeded at a density of 50,000 cells per acidified ethanol-washed coverslip
and incubated overnight at 37°C (5% CO2/95% air) in DMEM (Table 1). Cells were then
loaded with 5µM FURA-2AM for 30 minutes and coverslips were transferred to a temperature-
controlled chamber maintained at 37°C. For most protocols, cells were perifused with a
physiological buffer (Gey and Gey, 1936), Table 23, supplemented with 2mM glucose to
establish a stable baseline of intracellular calcium before being challenged with various agents of
interest (Table 32). Cells were also treated with ATP (100µM) and/or tolbutamide (50µM),
which served as positive controls. A shutter system was used to expose the cells or islets to
excitatory wavelengths of 340nm and 380nm every 2 seconds. Changes in fluorescence
(emission at 510nm) were monitored by an epi-fluorescence microscope (Zeiss Axiovert135
Inverted microscope). The data were recorded by OptoFluor imaging software (2.5.1: Single cell
calcium microfluorimetry).
5.2.3: Measurement of insulin secretion: Static incubation
MIN6 beta cells were seeded at a density of 30,000 cells per well in a clear 96 well plate and
incubated for 24 hours in DMEM (Table 1) at 37°C (5% CO2/95% air). The medium was
tapped off and cells were pre-incubated with a physiological buffer (Gey and Gey, 1936)
Chapter 5: Elucidating the GPR75 signalling pathway in beta cells.
155
supplemented with 2mM glucose (200µl/well) for 2 hours at 37°C (5% CO2/95% air). The
physiological buffer was then replaced with 200µl of agents of interest per well (Table 32) and
cells were incubated for a further hour at 37°C (5% CO2/95% air). 160µl of supernatant was
collected and diluted in borate buffer (1:5 dilution), which was used to quantify insulin secretion
by radioimmunoassay (section 2.6.3).
Isolated mouse and human islets were incubated for 24 hours in RPMI or CMRL (Table 1),
respectively. Islets were pre-incubated with a physiological buffer (Gey and Gey, 1936)
supplemented with 2mM glucose for 1 hour at 37°C (5% CO2/95% air) before being treated (3
islets per replicate) with 600µl agents of interest (Table 32) and incubated for a further hour at
37°C (5% CO2/95% air). 450µl of supernatant was collected and diluted in borate buffer (1:5
dilution), which was used to quantify insulin secretion by radioimmunoassay (section 2.6.3).
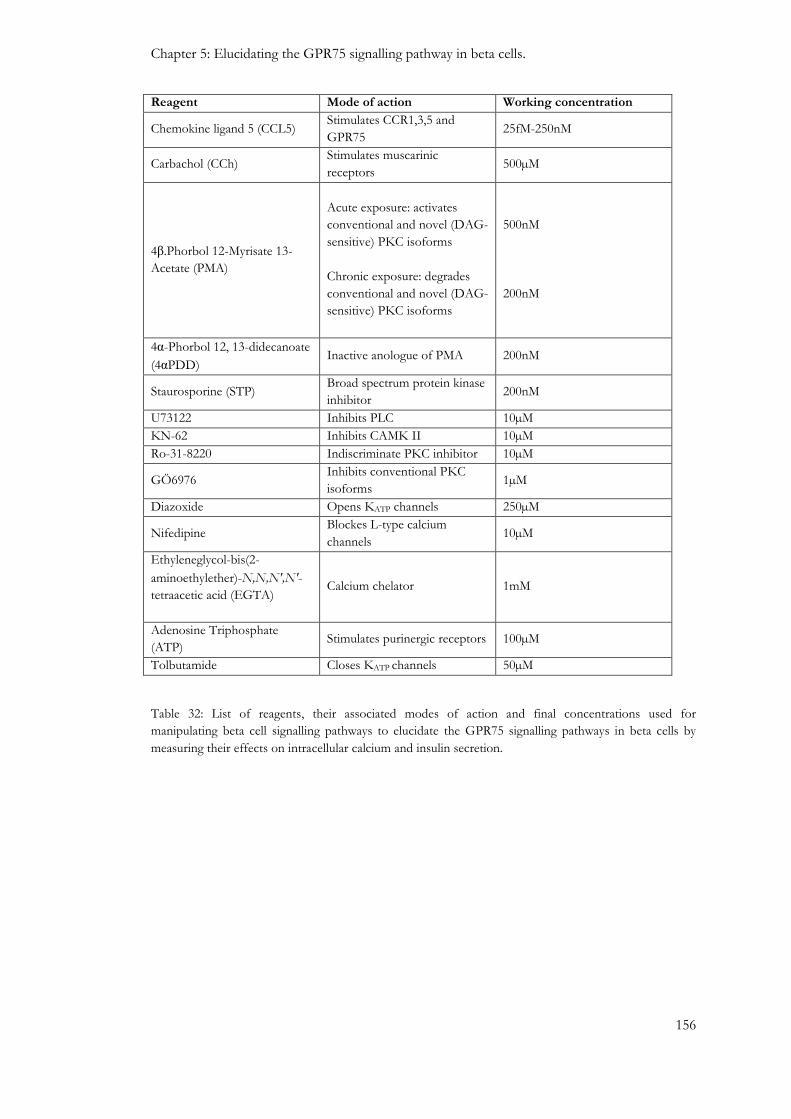
Chapter 5: Elucidating the GPR75 signalling pathway in beta cells.
156
Reagent Mode of action Working concentration
Chemokine ligand 5 (CCL5) Stimulates CCR1,3,5 and
GPR75 25fM-250nM
Carbachol (CCh) Stimulates muscarinic
receptors 500µM
4β.Phorbol 12-Myrisate 13-
Acetate (PMA)
Acute exposure: activates
conventional and novel (DAG-
sensitive) PKC isoforms
Chronic exposure: degrades
conventional and novel (DAG-
sensitive) PKC isoforms
500nM
200nM
4α-Phorbol 12, 13-didecanoate
(4αPDD) Inactive anologue of PMA 200nM
Staurosporine (STP) Broad spectrum protein kinase
inhibitor 200nM
U73122 Inhibits PLC 10µM
KN-62 Inhibits CAMK II 10µM
Ro-31-8220 Indiscriminate PKC inhibitor 10µM
GÖ6976 Inhibits conventional PKC
isoforms 1µM
Diazoxide Opens KATP channels 250µM
Nifedipine Blockes L-type calcium
channels 10µM
Ethyleneglycol-bis(2-
aminoethylether)-N,N,N′,N′-
tetraacetic acid (EGTA)
Calcium chelator 1mM
Adenosine Triphosphate
(ATP) Stimulates purinergic receptors 100µM
Tolbutamide Closes KATP channels 50µM
Table 32: List of reagents, their associated modes of action and final concentrations used for
manipulating beta cell signalling pathways to elucidate the GPR75 signalling pathways in beta cells by
measuring their effects on intracellular calcium and insulin secretion.

Chapter 5: Elucidating the GPR75 signalling pathway in beta cells.
157
5.3: Results
5.3.1: The effect of CCL5 on intracellular calcium levels in MIN6 beta cells, mouse islets
and human islets.
As demonstrated in Figure 58, challenging MIN6 beta cells with increasing concentrations of
CCL5 caused a robust increase in intracellular calcium levels (0.25nM CCL5: 106±20%; 2.5nM
CCL5: 99±14%; 25nM CCL5: 86±13%, of maximum response to tolbutamide). The
stimulatory responses were sustained during the presence of CCL5 and were reversible upon its
removal, but they were not concentration-dependent. The cells were still able to respond to
tolbutamide and ATP after exposure to CCL5 and indicated that CCL5 was not detrimental to
beta cell function. The response to tolbutamide was sustained and reversible whereas, ATP
response was transient with intracellular calcium levels falling back to basal before withdrawal of
ATP (Figure 58). It is worth noting that a smaller response to ATP was observed after
challenging MIN6 beta cells with tolbutamide as illustrated in Figure 58, which may be
explained by the fact that the increase in calcium influx in response to tolbutamide may mobilise
calcium from the endoplasmic reticulum (ER) by calcium-induced calcium release, which would
diminish internal calcium stores, and result in a diminished response to ATP, which can
mobilise calcium from the ER. Furthermore, CCL5 induced reversible increases in intracellular
calcium levels in MIN6 beta cells in a concentration-dependent manner between 25fM to 25pM,
(Figure 59), which was consistent with insulin secretion studies (Figure 49). However, the
concentration-dependent effect was lost at 0.25nM. Increasing concentrations of CCL5
(0.25nM-25nM) also increased intracellular calcium levels in MIN6 beta cells at 20mM glucose
by 147±29%, 139±23% and 71±29%, of the maximum response to tolbutamide (Figure 60).
The response was sustained throughout the presence of CCL5 but also reversibly returned to
basal after CCL5 was withdrawn. MIN6 beta cells were still able to respond to tolbutamide,
which again suggested CCL5 had no detrimental effect on beta cell viability or cell function at
stimulatory glucose concentrations.
The stimulatory effects of CCL5 on intracellular calcium concentrations were also observed in
partially dispersed isolated mouse islets. Mouse islet beta cells were able to reversibly elevate
cytosolic calcium levels by 53%-69% of the maximum response to ATP, in response to
increasing concentrations of exogenous CCL5 (0.25nM-25nM). These cells were also able to
elevate intracellular calcium levels in response to ATP after being challenged with CCL5, which
indicated that exogenous CCL5 had no immediate effect on mouse islet beta cell function or
viability (Figure 61). Furthermore, CCL5 also elevated intracellular calcium levels by 83%-232%
of the maximum response to tolbutamide in partially dispersed human islet cells that were
challenged with increasing concentrations of CCL5 (0.1nM-10nM). The human islet cells were
able to respond to tolbutamide after being challenged with CCL5, which suggested that the cells

Chapter 5: Elucidating the GPR75 signalling pathway in beta cells.
158
under observation were beta cells, and they also responded to ATP, which demonstrated that
CCL5 had no detrimental effect on human beta cell function or viability (Figure 62).
Therefore, the stimulation of insulin secretion by CCL5 is most likely through the elevation of
cytosolic calcium levels in beta cells. The next phase of this PhD project tried to identify
whether these stimulatory effects were primarily mediated through the activation of GPR75.

Chapter 5: Elucidating the GPR75 signalling pathway in beta cells.
159
Figure 58: The effect of CCL5 on intracellular calcium concentrations in Fura-2 loaded MIN6
beta cells. Fura-2 loaded MIN6 beta cells were perifused with a physiological buffer supplemented with
2mM glucose before being challenged with increasing concentrations of CCL5 (0.25-25nM), as well as
ATP (100µM) and tolbutamide (50µM), which served as positive controls. Changes in cytosolic calcium
concentrations were expressed as 340nm:380nm ratiometric data. Data are expressed as Mean ± SEM,
n=37 cells.
0.6
0.65
0.7
0.75
0.8
0.85
0.9
0.95
0 5 10 15 20 25 30 35 40
Ab
sorb
ance
(340n
m:3
80n
m)
Time (Minutes)
0.25nM
CCL5
2.5nM
CCL5
25nM
CCL5 50µ
M T
ol
100µ
M A
TP
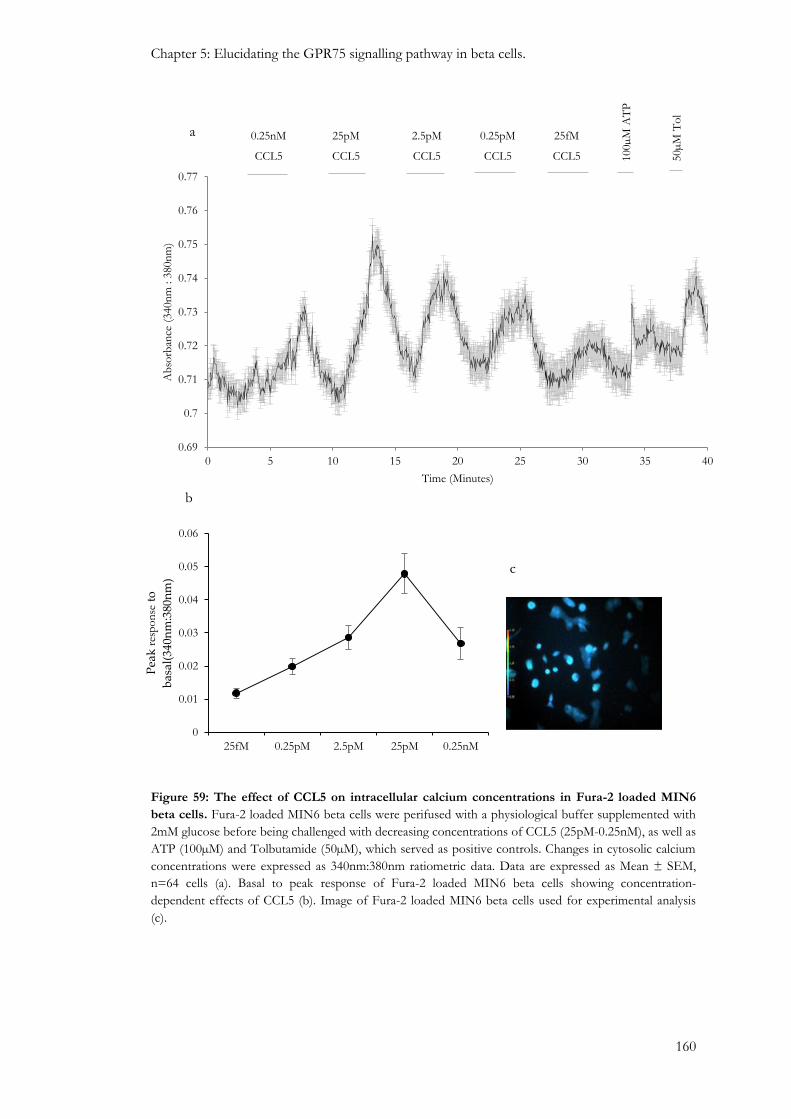
Chapter 5: Elucidating the GPR75 signalling pathway in beta cells.
160
Figure 59: The effect of CCL5 on intracellular calcium concentrations in Fura-2 loaded MIN6
beta cells. Fura-2 loaded MIN6 beta cells were perifused with a physiological buffer supplemented with
2mM glucose before being challenged with decreasing concentrations of CCL5 (25pM-0.25nM), as well as
ATP (100µM) and Tolbutamide (50µM), which served as positive controls. Changes in cytosolic calcium
concentrations were expressed as 340nm:380nm ratiometric data. Data are expressed as Mean ± SEM,
n=64 cells (a). Basal to peak response of Fura-2 loaded MIN6 beta cells showing concentration-
dependent effects of CCL5 (b). Image of Fura-2 loaded MIN6 beta cells used for experimental analysis
(c).
0.69
0.7
0.71
0.72
0.73
0.74
0.75
0.76
0.77
0 5 10 15 20 25 30 35 40
Ab
sorb
ance
(340n
m : 3
80n
m)
Time (Minutes)
0.25nM
CCL5
25pM
CCL5
0.25pM
CCL5 50µ
M T
ol
100µ
M A
TP
2.5pM
CCL5
25fM
CCL5
a
b
c
0
0.01
0.02
0.03
0.04
0.05
0.06
25fM 0.25pM 2.5pM 25pM 0.25nM
Pea
k r
esp
on
se t
o
bas
al(3
40n
m:3
80n
m)
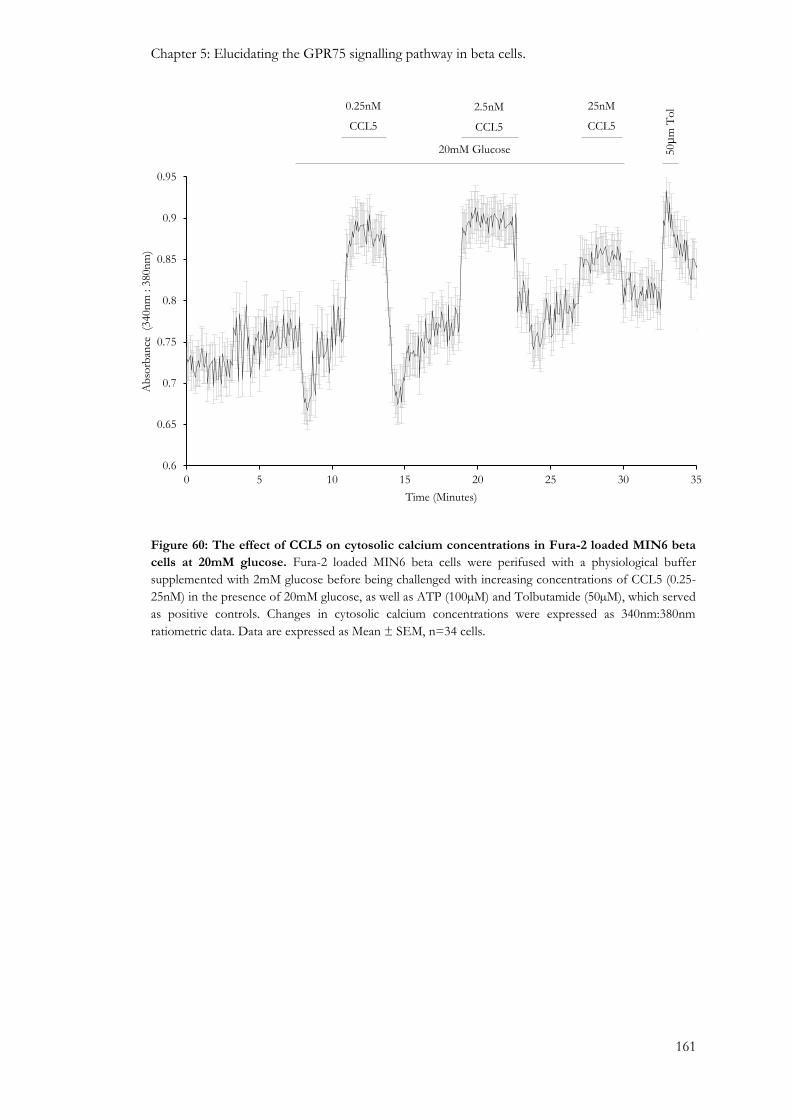
Chapter 5: Elucidating the GPR75 signalling pathway in beta cells.
161
Figure 60: The effect of CCL5 on cytosolic calcium concentrations in Fura-2 loaded MIN6 beta
cells at 20mM glucose. Fura-2 loaded MIN6 beta cells were perifused with a physiological buffer
supplemented with 2mM glucose before being challenged with increasing concentrations of CCL5 (0.25-
25nM) in the presence of 20mM glucose, as well as ATP (100µM) and Tolbutamide (50µM), which served
as positive controls. Changes in cytosolic calcium concentrations were expressed as 340nm:380nm
ratiometric data. Data are expressed as Mean ± SEM, n=34 cells.
0.6
0.65
0.7
0.75
0.8
0.85
0.9
0.95
0 5 10 15 20 25 30 35
Ab
sorb
ance
(3
40n
m : 3
80n
m)
Time (Minutes)
20mM Glucose
0.25nM
CCL5
50µ
m T
ol 2.5nM
CCL5
25nM
CCL5

Chapter 5: Elucidating the GPR75 signalling pathway in beta cells.
162
Figure 61: The effect of CCL5 on intracellular calcium levels in mouse islet cells. Isolated ICR
mouse islets were dispersed and seeded at a density of 80 islets per Cell-Tak coated coverslips. Cells were
loaded with 5µM FURA-2AM for 30 minutes and perifused with a physiological buffer supplemented
with 2mM glucose before being challenged with increasing concentrations of CCL5 (0.25nM-25nM), and
with ATP (100µM), which served as a positive control (a). Image of Fura-2 loaded islet beta cells used for
experimental analysis (b). Changes in cytosolic calcium concentrations were expressed as 340nm:380nm
ratiometric data. Data are expressed as Mean ± Range, n=2 cells.
b
0.6
0.61
0.62
0.63
0.64
0.65
0.66
0 1 2 3 4 5 6 7 8 9 10 11 12 13 14 15 16 17 18 19 20 21 22
Ab
sorb
ance
(340n
m:3
80n
m)
Time (Minutes)
0.25nM
CCL5
2.5nM
CCL5
25nM
CCL5 1000µ
M A
TP
a

Chapter 5: Elucidating the GPR75 signalling pathway in beta cells.
163
Figure 62: The effect of CCL5 on intracellular calcium levels in human islet beta cells. Isolated
human islets were dispersed and seeded at a density of 100 islets per Cell-Tak coated coverslips. Cells
were loaded with 5µM FURA-2AM for 30 minutes and perifused with a physiological buffer
supplemented with 2mM glucose before being challenged with increasing concentrations of CCL5
(0.1nM-10nM), as well as Tolbutamide (50µM) and ATP (100µM), which served as positive controls. (a).
Image of Fura-2 loaded human islet beta cells used for experimental analysis (b). Changes in cytosolic
calcium concentrations were expressed as 340nm:380nm ratiometric data. Data are expressed as Mean ±
SEM, n=4 cells.
0.6
0.61
0.62
0.63
0.64
0.65
0.66
0 1 2 3 4 5 6 7 8 9 10 11 12 13 14 15 16 17 18 19 20 21 22 23 24 25 26
Ab
sorb
ance
(340n
m: 380n
m)
Time (Minutes)
0.1nM
CCL5
1nM
CCL5
10nM
CCL5 50µM Tol 100µ
M A
TP
b
a

Chapter 5: Elucidating the GPR75 signalling pathway in beta cells.
164
5.3.2: The effect of GPR75 down-regulation on beta cell function
Exposure of MIN6 beta cells to GPR75-targeted siRNAs for 48 hours led to significant
reductions in GPR75 mRNA expression (Figure 63a). Western blotting also indicated that
GPR75 protein expression in MIN6 beta cells was diminished after 48 hours compared to cells
that were transfected with non-coding (NC) RNAs (Figure 63b). All concentrations of CCL5
used (0.25-25nM) were able to induce reversible increases in intracellular calcium at 2mM
glucose in MIN6 beta cells that were transfected with NC RNAs (Figure 64a), which was
consistent to the response profile observed in native MIN6 beta cells (Figure 58a). However,
this response was absent in MIN6 beta cells transfected with GPR75-targeted siRNAs (Figure
64b). At 20mM glucose MIN6 beta cells transfected with NC RNAs showed increased
intracellular calcium levels in response to 0.25-25nM CCL5 (Figure 64c) and this stimulatory
effect of CCL5 at 20mM glucose was considerably diminished but not completely abolished in
MIN6 beta cells transfected with GPR75 siRNAs (Figure 64d). This could be explained by the
incomplete down-regulation of GPR75 in these cells (Figure 63).
A similar approach of down-regulating GPR75 in MIN6 beta cells was used to identify the
potential involvement of GPR75 in CCL5-induced insulin secretion from beta cells. 2.5nM
CCL5 significantly stimulated insulin secretion at 20mM glucose from MIN6 beta cells
transfected with NC RNAs, which was consistent with observations using native MIN6 beta
cells. However, this response was abolished in MIN6 beta cells transfected with GPR75 siRNAs
(Figure 65).
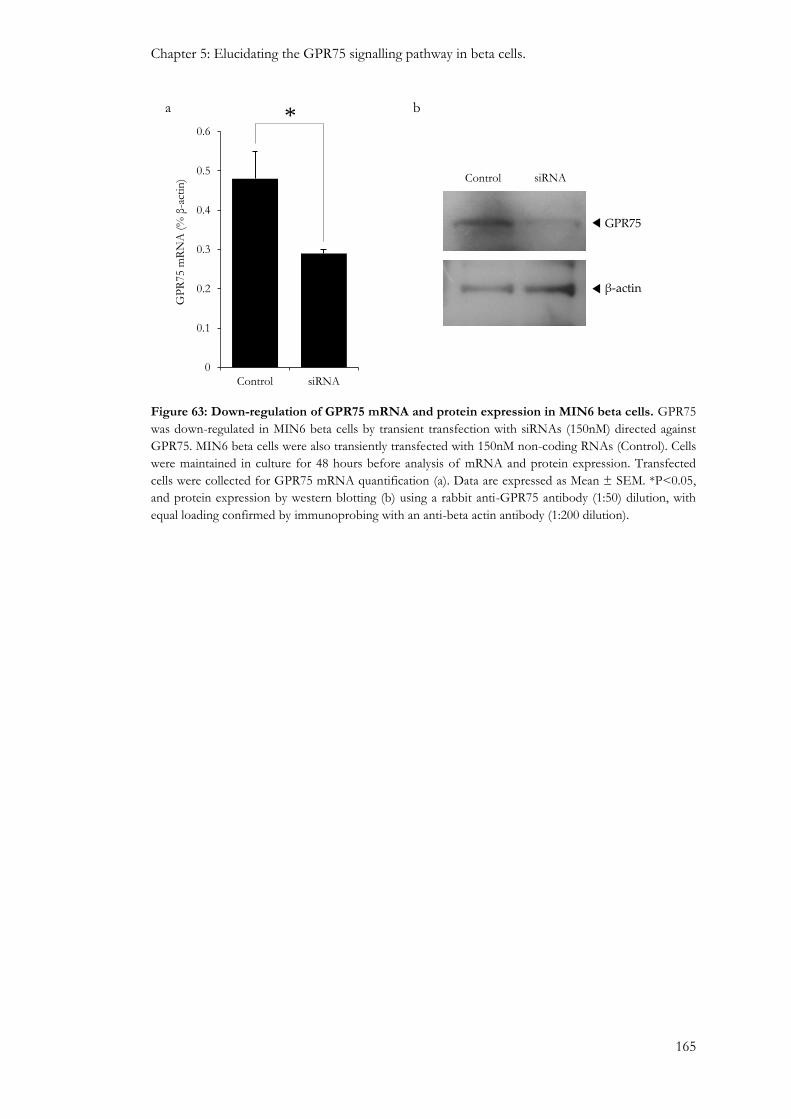
Chapter 5: Elucidating the GPR75 signalling pathway in beta cells.
165
Figure 63: Down-regulation of GPR75 mRNA and protein expression in MIN6 beta cells. GPR75
was down-regulated in MIN6 beta cells by transient transfection with siRNAs (150nM) directed against
GPR75. MIN6 beta cells were also transiently transfected with 150nM non-coding RNAs (Control). Cells
were maintained in culture for 48 hours before analysis of mRNA and protein expression. Transfected
cells were collected for GPR75 mRNA quantification (a). Data are expressed as Mean ± SEM. *P<0.05,
and protein expression by western blotting (b) using a rabbit anti-GPR75 antibody (1:50) dilution, with
equal loading confirmed by immunoprobing with an anti-beta actin antibody (1:200 dilution).
GPR75
Control
β-actin
siRNA
b
0
0.1
0.2
0.3
0.4
0.5
0.6
Control siRNA
GP
R75 m
RN
A (
% β
-act
in)
a *

Chapter 5: Elucidating the GPR75 signalling pathway in beta cells.
166
0.4
0.45
0.5
0.55
0.6
0.65
0.7
0 1 2 3 4 5 6 7 8 9 10 11 12 13 14 15 16 17 18 19 20 21 22 23 24 25 26 27
Ab
sorb
ance
(340n
m: 380n
m)
Time (Minutes)
0.25nM
CCL5
2.5nM
CCL5
25nM
CCL5 50µ
M T
ol
100µ
M A
TP
0.4
0.45
0.5
0.55
0.6
0.65
0.7
0 1 2 3 4 5 6 7 8 9 10 11 12 13 14 15 16 17 18 19 20 21 22 23 24 25 26 27
Ab
sorb
ance
(340n
m: 380n
m)
Time (Minutes)
0.25nM
CCL5
2.5nM
CCL5
25nM
CCL5 50µ
M T
ol
100µ
M A
TP
a
b

Chapter 5: Elucidating the GPR75 signalling pathway in beta cells.
167
0.35
0.4
0.45
0.5
0.55
0.6
0.65
0.7
0 5 10 15 20 25 30 35
Ab
sorb
ance
(340n
m:3
80n
m)
Time (Minutes)
20mM glucose
0.25nM
CCL5
2.5nM
CCL5
25nM
CCL5 50µ
M T
ol
100µ
M A
TP
0.35
0.4
0.45
0.5
0.55
0.6
0.65
0.7
0 5 10 15 20 25 30
Ab
sorb
ance
(340n
m:3
80n
m)
Time (Minutes)
20mM glucose
0.25nM
CCL5
2.5nM
CCL5
25nM
CCL5 50µ
M T
ol
100µ
M A
TP
c
d
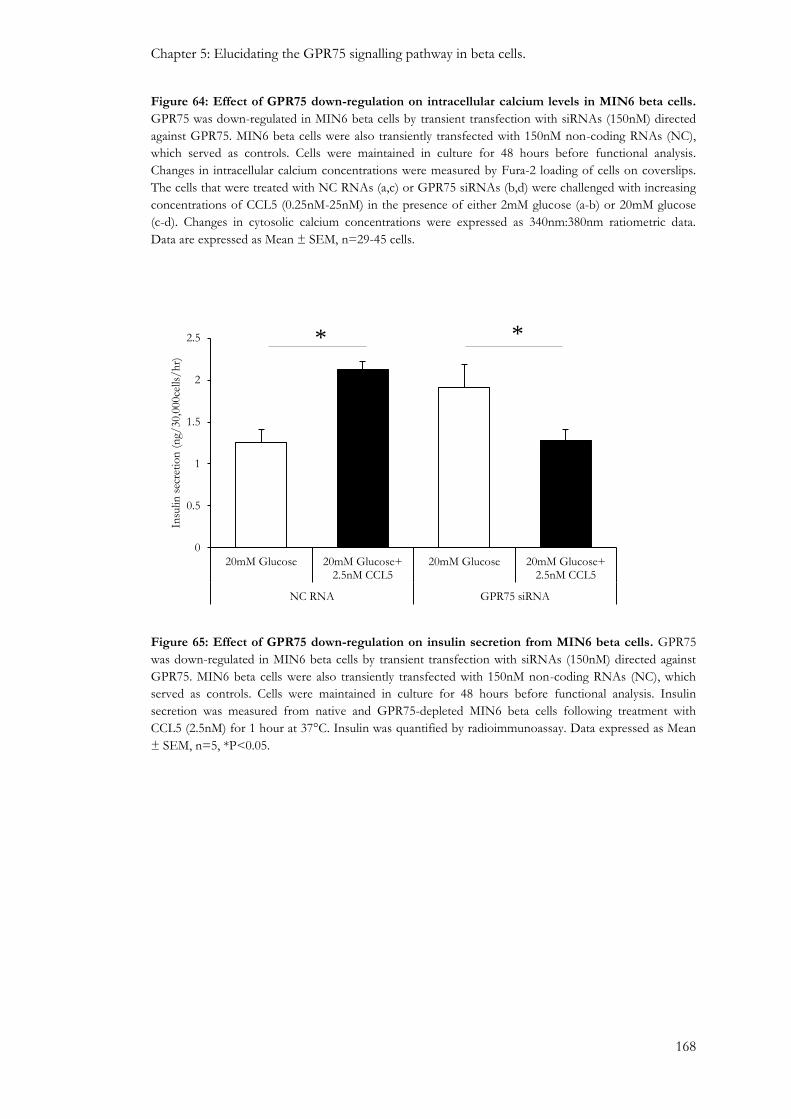
Chapter 5: Elucidating the GPR75 signalling pathway in beta cells.
168
Figure 64: Effect of GPR75 down-regulation on intracellular calcium levels in MIN6 beta cells.
GPR75 was down-regulated in MIN6 beta cells by transient transfection with siRNAs (150nM) directed
against GPR75. MIN6 beta cells were also transiently transfected with 150nM non-coding RNAs (NC),
which served as controls. Cells were maintained in culture for 48 hours before functional analysis.
Changes in intracellular calcium concentrations were measured by Fura-2 loading of cells on coverslips.
The cells that were treated with NC RNAs (a,c) or GPR75 siRNAs (b,d) were challenged with increasing
concentrations of CCL5 (0.25nM-25nM) in the presence of either 2mM glucose (a-b) or 20mM glucose
(c-d). Changes in cytosolic calcium concentrations were expressed as 340nm:380nm ratiometric data.
Data are expressed as Mean ± SEM, n=29-45 cells.
Figure 65: Effect of GPR75 down-regulation on insulin secretion from MIN6 beta cells. GPR75
was down-regulated in MIN6 beta cells by transient transfection with siRNAs (150nM) directed against
GPR75. MIN6 beta cells were also transiently transfected with 150nM non-coding RNAs (NC), which
served as controls. Cells were maintained in culture for 48 hours before functional analysis. Insulin
secretion was measured from native and GPR75-depleted MIN6 beta cells following treatment with
CCL5 (2.5nM) for 1 hour at 37°C. Insulin was quantified by radioimmunoassay. Data expressed as Mean
± SEM, n=5, *P<0.05.
0
0.5
1
1.5
2
2.5
20mM Glucose 20mM Glucose+2.5nM CCL5
20mM Glucose 20mM Glucose+2.5nM CCL5
NC RNA GPR75 siRNA
Insu
lin s
ecre
tio
n (
ng/
30,0
00ce
lls/
hr)
* *
Chapter 5: Elucidating the GPR75 signalling pathway in beta cells.
169
5.3.3: Identification of a calcium ion influx component in the beta cell GPR75 signalling
pathway.
The data presented in section 5.3.2 established that GRP75 activation is responsible for CCL5-
induced elevations in intracellular calcium in beta cells. Unstimulated beta cells maintain low
intracellular calcium concentrations, between 50-100nM, and so the second messenger property
of calcium relies on the ability of cells to rapidly and markedly elevate cytosolic calcium in
response to various stimuli (Henquin, 2000). Large calcium stores exist in the lumen of the
endoplasmic reticulum (ER) and the extracellular compartment (Henquin, 2000). The following
experiments were designed to determine whether GPR75 activation by CCL5 elevates cytosolic
calcium through calcium influx and/or mobilisation.
As illustrated in Figure 66, 0.25nM CCL5 reversibly elevated intracellular calcium in MIN6 beta
cells in the presence of a physiological buffer supplemented with 2mM calcium (Figure 66a,
black line). The same cells were still able to respond to ATP (100µM) and tolbutamide (50µM),
which served as controls, which elevate intracellular calcium by either mobilising calcium from
the endoplasmic reticulum or permitting calcium influx via VOCCs by closing KATP channels,
respectively (Figure 66a, black line). However, the response to 0.25nM CCL5 was completely
abolished when MIN6 beta cells were challenged in a calcium-free physiological buffer
supplemented with 1mM EGTA, to chelate calcium (Figure 66a, red line). The same cells were
still able to mobilise calcium and transiently elevate intracellular calcium in response to ATP
(100µM) but at a lower magnitude compared to cells in the presence of extracellular calcium,
which may be explained by diminished calcium-induced calcium release from the ER (Figure
66a, red line). Furthermore, the cells did not respond to tolbutamide (50µM), which was
expected due to the absence of extracellular calcium which is responsible for calcium influx
associated with the mode of action of tolbutamide (Figure 66a, red line).
It was important to identify the mechanism of calcium entry into beta cells since Figure 66
demonstrates that a calcium influx component was essential in mediating CCL5-induced
elevations of intracellular calcium in MIN6 beta cells. VOCCs are important for nutrient-
induced calcium influx into beta cells. Beta cells predominantly express L-type VOCCs whose
activation is important for driving the exocytosis of insulin (Braun et al., 2008). Therefore,
blockade of L-type calcium channels with nifedipine would indicate whether calcium influx into
beta cells was via the L-type VOCCs or through another unidentified mechanism.
As illustrated in Figure 67a, 0.25nM CCL5 increased intracellular calcium (black line), as
expected, in MIN6 beta cells in the absence of nifedipine. The same cells also responded to
ATP (100µM) and tolbutamide (50µM), which served as controls. However, MIN6 beta cells
that were challenged with CCL5 in the presence of nifedipine (10µM) were unable to elevate
intracellular calcium concentrations (Figure 67a, red line), but the same cells showed a transient
Chapter 5: Elucidating the GPR75 signalling pathway in beta cells.
170
response to ATP (Figure 67a, red line), clearly demonstrating that MIN6 beta cells were still
able to mobilise calcium from the internal ER calcium store after exposing the cells to ATP.
Moreover, tolbutamide was unable to elevate intracellular calcium levels in these cells (Figure
67a, red line), which supported the notion that a calcium influx component involving L-type
calcium channels was essential for mediating the effects of tolbutamide on stimulation of
cytosolic calcium levels in beta cells. Similar results were obtained in experiments using partially
dispersed human islets, as illustrated in Figure 68, which showed CCL5 elevated intracellular
calcium in human beta cells in the absence of nifedipine (Figure 68a) whereas this response was
absent in beta cells in the presence of nifedipine (10µM), as illustrated in Figure 68b. Both sets
of cells mounted appropriate responses to ATP (100µM), as expected due to reasons mentioned
earlier.

Chapter 5: Elucidating the GPR75 signalling pathway in beta cells.
171
Figure 66: Effect of CCL5 on intracellular calcium concentrations in MIN6 beta cells in the
presence or absence of extracellular calcium. Fura-2 loaded MIN6 beta cells were perifused with a
physiological buffer supplemented with 2mM glucose containing either 2mM calcium (black) or a
calcium-free physiological buffer supplemented with 1mM EGTA (red). Cells were then challenged with
0.25nM CCL5, as well as ATP (100µM) and Tolbutamide (50µM), which served as positive controls (a).
Changes in cytosolic calcium concentrations were expressed as 340nm:380nm ratiometric data. Data are
expressed as Mean ± SEM, n=39-63 cells from two separate experiments. Images of Fura-2 loaded MIN6
beta cells used for experimental analysis in the presence (b) and absence (c) of extracellular calcium.
a
0.64
0.66
0.68
0.7
0.72
0.74
0.76
0.78
0.8
0.82
0.84
0 1 2 3 4 5 6 7 8 9 10 11 12 13 14 15
Ab
sorb
ance
(340n
m: 380n
m)
Time (Minutes)
0.25nM
CCL5 100µ
M A
TP
50µ
M T
ol
b c

Chapter 5: Elucidating the GPR75 signalling pathway in beta cells.
172
Figure 67: Effect of CCL5 on intracellular calcium concentrations in MIN6 beta cells in the
absence or presence of nifedipine. Fura-2 loaded MIN6 beta cells were perifused with a physiological
buffer supplemented with 2mM glucose in the absence (black) or presence (red) of nifedipine (10µM).
Cells were then challenged with 0.25nM CCL5, as well as ATP (100µM) and Tolbutamide (50µM), which
served as positive controls (a). Changes in cytosolic calcium concentrations were expressed as
340nm:380nm ratiometric data. Data are expressed as Mean ± SEM of two separate experiments, n=28-
35 cells. Images of Fura-2 loaded MIN6 beta cells used for experimental analysis in the absence (b) or
presence (c) of nifedipine.
0.64
0.66
0.68
0.7
0.72
0.74
0.76
0 1 2 3 4 5 6 7 8 9 10 11 12 13 14 15
Ab
sorb
ance
(340n
m: 380n
m)
Time (Minutes)
0.25nM
CCL5 100µ
M A
TP
50µ
M T
ol
a
b c

Chapter 5: Elucidating the GPR75 signalling pathway in beta cells.
173
0.61
0.62
0.63
0.64
0.65
0.66
0.67
0.68
0.69
0.7
0 1 2 3 4 5 6 7 8 9 10 11 12
Ab
sorb
ance
(340n
m : 3
80n
m)
Time (Minutes)
10nM CCL5
a
10nM CCL5
0.63
0.64
0.65
0.66
0.67
0.68
0.69
0.7
0 1 2 3 4 5 6 7 8 9 10 11 12
Ab
sorb
ance
(340n
m : 3
80n
m)
Time (Minutes)
100µ
M A
TP
b 100µ
M A
TP
Figure 68: Effect of CCL5 on human islet intracellular calcium levels in the absence or presence
of nifedipine. Isolated human islets were dispersed and seeded at a density of 100 islets per Cell-Tak
coated coverslip and loaded with 5µM Fura-2 before being perifused with a physiological buffer
supplemented with 2mM glucose in the absence (a) or presence (b) of nifedipine (10µM). Cells were then
challenged with 10nM CCL5, as well as ATP (100µM), which served as a positive control. Changes in
cytosolic calcium concentrations were expressed as 340nm:380nm ratiometric data. Data are expressed as
Mean ± SEM of two separate experiments, n=7-17 cells. Images inset shows Fura-2 loaded human islet
beta cells used for experiment analysis.

Chapter 5: Elucidating the GPR75 signalling pathway in beta cells.
174
5.3.4: Effect of opening beta cell KATP channels on CCL5-induced insulin secretion.
The identification of a calcium influx component, which was essential for CCL5-induced
elevations in intracellular calcium, warranted further investigation of the influence KATP channel
closure has on the open probability of L-type VOCCs upon GPR75 activation by CCL5.
A static incubation experiment was initially carried out to determine the effect of diazoxide,
which is a selective ATP-sensitive K+ channel activator, on insulin secretion. As illustrated in
Figure 69, mouse islets significantly increased insulin secretion by approximately 10-fold in
response to a glucose stimulus (20mM), as expected, and this response was significantly
inhibited by 250µM diazoxide, a concentration that has been established to effectively activate
ATP-sensitive K+ channels. This demonstrated that opening KATP channels preserved the
hyperpolarised state of the beta cell membrane, which prevented calcium influx from the
extracellular compartment into the beta cell cytosol and thus prevented glucose from
stimulating insulin secretion.
To identify whether GPR75 activation by CCL5 was permitting calcium to enter beta cells via
KATP channel closure and ensuing membrane depolarisation, mouse islets were treated with
250µM diazoxide in the absence or presence of CCL5, at 2mm glucose. This glucose
concentration was selected so that the effect of diazoxide on the secretory response to CCL5
could be determined separately from its inhibition of GSIS. Diazoxide did not influence insulin
secretion and demonstrating that closure of KATP channels did not influence insulin secretion at
sub-stimulatory glucose concentrations but only in the presence of a glucose stimulus (Figure
70). Mouse islets increased insulin secretion by 72% when challenged with CCL5 at 2mM
glucose and this response was lost when islets were treated with CCL5 in the presence of
250µM diazoxide (Figure 70).
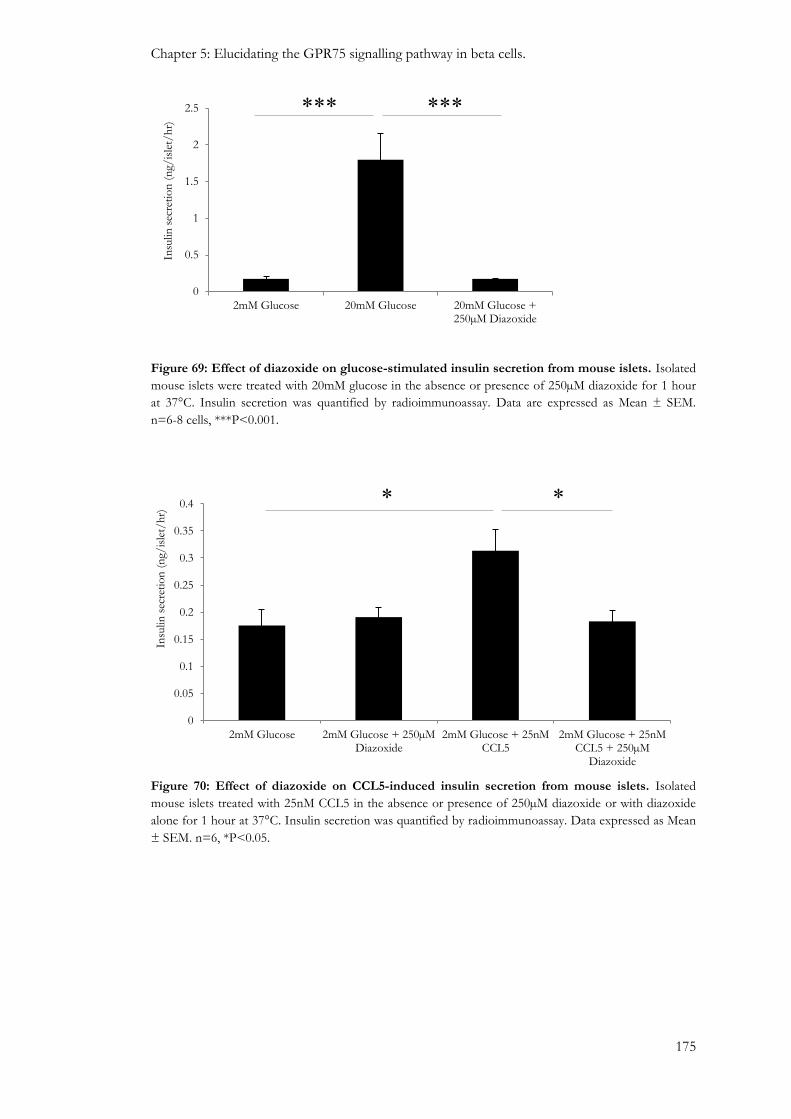
Chapter 5: Elucidating the GPR75 signalling pathway in beta cells.
175
Figure 69: Effect of diazoxide on glucose-stimulated insulin secretion from mouse islets. Isolated
mouse islets were treated with 20mM glucose in the absence or presence of 250µM diazoxide for 1 hour
at 37°C. Insulin secretion was quantified by radioimmunoassay. Data are expressed as Mean ± SEM.
n=6-8 cells, ***P<0.001.
Figure 70: Effect of diazoxide on CCL5-induced insulin secretion from mouse islets. Isolated
mouse islets treated with 25nM CCL5 in the absence or presence of 250µM diazoxide or with diazoxide
alone for 1 hour at 37°C. Insulin secretion was quantified by radioimmunoassay. Data expressed as Mean
± SEM. n=6, *P<0.05.
0
0.5
1
1.5
2
2.5
2mM Glucose 20mM Glucose 20mM Glucose +250µM Diazoxide
Insu
lin s
ecre
tio
n (
ng/
isle
t/h
r)
*** ***
0
0.05
0.1
0.15
0.2
0.25
0.3
0.35
0.4
2mM Glucose 2mM Glucose + 250µMDiazoxide
2mM Glucose + 25nMCCL5
2mM Glucose + 25nMCCL5 + 250µM
Diazoxide
Insu
lin s
ecre
tio
n (
ng/
isle
t/h
r) * *

Chapter 5: Elucidating the GPR75 signalling pathway in beta cells.
176
5.3.5: Involvement of PLC in the stimulus-secretion coupling of CCL5.
The newly identified ability of GPR75 activation by CCL5 to induce calcium entry into beta
cells, presumably via KATP channel closure, warranted investigation into the potential coupling
of GPR75 to the Gαq protein in beta cells. Calcium microfluorimetry experiments demonstrated
that CCL5-induced elevation in intracellular calcium concentrations in MIN6 beta cells is
reduced in the presence of the PLC inhibitor, U73122 (Figure 71 and Figure 72). It is worth
noting that U73122 did not completely abolish CCL5-induced elevations in intracellular
calcium.
The notion that CCL5 mediated its downstream effects through PLC stimulation was further
supported by insulin secretion studies. Thus, MIN6 beta cells responded to 2.5nM CCL5 by
elevating insulin secretion in the absence of U73122 but this stimulatory response was abolished
in the presence of U73122 (Figure 73). In human islets CCh-induced insulin secretion at 20mM
glucose was abolished in the presence of U73122 (Figure 74a), which confirmed signalling of
the muscarinic (M3) receptor via the Gαq-PLC cascade. In parallel experiments, human islets
treated with 10nM CCL5 stimulated insulin secretion at 20mM glucose but the stimulatory
response to CCL5 was lost in the presence of 10µM U73122 (Figure 74b).

Chapter 5: Elucidating the GPR75 signalling pathway in beta cells.
177
Figure 71: Effect of U73122 on CCL5-induced elevations in intracellular calcium in MIN6 beta
cells. Fura-2 loaded MIN6 beta cells were perifused with a physiological buffer supplemented with 2mM
glucose in the absence (black) or presence (red) of U73122 (10µM). Cells were then challenged with
0.25nM CCL5. Changes in cytosolic calcium concentrations were expressed as 340nm:380nm ratiometric
data. Data are expressed as Mean ± SEM of two separate experiments, n=47-63 cells. Image inset shows
Fura-2 loaded MIN6 beta cells used for experimental analysis.
0.66
0.68
0.7
0.72
0.74
0.76
0.78
0 1 2 3 4 5 6 7
Ab
sorb
ance
(340n
m :380n
m)
Time (Minutes)
0.25nM CCL5
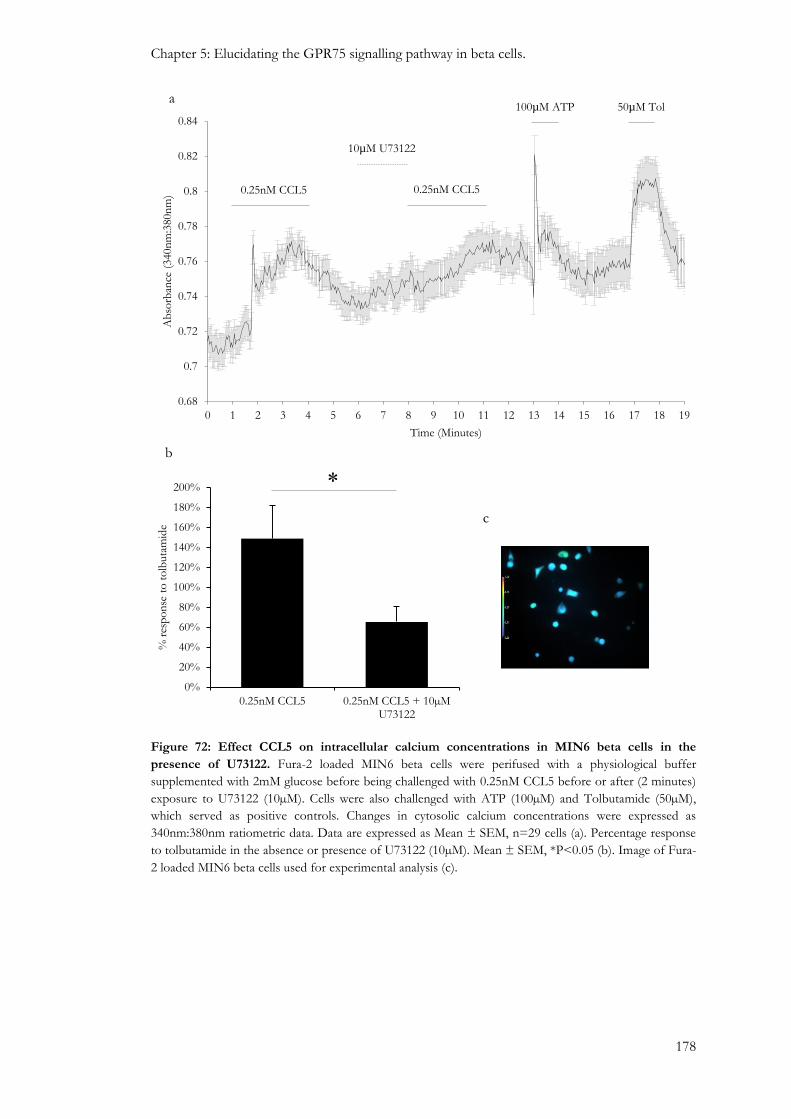
Chapter 5: Elucidating the GPR75 signalling pathway in beta cells.
178
Figure 72: Effect CCL5 on intracellular calcium concentrations in MIN6 beta cells in the
presence of U73122. Fura-2 loaded MIN6 beta cells were perifused with a physiological buffer
supplemented with 2mM glucose before being challenged with 0.25nM CCL5 before or after (2 minutes)
exposure to U73122 (10µM). Cells were also challenged with ATP (100µM) and Tolbutamide (50µM),
which served as positive controls. Changes in cytosolic calcium concentrations were expressed as
340nm:380nm ratiometric data. Data are expressed as Mean ± SEM, n=29 cells (a). Percentage response
to tolbutamide in the absence or presence of U73122 (10µM). Mean ± SEM, *P<0.05 (b). Image of Fura-
2 loaded MIN6 beta cells used for experimental analysis (c).
a
0.68
0.7
0.72
0.74
0.76
0.78
0.8
0.82
0.84
0 1 2 3 4 5 6 7 8 9 10 11 12 13 14 15 16 17 18 19
Ab
sorb
ance
(340n
m:3
80n
m)
Time (Minutes)
0.25nM CCL5 0.25nM CCL5
10µM U73122
100µM ATP 50µM Tol
0%
20%
40%
60%
80%
100%
120%
140%
160%
180%
200%
0.25nM CCL5 0.25nM CCL5 + 10µMU73122
% r
esp
on
se t
o t
olb
uta
mid
e
*
b
c

Chapter 5: Elucidating the GPR75 signalling pathway in beta cells.
179
Figure 73: Effect of U73122 on CCL5-induced insulin secretion in MIN6 beta cells. MIN6 beta
cells were pre-incubated with a physiological buffer supplemented with 2mM glucose for 2 hours before
being challenged with 20mM glucose alone or with 2.5nM CCL5 in the absence or presence of U73122
(10µM) for 1 hour at 37°C. Data are expressed as Mean ± SEM, n=4-6, *P<0.05.
0
1
2
3
4
5
6
7
8
9
10
20mM Glucose 20mM Glucose +2.5nM CCL5
20mM Glucose +2.5nM CCL5 + 10µM
U73122
20mM Glucose+10µMU73122
Insu
lin s
ecre
tio
n (
ng/
30,0
00ce
lls/
hr)
* *

Chapter 5: Elucidating the GPR75 signalling pathway in beta cells.
180
Figure 74: Effect of U73122 on CCL5 and Carbachol (CCh)-induced insulin secretion in human
islets. Isolated human islets were pre-incubated with a physiological buffer supplemented with 2mM
glucose for 1 hour before being challenged with either 20mM glucose alone, 500µM CCh (a) or 10nM
CCL5 (b), in the absence or presence of U73122 (10µM) for 1 hour at 37°C. Data are expressed as Mean
± SEM, n=4-7, *P<0.05.
*
0
0.2
0.4
0.6
0.8
1
1.2
1.4
1.6
2mM Glucose 20mM glucose 20mM Glucose +500µM CCh
20mM Glucose +500µM CCh + 10µM
U73122
Insu
lin s
ecre
tio
n (
ng/
isle
t/h
r)
*
a
0
0.2
0.4
0.6
0.8
1
1.2
1.4
1.6
2mM Glucose 20mM glucose 20mM Glucose+10nM CCL5
20mM Glucose+10nM CCL5 +10µM U73122
Insu
lin
secr
etio
n (
ng/
isle
t/h
r)
*
b
*
*

Chapter 5: Elucidating the GPR75 signalling pathway in beta cells.
181
5.3.6: Involvement of protein kinases in the GPR75 signalling pathway.
It has been identified that components of a calcium influx mechanism in beta cells involves
closure of ATP-sensitive K+ channels and opening of L-type calcium channels, through PLC
activation, upon GPR75 activation by CCL5. IP3 and DAG are generated from the hydrolysis of
PIP2 by PLC and it is therefore conceivable that DAG, which is a PKC activator, may have a
role in the stimulatory effects associated with CCL5 in the beta cell on intracellular calcium and
insulin secretion. Therefore, experiments were carried out to identify a potential role of PKC
within the GPR75 signalling pathway.
The involvement of protein kinases downstream of GPR75 were initially investigated by using
staurosporine (STP), which is a broad spectrum kinase inhibitor that inhibits
phospholipid/calcium dependent protein kinases. As illustrated in Figure 75, calcium
microfluorimetry experiments demonstrated that intracellular calcium concentrations were
significantly diminished by 40% in Fura-2 loaded MIN6 beta cells that were challenged with
0.25nM CCL5 in the presence of STP (200nM), as illustrated in Figure 75a. Furthermore,
CCL5-induced insulin secretion in MIN6 beta cells was abolished in the presence of 200nM
STP (Figure 76). Surprisingly, insulin secretion levels in MIN6 beta cells that were treated with
CCL5 (2.5nM) in the presence of STP (200nM) were significantly below to those observed in
beta cells treated with STP alone, which on its own did not have any effect on GSIS (Figure 76).
A similar pattern was observed in human islets in which CCL5 potentiation of GSIS was also
inhibited when treated with 200nM STP (Figure 77).
The potential role of PKC in the GPR75 signalling pathway was then investigated after
demonstrating that protein kinase activation was partially required for mediating CCL5-induced
elevations in intracellular calcium and was essential for insulin secretion. Pharmacological
inhibition of PKC using Ro-31-8220 (10µM) significantly inhibited CCL5-induced insulin
secretion from MIN6 beta cells (Figure 78), but this response was not completely abolished.
The concentration of Ro-31-8220 used may not have been fully inhibiting PKC, or the data may
also implicate other protein kinases that are involved in insulin secretion associated with CCL5
activation of GPR75.
It is worth noting that Ro-31-8220 inhibits all PKC isoforms. To identify which PKC isoforms
were stimulated upon GPR75 activation an alternative approach of pharmacologically depleting
phorbol ester-sensitive PKC isoforms by long-term (>24 hours) exposure to PMA was
implemented. The success of this strategy was verified by calcium microfluorimetry
experiments, which demonstrated that acute exposure to 500nM PMA failed to elevate
intracellular calcium concentrations in Fura-2 loaded MIN6 beta cells that were chronically
exposed to 200nM PMA (Figure 79a). However, MIN6 beta cells treated long-term with 200nM

Chapter 5: Elucidating the GPR75 signalling pathway in beta cells.
182
4αPDD, which is an inactive analogue of PMA and served as a negative control, were able to
elevate intracellular calcium levels in response to CCL5 (Figure 79b). Furthermore, 500nM
PMA induced insulin secretion at 20mM glucose from MIN6 beta cells treated with 200nM
4αPDD for 24 hours but this response was abolished when MIN6 beta cells were treated for 24
hours with 200nM PMA, as illustrated in Figure 79c. 25nM CCL5 and 500nM PMA both
potentiated GSIS by 1.2-fold and 1.9-fold, respectively, from MIN6 beta cells (Figure 80a) and
similar responses were observed in MIN6 beta cells treated with 4αPDD for 24 hours (Figure
80b). However, when MIN6 beta cells were treated for 24 hours with 200nM PMA neither
CCL5 nor PMA were able to potentate insulin secretion (Figure 80c). Similar observations were
made using human islets. In these experiments islets showed increased insulin secretion in
response to 10nM CCL5 and 500nM PMA at 20mM glucose (Figure 81a), and this was also
evident in human islets treated long-term with 4αPDD for 24 hours (Figure 81b). However,
human islets lost the ability to stimulate insulin secretion in response to CCL5 and PMA when
treated long-term with 200nM PMA (Figure 81c).
The preceding data suggest that CCL5-induced insulin secretion is mediated through a phorbol
ester-sensitive PKC isoform. Therefore, it was important to identify the specific PKC isoform
that was responsible for mediating the effects of CCL5 on insulin secretion. Both conventional
and novel PKC isoforms are sensitive to phorbol esters but only the conventional PKC
isoforms are sensitive to calcium with several PKC isoforms expressed in islets and beta cells,
which include PKCα, βII, δ, ε, ζ and ι (Kaneto et al., 2002, Carpenter et al., 2004, Tang and
Sharp, 1998, Tian et al., 1996, Knutson and Hoenig, 1994). GÖ6976, is a PKC inhibitor that
discriminates between calcium-dependent (conventional) and calcium-independent (novel) PKC
isoforms by inhibiting the conventional PKC isoforms. As illustrated in Figure 82, 500nM PMA
increased intracellular calcium levels in Fura-2 loaded MIN6 beta cells and this response was
inhibited in the presence of 1µM GÖ6976, demonstrating that this was an effective
concentration for inhibiting conventional PKC isoforms in native MIN6 beta cells. When
MIN6 beta cells were challenged with 2.5nM CCL5 insulin secretion increased by 1.3-fold
(Figure 83), and this effect was also seen in the presence of 1µM GÖ6976. This suggests that
novel PKC isoforms may be stimulated upon GPR75 activation and thus may be a component
of GPR75 signalling responsible for stimulating insulin secretion from beta cells in response to
CCL5.
Pancreatic beta cells express several kinases that are sensitive to calcium and the calcium
binding protein calmodulin. Calcium/calmodulin-dependent protein kinase II (CAMK II) has
been implicated in maintaining normal insulin secretory responses to elevated intracellular
calcium levels (Jones and Persaud, 1998a, Easom et al., 1997, Hughes et al., 1993). Therefore, it
was important to investigate whether CAMK II activation was part of the GPR75 signalling

Chapter 5: Elucidating the GPR75 signalling pathway in beta cells.
183
cascade and if it facilitated CCL5-induced insulin secretion. Insulin secretion experiments using
MIN6 beta cells demonstrated that 10µM KN-62, which is a CAMK II inhibitor, inhibited
insulin secretion in response to 2.5nM CCL5 (Figure 84). This was also evident in human islets
where 10µM KN-62 significantly inhibited insulin secretion induced by CCL5 (10nM), as
illustrated in Figure 85.

Chapter 5: Elucidating the GPR75 signalling pathway in beta cells.
184
Figure 75: Effect of CCL5 in the absence or presence of staurosporine (STP) on intracellular
calcium in MIN6 beta cells. Fura-2 loaded MIN6 beta cells were challenged with 0.25nM CCL5 in the
absence or presence of 200nM STP. Changes in cytosolic calcium concentrations were expressed as
340nm:380nm ratiometric data. Percentage response of CCL5 to tolbutamide in the absence or presence
of STP (a). Data are expressed as Mean ± SEM. n=37-49 cells. Images of MIN6 beta cells used for
experiment analysis (b).
*
0%
10%
20%
30%
40%
50%
60%
70%
80%
90%
100%
110%
120%
0.25nM CCL5 0.25nM CCL5 + 200nM STP
% t
olb
uta
mid
e re
spo
nse
a b
CCL5
CCL5 + STP
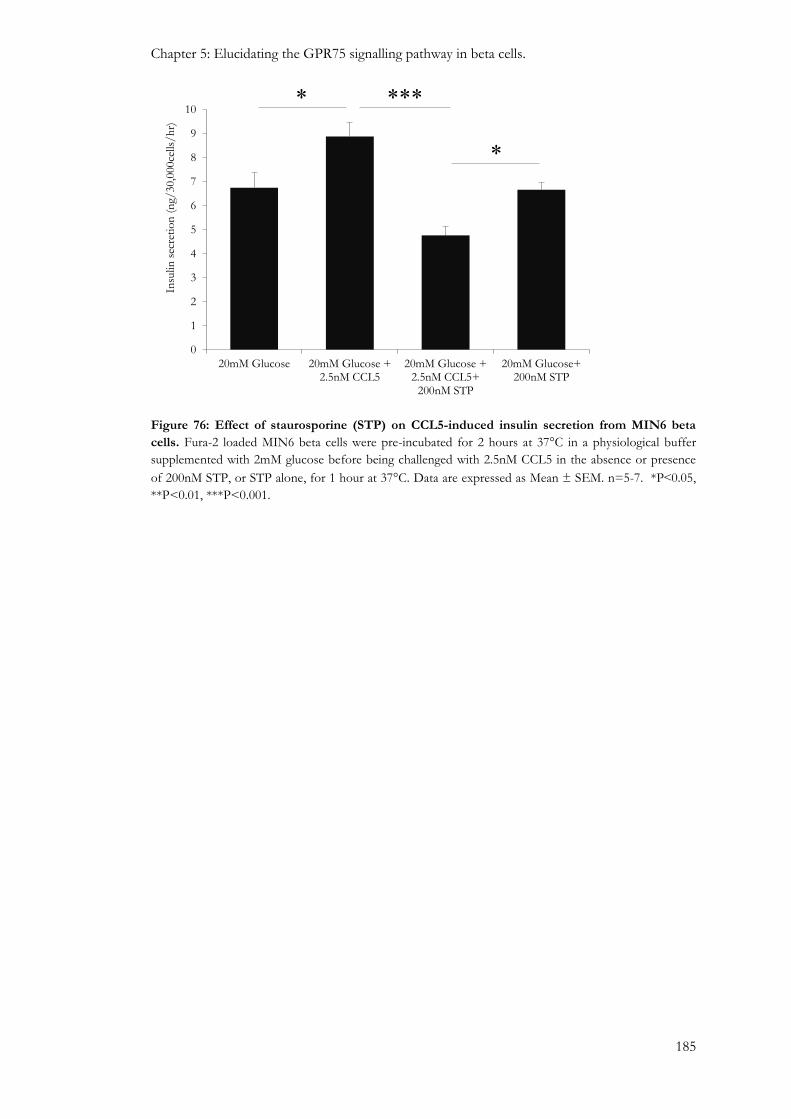
Chapter 5: Elucidating the GPR75 signalling pathway in beta cells.
185
Figure 76: Effect of staurosporine (STP) on CCL5-induced insulin secretion from MIN6 beta
cells. Fura-2 loaded MIN6 beta cells were pre-incubated for 2 hours at 37°C in a physiological buffer
supplemented with 2mM glucose before being challenged with 2.5nM CCL5 in the absence or presence
of 200nM STP, or STP alone, for 1 hour at 37°C. Data are expressed as Mean ± SEM. n=5-7. *P˂0.05,
**P<0.01, ***P<0.001.
*
0
1
2
3
4
5
6
7
8
9
10
20mM Glucose 20mM Glucose +2.5nM CCL5
20mM Glucose +2.5nM CCL5+
200nM STP
20mM Glucose+200nM STP
Insu
lin s
ecre
tio
n (
ng/
30,0
00ce
lls/
hr)
***
*

Chapter 5: Elucidating the GPR75 signalling pathway in beta cells.
186
Figure 77: Effect of staurosporine (STP) on CCL5-induced insulin secretion from human islets.
Isolated human islets were incubated for 24 hours in serum containing CMRL at 37°C. Islets were then
pre-incubated for 1 hour at 37°C in a physiological buffer supplemented with 2mM glucose before being
treated with 10nM CCL5 in the absence or presence of 200nM STP for 1 hour at 37°C. Data expressed
as Mean ± SEM. n=4-7, **P˂0.01.
Figure 78: Effect of Ro-31-8220 on CCL5-induced insulin secretion from MIN6 beta cells. MIN6
beta cells were pre-incubated for 2 hours at 37°C in a physiological buffer supplemented with 2mM
glucose before being challenged with 20mM glucose alone or with 2.5nM CCL5 in the absence or
presence of 10µM Ro-31-8220 for 1 hour at 37°C. Data expressed as Mean ± SEM. n=5-6 cells. *P<0.05,
***P˂0.001.
0
0.2
0.4
0.6
0.8
1
1.2
2mM Glucose 20mM glucose 20mM Glucose+10nM CCL5
20mM Glucose +10nM CCL5 +
200nM STP
Insu
lin s
ecre
tio
n (
ng/
isle
t/h
r)
**
0
1
2
3
4
5
6
7
20mM Glucose 20mM Glucose +2.5nM CCL5
20mM Glucose +2.5nM CCL5 + 10µM
Ro-31-8220
Insu
lin s
ecre
tio
n (
ng/
30,0
00ce
lls/
hr)
*** *

Chapter 5: Elucidating the GPR75 signalling pathway in beta cells.
187
0.66
0.68
0.7
0.72
0.74
0.76
0.78
0.8
0.82
0.84
0 1 2 3 4 5 6 7 8 9 10 11
Ab
sorb
ance
(340n
m:3
80n
m)
Time (Minutes)
500nM PMA
50µ
M T
ol
0.66
0.68
0.7
0.72
0.74
0.76
0.78
0.8
0.82
0.84
0 1 2 3 4 5 6 7 8 9 10 11
Ab
sorb
ance
(340n
m:3
80n
m)
Time (Minutes)
500nM PMA
50µ
M T
ol
a
b

Chapter 5: Elucidating the GPR75 signalling pathway in beta cells.
188
Figure 79: Effect of PKC depletion on intracellular calcium levels and insulin secretion in MIN6
beta cells when acutely exposed to PMA. MIN6 beta cells were seeded at a density of 30,000 or
50,000 cells per coverslip or well for measuring intracellular calcium or insulin secretion, respectively.
Cells were incubated in serum containing DMEM for 24 hours at 37°C before being incubated in the
presence of 200nM 4αPDD or 200nM PMA for a further 24 hours at 37°C. Calcium measurement
studies involved 4αPDD (a) or PMA (b) treated cells that were loaded with 5µM Fura-2 for 30 minutes
before being acutely challenged with 500nM PMA, as well as with 50µM Tolbutamide, which served as
positive control. Data are expressed as Mean ± SEM. n=27-37 cells (images inset shows MIN6 beta cells
used for calcium measurement studies). Insulin secretion studies involved pre-incubating cells with a
physiological buffer supplemented with 2mM glucose for 2 hours at 37°C before being challenged with
20mM glucose in the absence or presence of 500nM PMA for 1 hour at 37°C. Data are expressed as
Mean ± SEM, n=8 cells, *P<0.001 (C).
0
1
2
3
4
5
6
7
8
9
20mM Glucose 20mM Glucose +500nM PMA
20mM Glucose 20mM Glucose +500nM PMA
4αPDD PMA
Insu
lin s
ecre
tio
n (
ng/
30,0
00ce
lls/
hr)
***
c

Chapter 5: Elucidating the GPR75 signalling pathway in beta cells.
189
0
2
4
6
8
10
12
14
16
20mM Glucose 20mM Glucose + 25nMCCL5
20mM Glucose+ 500nMPMA
Control
Insu
lin s
ecre
tio
n (
ng/
30,0
00ce
lls/
hr)
0
2
4
6
8
10
12
14
16
20mM Glucose 20mM Glucose + 25nMCCL5
20mM Glucose+ 500nMPMA
4αPDD
Insu
lin s
ecre
tio
n (
ng/
30,0
00ce
lls/
hr)
0
2
4
6
8
10
12
14
16
20mM Glucose 20mM Glucose + 25nMCCL5
20mM Glucose+ 500nMPMA
PMA
Insu
lin s
ecre
tio
n (
ng/
30,0
00ce
lls/
hr)
*
*
a
b
c
***
***
Chapter 5: Elucidating the GPR75 signalling pathway in beta cells.
190
Figure 80: Effect of PKC depletion on CCL5-induced insulin secretion from MIN6 beta cells.
MIN6 beta cells seeded at a density of 30,000 cells per well were incubated for 24 hours in DMEM,
which served as a control (a) or in DMEM supplemented with 200nM 4αPDD (b) or 200nM PMA (c) at
37°C. Cells were then challenged with 25nM CCL5 or 500nM PMA in the presence of 20mM glucose for
1 hour at 37°C. Data are expressed as Mean ± SEM, n=6-8, *P<0.05, ***P<0.001.
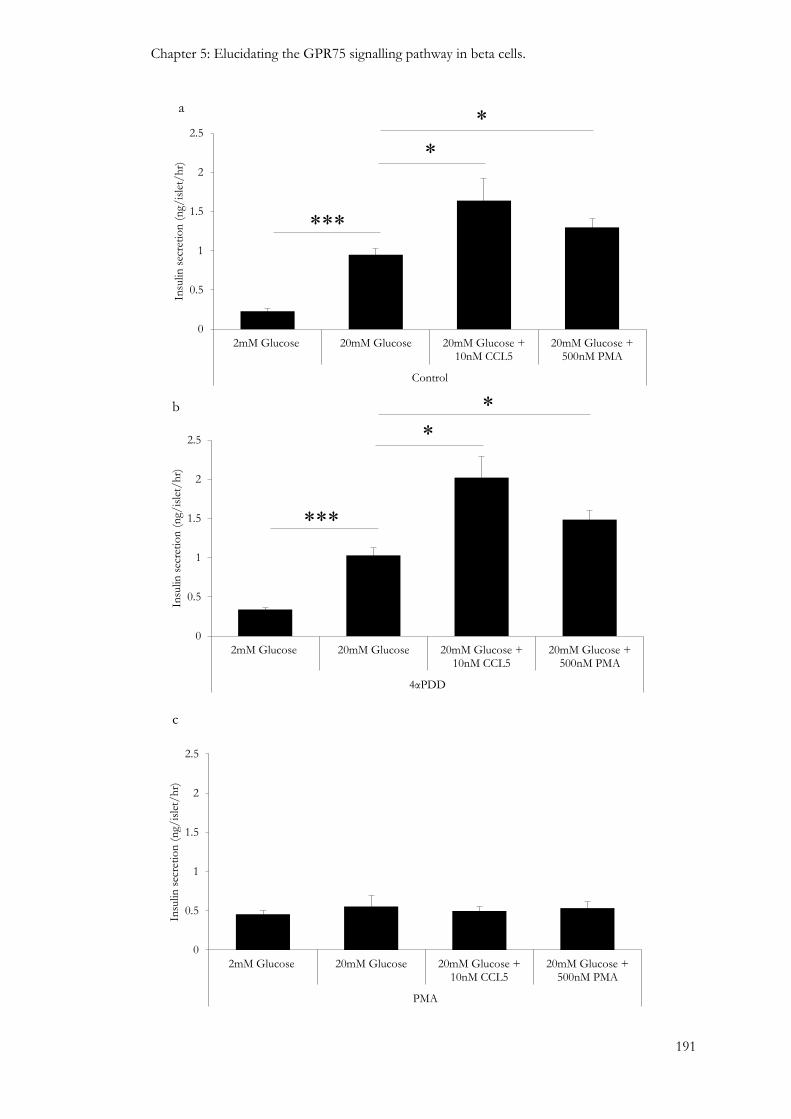
Chapter 5: Elucidating the GPR75 signalling pathway in beta cells.
191
0
0.5
1
1.5
2
2.5
2mM Glucose 20mM Glucose 20mM Glucose +10nM CCL5
20mM Glucose +500nM PMA
Control
Insu
lin s
ecre
tio
n (
ng/
isle
t/h
r)
0
0.5
1
1.5
2
2.5
2mM Glucose 20mM Glucose 20mM Glucose +10nM CCL5
20mM Glucose +500nM PMA
4αPDD
Insu
lin s
ecre
tio
n (
ng/
isle
t/h
r)
0
0.5
1
1.5
2
2.5
2mM Glucose 20mM Glucose 20mM Glucose +10nM CCL5
20mM Glucose +500nM PMA
PMA
Insu
lin s
ecre
tio
n (
ng/
isle
t/h
r)
*
*
a
b
c
*
*
***
***
*

Chapter 5: Elucidating the GPR75 signalling pathway in beta cells.
192
Figure 81: Effect of PKC depletion on CCL5-induced insulin secretion from human islets.
Isolated human islets were treated with CMRL, which served as a control (a) or with CMRL
supplemented with 200nM 4αPDD (b) or 200nM PMA (c) at 37°C for 24 hours. Cells were then pre-
incubated with a physiological buffer supplemented with 2mM glucose for 1 hour at 37°C before being
challenged with 10nM CCL5 or 500 PMA in the presence of 20mM glucose for 1 hour at 37°C. Data are
expressed as Mean ± SEM, n=5-8, *P<0.05, ***P<0.001.
Figure 82: The effect of PMA on intracellular calcium in MIN6 beta cells exposed to GÖ6976.
Fura-2 loaded MIN6 beta cells were challenged with 500nM PMA in the absence or presence of 1µM
GÖ6976. Cells were also challenged with 100µM ATP and 50µM Tolbutamide, which served as positive
controls. Changes in cytosolic calcium concentrations were expressed as 340nm:380nm ratiometric data.
Data are expressed as Mean ± SEM. n=101 cells.
0.66
0.68
0.7
0.72
0.74
0.76
0.78
0 1 2 3 4 5 6 7 8 9 10 11 12 13 14 15 16 17 18 19 20 21 22 23 24 25 26 27
Ab
sorb
ance
(340n
m:3
80n
m)
Time (Minutes)
500nM PMA
500nM PMA +
1µM GÖ6976
100µ
M A
TP
50µ
M T
ol

Chapter 5: Elucidating the GPR75 signalling pathway in beta cells.
193
Figure 83: Effect of GÖ6976 on CCL5-induced insulin secretion from MIN6 beta cells. MIN6 beta
cells were pre-incubated for 2 hours at 37°C in a physiological buffer supplemented with 2mM glucose
before being challenged with 20mM glucose alone or supplemented with 2.5nM CCL5 in the absence or
presence of 1µM GÖ6976 and incubated for 1 hour at 37°C. Data are expressed as Mean ± SEM. n=5-7.
Figure 84: Effect of KN-62 on CCL5-induced insulin secretion from MIN6 beta cells. MIN6 beta
cells were pre-incubated for 2 hours at 37°C in a physiological buffer supplemented with 2mM glucose
before being challenged with 20mM glucose alone or with 20mM glucose + 2.5nM CCL5 in the absence
or presence of 10µM KN-62, or KN-62 alone, for 1 hour at 37°C. Data are expressed as Mean ± SEM.
n=5-7. ***P<0.001.
0
1
2
3
4
5
6
7
8
9
10
11
20mM Glucose 20mM Glucose +2.5nM CCL5
20mM Glucose +2.5nM CCL5+1µM
GÖ6976
20mM Glucose +1µM GÖ6976
Insu
lin s
ecre
tio
n (
ng/
30,0
00ce
lls/
hr)
0
1
2
3
4
5
6
7
8
9
10
20mM Glucose 20mM Glucose + 2.5nMCCL5
20mM Glucose + 2.5nMCCL5+ 10µM KN62
20mM Glucose+10µMKN62
Insu
lin
sec
reti
on
(n
g/3
0,00
0cel
ls/h
r) ***

Chapter 5: Elucidating the GPR75 signalling pathway in beta cells.
194
Figure 85: Effect of the KN-62 on CCL5-induced insulin secretion from human islets. Isolated
human islets were pre-incubated for 1 hour at 37°C in a physiological buffer supplemented with 2mM
glucose before being challenged with 20mM glucose alone or with 20mM glucose + 10nM CCL5 in the
absence or presence of 10µM KN-62, or KN-62 alone, for 1 hour at 37°C. Data are expressed as Mean ±
SEM, n=5-7, *P<0.05, ***P<0.001.
*
***
0
0.2
0.4
0.6
0.8
1
1.2
1.4
2mM Glucose 20mM Glucose 20mM Glucose +10nM CCL5
20mM Glucose +10nM CCL5 +10µM KN62
20mM Glucose+10µM KN62
Insu
lin s
ecre
tio
n (
ng/
isle
t/h
r)
*

Chapter 5: Elucidating the GPR75 signalling pathway in beta cells.
195
5.4: Discussion
Data in chapter 3 in this thesis have indicated that GPR75 is the most abundantly expressed
CCL5 receptor in mouse and human islets and it co-localises with alpha and beta cell
populations. Furthermore, CCL5 is endogenously expressed in islets and it can stimulate insulin
secretion. Conventional CCL5 receptors, which are coupled to the inhibitory Gα protein, are
expressed at extremely low or non-existent levels and it is therefore presumed that the
stimulatory effect of CCL5 on insulin secretion is mediated via the activation of the Gαq-
coupled GPR75. This chapter focused on two main aspects associated with the stimulus-
secretion coupling of CCL5, which was to identify whether GPR75 is responsible for mediating
the stimulatory effects of CCL5 in beta cells, and, if so, deduce the beta cell GPR75 signalling
pathway.
The primary response of beta cells to nutrient secretagogues such as glucose, is to elevate
intracellular calcium concentrations (Rorsman et al., 1984, Gylfe et al., 1991), which are
maintained at approximately 100nM in unstimulated beta cells and can increase to in excess of
500nM following stimulation with secretagogues (Draznin, 1988, Prentki and Wollheim, 1984).
The elevation of intracellular calcium is considered to be the key event in regulating the insulin
secretory process (Hellman et al., 1994, Jones et al., 1985). GSIS is inhibited when intracellular
calcium concentrations exceed 10mM, but extracellular calcium concentrations ranging between
0.1mM and 1mM fail to promote insulin release even though calcium influx is observed,
whereas extracellular calcium concentrations ranging between 1-5mM can trigger the onset of
insulin release (Wollheim and Sharp, 1981, Curry et al., 1968). Physiological secretagogues can
either promote calcium influx and/or mobilise calcium from internal calcium stores such as the
endoplasmic reticulum or mitochondria (Draznin, 1988). Non-nutrient-induced insulin
secretions via activation of Gαq protein-coupled receptors expressed by beta cells, such as
GPR54, have been associated with elevations in intracellular calcium concentrations in beta cells
(Hauge-Evans et al., 2006, Bowe et al., 2009). GPR75 couples to the Gαq protein and its
overexpression has been implicated in CCL5-induced elevations in intracellular calcium in
CHO-K1 cells (Ignatov et al., 2006).
Calcium microfluorimetry experiments demonstrated that intracellular calcium concentrations
were reversibly elevated in response to increasing concentrations of CCL5 at a sub-stimulatory
glucose concentration in Fura-2 loaded MIN6 beta cells (Figure 58 and Figure 59), mouse islet
beta cells (Figure 61) and human islet beta cells (Figure 62). This supports earlier findings in this
thesis which demonstrated that CCL5 initiated insulin secretion at 2mM glucose in MIN6 beta
cells (Figure 48a). Furthermore, CCL5 also reversibly increased intracellular calcium
concentrations in MIN6 beta cells at 20mM glucose (Figure 60), which also supported the
ability of CCL5 to potentiate insulin secretion at a stimulatory glucose concentration in MIN6

Chapter 5: Elucidating the GPR75 signalling pathway in beta cells.
196
beta cells (Figure 48b-c). It is likely that the stimulatory effects of CCL5 on insulin secretion
from the beta cell are closely regulated by changes in intracellular calcium concentrations.
Down-regulation of GPR75 expression, which was achieved by using GPR75 targeted siRNAs
(Figure 63), was carried out to identify if GPR75 activation was responsible for the stimulatory
effects of CCL5 on intracellular calcium and insulin secretion. These experiments demonstrated
that the stimulatory effects of CCL5 on intracellular calcium were substantially reduced
following GPR75 depletion (Figure 64) and the insulin secretory response to CCL5 was absent
in GPR75 down-regulated MIN6 beta cells (Figure 65). These novel findings directly implicate
GPR75 activation in the stimulation of cytosolic calcium and insulin secretion in beta cells in
response to CCL5 (Figure 86).
Non-nutrient secretagogues have been implicated in elevating cytosolic calcium concentrations
by activating beta cell GPCRs (Bowe et al., 2009, Burant, 2013, Hellman and Gylfe, 1986, Li et
al., 2010, Romero-Zerbo et al., 2011, Amisten et al., 2013). Changes in intracellular calcium in
beta cells result from either calcium entry from the extracellular compartment via VOCCs
located on the plasma membrane (Curry et al., 1968, Islam, 2002) or through the mobilisation of
calcium from the endoplasmic reticulum (Islam, 2002). Calcium release from the ER is regulated
by ryanodine receptor (RYR)-gated or IP3 receptor (IP3R)-gated calcium channels. An
important feature of RYR is that they are sensitive to cytosolic calcium and can amplify the
calcium signal elicited from calcium influx via VOCCs or calcium release upon IP3R, activation,
thus providing a mechanism of calcium-induced calcium release (Islam, 2002, Lemmens et al.,
2001). Although, cAMP does not directly stimulate calcium release, its activation of PKA has
been shown to release the RYR calcium channel from the inhibition of high magnesium (Mg2+)
concentrations, which brings the channel to an excitable state for it to be activated by calcium
entering via L-type VOCCs (Lemmens et al., 2001, Fabiato, 1992). RYR can also be activated in
a PKA-independent manner and promotes calcium release through cAMP activation of cAMP-
regulated guanine nucleotide exchange factor 2 (Epac2) by interacting with Rap1b (Kang et al.,
2001). Calcium mobilisation via IP3R gated calcium channels can be activated directly by IP3
generated from PLC-mediated PIP2 hydrolysis or indirectly activated by depolarisation-induced
calcium. However, it is not involved in the amplification process of calcium-induced calcium
release in beta cells, which is primarily mediated by the activation of RYR-gated calcium
channels (Lemmens et al., 2001).
Calcium microfluorimetry experiments identified a calcium influx component downstream of
GPR75 activation, as illustrated in Figure 86, in which CCL5 stimulated intracellular calcium
levels in MIN6 beta cells in the presence of extracellular calcium (Figure 66a: red line), but this
stimulatory response was abolished in the absence of extracellular calcium (Figure 66a: black
line). This ruled out the possibility of the mobilisation of calcium from the endoplasmic

Chapter 5: Elucidating the GPR75 signalling pathway in beta cells.
197
reticulum, which is a conventional hallmark associated with Gαq protein coupled receptors
(Persaud et al., 1989). Furthermore, ATP, which acts via purinergic (P2Y) receptors and induces
calcium mobilisation (Green et al., 1997, Gylfe and Hellman, 1987), was still able to elevate
intracellular calcium in MIN6 beta cells in the absence of extracellular calcium (Figure 66a: red
line). This demonstrated that these cells did not lose their capacity to mobilise calcium from the
endoplasmic reticulum after being challenged with CCL5, which suggests that calcium influx is
solely responsible for CCL5-induced elevations in intracellular calcium.
In addition, insulin secretion from beta cells is tightly coupled to calcium influx through L-type
calcium channels, which is considered to be the predominant calcium channel responsible for
elevating glucose-induced intracellular calcium concentrations in beta cells (Ashcroft et al., 1994,
Braun et al., 2008). Calcium microfluorimetry experiments confirmed that calcium influx into
beta cells was achieved by opening of L-type calcium channels, as responses to CCL5 (Figure
67a: Black line) were abolished when L-type calcium channels were blocked with nifedipine in
MIN6 beta cells (Figure 67a: Red line) and human islets (Figure 68). Therefore, this implies
CCL5 may stimulate insulin secretion via a calcium influx component involving L-type VOCCs.
However, further experiments are required to measure CCL5-induced insulin secretion in
response to blockade of L-type VOCCs.

Chapter 5: Elucidating the GPR75 signalling pathway in beta cells.
198
Figure 86: Diagram illustrating the calcium influx component of the GPR75 signalling pathway
in beta cells. CCL5 (Solid orange circles) binds to GPR75 and activates the heterotrimeric G-protein
subunit, causes the dissociation of the Gαq protein from the Gβγ subunit. This activation is presumably
responsible for the elevation of intracellular calcium levels, which enters the beta cell via L-type calcium
channels, and acts as the predominant signal for driving the insulin secretory process in beta cells. This
rules out the possibility of calcium mobilisation.

Chapter 5: Elucidating the GPR75 signalling pathway in beta cells.
199
VOCCs play an important regulatory role in mediating the calcium-dependent effects of CCL5
on insulin secretion. Beta cell membrane depolarisation is detected by VOCCs, which are
activated and allow calcium influx across the cell membrane and ultimately elevate cytosolic
calcium concentrations (Ashcroft and Rorsman, 1989, Tarasov et al., 2004, Henquin et al., 2003,
Henquin et al., 2006). Insulin secretion experiments show CCL5-induced insulin secretion was
abolished when mouse islets were treated with diazoxide (Figure 70), which maintains the open
state of KATP channels and prevents beta cell membrane depolarisation. Therefore, these data
suggest that GPR75 activation by CCL5 induces closure of KATP channels, which presumably
opens L-type calcium channels by depolarising the cell membrane and allowing calcium entry
into beta cells.
It has been reported that Gαq protein-deficient mouse beta cells demonstrated a higher open
probability of KATP channels, with a lower percentage of beta cells that were able to elicit action
potentials when compared to controls (Sassmann et al., 2010). PIP2 has also been implicated in
increasing the open probability state of KATP channels (Shyng and Nichols, 1998, Baukrowitz et
al., 1998) by binding to the C-terminus of the Kir6.2 subunit of KATP channels (MacGregor et
al., 2002, Baukrowitz et al., 1998). Furthermore, co-expression of KATP channels with PLC-
coupled purinergic receptors (P2Y) in xenopus oocyte, demonstrated decreased KATP-mediated
currents when stimulated with ATP, which was attributed to diminished PIP2 concentrations as
a result of increasing hydrolysis invoked by PLC stimulation (Baukrowitz et al., 1998).
Therefore, receptor-mediated activation of PLC may reduce the open probability of KATP
channels by reducing the availability of PIP2 and may abrogate its binding to the Kir6.2 subunit
of the KATP channel thus representing a possible mechanism of phospholipid-mediated
regulation of beta cell membrane excitation (Figure 87).
GPR75 couples to the Gαq protein in HEK and CHO cells (Ignatov et al., 2006) but the evident
calcium influx component in beta cells, upon GPR75 activation by CCL5 is atypical of
established Gαq protein coupled receptors, which usually mobilise calcium from the ER. PLC is
activated by Gαq protein coupled receptors and is responsible for the generation of IP3 and
DAG from the hydrolysis of PIP2. PLC activation is essential for CCL5-induced mobilisation of
calcium in CHO-K1 cells expressing GPR75 (Ignatov et al., 2006) and experiments in this
chapter, as demonstrated in Figure 71 and Figure 72, show CCL5-induced elevations in
intracellular calcium concentrations were diminished but not abolished in Fura-2 loaded MIN6
beta cells that were treated with a PLC inhibitor (U73122) at 10µM. However, CCL5-induced
insulin secretion was completely abolished in MIN6 beta cells (Figure 73) and human islets
(Figure 74b) that were also treated with 10µM U73122. The disparity between the partial loss of
CCL5-induced elevations in intracellular calcium and the absolute inhibition of CCL5-induced
insulin secretion in beta cells treated with identical concentrations of U73122 suggests that

Chapter 5: Elucidating the GPR75 signalling pathway in beta cells.
200
CCL5-induced insulin secretions is a PLC-dependent process but the ability of CCL5 to elevate
intracellular calcium may involve PLC-dependent and independent mechanisms that converge
downstream to regulate insulin secretion. For example, a PLC-independent mechanism may
involve the Gβγ complex, which can stimulate cAMP accumulation in human fibroblast cells
(Ahmed and Heppel, 1997) and subsequently stimulate protein kinase A (PKA) and cAMP-
activated GTP-exchange factors (Epacs). PKA can activate L-type calcium channels and is
known to increase the open probability state of VOCCs (Britsch et al., 1995, Kanno et al., 1998,
Ammala et al., 1993, Bünemann et al., 1999, Gao et al., 1997). In theory, this may elevate beta
cell intracellular calcium concentrations in the presence of U73122 but this may fail to reach the
threshold required to promote insulin secretion (Figure 87). This is supported by a study, which
demonstrated insulin secretion was only observed when extracellular calcium concentrations
exceeded 1mM, whereas extracellular calcium concentrations ranging between 0.1mM and 1mM
permitted influx of calcium into beta cells but did not stimulate insulin secretion (Curry et al.,
1968). Identification of a possible PLC-independent mechanism on elevating intracellular
calcium upon GPR75 activation by CCL5 would warrant further investigation by measuring
cAMP and/or PKA levels in beta cells.

Chapter 5: Elucidating the GPR75 signalling pathway in beta cells.
201
Figure 87: Diagram illustrating the possible association of KATP channel closure and calcium
influx component of the GPR75 signalling pathway in beta cells. CCL5 (Solid orange circles) binds
to GPR75, which activates the heterotrimeric G-protein subunit and causes the dissociation of the Gαq
protein from the Gβγ subunit. This activates PLC, which decreases cellular concentrations of PIP2 by
stimulating the generation of IP3 and DAG, resulting in reduced binding of PIP2 to the Kir6.2 subunit of
KATP channels. This subsequent reduced open probability state of KATP channels will depolarise the beta
cell membrane and elevate intracellular calcium levels, by activating L-type calcium channels, which acts
as the predominant signal for driving the insulin secretory response to CCL5. In addition, PLC-
independent effects may elevate intracellular calcium levels via a PKA-dependent mechanism by
activation of L-type VOCCs by PKA.

Chapter 5: Elucidating the GPR75 signalling pathway in beta cells.
202
Several classes of protein kinases whose activities are modulated by calcium, cyclic nucleotides
and products of phospholipid hydrolysis have been identified in islets and insulin secreting beta
cell lines (Jones and Persaud, 1998b). The regulation of the phosphorylation state of specific
intracellular protein kinases are important for regulating insulin secretion (Harrison et al., 1984).
There are three distinct groups of serine/threonine protein kinases that have been identified in
islets: calcium/phospholipid-dependent protein kinase C (PKC), calcium/calmodulin-
dependent kinase (CAMK) and cAMP-dependent kinase (PKA). The stimulatory effects of
GPR75 activation by CCL5 on insulin secretion via a PLC-dependent process, coupled with its
ability to elevate intracellular calcium warranted further investigation of the potential
involvement of protein kinases in these effects.
As illustrated in Figure 75, MIN6 beta cells that were challenged with staurosporine (STP), a
broad spectrum protein kinase inhibitor (Persaud et al., 1993), diminished CCL5-induced
elevations in intracellular calcium at 2mM glucose, which implicated protein kinase involvement
in mediating the downstream effects of GPR75 activation on intracellular calcium in beta cells.
However, CCL5-induced insulin secretion was completely abolished by STP in MIN6 beta cells
(Figure 76) and human islets (Figure 77), which suggested that GPR75 signalling is
predominantly mediated through protein kinases, which influence intracellular calcium and/or
insulin exocytosis. Intracellular calcium can be regulated by protein kinases at various events
associated with stimulus-secretion coupling in beta cells. For example, KATP channels and the
sulphonylurea receptor (SUR1) have several potential phosphorylation sites for PKC and PKA
(Inagaki et al., 1995b), as do L-type VOCCs (Seino et al., 1992, Seino, 1995). PKC can regulate
calcium influx by altering the phosphorylation state of L-type VOCCs (Arkhammar et al., 1994).
PKA can also phosphorylate VOCCs in a mouse beta cell line (Leiser and Fleischer, 1996) and
thus has been shown to enhance the open probability of L-type calcium channels (Bünemann et
al., 1999, Gao et al., 1997, Kanno et al., 1998). Therefore, protein kinases can potentially modify
calcium influx by phosphorylating either KATP channels or VOCCs. In addition, protein kinases
can also directly regulate insulin secretory granule transport and insulin exocytosis by
phosphorylating cytoskeletal elements (Jones and Persaud, 1998b) such as actin (Calle et al.,
1992), myosin (Penn et al., 1982, MacDonald and Kowluru, 1982) and tubulin (Colca et al.,
1983). Also, PKA and CAMK II have been shown to influence vesicle fusion with the cell
membrane by phosphorylating v-SNARES (VAMP) (Hirling and Scheller, 1996), whereas,
glucose and GLP-1 can also phosphorylate t-SNARES (SNAP-25) but the kinase/s responsible
are yet to be identified (Zhou and Egan, 1997).
Insulin secretion experiments were performed to identify the protein kinases involved in the
stimulus-secretion coupling of CCL5 in beta cells. As illustrated in Figure 78, CCL5-induced
insulin secretion was diminished but not completely lost in the presence of Ro-31-8220, a non-

Chapter 5: Elucidating the GPR75 signalling pathway in beta cells.
203
selective pharmacological inhibitor of PKC (Harris et al., 1996). The continued effects of CCL5
the presence of Ro-31-8220 may be explained by the use of a concentration that did not
completely inhibit PKC activity. Therefore, an alternative approach of depleting DAG-sensitive
conventional and novel PKC isoforms by prolonged exposure to PMA, which causes PKC to
translocate from the cytosol to the cell membrane where it is degraded (Howell et al., 1994),
provided an alternative way of measuring the PKC-mediated effects of the GPR75 signalling
pathway on beta cell function. CCL5-induced insulin secretion was shown to be primarily
mediated through DAG-sensitive PKC activation in mouse (Figure 80) and human (Figure 81)
beta cells. This is consistent with previous findings in this thesis that implicate PLC involvement
in CCL5 effects in beta cells as PLC hydrolyses PIP2 to generate DAG, which is a known
activator of PKC, and may increase the open probability of L-type calcium channels
(Arkhammar et al., 1994), as well as KATP channel opening as the SUR1 component acts as its
substrate (Inagaki et al., 1995a) and promote calcium influx via VOCCs in response to
membrane depolarisation, in which VOCCs have been shown to stimulate DAG-sensitive PKC
isoforms (Mogami et al., 2003). PKC can also promote the exocytosis of calcium sensitive
insulin secretory granules by sensitising the insulin secretory machinery to calcium (Wan et al.,
2004). Furthermore, PKC also has the ability to transduce its effects through cAMP dependent
signalling pathways (Sugita et al., 1997), but these effects are assumed to take place at the levels
of signal recognition and/or second messenger generation rather than the latter stages of the
insulin secretory pathway after protein kinase activation by second messengers (Basudev et al.,
1995) but this mechanism is yet to be identified in beta cells. These findings highlight the
importance of PKC and its involvement in regulating insulin secretion. It is worth noting,
depletion of DAG-sensitive PKC isoforms by long-term exposure to PMA does not
discriminate between conventional and novel PKC isoforms. MIN6 beta cells were still able to
secrete insulin in response to CCL5 in the presence of GÖ6976, a conventional PKC inhibitor,
and therefore discriminates between conventional and novel PKC isoforms (Ishikawa et al.,
2005). It has been reported that novel PKC isoforms (PKC-δ and/or ε) are involved in CCh-
induced insulin secretion in rat islets (Ishikawa et al., 2005), which may indicate that novel PKC
isoforms are involved in mediating the effects associated with the activation of the GPR75
signalling cascade in response to CCL5.
Beta cells express a variety of calcium-sensitive proteins that may be involved in sensing
changes in cytosolic calcium levels. CAMK II can transduce calcium mobilising signals into a
secretory response (Jones and Persaud, 1998b). Glucose or depolarising concentrations of K+
have been shown to increase CAMK activity as a result of calcium influx through VOCCs
(Wenham et al., 1994). There is a strong correlation between CAMK II dependence on glucose
concentrations and insulin secretion and it has been reported that increases in CAMK II activity
usually precedes insulin secretion (Babb et al., 1996). It has been reported that CAMK II is

Chapter 5: Elucidating the GPR75 signalling pathway in beta cells.
204
important for calcium entry via VOCCs, with reduced basal cytosolic and ER calcium stores
upon CAMK II inhibition (Dadi et al., 2014). It has been established that CAMK II is involved
in promoting the trafficking and docking of insulin secretory granules by phosphorylating
proteins such as synapsin-1 and microtubule-associated protein-2 during insulin exocytosis
(Easom, 1999) and CAMK II inhibition with KN-62 inhibits nutrient-induced insulin secretion
(Li et al., 1992, Wenham et al., 1992, Niki et al., 1993). KN-62 is a competitive inhibitor at the
calmodulin binding site of CAMK II and has no effect on PKC in beta cells (Wenham et al.,
1992). Experiments in this thesis demonstrate that CCL5-indiuced insulin secretion is also
abolished in MIN6 beta cells (Figure 84) and human islets (Figure 85) when challenged with
KN-62, which is likely to work downstream of PKC activation and calcium elevations within
the beta cells. This reaffirms the importance of protein kinases such as PKC and CAMK II in
the GPR75 signalling pathway that mediate the associated effects of CCL5 in the beta cell
(Figure 88). It would be interesting to identify PKA activity, which may indicate the possible
association of cAMP-dependent pathways in the GPR75 signalling cascade in beta cells, but
there was not sufficient time to carry out experiments with PKA inhibitors during this thesis.

Chapter 5: Elucidating the GPR75 signalling pathway in beta cells.
205
Figure 88: Diagram illustrating the role of protein kinases in the GPR75 signalling pathway in
beta cells. CCL5 (Solid orange circles) binds to GPR75, which activates the heterotrimeric G-protein
subunit and causes the dissociation of the Gαq protein from the Gβγ subunit. The Gαq protein activates
PLC and subsequently stimulates the generation of DAG, which may activate DAG-sensitive novel PKC
isoforms. PKC can go on to affect multiple events associated with the stimulus-secretion pathway of
CCL-GPR75 involving VOCCs, insulin exocytosis and possible cAMP dependent signalling pathways.
Furthermore, CCL5 can mediate its effects on insulin secretion via CAMK II, which is activated by the
binding of calcium-calmodulin, which is activated in response to the elevation in intracellular calcium
levels associated with calcium influx via L-type calcium channels.

206
Chapter 6: GPR75 activation regulates beta cell mass.

Chapter 6: GPR75 activation regulates beta cell mass.
207
6.1: Introduction
T2DM is caused by two major defects: insulin resistance and defective beta cell function
(DeFronzo, 1988). The decline in insulin secretory function is paralleled by a reduction in beta
cell mass (Lupi and Del Prato, 2008), which is a dynamic process involving the fine balance
between beta cell expansion (hyperplasia and/or neogenesis) and involution (necrosis and/or
apoptosis). Apoptosis is considered to be the key regulator of beta cell mass, with a report
suggesting that beta cell mass was reduced in T2DM subjects by 63%, which was attributed to
apoptosis while beta cell regeneration was similar between control and T2DM islets (Butler et
al., 2003a). Furthermore, electron microscopy studies of islets from T2DM pancreatic donors
have shown an approximate 60-70% decrease in the number of beta cells compared to that of
non-diabetic islets, which was associated with increased expression of caspases (Marchetti et al.,
2004). Obese patients with T2DM exhibit an approximate 60% reduction in beta cell mass,
which was attributed to a 3-fold increase in beta cell apoptosis (Butler et al., 2003c). These
findings collectively indicate that the reduction in beta cell mass observed in T2DM is likely to
be a result of increased beta cell apoptosis (Lupi and Del Prato, 2008, Donath and Halban,
2004).
Apoptosis is a coordinated sequence of events that results in the programmed execution of cell
death. It plays a key role in maintaining islet health by removing infected or mutated cells (Lupi
and Del Prato, 2008). Beta cell apoptosis can be triggered by three pathways, which include
cytokine-induced death by the activation of cell surface death receptors (Wajant, 2002, Curtin
and Cotter, 2003), mitochondrial dysfunction, and activation of the ER stress pathway.
Although information on the role of GPR75 in regulating cell apoptosis and survival is currently
limited it has already been implicated in providing cell protective effects in mouse hippocampal
cells (HT22), in which exposure to CCL5 significantly enhanced cell viability (Ignatov et al.,
2006). The hippocampus is one of the areas affected in patients with Alzheimer’s disease, which
is predominantly caused by the aggregation of amyloid-β peptide (Cummings et al., 1998). It is
understood that the amyloid-β peptide is able to induce chemokine production in neuronal cells,
which subsequently results in neuro-inflammation and eventual cell death (Cartier et al., 2005,
Bajetto et al., 2001). Islets of T2DM patients also exhibit amyloid deposits in the extracellular
compartment and amylin, also known as islet amyloid pancreatic polypeptide (IAPP), which is
the major constituent of islet amyloid plaques (Cooper et al., 1987), is also co-secreted with
insulin (Moore and Cooper, 1991). The build-up of islet amyloid is termed islet amyloidosis (IA)
and has been implicated in the loss of beta cells in T2DM by inducing apoptosis (Matveyenko
and Butler, 2006, Lorenzo et al., 1994). IA can cause cell death by occupying the extracellular
compartment which starves islets of nutrients and oxygen uptake (Guardado-Mendoza et al.,
Chapter 6: GPR75 activation regulates beta cell mass.
208
2009). Furthermore, small IAPP oligomers can form non-selective cation channels that can lead
to excessive calcium influx, ER stress and apoptosis (Huang et al., 2007, Mirzabekov et al.,
1996, Ritzel et al., 2007) and can disrupt cell membrane integrity resulting in the loss of cell
synchrony within the islet (Ritzel et al., 2007). It has been reported that human IAPP can
promote beta cell death in RINm5F cells by activating p38 MAPKs and caspase-3 (Rumora et
al., 2002).
Experiments reported in chapters 3 of this thesis have demonstrated that GPR75 is the most
abundantly expressed CCL5 receptor in islets and that CCL5 is also endogenously expressed in
islets. Unfortunately, due to insufficient time, the effects of GPR75 activation by CCL5 on islet
amyloid deposits within islets could not be determined but it can be presumed that GPR75
activation by CCL5 may enhance beta cell viability. Therefore the focus of this chapter aimed to
identify the potential regulatory role of GPR75 activation by CCL5 on beta cell mass by
studying the effects of CCL5 on islet and beta cell apoptosis as well as on beta cell proliferation.

Chapter 6: GPR75 activation regulates beta cell mass.
209
6.2: Methods
Apoptosis assay: Measurement of caspase 3/7 activities in MIN6 beta cells, mouse
islets and human islets.
20,000 MIN6 beta cells or 5 islets were seeded into white-wall 96-well plates and incubated for
24 hours (5% CO2/95% air, 37°C) in 200µl serum-containing medium (Table 1). Cells or islets
were then treated with various concentrations of exogenous CCL5 in the absence or presence
of a cytokine cocktail, which consisted of IL-1β (50 U/ml), TNF-α (1000 U/ml) and IFN-γ
(1000 U/ml), and incubated for a further 21 hours (5% CO2/95% air, 37°C). Caspase 3/7
activities were measured by preparing the CaspaseGlo® reagent as described in section 2.7.1,
which was added to each well followed by 1 hour incubation at room temperature.
Luminescence was measured using a Veritas luminometer.
BrdU colorimetric assay: Measurement of MIN6 beta cell proliferation.
MIN6 beta cells were seeded into clear 96 well plates at a density of 15,000 cells per well and
incubated for 24 hours (5% CO2/95% air, 37°C) in 200µl serum-containing medium (Table 1).
The cells were then treated with various concentrations of exogenous CCL5 for a further 21
hours (5% CO2/95% air, 37°C), then incubated with 10µM BrdU labelling solution for 2 hours
at 37°C before being denatured and tagged with a peroxidase-conjugated anti-BrdU antibody, as
described in section 2.7.2. Absorbance was measured at 450nm using an ELISA reader (Hidex
Chameleon™V).

Chapter 6: GPR75 activation regulates beta cell mass.
210
6.3: Results
6.3.1: The effect of CCL5 on cytokine-induced apoptosis in MIN6 beta cells as well as
mouse and human islets.
As shown in Figure 89, 25nM CCL5 did not affect the basal level of MIN6 beta cell apoptosis.
As expected, a cytokine cocktail (IL-1β, TNF-α and IFN-γ) induced MIN6 beta cell apoptosis,
which was measured by an 8.6-fold increase in caspase 3/7 activities. Moreover, when MIN6
beta cells were challenged with CCL5 in the presence of a cytokine cocktail, apoptosis was
significantly reduced such that caspase 3/7 activities increased by only 4.3-fold. These data
indicate that CCL5 confers MIN6 beta cell protection by suppressing cell apoptosis by
approximately 50%. Similar data were observed in experiments using isolated mouse islets, in
which CCL5 did not affect basal levels of apoptosis. However, a 4.4-fold increase in caspase
3/7 activities was observed when mouse islets were treated with cytokines alone but when
mouse islets were treated with 2.5nM and 25nM CCL5 apoptosis decreased to levels not
significantly different from basal apoptosis observed in the absence of cytokines but in the
presence of cytokines apoptosis was significantly diminished (Figure 90). In human islets,
cytokine-induced apoptosis increased by approximately 4-fold, as expected, but the pro-
apoptotic effects of the cytokines were significantly reduced, by up to 50% when human islets
were treated with 0.01nM-1nM CCL5, as shown in Figure 91.

Chapter 6: GPR75 activation regulates beta cell mass.
211
Figure 89: The effect of CCL5 on MIN6 beta cell apoptosis. MIN6 beta cells were treated with
25nM CCL5 in the absence or presence of a cytokine cocktail (IFNγ:1000U/μl, TNF-α:1000U/μl and IL-
1β:100U/μl) in serum-deprived DMEM and incubated for 21 hours at 37°C (5% CO2/95% air).
Apoptosis was detected by measuring Caspase 3/7 activities by incubating the cells for 1 hour with a
mixture containing a Caspase-Glo® substrate and reagent at room temperature. The luminescent signal
generated was measured using a luminometer. Data expressed as Mean ± SEM, n=8. ***P<0.001.
0
50000
100000
150000
200000
250000
300000
350000
No cytokines Cytokines
Cas
pas
e 3/
7 a
ctiv
itie
s (L
um
iesc
ent
un
its)
Control
25nM CCL5
***
***
***

Chapter 6: GPR75 activation regulates beta cell mass.
212
Figure 90: The effect of CCL5 on mouse islet apoptosis. Isolated mouse islets were treated with
25nM CCL5 in the absence or presence of a cytokine cocktail (IFNγ:1000U/μl, TNF-α:1000U/μl and IL-
1β:100U/μl) in serum-deprived RPMI and incubated for 21 hours at 37°C (5% CO2/95% air). Apoptosis
was detected by measuring caspase 3/7 activities by incubating the islets for 1 hour with a mixture
containing a Caspase-Glo® substrate and reagent at room temperature. The luminescent signal generated
was detected and measured using a luminometer. Data expressed as Mean ± SEM, n=6-7. **P<0.01. No
significant difference between 2.5nM CCL5 and 25nM CCL5 (no cytokines) vs 2.5nM CCL5 and 25nM
CCL5 (cytokines).
**
0
50000
100000
150000
200000
250000
300000
350000
Control 2.5nM CCL5 25nM CCL5 Control 2.5nM CCL5 25nM CCL5
No cytokines Cytokines
Cas
pas
e 3/
7 ac
tiv
itie
s (L
um
ines
cen
t u
nit
s) **
**

Chapter 6: GPR75 activation regulates beta cell mass.
213
Figure 91: The effect of CCL5 on human islet apoptosis. Isolated human islets were treated with
CCL5 (0.01nM–1nM) in the absence or presence of a cytokine cocktail (IFNγ:1000U/μl, TNF-
α:1000U/μl and IL-1β:100U/μl) in serum-deprived CMRL for 21 hours at 37°C (5% CO2/95% air).
Apoptosis was detected by measuring caspase 3/7 activities by incubating the islets for 1 hour with a
mixture containing a Caspase-Glo® substrate and reagent at room temperature. The luminescent signal
generated was detected and measured using a luminometer. Data expressed as Mean ± SEM, n=5-7.
**P<0.01, ***P<0.001.
0
50000
100000
150000
200000
250000
300000
350000
Control Control 0.01nM CCL5 0.1nM CCL5 1nM CCL5
No cytokines Cytokines
Cas
pas
e 3/
7 ac
tiv
itie
s (L
um
ines
cen
t u
nit
s) ** ***
**
**
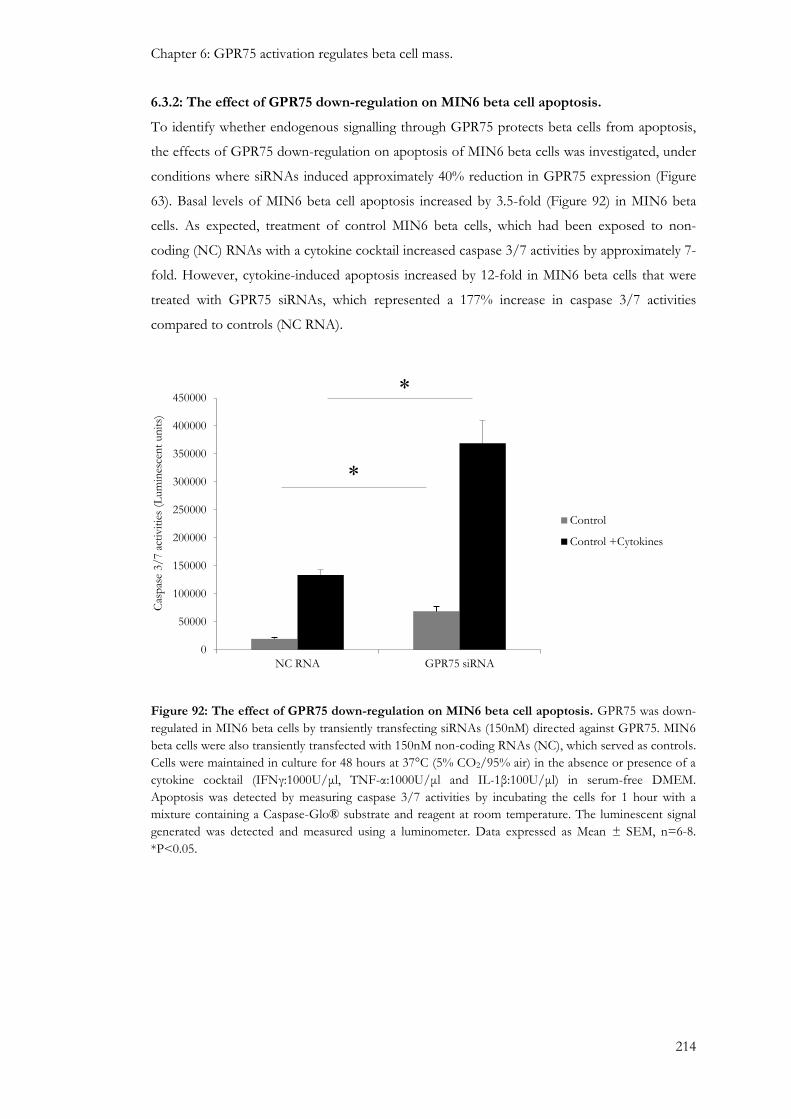
Chapter 6: GPR75 activation regulates beta cell mass.
214
6.3.2: The effect of GPR75 down-regulation on MIN6 beta cell apoptosis.
To identify whether endogenous signalling through GPR75 protects beta cells from apoptosis,
the effects of GPR75 down-regulation on apoptosis of MIN6 beta cells was investigated, under
conditions where siRNAs induced approximately 40% reduction in GPR75 expression (Figure
63). Basal levels of MIN6 beta cell apoptosis increased by 3.5-fold (Figure 92) in MIN6 beta
cells. As expected, treatment of control MIN6 beta cells, which had been exposed to non-
coding (NC) RNAs with a cytokine cocktail increased caspase 3/7 activities by approximately 7-
fold. However, cytokine-induced apoptosis increased by 12-fold in MIN6 beta cells that were
treated with GPR75 siRNAs, which represented a 177% increase in caspase 3/7 activities
compared to controls (NC RNA).
Figure 92: The effect of GPR75 down-regulation on MIN6 beta cell apoptosis. GPR75 was down-
regulated in MIN6 beta cells by transiently transfecting siRNAs (150nM) directed against GPR75. MIN6
beta cells were also transiently transfected with 150nM non-coding RNAs (NC), which served as controls.
Cells were maintained in culture for 48 hours at 37°C (5% CO2/95% air) in the absence or presence of a
cytokine cocktail (IFNγ:1000U/μl, TNF-α:1000U/μl and IL-1β:100U/μl) in serum-free DMEM.
Apoptosis was detected by measuring caspase 3/7 activities by incubating the cells for 1 hour with a
mixture containing a Caspase-Glo® substrate and reagent at room temperature. The luminescent signal
generated was detected and measured using a luminometer. Data expressed as Mean ± SEM, n=6-8.
*P<0.05.
0
50000
100000
150000
200000
250000
300000
350000
400000
450000
NC RNA GPR75 siRNA
Cas
pas
e 3/
7 a
ctiv
itie
s (L
um
ines
cen
t un
its)
Control
Control +Cytokines
*
*
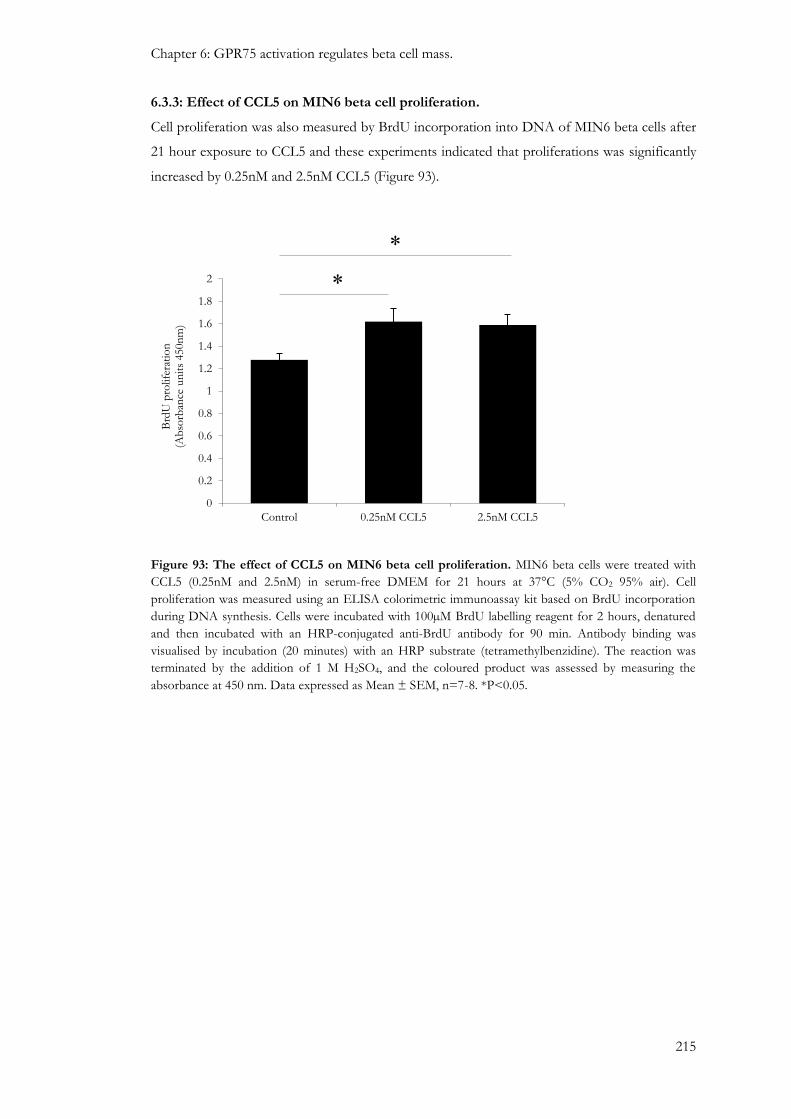
Chapter 6: GPR75 activation regulates beta cell mass.
215
6.3.3: Effect of CCL5 on MIN6 beta cell proliferation.
Cell proliferation was also measured by BrdU incorporation into DNA of MIN6 beta cells after
21 hour exposure to CCL5 and these experiments indicated that proliferations was significantly
increased by 0.25nM and 2.5nM CCL5 (Figure 93).
Figure 93: The effect of CCL5 on MIN6 beta cell proliferation. MIN6 beta cells were treated with
CCL5 (0.25nM and 2.5nM) in serum-free DMEM for 21 hours at 37°C (5% CO2 95% air). Cell
proliferation was measured using an ELISA colorimetric immunoassay kit based on BrdU incorporation
during DNA synthesis. Cells were incubated with 100µM BrdU labelling reagent for 2 hours, denatured
and then incubated with an HRP-conjugated anti-BrdU antibody for 90 min. Antibody binding was
visualised by incubation (20 minutes) with an HRP substrate (tetramethylbenzidine). The reaction was
terminated by the addition of 1 M H2SO4, and the coloured product was assessed by measuring the
absorbance at 450 nm. Data expressed as Mean ± SEM, n=7-8. *P<0.05.
0
0.2
0.4
0.6
0.8
1
1.2
1.4
1.6
1.8
2
Control 0.25nM CCL5 2.5nM CCL5
Brd
U p
rolif
erat
ion
(A
bso
rban
ce u
nit
s 450n
m)
*
*
Chapter 6: GPR75 activation regulates beta cell mass.
216
6.4: Discussion
T2DM is characterised by impaired insulin action (insulin resistance) in peripheral target tissues
such as liver, adipose and muscle, as well as being associated with a defective insulin secretory
mechanism in response to elevated levels of glucose. Conventional pharmacological treatments
for T2DM tend to focus on lowering blood glucose levels through various mechanisms but
these hypoglycaemic agents lose their efficacy over time leading to deterioration in beta cell
function and worsening of glycaemic control. This has partially been attributed to a progressive
loss in beta cell mass (Baggio and Drucker, 2006). Several studies have demonstrated that beta
cell mass is reduced in T2DM subjects compared to non-diabetic controls, despite normal beta
cell replication and neogenesis (Saito et al., 1979, Maclean and Ogilvie, 1955, Butler et al., 2003a,
Yoon et al., 2003, Pick et al., 1998). The regulation of beta cell mass is a combined result of:
beta cell replication, beta cell differentiation (neogenesis) and beta cell apoptosis (Bonner-Weir,
2000b, Bonner-Weir, 2000a). An increase in beta cell apoptosis is commonly observed in
subjects with T2DM (Butler et al., 2003a, Pick et al., 1998), which is thought to be invoked by
oxidative stress, ER stress, islet amyloid deposition, chronic hyperglycaemia and inflammatory
cytokines (Donath and Halban, 2004, Rhodes, 2005). As current T2DM medication have failed
to address the progressive loss of beta cells there has been an increasing interest in the
development of therapeutic targets that preserve and/or restore beta cell mass, especially by
inhibiting beta cell apoptosis (Baggio and Drucker, 2006).
The results in this chapter demonstrate CCL5 exhibits protective effects in MIN6 beta cells
(Figure 89), mouse islets (Figure 90) and human islets (Figure 91), as measured by a reduction in
caspase 3 and caspase 7 activities. Furthermore, down-regulation of GPR75 using gene-specific
siRNAs demonstrated that MIN6 beta cells were more susceptible to basal and cytokine-
induced apoptosis compared to those cells transfected with non-coding RNAs (Figure 92). This
suggests that the protective effects in beta cells are mediated via GPR75, most likely forming its
activation by islet derived CCL5. This is consistent with a previous study demonstrating that
CCL5 reduced HT22 cell death induced by amyloid-β deposits, which endogenously expresses
GPR75 but not conventional CCL5 receptors (Ignatov et al., 2006). Furthermore, CCL5 also
stimulated MIN6 beta cell proliferation (Figure 93).
GPR75 activation is thought to confer protective effects on CV-1 cells by activating the
PLC/PI3K/Akt/p42/p44 MAPK cell survival pathway (Ignatov et al., 2006). Previous
experiments in this thesis have established that GPR75 signals through PLC in beta cells
(Section 5.3.5). Those studies were tasked on the role of the GPR75/PLC cascade on beta cell
function but the data presented in this chapter of reduced beta cell apoptosis and increased beta
cell proliferation downstream of GPR75 activation suggest that there may be a possible PLC-
dependent cell survival pathway in beta cells.

Chapter 6: GPR75 activation regulates beta cell mass.
217
Activation of PI3K results in the generation of phosphatidylinositol-3,4,5-trisphosphate (PIP3)
from phosphatidylinositol-3,4-bisphosphate (PIP2) at the plasma membrane, which activates
Akt (Fresno Vara et al., 2004). It has been shown that the Gq-coupled muscarinic receptor 1
(M1) can activate Akt in COS-7 cells in a PI3K-dependent manner (Murga et al., 1998).
Furthermore, the Gα and the Gβγ subunits of M1 receptors can promote Akt activity, with
further identification of a Gβγ-sensitive PI3Kγ, which can go on to stimulate Akt (Murga et al.,
1998), which indicates of a potential link between Akt stimulation and activation of Gq-coupled
GPR75. It has been reported that activation of an uncharacterised Gαs-coupled receptor for the
peptide hormone ghrelin was able to protect beta cells from apoptosis by Akt and MAPK
pathways (Granata et al., 2007). Overexpression and hyper-activation of Akt has been associated
with reduced susceptibility to apoptosis and increased cell growth and proliferation, respectively
(Lawlor and Alessi, 2001, Downward, 2004). In addition, inducing Akt activation stimulates beta
cell replication and increases beta cell mass in the developing pancreas of mouse (Hakonen et
al., 2014). Akt mediates its pro-survival effects through the phosphorylation of pro-apoptotic
substrates such as Bad, Caspase 9 and forkhead transcription factors resulting in their inhibition
(Downward, 2004, Khwaja, 1999, Lawlor and Alessi, 2001, Nakamura et al., 2000) (See section
1.3.2 for in additional information on cell apoptotic pathways). This supports experiments in
this chapter, which demonstrate CCL5-mediated reduction in caspase 3 and caspase 7 activities
most likely though GPR75 activation of Akt. It has also been demonstrated that the PI3K/Akt
survival pathway can cross-talk with other survival pathways such as the NFkB pathway
(Hussain et al., 2012), which can regulate cell survival and apoptosis by transcriptionally
activating pro-survival and anti-apoptotic genes such as Bcl-2, Bcl-XL, IkB-α, IAPs (Sethi et al.,
2008).
Cell proliferation involves two essential tasks of replicating DNA without errors (S phase) and
separating the duplicated chromosomal DNA into two daughter cells during mitosis (M phase).
Both the S and M phases are separated by gap phases (G). G1 separates the M and S phases,
whereas the G2 phase separates the S and M phase. The G1 is the interval in the cell cycle that
can respond to extracellular signals and can determine the cell’s ability to enter the S phase or
render the cell cycle into a quiescent state (G0). Once the cells are committed to entering the S
phase the cell cycle is irreversible. The point of cell cycle irreversibility in the G1 phase is
referred to as the “restriction point” (Sherr, 2000). The cell cycle phase transitions are
controlled by cyclin dependent kinases (cdks), which associate with cyclins. In general, cyclin D
associates with cdk-4 and cdk-6 during early G1 phase, whereas cyclin E activates cdk-2 during
the cell’s transition from G1 to the S phase. Thus, phosphorylation of specific amino acid
residues on cyclin/cdk complexes can regulate cell cycle progression. Furthermore, cyclin-
dependent kinase inhibitors (CKIs) such as p21, p27 and p52 can inhibit cyclin/cdk complexes

Chapter 6: GPR75 activation regulates beta cell mass.
218
and inhibit cell cycle progression into the S phase hence inhibit cell proliferation (Sherr, 2000,
Lee et al., 1999).
Akt has also been implicated in promoting cell proliferation by regulating transcription of p27.
Overexpression of Akt down-regulates cellular levels of p27 and thus promotes cell
proliferation (Gesbert et al., 2000, Graff et al., 2000, Sun et al., 1999). Furthermore, forkhead
transcription factors are required for p27 transcription, and studies have shown that Akt
phosphorylation sequesters forkhead transcription factors into the cell cytosol and thus inhibits
p27 transcription (Nakamura et al., 2000, Medema et al., 2000). Maintenance of beta cells and
beta cell proliferation requires activation of the cdk4/cyclin D complex, which is up-regulated
by Akt by phosphorylation of cyclin D1, which is critical for cell cycle progression and
maintenance of beta cell mass (Kushner et al., 2005, Chang et al., 2003, Georgia and Bhushan,
2004). Increased cyclin D activity can also sequester p27, which is the principle cell cycle
inhibitor in beta cells. It is known to accumulate in the beta cell nucleus of obese mice and
inhibit beta cell expansion (Uchida et al., 2005, Sherr, 2000). It has been reported that mouse
beta cells overexpressing Akt show marked expansion of beta cell mass, which has been
attributed to increased levels of cyclin D1 and cyclin D2, and parallel inhibition of p27
transcription by the inactivation of the FOXO1 forkhead transcription factor (Fatrai et al.,
2006).
Eukaryotic cells also express multiple mitogen-activated protein kinases (MAPK) that mediate
the effects of extracellular signals on a variety of biological processes. p42/p44 MAPK nuclear
translocation is predominant in relaying the mitogenic signal from the cytoplasm into the
nucleus (Chen et al., 1992, Lenormand et al., 1993) and is activated by a cascade of small G
protein Ras-Raf followed by MAP3K activation. It has been reported that PMA, a PKC
activator, can increase activity of the 44kDa MAPK isoform in the INS-1 beta cell line but its
activation was not associated with an increase in insulin secretion (Frödin et al., 1995).
However, it may suggest a possible role for MAPK in regulating beta cell mass, which has been
reported to promote MIN6 beta cell proliferation upon p42/p44 MAPK activation (Burns et al.,
2000). This is consistent with previous experiments shown in this thesis that demonstrate
CCL5-mediated activation of GPR75 activates PKC (Section 5.3.6). p42/p44 has been shown
to progress the cell cycle of fibroblasts from the G1 to the S-phase (Brondello et al., 1995) by
stimulating cyclin D1 activity (Lavoie et al., 1996). Furthermore, p42/p44 MAPK can also
inhibit pro-apoptotic Bcl-2 family members Bad (Harada et al., 2001) and Bim (Biswas and
Greene, 2002) and activate Caspase 9 (Park et al., 2013).
Experiments in this thesis have demonstrated that GPR75 signals through PLC to mediate its
effects on beta cell secretory function. The data presented in this chapter suggest that GPR75
activate the PLC-dependent cell survival pathway in beta cells as it has previously been shown

Chapter 6: GPR75 activation regulates beta cell mass.
219
that GPR75 signals through PLC (Section 5.3.5), and is consistent with findings that GPR75
activation by CCL5 results in the activation of the PLC/PI3K/Akt/p42/p44 MAPK cell
survival cascade in CV-1 cells (Ignatov et al., 2006). Activation of Akt can inhibit pro-apoptotic
proteins such as Bad and forkhead transcription factors, and regulate proteins involved in cell
proliferation such as cyclin D and p27. Akt can also activate p42/p44 MAPKs (Ignatov et al.,
2006), which have been implicated in stimulating cell cycle progression from the G1 restriction
point by stimulating cyclin D1 activity, as well as simultaneously inhibiting pro-apoptotic
proteins. Therefore, future experiments should investigate the role of Akt and p42/p44 MAPK
downstream of GPR75 on beta cell protection and proliferation and ultimately identify the
pathways and regulatory mechanisms influencing GPR75-mediated beta cell apoptosis and
proliferation (Figure 94). This would lay further claim to the potential T2DM therapeutic target
of GPR75 due to its ability to not only improve beta cell secretory function but to also maintain
or restore beta cell mass.

Chapter 6: GPR75 activation regulates beta cell mass.
220
Figure 94: Schematic diagram illustrating the potential GPR75-mediated cell protective effects
on beta cell mass. CCL5 (solid orange circles) binds to GPR75 expressed on beta cells, which stimulates
Akt through phospholipase C (PLC)-mediated activation of phosphatidylinositol-3 kinase (PI3K). Akt
can inhibit apoptosis by inhibiting the actions of caspase 9 (Cas9) and thus caspase 3 (Cas3) and caspase 7
(Cas7), inhibiting cytochrome c (C) release from the mitochondria, inhibiting pro-apoptotic substrates
such as Bad and Bim and sequestering forkhead transcription factors (TFs) in the cytosol. This would
subsequently prevent transcription of pro-apoptotic and anti-proliferative molecules such as Fas ligand
and p27, respectively. Akt and PKC can also activate p42/p44 mitogen-activated protein kinases, which
stimulate cell proliferation through the activation of cdk-4/cyclinD1 (cyD1) complex, which promotes
cell cycle progression. This is further complemented by the ability of p42/p44 to inhibit Bad and Bim as
well as sequestering p27, a cdk inhibitor, to the cytosolic compartment and thus promoting cdk-4/cyclin
D1 activation.

221
Chapter 7: General discussion

Chapter 7: General discussion
222
7.1: Summary
It is predicted that 592 million people will develop DM by 2035, of which 439 million people
will develop T2DM (IDF, 2011, Chamnan et al., 2011, IDF, 2013). In 2011 alone, T2DM
accounted for more than 4.6 million deaths (Olokoba et al., 2012, IDF, 2011). Lifestyle changes
such as exercise and dietary modifications are the first line of T2DM intervention but when this
fails to prevent the progression of T2DM then pharmacological intervention is required
(Section 1.1.4). Therefore, there is a current impetus within the biomedical and pharmaceutical
industry to develop the next generation of T2DM therapies, which not only improve long-term
glycaemic control but can also delay T2DM progression, minimise the onset of secondary
complications such as cardiovascular disease, kidney failure and retinopathy, but also minimise
pharmacological side effects.
GPCRs have become prominent pharmacological targets within biomedicine (Lappano and
Maggiolini, 2011). They are the largest family of cell surface receptors, and they transmit
extracellular stimuli into intracellular signals to regulate a variety of physiological functions.
GPCRs expressed by islets are becoming promising candidates as therapeutic targets in the fight
against T2DM (section 1.4.1). With over 250 GPCRs expressed by human islets, a majority of
which have undocumented effects on islet hormone secretion it is evident that there is a
knowledge gap in the current understanding between ligand-GPCR interactions and islet
function, which could potentially aid the development of novel and safer T2DM therapeutics
(Amisten et al., 2013).
GPR75 was identified as a novel and atypical CCR (Tarttelin et al., 1999), and has been
established to promote IP3 and DAG formation as well as elevating intracellular calcium levels
in in HEK293 and CHO-K1 cells, respectively, by coupling to the Gαq protein when activated
by its endogenous ligand CCL5 (Ignatov et al., 2006). Elevations in IP3 and DAG, which is a
potent activator of PKC, have been implicated in stimulating insulin secretion (Chen and Hsu,
1995, Arkhammar et al., 1994, Carpenter et al., 2004, Persaud et al., 1989). In addition,
activation of endogenously expressed GPR75 in mouse hippocampal cells enhanced cell
survival (Ignatov et al., 2006), therefore, if GPR75 has similar cell protective effects in beta cells
it could possibly prevent beta cell loss and restore and/or improve beta cell mass. Furthermore,
GPR75 is also expressed by a variety of tissues such as liver, skeletal muscle and kidney
(Tarttelin et al., 1999, Ignatov et al., 2006), which have been implicated in the pathogenesis of
T2DM. Thus, the experiments mentioned in this thesis aimed to determine the expression and
function of GPR75 in islets of Langerhans and whether it could be a potential T2DM
therapeutic target (section 1.4.4).

Chapter 7: General discussion
223
As described in Chapter 3, experiments involving qRT-PCR, IHC and Western blotting
demonstrated that CCL5 mRNA was detected in mouse and human islets, which was consistent
with a previous study which reported endogenous CCL5 expression in islets of NOD mice
(Carvalho-Pinto et al., 2004). However, CCL5 mRNA was not detected in MIN6 beta cells and
this was supported by the IHC studies described in this thesis, which demonstrated species–
dependent expression of CCL5. In mouse islets CCL5 co-localised with glucagon-secreting
alpha cells whereas in human islets CCL5 was present in alpha and beta cells. CCL5 receptor
mRNA expression revealed that GPR75 was the most abundant CCL5 receptor expressed by
mouse and human islets, with minimal or non-existent expression of traditional CCL5 receptors
CCR1, CCR3 and CCR5. Western blotting detected GPR75 proteins in mouse and human islets
and in MIN6 beta cell protein extracts, and IHC studies revealed that GPR75 was expressed by
alpha and beta cell populations in mouse and human islets.
The expression of CCL5 in mouse and human islets, and the abundant expression of GPR75 by
alpha and beta cells led to the next set of experiments, which aimed to determine the functional
effects of exogenous CCL5 on insulin and glucagon secretion. As described in Chapter 4, static
and dynamic islet hormone secretion experiments demonstrated that CCL5 was able to
reversibly stimulate insulin secretion in mouse and human islets at sub-stimulatory and
stimulatory glucose concentrations. However, the functional effect of CCL5 on arginine-
induced glucagon secretion differed between species as CCL5 stimulated glucagon secretion
from mouse islets whereas it inhibited glucagon secretion from human islets. This could be
explained, at least in part, by the fact that human islets have a higher number of alpha cells than
their mouse counterparts and glucagon binding to GluR on alpha cells (Kawai et al., 1995,
Wojtusciszyn et al., 2008), has been shown to increase glucose sensitivity and insulin output of
beta cells (Jiang and Zhang, 2003, Pipeleers et al., 1985). The inhibitory effect of CCL5 on
human islet glucagon secretion may be indirect, secondary to the higher insulin output observed
from human islets in response to CCL5, which may override the stimulatory effect of CCL5-
stimulated glucagon on insulin secretion by binding to InsR expressed on alpha cells to inhibit
glucagon release (Kawamori et al., 2009, Diao et al., 2005, Kaneko et al., 1999).
Chapter 5 aimed to determine whether the stimulatory effect of CCL5 on insulin secretion was
mediated though GPR75 activation and to identify potential signalling pathways elicited in the
presence of a CCL5 stimulus. GPR75 knock down experiments using gene specific siRNAs
demonstrated that the stimulatory effects of CCL5 on insulin secretion and intracellular calcium
levels in beta cells were solely attributed to the activation of GPR75. This was consistent with
previous findings in Chapter 3, which established that GPR75 was the most abundant CCL5
receptor expressed in mouse and human islets and thus it was probable that CCL5 could
mediate its beneficiary effects on beta cell function through GPR75. Further experiments with
Chapter 7: General discussion.
224
islets and MIN6 beta cells reaffirmed the notion that GPR75 was a Gαq coupled protein
receptor, in which CCL5 was able to stimulate PLC activity to elevate intracellular calcium
levels. Furthermore, a calcium influx component was identified upon removal of calcium from
the extracellular compartment and blockade of L-type VOCCs. In addition, closure of KATP
channels upstream of VOCCs was identified as playing a role in propagating the GPR75 signal
into an insulin secretory response, most likely by depolarising the beta cell membrane and
subsequently activating L-type VOCCs to permit calcium influx into the beta cell cytosolic
compartment.
As mentioned earlier, PLC activation is a pre-requisite for GPR75 signal propagation in the beta
cell and it has been reported that GPR75 activation promotes the formation of IP3 and DAG
via PLC-mediated PIP2 hydrolysis in HEK293 cells (Ignatov et al., 2006). DAG is a potent
activator of PKC, and therefore it was conceivable that PKC and/or calcium activated CAMK
II may in some way be involved in the GPR75 signalling pathway. Thus, pharmacological
inhibition of protein kinases using STP, a broad spectrum protein kinase inhibitor,
demonstrated that protein kinases were essential in mediating the stimulatory effect of CCL5 on
intracellular calcium levels and insulin secretion. Moreover, specific pharmacological depletion
and/or inhibition of PKC and CAMK II revealed that both protein kinases were required in
mediating the stimulatory effects of CCL5 on insulin secretion. PKC has been reported to
influence signalling components in beta cells. For example, several phosphorylation sites for
PKC have been identified on the SUR1 subunit of KATP channels (Inagaki et al., 1995b), PKC
regulates L-type VOCC activity via phosphorylation (Seino et al., 1992, Seino, 1995,
Arkhammar et al., 1994) and directly alters the phosphorylation status of cytoskeletal elements
involved in insulin exocytosis (Jones and Persaud, 1998b). Inhibition of conventional PKC
isoforms failed to inhibit CCL5-induced insulin secretion, and thus may implicate a potential
role for novel DAG-sensitive PKC isoforms in mediating the stimulatory effect of CCL5 on
insulin secretion from beta cells. Furthermore, CAMK II most likely couples the elevations of
intracellular calcium and insulin exocytosis in response to the CCL5-GPR75 interaction since it
was shown that inhibition of CAMK II using KN-62 abolished CCL5-induced insulin secretion
from MIN6 beta cells and human islets. It has been reported that CAMK II promotes vesicle
fusion with the beta cell membrane by phosphorylating v-SNARES such as VAMP (Hirling and
Scheller, 1996), and this maybe a mechanism by which CCL5 activation of GPR75 stimulates
insulin secretion stimulates insulin secretion.
GPR75 activation has also been implicated in promoting mouse hippocampal cell survival
(Ignatov et al., 2006). Therefore, experiments measuring apoptosis and cell proliferation
described in Chapter 6 aimed to investigate the effect of CCL5 and GPR75 activation on beta
cell survival. CCL5 was shown to have cell protective effects on mouse and human islets as well

Chapter 7: General discussion.
225
as MIN6 beta cells. Consistent with this, knock-down studies of GPR75 using gene specific
siRNAs revealed that beta cells were more susceptible to apoptosis compared to controls,
indicating that GPR75 signalling is associated with protection against apoptosis. Furthermore,
CCL5 also stimulated MIN6 beta cell proliferation, consistent with reports suggesting GPR75
activates a PLC/PI3K/Akt/ MAPK cell survival pathway in CV-1 cells (Ignatov et al., 2006).
Elements of this survival pathway have been implicated in beta cell survival. For example, over
expression of Akt is associated with reduced susceptibility to apoptosis and enhanced cell
proliferation (Downward, 2004, Khwaja, 1999, Lawlor and Alessi, 2001, Nakamura et al., 2000).
Akt can also expand the beta cell mass by stimulating cyclin D1 levels with concomitant
inhibition of CKIs such as p27 (Fatrai et al., 2006). Akt can also activate p42/p44 MAPK
(Ignatov et al., 2006), which has been implicated in stimulating cell cycle progression by
stimulating cyclin D1 activity (Lavoie et al., 1996). Furthermore, p42/p44 MAPK activation has
been implicated in promoting the expansion of beta cell mass (Rafacho et al., 2009).
The overall aim of this thesis was to determine the role GPR75 and its endogenous ligand
CCL5 in islets of Langerhans and the main observations illustrated in Figure 95 and can be
summarised as follows: GPR75 is the most abundantly expressed CCL5 receptor at the mRNA
level in mouse and human islets and it has been detected at the protein level in islets in alpha
and beta cells. Its activation by CCL5 stimulates insulin secretion from beta cells via GPR75
coupling to the Gαq protein, activation of PLC, elevations in intracellular calcium via calcium
influx promoted by closure of KATP channels. Although the exact mechanism of how PLC
activation is coupled to the closure of KATP channels remains unknown it is conceivable that it
may involve the activation of DAG-sensitive novel PKC isoforms. Furthermore, GPR75
activation by CCL5 also enhances beta cell survival in islets, most likely by signalling through
survival pathways. Therefore, GPR75 shows promising potential to improve glycaemic control
and improve beta cell mass, and thus it is an attractive therapeutic target for future T2DM
therapies.

Chapter 7: General discussion.
226
Figure 95: Schematic diagram summarising the GPR75 signalling pathways involved in
stimulating insulin secretion and expansion of beta cell mass. GPR75 activation by CCL5 activates
PLC, which stimulates the formation of IP3 and DAG. This activates DAG-sensitive novel PKC
isoforms, which may regulate the open state KATP channels and L-type VOCC activity. Closure of KATP
channels results in beta cell membrane depolarisation, which subsequently activated L-type VOCCs and
thus promotes calcium influx into the cytosolic compartment. Elevations in intracellular calcium stimulate
CAMK II, which promotes insulin exocytosis. GPR75 activation also enhances beta cell survival and this
may be achieved by activating a PLC/PI3K/Akt/MAPK cell survival pathway, however further
experiments are required to establish this in beta cells.

Chapter 7: General discussion
227
7.2 Future perspectives
The experiments described in this thesis provide a firm foundation for further studies on the
role of GPR75 in islets. Future experiments should identify the GPR75 signalling pathway in
beta cells in greater detail, with a focus on the role of PKC in this pathway. Experiments should
also be carried out to identify the pathways responsible for promoting beta cell survival upon
GPR75 activation. It would be worthwhile measuring Akt and p42/p44 MAPK
phosphorylation in response to GPR75 activation and observing the effects on apoptosis
and/or proliferation by pharmacological inhibition of PLC (with U73122) or PI3K (with
wortmannin) in islets and MIN6 beta cells.
It would also be of interest to determine expression levels of GPR75 and traditional CCL5
receptors in islets from obese and/or T2DM models. It has been reported that circulating levels
of CCL5 are elevated in T2DM (Herder et al., 2005), whereas CCR5 mRNA is down-regulated
in NOD mice, and CCR5-/-NOD mice display accelerated insulitis (Solomon et al., 2010,
Cameron et al., 2000). However, it has also been shown that CCR5 is also up-regulated in white
adipose tissue (WAT) of diet-induced obese (DIO) mice with CCR5-/- mice showing protection
from insulin resistance and glucose intolerance (Kitade et al., 2012). Therefore, it is conceivable
that GPR75 in beta cells may be down-regulated during the pathogenesis of T2DM, which may
cause beta cells to alter their function and become more susceptible to cell damage.
Furthermore, GPR75 mRNAs have been detected in liver and skeletal muscle (Ignatov et al.,
2006), which are key sites for glucose production and utilisation, and therefore it is possible that
GPR75 may regulate various glucoregulatory processes in peripheral tissues.
Future experiments should also include functional studies using GPR75 and CCL5 knock out
(KO) mice when they become available, in order to determine the effects on islet hormone
secretion, beta cell apoptosis and proliferation, as well as to determine other functional
alterations such as glycogen synthesis in the liver or glucose uptake in adipose tissue and skeletal
muscle, which should be further complemented with in vivo studies to determine plasma insulin
and glucose levels when compared with wild-type (WT) mice.

228
References
ADA 2010. American Diabetes Association: Diagnosis and Classification of Diabetes Mellitus.
Diabetes Care, 33, S62-S69. Ahmed, A. H. & Heppel, L. A. 1997. Evidence for a role of G protein beta gamma subunits in
the enhancement of cAMP accumulation and DNA synthesis by adenosine in human cells. J Cell Physiol, 170, 263-71.
Ahmed, N. N., Grimes, H. L., Bellacosa, A., Chan, T. O. & Tsichlis, P. N. 1997. Transduction of interleukin-2 antiapoptotic and proliferative signals via Akt protein kinase. Proc Natl Acad Sci U S A, 94, 3627-32.
Ahren, B. 2009. Islet G protein-coupled receptors as potential targets for treatment of type 2 diabetes. Nat Rev Drug Discov, 8, 369-385.
Ahrén, B. 2000. Autonomic regulation of islet hormone secretion – Implications for health and disease. Diabetologia, 43, 393-410.
Ahrén, B. & Lindskog, S. 1992. Galanin and the regulation of islet hormone secretion. International Journal of Pancreatology, 11, 147-160.
Ahren, B. & Lundquist, I. 1981. Effects of vasoactive intestinal polypeptide (VIP), secretin and gastrin on insulin secretion in the mouse. Diabetologia, 20, 54-9.
Ahrén, B., Wierup, N. & Sundler, F. 2006. Neuropeptides and the Regulation of Islet Function. Diabetes, 55, S98-S107.
Alessi, D. R. & Downes, C. P. 1998. The role of PI 3-kinase in insulin action. Biochim Biophys Acta, 1436, 151-64.
Amisten, S., Salehi, A., Rorsman, P., Jones, P. M. & Persaud, S. J. 2013. An atlas and functional analysis of G-protein coupled receptors in human islets of Langerhans. Pharmacol Ther, 139, 359-91.
Ammala, C., Ashcroft, F. M. & Rorsman, P. 1993. Calcium-independent potentiation of insulin release by cyclic AMP in single [beta]-cells. Nature, 363, 356-358.
Appay, V. & Rowland-Jones, S. L. 2001. RANTES: a versatile and controversial chemokine. Trends in Immunology, 22, 83-87.
Araki, E., Oyadomari, S. & Mori, M. 2003. Impact of endoplasmic reticulum stress pathway on pancreatic beta-cells and diabetes mellitus. Exp Biol Med (Maywood), 228, 1213-7.
Arkhammar, P., Juntti-Berggren, L., Larsson, O., Welsh, M., Nanberg, E., Sjoholm, A., Kohler, M. & Berggren, P. O. 1994. Protein kinase C modulates the insulin secretory process by maintaining a proper function of the beta-cell voltage-activated Ca2+ channels. J Biol Chem, 269, 2743-9.
Aronoff, S. L., Berkowitz, K., Shreiner, B. & Want, L. 2004. Glucose Metabolism and Regulation: Beyond Insulin and Glucagon. Diabetes Spectrum, 17, 183-190.
Ashcroft, F. M., Proks, P., Smith, P. A., Ammala, C., Bokvist, K. & Rorsman, P. 1994. Stimulus-secretion coupling in pancreatic beta cells. J Cell Biochem, 55 Suppl, 54-65.
Ashcroft, F. M. & Rorsman, P. 1989. Electrophysiology of the pancreatic beta-cell. Prog Biophys Mol Biol, 54, 87-143.
Ashcroft, W. B., Smith PA, Fewtrell CMS 1992. Ion channels involved in the regulation of nutrient-stimulated insulin secretion., London, Portland Press Ltd.
Aspinwall, C. A., Lakey, J. R. T. & Kennedy, R. T. 1999. Insulin-stimulated Insulin Secretion in Single Pancreatic Beta Cells. Journal of Biological Chemistry, 274, 6360-6365.
Atkinson, M. A. & Eisenbarth, G. S. 2001. Type 1 diabetes: new perspectives on disease pathogenesis and treatment. Lancet, 358, 221-9.
Authier, F. & Desbuquois, B. 2008. Glucagon receptors. Cell Mol Life Sci, 65, 1880-99. Azoulay, L., Yin, H., Filion, K. B., Assayag, J., Majdan, A., Pollak, M. N. & Suissa, S. 2012. The
use of pioglitazone and the risk of bladder cancer in people with type 2 diabetes: nested case-control study.
Babb, E. L., Tarpley, J., Landt, M. & Easom, R. A. 1996. Muscarinic activation of Ca2+/calmodulin-dependent protein kinase II in pancreatic islets. Temporal dissociation of kinase activation and insulin secretion. Biochem J, 317 ( Pt 1), 167-72.
References
229
Baetens, D., Malaisse-Lagae, F., Perrelet, A. & Orci, L. 1979. Endocrine pancreas: three-dimensional reconstruction shows two types of islets of langerhans. Science, 206, 1323-5.
Baggio, L. L. & Drucker, D. J. 2006. Therapeutic approaches to preserve islet mass in type 2 diabetes. Annu Rev Med, 57, 265-81.
Bailey, C. J. 2005. Overview of new and developing pharmacological treatments. Bajetto, A., Bonavia, R., Barbero, S., Florio, T. & Schettini, G. 2001. Chemokines and their
receptors in the central nervous system. Front Neuroendocrinol, 22, 147-84. Ballian, N. & Brunicardi, F. C. 2007. Islet vasculature as a regulator of endocrine pancreas
function. World J Surg, 31, 705-14. Band, A. M., Jones, P. M. & Howell, S. L. 1992. Arachidonic acid-induced insulin secretion
from rat islets of Langerhans. Journal of Molecular Endocrinology, 8, 95-101. Baron, A. D., Brechtel, G., Wallace, P. & Edelman, S. V. 1988. Rates and tissue sites of non-
insulin- and insulin-mediated glucose uptake in humans. Am J Physiol, 255, E769-74. Barry, M., Heibein, J. A., Pinkoski, M. J., Lee, S.-F., Moyer, R. W., Green, D. R. & Bleackley, R.
C. 2000. Granzyme B Short-Circuits the Need for Caspase 8 Activity during Granule-Mediated Cytotoxic T-Lymphocyte Killing by Directly Cleaving Bid. Molecular and Cellular Biology, 20, 3781-3794.
Basudev, H., Jones, P. M. & Howell, S. L. 1995. Protein phosphorylation in the regulation of insulin secretion: the use of site-directed inhibitory peptides in electrically permeabilised islets of Langerhans. Acta Diabetologica, 32, 32-37.
Baukrowitz, T., Schulte, U., Oliver, D., Herlitze, S., Krauter, T., Tucker, S. J., Ruppersberg, J. P. & Fakler, B. 1998. PIP2 and PIP as Determinants for ATP Inhibition of KATP Channels. Science, 282, 1141-1144.
Bavamian, S., Klee, P., Britan, A., Populaire, C., Caille, D., Cancela, J., Charollais, A. & Meda, P. 2007. Islet-cell-to-cell communication as basis for normal insulin secretion. Diabetes Obes Metab, 9 Suppl 2, 118-32.
Beeson, M., Sajan, M. P., Daspet, J. G., Luna, V., Dizon, M., Grebenev, D., Powe, J. L., Lucidi, S., Miura, A., Kanoh, Y., Bandyopadhyay, G., Standaert, M. L., Yeko, T. R. & Farese, R. V. 2004. Defective Activation of Protein Kinase C-z in Muscle by Insulin and Phosphatidylinositol-3,4,5,-(PO(4))(3) in Obesity and Polycystic Ovary Syndrome. Metab Syndr Relat Disord, 2, 49-56.
Beeson, M., Sajan, M. P., Dizon, M., Grebenev, D., Gomez-Daspet, J., Miura, A., Kanoh, Y., Powe, J., Bandyopadhyay, G., Standaert, M. L. & Farese, R. V. 2003. Activation of protein kinase C-zeta by insulin and phosphatidylinositol-3,4,5-(PO4)3 is defective in muscle in type 2 diabetes and impaired glucose tolerance: amelioration by rosiglitazone and exercise. Diabetes, 52, 1926-34.
Béguin, P., Nagashima, K., Nishimura, M., Gonoi, T. & Seino, S. 1999. PKA‐mediated phosphorylation of the human KATP channel: separate roles of Kir6.2 and SUR1 subunit phosphorylation.
Bensellam, M., Laybutt, D. R. & Jonas, J. C. 2012. The molecular mechanisms of pancreatic beta-cell glucotoxicity: recent findings and future research directions. Mol Cell Endocrinol, 364, 1-27.
Bernal-Mizrachi, E., Wen, W., Stahlhut, S., Welling, C. M. & Permutt, M. A. 2001. Islet beta cell expression of constitutively active Akt1/PKB alpha induces striking hypertrophy, hyperplasia, and hyperinsulinemia. J Clin Invest, 108, 1631-8.
Best, L. & Malaisse, W. J. 1983. Stimulation of phosphoinositide breakdown in rat pancreatic islets by glucose and carbamylcholine. Biochemical and Biophysical Research Communications, 116, 9-16.
Biden, T. J., Peter-Riesch, B., Schlegel, W. & Wollheim, C. B. 1987. Ca2+-mediated generation of inositol 1,4,5-triphosphate and inositol 1,3,4,5-tetrakisphosphate in pancreatic islets. Studies with K+, glucose, and carbamylcholine. J Biol Chem, 262, 3567-71.
Biden, T. J., Prentki, M., Irvine, R. F., Berridge, M. J. & Wollheim, C. B. 1984. Inositol 1,4,5-trisphosphate mobilizes intracellular Ca2+ from permeabilized insulin-secreting cells. Biochem J, 223, 467-73.

References
230
Biggs, W. H., 3rd, Meisenhelder, J., Hunter, T., Cavenee, W. K. & Arden, K. C. 1999. Protein kinase B/Akt-mediated phosphorylation promotes nuclear exclusion of the winged helix transcription factor FKHR1. Proc Natl Acad Sci U S A, 96, 7421-6.
Biswas, S. C. & Greene, L. A. 2002. Nerve Growth Factor (NGF) Down-regulates the Bcl-2 Homology 3 (BH3) Domain-only Protein Bim and Suppresses Its Proapoptotic Activity by Phosphorylation. Journal of Biological Chemistry, 277, 49511-49516.
Black, C., Cummins, E., Royle, P., Philip, S. & Waugh, N. 2007. The clinical effectiveness and cost-effectiveness of inhaled insulin in diabetes mellitus: a systematic review and economic evaluation. Health Technol Assess, 11, 1-126.
Bloom, S. R. & Edwards, A. V. 1981. The role of the parasympathetic system in the control of insulin release in the conscious calf. J Physiol, 314, 37-46.
Boffetta, P., McLerran, D., Chen, Y., Inoue, M., Sinha, R., He, J., Gupta, P. C., Tsugane, S., Irie, F., Tamakoshi, A., Gao, Y. T., Shu, X. O., Wang, R., Tsuji, I., Kuriyama, S., Matsuo, K., et al. 2011. Body mass index and diabetes in Asia: a cross-sectional pooled analysis of 900,000 individuals in the Asia cohort consortium. PLoS One, 6, e19930.
Bogan, J. S. 2012. Regulation of Glucose Transporter Translocation in Health and Diabetes. Annual Review of Biochemistry, 81, 507-532.
Bogoyevitch, M. A., Marshall, C. J. & Sugden, P. H. 1995. Hypertrophic Agonists Stimulate the Activities of the Protein Kinases c-Raf and A-Raf in Cultured Ventricular Myocytes. Journal of Biological Chemistry, 270, 26303-26310.
Bonner-Weir, S. 1988. Morphological evidence for pancreatic polarity of beta-cell within islets of Langerhans. Diabetes, 37, 616-21.
Bonner-Weir, S. 2000a. Islet growth and development in the adult. J Mol Endocrinol, 24, 297-302. Bonner-Weir, S. 2000b. Life and death of the pancreatic beta cells. Trends Endocrinol Metab, 11,
375-8. Bos, J. L. 2006. Epac proteins: multi-purpose cAMP targets. Trends in Biochemical Sciences, 31, 680-
686. Bosco, D., Armanet, M., Morel, P., Niclauss, N., Sgroi, A., Muller, Y. D., Giovannoni, L.,
Parnaud, G. & Berney, T. 2010. Unique Arrangement of α- and β-Cells in Human Islets of Langerhans. Diabetes, 59, 1202-1210.
Bowe, J. E., King, A. J., Kinsey-Jones, J. S., Foot, V. L., Li, X. F., O'Byrne, K. T., Persaud, S. J. & Jones, P. M. 2009. Kisspeptin stimulation of insulin secretion: mechanisms of action in mouse islets and rats. Diabetologia, 52, 855-62.
Brady, M. J., Bourbonais, F. J. & Saltiel, A. R. 1998. The activation of glycogen synthase by insulin switches from kinase inhibition to phosphatase activation during adipogenesis in 3T3-L1 cells. J Biol Chem, 273, 14063-6.
Braun-Dullaeus, R. C., Mann, M. J. & Dzau, V. J. 1998. Cell Cycle Progression: New Therapeutic Target for Vascular Proliferative Disease. Circulation, 98, 82-89.
Braun, M., Ramracheya, R., Bengtsson, M., Zhang, Q., Karanauskaite, J., Partridge, C., Johnson, P. R. & Rorsman, P. 2008. Voltage-gated ion channels in human pancreatic beta-cells: electrophysiological characterization and role in insulin secretion. Diabetes, 57, 1618-28.
Brissova, M., Fowler, M. J., Nicholson, W. E., Chu, A., Hirshberg, B., Harlan, D. M. & Powers, A. C. 2005. Assessment of Human Pancreatic Islet Architecture and Composition by Laser Scanning Confocal Microscopy. Journal of Histochemistry & Cytochemistry, 53, 1087-1097.
Britsch, S., Krippeitdrews, P., Lang, F., Gregor, M. & Drews, G. 1995. GLUCAGON-LIKE PEPTIDE-1 MODULATES CA2+ CURRENT BUT NOT K-ATP(+) CURRENT IN INTACT MOUSE PANCREATIC B-CELLS. Biochemical and Biophysical Research Communications, 207, 33-39.
Brocklehurst, K. W. & Hutton, J. C. 1984. Involvement of protein kinase C in the phosphorylation of an insulin-granule membrane protein. Biochem J, 220, 283-90.
Brondello, J. M., McKenzie, F. R., Sun, H., Tonks, N. K. & Pouyssegur, J. 1995. Constitutive MAP kinase phosphatase (MKP-1) expression blocks G1 specific gene transcription and S-phase entry in fibroblasts. Oncogene, 10, 1895-904.
References
231
Brunet, A., Bonni, A., Zigmond, M. J., Lin, M. Z., Juo, P., Hu, L. S., Anderson, M. J., Arden, K. C., Blenis, J. & Greenberg, M. E. 1999. Akt Promotes Cell Survival by Phosphorylating and Inhibiting a Forkhead Transcription Factor. Cell, 96, 857-868.
Bruning, J. C., Winnay, J., Bonner-Weir, S., Taylor, S. I., Accili, D. & Kahn, C. R. 1997. Development of a novel polygenic model of NIDDM in mice heterozygous for IR and IRS-1 null alleles. Cell, 88, 561-72.
Bünemann, M., Gerhardstein, B. L., Gao, T. & Hosey, M. M. 1999. Functional Regulation of L-type Calcium Channels via Protein Kinase A-mediated Phosphorylation of the β2 Subunit. Journal of Biological Chemistry, 274, 33851-33854.
Burant, C. F. 2013. Activation of GPR40 as a Therapeutic Target for the Treatment of Type 2 Diabetes. Diabetes Care, 36, S175-S179.
Burge, M. R. & Schade, D. S. 1997. Insulins. Endocrinol Metab Clin North Am, 26, 575-98. Burns, C. J., Squires, P. E. & Persaud, S. J. 2000. Signaling through the p38 and p42/44
Mitogen-Activated Families of Protein Kinases in Pancreatic β-Cell Proliferation. Biochemical and Biophysical Research Communications, 268, 541-546.
Buteau, J., Foisy, S., Rhodes, C. J., Carpenter, L., Biden, T. J. & Prentki, M. 2001. Protein Kinase Cζ Activation Mediates Glucagon-Like Peptide-1–Induced Pancreatic β-Cell Proliferation. Diabetes, 50, 2237-2243.
Buteau, J., Roduit, R., Susini, S. & Prentki, M. 1999. Glucagon-like peptide-1 promotes DNA synthesis, activates phosphatidylinositol 3-kinase and increases transcription factor pancreatic and duodenal homeobox gene 1 (PDX-1) DNA binding activity in beta (INS-1)-cells. Diabetologia, 42, 856-864.
Butler, A. E., Janson, J., Bonner-Weir, S., Ritzel, R., Rizza, R. A. & Butler, P. C. 2003a. Beta-cell deficit and increased beta-cell apoptosis in humans with type 2 diabetes. Diabetes, 52, 102-10.
Butler, A. E., Janson, J., Bonner-Weir, S., Ritzel, R., Rizza, R. A. & Butler, P. C. 2003b. β-Cell Deficit and Increased β-Cell Apoptosis in Humans With Type 2 Diabetes. Diabetes, 52, 102-110.
Butler, A. E., Janson, J., Soeller, W. C. & Butler, P. C. 2003c. Increased beta-cell apoptosis prevents adaptive increase in beta-cell mass in mouse model of type 2 diabetes: evidence for role of islet amyloid formation rather than direct action of amyloid. Diabetes, 52, 2304-14.
Buzzetti, R., Quattrocchi, C. C. & Nistico, L. 1998. Dissecting the genetics of type 1 diabetes: relevance for familial clustering and differences in incidence. Diabetes Metab Rev, 14, 111-28.
Cabrera, O., Berman, D. M., Kenyon, N. S., Ricordi, C., Berggren, P.-O. & Caicedo, A. 2006. The unique cytoarchitecture of human pancreatic islets has implications for islet cell function. Proceedings of the National Academy of Sciences of the United States of America, 103, 2334-2339.
Calle, R., Ganesan, S., Smallwood, J. I. & Rasmussen, H. 1992. Glucose-induced phosphorylation of myristoylated alanine-rich C kinase substrate (MARCKS) in isolated rat pancreatic islets. J Biol Chem, 267, 18723-7.
Cameron, C. G. & Bennett, H. A. 2009. Cost-effectiveness of insulin analogues for diabetes mellitus. Cmaj, 180, 400-7.
Cameron, M. J., Arreaza, G. A., Grattan, M., Meagher, C., Sharif, S., Burdick, M. D., Strieter, R. M., Cook, D. N. & Delovitch, T. L. 2000. Differential Expression of CC Chemokines and the CCR5 Receptor in the Pancreas Is Associated with Progression to Type I Diabetes. The Journal of Immunology, 165, 1102-1110.
Camina, J. P., Lodeiro, M., Ischenko, O., Martini, A. C. & Casanueva, F. F. 2007. Stimulation by ghrelin of p42/p44 mitogen-activated protein kinase through the GHS-R1a receptor: role of G-proteins and beta-arrestins. J Cell Physiol, 213, 187-200.
Cardone, M. H., Roy, N., Stennicke, H. R., Salvesen, G. S., Franke, T. F., Stanbridge, E., Frisch, S. & Reed, J. C. 1998. Regulation of cell death protease caspase-9 by phosphorylation. Science, 282, 1318-21.
Cargnello, M. & Roux, P. P. 2011. Activation and function of the MAPKs and their substrates, the MAPK-activated protein kinases. Microbiol Mol Biol Rev, 75, 50-83.

References
232
Carpenter, L., Mitchell, C. J., Xu, Z. Z., Poronnik, P., Both, G. W. & Biden, T. J. 2004. PKCα Is Activated But Not Required During Glucose-Induced Insulin Secretion From Rat Pancreatic Islets. Diabetes, 53, 53-60.
Cartier, L., Hartley, O., Dubois-Dauphin, M. & Krause, K. H. 2005. Chemokine receptors in the central nervous system: role in brain inflammation and neurodegenerative diseases. Brain Res Brain Res Rev, 48, 16-42.
Carvalho-Pinto, C., García, M. I., Gómez, L., Ballesteros, A., Zaballos, A., Flores, J. M., Mellado, M., Rodríguez-Frade, J. M., Balomenos, D. & Martínez-A, C. 2004. Leukocyte attraction through the CCR5 receptor controls progress from insulitis to diabetes in non-obese diabetic mice. European Journal of Immunology, 34, 548-557.
Cerasi, E. 1975. Mechanisms of glucose stimulated insulin secretion in health and in diabetes: Some re-evaluations and proposals. Diabetologia, 11, 1-13.
Chamnan, P., Simmons, R. K., Forouhi, N. G., Luben, R. N., Khaw, K. T., Wareham, N. J. & Griffin, S. J. 2011. Incidence of type 2 diabetes using proposed HbA1c diagnostic criteria in the european prospective investigation of cancer-norfolk cohort: implications for preventive strategies. Diabetes Care, 34, 950-6.
Chang, F., Lee, J. T., Navolanic, P. M., Steelman, L. S., Shelton, J. G., Blalock, W. L., Franklin, R. A. & McCubrey, J. A. 2003. Involvement of PI3K/Akt pathway in cell cycle progression, apoptosis, and neoplastic transformation: a target for cancer chemotherapy. Leukemia, 17, 590-603.
Chen, L., Koh, D. S. & Hille, B. 2003. Dynamics of calcium clearance in mouse pancreatic beta-cells. Diabetes, 52, 1723-31.
Chen, R. H., Sarnecki, C. & Blenis, J. 1992. Nuclear localization and regulation of erk- and rsk-encoded protein kinases. Molecular and Cellular Biology, 12, 915-927.
Chen, T. H. & Hsu, W. H. 1995. U-73122 inhibits carbachol-induced increases in [Ca2+]i, IP3, and insulin release in beta-TC3 cells. Life Sci, 56, Pl103-8.
Cheng, K., Delghingaro-Augusto, V., Nolan, C. J., Turner, N., Hallahan, N., Andrikopoulos, S. & Gunton, J. E. 2012. High Passage MIN6 Cells Have Impaired Insulin Secretion with Impaired Glucose and Lipid Oxidation. PLoS ONE, 7, e40868.
Cheung, H. H., Lynn Kelly, N., Liston, P. & Korneluk, R. G. 2006. Involvement of caspase-2 and caspase-9 in endoplasmic reticulum stress-induced apoptosis: a role for the IAPs. Exp Cell Res, 312, 2347-57.
Chiasson, J. L., Liljenquist, J. E., Finger, F. E. & Lacy, W. W. 1976. Differential sensitivity of glycogenolysis and gluconeogenesis to insulin infusions in dogs. Diabetes, 25, 283-91.
Chu, Z. L., Carroll, C., Alfonso, J., Gutierrez, V., He, H., Lucman, A., Pedraza, M., Mondala, H., Gao, H., Bagnol, D., Chen, R., Jones, R. M., Behan, D. P. & Leonard, J. 2008. A role for intestinal endocrine cell-expressed g protein-coupled receptor 119 in glycemic control by enhancing glucagon-like Peptide-1 and glucose-dependent insulinotropic Peptide release. Endocrinology, 149, 2038-47.
Clark, J. T., Kalra, P. S., Crowley, W. R. & Kalra, S. P. 1984. Neuropeptide Y and human pancreatic polypeptide stimulate feeding behavior in rats. Endocrinology, 115, 427-9.
Clissold, S. P. & Edwards, C. 1988. Acarbose. A preliminary review of its pharmacodynamic and pharmacokinetic properties, and therapeutic potential. Drugs, 35, 214-43.
Colca, J. R., Brooks, C. L., Landt, M. & McDaniel, M. L. 1983. Correlation of Ca2+-and calmodulin-dependent protein kinase activity with secretion of insulin from islets of Langerhans. Biochem J, 212, 819-27.
Coniff, R. F., Shapiro, J. A., Robbins, D., Kleinfield, R., Seaton, T. B., Beisswenger, P. & McGill, J. B. 1995. Reduction of glycosylated hemoglobin and postprandial hyperglycemia by acarbose in patients with NIDDM. A placebo-controlled dose-comparison study. Diabetes Care, 18, 817-24.
Conti, P., Pang, X., Boucher, W., Letourneau, R., Reale, M., Barbacane, R. C., Thibault, J. & Theoharides, T. C. 1997. RANTES is a pro-inflammatory chemokine and chemoattracts basophil cells to extravascular sites. J Pathol, 183, 352-8.
Cooper, G. J., Willis, A. C., Clark, A., Turner, R. C., Sim, R. B. & Reid, K. B. 1987. Purification and characterization of a peptide from amyloid-rich pancreases of type 2 diabetic patients. Proceedings of the National Academy of Sciences, 84, 8628-8632.

References
233
Coore, H. G. & Randle, P. J. 1964. Regulation of insulin secretion studied with pieces of rabbit pancreas incubated in vitro. Biochem. J., 93, 66-78.
Coppieters, K. T., Wiberg, A., Amirian, N., Kay, T. W. & von Herrath, M. G. 2011. Persistent glucose transporter expression on pancreatic beta cells from longstanding type 1 diabetic individuals. Diabetes Metab Res Rev, 27, 746-54.
Creagh, E. M., Conroy, H. & Martin, S. J. 2003. Caspase-activation pathways in apoptosis and immunity. Immunol Rev, 193, 10-21.
Cummings, J. L., Vinters, H. V., Cole, G. M. & Khachaturian, Z. S. 1998. Alzheimer's disease: etiologies, pathophysiology, cognitive reserve, and treatment opportunities. Neurology, 51, S2-17; discussion S65-7.
Curry, D. L., Bennett, L. L. & Grodsky, G. M. 1968. Requirement for calcium ion in insulin secretion by the perfused rat pancreas. Am J Physiol, 214, 174-8.
Curtin, J. F. & Cotter, T. G. 2003. Live and let die: regulatory mechanisms in Fas-mediated apoptosis. Cell Signal, 15, 983-92.
Dadi, P. K., Vierra, N. C., Ustione, A., Piston, D. W., Colbran, R. J. & Jacobson, D. A. 2014. Inhibition of Pancreatic β-Cell Ca2+/Calmodulin-dependent Protein Kinase II Reduces Glucose-stimulated Calcium Influx and Insulin Secretion, Impairing Glucose Tolerance. Journal of Biological Chemistry, 289, 12435-12445.
Dahl, U., Sjodin, A. & Semb, H. 1996. Cadherins regulate aggregation of pancreatic beta-cells in vivo. Development, 122, 2895-902.
Dahlquist, G. G. 1997. Viruses and Other Perinatal Exposures as Initiating Events for β-cell Destruction. Annals of Medicine, 29, 413-417.
Danaei, G., Finucane, M. M., Lu, Y., Singh, G. M., Cowan, M. J., Paciorek, C. J., Lin, J. K., Farzadfar, F., Khang, Y. H., Stevens, G. A., Rao, M., Ali, M. K., Riley, L. M., Robinson, C. A. & Ezzati, M. 2011. National, regional, and global trends in fasting plasma glucose and diabetes prevalence since 1980: systematic analysis of health examination surveys and epidemiological studies with 370 country-years and 2.7 million participants. Lancet, 378, 31-40.
Daniel, P. B., Walker, W. H. & Habener, J. F. 1998. Cyclic AMP signaling and gene regulation. Annu Rev Nutr, 18, 353-83.
Date, Y., Nakazato, M., Hashiguchi, S., Dezaki, K., Mondal, M. S., Hosoda, H., Kojima, M., Kangawa, K., Arima, T., Matsuo, H., Yada, T. & Matsukura, S. 2002. Ghrelin Is Present in Pancreatic α-Cells of Humans and Rats and Stimulates Insulin Secretion. Diabetes, 51, 124-129.
de Rooij, J., Zwartkruis, F. J. T., Verheijen, M. H. G., Cool, R. H., Nijman, S. M. B., Wittinghofer, A. & Bos, J. L. 1998. Epac is a Rap1 guanine-nucleotide-exchange factor directly activated by cyclic AMP. Nature, 396, 474-477.
De Vos, A., Heimberg, H., Quartier, E., Huypens, P., Bouwens, L., Pipeleers, D. & Schuit, F. 1995. Human and rat beta cells differ in glucose transporter but not in glucokinase gene expression. Journal of Clinical Investigation, 96, 2489-95.
Dean, P. M. 1973. Ultrastructural morphometry of the pancreatic -cell. Diabetologia, 9, 115-9. DeFronzo, R. A. 1988. The Triumvirate: β-Cell, Muscle, Liver: A Collusion Responsible for
NIDDM. Diabetes, 37, 667-687. DeFronzo, R. A. 1999. Pharmacologic Therapy for Type 2 Diabetes Mellitus. Annals of Internal
Medicine, 131, 281-303. DeFronzo, R. A., Barzilai, N. & Simonson, D. C. 1991. Mechanism of metformin action in
obese and lean noninsulin-dependent diabetic subjects. J Clin Endocrinol Metab, 73, 1294-301.
Delmeire, D., Flamez, D., Hinke, S. A., Cali, J. J., Pipeleers, D. & Schuit, F. 2003. Type VIII adenylyl cyclase in rat beta cells: coincidence signal detector/generator for glucose and GLP-1. Diabetologia, 46, 1383-1393.
Denker, P. S. & Dimarco, P. E. 2006. Exenatide (Exendin-4)–Induced Pancreatitis: A case report. Diabetes Care, 29, 471.
Dezaki, K., Damdindorj, B., Sone, H., Dyachok, O., Tengholm, A., Gylfe, E., Kurashina, T., Yoshida, M., Kakei, M. & Yada, T. 2011. Ghrelin attenuates cAMP-PKA signaling to evoke insulinostatic cascade in islet beta-cells. Diabetes, 60, 2315-24.

References
234
Diamant, M. & Heine, R. 2003. Thiazolidinediones in Type 2 Diabetes Mellitus. Drugs, 63, 1373-1406.
Diao, J., Asghar, Z., Chan, C. B. & Wheeler, M. B. 2005. Glucose-regulated glucagon secretion requires insulin receptor expression in pancreatic alpha-cells. J Biol Chem, 280, 33487-96.
Ding, W.-G. & Gromada, J. 1997. Protein Kinase A-Dependent Stimulation of Exocytosis in Mouse Pancreatic β-Cells by Glucose-Dependent Insulinotropic Polypeptide. Diabetes, 46, 615-621.
Donath, M. & Halban, P. 2004. Decreased beta-cell mass in diabetes: significance, mechanisms and therapeutic implications. Diab tologia, 47, 581-589.
Downes, G. B. & Gautam, N. 1999. The G protein subunit gene families. Genomics, 62, 544-52. Downward, J. 2004. PI 3-kinase, Akt and cell survival. Semin Cell Dev Biol, 15, 177-82. Drake, M. T., Shenoy, S. K. & Lefkowitz, R. J. 2006. Trafficking of G Protein–Coupled
Receptors. Circulation Research, 99, 570-582. Draznin, B. 1988. Intracellular calcium, insulin secretion, and action. The American Journal of
Medicine, 85, 44-58. DUK 2014. Diabetes UK: Facts and Stats.), Diabetes UK. Dunlop, M. & Clark, S. 1995. Glucose-induced phosphorylation and activation of a high
molecular weight cytosolic phospholipase A2 in neonatal rat pancreatic islets. The International Journal of Biochemistry & Cell Biology, 27, 1191-1199.
Dunning, B. E., Foley, J. E. & Ahrén, B. 2005. Alpha cell function in health and disease: influence of glucagon-like peptide-1. Diabetologia, 48, 1700-1713.
Duttaroy, A., Zimliki, C. L., Gautam, D., Cui, Y., Mears, D. & Wess, J. 2004. Muscarinic stimulation of pancreatic insulin and glucagon release is abolished in m3 muscarinic acetylcholine receptor-deficient mice. Diabetes, 53, 1714-20.
Easom, R. A. 1999. CaM kinase II: a protein kinase with extraordinary talents germane to insulin exocytosis. Diabetes, 48, 675-84.
Easom, R. A., Filler, N. R., Ings, E. M., Tarpley, J. & Landt, M. 1997. Correlation of the activation of Ca2+/calmodulin-dependent protein kinase II with the initiation of insulin secretion from perifused pancreatic islets. Endocrinology, 138, 2359-64.
Efanova, I. B., Zaitsev, S. V., Zhivotovsky, B., Kohler, M., Efendic, S., Orrenius, S. & Berggren, P. O. 1998. Glucose and tolbutamide induce apoptosis in pancreatic beta-cells. A process dependent on intracellular Ca2+ concentration. J Biol Chem, 273, 33501-7.
Egea, P. F., Stroud, R. M. & Walter, P. 2005. Targeting proteins to membranes: structure of the signal recognition particle. Curr Opin Struct Biol, 15, 213-20.
Ehses, J. A., Pelech, S. L., Pederson, R. A. & McIntosh, C. H. S. 2002. Glucose-dependent Insulinotropic Polypeptide Activates the Raf-Mek1/2-ERK1/2 Module via a Cyclic AMP/cAMP-dependent Protein Kinase/Rap1-mediated Pathway. Journal of Biological Chemistry, 277, 37088-37097.
Ellis, T. M. & Atkinson, M. A. 1996. Early infant diets and insulin-dependent diabetes. The Lancet, 347, 1464-1465.
Emamaullee, J., Liston, P., Korneluk, R. G., Shapiro, A. M. & Elliott, J. F. 2005. XIAP overexpression in islet beta-cells enhances engraftment and minimizes hypoxia-reperfusion injury. Am J Transplant, 5, 1297-305.
Emamaullee, J. A. & Shapiro, A. M. J. 2006. Interventional Strategies to Prevent β-Cell Apoptosis in Islet Transplantation. Diabetes, 55, 1907-1914.
Esni, F., Taljedal, I. B., Perl, A. K., Cremer, H., Christofori, G. & Semb, H. 1999. Neural cell adhesion molecule (N-CAM) is required for cell type segregation and normal ultrastructure in pancreatic islets. J Cell Biol, 144, 325-37.
Estella, E., McKenzie, M. D., Catterall, T., Sutton, V. R., Bird, P. I., Trapani, J. A., Kay, T. W. & Thomas, H. E. 2006. Granzyme B-mediated death of pancreatic beta-cells requires the proapoptotic BH3-only molecule bid. Diabetes, 55, 2212-9.
Fabiato, A. 1992. Two kinds of calcium-induced release of calcium from the sarcoplasmic reticulum of skinned cardiac cells. Adv Exp Med Biol, 311, 245-62.

References
235
Fatrai, S., Elghazi, L., Balcazar, N., Cras-Méneur, C., Krits, I., Kiyokawa, H. & Bernal-Mizrachi, E. 2006. Akt Induces β-Cell Proliferation by Regulating Cyclin D1, Cyclin D2, and p21 Levels and Cyclin-Dependent Kinase-4 Activity. Diabetes, 55, 318-325.
Fehmann, H. C., Goke, R. & Goke, B. 1995. Cell and molecular biology of the incretin hormones glucagon-like peptide-I and glucose-dependent insulin releasing polypeptide. Endocr Rev, 16, 390-410.
Fehmann, H. C. & Habener, J. F. 1992. INSULINOTROPIC HORMONE GLUCAGON-LIKE PEPTIDE-I(7-37) STIMULATION OF PROINSULIN GENE-EXPRESSION AND PROINSULIN BIOSYNTHESIS IN INSULINOMA BETA-TC-1 CELLS. Endocrinology, 130, 159-166.
Ferrannini, E., Haffner, S. M., Mitchell, B. D. & Stern, M. P. 1991. Hyperinsulinaemia: the key feature of a cardiovascular and metabolic syndrome. Diabetologia, 34, 416-22.
Filipsson, K., Pacini, G., Scheurink, A. J. & Ahren, B. 1998a. PACAP stimulates insulin secretion but inhibits insulin sensitivity in mice. Am J Physiol, 274, E834-42.
Filipsson, K., Sundler, F., Hannibal, J. & Ahren, B. 1998b. PACAP and PACAP receptors in insulin producing tissues: localization and effects. Regul Pept, 74, 167-75.
Filipsson, K., Tornoe, K., Holst, J. & Ahren, B. 1997. Pituitary adenylate cyclase-activating polypeptide stimulates insulin and glucagon secretion in humans. J Clin Endocrinol Metab, 82, 3093-8.
Finegood, D. T., Scaglia, L. & Bonner-Weir, S. 1995. Dynamics of β-cell Mass in the Growing Rat Pancreas: Estimation With a Simple Mathematical Model. Diabetes, 44, 249-256.
Fonseca, S. G., Lipson, K. L. & Urano, F. 2007. Endoplasmic reticulum stress signaling in pancreatic beta-cells. Antioxid Redox Signal, 9, 2335-44.
Forbes, J. M. & Cooper, M. E. 2013. Mechanisms of diabetic complications. Physiol Rev, 93, 137-88.
Franke, T. F., Kaplan, D. R., Cantley, L. C. & Toker, A. 1997. Direct regulation of the Akt proto-oncogene product by phosphatidylinositol-3,4-bisphosphate. Science, 275, 665-8.
Fresno Vara, J. A., Casado, E., de Castro, J., Cejas, P., Belda-Iniesta, C. & Gonzalez-Baron, M. 2004. PI3K/Akt signalling pathway and cancer. Cancer Treat Rev, 30, 193-204.
Frödin, M., Sekine, N., Roche, E., Filloux, C., Prentki, M., Wollheim, C. B. & Van Obberghen, E. 1995. Glucose, Other Secretagogues, and Nerve Growth Factor Stimulate Mitogen-activated Protein Kinase in the Insulin-secreting β-Cell Line, INS-1. Journal of Biological Chemistry, 270, 7882-7889.
Froelich, C. J., Dixit, V. M. & Yang, X. 1998. Lymphocyte granule-mediated apoptosis: matters of viral mimicry and deadly proteases. Immunology Today, 19, 30-36.
Fu, Z., Gilbert, E. R. & Liu, D. 2013. Regulation of insulin synthesis and secretion and pancreatic Beta-cell dysfunction in diabetes. Curr Diabetes Rev, 9, 25-53.
Fuhlendorff, J., Rorsman, P., Kofod, H., Brand, C. L., Rolin, B., MacKay, P., Shymko, R. & Carr, R. D. 1998. Stimulation of insulin release by repaglinide and glibenclamide involves both common and distinct processes. Diabetes, 47, 345-51.
Fujioka, K. 2007. Pathophysiology of type 2 diabetes and the role of incretin hormones and beta-cell dysfunction. Jaapa, Suppl, 3-8.
Gamm, D. M., Baude, E. J. & Uhler, M. D. 1996. The major catalytic subunit isoforms of cAMP-dependent protein kinase have distinct biochemical properties in vitro and in vivo. J Biol Chem, 271, 15736-42.
Gao, J., Tian, L., Weng, G., Bhagroo, N. V., Sorenson, R. L., O'Brien, T. D., Luo, J. & Guo, Z. 2011. Stimulating beta cell replication and improving islet graft function by GPR119 agonists. Transpl Int, 24, 1124-34.
Gao, T., Yatani, A., Dell'Acqua, M. L., Sako, H., Green, S. A., Dascal, N., Scott, J. D. & Hosey, M. M. 1997. cAMP-dependent regulation of cardiac L-type Ca2+ channels requires membrane targeting of PKA and phosphorylation of channel subunits. Neuron, 19, 185-96.
Gao, Z. Y., Drews, G., Nenquin, M., Plant, T. D. & Henquin, J. C. 1990. Mechanisms of the stimulation of insulin release by arginine-vasopressin in normal mouse islets. J Biol Chem, 265, 15724-30.

References
236
Gastaldelli, A., Ferrannini, E., Miyazaki, Y., Matsuda, M., Mari, A. & DeFronzo, R. A. 2007. Thiazolidinediones improve beta-cell function in type 2 diabetic patients. Am J Physiol Endocrinol Metab, 292, E871-83.
Gautam, D., Han, S. J., Hamdan, F. F., Jeon, J., Li, B., Li, J. H., Cui, Y., Mears, D., Lu, H., Deng, C., Heard, T. & Wess, J. 2006. A critical role for beta cell M3 muscarinic acetylcholine receptors in regulating insulin release and blood glucose homeostasis in vivo. Cell Metab, 3, 449-61.
Gazzano, H., Halban, P., Prentki, M., Ballotti, R., Brandenburg, D., Fehlmann, M. & Van Obberghen, E. 1985. Identification of functional insulin receptors on membranes from an insulin-producing cell line (RINm5F). Biochem J, 226, 867-72.
Geerlings, S., Fonseca, V., Castro-Diaz, D., List, J. & Parikh, S. 2014. Genital and urinary tract infections in diabetes: impact of pharmacologically-induced glucosuria. Diabetes Res Clin Pract, 103, 373-81.
Georgia, S. & Bhushan, A. 2004. Beta cell replication is the primary mechanism for maintaining postnatal beta cell mass. J Clin Invest, 114, 963-8.
Gerber, P. P., Trimble, E. R., Wollheim, C. B. & Renold, A. E. 1981. Effect of insulin on glucose- and arginine-stimulated somatostatin secretion from the isolated perfused rat pancreas. Endocrinology, 109, 279-83.
Gesbert, F., Sellers, W. R., Signoretti, S., Loda, M. & Griffin, J. D. 2000. BCR/ABL Regulates Expression of the Cyclin-dependent Kinase Inhibitor p27Kip1 through the Phosphatidylinositol 3-Kinase/AKT Pathway. Journal of Biological Chemistry, 275, 39223-39230.
Gey, G. O. & Gey, M. K. 1936. The Maintenance of Human Normal Cells and Tumor Cells in Continuous Culture: I. Preliminary Report: Cultivation of Mesoblastic Tumors and Normal Tissue and Notes on Methods of Cultivation. The American Journal of Cancer, 27, 45-76.
Gilon, P. & Henquin, J. C. 2001. Mechanisms and physiological significance of the cholinergic control of pancreatic beta-cell function. Endocr Rev, 22, 565-604.
Gitlin, N., Julie, N. L., Spurr, C. L., Lim, K. N. & Juarbe, H. M. 1998. Two cases of severe clinical and histologic hepatotoxicity associated with troglitazone. Ann Intern Med, 129, 36-8.
Göpel, S. O., Kanno, T., Barg, S., Weng, X. G., Gromada, J. & Rorsman, P. 2000. Regulation of glucagon release in mouse α-cells by KATP channels and inactivation of TTX-sensitive Na+ channels. The Journal of Physiology, 528, 509-520.
Graff, J. R., Konicek, B. W., McNulty, A. M., Wang, Z., Houck, K., Allen, S., Paul, J. D., Hbaiu, A., Goode, R. G., Sandusky, G. E., Vessella, R. L. & Neubauer, B. L. 2000. Increased AKT Activity Contributes to Prostate Cancer Progression by Dramatically Accelerating Prostate Tumor Growth and Diminishing p27Kip1 Expression. Journal of Biological Chemistry, 275, 24500-24505.
Granata, R. & Ghigo, E. 2013. Products of the ghrelin gene, the pancreatic beta-cell and the adipocyte. Endocr Dev, 25, 144-56.
Granata, R., Settanni, F., Biancone, L., Trovato, L., Nano, R., Bertuzzi, F., Destefanis, S., Annunziata, M., Martinetti, M., Catapano, F., Ghe, C., Isgaard, J., Papotti, M., Ghigo, E. & Muccioli, G. 2007. Acylated and unacylated ghrelin promote proliferation and inhibit apoptosis of pancreatic beta-cells and human islets: involvement of 3',5'-cyclic adenosine monophosphate/protein kinase A, extracellular signal-regulated kinase 1/2, and phosphatidyl inositol 3-Kinase/Akt signaling. Endocrinology, 148, 512-29.
Graves, T. K. & Hinkle, P. M. 2003. Ca(2+)-induced Ca(2+) release in the pancreatic beta-cell: direct evidence of endoplasmic reticulum Ca(2+) release. Endocrinology, 144, 3565-74.
Green, A. C., Dowdall, M. J. & Richardson, C. M. 1997. ATP acting on P2Y receptors triggers calcium mobilization in Schwann cells at the neuroelectrocyte junction in skate. Neuroscience, 80, 635-51.
Gregersen, S. & Ahren, B. 1996. Studies on the mechanisms by which gastrin releasing peptide potentiates glucose-induced insulin secretion from mouse islets. Pancreas, 12, 48-57.
Gromada, J., Bokvist, K., Ding, W.-G., Barg, S., Buschard, K., Renström, E. & Rorsman, P. 1997a. Adrenaline Stimulates Glucagon Secretion in Pancreatic A-Cells by Increasing

References
237
the Ca2+ Current and the Number of Granules Close to the L-Type Ca2+ Channels. The Journal of General Physiology, 110, 217-228.
Gromada, J., Ding, W.-G., Barg, S., Renström, E. & Rorsman, P. 1997b. Multisite regulation of insulin secretion by cAMP-increasing agonists: evidence that glucagon-like peptide 1 and glucagon act via distinct receptors. Pflügers Archiv, 434, 515-524.
Guardado-Mendoza, R., Davalli, A. M., Chavez, A. O., Hubbard, G. B., Dick, E. J., Majluf-Cruz, A., Tene-Perez, C. E., Goldschmidt, L., Hart, J., Perego, C., Comuzzie, A. G., Tejero, M. E., Finzi, G., Placidi, C., La Rosa, S., Capella, C., et al. 2009. Pancreatic islet amyloidosis, beta-cell apoptosis, and alpha-cell proliferation are determinants of islet remodeling in type-2 diabetic baboons. Proc Natl Acad Sci U S A, 106, 13992-7.
Guenifi, A., Portela-Gomes, G. M., Grimelius, L., Efendić, S. & Abdel-Halim, S. M. 2000. Adenylyl cyclase isoform expression in non-diabetic and diabetic Goto-Kakizaki (GK) rat pancreas. Evidence for distinct overexpression of type-8 adenylyl cyclase in diabetic GK rat islets. Histochemistry and Cell Biology, 113, 81-89.
Gylfe, E., Grapengiesser, E. & Hellman, B. 1991. Propagation of cytoplasmic Ca2+ oscillations in clusters of pancreatic beta-cells exposed to glucose. Cell Calcium, 12, 229-40.
Gylfe, E. & Hellman, B. 1987. External ATP mimics carbachol in initiating calcium mobilization from pancreatic beta-cells conditioned by previous exposure to glucose. Br J Pharmacol, 92, 281-9.
Hakonen, E., Ustinov, J., Eizirik, D. L., Sariola, H., Miettinen, P. J. & Otonkoski, T. 2014. In vivo activation of the PI3K-Akt pathway in mouse beta cells by the EGFR mutation L858R protects against diabetes. Diabetologia, 57, 970-9.
Halban, P. A., Wollheim, C. B., Blondel, B., Meda, P., Niesor, E. N. & Mintz, D. H. 1982. The possible importance of contact between pancreatic islet cells for the control of insulin release. Endocrinology, 111, 86-94.
Hammar, E., Tomas, A., Bosco, D. & Halban, P. A. 2009. Role of the Rho-ROCK (Rho-associated kinase) signaling pathway in the regulation of pancreatic beta-cell function. Endocrinology, 150, 2072-9.
Han, P., Werber, J., Surana, M., Fleischer, N. & Michaeli, T. 1999. The Calcium/Calmodulin-dependent Phosphodiesterase PDE1C Down-regulates Glucose-induced Insulin Secretion. Journal of Biological Chemistry, 274, 22337-22344.
Harada, H., Andersen, J. S., Mann, M., Terada, N. & Korsmeyer, S. J. 2001. p70S6 kinase signals cell survival as well as growth, inactivating the pro-apoptotic molecule BAD. Proc Natl Acad Sci U S A, 98, 9666-70.
Harbeck, M. C., Louie, D. C., Howland, J., Wolf, B. A. & Rothenberg, P. L. 1996. Expression of Insulin Receptor mRNA and Insulin Receptor Substrate 1 in Pancreatic Islet β-Cells. Diabetes, 45, 711-717.
Härndahl, L., Jing, X.-J., Ivarsson, R., Degerman, E., Ahrén, B., Manganiello, V. C., Renström, E. & Holst, L. S. 2002. Important Role of Phosphodiesterase 3B for the Stimulatory Action of cAMP on Pancreatic β-Cell Exocytosis and Release of Insulin. Journal of Biological Chemistry, 277, 37446-37455.
Harris, T. E., Persaud, S. J. & Jones, P. M. 1996. Atypical Isoforms of PKC and Insulin Secretion from Pancreatic β-Cells: Evidence Using Gö 6976 and Ro 31-8220 as PKC Inhibitors. Biochemical and Biophysical Research Communications, 227, 672-676.
Harrison, D. E., Ashcroft, S. J. H., Christie, M. R. & Lord, J. M. 1984. Protein phosphorylation in the pancreatic B-cell. Experientia, 40, 1075-1084.
Hashimoto, N., Kido, Y., Uchida, T., Matsuda, T., Suzuki, K., Inoue, H., Matsumoto, M., Ogawa, W., Maeda, S., Fujihara, H., Ueta, Y., Uchiyama, Y., Akimoto, K., Ohno, S., Noda, T. & Kasuga, M. 2005. PKClambda regulates glucose-induced insulin secretion through modulation of gene expression in pancreatic beta cells. J Clin Invest, 115, 138-45.
Hatakeyama, M., Brill, J. A., Fink, G. R. & Weinberg, R. A. 1994. Collaboration of G1 cyclins in the functional inactivation of the retinoblastoma protein. Genes Dev, 8, 1759-71.
Hauge-Evans, A. C., Reers, C., Kerby, A., Franklin, Z., Amisten, S., King, A. J., Hassan, Z., Vilches-Flores, A., Tippu, Z., Persaud, S. J. & Jones, P. M. 2014. Effect of

References
238
hyperglycaemia on muscarinic M3 receptor expression and secretory sensitivity to cholinergic receptor activation in islets. Diabetes Obes Metab.
Hauge-Evans, A. C., Richardson, C. C., Milne, H. M., Christie, M. R., Persaud, S. J. & Jones, P. M. 2006. A role for kisspeptin in islet function. Diabetologia, 49, 2131-5.
Hauge-Evans, A. C., Squires, P. E., Persaud, S. J. & Jones, P. M. 1999. Pancreatic beta-cell-to-beta-cell interactions are required for integrated responses to nutrient stimuli: enhanced Ca2+ and insulin secretory responses of MIN6 pseudoislets. Diabetes, 48, 1402-1408.
Hedeskov, C. J. 1980. Mechanism of glucose-induced insulin secretion. Heibein, J. A., Goping, I. S., Barry, M., Pinkoski, M. J., Shore, G. C., Green, D. R. & Bleackley,
R. C. 2000. Granzyme B–Mediated Cytochrome C Release Is Regulated by the Bcl-2 Family Members Bid and Bax. The Journal of Experimental Medicine, 192, 1391-1402.
Heller, R. S. & Aponte, G. W. 1995. Intra-islet regulation of hormone secretion by glucagon-like peptide-1- (7-36) amide. American Journal of Physiology - Gastrointestinal and Liver Physiology, 269, G852-G860.
Hellman, B. & Gylfe, E. 1986. Mobilization of different intracellular calcium pools after activation of muscarinic receptors in pancreatic beta-cells. Pharmacology, 32, 257-67.
Hellman, B., Gylfe, E., Bergsten, P., Grapengiesser, E., Lund, P. E., Berts, A., Tengholm, A., Pipeleers, D. G. & Ling, Z. 1994. Glucose induces oscillatory Ca2+ signalling and insulin release in human pancreatic beta cells. Diabetologia, 37 Suppl 2, S11-20.
Henquin, J. C. 2000. Triggering and amplifying pathways of regulation of insulin secretion by glucose. Diabetes, 49, 1751-1760.
Henquin, J. C. 2011. The dual control of insulin secretion by glucose involves triggering and amplifying pathways in beta-cells. Diabetes Res Clin Pract, 93 Suppl 1, S27-31.
Henquin, J. C., Dufrane, D. & Nenquin, M. 2006. Nutrient control of insulin secretion in isolated normal human islets. Diabetes, 55, 3470-7.
Henquin, J. C., Ravier, M. A., Nenquin, M., Jonas, J. C. & Gilon, P. 2003. Hierarchy of the beta-cell signals controlling insulin secretion. Eur J Clin Invest, 33, 742-50.
Herder, C., Haastert, B., Müller-Scholze, S., Koenig, W., Thorand, B., Holle, R., Wichmann, H.-E., Scherbaum, W. A., Martin, S. & Kolb, H. 2005. Association of Systemic Chemokine Concentrations With Impaired Glucose Tolerance and Type 2 Diabetes: Results from the Cooperative Health Research in the Region of Augsburg Survey S4 (KORA S4). Diabetes, 54, S11-S17.
Hirling, H. & Scheller, R. H. 1996. Phosphorylation of synaptic vesicle proteins: modulation of the alpha SNAP interaction with the core complex. Proc Natl Acad Sci U S A, 93, 11945-9.
Holst, J. J. & Gromada, J. 2004. Role of incretin hormones in the regulation of insulin secretion in diabetic and nondiabetic humans.
Holz, G. G. 2004. Epac: A New cAMP-Binding Protein in Support of Glucagon-Like Peptide-1 Receptor-Mediated Signal Transduction in the Pancreatic β-Cell. Diabetes, 53, 5-13.
Holz, G. G., Kang, G., Harbeck, M., Roe, M. W. & Chepurny, O. G. 2006. Cell physiology of cAMP sensor Epac. The Journal of Physiology, 577, 5-15.
Holz, G. G., Leech, C. A., Heller, R. S., Castonguay, M. & Habener, J. F. 1999. cAMP-dependent Mobilization of Intracellular Ca2+ Stores by Activation of Ryanodine Receptors in Pancreatic β-Cells: A Ca2+ SIGNALING SYSTEM STIMULATED BY THE INSULINOTROPIC HORMONE GLUCAGON-LIKE PEPTIDE-1-(7–37). Journal of Biological Chemistry, 274, 14147-14156.
Honey, R. N. & Weir, G. C. 1979. Insulin stimulates somatostatin and inhibits glucagon secretion from the perfused chicken pancreas-duodenum. Life Sciences, 24, 1747-1750.
Honey, R. N. & Weir, G. C. 1980. Acetylcholine stimulates insulin, glucagon, and somatostatin release in the perfused chicken pancreas. Endocrinology, 107, 1065-8.
Hopcroft, D. W., Mason, D. R. & Scott, R. S. 1985. Structure-function relationships in pancreatic islets: support for intraislet modulation of insulin secretion. Endocrinology, 117, 2073-80.
Hoppener, J. W. & Lips, C. J. 2006. Role of islet amyloid in type 2 diabetes mellitus. International Journal of Biochemistry and Cell Biology, 38, 726-36.
Howell, S. L. 1984. The mechanism of insulin secretion. Diabetologia, 26, 319-27.

References
239
Howell, S. L., Jones, P. M. & Persaud, S. J. 1994. Regulation of insulin secretion: the role of second messengers. Diabetologia, 37, S30-S35.
Hu, F. B., Manson, J. E., Stampfer, M. J., Colditz, G., Liu, S., Solomon, C. G. & Willett, W. C. 2001. Diet, Lifestyle, and the Risk of Type 2 Diabetes Mellitus in Women. New England Journal of Medicine, 345, 790-797.
Huang, C. J., Lin, C. Y., Haataja, L., Gurlo, T., Butler, A. E., Rizza, R. A. & Butler, P. C. 2007. High expression rates of human islet amyloid polypeptide induce endoplasmic reticulum stress mediated beta-cell apoptosis, a characteristic of humans with type 2 but not type 1 diabetes. Diabetes, 56, 2016-27.
Huang, G. C., Zhao, M., Jones, P., Persaud, S., Ramracheya, R., Löbner, K., Christie, M. R., Banga, J. P., Peakman, M., Sirinivsan, P., Rela, M., Heaton, N. & Amiel, S. 2004. The development of new density gradient media for purifying human islets and islet-quality assessments. Transplantation, 77, 143-145.
Huang, X. F. & Arvan, P. 1994. Formation of the insulin-containing secretory granule core occurs within immature β-granules. Journal of Biological Chemistry, 269, 20838-20844.
Huber, J., Kiefer, F. W., Zeyda, M., Ludvik, B., Silberhumer, G. R., Prager, G., Zlabinger, G. J. & Stulnig, T. M. 2008. CC Chemokine and CC Chemokine Receptor Profiles in Visceral and Subcutaneous Adipose Tissue Are Altered in Human Obesity. Journal of Clinical Endocrinology and Metabolism, 93, 3215-3221.
Hughes, B. 2008. 2007 FDA drug approvals: a year of flux. Nat Rev Drug Discov, 7, 107-109. Hughes, S. J., Smith, H. & Ashcroft, S. J. 1993. Characterization of Ca2+/calmodulin-
dependent protein kinase in rat pancreatic islets. Biochem J, 289 ( Pt 3), 795-800. Hui, H., Nourparvar, A., Zhao, X. & Perfetti, R. 2003. Glucagon-like peptide-1 inhibits
apoptosis of insulin-secreting cells via a cyclic 5'-adenosine monophosphate-dependent protein kinase A- and a phosphatidylinositol 3-kinase-dependent pathway. Endocrinology, 144, 1444-55.
Hundal, H. S., Ahmed, A., Guma, A., Mitsumoto, Y., Marette, A., Rennie, M. J. & Klip, A. 1992. Biochemical and immunocytochemical localization of the 'GLUT5 glucose transporter' in human skeletal muscle. Biochem J, 286 ( Pt 2), 339-43.
Hussain, A. R., Ahmed, S. O., Ahmed, M., Khan, O. S., Al AbdulMohsen, S., Platanias, L. C., Al-Kuraya, K. S. & Uddin, S. 2012. Cross-Talk between NFkB and the PI3-Kinase/AKT Pathway Can Be Targeted in Primary Effusion Lymphoma (PEL) Cell Lines for Efficient Apoptosis. PLoS ONE, 7, e39945.
Hussain, M. A., Porras, D. L., Rowe, M. H., West, J. R., Song, W.-J., Schreiber, W. E. & Wondisford, F. E. 2006. Increased Pancreatic β-Cell Proliferation Mediated by CREB Binding Protein Gene Activation. Molecular and Cellular Biology, 26, 7747-7759.
Hussein, Z., Wentworth, J. M., Nankervis, A. J., Proietto, J. & Colman, P. G. 2004. Effectiveness and side effects of thiazolidinediones for type 2 diabetes: real-life experience from a tertiary hospital. Med J Aust, 181, 536-9.
Huypens, P., Ling, Z., Pipeleers, D. & Schuit, F. 2000. Glucagon receptors on human islet cells contribute to glucose competence of insulin release. Diabetologia, 43, 1012-9.
IDF 2011. Global burden of diabetes.) Diabetic atlas fifth edition ed. Brussels. , International Diabetes federation.
IDF 2013. IDF Diabetes Atlas Sixth Edition.) 6th ed., International Diabetes Federation. Ignatov, A., Robert, J., Gregory-Evans, C. & Schaller, H. C. 2006. RANTES stimulates Ca2+
mobilization and inositol trisphosphate (IP3) formation in cells transfected with G protein-coupled receptor 75.
Inagaki, N., Gonoi, T., Clement, J. P. t., Namba, N., Inazawa, J., Gonzalez, G., Aguilar-Bryan, L., Seino, S. & Bryan, J. 1995a. Reconstitution of IKATP: an inward rectifier subunit plus the sulfonylurea receptor. Science, 270, 1166-70.
Inagaki, N., Tsuura, Y., Namba, N., Masuda, K., Gonoi, T., Horie, M., Seino, Y., Mizuta, M. & Seino, S. 1995b. Cloning and Functional Characterization of a Novel ATP-sensitive Potassium Channel Ubiquitously Expressed in Rat Tissues, including Pancreatic Islets, Pituitary, Skeletal Muscle, and Heart. Journal of Biological Chemistry, 270, 5691-5694.
References
240
Ishihara, H., Maechler, P., Gjinovci, A., Herrera, P. L. & Wollheim, C. B. 2003. Islet beta-cell secretion determines glucagon release from neighbouring alpha-cells. Nat Cell Biol, 5, 330-5.
Ishikawa, T., Iwasaki, E., Kanatani, K., Sugino, F., Kaneko, Y., Obara, K. & Nakayama, K. 2005. Involvement of novel protein kinase C isoforms in carbachol-stimulated insulin secretion from rat pancreatic islets. Life Sciences, 77, 462-469.
Islam, M. S. 2002. The Ryanodine Receptor Calcium Channel of β-Cells: Molecular Regulation and Physiological Significance. Diabetes, 51, 1299-1309.
Itoh, Y. & Hinuma, S. 2005. GPR40, a free fatty acid receptor on pancreatic β cells, regulates insulin secretion. Hepatology Research, 33, 171-173.
Itoh, Y., Kawamata, Y., Harada, M., Kobayashi, M., Fujii, R., Fukusumi, S., Ogi, K., Hosoya, M., Tanaka, Y., Uejima, H., Tanaka, H., Maruyama, M., Satoh, R., Okubo, S., Kizawa, H., Komatsu, H., et al. 2003. Free fatty acids regulate insulin secretion from pancreatic beta cells through GPR40. Nature, 422, 173-6.
Jelinek, L. J., Lok, S., Rosenberg, G. B., Smith, R. A., Grant, F. J., Biggs, S., Bensch, P. A., Kuijper, J. L., Sheppard, P. O., Sprecher, C. A. & et al. 1993. Expression cloning and signaling properties of the rat glucagon receptor. Science, 259, 1614-6.
Jeong, K. H., Moon, J. Y., Chung, J. H., Kim, Y. H. & Lee, T. W. 2010. Significant Associations between <i>CCL5 </i>Gene Polymorphisms and Post-Transplantational Diabetes Mellitus in Korean Renal Allograft Recipients. American Journal of Nephrology, 32, 356-361.
Jiang, G. & Zhang, B. B. 2003. Glucagon and regulation of glucose metabolism. Am J Physiol Endocrinol Metab, 284, E671-8.
Jing, X., Li, D.-Q., Olofsson, C. S., Salehi, A., Surve, V. V., Caballero, J., xE, Ivarsson, R., Lundquist, I., Pereverzev, A., Schneider, T., Rorsman, P., Renstr, xF & m, E. 2005. CaV2.3 calcium channels control second-phase insulin release. The Journal of Clinical Investigation, 115, 146-154.
Johnstone, M., Gearing, A. J. H. & Miller, K. M. 1999. A central role for astrocytes in the inflammatory response to β-amyloid; chemokines, cytokines and reactive oxygen species are produced. Journal of Neuroimmunology, 93, 182-193.
Jones, P. M., Burns, C. J., Belin, V. D., Roderigo-Milne, H. M. & Persaud, S. J. 2004. The Role of Cytosolic Phospholipase A2 in Insulin Secretion. Diabetes, 53, S172-S178.
Jones, P. M. & Persaud, S. J. 1998a. Ca2+-induced loss of Ca2+/calmodulin-dependent protein kinase II activity in pancreatic β-cells.
Jones, P. M. & Persaud, S. J. 1998b. Protein kinases, protein phosphorylation, and the regulation of insulin secretion from pancreatic beta-cells. Endocr Rev, 19, 429-61.
Jones, P. M., Stutchfield, J. & Howell, S. L. 1985. Effects of Ca2+ and a phorbol ester on insulin secretion from islets of langerhans permeabilised by high-voltage discharge. FEBS Letters, 191, 102-106.
Jones, R. M., Leonard, J. N., Buzard, D. J. & Lehmann, J. 2009. GPR119 agonists for the treatment of type 2 diabetes. Expert Opin Ther Pat, 19, 1339-59.
Joshi, M. & Deshpande, J. D. 2011. POLYMERASE CHAIN REACTION: METHODS, PRINCIPLES AND APPLICATION. International Journal of Biomedical Research; Vol 2, No 1 (2011): Jan.
Kachapati, K., Adams, D., Bednar, K. & Ridgway, W. 2012. The Non-Obese Diabetic (NOD) Mouse as a Model of Human Type 1 Diabetes. In: JOOST, H.-G., AL-HASANI, H. & SCHÜRMANN, A. (Eds.) Animal Models in Diabetes Research. Humana Press.
Kahn, C. R. 1994. Banting Lecture. Insulin action, diabetogenes, and the cause of type II diabetes. Diabetes, 43, 1066-84.
Kane, L. P., Shapiro, V. S., Stokoe, D. & Weiss, A. 1999. Induction of NF-κB by the Akt/PKB kinase. Current Biology, 9, 601-S1.
Kaneko, K., Shirotani, T., Araki, E., Matsumoto, K., Taguchi, T., Motoshima, H., Yoshizato, K., Kishikawa, H. & Shichiri, M. 1999. Insulin inhibits glucagon secretion by the activation of PI3-kinase in In-R1-G9 cells. Diabetes Res Clin Pract, 44, 83-92.

References
241
Kaneto, H., Suzuma, K., Sharma, A., Bonner-Weir, S., King, G. L. & Weir, G. C. 2002. Involvement of Protein Kinase C β2 in c-mycInduction by High Glucose in Pancreatic β-Cells. Journal of Biological Chemistry, 277, 3680-3685.
Kang, G., Chepurny, O. G. & Holz, G. G. 2001. cAMP-regulated guanine nucleotide exchange factor II (Epac2) mediates Ca2+-induced Ca2+ release in INS-1 pancreatic β-cells. The Journal of Physiology, 536, 375-385.
Kanno, T., Suga, S., Wu, J., Kimura, M. & Wakui, M. 1998. Intracellular cAMP potentiates voltage-dependent activation of L-type Ca2+ channels in rat islet beta-cells. Pflugers Archiv-European Journal of Physiology, 435, 578-580.
Kashima, Y., Miki, T., Shibasaki, T., Ozaki, N., Miyazaki, M., Yano, H. & Seino, S. 2001. Critical role of cAMP-GEFII--Rim2 complex in incretin-potentiated insulin secretion. J Biol Chem, 276, 46046-53.
Kawai, K., Yokota, C., Ohashi, S., Watanabe, Y. & Yamashita, K. 1995. Evidence that glucagon stimulates insulin secretion through its own receptor in rats. Diabetologia, 38, 274-276.
Kawamori, D., Kurpad, A. J., Hu, J., Liew, C. W., Shih, J. L., Ford, E. L., Herrera, P. L., Polonsky, K. S., McGuinness, O. P. & Kulkarni, R. N. 2009. Insulin Signaling in α Cells Modulates Glucagon Secretion In Vivo. Cell Metabolism, 9, 350-361.
Kelly, E., Bailey, C. P. & Henderson, G. 2008. Agonist-selective mechanisms of GPCR desensitization. British Journal of Pharmacology, 153, S379-S388.
Kennedy, S. G., Kandel, E. S., Cross, T. K. & Hay, N. 1999. Akt/Protein kinase B inhibits cell death by preventing the release of cytochrome c from mitochondria. Mol Cell Biol, 19, 5800-10.
Kharbanda, S., Pandey, P., Schofield, L., Israels, S., Roncinske, R., Yoshida, K., Bharti, A., Yuan, Z. M., Saxena, S., Weichselbaum, R., Nalin, C. & Kufe, D. 1997. Role for Bcl-xL as an inhibitor of cytosolic cytochrome C accumulation in DNA damage-induced apoptosis. Proc Natl Acad Sci U S A, 94, 6939-42.
Khwaja, A. 1999. Akt is more than just a Bad kinase. Nature, 401, 33-4. Kieffer, T. J., Heller, R. S., Unson, C. G., Weir, G. C. & Habener, J. F. 1996. Distribution of
glucagon receptors on hormone-specific endocrine cells of rat pancreatic islets. Endocrinology, 137, 5119-25.
Kim, A., Miller, K., Jo, J., Kilimnik, G., Wojcik, P. & Hara, M. 2009. Islet architecture: A comparative study. Islets, 1, 129-36.
Kim, D. & Chung, J. 2002. Akt: versatile mediator of cell survival and beyond. J Biochem Mol Biol, 35, 106-15.
Kim, S., Jee, K., Kim, D., Koh, H. & Chung, J. 2001. Cyclic AMP inhibits Akt activity by blocking the membrane localization of PDK1. J Biol Chem, 276, 12864-70.
Kim, S., Jung, Y., Kim, D., Koh, H. & Chung, J. 2000. Extracellular zinc activates p70 S6 kinase through the phosphatidylinositol 3-kinase signaling pathway. J Biol Chem, 275, 25979-84.
Kim, W.-H., Lee, J. W., Suh, Y. H., Hong, S. H., Choi, J. S., Lim, J. H., Song, J. H., Gao, B. & Jung, M. H. 2005. Exposure to Chronic High Glucose Induces β-Cell Apoptosis Through Decreased Interaction of Glucokinase With Mitochondria: Downregulation of Glucokinase in Pancreatic β-Cells. Diabetes, 54, 2602-2611.
Kim, W. & Egan, J. M. 2008. The role of incretins in glucose homeostasis and diabetes treatment. Pharmacol Rev, 60, 470-512.
King, C. & Sarvetnick, N. 2011. The Incidence of Type-1 Diabetes in NOD Mice Is Modulated by Restricted Flora Not Germ-Free Conditions. PLoS ONE, 6, e17049.
Kitade, H., Sawamoto, K., Nagashimada, M., Inoue, H., Yamamoto, Y., Sai, Y., Takamura, T., Yamamoto, H., Miyamoto, K., Ginsberg, H. N., Mukaida, N., Kaneko, S. & Ota, T. 2012. CCR5 plays a critical role in obesity-induced adipose tissue inflammation and insulin resistance by regulating both macrophage recruitment and M1/M2 status. Diabetes, 61, 1680-90.
Klinteberg, K. A., Karlsson, S. & Ahren, B. 1996. Signaling mechanisms underlying the insulinotropic effect of pituitary adenylate cyclase-activating polypeptide in HIT-T15 cells. Endocrinology, 137, 2791-8.

References
242
Klip, A. & Paquet, M. R. 1990. Glucose transport and glucose transporters in muscle and their metabolic regulation. Diabetes Care, 13, 228-43.
Kloppel, G., Lohr, M., Habich, K., Oberholzer, M. & Heitz, P. U. 1985. Islet pathology and the pathogenesis of type 1 and type 2 diabetes mellitus revisited. Surv Synth Pathol Res, 4, 110-25.
Knip, M. & Akerblom, H. K. 1999. Environmental factors in the pathogenesis of type 1 diabetes mellitus. Exp Clin Endocrinol Diabetes, 107 Suppl 3, S93-100.
Knutson, K. L. & Hoenig, M. 1994. Identification and subcellular characterization of protein kinase-C isoforms in insulinoma beta-cells and whole islets. Endocrinology, 135, 881-6.
Konrad, R. J., Jolly, Y. C., Major, C. & Wolf, B. A. 1992. Carbachol stimulation of phospholipase A2 and insulin secretion in pancreatic islets. Biochem J, 287 ( Pt 1), 283-90.
Konrad, R. J., Jolly, Y. C., Major, C. & Wolf, B. A. 1993. Fuel secretagogue stimulation of arachidonic acid accumulation in fresh and cultured pancreatic islets. Molecular and Cellular Endocrinology, 92, 135-140.
Koressaar, T. & Remm, M. 2007. Enhancements and modifications of primer design program Primer3. Bioinformatics, 23, 1289-91.
Kowluru, A., Li, G. & Metz, S. A. 1997a. Glucose activates the carboxyl methylation of gamma subunits of trimeric GTP-binding proteins in pancreatic beta cells. Modulation in vivo by calcium, GTP, and pertussis toxin. The Journal of Clinical Investigation, 100, 1596-1610.
Kowluru, A., Li, G., Rabaglia, M. E., Segu, V. B., Hofmann, F., Aktories, K. & Metz, S. A. 1997b. Evidence for differential roles of the Rho subfamily of GTP-binding proteins in glucose- and calcium-induced insulin secretion from pancreatic beta cells. Biochem Pharmacol, 54, 1097-108.
Krupnick, J. G. & Benovic, J. L. 1998. The role of receptor kinases and arrestins in G protein-coupled receptor regulation. Annu Rev Pharmacol Toxicol, 38, 289-319.
Kuo, W.-N., Hodgins, D. S. & Kuo, J. F. 1973. Adenylate Cyclase in Islets of Langerhans: ISOLATION OF ISLETS AND REGULATION OF ADENYLATE CYCLASE ACTIVITY BY VARIOUS HORMONES AND AGENTS. Journal of Biological Chemistry, 248, 2705-2711.
Kushner, J. A., Ciemerych, M. A., Sicinska, E., Wartschow, L. M., Teta, M., Long, S. Y., Sicinski, P. & White, M. F. 2005. Cyclins D2 and D1 Are Essential for Postnatal Pancreatic β-Cell Growth. Molecular and Cellular Biology, 25, 3752-3762.
Lacey, R. J., Berrow, N. S., Scarpello, J. H. & Morgan, N. G. 1991. Selective stimulation of glucagon secretion by beta 2-adrenoceptors in isolated islets of Langerhans of the rat. Br J Pharmacol, 103, 1824-8.
Lammert, E., Cleaver, O. & Melton, D. 2003. Role of endothelial cells in early pancreas and liver development. Mech Dev, 120, 59-64.
Landt, M., Easom, R. A., Colca, J. R., Wolf, B. A., Turk, J., Mills, L. A. & McDaniel, M. L. 1992. Parallel effects of arachidonic acid on insulin secretion, calmodulin-dependent protein kinase activity and protein kinase C activity in pancreatic islets. Cell Calcium, 13, 163-172.
Lang, I. A., Galloway, T. S., Scarlett, A. & et al. 2008. ASsociation of urinary bisphenol a concentration with medical disorders and laboratory abnormalities in adults. JAMA, 300, 1303-1310.
LaPorte, R. E., Tajima, N., Akerblom, H. K., Berlin, N., Brosseau, J., Christy, M., Drash, A. L., Fishbein, H., Green, A., Hamman, R. & et al. 1985. Geographic differences in the risk of insulin-dependent diabetes mellitus: the importance of registries. Diabetes Care, 8 Suppl 1, 101-7.
Lappano, R. & Maggiolini, M. 2011. G protein-coupled receptors: novel targets for drug discovery in cancer. Nat Rev Drug Discov, 10, 47-60.
Lavan, B. E., Lane, W. S. & Lienhard, G. E. 1997. The 60-kDa Phosphotyrosine Protein in Insulin-treated Adipocytes Is a New Member of the Insulin Receptor Substrate Family. Journal of Biological Chemistry, 272, 11439-11443.

References
243
Lavoie, J. N., L'Allemain, G., Brunet, A., Muller, R. & Pouyssegur, J. 1996. Cyclin D1 expression is regulated positively by the p42/p44MAPK and negatively by the p38/HOGMAPK pathway. J Biol Chem, 271, 20608-16.
Lawen, A. 2003. Apoptosis-an introduction. Bioessays, 25, 888-96. Lawlor, M. A. & Alessi, D. R. 2001. PKB/Akt: a key mediator of cell proliferation, survival and
insulin responses? J Cell Sci, 114, 2903-10. Laybutt, D. R., Preston, A. M., Åkerfeldt, M. C., Kench, J. G., Busch, A. K., Biankin, A. V. &
Biden, T. J. 2007. Endoplasmic reticulum stress contributes to beta cell apoptosis in type 2 diabetes. Diabetologia, 50, 752-763.
Lee, C. H., Yun, H. J., Kang, H. S. & Kim, H. D. 1999. ERK/MAPK pathway is required for changes of cyclin D1 and B1 during phorbol 12-myristate 13-acetate-induced differentiation of K562 cells. IUBMB Life, 48, 585-91.
Leibiger, B., Moede, T., Muhandiramlage, T. P., Kaiser, D., Vaca Sanchez, P., Leibiger, I. B. & Berggren, P. O. 2012. Glucagon regulates its own synthesis by autocrine signaling. Proc Natl Acad Sci U S A, 109, 20925-30.
Leiser, M. & Fleischer, N. 1996. cAMP-dependent phosphorylation of the cardiac-type alpha 1 subunit of the voltage-dependent Ca2+ channel in a murine pancreatic beta-cell line. Diabetes, 45, 1412-8.
Leite, A. R., Carvalho, C. P., Furtado, A. G., Barbosa, H. C., Boschero, A. C. & Collares-Buzato, C. B. 2005. Co-expression and regulation of connexins 36 and 43 in cultured neonatal rat pancreatic islets. Can J Physiol Pharmacol, 83, 142-51.
Lemmens, R., Larsson, O., Berggren, P. O. & Islam, M. S. 2001. Ca2+-induced Ca2+ release from the endoplasmic reticulum amplifies the Ca2+ signal mediated by activation of voltage-gated L-type Ca2+ channels in pancreatic beta-cells. J Biol Chem, 276, 9971-7.
Lenormand, P., Sardet, C., Pagès, G., L'Allemain, G., Brunet, A. & Pouysségur, J. 1993. Growth factors induce nuclear translocation of MAP kinases (p42mapk and p44mapk) but not of their activator MAP kinase kinase (p45mapkk) in fibroblasts. The Journal of Cell Biology, 122, 1079-1088.
Leonardi, O., Mints, G. & Hussain, M. A. 2003. Beta-cell apoptosis in the pathogenesis of human type 2 diabetes mellitus. Eur J Endocrinol, 149, 99-102.
Lernmark, Å. 1974. The preparation of, and studies on, free cell suspensions from mouse pancreatic islets. Diabetologia, 10, 431-438.
Levy, J. A. 2009. The Unexpected Pleiotropic Activities of RANTES. The Journal of Immunology, 182, 3945-3946.
Li, C., Bowe, J. E., Huang, G. C., Amiel, S. A., Jones, P. M. & Persaud, S. J. 2011. Cannabinoid receptor agonists and antagonists stimulate insulin secretion from isolated human islets of Langerhans. Diabetes Obes Metab, 13, 903-10.
Li, C., Jones, P. M. & Persaud, S. J. 2010. Cannabinoid receptors are coupled to stimulation of insulin secretion from mouse MIN6 beta-cells. Cellular Physiology and Biochemistry, 26, 187-96.
Li, G., Hidaka, H. & Wollheim, C. B. 1992. Inhibition of voltage-gated Ca2+ channels and insulin secretion in HIT cells by the Ca2+/calmodulin-dependent protein kinase II inhibitor KN-62: comparison with antagonists of calmodulin and L-type Ca2+ channels. Mol Pharmacol, 42, 489-8.
Li, J., Luo, R., Kowluru, A. & Li, G. 2004. Novel regulation by Rac1 of glucose- and forskolin-induced insulin secretion in INS-1 beta-cells. Am J Physiol Endocrinol Metab, 286, E818-27.
Li, Z., Shangguan, Z., Liu, Y., Wang, J., Li, X., Yang, S. & Liu, S. 2014. Puerarin protects pancreatic beta-cell survival via PI3K/Akt signaling pathway. J Mol Endocrinol, 53, 71-9.
Liadis, N., Murakami, K., Eweida, M., Elford, A. R., Sheu, L., Gaisano, H. Y., Hakem, R., Ohashi, P. S. & Woo, M. 2005. Caspase-3-dependent beta-cell apoptosis in the initiation of autoimmune diabetes mellitus. Mol Cell Biol, 25, 3620-9.
Limke, T. L. & Atchison, W. D. 2001. Application of Single-Cell Microfluorimetry to Neurotoxicology Assays.) Current Protocols in Toxicology. John Wiley & Sons, Inc.
Lingohr, M. K., Buettner, R. & Rhodes, C. J. 2002. Pancreatic beta-cell growth and survival--a role in obesity-linked type 2 diabetes? Trends Mol Med, 8, 375-84.
References
244
Liu, Y. M., Guth, P. H., Kaneko, K., Livingston, E. H. & Brunicardi, F. C. 1993. Dynamic in vivo observation of rat islet microcirculation. Pancreas, 8, 15-21.
Livak, K. J. & Schmittgen, T. D. 2001. Analysis of Relative Gene Expression Data Using Real-Time Quantitative PCR and the 2−ΔΔCT Method. Methods, 25, 402-408.
Lord, J. M. & Ashcroft, S. J. 1984. Identification and characterization of Ca2+-phospholipid-dependent protein kinase in rat islets and hamster beta-cells. Biochem J, 219, 547-51.
Lorenzo, A., Razzaboni, B., Weir, G. C. & Yankner, B. A. 1994. Pancreatic islet cell toxicity of amylin associated with type-2 diabetes mellitus. Nature, 368, 756-760.
Ludvigsen, E., Olsson, R., Stridsberg, M., Janson, E. T. & Sandler, S. 2004. Expression and Distribution of Somatostatin Receptor Subtypes in the Pancreatic Islets of Mice and Rats. Journal of Histochemistry & Cytochemistry, 52, 391-400.
Lupi, R. & Del Prato, S. 2008. β-cell apoptosis in type 2 diabetes: quantitative and functional consequences. Diabetes & Metabolism, 34, Supplement 2, S56-S64.
Luther, M. J., Hauge-Evans, A., Souza, K. L., Jorns, A., Lenzen, S., Persaud, S. J. & Jones, P. M. 2006. MIN6 beta-cell-beta-cell interactions influence insulin secretory responses to nutrients and non-nutrients. Biochem Biophys Res Commun, 343, 99-104.
Ma, X., Zhang, Y., Gromada, J., Sewing, S., Berggren, P. O., Buschard, K., Salehi, A., Vikman, J., Rorsman, P. & Eliasson, L. 2005. Glucagon stimulates exocytosis in mouse and rat pancreatic alpha-cells by binding to glucagon receptors. Mol Endocrinol, 19, 198-212.
MacDonald, M. J. & Kowluru, A. 1982. Calcium-calmodulin-dependent myosin phosphorylation by pancreatic islets. Diabetes, 31, 566-70.
MacDonald, P. E., Marinis, Y. Z. D., Ramracheya, R., Salehi, A., Ma, X., Johnson, P. R. V., Cox, R., Eliasson, L. & Rorsman, P. 2007. A K<sub>ATP</sub> Channel-Dependent Pathway within α Cells Regulates Glucagon Release from Both Rodent and Human Islets of Langerhans. PLoS Biol, 5, e143.
MacGregor, G. G., Dong, K., Vanoye, C. G., Tang, L., Giebisch, G. & Hebert, S. C. 2002. Nucleotides and phospholipids compete for binding to the C terminus of KATP channels. Proc Natl Acad Sci U S A, 99, 2726-31.
Maclean, N. & Ogilvie, R. F. 1955. Quantitative Estimation of the Pancreatic Islet Tissue in Diabetic Subjects. Diabetes, 4, 367-376.
Maedler, K., Carr, R. D., Bosco, D., Zuellig, R. A., Berney, T. & Donath, M. Y. 2005. Sulfonylurea induced beta-cell apoptosis in cultured human islets. J Clin Endocrinol Metab, 90, 501-6.
Marchetti, P., Del Guerra, S., Marselli, L., Lupi, R., Masini, M., Pollera, M., Bugliani, M., Boggi, U., Vistoli, F., Mosca, F. & Del Prato, S. 2004. Pancreatic islets from type 2 diabetic patients have functional defects and increased apoptosis that are ameliorated by metformin. J Clin Endocrinol Metab, 89, 5535-41.
Marsenic, O. 2009. Glucose control by the kidney: an emerging target in diabetes. Am J Kidney Dis, 53, 875-83.
Mathers, C. D. & Loncar, D. 2006. Projections of Global Mortality and Burden of Disease from 2002 to 2030. PLoS Med, 3, e442.
Matter, C. M. & Handschin, C. 2007. RANTES (Regulated on Activation, Normal T Cell Expressed and Secreted), Inflammation, Obesity, and the Metabolic Syndrome. Circulation, 115, 946-948.
Matveyenko, A. V. & Butler, P. C. 2006. Beta-cell deficit due to increased apoptosis in the human islet amyloid polypeptide transgenic (HIP) rat recapitulates the metabolic defects present in type 2 diabetes. Diabetes, 55, 2106-14.
Mayo, K. E., Miller, L. J., Bataille, D., Dalle, S., Göke, B., Thorens, B. & Drucker, D. J. 2003. International Union of Pharmacology. XXXV. The Glucagon Receptor Family. Pharmacological Reviews, 55, 167-194.
McCarthy, M. I. 2010. Genomics, type 2 diabetes, and obesity. N Engl J Med, 363, 2339-50. McTigue, D. M. & Rogers, R. C. 1995. Pancreatic polypeptide stimulates gastric motility
through a vagal-dependent mechanism in rats. Neuroscience Letters, 188, 93-96. Meda, P. 2003. Cx36 involvement in insulin secretion: characteristics and mechanism. Cell
Commun Adhes, 10, 431-5.

References
245
Medema, R. H., Kops, G. J. P. L., Bos, J. L. & Burgering, B. M. T. 2000. AFX-like Forkhead transcription factors mediate cell-cycle regulation by Ras and PKB through p27kip1. Nature, 404, 782-787.
Mellado, M., Rodríguez-Frade, J. M., Mañes, S. & Martínez-A, C. 2001. CHEMOKINE SIGNALING AND FUNCTIONAL RESPONSES: The Role of Receptor Dimerization and TK Pathway Activation. Annual Review of Immunology, 19, 397-421.
Mendez, C. F., Leibiger, I. B., Leibiger, B., Hoy, M., Gromada, J., Berggren, P. O. & Bertorello, A. M. 2003. Rapid association of protein kinase C-epsilon with insulin granules is essential for insulin exocytosis. J Biol Chem, 278, 44753-7.
Mine, T., Kojima, I. & Ogata, E. 1988. Evidence of cyclic AMP-independent action of glucagon on calcium mobilization in rat hepatocytes. Biochim Biophys Acta, 970, 166-71.
Mirzabekov, T. A., Lin, M.-c. & Kagan, B. L. 1996. Pore Formation by the Cytotoxic Islet Amyloid Peptide Amylin. Journal of Biological Chemistry, 271, 1988-1992.
Miura, Y. & Matsui, H. 2003. Glucagon-like peptide-1 induces a cAMP-dependent increase of [Na+]i associated with insulin secretion in pancreatic beta-cells. Am J Physiol Endocrinol Metab, 285, E1001-9.
Miyazaki, J., Araki, K., Yamato, E., Ikegami, H., Asano, T., Shibasaki, Y., Oka, Y. & Yamamura, K. 1990. Establishment of a pancreatic beta cell line that retains glucose-inducible insulin secretion: special reference to expression of glucose transporter isoforms. Endocrinology, 127, 126-32.
Modan, M., Halkin, H., Almog, S., Lusky, A., Eshkol, A., Shefi, M., Shitrit, A. & Fuchs, Z. 1985. Hyperinsulinemia. A link between hypertension obesity and glucose intolerance. Journal of Clinical Investigation, 75, 809-817.
Moens, K., Flamez, D., Schravendijk, C. V., Ling, Z., Pipeleers, D. & Schuit, F. 1998. Dual Glucagon Recognition by Pancreatic β-Cells via Glucagon and Glucagon-Like Peptide 1 Receptors. Diabetes, 47, 66-72.
Mogami, H., Zhang, H., Suzuki, Y., Urano, T., Saito, N., Kojima, I. & Petersen, O. H. 2003. Decoding of short-lived Ca2+ influx signals into long term substrate phosphorylation through activation of two distinct classes of protein kinase C. J Biol Chem, 278, 9896-904.
Mojsov, S., Heinrich, G., Wilson, I. B., Ravazzola, M., Orci, L. & Habener, J. F. 1986. Preproglucagon gene expression in pancreas and intestine diversifies at the level of post-translational processing. Journal of Biological Chemistry, 261, 11880-11889.
Moore, C. X. & Cooper, G. J. 1991. Co-secretion of amylin and insulin from cultured islet beta-cells: modulation by nutrient secretagogues, islet hormones and hypoglycemic agents. Biochem Biophys Res Commun, 179, 1-9.
Moran, B. M., Abdel-Wahab, Y. H., Flatt, P. R. & McKillop, A. M. 2014. Activation of GPR119 by fatty acid agonists augments insulin release from clonal beta-cells and isolated pancreatic islets and improves glucose tolerance in mice. Biol Chem, 395, 453-64.
Morgan, D. G., Kulkarni, R. N., Hurley, J. D., Wang, Z. L., Wang, R. M., Ghatei, M. A., Karlsen, A. E., Bloom, S. R. & Smith, D. M. 1998. Inhibition of glucose stimulated insulin secretion by neuropeptide Y is mediated via the Y1 receptor and inhibition of adenylyl cyclase in RIN 5AH rat insulinoma cells. Diabetologia, 41, 1482-91.
Mortensen, K., Christensen, L. L., Holst, J. J. & Orskov, C. 2003. GLP-1 and GIP are colocalized in a subset of endocrine cells in the small intestine. Regulatory Peptides, 114, 189-196.
Murga, C., Laguinge, L., Wetzker, R., Cuadrado, A. & Gutkind, J. S. 1998. Activation of Akt/Protein Kinase B by G Protein-coupled Receptors: A ROLE FOR α AND βγ SUBUNITS OF HETEROTRIMERIC G PROTEINS ACTING THROUGH PHOSPHATIDYLINOSITOL-3-OH KINASEγ. Journal of Biological Chemistry, 273, 19080-19085.
Myers, S. J., Wong, L. M. & Charo, I. F. 1995. Signal transduction and ligand specificity of the human monocyte chemoattractant protein-1 receptor in transfected embryonic kidney cells. J Biol Chem, 270, 5786-92.

References
246
Nadal, A., Quesada, I. & Soria, B. 1999. Homologous and heterologous asynchronicity between identified alpha-, beta- and delta-cells within intact islets of Langerhans in the mouse. J Physiol, 517 ( Pt 1), 85-93.
Nakaki, T., Nakadate, T., Ishii, K. & Kato, R. 1981. Postsynaptic alpha-2 adrenergic receptors in isolated rat islets of Langerhans: inhibition of insulin release and cyclic 3':5'-adenosine monophosphate accumulation. J Pharmacol Exp Ther, 216, 607-12.
Nakamura, N., Ramaswamy, S., Vazquez, F., Signoretti, S., Loda, M. & Sellers, W. R. 2000. Forkhead transcription factors are critical effectors of cell death and cell cycle arrest downstream of PTEN. Mol Cell Biol, 20, 8969-82.
NCBI BLAST: Basic Local Alignment Search Tool.), National Library of Medicine: National Center for Biotechnology Information
Nevins, A. K. & Thurmond, D. C. 2005. A Direct Interaction between Cdc42 and Vesicle-associated Membrane Protein 2 Regulates SNARE-dependent Insulin Exocytosis. Journal of Biological Chemistry, 280, 1944-1952.
Niki, I., Okazaki, K., Saitoh, M., Niki, A., Niki, H., Tamagawa, T., Iguchi, A. & Hidaka, H. 1993. Presence and possible involvement of Ca/calmodulin-dependent protein kinases in insulin release from the rat pancreatic beta cell. Biochem Biophys Res Commun, 191, 255-61.
Nilsson, T., Arkhammar, P., Rorsman, P. & Berggren, P. O. 1988. Inhibition of glucose-stimulated insulin release by alpha 2-adrenoceptor activation is parallelled by both a repolarization and a reduction in cytoplasmic free Ca2+ concentration. J Biol Chem, 263, 1855-60.
Nishi, M., Sanke, T., Nagamatsu, S., Bell, G. I. & Steiner, D. F. 1990. Islet amyloid polypeptide. A new beta cell secretory product related to islet amyloid deposits. J Biol Chem, 265, 4173-6.
Nissen, S. E. & Wolski, K. 2007. Effect of Rosiglitazone on the Risk of Myocardial Infarction and Death from Cardiovascular Causes. New England Journal of Medicine, 356, 2457-2471.
Nisticò, L., Buzzetti, R., Pritchard, L. E., Van der Auwera, B., Giovannini, C., Bosi, E., Martinez Larrad, M. T., Serrano Rios, M., Chow, C. C., Cockram, C. S., Jacobs, K., Mijovic, C., Bain, S. C., Barnett, A. H., Vandewalle, C. L., Schuit, F., et al. 1996. The CTLA-4 Gene Region of Chromosome 2q33 Is Linked to, and Associated with, Type 1 Diabetes. Human Molecular Genetics, 5, 1075-1080.
Noble, J. A., Valdes, A. M., Cook, M., Klitz, W., Thomson, G. & Erlich, H. A. 1996. The role of HLA class II genes in insulin-dependent diabetes mellitus: molecular analysis of 180 Caucasian, multiplex families. Am J Hum Genet, 59, 1134-48.
Nolan, A. & O’Dowd, J. F. 2009. The Measurement of Insulin Secretion from Isolated Rodent Islets of Langerhans. In: STOCKER, C. (Ed.) Type 2 Diabetes. Humana Press.
Nomura, S., Shouzu, A., Omoto, S., Nishikawa, M. & Fukuhara, S. 2000. Significance of chemokines and activated platelets in patients with diabetes. Clinical & Experimental Immunology, 121, 437-443.
Notkins, A. L., Lernmark, x212B & ke 2001. Autoimmune type 1 diabetes: resolved and unresolved issues. The Journal of Clinical Investigation, 108, 1247-1252.
Olokoba, A. B., Obateru, O. A. & Olokoba, L. B. 2012. Type 2 diabetes mellitus: a review of current trends. Oman Med J, 27, 269-73.
Ono, K. & Han, J. 2000. The p38 signal transduction pathway Activation and function. Cellular Signalling, 12, 1-13.
Ortmeyer, H. K., Bodkin, N. L. & Hansen, B. C. 1997. Insulin regulates liver glycogen synthase and glycogen phosphorylase activity reciprocally in rhesus monkeys.
Oshima, H., Yoshida, S., Ohishi, T., Matsui, T., Tanaka, H., Yonetoku, Y., Shibasaki, M. & Uchiyama, Y. 2013. Novel GPR119 agonist AS1669058 potentiates insulin secretion from rat islets and has potent anti-diabetic effects in ICR and diabetic db/db mice. Life Sciences, 92, 167-173.
Ovalle, F. & Bell, D. S. 2002. Clinical evidence of thiazolidinedione-induced improvement of pancreatic beta-cell function in patients with type 2 diabetes mellitus. Diabetes Obes Metab, 4, 56-9.

References
247
Overton, H. A., Babbs, A. J., Doel, S. M., Fyfe, M. C. T., Gardner, L. S., Griffin, G., Jackson, H. C., Procter, M. J., Rasamison, C. M., Tang-Christensen, M., Widdowson, P. S., Williams, G. M. & Reynet, C. 2006. Deorphanization of a G protein-coupled receptor for oleoylethanolamide and its use in the discovery of small-molecule hypophagic agents. Cell Metabolism, 3, 167-175.
Ozaki, N., Shibasaki, T., Kashima, Y., Miki, T., Takahashi, K., Ueno, H., Sunaga, Y., Yano, H., Matsuura, Y., Iwanaga, T., Takai, Y. & Seino, S. 2000. cAMP-GEFII is a direct target of cAMP in regulated exocytosis. Nat Cell Biol, 2, 805-811.
Ozawa, S., Katsuta, H., Suzuki, K., Takahashi, K., Tanaka, T., Sumitani, Y., Nishida, S., Yoshimoto, K. & Ishida, H. 2014. Estimated proinsulin processing activity of prohormone convertase (PC) 1/3 rather than PC2 is decreased in pancreatic beta-cells of type 2 diabetic patients. Endocr J, 61, 607-14.
Ozes, O. N., Mayo, L. D., Gustin, J. A., Pfeffer, S. R., Pfeffer, L. M. & Donner, D. B. 1999. NF-kappaB activation by tumour necrosis factor requires the Akt serine-threonine kinase. Nature, 401, 82-5.
Park, G. B., Choi, Y., Kim, Y. S., Lee, H. K., Kim, D. & Hur, D. Y. 2013. ROS and ERK1/2-mediated caspase-9 activation increases XAF1 expression in dexamethasone-induced apoptosis of EBV-transformed B cells. Int J Oncol, 43, 29-38.
Parker, E. M., Izzarelli, D. G., Nowak, H. P., Mahle, C. D., Iben, L. G., Wang, J. & Goldstein, M. E. 1995. Cloning and characterization of the rat GALR1 galanin receptor from Rin14B insulinoma cells. Brain Res Mol Brain Res, 34, 179-89.
Patel, Y. C. & Reichlin, S. 1978. Somatostatin in hypothalamus, extrahypothalamic brain, and peripheral tissues of the rat. Endocrinology, 102, 523-30.
Paul, A., Wilson, S., Belham, C. M., Robinson, C. J. M., Scott, P. H., Gould, G. W. & Plevin, R. 1997. Stress-activated Protein Kinases: Activation, Regulation and Function. Cellular Signalling, 9, 403-410.
Pease, J. E. 2006. Tails of the unexpected - an atypical receptor for the chemokine RANTES/CCL5 expressed in brain. Br J Pharmacol, 149, 460-2.
Pedersen, M. G. & Sherman, A. 2009. Newcomer insulin secretory granules as a highly calcium-sensitive pool. Proceedings of the National Academy of Sciences, 106, 7432-7436.
Penn, E. J., Brocklehurst, K. W., Sopwith, A. M., Hales, C. N. & Hutton, J. C. 1982. Ca2+--Calmodulin dependent myosin light-chain phosphorylating activity in insulin-secreting tissues. FEBS Lett, 139, 4-8.
Perfetti, R., Zhou, J., Doyle, M. E. & Egan, J. M. 2000. Glucagon-like peptide-1 induces cell proliferation and pancreatic-duodenum homeobox-1 expression and increases endocrine cell mass in the pancreas of old, glucose-intolerant rats. Endocrinology, 141, 4600-5.
Persaud, S. J., Jones, P. M. & Howell, S. L. 1993. Staurosporine inhibits protein kinases activated by Ca2+ and cyclic AMP in addition to inhibiting protein kinase C in rat islets of Langerhans. Mol Cell Endocrinol, 94, 55-60.
Persaud, S. J., Jones, P. M., Sugden, D. & Howell, S. L. 1989. The role of protein kinase C in cholinergic stimulation of insulin secretion from rat islets of Langerhans. Biochem J, 264, 753-8.
Persaud, S. J., Muller, D. & Jones, P. M. 2008. Insulin signalling in islets. Biochem Soc Trans, 36, 290-3.
Peter-Riesch, B., Fathi, M., Schlegel, W. & Wollheim, C. B. 1988. Glucose and carbachol generate 1,2-diacylglycerols by different mechanisms in pancreatic islets. The Journal of Clinical Investigation, 81, 1154-1161.
Peterhoff, M., Sieg, A., Brede, M., Chao, C., Hein, L. & Ullrich, S. 2003. Inhibition of insulin secretion via distinct signaling pathways in alpha2-adrenoceptor knockout mice. European Journal of Endocrinology, 149, 343-350.
Pick, A., Clark, J., Kubstrup, C., Levisetti, M., Pugh, W., Bonner-Weir, S. & Polonsky, K. S. 1998. Role of apoptosis in failure of beta-cell mass compensation for insulin resistance and beta-cell defects in the male Zucker diabetic fatty rat. Diabetes, 47, 358-64.
Pinkoski, M. J., Waterhouse, N. J., Heibein, J. A., Wolf, B. B., Kuwana, T., Goldstein, J. C., Newmeyer, D. D., Bleackley, R. C. & Green, D. R. 2001. Granzyme B-mediated

References
248
Apoptosis Proceeds Predominantly through a Bcl-2-inhibitable Mitochondrial Pathway. Journal of Biological Chemistry, 276, 12060-12067.
Pipeleers, D. G., in't Veld, P. A., Van de Winkel, M., Maes, E., Schuit, F. C. & Gepts, W. 1985. A new in vitro model for the study of pancreatic A and B cells. Endocrinology, 117, 806-16.
Plesner, A., Soukhatcheva, G., Korneluk, R. G. & Verchere, C. B. 2010. XIAP inhibition of beta-cell apoptosis reduces the number of islets required to restore euglycemia in a syngeneic islet transplantation model. Islets, 2, 18-23.
Poitout, V., Hagman, D., Stein, R., Artner, I., Robertson, R. P. & Harmon, J. S. 2006. Regulation of the insulin gene by glucose and fatty acids. J Nutr, 136, 873-6.
Porte, D., Jr. & Williams, R. H. 1966. Inhibition of insulin release by norepinephrine in man. Science, 152, 1248-50.
Prentki, M., Biden, T. J., Janjic, D., Irvine, R. F., Berridge, M. J. & Wollheim, C. B. 1984. Rapid mobilization of Ca2+ from rat insulinoma microsomes by inositol-1,4,5-trisphosphate. Nature, 309, 562-564.
Prentki, M. & Wollheim, C. B. 1984. Cytosolic free Ca2+ in insulin secreting cells and its regulation by isolated organelles. Experientia, 40, 1052-1060.
Pugazhenthi, S., Nesterova, A., Sable, C., Heidenreich, K. A., Boxer, L. M., Heasley, L. E. & Reusch, J. E.-B. 2000. Akt/Protein Kinase B Up-regulates Bcl-2 Expression through cAMP-response Element-binding Protein. Journal of Biological Chemistry, 275, 10761-10766.
Pyne, N. J. & Furman, B. L. 2003. Cyclic nucleotide phosphodiesterases in pancreatic islets. Diabetologia, 46, 1179-1189.
Quesada, I., Tudurí, E., Ripoll, C. & Nadal, Á. 2008. Physiology of the pancreatic α-cell and glucagon secretion: role in glucose homeostasis and diabetes. Journal of Endocrinology, 199, 5-19.
Rafacho, A., Giozzet, V. A., Boschero, A. C., Abrantes, J. L., Cestari, T. M., Carneiro, E. M. & Bosqueiro, J. R. 2009. Reduced pancreatic beta-cell mass is associated with decreased FoxO1 and Erk1/2 protein phosphorylation in low-protein malnourished rats. Braz J Med Biol Res, 42, 935-41.
Reaven, G. M., Lerner, R. L., Stern, M. P. & Farquhar, J. W. 1967. Role of insulin in endogenous hypertriglyceridemia. J Clin Invest, 46, 1756-67.
Reimer, M. K., Pacini, G. & Ahren, B. 2003. Dose-dependent inhibition by ghrelin of insulin secretion in the mouse. Endocrinology, 144, 916-21.
Rendell, M. 2004. The Role of Sulphonylureas in the Management of Type 2 Diabetes Mellitus. Drugs, 64, 1339-1358.
Resnitzky, D. & Reed, S. I. 1995. Different roles for cyclins D1 and E in regulation of the G1-to-S transition. Mol Cell Biol, 15, 3463-9.
Rhodes, C. J. 2005. Type 2 Diabetes-a Matter of ß-Cell Life and Death? Science, 307, 380-384. Ribalet, B., Ciani, S. & Eddlestone, G. T. 1989. ATP mediates both activation and inhibition of
K(ATP) channel activity via cAMP-dependent protein kinase in insulin-secreting cell lines. The Journal of General Physiology, 94, 693-717.
Ritzel, R. A., Meier, J. J., Lin, C. Y., Veldhuis, J. D. & Butler, P. C. 2007. Human islet amyloid polypeptide oligomers disrupt cell coupling, induce apoptosis, and impair insulin secretion in isolated human islets. Diabetes, 56, 65-71.
Robertson, R. P. 1995. Antagonist: diabetes and insulin resistance--philosophy, science, and the multiplier hypothesis. J Lab Clin Med, 125, 560-4; discussion 565.
Robinson, A. J. & Dickenson, J. M. 2001. Activation of the p38 and p42/p44 mitogen-activated protein kinase families by the histamine H(1) receptor in DDT(1)MF-2 cells. Br J Pharmacol, 133, 1378-86.
Rolin, B., Larsen, M. O., Gotfredsen, C. F., Deacon, C. F., Carr, R. D., Wilken, M. & Knudsen, L. B. 2002. The long-acting GLP-1 derivative NN2211 ameliorates glycemia and increases beta-cell mass in diabetic mice. Am J Physiol Endocrinol Metab, 283, E745-52.
Romero-Zerbo, S. Y., Rafacho, A., Díaz-Arteaga, A., Suárez, J., Quesada, I., Imbernon, M., Ross, R. A., Dieguez, C., Rodríguez de Fonseca, F., Nogueiras, R., Nadal, Á. &

References
249
Bermúdez-Silva, F. J. 2011. A role for the putative cannabinoid receptor GPR55 in the islets of Langerhans. Journal of Endocrinology, 211, 177-185.
Rorsman, P., Abrahamsson, H., Gylfe, E. & Hellman, B. 1984. Dual effects of glucose on the cytosolic Ca2+ activity of mouse pancreatic beta-cells. FEBS Lett, 170, 196-200.
Rorsman, P. & Renström, E. 2003. Insulin granule dynamics in pancreatic beta cells. Diabetologia, 46, 1029-1045.
Rosa, J., Rosa, J. & Fister, V. 1992. Effects of somatostatin on glucagon-stimulated glycogenolysis and gluconeogenesis in hepatocytes cultured in vitro. Acta Physiol Scand, 146, 205-11.
Rosenstock, J., Lorber, D. L., Gnudi, L., Howard, C. P., Bilheimer, D. W., Chang, P. C., Petrucci, R. E., Boss, A. H. & Richardson, P. C. 2010. Prandial inhaled insulin plus basal insulin glargine versus twice daily biaspart insulin for type 2 diabetes: a multicentre randomised trial. Lancet, 375, 2244-53.
Rossetti, L., DeFronzo, R. A., Gherzi, R., Stein, P., Andraghetti, G., Falzetti, G., Shulman, G. I., Klein-Robbenhaar, E. & Cordera, R. 1990. Effect of metformin treatment on insulin action in diabetic rats: in vivo and in vitro correlations. Metabolism, 39, 425-35.
Rouille, Y., Kantengwa, S., Irminger, J. C. & Halban, P. A. 1997. Role of the prohormone convertase PC3 in the processing of proglucagon to glucagon-like peptide 1. J Biol Chem, 272, 32810-6.
Rudich, A., Konrad, D., Torok, D., Ben-Romano, R., Huang, C., Niu, W., Garg, R. R., Wijesekara, N., Germinario, R. J., Bilan, P. J. & Klip, A. 2003. Indinavir uncovers different contributions of GLUT4 and GLUT1 towards glucose uptake in muscle and fat cells and tissues. Diabetologia, 46, 649-58.
Rumora, L., Hadzija, M., Barisic, K., Maysinger, D. & Grubiic, T. Z. 2002. Amylin-induced cytotoxicity is associated with activation of caspase-3 and MAP kinases. Biol Chem, 383, 1751-8.
Saito, K., Yaginuma, N. & Takahashi, T. 1979. Differential volumetry of A, B and D cells in the pancreatic islets of diabetic and nondiabetic subjects. Tohoku J Exp Med, 129, 273-83.
Sakurada, M., Kanatsuka, A., Saitoh, T., Makino, H., Yamamura, K., Miyazaki, J., Kikuchi, M. & Yoshida, S. 1993. Relation between glucose-stimulated insulin secretion and intracellular calcium accumulation studied with a superfusion system of a glucose-responsive pancreatic beta-cell line MIN6. Endocrinology, 132, 2659-65.
Saltiel, A. R. & Kahn, C. R. 2001. Insulin signalling and the regulation of glucose and lipid metabolism. Nature, 414, 799-806.
Saltiel, A. R. & Olefsky, J. M. 1996. Thiazolidinediones in the Treatment of Insulin Resistance and Type II Diabetes. Diabetes, 45, 1661-1669.
Saltiel, A. R. & Pessin, J. E. 2003. Insulin Signaling in Microdomains of the Plasma Membrane. Traffic, 4, 711-716.
Samols, E., Marri, G. & Marks, V. 1965. PROMOTION OF INSULIN SECRETION BY GLUCAGON. The Lancet, 286, 415-416.
Samols, E., Stagner, J. I., Ewart, R. B. & Marks, V. 1988. The order of islet microvascular cellular perfusion is B----A----D in the perfused rat pancreas. J Clin Invest, 82, 350-3.
Sano, H., Kane, S., Sano, E., Miinea, C. P., Asara, J. M., Lane, W. S., Garner, C. W. & Lienhard, G. E. 2003. Insulin-stimulated phosphorylation of a Rab GTPase-activating protein regulates GLUT4 translocation. J Biol Chem, 278, 14599-602.
Sassmann, A., Gier, B., Grone, H. J., Drews, G., Offermanns, S. & Wettschureck, N. 2010. The Gq/G11-mediated signaling pathway is critical for autocrine potentiation of insulin secretion in mice. Journal of Clinical Investigation, 120, 2184-93.
Sauer, C. G. 2001. Evaluation of the G protein coupled receptor-75 (GPR75) in age related macular degeneration. British Journal of Ophthalmology, 85, 969-975.
Sauer, C. G., White, K., Stohr, H., Grimm, T., Hutchinson, A., Bernstein, P. S., Lewis, R. A., Simonelli, F., Pauleikhoff, D., Allikmets, R. & Weber, B. H. 2001. Evaluation of the G protein coupled receptor-75 (GPR75) in age related macular degeneration. Br J Ophthalmol, 85, 969-75.
Scaffidi, C., Fulda, S., Srinivasan, A., Friesen, C., Li, F., Tomaselli, K. J., Debatin, K. M.,
Krammer, P. H. & Peter, M. E. 1998. Two CD95 (APO‐1/Fas) signaling pathways.

References
250
Schall, T. J., Bacon, K., Toy, K. J. & Goeddel, D. V. 1990. Selective attraction of monocytes and T lymphocytes of the memory phenotype by cytokine RANTES. Nature, 347, 669-71.
Schall, T. J., Jongstra, J., Dyer, B. J., Jorgensen, J., Clayberger, C., Davis, M. M. & Krensky, A. M. 1988. A human T cell-specific molecule is a member of a new gene family. J Immunol, 141, 1018-25.
Schebalin, M., Said, S. I. & Makhlouf, G. M. 1977. Stimulation of insulin and glucagon secretion by vasoactive intestinal peptide. Am J Physiol, 232, E197-200.
Schulla, V., Renström, E., Feil, R., Feil, S., Franklin, I., Gjinovci, A., Jing, X. J., Laux, D., Lundquist, I., Magnuson, M. A., Obermüller, S., Olofsson, C. S., Salehi, A., Wendt, A., Klugbauer, N., Wollheim, C. B., et al. 2003. Impaired insulin secretion and glucose tolerance in β
cell‐selective CaV1.2 Ca2+ channel null mice. Schwetz, T. A., Ustione, A. & Piston, D. W. 2013. Neuropeptide Y and somatostatin inhibit
insulin secretion through different mechanisms. Am J Physiol Endocrinol Metab, 304, E211-21.
Scrocchi, L. A., Brown, T. J., MaClusky, N., Brubaker, P. L., Auerbach, A. B., Joyner, A. L. & Drucker, D. J. 1996. Glucose intolerance but normal satiety in mice with a null mutation in the glucagon-like peptide 1 receptor gene. Nat Med, 2, 1254-8.
Seino, S. 1995. CACN4, the major alpha 1 subunit isoform of voltage-dependent calcium channels in pancreatic beta-cells: a minireview of current progress. Diabetes Res Clin Pract, 28 Suppl, S99-103.
Seino, S., Chen, L., Seino, M., Blondel, O., Takeda, J., Johnson, J. H. & Bell, G. I. 1992. Cloning of the alpha 1 subunit of a voltage-dependent calcium channel expressed in pancreatic beta cells. Proc Natl Acad Sci U S A, 89, 584-8.
Sethi, G., Ahn, K. S. & Aggarwal, B. B. 2008. Targeting nuclear factor-kappa B activation pathway by thymoquinone: role in suppression of antiapoptotic gene products and enhancement of apoptosis. Mol Cancer Res, 6, 1059-70.
Sherr, C. J. 2000. The Pezcoller Lecture: Cancer Cell Cycles Revisited. Cancer Research, 60, 3689-3695.
Shibasaki, T., Takahashi, H., Miki, T., Sunaga, Y., Matsumura, K., Yamanaka, M., Zhang, C., Tamamoto, A., Satoh, T., Miyazaki, J.-i. & Seino, S. 2007. Essential role of Epac2/Rap1 signaling in regulation of insulin granule dynamics by cAMP. Proceedings of the National Academy of Sciences, 104, 19333-19338.
Shyng, S.-L. & Nichols, C. G. 1998. Membrane Phospholipid Control of Nucleotide Sensitivity of KATP Channels. Science, 282, 1138-1141.
Siconolfi-Baez, L., Banerji, M. A. & Lebovitz, H. E. 1990. Characterization and significance of sulfonylurea receptors. Diabetes Care, 13 Suppl 3, 2-8.
Singh, S., Chang, H., Richards, T. M., Weiner, J. P., Clark, J. M. & Segal, J. B. 2013. Glucagonlike peptide 1–based therapies and risk of hospitalization for acute pancreatitis in type 2 diabetes mellitus: A population-based matched case-control study. JAMA Internal Medicine, 173, 534-539.
Skalhegg, B. S. & Tasken, K. 2000. Specificity in the cAMP/PKA signaling pathway. Differential expression,regulation, and subcellular localization of subunits of PKA. Front Biosci, 5, D678-93.
Skelin, M. & Rupnik, M. 2011. cAMP increases the sensitivity of exocytosis to Ca(2)+ primarily through protein kinase A in mouse pancreatic beta cells. Cell Calcium, 49, 89-99.
Skelin, M., Rupnik, M. & Cencic, A. 2010. Pancreatic beta cell lines and their applications in diabetes mellitus research. ALTEX, 27, 105-13.
Slee, E. A., Harte, M. T., Kluck, R. M., Wolf, B. B., Casiano, C. A., Newmeyer, D. D., Wang, H. G., Reed, J. C., Nicholson, D. W., Alnemri, E. S., Green, D. R. & Martin, S. J. 1999. Ordering the cytochrome c-initiated caspase cascade: hierarchical activation of caspases-2, -3, -6, -7, -8, and -10 in a caspase-9-dependent manner. J Cell Biol, 144, 281-92.
Soga, T., Ohishi, T., Matsui, T., Saito, T., Matsumoto, M., Takasaki, J., Matsumoto, S., Kamohara, M., Hiyama, H., Yoshida, S., Momose, K., Ueda, Y., Matsushime, H., Kobori, M. & Furuichi, K. 2005. Lysophosphatidylcholine enhances glucose-dependent

References
251
insulin secretion via an orphan G-protein-coupled receptor. Biochem Biophys Res Commun, 326, 744-51.
Solomon, M., Balasa, B. & Sarvetnick, N. 2010. CCR2 and CCR5 chemokine receptors differentially influence the development of autoimmune diabetes in the NOD mouse. Autoimmunity, 43, 156-63.
Sorensen, H., Winzell, M. S., Brand, C. L., Fosgerau, K., Gelling, R. W., Nishimura, E. & Ahren, B. 2006. Glucagon receptor knockout mice display increased insulin sensitivity and impaired beta-cell function. Diabetes, 55, 3463-9.
Spiegelman, B. M. 1998. PPAR-gamma: adipogenic regulator and thiazolidinedione receptor. Diabetes, 47, 507-14.
Staddon, J. M. & Hansford, R. G. 1989. Evidence indicating that the glucagon-induced increase in cytoplasmic free Ca2+ concentration in hepatocytes is mediated by an increase in cyclic AMP concentration. Eur J Biochem, 179, 47-52.
Stefan, Y., Orci, L., Malaisse-Lagae, F., Perrelet, A., Patel, Y. & Unger, R. H. 1982. Quantitation of Endocrine Cell Content in the Pancreas of Nondiabetic and Diabetic Humans. Diabetes, 31, 694-700.
Stoffers, D. A., Kieffer, T. J., Hussain, M. A., Drucker, D. J., Bonner-Weir, S., Habener, J. F. & Egan, J. M. 2000. Insulinotropic glucagon-like peptide 1 agonists stimulate expression of homeodomain protein IDX-1 and increase islet size in mouse pancreas. Diabetes, 49, 741-748.
Stokoe, D., Stephens, L. R., Copeland, T., Gaffney, P. R., Reese, C. B., Painter, G. F., Holmes, A. B., McCormick, F. & Hawkins, P. T. 1997. Dual role of phosphatidylinositol-3,4,5-trisphosphate in the activation of protein kinase B. Science, 277, 567-70.
Stumvoll, M., Nurjhan, N., Perriello, G., Dailey, G. & Gerich, J. E. 1995. Metabolic effects of metformin in non-insulin-dependent diabetes mellitus. N Engl J Med, 333, 550-4.
Suga, S., Kanno, T., Ogawa, Y., Takeo, T., Kamimura, N. & Wakui, M. 2000. cAMP-independent decrease of ATP-sensitive K+ channel activity by GLP-1 in rat pancreatic beta-cells. Pflugers Arch, 440, 566-72.
Sugden, M. C., Ashcroft, S. J. & Sugden, P. H. 1979. Protein kinase activities in rat pancreatic islets of Langerhans. Biochem J, 180, 219-29.
Sugden, P. H. & Clerk, A. 1997. Regulation of the ERK Subgroup of MAP Kinase Cascades Through G Protein-Coupled Receptors. Cellular Signalling, 9, 337-351.
Sugita, S., Baxter, D. A. & Byrne, J. H. 1997. Modulation of a cAMP/protein kinase A cascade by protein kinase C in sensory neurons of Aplysia. J Neurosci, 17, 7237-44.
Sun, H., Lesche, R., Li, D. M., Liliental, J., Zhang, H., Gao, J., Gavrilova, N., Mueller, B., Liu, X. & Wu, H. 1999. PTEN modulates cell cycle progression and cell survival by regulating phosphatidylinositol 3,4,5,-trisphosphate and Akt/protein kinase B signaling pathway. Proc Natl Acad Sci U S A, 96, 6199-204.
Sutton, V. R., Davis, J. E., Cancilla, M., Johnstone, R. W., Ruefli, A. A., Sedelies, K., Browne, K. A. & Trapani, J. A. 2000. Initiation of Apoptosis by Granzyme B Requires Direct Cleavage of Bid, but Not Direct Granzyme B–Mediated Caspase Activation. The Journal of Experimental Medicine, 192, 1403-1414.
Swislocki, A. L. M., Hoffman, B. B. & Reaven, G. M. 1989. Insulin resistance, glucose intolerance and hyperinsulinemia in patients with hypertension. American Journal of Hypertension, 2, 419-423.
Swope, S. L. & Schonbrunn, A. 1988. The biphasic stimulation of insulin secretion by bombesin involves both cytosolic free calcium and protein kinase C. Biochem J, 253, 193-202.
Szaszák, M., Christian, F., Rosenthal, W. & Klussmann, E. 2008. Compartmentalized cAMP signalling in regulated exocytic processes in non-neuronal cells. Cellular Signalling, 20, 590-601.
Szecówka, J., Grill, V., Sandberg, E. & Efendić, S. 1982. Effect of GIP on the secretion of insulin and somatostatin and the accumulation of cyclic AMP in vitro in the rat. Acta Endocrinologica, 99, 416-421.
Tamemoto, H., Kadowaki, T., Tobe, K., Yagi, T., Sakura, H., Hayakawa, T., Terauchi, Y., Ueki, K., Kaburagi, Y., Satoh, S. & et al. 1994. Insulin resistance and growth retardation in mice lacking insulin receptor substrate-1. Nature, 372, 182-6.
References
252
Tang, S. H. & Sharp, G. W. 1998. Atypical protein kinase C isozyme zeta mediates carbachol-stimulated insulin secretion in RINm5F cells. Diabetes, 47, 905-912.
Tanigawa, K., Kuzuya, H., Imura, H., Taniguchi, H., Baba, S., Takai, Y. & Nishizuka, Y. 1982. Calcium-activated, phospholipid-dependent protein kinase in rat pancreas islets of langerhans. Its possible role in glucose-induced insulin release. FEBS Lett, 138, 183-6.
Taniguchi, C. M., Ueki, K. & Kahn, C. R. 2005. Complementary roles of IRS-1 and IRS-2 in the hepatic regulation of metabolism. The Journal of Clinical Investigation, 115, 718-727.
Tarasov, A., Dusonchet, J. & Ashcroft, F. 2004. Metabolic regulation of the pancreatic beta-cell ATP-sensitive K+ channel: a pas de deux. Diabetes, 53 Suppl 3, S113-22.
Tarttelin, E. E., Kirschner, L. S., Bellingham, J., Baffi, J., Taymans, S. E., Gregory-Evans, K., Csaky, K., Stratakis, C. A. & Gregory-Evans, C. Y. 1999. Cloning and characterization of a novel orphan G-protein-coupled receptor localized to human chromosome 2p16. Biochem Biophys Res Commun, 260, 174-80.
Tian, Y. M., Urquidi, V. & Ashcroft, S. J. H. 1996. Protein kinase C in beta-cells: expression of multiple isoforms and involvement in cholinergic stimulation of insulin secretion. Molecular and Cellular Endocrinology, 119, 185-193.
Tong, J., Prigeon, R. L., Davis, H. W., Bidlingmaier, M., Kahn, S. E., Cummings, D. E., Tschop, M. H. & D'Alessio, D. 2010. Ghrelin suppresses glucose-stimulated insulin secretion and deteriorates glucose tolerance in healthy humans. Diabetes, 59, 2145-51.
Trumper, A., Trumper, K. & Horsch, D. 2002. Mechanisms of mitogenic and anti-apoptotic signaling by glucose-dependent insulinotropic polypeptide in beta(INS-1)-cells. Journal of Endocrinology, 174, 233-246.
Trumper, A., Trumper, K., Trusheim, H., Arnold, R., Goke, B. & Horsch, D. 2001. Glucose-dependent insulinotropic polypeptide is a growth factor for beta (INS-1) cells by pleiotropic signaling. Molecular Endocrinology, 15, 1559-1570.
Tuttle, R. L., Gill, N. S., Pugh, W., Lee, J. P., Koeberlein, B., Furth, E. E., Polonsky, K. S., Naji, A. & Birnbaum, M. J. 2001. Regulation of pancreatic beta-cell growth and survival by the serine/threonine protein kinase Akt1/PKBalpha. Nat Med, 7, 1133-7.
Uchida, T., Iwashita, N., Ohara-Imaizumi, M., Ogihara, T., Nagai, S., Choi, J. B., Tamura, Y., Tada, N., Kawamori, R., Nakayama, K. I., Nagamatsu, S. & Watada, H. 2007. Protein Kinase Cδ Plays a Non-redundant Role in Insulin Secretion in Pancreatic β Cells. Journal of Biological Chemistry, 282, 2707-2716.
Uchida, T., Nakamura, T., Hashimoto, N., Matsuda, T., Kotani, K., Sakaue, H., Kido, Y., Hayashi, Y., Nakayama, K. I., White, M. F. & Kasuga, M. 2005. Deletion of Cdkn1b ameliorates hyperglycemia by maintaining compensatory hyperinsulinemia in diabetic mice. Nat Med, 11, 175-82.
Ueda, H., Howson, J. M., Esposito, L., Heward, J., Snook, H., Chamberlain, G., Rainbow, D. B., Hunter, K. M., Smith, A. N., Di Genova, G., Herr, M. H., Dahlman, I., Payne, F., Smyth, D., Lowe, C., Twells, R. C., et al. 2003. Association of the T-cell regulatory gene CTLA4 with susceptibility to autoimmune disease. Nature, 423, 506-11.
Untergasser, A., Cutcutache, I., Koressaar, T., Ye, J., Faircloth, B. C., Remm, M. & Rozen, S. G. 2012. Primer3--new capabilities and interfaces. Nucleic Acids Res, 40, e115.
Van Belle, T. L., Coppieters, K. T. & Von Herrath, M. G. 2011. Type 1 Diabetes: Etiology, Immunology, and Therapeutic Strategies.
van Biesen, T., Luttrell, L. M., Hawes, B. E. & Lefkowitz, R. J. 1996. Mitogenic signaling via G protein-coupled receptors. Endocr Rev, 17, 698-714.
Van De Craen, M., Van Den Brande, I., Declercq, W., Irmler, M., Beyaert, R., Tschopp, J., Fiers, W. & Vandenabeele, P. 1997. Cleavage of caspase family members by granzyme B: a comparative study in vitro. European Journal of Immunology, 27, 1296-1299.
Vanhaesebroeck, B. & Alessi, D. R. 2000. The PI3K-PDK1 connection: more than just a road to PKB. Biochem J, 346 Pt 3, 561-76.
Verspohl, E. J. & Ammon, H. P. 1980. Evidence for presence of insulin receptors in rat islets of Langerhans. J Clin Invest, 65, 1230-7.
Viard, P., Macrez, N., Mironneau, C. & Mironneau, J. 2001. Involvement of both G protein alphas and beta gamma subunits in beta-adrenergic stimulation of vascular L-type Ca(2+) channels. Br J Pharmacol, 132, 669-76.

References
253
Viola, A. & Luster, A. D. 2008. Chemokines and Their Receptors: Drug Targets in Immunity and Inflammation. Annual Review of Pharmacology and Toxicology, 48, 171-197.
Viollet, B., Guigas, B., Sanz Garcia, N., Leclerc, J., Foretz, M. & Andreelli, F. 2012. Cellular and molecular mechanisms of metformin: an overview. Clin Sci (Lond), 122, 253-70.
Wajant, H. 2002. The Fas signaling pathway: more than a paradigm. Science, 296, 1635-6. Wakelam, M. J., Murphy, G. J., Hruby, V. J. & Houslay, M. D. 1986. Activation of two signal-
transduction systems in hepatocytes by glucagon. Nature, 323, 68-71. Walker, J. N., Ramracheya, R., Zhang, Q., Johnson, P. R., Braun, M. & Rorsman, P. 2011.
Regulation of glucagon secretion by glucose: paracrine, intrinsic or both? Diabetes Obes Metab, 13 Suppl 1, 95-105.
Wan, Q. F., Dong, Y., Yang, H., Lou, X., Ding, J. & Xu, T. 2004. Protein kinase activation increases insulin secretion by sensitizing the secretory machinery to Ca2+. J Gen Physiol, 124, 653-62.
Wang, C. Y., Mayo, M. W., Korneluk, R. G., Goeddel, D. V. & Baldwin, A. S., Jr. 1998. NF-kappaB antiapoptosis: induction of TRAF1 and TRAF2 and c-IAP1 and c-IAP2 to suppress caspase-8 activation. Science, 281, 1680-3.
Wang, J. L., Corbett, J. A., Marshall, C. A. & McDaniel, M. L. 1993. Glucose-induced insulin secretion from purified beta-cells. A role for modulation of Ca2+ influx by cAMP- and protein kinase C-dependent signal transduction pathways. Journal of Biological Chemistry, 268, 7785-7791.
Wang, L., Liu, F. & Adamo, M. L. 2001. Cyclic AMP inhibits extracellular signal-regulated kinase and phosphatidylinositol 3-kinase/Akt pathways by inhibiting Rap1. J Biol Chem, 276, 37242-9.
Wang, Y., Kole, H., Montrose-Rafizadeh, C., Perfetti, R., Bernier, M. & Egan, J. 1997. Regulation of glucose transporters and hexose uptake in 3T3-L1 adipocytes: glucagon-like peptide-1 and insulin interactions. Journal of Molecular Endocrinology, 19, 241-248.
Waterhouse, P., Penninger, J. M., Timms, E., Wakeham, A., Shahinian, A., Lee, K. P., Thompson, C. B., Griesser, H. & Mak, T. W. 1995. Lymphoproliferative Disorders with Early Lethality in Mice Deficient in Ctla-4. Science, 270, 985-988.
Watson, R. T., Kanzaki, M. & Pessin, J. E. 2004. Regulated membrane trafficking of the insulin-responsive glucose transporter 4 in adipocytes. Endocr Rev, 25, 177-204.
Watt, H. L., Kharmate, G. & Kumar, U. 2008. Biology of somatostatin in breast cancer. Molecular and Cellular Endocrinology, 286, 251-261.
Wei, Y., Fan, T. & Yu, M. 2008. Inhibitor of apoptosis proteins and apoptosis. Acta Biochim Biophys Sin (Shanghai), 40, 278-88.
Weiss, M. A. 2009. Proinsulin and the genetics of diabetes mellitus. Journal of Biological Chemistry, 284, 19159-19163.
Wenham, R. M., Landt, M. & Easom, R. A. 1994. Glucose activates the multifunctional Ca2+/calmodulin-dependent protein kinase II in isolated rat pancreatic islets. J Biol Chem, 269, 4947-52.
Wenham, R. M., Landt, M., Walters, S. M., Hidaka, H. & Easom, R. A. 1992. Inhibition of insulin secretion by KN-62, a specific inhibitor of the multifunctional Ca2+/calmodulin-dependent protein kinase II. Biochem Biophys Res Commun, 189, 128-33.
Wheeler, M. B., Gelling, R. W., McIntosh, C. H. S., Georgiou, J., Brown, J. C. & Pederson, R. A. 1995. FUNCTIONAL EXPRESSION OF THE RAT PANCREATIC-ISLET GLUCOSE-DEPENDENT INSULINOTROPIC POLYPEPTIDE RECEPTOR - LIGAND-BINDING AND INTRACELLULAR SIGNALING PROPERTIES. Endocrinology, 136, 4629-4639.
White, M. F. 2002. IRS proteins and the common path to diabetes. Am J Physiol Endocrinol Metab, 283, E413-22.
WHO/IDF 2006. Definition and diagnosis of diabetes mellitus and intermediate hyperglycaemia.) Switzerland, WHO document production services.
Willi, C., Bodenmann, P., Ghali, W. A., Faris, P. D. & Cornuz, J. 2007. Active smoking and the risk of type 2 diabetes: a systematic review and meta-analysis. Jama, 298, 2654-64.

References
254
Wiser, O., Bennett, M. K. & Atlas, D. 1996. Functional interaction of syntaxin and SNAP-25 with voltage-sensitive L- and N-type Ca2+ channels. Embo j, 15, 4100-10.
Wiser, O., Trus, M., Hernandez, A., Renstrom, E., Barg, S., Rorsman, P. & Atlas, D. 1999. The voltage sensitive Lc-type Ca2+ channel is functionally coupled to the exocytotic machinery. Proc Natl Acad Sci U S A, 96, 248-53.
Withers, D. J., Gutierrez, J. S., Towery, H., Burks, D. J., Ren, J. M., Previs, S., Zhang, Y., Bernal, D., Pons, S., Shulman, G. I., Bonner-Weir, S. & White, M. F. 1998. Disruption of IRS-2 causes type 2 diabetes in mice. Nature, 391, 900-4.
Wojtusciszyn, A., Armanet, M., Morel, P., Berney, T. & Bosco, D. 2008. Insulin secretion from human beta cells is heterogeneous and dependent on cell-to-cell contacts. Diabetologia, 51, 1843-52.
Wolf, B. A., Easom, R. A., McDaniel, M. L. & Turk, J. 1990. Diacylglycerol synthesis de novo from glucose by pancreatic islets isolated from rats and humans. The Journal of Clinical Investigation, 85, 482-490.
Wollen, N. & Bailey, C. J. 1988. Inhibition of hepatic gluconeogenesis by metformin. Synergism with insulin. Biochem Pharmacol, 37, 4353-8.
Wollheim, C. B., Dunne, M. J., Peter-Riesch, B., Bruzzone, R., Pozzan, T. & Petersen, O. H. 1988. Activators of protein kinase C depolarize insulin-secreting cells by closing K+ channels. EMBO Journal, 7, 2443-2449.
Wollheim, C. B. & Sharp, G. W. 1981. Regulation of insulin release by calcium. Physiol Rev, 61, 914-73.
Wren, A. M., Small, C. J., Ward, H. L., Murphy, K. G., Dakin, C. L., Taheri, S., Kennedy, A. R., Roberts, G. H., Morgan, D. G., Ghatei, M. A. & Bloom, S. R. 2000. The novel hypothalamic peptide ghrelin stimulates food intake and growth hormone secretion. Endocrinology, 141, 4325-8.
Wu, H., Ghosh, S., Perrard, X. D., Feng, L., Garcia, G. E., Perrard, J. L., Sweeney, J. F., Peterson, L. E., Chan, L., Smith, C. W. & Ballantyne, C. M. 2007. T-Cell Accumulation and Regulated on Activation, Normal T Cell Expressed and Secreted Upregulation in Adipose Tissue in Obesity. Circulation, 115, 1029-1038.
Xu, G. G. & Rothenberg, P. L. 1998. Insulin Receptor Signaling in the β-Cell Influences Insulin Gene Expression and Insulin Content: Evidence for Autocrine β-Cell Regulation. Diabetes, 47, 1243-1252.
Yamada, K., Ichikawa, F., Ishiyama-Shigemoto, S., Yuan, X. & Nonaka, K. 1999. Essential role of caspase-3 in apoptosis of mouse beta-cells transfected with human Fas. Diabetes, 48, 478-483.
Yamagata, K., Nammo, T., Moriwaki, M., Ihara, A., Iizuka, K., Yang, Q., Satoh, T., Li, M., Uenaka, R., Okita, K., Iwahashi, H., Zhu, Q., Cao, Y., Imagawa, A., Tochino, Y., Hanafusa, T., et al. 2002. Overexpression of dominant-negative mutant hepatocyte nuclear fctor-1 alpha in pancreatic beta-cells causes abnormal islet architecture with decreased expression of E-cadherin, reduced beta-cell proliferation, and diabetes. Diabetes, 51, 114-23.
Yano, S., Tokumitsu, H. & Soderling, T. R. 1998. Calcium promotes cell survival through CaM-K kinase activation of the protein-kinase-B pathway. Nature, 396, 584-587.
Yen, T. T., Gill, A. M., Frigeri, L. G., Barsh, G. S. & Wolff, G. L. 1994. Obesity, diabetes, and neoplasia in yellow A(vy)/- mice: ectopic expression of the agouti gene. Faseb j, 8, 479-88.
Yoon, K. H., Ko, S. H., Cho, J. H., Lee, J. M., Ahn, Y. B., Song, K. H., Yoo, S. J., Kang, M. I., Cha, B. Y., Lee, K. W., Son, H. Y., Kang, S. K., Kim, H. S., Lee, I. K. & Bonner-Weir, S. 2003. Selective beta-cell loss and alpha-cell expansion in patients with type 2 diabetes mellitus in Korea. J Clin Endocrinol Metab, 88, 2300-8.
Yoon, K. H., Lee, J. H., Kim, J. W., Cho, J. H., Choi, Y. H., Ko, S. H., Zimmet, P. & Son, H. Y. 2006. Epidemic obesity and type 2 diabetes in Asia. Lancet, 368, 1681-8.
Yu, W., Niwa, T., Fukasawa, T., Hidaka, H., Senda, T., Sasaki, Y. & Niki, I. 2000. Synergism of protein kinase A, protein kinase C, and myosin light-chain kinase in the secretory cascade of the pancreatic beta-cell. Diabetes, 49, 945-52.

References
255
Zavaroni, I. & Reaven, G. M. 1981. Inhibition of carbohydrate-induced hypertriglyceridemia by a disaccharidase inhibitor. Metabolism, 30, 417-20.
Zawalich, W., Takuwa, N., Takuwa, Y., Diaz, V. A. & Rasmussen, H. 1987. Interactions of cholecystokinin and glucose in rat pancreatic islets. Diabetes, 36, 426-33.
Zawalich, W. S. & Zawalich, K. C. 1996. Regulation of insulin secretion by phospholipase C. Am J Physiol, 271, E409-16.
Zhang, S., Liu, H., Yu, H. & Cooper, G. J. S. 2008. Fas-Associated Death Receptor Signaling Evoked by Human Amylin in Islet β-Cells. Diabetes, 57, 348-356.
Zhou, B. P., Liao, Y., Xia, W., Spohn, B., Lee, M. H. & Hung, M. C. 2001. Cytoplasmic localization of p21Cip1/WAF1 by Akt-induced phosphorylation in HER-2/neu-overexpressing cells. Nat Cell Biol, 3, 245-52.
Zhou, J. & Egan, J. M. 1997. SNAP-25 is phosphorylated by glucose and GLP-1 in RIN 1046-38 cells. Biochem Biophys Res Commun, 238, 297-300.
Zong, W. X., Edelstein, L. C., Chen, C., Bash, J. & Gelinas, C. 1999. The prosurvival Bcl-2 homolog Bfl-1/A1 is a direct transcriptional target of NF-kappaB that blocks TNFalpha-induced apoptosis. Genes Dev, 13, 382-7.
Zorzano, A., Munoz, P., Camps, M., Mora, C., Testar, X. & Palacin, M. 1996. Insulin-induced redistribution of GLUT4 glucose carriers in the muscle fiber. In search of GLUT4 trafficking pathways. Diabetes, 45 Suppl 1, S70-81.
Zucchi, R. & Ronca-Testoni, S. 1997. The sarcoplasmic reticulum Ca2+ channel/ryanodine receptor: modulation by endogenous effectors, drugs and disease states. Pharmacol Rev, 49, 1-51.