7121.0 agricultural commodities, australia (2003-04)file/71210_2003-04.pdf · ... select...
TRANSCRIPT

30Explanatory Notes . . . . . . . . . . . . . . . . . . . . . . . . . . . . . . . . . . . . . . . .A D D I T I O N A L I N F O R M A T I O N
29Land management . . . . . . . . . . . . . . . . . . . . . . . . . . . . . . . . . . . . . . .25Livestock and livestock products . . . . . . . . . . . . . . . . . . . . . . . . . . . . . .20Horticulture . . . . . . . . . . . . . . . . . . . . . . . . . . . . . . . . . . . . . . . . . . . .18Crops and pastures . . . . . . . . . . . . . . . . . . . . . . . . . . . . . . . . . . . . . . .13Structure of agricultural industry . . . . . . . . . . . . . . . . . . . . . . . . . . . . . . .11List of tables . . . . . . . . . . . . . . . . . . . . . . . . . . . . . . . . . . . . . . . . . . .
T A B L E S
9Livestock . . . . . . . . . . . . . . . . . . . . . . . . . . . . . . . . . . . . . . . . . . . . . .7Horticulture . . . . . . . . . . . . . . . . . . . . . . . . . . . . . . . . . . . . . . . . . . . . .5Crops . . . . . . . . . . . . . . . . . . . . . . . . . . . . . . . . . . . . . . . . . . . . . . . .4Industry structure . . . . . . . . . . . . . . . . . . . . . . . . . . . . . . . . . . . . . . . . .
S U M M A R Y O F F I N D I N G S
3Abbreviations . . . . . . . . . . . . . . . . . . . . . . . . . . . . . . . . . . . . . . . . . . .2Notes . . . . . . . . . . . . . . . . . . . . . . . . . . . . . . . . . . . . . . . . . . . . . . . .
page
C O N T E N T S
E M B A R G O : 1 1 . 3 0 A M ( C A N B E R R A T I M E ) T U E S 2 8 J U N 2 0 0 5
AGRICULTURAL COMMODITIES A U S T R A L I A
7121.02 0 0 3 – 0 4
For further informationabout these and relatedstatistics, contact theNational Information andReferral Service on1300 135 070 orGordon Cameron onHobart (03) 6222 5939.
I N Q U I R I E S
w w w . a b s . g o v . a u

Su s a n L i n a c r e
Ac t i n g Au s t r a l i a n S t a t i s t i c i a n
Information about ABS activities in the field of agriculture statistics is available from the
Agriculture Statistics theme page on the ABS web site <http://www.abs.gov.au>. To
access the theme page, select 'Themes' from the menu on the home page.
MO R E IN F O R M A T I O N ON
AB S AG R I C U L T U R E
ST A T I S T I C S
No changes in this issue.CH A N G E S IN TH I S I S S U E
This publication contains final estimates for the main commodities collected in the
2003–04 Agricultural Survey. It contains detailed statistics on crops, livestock and
livestock products, land use and industry and size characteristics of farms.
AB O U T TH I S PU B L I C A T I O N
2 A B S • A G R I C U L T U R A L CO M M O D I T I E S • 7 1 2 1 . 0 • 2 0 0 3 – 0 4
N O T E S

Western AustraliaWA
VictoriaVic.
TasmaniaTas.
tonnet
statistical local areaSLA
standard errorSE
South AustraliaSA
relative standard errorRSE
QueenslandQld
Northern TerritoryNT
New South WalesNSW
not elsewhere classifiedn.e.c.
megalitreML
kilogramkg
hectareha
Estimated Value of Agricultural OperationsEVAO
AustraliaAust.
Australian and New Zealand Standard Industrial ClassificationANZSIC
Australian Capital TerritoryACT
Australian Bureau of StatisticsABS
thousand'000
A B S • A G R I C U L T U R A L CO M M O D I T I E S • 7 1 2 1 . 0 • 2 0 0 3 – 0 4 3
A B B R E V I A T I O N S

Most farms in 2003–04 were between 100 and 499 hectares in size, and accounted for
42,400 farms (or 32%). These farms were mainly engaged in beef cattle grazing, dairying,
sheep grazing or mixed grain-sheep/beef cattle growing.
Small farms under 50 hectares were the second main size group and accounted for
25,100 farms (or 19%). These small farms were mainly engaged in grape growing, beef
cattle grazing, fruit growing, vegetable growing and plant nursery operations.
Large farms of over 2,500 hectares accounted for 11% (14,700) of all farms and were
mainly engaged in grazing or cropping operations.
Area of operat ions
The median estimated value of agricultural operations (EVAO) of all farms was
approximately $123,000 in 2003–04. Around 15% of all farms (20,200 farms) had an EVAO
below $22,500, while at the other end of the scale, 14% (18,000 farms) had an EVAO
above $500,000.
The majority of farms with EVAO below $22,500 were involved in beef cattle farming
(11,700 farms) and sheep farming (2,000 farms) while the majority of farms with EVAO
above $500,000 were involved in grain growing (5,500 farms), mixed grain-sheep/beef
cattle farming (2,800 farms), dairy cattle farming (1,700 farms) and beef cattle farming
(1,700 farms).
On an industry basis, the cotton, poultry for meat, grain, pig, and poultry for eggs
farming industries were dominated by farms with large EVAOs, with around 76%, 54%,
38%, 34% and 32% respectively, having an EVAO greater than $500,000.
S I Z E OF OP E R A T I O N S
EVAO of operat ions
The 2003–04 Agricultural Survey found that the number of farms in Australia fell by 2% in
the 12 months ending 30 June 2004, down from 133,000 to 131,000 farms, continuing the
decline in farm numbers seen in previous years.
The beef cattle farming industry remained the largest in terms of farm numbers, with
around 27% of all farms. The mixed farming sector (grain-sheep/beef cattle) was the next
largest with around 12% of all farms, followed by the grain sector with 11%.
NU M B E R OF FA R M S
4 A B S • A G R I C U L T U R A L CO M M O D I T I E S • 7 1 2 1 . 0 • 2 0 0 3 – 0 4
S U M M A R Y O F F I N D I N G S I N D U S T R Y S T R U C T U R E

The total area planted to lupins for grain fell by 17% to 851,000 hectares due mainly to a
16% fall in the main growing state of Western Australia. This was the sixth annual
decrease in lupins plantings and reflects a longer term trend towards oats and barley.
Increased yields after drought saw total production increase by 63%
to 1.2 million tonnes.
Lupins for grain
The total area of grain sorghum planted increased by 10% to 734,000 hectares.
Production increased by 37% to 2.0 million tonnes, with significant increases in
Queensland and New South Wales, the main growing states.
Grain sorghum
The total area of oats planted increased by 20% to 1.1 million hectares. This was the
fourth year of increased planting. Production increased by 111% to 2.0 million tonnes,
the highest level reported since 1984. The largest producers were Western Australia
(up 58% to 752,000 tonnes), New South Wales (up 309% to 610,000 tonnes) and Victoria
(up 103% to 507,000 tonnes).
Oats
The total area of barley planted increased by 16% to 4.5 million hectares. The largest
areas planted were in Western Australia (1.3 million hectares) and South Australia
(1.2 million hectares). Improved yields, combined with the increase in area planted, saw
total production reach a record level of 10.4 million tonnes. The largest producers were
Western Australia (up 135% to 3.2 million tonnes), South Australia (up 87%
to 2.7 million tonnes) and Victoria (up 375% to 2.3 million tonnes).
Barley
Improved conditions in 2003–04 saw records for both area planted to wheat and wheat
production. The total area planted increased by 17% to 13.1 million hectares. All states
reported increases, with the largest reported in New South Wales (up 33% to 4.0 million
hectares) and Western Australia (up 10% to 4.9 million hectares). Wheat production
increased by 158% to 26.1 million tonnes, with nearly all states reporting significant
increases. The largest were reported in Western Australia (up 174% to
11.1 million tonnes), and New South Wales (up 192% to 7.3 million tonnes).
CR O P S FO R GR A I N
Wheat
Wheat Barley Oats Grainsorghum
Canola Lupinsfor grain
million tonnes
0
10
20
30
2001–022002–032003–04
PRODUCTION OF MAJOR CROPS, Aust ra l ia —2001–02 to 2003–04
The easing of widespread drought saw significant increases in production, with record or
near record harvests reported for most of the major crops.
OV E R V I E W
A B S • A G R I C U L T U R A L CO M M O D I T I E S • 7 1 2 1 . 0 • 2 0 0 3 – 0 4 5
S U M M A R Y O F F I N D I N G S CR O P S

Some reductions in water restrictions in 2003–04 saw the area planted to rice increase by
45% to 66,400 hectares. Rice production increased by 26% to 553,000 tonnes, but this
was still less than half the harvest from 'normal' years. The production of rice is entirely
dependent on access to water, and the lingering effects of the drought continued to
affect the major growing regions of New South Wales.
Rice
Continuing lack of water for irrigation saw plantings of cotton fall by 7%
to 227,000 hectares. Total cotton lint production was down by 13% to 317,000 tonnes.
Increases in plantings and production in Queensland were more than offset by decreases
in New South Wales.
Cotton lint
Canola plantings fell by 7% to 1.2 million hectares, with falls in New South Wales and
Victoria partly offset by increases in South Australia and Western Australia. Improved
conditions in many areas saw production increase to pre-drought levels. Production rose
by 96% to 1.7 million tonnes, with increases reported in all the main growing states.
OT H E R CR O P S
Canola
6 A B S • A G R I C U L T U R A L CO M M O D I T I E S • 7 1 2 1 . 0 • 2 0 0 3 – 0 4
S U M M A R Y O F F I N D I N G S CR O P S continued

Grapes Oranges Bananas Apples Pears
'000 tonnes
0
300
600
900
1200
1500
1800
2100 2001–022002–032003–04
PRODUCT ION OF MAJOR FRUIT CROPS, Aust ra l ia —2001–02 to2003–04
Pear production rose by 2% to 139,000 tonnes. Victoria's production of 121,000 tonnes
accounted for 87% of total Australian production. The total number of bearing pear trees
rose by 6% to 1.4 million.
Pears
Apple production fell by 22% to 255,000 tonnes, with falls reported for every state except
Queensland. The largest decreases in production were reported for Victoria (down 29%
to 84,100 tonnes), New South Wales (down 23% to 47,700 tonnes) and Tasmania (down
29% to 37,300 tonnes. The total number of bearing apple trees rose by 6% to 8.9 million,
with increases reported in all states except Tasmania.
Apples
Banana production fell by 3% to 257,000 tonnes, with falls in production reported in
Queensland and New South Wales. The total bearing area of bananas rose by 2% to
10,900 hectares.
Bananas
Orange production decreased by 34% to 395,000 tonnes after near record production in
the previous year. Decreases were reported in the three main growing states of
New South Wales (down 35% to 181,000 tonnes), South Australia (down 36% to
122,000 tonnes) and Victoria (down 39% to 69,400 tonnes). The total number of bearing
orange trees fell by 4% to 6.8 million trees, due mainly to an 8% fall in tree numbers in
New South Wales.
Oranges
In 2003–04 grape production rose by 35% to a record harvest of 2.0 million tonnes. The
largest increases were reported in South Australia (up 44% to 886,000 tonnes), Victoria
(up 31% to 532,000 tonnes) and New South Wales (up 25% to 483,000 tonnes). The total
area of bearing vines increased by 5% to a record 151,000 hectares, with the main
growing state of South Australia reporting an increase of 8% to a record 65,000 hectares.
FR U I T
Grapes
A B S • A G R I C U L T U R A L CO M M O D I T I E S • 7 1 2 1 . 0 • 2 0 0 3 – 0 4 7
S U M M A R Y O F F I N D I N G S H O R T I C U L T U R E

Potatoes Tomatoes Carrots Onions Lettuces
'000 tonnes
0
300
600
900
1200
1500 2001–022002–032003–04
PRODUCT ION OF MAJOR VEGETABLE CROPS, Aust ra l ia —2001–02 to2003–04
Production of lettuces rose by 5% to 127,000 tonnes. Increases in Queensland, Western
Australia and South Australia were partly offset by falls in Victoria, New South Wales and
Tasmania. The area planted to lettuces remained steady at 6,100 hectares.
Lettuces
Production of onions rose slightly to 233,000 tonnes. Increases in production in
Tasmania, New South Wales, Victoria and Western Australia were partly offset by
decreases in South Australia, the main producing state, and Queensland. The area
planted to onions rose by 6% to 5,600 hectares, with increases reported in all states
except Queensland.
Onions
Production of carrots fell marginally to 303,000 tonnes, with falls in all states except
South Australia and Tasmania. The area planted to carrots fell by 2% to 7,200 hectares,
with falls in Victoria, Western Australia and Queensland partly offset by increases in
South Australia and Tasmania. New South Wales remained steady.
Carrots
Production of tomatoes rose by 30% to 474,000 tonnes, with significant increases
reported in the three main growing states of Victoria (up 28% to 270,000 tonnes),
Queensland (up 33% to 125,000 tonnes) and New South Wales (up 40% to
67,100 tonnes). The area planted to tomatoes rose by 16% to 8,500 hectares, with
increases reported in all states except Western Australia.
Tomatoes
Production of potatoes in 2003–04 rose by 5% to 1.3 million tonnes, due mainly to a 25%
increase in production in Victoria (up to 338,000 tonnes). The only state to report a fall
in production was New South Wales (down 11% to 119,000 tonnes). The total area
planted to potatoes remained steady at 36,100 hectares, with increases in plantings in
Victoria, Tasmania, Western Australia and Queensland, offset by decreases in South
Australia and New South Wales.
VE G E T A B L E S
Potatoes
8 A B S • A G R I C U L T U R A L CO M M O D I T I E S • 7 1 2 1 . 0 • 2 0 0 3 – 0 4
S U M M A R Y O F F I N D I N G S H O R T I C U L T U R E continued

Sheep and lamb numbers increased by 2% to 101 million, with lamb numbers up by 12%,
but sheep numbers down slightly. This was due mainly to increases in the largest
producing states of New South Wales (up 5% to 35.2 million) and Western Australia
(up 5% to 25.1 million). However these were partly offset by falls in Victoria (down 2% to
20.0 million), South Australia (down slightly to 12.9 million) and Tasmania (down 4% to
3.2 million).
Lamb markings rose by 7% to 36.3 million, with increases reported in New South Wales
(up 13% to 12.8 million), Western Australia (up 6% to 9.2 million) and Queensland
(up 61% to 1.2 million). The number of ewes mated to produce these lambs was little
changed from the previous year, with improved lambing percentages (up from 77.6% in
2002–03 to 83.0% in 2003–04) responsible for the increased numbers of lambs.
SH E E P AN D LA M B S
Meat cattle numbers increased by 3% to 24.4 million after the badly drought-affected
season in the previous year. Increases in meat cattle numbers were reported in
Queensland (up 7% to 11.2 million head), Western Australia (up 8% to 2.0 million),
Northern Territory (up 3% to 1.7 million) and Tasmania (up 3% to 496,000). These were
partly offset by falls in Victoria (down 4% to 2.4 million) and South Australia (down 4% to
1.2 million). New South Wales remained steady at 5.4 million.
ME A T CA T T L E
The number of milk cattle remained steady at 3.1 million head at 30 June 2004. A small
decrease in milking cow numbers was offset by an increase in other milk cattle. The most
significant movements were reported in Queensland (up 10% to 255,000), and Tasmania
(down 6% to 189,000). Victoria had the majority of milk cattle, with its herd steady at
1.9 million.
MI L K CA T T L E
Sheep Lambs Meat cattle Milk cattle Pigs
million
0
20
40
60
80 2001–022002–032003–04
NUMBERS OF LIVESTOCK, Aust ra l ia —2001–02 to 2003–04
Cattle numbers recovered slightly in 2003–04, but were limited in their recovery by
ongoing effects of drought in some areas and also by lower cow numbers available for
breeding from the previous year. Sheep and lamb numbers also showed signs of
recovery with better conditions contributing to improved lambing percentages. Pig
numbers fell and chicken numbers were steady.
OV E R V I E W
A B S • A G R I C U L T U R A L CO M M O D I T I E S • 7 1 2 1 . 0 • 2 0 0 3 – 0 4 9
S U M M A R Y O F F I N D I N G S L I V E S T O C K

The number of chickens for meat production remained steady at 70.7 million birds.
Decreases in New South Wales and Western Australia were offset by increases in Victoria
and Queensland. The number of chickens for egg production fell slightly to 12.7 million
birds. Egg production remained steady at 193 million dozen.
CH I C K E N S
Australian pig numbers fell by 4% to 2.5 million, with falls reported in all states except
Queensland, which rose by 4%. Trends of recent years have shown an industry move
away from New South Wales as the main pig-producing state, to Queensland, which has
for the first time reported a bigger herd than New South Wales.
P I G S
10 A B S • A G R I C U L T U R A L CO M M O D I T I E S • 7 1 2 1 . 0 • 2 0 0 3 – 0 4
S U M M A R Y O F F I N D I N G S L I V E S T O C K continued

29Land use, area13 . . . . . . . . . . . . . . . . . . . . . . . . . . . . . . . . . . . . . . .LA N D MA N A G E M E N T
28Chickens12 . . . . . . . . . . . . . . . . . . . . . . . . . . . . . . . . . . . . . . . . . .28Pigs11 . . . . . . . . . . . . . . . . . . . . . . . . . . . . . . . . . . . . . . . . . . . . . .27Sheep10 . . . . . . . . . . . . . . . . . . . . . . . . . . . . . . . . . . . . . . . . . . . .26Cattle9 . . . . . . . . . . . . . . . . . . . . . . . . . . . . . . . . . . . . . . . . . . . . .25Livestock slaughterings and products8 . . . . . . . . . . . . . . . . . . . . . . . . .
L I V E S T O C K AN D L I V E S T O C K PR O D U C T S
24Grapes, production7 . . . . . . . . . . . . . . . . . . . . . . . . . . . . . . . . . . . .22Vegetables, production6 . . . . . . . . . . . . . . . . . . . . . . . . . . . . . . . . . .20Fruit and nuts, production5 . . . . . . . . . . . . . . . . . . . . . . . . . . . . . . .
HO R T I C U L T U R E
18Principal crops, production4 . . . . . . . . . . . . . . . . . . . . . . . . . . . . . . .CR O P S AN D PA S T U R E S
16Establishments with agricultural activity, by area3 . . . . . . . . . . . . . . . . . .14Establishments with agricultural activity, by EVAO2 . . . . . . . . . . . . . . . . .13Establishments with agricultural activity, by state1 . . . . . . . . . . . . . . . . . .
ST R U C T U R E OF AG R I C U L T U R A L IN D U S T R Y
page
A B S • A G R I C U L T U R A L CO M M O D I T I E S • 7 1 2 1 . 0 • 2 0 0 3 – 0 4 11
L I S T O F T A B L E S

L I S T O F T A B L E S continued

** estimate has a relative standard error greater than 50% and isconsidered too unreliable for general use
— nil or rounded to zero (including null cells)
^ estimate has a relative standard error of 10% to less than25% and should be used with caution
* estimate has a relative standard error of 25% to 50% andshould be used with caution
130 526883823 86611 87614 23826 78532 46340 827Total all industries#
1 37219*85^185*160^157^239^535All other industries99
129 154873733 78111 69214 07726 62732 22440 292Agriculture01
1 710—9^73*87^165^560^575^242Crop and plant growing
n.e.c.0169
566—————337—^229Cotton growing01624 560———*7—4 039—^514Sugar cane growing0161^80213*14*67*64*155*276^221Livestock farming n.e.c.0159
**5—————1**31Deer farming01531 75721*65^89*65^541^379^615Horse farming0152
870—2^25^57^123^258^168238Pig farming0151^47413^19^59^36^63*118*174Poultry farming (eggs)0142
781—1^145960122^217309Poultry farming (meat)014110 359—15423425031 1206 4121 439Dairy cattle farming013035 501232051 1541 9301 24811 5057 80911 626Beef cattle farming012512 01828—5831 2411 406^2743 4025 084Sheep farming0124
8 54122—318^4609107452 3683 719Sheep-beef cattle farming012316 3082—^642 7832 2711 4092 7966 983
Grain-sheep/beef cattlefarming
012214 614—2^212 6733 5281 5303 1433 717Grain growing0121
4 875—111^393044161 8534521 700Fruit growing n.e.c.0119*33———*4—**33**23Kiwi fruit growing0117
1 244——^42^160^206*100301435Stone fruit growing01169712—133^155*95*45^368^173Apple and pear growing0115
6 53525^110^5632 423^1342 0581 240Grape growing01144 297—85094454061 247920761Vegetable growing0113
685—5^24^73^52^142^169^220Cut flower and flower seed
growing0112
1 648417^31^13599446287629Plant nurseries0111
Aust.ACTNTTas.WASAQldVic.NSWDesc r i p t i o n
ANZS IC
code
ESTABL ISHMENTS WITH AGRICULTURAL ACT IV ITY , By sta te —At 30 June 20041
A B S • A G R I C U L T U R A L CO M M O D I T I E S • 7 1 2 1 . 0 • 2 0 0 3 – 0 4 13

— nil or rounded to zero (including null cells)(a) Establishments on the population frame with EVAO of less than
$5,000 are not in scope of the survey, however some respondents tothe survey may report activity below this level.
^ estimate has a relative standard error of 10% to less than 25% andshould be used with caution
* estimate has a relative standard error of 25% to 50% and should beused with caution
** estimate has a relative standard error greater than 50% and isconsidered too unreliable for general use
9 95719 24810 43414 00520 33918 35220 166Total all industries#
*75^122*80*168*170^235^406All other industries99
9 88319 12610 35413 83720 16918 11619 760Agriculture01
*41*286^126^225^238^244^424Crop and plant growing
n.e.c.0169
*62*55**4**71—**4Cotton growing0162^423938^675^861^884^280**22Sugar cane growing0161**10**18**11*42*49*176^483Livestock farming n.e.c.0159
—————**41Deer farming0153**32^89*68^173^385^590^411Horse farming0152
^104^160^51^83*63*54*62Pig farming0151^35^58*12*32*34*20**130Poultry farming (eggs)0142^98^90*13^19*40*29**72Poultry farming (meat)0141
^1 6263 495^1 119^1 258^719*231*178Dairy cattle farming0130^9552 245^1 5402 8496 3378 11211 732Beef cattle farming0125^5561 456^1 1361 4312 3212 458^2 037Sheep farming0124^6481 301^967^1 1732 055^1 077^738Sheep-beef cattle farming01232 1753 8271 6392 1532 263^972^444
Grain-sheep/beef cattlefarming
01221 9672 5821 2621 0121 078^796^425Grain growing0121^250540^346518944^858802Fruit growing n.e.c.0119
————**10**13**8Kiwi fruit growing0117*34^160^105^163^209^237^214Stone fruit growing0116
^119^138*87*68^122*110**74Apple and pear growing0115^258861^688^1 122^1 324^975^699Grape growing0114
394560292^377551^509^478Vegetable growing0113^21^42*58^91^177^124^133
Cut flower and flower seedgrowing
0112^74224^154^180^363^248^190Plant nurseries0111
350.0
–499.9
200.0
–349.9
150.0
–199.9
100.0
–149.9
50.0
–99.9
22.5
–49.9
Less than
22.5(a)
ESTIMATED VALUE OF AGRICULTURAL OPERATIONS ($'000)
Desc r i p t i o n
ANZS IC
code
ESTABL ISHMENTS WITH AGRICULTURAL ACT IV ITY , By EVAO —At 30 June 20042
14 A B S • A G R I C U L T U R A L CO M M O D I T I E S • 7 1 2 1 . 0 • 2 0 0 3 – 0 4

^ estimate has a relative standard error of 10% to less than 25% and should be used with caution* estimate has a relative standard error of 25% to 50% and should be used with caution** estimate has a relative standard error greater than 50% and is considered too unreliable for general
use— nil or rounded to zero (including null cells)
130 5261 6394 65811 727Total all industries#
1 372*18*30*67All other industries99
129 1541 6224 62811 660Agriculture01
1 7106^14^106Crop and plant growing
n.e.c.0169
566^89^141^201Cotton growing01624 560*16*106^353Sugar cane growing0161^80212**9Livestock farming n.e.c.0159
**5———Deer farming01531 757—36Horse farming0152
87083^82^129Pig farming0151^47430^45^79Poultry farming (eggs)0142
781^56139226Poultry farming (meat)014110 359*28^2691 436Dairy cattle farming013035 501275^4501 006Beef cattle farming012512 01810^125488Sheep farming0124
8 541*18^86^480Sheep-beef cattle farming012316 308^1146102 111
Grain-sheep/beef cattlefarming
012214 6143691 6553 467Grain growing0121
4 875107185324Fruit growing n.e.c.0119*33——2Kiwi fruit growing0117
1 244*21*15^85Stone fruit growing0116971^32^129^92Apple and pear growing0115
6 535^76^170^362Grape growing01144 297258317561Vegetable growing0113
685^9^10^19Cut flower and flower seed
growing0112
1 648^24^73118Plant nurseries0111
Total
establishments
2 000.0
or more
1 000.0
–1 999.9
500.0
–999.9
ESTIMATED VALUE OF AGRICULTURAL
OPERATIONS ($'000) continued
Desc r i p t i o n
ANZS IC
code
ESTABL ISHMENTS WITH AGRICULTURAL ACT IV ITY , By EVAO —At 30 June 2004 co n t i n u e d2
A B S • A G R I C U L T U R A L CO M M O D I T I E S • 7 1 2 1 . 0 • 2 0 0 3 – 0 4 15

** estimate has a relative standard error greater than 50% and isconsidered too unreliable for general use
— nil or rounded to zero (including null cells)
^ estimate has a relative standard error of 10% to less than 25%and should be used with caution
* estimate has a relative standard error of 25% to 50% and shouldbe used with caution
1 46712 47216 81716 96642 41514 52125 103Total all industries#
**10*76*64*154^307*183^577All other industries99
1 45712 39716 75316 81242 10914 33824 526Agriculture01
—^20*73*216^516^367^516Crop and plant growing
n.e.c.0169
*8^131^180^107^122—**18Cotton growing0162—*33*63^1922 0821 427^764Sugar cane growing0161
*35*30*45**35*134*94^420Livestock farming n.e.c.0159—11——**3—Deer farming0153—*18**27*102^465^521^625Horse farming0152119^56^116307^147^225Pig farming0151
—3*14*10^35**80^332Poultry farming (eggs)0142—1*7**12^76^61623Poultry farming (meat)0141
**621^181^7977 005^1 719^629Dairy cattle farming0130^7003 6393 1443 78913 4965 4844 694Beef cattle farming0125^3441 2201 6522 2925 021^599^757Sheep farming0124^2371 1961 6721 8792 815^542*145Sheep-beef cattle farming0123
^812 6545 0813 9733 961*312^237Grain-sheep/beef cattle
farming0122
^413 3114 3502 9053 216^440^350Grain growing0121120^46^866056903 427Fruit growing n.e.c.0119
————**9—*24Kiwi fruit growing0117——**146^121^154948Stone fruit growing0116——2**39^296^152^483Apple and pear growing01152*41^50^74675^7844 909Grape growing011414085^1781 0906532 251Vegetable growing0113
———1*34^53598Cut flower and flower seed
growing0112
——**8*3^29591 550Plant nurseries0111
25 000
–99 999
2 500
–24 999
1 000
–2 499
500
–999
100
–499
50
–99
0
–49
AREA OF HOLDING (ha)
Desc r i p t i o n
ANZS IC
code
ESTABL ISHMENTS WITH AGRICULTURAL ACT IV ITY , By area —At 30 June 20043
16 A B S • A G R I C U L T U R A L CO M M O D I T I E S • 7 1 2 1 . 0 • 2 0 0 3 – 0 4

^ estimate has a relative standard error of 10% to less than 25% and should be used with caution* estimate has a relative standard error of 25% to 50% and should be used with caution** estimate has a relative standard error greater than 50% and is considered too unreliable for
general use— nil or rounded to zero (including null cells)
130 526108361^295Total all industries#
1 372—1—All other industries99
129 154108360^295Agriculture01
1 710———Crop and plant growing
n.e.c.0169
566———Cotton growing01624 560———Sugar cane growing0161^802—**5**5Livestock farming n.e.c.0159
**5———Deer farming01531 757———Horse farming0152
870———Pig farming0151^474———Poultry farming (eggs)0142
7811——Poultry farming (meat)014110 359——1Dairy cattle farming013035 50198282^173Beef cattle farming012512 0185^51^77Sheep farming0124
8 5414^19*32Sheep-beef cattle farming012316 308—**2**7
Grain-sheep/beef cattlefarming
012214 614——1Grain growing0121
4 875———Fruit growing n.e.c.0119*33———Kiwi fruit growing0117
1 244———Stone fruit growing0116971———Apple and pear growing0115
6 535———Grape growing01144 297———Vegetable growing0113
685———Cut flower and flower seed
growing0112
1 648———Plant nurseries0111
Total
establishments
500 000
or more
200 000
–499 999
100 000
–199 999
AREA OF HOLDING (ha) continued
Desc r i p t i o n
ANZS IC
code
ESTABL ISHMENTS WITH AGRICULTURAL ACT IV ITY , By area —At 30 June 2004 co n t i n u e d3
A B S • A G R I C U L T U R A L CO M M O D I T I E S • 7 1 2 1 . 0 • 2 0 0 3 – 0 4 17

** estimate has a relative standard error greater than 50% and isconsidered too unreliable for general use
. . not applicable— nil or rounded to zero (including null cells)na not available
^ estimate has a relative standard error of 10% to less than 25% andshould be used with caution
* estimate has a relative standard error of 25% to 50% and should beused with caution
—7.7^9.4^4.4^3.92.3^2.7^2.73.33.13.0Yield (t/ha)—3*1*3^3^6^13^9^37^54^41Area ('000 ha)—21*6*12^10^14^34^25122^166124Production ('000 t)
Non-cereal crops for hay
2.96.1^3.95.24.5^3.8^7.03.84.93.14.0Yield (t/ha)——^2173129^48107143603505434Area ('000 ha)—2^9898583^185^7495382 9641 5811 717Production ('000 t)
Cereal crops for hayCrops cut for hay
—. .1.51.51.41.41.10.81.40.71.1Yield (t/ha)—na^—66786**—28698511 0251 139Area ('000 ha)—na^1969^122**—^32561 1807261 215Production ('000 t)
Lupins for grain
—. .2.01.61.6**0.2*1.10.9^1.40.51.5Yield (t/ha)—na^165157**1110^22354380336Area ('000 ha)—na^1103246**—*118^19^487178513Production ('000 t)
Field peas for grainLegumes
3.3. .3.42.31.81.42.21.82.00.92.1Yield (t/ha)1na84 9171 9607901 4093 98313 06711 17011 529Area ('000 ha)2na2611 0703 4901 1103 1457 28826 13210 13224 299Production ('000 t)
Wheat
—. .3.41.71.3**0.72.12.21.90.82.1Yield (t/ha)—na2^42122**3141135445408409Area ('000 ha)—na^8^73153**2295294826327860Production ('000 t)
Triticale
——. .—. .. .*3.98.48.39.68.3Yield (t/ha)——na—nana**1666646144Area ('000 ha)——na—nana*35505534381 192Production ('000 t)
Rice
3.1. .1.62.21.50.52.61.41.91.11.8Yield (t/ha)—na434489*91944491 089911784Area ('000 ha)—na7752137*55076102 0189571 434Production ('000 t)
Oats
—1.9. .5.4. .4.411.18.15.66.35.5Yield (t/ha)——na—na^48**122705083Area ('000 ha)——na—na^211**7178^395310454Production ('000 t)
Maize
—1.9. .*1.7. .2.5*1.33.32.72.22.5Yield (t/ha)——na*1na519**2212734667823Area ('000 ha)—1na*1na1 296**27092 0091 4652 021Production ('000 t)
Grain sorghum
—. .3.02.52.21.72.62.12.31.02.2Yield (t/ha)—na91 2781 2161518729514 4773 8643 707Area ('000 ha)—na283 1702 6912632 2751 95510 3823 8658 280Production ('000 t)
BarleyCereal for grain
ACTNTTas.WASAQldVic.NSW200420032002
2004Aust.
PRINCIPAL CROPS, Product ion —Year ended 30 June4
18 A B S • A G R I C U L T U R A L CO M M O D I T I E S • 7 1 2 1 . 0 • 2 0 0 3 – 0 4

** estimate has a relative standard error greater than 50% and isconsidered too unreliable for general use
. . not applicable— nil or rounded to zero (including null cells)na not available
^ estimate has a relative standard error of 10% to less than 25% andshould be used with caution
* estimate has a relative standard error of 25% to 50% and should beused with caution
—0.30.9*0.1^0.3^0.10.5*0.20.2^0.30.3Yield (t/ha)——^3^25*41^32^23*19^14491105Area ('000 ha)——^3*3^12^2^11*5^35^2331Production ('000 t)
Pasture seed
. .. .. .. .. .. .. .. .. .. .. .Yield (t/ha)—544106129^624952081 048740941Area ('000 ha)130200415471^4322 1928364 5773 1664 024Production ('000 t)
Total cut for hay
2.52.54.43.83.5^6.24.33.74.13.94.1Yield (t/ha)—4399596^33430121819572735Area ('000 ha)111174366333^2051 8414423 3732 2093 046Production ('000 t)
Other
1.442.2^5.6^4.54.38.05.44.55.35.74.7Yield (t/ha)——^4^1132*286687229169206Area ('000 ha)—19^25^49^138*2273513941 204957978Production ('000 t)
Lucerne
Pastures and grasses cutfor hay
. .. .. .. .. .2.72.4. .2.52.82.4Yield (t/ha)nanananana*—^1na^22^2Area ('000 ha)nanananana*1^3na^466Production ('000 t)
Tobacco
. .. .. .112.0. .81.1. .^99.582.682.573.7Yield (t/ha)nanana4na414na*30448448426Area ('000 ha)nanana453na33 553na*2 98836 99336 99531 424Production ('000 t)
Sugar cane cut forcrushing
. .4.7. .. .. .3.1. .**3.53.22.72.0Yield (t/ha)na—nanana^13na**—^14^10^15Area ('000 ha)na1nanana^42na**1^44^28^29Production ('000 t)
Peanuts (in shell)
. .. .. .—. .1.4. .^1.41.41.51.5Yield (t/ha)nanana**—na101na^126227245458Area ('000 ha)nanana—na145na^172317^364675Production ('000 t)
Cotton lintOther crops
. .. .. .. .. .. .. .. .. .. .. .Yield (t/ha)———358250^582424111 3211 3551 447Area ('000 ha)1——527355^513865071 8279071 891Production ('000 t)
Total oilseeds
1.6. .1.51.51.4—1.61.21.40.71.3Yield (t/ha)—na—358247—2393661 2111 2981 332Area ('000 ha)1na—527354—3844381 7038711 756Production ('000 t)
CanolaOilseeds
ACTNTTas.WASAQldVic.NSW200420032002
2004Aust.
PRINCIPAL CROPS, Product ion —Year ended 30 June co n t i n u e d4
A B S • A G R I C U L T U R A L CO M M O D I T I E S • 7 1 2 1 . 0 • 2 0 0 3 – 0 4 19

— nil or rounded to zero (including null cells)na not available(a) Number of trees refers to trees of bearing age (i.e. for apples it is trees four
years and over, for other fruit it is trees six years and over). Information onthe total number of trees is available on request. Yield is based on thenumber of bearing trees or the bearing area.
^ estimate has a relative standard error of 10% to less than 25% and shouldbe used with caution
* estimate has a relative standard error of 25% to 50% and should be usedwith caution
** estimate has a relative standard error greater than 50% and is consideredtoo unreliable for general use
. . not applicable
—36.4. .**19.4. .29.7. .^23.329.637.340.7Yield (kg/tree)—165na*113na960na^191 2571 0441 006Trees ('000)—6 027na^2 192na28 516na^43337 16938 97040 973Production (t)
Mangoes
——. .^43.5*15.763.629.1^88.960.5^59.549.8Yield (kg/tree)——na^55*40321**101^174^692681572Trees ('000)——na^2 412*630^20 447**2 954*15 454^41 897^40 53128 485Production (t)
AvocadosOther orchard fruit
8.0—*1.7^16.625.0^26.8^17.0^14.016.922.619.2Yield (kg/tree)——^6^359^63*101^413^5081 4501 4701 325Trees ('000)——**9^5 9771 576*2 700^7 034^7 14024 437^33 18325 485Production (t)
Plums and prunes
—. .12.1^21.8^48.018.5^51.7^19.6^39.7^45.255.9Yield (kg/tree)—na6^101^61^132^1 121^4551 877^2 1501 587Trees ('000)—na75^2 214^2 907^2 437^57 947^8 902^74 483^97 22988 651Production (t)
Peaches
—. .8.2^19.614.2*12.623.0^19.919.526.731.9Yield (kg/tree)—na11^169^100^184^508^3101 2821 113904Trees ('000)—na91^3 310^1 422^2 309^11 685*6 18925 00629 75428 823Production (t)
Nectarines
—. .^5.1**4.38.3**1.5^9.1^8.47.6^8.87.9Yield (kg/tree)—na*181**53157**16^203^4611 071^1 075853Trees ('000)—na*919*227^1 307**23^1 851^3 847^8 174^9 460^6 702Production (t)
Cherries
—. .*24.0*26.635.3**9.3^13.8*15.2^22.344.930.0Yield (kg/tree)—na*29*12^171*20^226*20^478^440^411Trees ('000)—na^691*321^6 021*186^3 132^308^10 658^19 742^12 355Production (t)
ApricotsStone
10.6. .42.172.873.233.6109.026.0100.0104.1110.5Yield (kg/tree)—na1713376221 112261 3861 3061 312Trees ('000)1na7289 7085 536724121 178674138 548135 919144 885Production (t)
Pears (excl. Nashi)
15.5. .32.538.717.830.429.825.328.738.939.7Yield (kg/tree)3na1 1489761 1339172 8261 8838 8858 3918 070Trees ('000)
42na37 25637 74520 17227 91384 07947 718254 925326 072320 526Production (t)Apples
Pome
——. .^39.771.790.555.351.458.084.166.6Yield (kg/tree)——na^1451 697^188^1 2553 5306 8147 1296 767Trees ('000)——na*5 744121 577^16 998^69 423181 422395 164599 484450 559Production (t)
Oranges
—2.4. .^39.762.067.1^58.8^44.063.862.556.5Yield (kg/tree)——na^332091 135^104^1001 5821 5731 383Trees ('000)——na*1 29412 97776 143^6 128^4 417100 95998 34378 079Production (t)
Mandarins
—7.7. .^81.786.0^71.874.7^36.963.977.393.1Yield (kg/tree)—1na*15^96^129^53^144438^446431Trees ('000)—10na*1 2638 246^9 257^3 944*5 31628 03534 47240 116Production (t)
Lemons and limesCitrus
ACTNTTas.WASAQldVic.NSW200420032002
2004Aust.
FRUIT AND NUTS, Product ion(a) —Year ended 30 June5
20 A B S • A G R I C U L T U R A L CO M M O D I T I E S • 7 1 2 1 . 0 • 2 0 0 3 – 0 4

— nil or rounded to zero (including null cells)na not available(a) Number of trees refers to trees of bearing age (i.e. for apples it is trees four
years and over, for other fruit it is trees six years and over). Information onthe total number of trees is available on request. Yield is based on thenumber of bearing trees or the bearing area.
^ estimate has a relative standard error of 10% to less than 25% and shouldbe used with caution
* estimate has a relative standard error of 25% to 50% and should be usedwith caution
** estimate has a relative standard error greater than 50% and is consideredtoo unreliable for general use
. . not applicable
—13.3. .. .. .41.5. .—41.540.040.3Yield (t/ha)—2nanana2 662na—2 6642 6162 963Area (ha)—20nanana110 397na—110 417104 743119 328Production (t)
Pineapples
—20.0. .22.5. .^12.3. .**0.9^12.514.4^24.7Yield (t/ha)—1na**11na*388na**4^403*623^457Area (ha)—10na**245na*4 768na**4*5 027*8 976*11 314Production (t)
Pawpaws
—19.7. .27.2. .26.8. .10.523.724.824.9Yield (t/ha)—80na^292na8 434na^2 05510 86110 65912 583Area (ha)—1 576na^7 915na226 090na^21 656257 237264 772313 314Production (t)
BananasTropical
——*7.524.524.918.7^20.1^13.420.2^15.420.4Yield (t/ha)——*2913688^329^405*12999^1 479986Area (ha)——^214^3 3372 1926 153*8 157**166^20 219^22 83420 088Production (t)
Strawberries
—. .**5.6. .. .. .*1.84.74.24.04.4Yield (t/ha)—na**3nanana*66309^377^400348Area (ha)—na**15nanana**1191 4491 5831 6051 512Production (t)
BlueberriesBerry fruit
—. .. .. .. .7.5. .10.99.48.710.4Yield (kg/tree)—nananana^1 354na^1 7413 0952 8082 452Trees ('000)—nananana^10 189na^18 98429 17324 34725 446Production (t)
Macadamia
—. .. .. .11.1—10.7*8.610.910.66.4Yield (kg/tree)—nanana^479—373**168689051 575Trees ('000)—nanana^5 302—3 993**1359 4309 55410 040Production (t)
Almond (kernel)Nuts
ACTNTTas.WASAQldVic.NSW200420032002
2004Aust.
FRUIT AND NUTS, Product ion(a) —Year ended 30 June co n t i n u e d5
A B S • A G R I C U L T U R A L CO M M O D I T I E S • 7 1 2 1 . 0 • 2 0 0 3 – 0 4 21

. . not applicable— nil or rounded to zero (including null cells)na not availablenp not available for publication but included in totals where applicable, unless
otherwise indicated
^ estimate has a relative standard error of 10% to less than 25% and should beused with caution
* estimate has a relative standard error of 25% to 50% and should be used withcaution
** estimate has a relative standard error greater than 50% and is considered toounreliable for general use
——npnp276.7^631.4221.3259.6302.3308.1323.7Yield (t/ha)——npnp14^1857^52^153128134Area (ha)——npnp3 866^11 16612 726^13 54646 26539 28843 412Production (t)
Mushrooms
—11.3—33.4**2.5^37.429.7^22.1^34.025.622.3Yield (t/ha)—129—719**25^2 428119^316^3 736^4 3354 470Area (ha)—1 460—24 017**64*90 844^3 531^6 962^126 877^110 95599 686Production (t)
Water
—13.9—21.828.232.417.926.427.024.424.3Yield (t/ha)—105—543*131 333^280^5612 8362 6353 049Area (ha)—1 460—11 850*37543 154*5 027^14 80176 66764 15074 101Production (t)
Rock andcantaloupe
Melons
——**10.327.8^28.923.015.623.020.819.822.6Yield (t/ha)——*261^567^3262 1782 002^7876 1216 1345 970Area (ha)——*2 698^15 739^9 43550 01531 221^18 120127 228121 508135 015Production (t)
Lettuces
—. .**1.2**0.1—*3.5^1.8*0.8^1.7*2.0^1.5Yield (t/ha)—na**—**7—*91^67*191^357^380^451Area (ha)—na**—*1—*316^121*157^596*742680Production (t)
Sold in pod
—. .5.6**0.4—4.7——5.55.35.1Yield (t/ha)—na5 112**71—^190——5 3745 1475 528Area (ha)—na28 537**31—^903——29 47127 09528 072Production (t)
For processingGreen peas
—. .19.718.350.423.718.5^26.022.318.821.7Yield (t/ha)—na309937^181^748^899^4423 5163 8794 041Area (ha)—na6 08617 160^9 121^17 733^16 669*11 51278 28172 97387 586Production (t)
Cauliflowers
—. .59.350.042.3*24.337.136.142.141.543.2Yield (t/ha)—na8871 5651 317*7721 689^9657 1957 3677 672Area (ha)—na52 61278 156^55 638^18 74162 591^34 823302 560305 699331 129Production (t)
Carrots
—12.5—^30.2**7.120.8^10.2^6.319.816.417.8Yield (t/ha)———*89*75^2 480^96^99^2 838^2 4852 419Area (ha)—1—*2 673**532^51 512^979*622^56 319^40 810^43 083Production (t)
Capsicums, chilliesand peppers
——9.4^12.37.97.66.55.07.47.66.9Yield (t/ha)——783*638*118^1 6502 657*1 1216 9667 2846 625Area (ha)——7 361^7 817*930^12 61217 238*5 58251 53955 08345 901Production (t)
Broccoli
3.0—7.5^3.1^3.93.53.9**1.54.4^5.05.1Yield (t/ha)——1 662**521**133 925661*3157 097^6 9516 569Area (ha)——12 476**1 606**5113 9252 574*48631 11934 62633 686Production (t)
Beans, french andrunner
——**0.5**1.4—^0.95.63.04.65.45.9Yield (t/ha)——**13*37—^315^1 666^2142 2452 2862 363Area (ha)——**7*50—^297^9 371^642^10 36612 22313 950Production (t)
Asparagus
ACTNTTas.WASAQldVic.NSW200420032002
2004Aust.
VEGETABLES, Product ion —Year ended 30 June6
22 A B S • A G R I C U L T U R A L CO M M O D I T I E S • 7 1 2 1 . 0 • 2 0 0 3 – 0 4

** estimate has a relative standard error greater than 50% and is considered toounreliable for general use
— nil or rounded to zero (including null cells)
^ estimate has a relative standard error of 10% to less than 25% and should beused with caution
* estimate has a relative standard error of 25% to 50% and should be used withcaution
—6.0*49.3^73.4**18.235.880.849.956.149.950.1Yield (t/ha)—1*24^110*146^3 4903 345^1 3448 4607 3098 477Area (ha)—3*1 162*8 082*2 655^125 003270 195^67 118474 220364 368424 950Production (t)
Tomatoes
—13.015.421.618.514.1*18.116.616.014.214.9Yield (t/ha)—41^111^829^189^3 205*272^1 2535 9016 5846 477Area (ha)—532^1 707^17 894*3 492^45 352^4 931^20 73594 64493 22696 331Production (t)
Pumpkins
——48.440.037.025.137.025.836.334.735.1Yield (t/ha)——6 7621 8988 940^4 755^9 1404 62536 12035 89937 943Area (ha)——327 60875 875330 690^119 164^337 943119 1041 310 3851 247 2681 333 158Production (t)
Potatoes
——51.266.841.134.137.6^33.642.043.451.2Yield (t/ha)——1 263220^1 976^700^486*9125 5585 2635 513Area (ha)——64 74314 722^81 186^23 85618 246^30 602233 354228 608282 516Production (t)
Onions, white andbrown
ACTNTTas.WASAQldVic.NSW200420032002
2004Aust.
VEGETABLES, Product ion —Year ended 30 June co n t i n u e d6
A B S • A G R I C U L T U R A L CO M M O D I T I E S • 7 1 2 1 . 0 • 2 0 0 3 – 0 4 23

(b) Yield represents the quantity of grapes produced per hectare of bearing vines.— nil or rounded to zero (including null cells)(a) Varietal information is available in Australian Wine and Grape Industry (cat. no.
1329.0).
6.73.47.58.313.65.815.213.413.410.512.2Yield (t/ha)(b)
5231 1867 86192 070885 99912 512532 251482 5632 014 9651 496 9391 753 888Total production
—1 186—3 5562 1017 28342 49412 29968 92075 08086 524Table and other———9913 82268104 86019 748129 48992 264152 863Drying
523—7 86187 523880 0755 162384 896450 5161 816 5561 329 5951 514 501Winemaking
GR A P E PR O D U C T I O N ( f r e s h we i g h t ) ( t )
993521 20512 08570 3122 56238 52939 036164 181157 492158 594Total area of vines
——723572 1491951 8251 2215 8196 2886 958Not yet bearing: planted or grafted during
collection year
21—856593 2022181 7751 8417 8008 4128 264Not yet bearing: planted or grafted prior
to collection year
783521 04811 06864 9612 15034 92935 975150 561142 793143 373Bearing
AR E A OF V I N E S AT HA R V E S T ( h a )
ACTNTTas.WASAQldVic.NSW200420032002
2004Aust.
GRAPES, Product ion (a) —Year ended 30 June7
24 A B S • A G R I C U L T U R A L CO M M O D I T I E S • 7 1 2 1 . 0 • 2 0 0 3 – 0 4

(c) Comprises broilers, fryers and roasters.(d) Australian total excludes Tasmania, the Northern Territory and the Australian
Capital Territory.(e) Dressed carcass weight, excluding offal.(f) Dressed weight of whole birds, pieces and giblets.(g) Data collected on basis of state of production.(h) Comprises dead wool and wool on skins.(i) Source: Dairy Australia.(j) Data for Australian Capital Territory are included in New South Wales; data for
Northern Territory are included in South Australia.
^ estimate has a relative standard error of 10% to less than 25% and should beused with caution
* estimate has a relative standard error of 25% to 50% and should be used withcaution
— nil or rounded to zero (including null cells)np not available for publication but included in totals where applicable, unless
otherwise indicatedr revised(a) Source: Livestock Products, Australia (cat. no. 7215.0).(b) Includes estimates of animals slaughtered on farms and by country butchers.
4 0201 039^4 791^19 839^15 059^41 589*48 780^57 929^193 045190 706187 027Eggs ('000 dozen)
npnp5904037036746 4341 27110 07510 32811 271Whole milk (ML)(i)( j )
525—15 038118 05772 47620 278108 352174 065508 791r551 107587 274Total wool produced (t)
34—1 1717 4496 0631 73114 56110 96841 97748 13350 404Other wool (t)(h)491—13 867110 60866 41318 54693 791163 097466 813r502 974536 870
Shorn wool (incl.crutchings) (t)
Wool(g)
npnpnpnpnp118205248694690667Chicken meat
('000 t)(d)(f )
——2455810070130406420396Pig meat ('000 t)——84768513182341329348Lamb ('000 t)——73723196073220268296Mutton ('000 t)——1——41514353831Veal ('000 t)—155117879753614021 9982 0351 996Beef ('000 t)
Meat(a)(e)Livestock products
npnpnpnpnp77 472120 346149 359423 742419 181415 556Chickens ('000)(c)(d)—9446748211 3189731 7515 5915 7425 402Pigs ('000)——4192 3922 9712616 4714 04716 56216 87017 400Lambs ('000)——3461 8459478933 0793 31010 42113 65714 441Sheep ('000)—14757856592221 0261 146963Calves ('000)—52054633433 5641 5571 6167 7538 0837 624Cattle ('000)
Livestock slaughterings(a)(b)
ACTNTTas.WASAQldVic.NSW200420032002
2004Aust.
L IVESTOCK SLAUGHTERINGS AND PRODUCTS— Year ended 30 June8
A B S • A G R I C U L T U R A L CO M M O D I T I E S • 7 1 2 1 . 0 • 2 0 0 3 – 0 4 25

— nil or rounded to zero (including null cells)(a) Excluding house cows.
^ estimate has a relative standard error of 10% to less than 25% and should beused with caution
592082 8834 4235 02917 46219 53625 82775 42777 73476 751Total establishments with cattle
592082 6094 3284 74616 89315 58025 01169 43471 29269 671Total meat cattle and calves
251711 6432 8192 79912 9029 20814 06243 62944 54544 238Other cattle one year and over561972 0363 8054 15815 18312 87122 41460 72062 54360 342Cows and heifers one year and over401791 6743 0053 58112 43510 81018 00149 72552 23652 069Other calves under one year431901 6203 4133 55113 51710 72019 24452 29952 96252 494
Bulls and bull calves used or intended forservice
Meat cattle
1—5903955991 4256 4771 72311 21111 86511 890Total milk cattle and calves
1—524373559^1 1916 2041 52110 37211 03011 207Other milk cattle——5533465091 3295 9011 57410 21210 44810 494Cows in milk and dry
Milk cattle(a)
NU M B E R OF ES T A B L I S H M E N T S W I T H CA T T L E
100.0100.072.493.786.197.855.893.188.988.688.8Meat cattle (%)——27.66.313.92.244.26.911.111.411.2Milk cattle (%)
Proportion of total herd
81 7306842 0951 35211 5004 2815 81627 46526 66427 870Total cattle and calves ('000)
81 7304961 9621 16411 2452 3905 41624 41023 61524 739Total meat cattle and calves ('000)
12551214022183 2134971 2575 9645 5085 788Other cattle one year and over ('000)51 0192331 0495685 6381 1852 87312 57012 24512 652Cows and heifers one year and over ('000)24111304613472 1146521 1425 2605 2925 679Other calves under one year ('000)
—4511503128055145617570620Bulls and bull calves used or intended for
service ('000)
Meat cattle
——1891331882551 8904003 0553 0493 131Total milk cattle and calves ('000)
——565972845931521 0169991 008Other milk cattle ('000)——133741161711 2972482 0382 0502 123Cows in milk and dry ('000)
Milk cattle(a)
CA T T L E
ACTNTTas.WASAQldVic.NSW200420032002
2004Aust.
CATTLE— Year ended 30 June9
26 A B S • A G R I C U L T U R A L CO M M O D I T I E S • 7 1 2 1 . 0 • 2 0 0 3 – 0 4

(a) Forecast made at the beginning of each season.— nil or rounded to zero (including null cells)na not available
50—1 5606 8067 3181 84111 32917 27346 17847 19948 092Total establishments with sheep
37na1 1165 7626 1171 3989 02714 32237 77837 24139 101Lambs under one year50na1 5126 7427 2481 83311 04716 97745 40946 35447 088Sheep
NU M B E R OF ES T A B L I S H M E N T S W I T H SH E E P
36na1 39111 4445 9012 4298 77916 35146 33345 51946 457Ewes expected to lamb next year
('000)(a)
73.1—86.482.486.861.685.583.083.077.682.3Proportion of lambs marked to ewes
mated (%)
23—1 0989 1724 9411 1957 09812 78636 31333 93237 694Lambs marked ('000)32—1 27111 1365 6921 9398 30315 40043 77243 74145 813Ewes mated to produce lambs ('000)
LA M B I N G
95—3 18325 06312 9174 82419 97835 227101 28799 252106 166Total sheep and lambs ('000)
20na7617 2754 0411 0425 58610 19828 92225 85828 395Lambs under one year ('000)75na2 42217 7888 8763 78214 39225 02972 36573 39477 770Sheep ('000)
SH E E P
ACTNTTas.WASAQldVic.NSW200420032002
2004Aust.
SHEEP— Year ended 30 June 200410
A B S • A G R I C U L T U R A L CO M M O D I T I E S • 7 1 2 1 . 0 • 2 0 0 3 – 0 4 27

— nil or rounded to zero (including null cells)na not available
^ estimate has a relative standard error of 10% to less than 25%and should be used with caution
* estimate has a relative standard error of 25% to 50% and shouldbe used with caution
na4722794884874517232 5052 8593 242Total establishments with
pigs
na4502254624853656532 2442 5742 941All other pigsna2*3595227^2192083011 0861 2471 588Gilts intended for breedingna3412413963493435721 9452 2402 580Breeding sowsna2402183853572945521 8472 0972 471Boars
NU M B E R OF ES T A B L I S H M E N T S W I T H P I G S
na3^14^291^378691^547^6242 5482 6582 940Total pigs ('000)
na2^12^253^326614^479^5312 2172 2922 568All other pigs ('000)na—*—^4^5^7^10^936^5143
Gilts intended for breeding('000)
na—^2^33^45^67^55^80282301313Breeding sows ('000)na—^—^2^2^3^2^4131417Boars ('000)
P I G S
ACTNTTas.WASAQldVic.NSW200420032002
2004Aust.
PIGS— Year ended 30 June11
np not available for publication but included in totals where applicable, unlessotherwise indicated
^ estimate has a relative standard error of 10% to less than 25% and shouldbe used with caution
— nil or rounded to zero (including null cells)
22071^343^1 376^1 201^3 330^2 919^3 20812 66912 91312 858For egg production ('000)——np^6 029np11 577^21 66726 76470 73570 91372 739For meat production ('000)
Chickens
ACTNTTas.WASAQldVic.NSW200420032002
2004Aust.
CHICKENS— Year ended 30 June12
28 A B S • A G R I C U L T U R A L CO M M O D I T I E S • 7 1 2 1 . 0 • 2 0 0 3 – 0 4
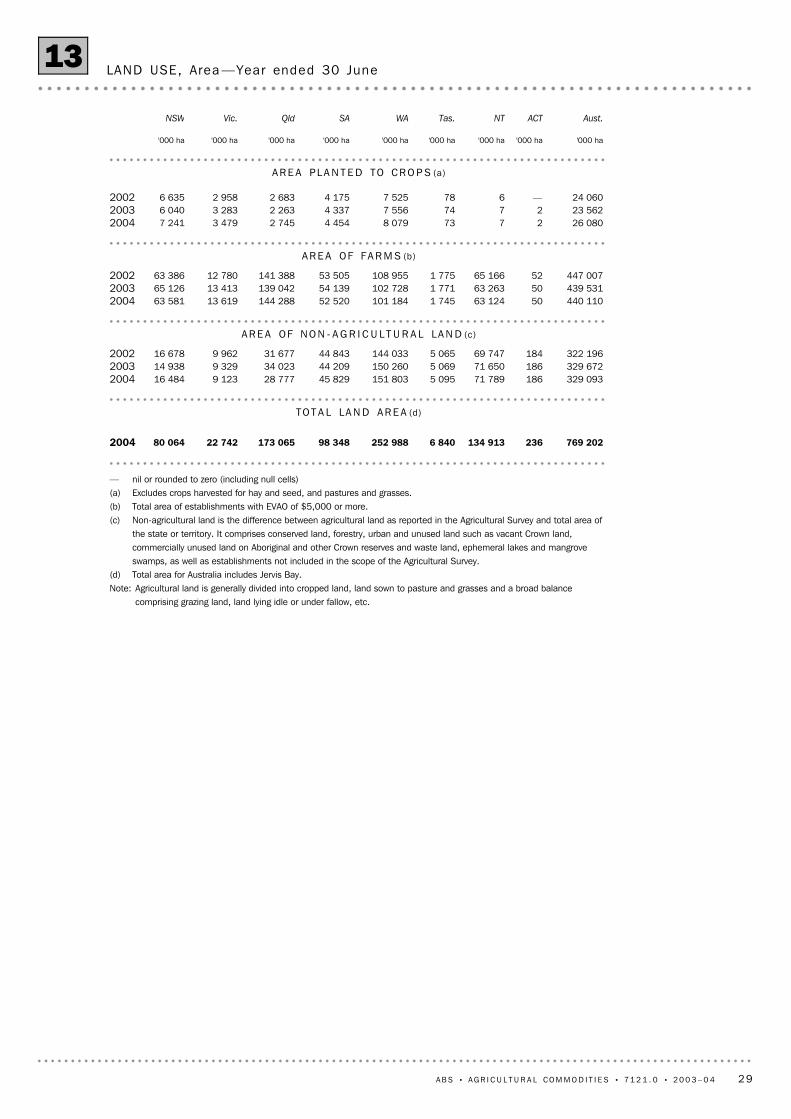
— nil or rounded to zero (including null cells)(a) Excludes crops harvested for hay and seed, and pastures and grasses.(b) Total area of establishments with EVAO of $5,000 or more.(c) Non-agricultural land is the difference between agricultural land as reported in the Agricultural Survey and total area of
the state or territory. It comprises conserved land, forestry, urban and unused land such as vacant Crown land,commercially unused land on Aboriginal and other Crown reserves and waste land, ephemeral lakes and mangroveswamps, as well as establishments not included in the scope of the Agricultural Survey.
(d) Total area for Australia includes Jervis Bay.Note: Agricultural land is generally divided into cropped land, land sown to pasture and grasses and a broad balance
comprising grazing land, land lying idle or under fallow, etc.
769 202236134 9136 840252 98898 348173 06522 74280 0642004
TO T A L LA N D AR E A (d)
329 09318671 7895 095151 80345 82928 7779 12316 4842004329 67218671 6505 069150 26044 20934 0239 32914 9382003322 19618469 7475 065144 03344 84331 6779 96216 6782002
AR E A OF NO N - A G R I C U L T U R A L LA N D (c)
440 1105063 1241 745101 18452 520144 28813 61963 5812004439 5315063 2631 771102 72854 139139 04213 41365 1262003447 0075265 1661 775108 95553 505141 38812 78063 3862002
AR E A OF FA R M S (b)
26 08027738 0794 4542 7453 4797 241200423 56227747 5564 3372 2633 2836 040200324 060—6787 5254 1752 6832 9586 6352002
AR E A PL A N T E D TO CR O P S (a)
'000 ha'000 ha'000 ha'000 ha'000 ha'000 ha'000 ha'000 ha'000 ha
Aust.ACTNTTas.WASAQldVic.NSW
LAND USE, Area —Year ended 30 June13
A B S • A G R I C U L T U R A L CO M M O D I T I E S • 7 1 2 1 . 0 • 2 0 0 3 – 0 4 29

10 The estimates in this publication are based on information obtained from a sample
drawn from the total farm population in scope of the collection, and are subject to
sampling variability; that is, they may differ from the figures that would have been
produced if all farms had been included in the Agricultural Survey. One measure of the
SA M P L E ER R O R
9 Since 1991–92, units in the Agricultural Census and the Agricultural Survey have been
classified according to the methodology described in Australian and New Zealand
Standard Industrial Classification (ANZSIC) (cat. no. 1292.0). Prior to 1991–92,
establishments were classified according to the methodology described in the 1983
edition of Australian Standard Industrial Classification (ASIC), Volume 1 – The
Classification (cat. no. 1201.0). Therefore care should be taken when making
comparisons between years where different classifications have been used.
I N D U S T R Y CL A S S I F I C A T I O N
8 An agricultural establishment is the smallest accounting unit of business within a
state or territory controlling its productive activities and maintaining a specified range of
detailed data enabling value added to be calculated. In general, an establishment covers
all operations at a physical location, but may consist of a group of locations provided
they are within the same Statistical Local Area (SLA) or contiguous SLAs. The majority of
establishments operate at one location only.
AG R I C U L T U R A L
ES T A B L I S H M E N T S
3 Estimates of farm production are based on information obtained from the
Agricultural Survey conducted at 30 June 2004. Prior to 1999–2000 information was
obtained for the period ending 31 March. The Australian Bureau of Statistics (ABS) has
changed the collection period to 30 June to better align with other ABS surveys. A study
of respondent data indicated that there should be no significant difference in estimates
collected between the reference periods.
4 The scope of the 2003–04 Agricultural Survey is establishments undertaking
agricultural activity with an estimated value of agricultural operations (EVAO) of $5,000
or more. This is the same as the scope for Agricultural Censuses from 1993–94 to
1996–97 and for 2000–01, and the Agricultural Surveys from 1997–98 to 1999–2000,
2001–02 and 2002–03. Prior to 1993–94 scope has varied and these details are available
on request.
5 From 2005–06 the ABS will use the Australian Business Register as the main source of
frames for its agricultural surveys. Until then, the Agriculture Survey sample will be
selected from the 2001–02 survey frame.
6 For the 2002–03 Agriculture Survey, a sub-sample of 28,000 units was selected from
the stratified random sample of 35,000 farms selected in the previous year. This helped
control the estimates of movement for that year which was particularly important given
the impact of the drought.
7 The sample for the 2003–04 Agriculture Survey included the same 28,000 units
selected for the 2002–03 survey. A further 3,000 units were selected to cover sample loss
due to units in the original selections having ceased farming, and to improve relative
standard errors where commodities were approaching or exceeding design parameters
in the 2002–03 Agriculture Survey. A proportion of the 3,000 units was also used to
sample units that commenced farming since 2001–02. This strategy was used to help
ensure good estimates of movements as parts of Australia move out of the drought.
SC O P E AN D CO V E R A G E
2 Where figures have been rounded, discrepancies may occur between sums of the
component items and totals.
GE N E R A L
1 This publication contains final estimates for the main commodities collected in the
2003–04 Agricultural Survey and related Supplementary Collections (i.e. Apples and Pears
Collection and Vineyards Collection). It contains detailed statistics on crops, livestock
and livestock products and industry and size characteristics of farms.
I N T R O D U C T I O N
30 A B S • A G R I C U L T U R A L CO M M O D I T I E S • 7 1 2 1 . 0 • 2 0 0 3 – 0 4
E X P L A N A T O R Y N O T E S

15 The statistics on livestock slaughtering and meat production are based on data
collected from abattoirs and other major slaughtering establishments and include
estimates of animals slaughtered on farms and by country butchers and other small
slaughtering establishments. Care should be taken when using this information as the
figures only relate to slaughtering for human consumption and do not include animals
condemned or those killed for boiling down. Definitions of livestock categories may
differ between states and within states, particularly with regard to calves.
L I V E S T O C K SL A U G H T E R I N G
AN D L I V E S T O C K PR O D U C T S
14 Statistics on area and production of crops relate, in the main, to crops sown during
the year ended 30 June. Statistics of perennial crops relate to the position at 30 June and
the production during the year ended on that date, or fruit set by that date. Statistics for
apples and pears and grapes, which in some states are harvested after 30 June, are
collected by supplementary collection forms and are included in this publication.
CR O P S , PA S T U R E S AN D
HO R T I C U L T U R E
. . not applicable— nil or rounded to zero (including null cells)
5.0. .—23.412.511.49.413.010.1Total pigs1.0——3.41.82.16.82.12.0Total sheep and lambs2.6——4.66.85.98.43.85.1Total milk cattle1.0——2.53.13.11.82.41.7Total meat cattle
11.0——24.719.523.613.133.921.9Tomatoes, production4.1——4.911.77.911.111.614.7Potatoes, production5.3——6.713.315.517.39.026.6Carrots, production4.4———15.58.817.415.25.8Oranges, production1.1—. .6.31.92.14.72.52.0Wheat for grain, production2.0—. .7.33.25.218.04.23.6Oats for grain, production2.8—. .17.03.76.570.19.76.8Lupins for grain, production2.3—. .17.65.14.9—4.14.6Canola, production1.4—. .5.32.52.35.92.63.4Barley for grain, production
%%%%%%%%%
Aust.ACTNTTas.WASAQldVic.NSW
RELAT IVE STANDARD ERRORS OF SELECTED COMMODIT IES— At 30June 2004
likely difference is given by the standard error (SE) which indicates the extent to which
an estimate might vary by chance because only a sample was taken. There are about two
chances in three that a 'sample' estimate will differ by less than one SE from the figure
that would have been obtained if all farms had responded, and about nineteen chances
in twenty that the difference will be less than two SEs.
11 In this publication, 'sampling' variability of the estimates is measured by the relative
standard error (RSE) which is obtained by expressing the SE as a percentage of the
estimate to which it refers.
12 Most published national estimates have RSEs less than 5%. For some states with
limited production of certain commodities, RSEs are greater than 10%. Estimates that
have an estimated relative standard error between 10% and 25% are annotated with the
symbol '^'. These estimates should be used with caution as they are subject to sampling
variability too high for some purposes. Estimates with an RSE between 25% and 50% are
annotated with the symbol '*', indicating that the estimate should be used with caution
as it is subject to sampling variability too high for most practical purposes. Estimates with
an RSE greater than 50% are annotated with the symbol '**' indicating that the sampling
variability causes the estimates to be considered too unreliable for general use. Separate
indication of the RSEs of all estimates is available on request.
13 A table with RSEs for selected commodities follows:
SA M P L E ER R O R continued
A B S • A G R I C U L T U R A L CO M M O D I T I E S • 7 1 2 1 . 0 • 2 0 0 3 – 0 4 31
E X P L A N A T O R Y N O T E S continued

22 A range of agricultural publications is produced by the ABS, including:
Livestock and Meat, Australia — Electronic Publication, cat. no. 7218.0.55.001
Livestock Products, Australia, cat. no. 7215.0
Principal Agricultural Commodities, Australia, Preliminary, cat. no. 7111.0
Value of Agricultural Commodities Produced, Australia, cat. no. 7503.0
Value of Principal Agricultural Commodities Produced, Australia, Preliminary,
cat. no. 7501.0
23 For comparisons of the agriculture industry with other industries, users are referred
to:
Australian National Accounts: National Income, Expenditure and Product, cat.
no. 5206.0
Australian National Accounts: State Accounts, cat. no. 5220.0
24 Current publications and other products released by the ABS are listed in the
Catalogue of Publications and Products (cat. no. 1101.0). The Catalogue is available
from any ABS office or the ABS web site <http://www.abs.gov.au>. The ABS also issues a
daily Release Advice on the web site which details products to be released in the week
ahead.
RE L A T E D PU B L I C A T I O N S
21 ABS publications draw extensively on information provided freely by individuals,
businesses, governments and other organisations. Their continued cooperation is very
much appreciated: without it, the wide range of statistics published by the ABS would
not be available. Information received by the ABS is treated in strict confidence as
required by the Census and Statistics Act 1905.
GE N E R A L AC K N O W L E D G M E N T
20 As well as the statistics included in this and related publications the ABS may have
other relevant data available on request. Inquiries should be made to either the
National Information and Referral Service on 1300 135 070 or Gordon Cameron on
Hobart (03) 6222 5939.
AB S DA T A AV A I L A B L E ON
RE Q U E S T
19 Poultry slaughtering statistics have been compiled from quarterly returns supplied
by commercial poultry slaughtering establishments. Producers in Tasmania, the Northern
Territory and the Australian Capital Territory are not included in the aggregates derived
from the Poultry and Game Birds Slaughtered collection. However, the statistics
represent a high level of coverage.
POULTRY SLAUGHTERING
18 Milk statistics have been collected and provided to the ABS by Dairy Australia. Data
for the Australian Capital Territory are included with New South Wales; data for the
Northern Territory are included with South Australia.
MILK
16 Wool production statistics contained in this publication are derived from the
quarterly ABS Wool Brokers and Dealers Receivals Collection and are published on the
basis of state of production.
17 Wool receivals statistics show the amount of taxable wool received by brokers and
dealers from wool producers. It excludes wool received by brokers on which wool tax
has already been paid by other dealers (private buyers) or brokers.
WOOL
32 A B S • A G R I C U L T U R A L CO M M O D I T I E S • 7 1 2 1 . 0 • 2 0 0 3 – 0 4
E X P L A N A T O R Y N O T E S continued


Subscription Services, ABS, GPO Box 2796Y, Melbourne Vic 3001
POST
(03) 9615 7848FAX
1300 366 323PHONE
ABS subscription services provide regular, convenient andprompt deliveries of selected ABS publications andproducts as they are released. Email delivery of monthlyand quarterly publications is available.
W H Y N O T S U B S C R I B E ?
Client Services, ABS, GPO Box 796, Sydney NSW 2001POST
1300 135 211FAX
1300 135 070PHONE
Data already published that can be provided within fiveminutes will be free of charge. Our information consultantscan also help you to access the full range of ABSinformation—ABS user pays services can be tailored toyour needs, time frame and budget. Publications may bepurchased. Specialists are on hand to help you withanalytical or methodological advice.
I N F O R M A T I O N S E R V I C E
This service now provides only current Consumer PriceIndex statistics call 1900 986 400 (call cost 77c perminute).
DIAL-A-STATISTIC
For current and historical Consumer Price Index data, call1902 981 074 (call cost 77c per minute).
CPI INFOLINE
A range of ABS publications is available from public andtertiary libraries Australia-wide. Contact your nearest libraryto determine whether it has the ABS statistics you require,or visit our web site for a list of libraries.
LIBRARY
www.abs.gov.au the ABS web site is the best place tostart for access to summary data from our latestpublications, information about the ABS, advice aboutupcoming releases, our catalogue, and Australia Now—astatistical profile.
INTERNET
F O R M O R E I N F O R M A T I O N . . .
ISSN 1442 71842712100007039
71
21
.0
•
AG
RI
CU
LT
UR
AL
CO
MM
OD
IT
IE
S,
AU
ST
RA
LI
A
• 2
00
3–
04
RRP $24.00
© Commonwealth of Australia 2005Produced by the Australian Bureau of Statistics