7. geophysical characteristics of volcanogenic massive ... · volcanogenic massive sulfide (vms)...
TRANSCRIPT

7. Geophysical Characteristics of Volcanogenic Massive Sulfide Deposits
By Lisa A. Morgan
7 of 21
Volcanogenic Massive Sulfide Occurrence Model
Scientific Investigations Report 2010–5070–C
U.S. Department of the InteriorU.S. Geological Survey

U.S. Department of the InteriorKEN SALAZAR, Secretary
U.S. Geological SurveyMarcia K. McNutt, Director
U.S. Geological Survey, Reston, Virginia: 2012
For more information on the USGS—the Federal source for science about the Earth, its natural and living resources, natural hazards, and the environment, visit http://www.usgs.gov or call 1–888–ASK–USGS.
For an overview of USGS information products, including maps, imagery, and publications, visit http://www.usgs.gov/pubprod
To order this and other USGS information products, visit http://store.usgs.gov
Any use of trade, product, or firm names is for descriptive purposes only and does not imply endorsement by the U.S. Government.
Although this report is in the public domain, permission must be secured from the individual copyright owners to reproduce any copyrighted materials contained within this report.
Suggested citation:Morgan, L.A., 2012, Geophysical characteristics of volcanogenic massive sulfide deposits in volcanogenic massive sulfide occurrence model: U.S. Geological Survey Scientific Investigations Report 2010–5070 –C, chap. 7, 16 p.

115
Contents
Introduction.................................................................................................................................................117Electrical Signature ...................................................................................................................................117Magnetic Signature ...................................................................................................................................118Gravity Signature .......................................................................................................................................123Radiometric Signature ..............................................................................................................................125Seismic Techniques ...................................................................................................................................125Concealed Deposits...................................................................................................................................127Conclusions.................................................................................................................................................129References Cited........................................................................................................................................129
Figures
7–1. Schematic diagram of the modern Trans-Atlantic Geothermal sulfide deposit on the Mid-Atlantic Ridge, depicting a cross section of a volcanogenic massive sulfide deposit with concordant semi-massive to massive sulfide lens underlain by a discordant stockwork vein system and associated alteration halo ..................................................................................................................................118
7–2. Selected airborne geophysical surveys for Bathurst mining camp .................................122 7–3. Gravity model showing that an excess mass in the crust contributes to
the gravity field and produces a positive anomaly or gravity high .....................................123 7–4. Geological and geophysical maps of the area containing the Armstrong B
massive sulfide deposit, Bathurst mining camp, New Brunswick, with geophysical profiles across the deposit ...........................................................................................................124
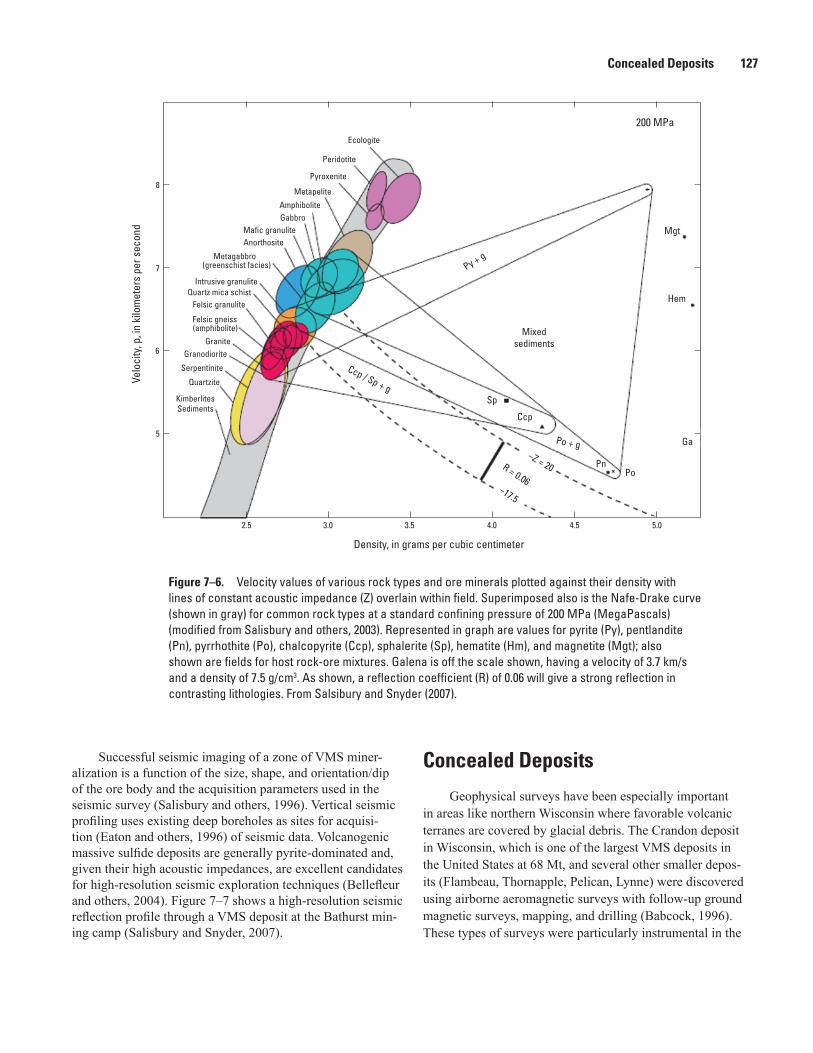
7–5. Schematic diagram showing airborne and ground radiometric surveys .........................126 7–6. Velocity values of various rock types and ore minerals plotted against their
density with lines of constant acoustic impedance overlain within field.........................127 7–7. Seismic reflection profiles through volcanogenic massive sulfide deposits ..................128
Tables
7–1. Utility of geophysical techniques in exploration of volcanogenic massive sulfide deposits .........................................................................................................................119
7-2. Physical properties of common rock ore minerals and ore-related minerals ...............120 7-3. Massive sulfide ore mineral density and magnetic susceptibility. ..................................123


Introduction
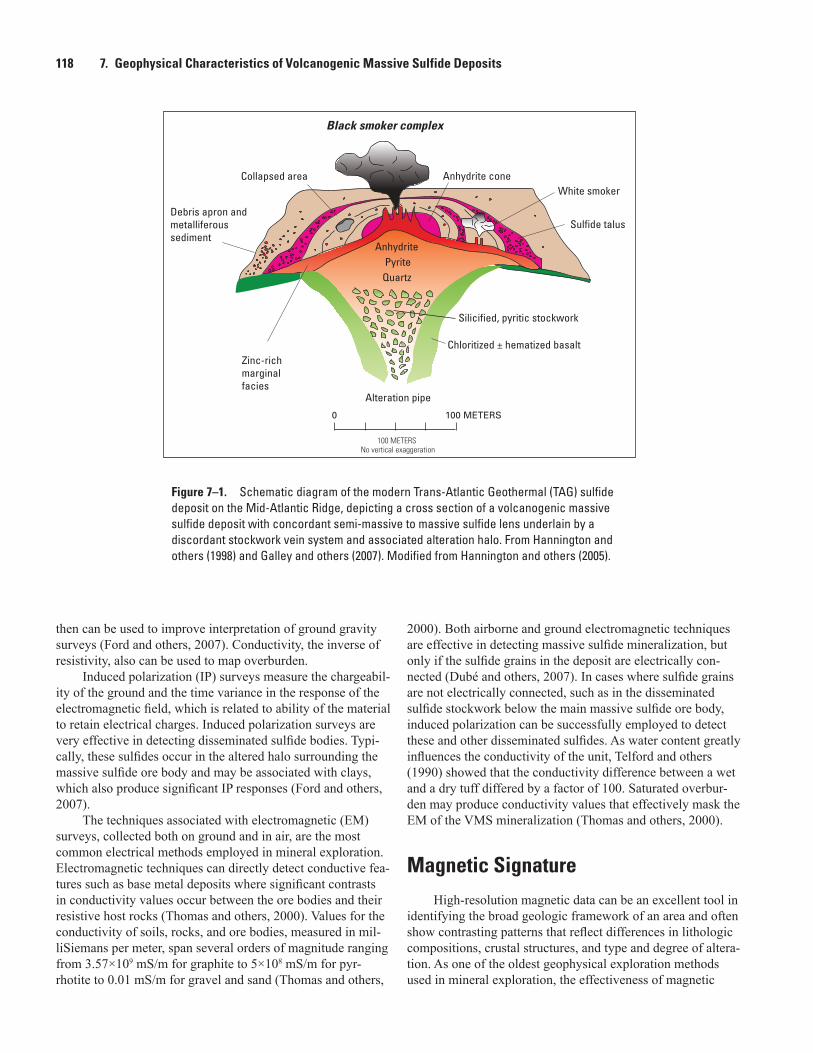
Volcanogenic massive sulfide (VMS) deposits typically have strong geophysical contrasts with their host rocks because of the substantial differences in physical and chemical properties between the deposits and the rock in which they form (Thomas and others, 2000). Such properties include density, magnetic intensity and susceptibility, gravity, electrical resistance, and acoustical velocity. Electrical self potential or transient responses to time-varying electromag-netic fields can also be used to detect buried sulfide deposits. Typically, the sulfide body is a concordant lens underlain by a discordant stockwork or stringer zone with vein-type sulfide mineralization (fig. 7–1) (Galley and others, 2007).
Based on the shape and depth of the ore body, the sulfide content in the ore produces significant geophysical signatures. As noted by Ford and others (2007), VMS deposits produce significant electromagnetic, gravimetric, and magnetic responses and thus provide great potential for geophysically detecting ore bodies (table 7–1). Geophysical surveys (fig. 7–2) have been employed successfully to identify ore bodies and are used at an early stage in exploration. For sulfide deposits, contrasts in magnetic, electromagnetic, and gravita-tional (density) properties become direct exploration vectors; gamma-ray spectroscopy provides an indirect technique based on chemical contrasts associated with near-surface alteration mostly as potassium enrichment or depletion within and sur-rounding the deposit (Thomas and others, 2000). As explora-tion for near-surface and surface base-metal deposits becomes more difficult, geophysical techniques are increasingly relied upon to identify areas of VMS mineralization (Bishop and Emerson, 1999).
The most common sulfide mineral in VMS deposits is pyrite, which is often associated with other sulfides such as pyrrhotite, chalcopyrite, sphalerite, and galena (Galley and others, 2007). Other possible nonsulfide minerals associated in VMS deposits include magnetite, hematite, and cassiterite; barite can be present as a gangue mineral. All these minerals have relatively high values of specific gravity (4.0–7.5 g/cm3; table 7–2), which is in strong contrast to the significantly lower densities measured in their sedimentary or volcanic host rocks. Thomas (2003) measured densities of 2.70–2.84 g/ cm3 for the host rock at the Bathurst mining camp.
Electrical Signature
Electrical methods are highly effective in identifying VMS targets because they respond to the electrical conductiv-ity of the rocks and minerals, which can vary by 20 orders of magnitude (Grant and West, 1965). Electrical methods are unique in being able to detect such a large range of mag-nitudes; no other physical property has such a wide range. Because of this large potential range in values, a variety of electrical techniques have been developed that capitalize on these differences, such as measurement of conductivity, resistivity (the inverse of conductivity), induced polarization, electromagnetism, and gamma ray spectra (table 7–1). Electri-cal methods are currently the most used technique in survey-ing for VMS deposits; a variety of survey types (for example, MegaTEM, Titan24, and borehole techniques) are pushing the limits of detectable depth ranges.
Volcanogenic massive sulfide deposits have high con-ductivities (fig. 7–2B) exceeding 500 mS/m (millisiemens per meter) and are similar in magnitude to graphite and saltwater (Ford and others, 2007). Compared to igneous and meta-morphic rocks with typical conductivities of <1 mS/m and sedimentary rocks with conductivities from 1 to 500 mS/m, the contrast between VMS deposits and its host rock may be significant and can be a useful physical property. A complicat-ing factor, however, may be introduced by a water-rich unit overlying the VMS ore body, as the content of water in a unit can substantially increase its conductivity; thus, such a unit could effectively mask the signal from the ore body. Anoxic sedimentary horizons that contain graphite or sulfide are also highly conductive and are difficult to distinguish from massive sulfide deposits. Some types of VMS deposits are typically associated with reducing sediments. Noneconomic pyrite-rich or pyrrhotite-rich deposits are not distinguishable from poten-tially economic deposits, so conductivity and other electro-magnetic techniques are not fully definitive exploration tools in and of themselves.
Electrical resistivity surveys are useful in calculating the apparent resistivity of the subsurface at different depths result-ing in the generation of cross sections of true resistivity (Ford and others, 2007). These can be used to produce three-dimen-sional geometries of ore bodies at depth. Resistivity surveys also are used to estimate the thickness of overburden, which
7. Geophysical Characteristics of Volcanogenic Massive Sulfide Deposits
By Lisa A. Morgan
118 7. Geophysical Characteristics of Volcanogenic Massive Sulfide Deposits
Figure 7–1. Schematic diagram of the modern Trans-Atlantic Geothermal (TAG) sulfide deposit on the Mid-Atlantic Ridge, depicting a cross section of a volcanogenic massive sulfide deposit with concordant semi-massive to massive sulfide lens underlain by a discordant stockwork vein system and associated alteration halo. From Hannington and others (1998) and Galley and others (2007). Modified from Hannington and others (2005).
then can be used to improve interpretation of ground gravity surveys (Ford and others, 2007). Conductivity, the inverse of resistivity, also can be used to map overburden.
Induced polarization (IP) surveys measure the chargeabil-ity of the ground and the time variance in the response of the electromagnetic field, which is related to ability of the material to retain electrical charges. Induced polarization surveys are very effective in detecting disseminated sulfide bodies. Typi-cally, these sulfides occur in the altered halo surrounding the massive sulfide ore body and may be associated with clays, which also produce significant IP responses (Ford and others, 2007).
The techniques associated with electromagnetic (EM) surveys, collected both on ground and in air, are the most common electrical methods employed in mineral exploration. Electromagnetic techniques can directly detect conductive fea-tures such as base metal deposits where significant contrasts in conductivity values occur between the ore bodies and their resistive host rocks (Thomas and others, 2000). Values for the conductivity of soils, rocks, and ore bodies, measured in mil-liSiemans per meter, span several orders of magnitude ranging from 3.57×10⁹ mS/m for graphite to 5×10⁸ mS/m for pyr-rhotite to 0.01 mS/m for gravel and sand (Thomas and others,
2000). Both airborne and ground electromagnetic techniques are effective in detecting massive sulfide mineralization, but only if the sulfide grains in the deposit are electrically con-nected (Dubé and others, 2007). In cases where sulfide grains are not electrically connected, such as in the disseminated sulfide stockwork below the main massive sulfide ore body, induced polarization can be successfully employed to detect these and other disseminated sulfides. As water content greatly influences the conductivity of the unit, Telford and others (1990) showed that the conductivity difference between a wet and a dry tuff differed by a factor of 100. Saturated overbur-den may produce conductivity values that effectively mask the EM of the VMS mineralization (Thomas and others, 2000).
Magnetic Signature
High-resolution magnetic data can be an excellent tool in identifying the broad geologic framework of an area and often show contrasting patterns that reflect differences in lithologic compositions, crustal structures, and type and degree of altera-tion. As one of the oldest geophysical exploration methods used in mineral exploration, the effectiveness of magnetic
Black smoker complex
Collapsed areaWhite smoker
Sulfide talus
100 METERS
Debris apron andmetalliferoussediment
Anhydrite cone
Anhydrite Pyrite Quartz
Zinc-richmarginalfacies
Silicified, pyritic stockwork
Chloritized ± hematized basalt
Alteration pipe
No vertical exaggeration
0 100 METERS

Magnetic Signature 119
Table 7–1. Utility of geophysical techniques in exploration of volcanogenic massive sulfide (VMS) deposits. O represent highly effective methods and X represent moderately effective methods.
[Source: Ford and others (2007)
Geophysical method
Air or ground
ApplicationVMS
deposits
Electric
Air Geological Framework XGround Direct Targeting O
Electromagnetic
Air Geological Framework XAir Direct Targeting OGround Geological Framework XGround Direct Targeting O
Magnetic
Air Geological Framework OAir Direct Targeting OGround Geological Framework OGround Direct Targeting O
Gravity
Air Geological Framework XAir Direct Targeting OGround Geological Framework XGround Direct Targeting O
Radiometric
Air Geological Framework OAir Direct Targeting XGround Geological Framework XGround Direct Targeting X
Seismic
Ground Geological Framework XGround Direct Targeting X
surveys depends on the presence of magnetite or other miner-als with high values of magnetic susceptibility (fig. 7–2A; tables 7–2, 7–3). Metallic ore bodies are often identified by delineating magnetic anomalies.
Magnetic surveys measure the total magnetic intensity or strength of the Earth’s field, measured in units of nanotesla (nT). The total field includes contributions imparted by the Earth’s core, crust, and upper atmosphere; the resultant field subtracts contributions from the core and upper atmosphere leaving the crustal component which reflects both positive and negative values of crustal susceptibility. It is the total magnetic intensity of the crust that is referred to in discussing processed magnetic field data. A commonly applied derivative of the magnetic field data is the magnetic vertical gradient, measured in nanoteslas per meter (nT/m), which filters the magnetic data and emphasizes near-surface geological features. Compared to anomalies observed in total magnetic intensity maps, vertical gradient anomalies tend to be more confined and associated with closely spaced geological units that produce distinct mag-netic anomalies (Thomas and others, 2000). Vertical gradient maps are commonly used to delineate VMS deposits (fig. 7–2).
Many sulfide minerals have high values of magnetic sus-ceptibility resulting in prominent magnetic anomalies associ-ated with VMS ore bodies. In some cases, the strong magnetic signature of a VMS deposit is associated with noneconomic mineralization. For example, a Cu-rich, chalcopyrite-bearing VMS deposit may have a strong magnetic anomaly due to its association with pyrrhotite, a highly magnetic but non-economic mineral (table 7–2). Very high values of magnetic susceptibility are measured in pyrrhotite (3,200×10-3 SI) and pyrite (5×10⁻³ SI), which is the most common mineral associ-ated with VMS deposits. Compared to the lower values mea-sured in most sedimentary and volcanic host rocks, this strong contrast in values results in positive magnetic anomalies in surveyed areas.
Other common sulfide minerals in VMS deposits, such as chalcopyrite, sphalerite and galena, have lower values of magnetic susceptibility that are similar to those found for their sedimentary and volcanic host rocks and thus do not contribute to any magnetic anomaly associated with the VMS ore body. Sphalerite has no salient geophysical properties that would allow its identification using routine geophysical techniques (Bishop and Emerson, 1999) and, in fact, detection of any Zn-bearing sulfides is difficult. Sphalerite, the most commonly mined Zn-bearing mineral, is not magnetic, is very resistive, and has a relatively low specific gravity. However, sphalerite rarely forms as an isolated sulfide as it is associ-ated with galena, pyrite, pyrrhotite, and chalcopyrite (Bishop and Emerson, 1999). The fact that sulfides with high values of magnetic susceptibility are associated with VMS ore bodies facilitates their identification. Additionally, nonsulfide metal-lic minerals with high susceptibility values, such as magnetite (5,500×10-3 SI) and hematite (40×10-3 SI) (table 7–2), also are common in some massive sulfide deposits and contribute to the strong positive magnetic anomalies found associated with these ore bodies. Magnetite in VMS deposits typically occurs

120 7. Geophysical Characteristics of Volcanogenic Massive Sulfide Deposits
Table 7-2. Physical properties (density, magnetic susceptibility, electrical conductivity) of common rock ore minerals and ore-related minerals.
[Sources: Thomas and others (2000); Ford and others (2007). SI, International System of Units; g/cm3, gram per cubic centimeter; mS/m, millisiemens per meter]
Rock type
Density (g/cc) Magnetic (SI x 10–3) Conductivity (mS/m)
Min. Max. Ave. Min. Max. Ave. Min. Max. Ave.
Sediments and sedimentary rocks
Overburden 1.92Soil 1.2 2.4 1.92 0.01 1.26Clay 1.63 2.6 2.21 10 300Glaciolacustrine clay 0.25 10 200Gravel 1.7 2.4 2 0.1 2Sand 1.7 2.3 2 0.1 2Glacial till 0.5 20Saprolite (mafic) 50 500Saprolite (felsic) 5 50Sandstone 1.61 2.76 2.35 0 20 0.4 1 200Shale 1.77 3.2 2.4 0.01 18 0.6 30 200Argillite 0.07 83.3Iron formation 0.05 3,300Limestone 1.93 2.9 2.55 0 3 0.3 0.001 1Dolomite 2.28 2.9 2.7 0 0.9 0.1 0.001 1Conglomerate 0.1 1Greywacke 2.6 2.7 2.65 0.09 0.24Coal 1.35 0.03 2 100Red sediments 2.24 0.01 0.1
Igneous rocks
Rhyolite 2.52 0.2 35Andesite 2.61 160Granite 2.64 2.5Granodiorite 2.73Porphyry 2.74 60Quartz porphyry 20Quartz diorite 2.79Quartz diorite, dacite 83Diorite 2.85 85Diabase 2.91Olivine diabase 55Basalt 2.99 25Gabbro 3.03 70Hornblende gabbro 3.08 70Peridotite 3.15 250Obsidian 2.3Pyroxenite 3.17 125Monzonite 85Acid igneous rocks 2.61 8Basic igneous rocks 2.79 25

Magnetic Signature 121
Table 7-2. Physical properties (density, magnetic susceptibility, electrical conductivity) of common rock ore minerals and ore-related minerals.—Continued
[Sources: Thomas and others (2000); Ford and others (2007). SI, International System of Units; g/cm3, gram per cubic centimeter; mS/m, millisiemens per meter]
Rock type
Density (g/cc) Magnetic (SI x 10–3) Conductivity (mS/m)
Min. Max. Ave. Min. Max. Ave. Min. Max. Ave.
Phonolite 2.59Trachyte 2.6 49Nepheline syenite 2.61Syenite 2.77 49Anorthosite 2.78Norite 2.92
Metamorphic rocks
Quartzite 2.6 4Schist 2.64 1.4Marble 2.75Serpentine 2.78Slate 2.79 6Gneiss 2.8Amphibolite 2.96 0.7Eclogite 3.37Granulite 2.65Phyllite 2.74Quartz slate 2.77Chlorite schist 2.87Skarn 2.95 3.15 2.5 1.25Hornfels 2.9 3 0.31 0.05
Sulfide minerals
Chalcopyrite 4.2 0.02 0.4 1.11 6.67Galena 7.7 -0.03 1.11 1.47Pyrite 5 0.03 5.3 1.67 8.33Pyrrhotite 5 3,200 6.25 5Sphalerite 3.75 -0.03 0.75 0.08 3.70
Other
Magnetite 5.04 1,000 5,700Graphite 2.5 -0.08 0.2 1.01 3.57
122 7. Geophysical Characteristics of Volcanogenic Massive Sulfide Deposits
B. Apparent conductivity (4433Hz)
0 20 KILOMETERS
1,000.00630.90398.10251.10158.40100.00
63.0039.8025.1015.8010.00
6.303.922.511.581.000.630.390.250.150.10
mS/m
C. Bouguer gravity field
0 20 KILOMETERS
62
−2−6
−10−14−18−22−26−30−34−38−42
mGal
A. Total magnetic field
0 20 KILOMETERS
27989
−50
−81−100
−115
−132−148−158
−172−182
−193−202
−210−219
−227
−234
−245−273
mS/m
KILOMETERS
D. Vertical magnetic gradient
0 20 KILOMETERS
49.50002.50001.50000.75000.4000
0.25000.15000.07500.03750.0125
−0.0125−0.0375−0.0500−0.1000−0.2000−0.3000−0.5000−1.0000−2.0000−3.5000
nT/m
E. Equivalent thorium
0 20 KILOMETERS
17.516.515.514.513.512.511.510.5
9.58.57.56.55.54.53.52.51.50.5
0ppm
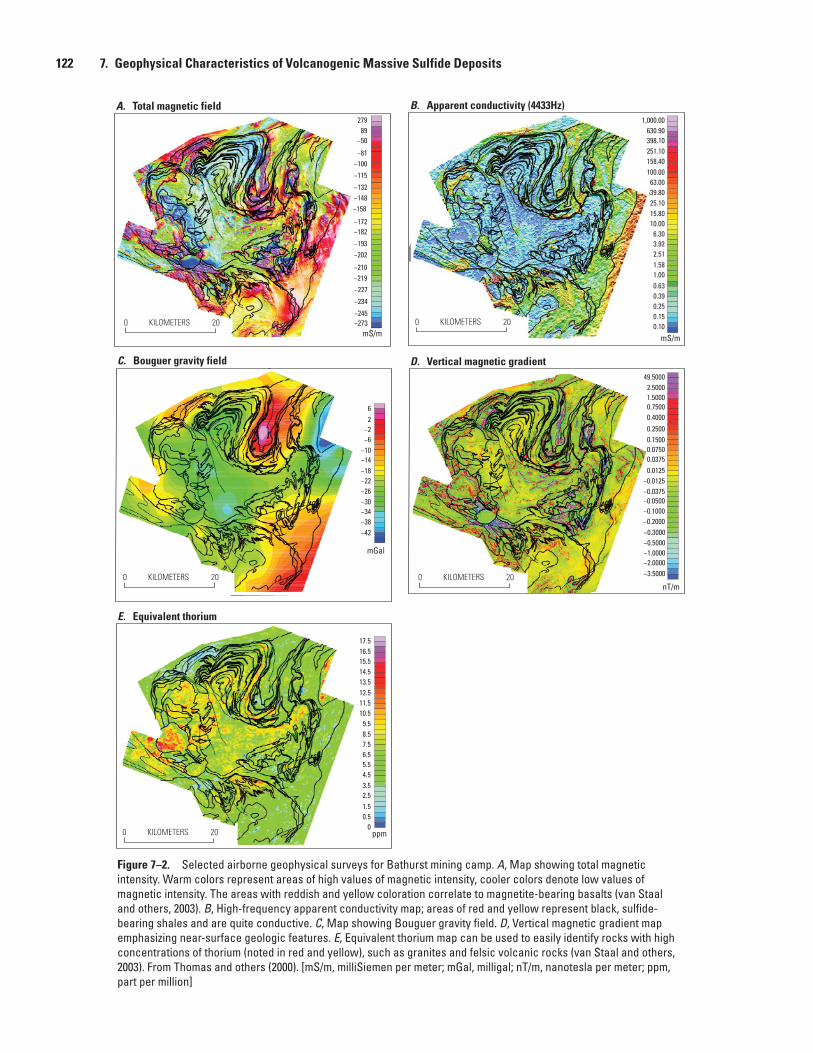
Figure 7–2. Selected airborne geophysical surveys for Bathurst mining camp. A, Map showing total magnetic intensity. Warm colors represent areas of high values of magnetic intensity, cooler colors denote low values of magnetic intensity. The areas with reddish and yellow coloration correlate to magnetite-bearing basalts (van Staal and others, 2003). B, High-frequency apparent conductivity map; areas of red and yellow represent black, sulfide-bearing shales and are quite conductive. C, Map showing Bouguer gravity field. D, Vertical magnetic gradient map emphasizing near-surface geologic features. E, Equivalent thorium map can be used to easily identify rocks with high concentrations of thorium (noted in red and yellow), such as granites and felsic volcanic rocks (van Staal and others, 2003). From Thomas and others (2000). [mS/m, milliSiemen per meter; mGal, milligal; nT/m, nanotesla per meter; ppm, part per million]

Gravity Signature 123
in the core of the stockwork and central basal part of the overlying sulfide lens (Ford and others, 2007). Furthermore, magnetite and hematite are common minerals in iron-forma-tion deposits that can be temporally and spatially associated with VMS deposits (Peter and others, 2003); high values of magnetic susceptibility for these minerals produce amplified magnetic anomalies.
At the Bathurst mining camp, Thomas (1997) measured values of magnetic susceptibility in host rocks that ranged from 0.1 to 1.1×10⁻³ SI. This strong contrast in values results in positive magnetic anomalies over the VMS ore body (fig. 7–2A) (Ford and others, 2007).
In other cases, hydrothermal alteration of footwall rocks beneath massive sulfide deposits may lead to the destruction of magnetic phases and results in anomalously low mag-netic signals, much like the hydrothermal alteration zones around thermal basins in Yellowstone National Park (Finn and Morgan, 2002). Tivey and others (1993, 1996) conducted near-bottom magnetic surveys over the TAG massive sulfide deposit (fig. 7–1) and two other inactive sulfide mounds on the Mid-Atlantic Ridge using the submersible Alvin. They found small localized negative magnetic anomolies over individual sulfide deposits and a broader magnetic low zone not attrib-utable to the small anomolies related to the mounds. They attribute the localized anomolies to destruction of magnetic minerals beneath the sulfide mounds in intense, focused hydrothermal up-flow zones. We note that alteration beneath the TAG massive sulfide deposit (fig. 7–1) has resulted in hematized basalts (Hannington and others, 1998); detailed studies of hydrothermal mineralogy have not identified any pyrrhotite or magnetite (Tivey and others, 1995). Geochemical and mineralogical observations are thus consistent with mag-netic data indicating that strongly magnetic minerals are not present in the TAG sulfide deposit and hydrothermal alteration has apparently oxidized primary magnetite in the basalt host rocks. This apparent inconsistency with magnetic highs related to VMS deposits exposed on the continents could be due to
differing mineralogy or to the overall size of sulfide accumula-tions relative to the underlying alteration pipes.
Tivey and others (2003) conducted extensive deep-tow magnetometer surveys over the TAG area and concluded that the broad negative magnetic anomaly is due to the area’s position on the hanging wall of a detachment fault that causes crustal thinning. They also suggest that the hanging wall of a long-lived detachment fault is a favorable site for hydrother-mal vents that may form VMS deposits because of reactivation along the fault providing pathways for fluid flow.
Gravity Signature
Gravimetric surveys measure differences in units of mil-ligals (mGal) in the Earth’s gravity field, which is sensitive to variations in rock density (Ford and others, 2007). Gravimetric surveys can be used to detect excess mass (fig. 7–3), which may indicate a potential ore body at depth, and to estimate the size of the excess mass; gravimetric surveys can be used in conjunction with conductivity surveys in assessing whether a conductivity anomaly is due to a low-density graphite body at depth or a high-density sulfide mineralized zone (Thomas and others, 2000). As noted, the minerals found in VMS deposits have relatively high specific gravity values in marked contrast to lower specific gravity values measured in their sedimentary and volcanic host rocks. Gravity highs are typical in VMS ter-ranes and center over the ore body (figs. 7–2C, 7–4).
In mineral exploration for massive sulfide deposits, gravity surveys generally follow other geophysical (magnetic, electrical, or electromagnetic) and geochemical surveys and are used to detect the excess mass of the ore body as well as determining its size and tonnage.
In the Iberian Pyrite Belt, the Las Cruces massive sulfide deposit, hosted in siliciclastic-felsic rock, originally was
Table 7-3. Massive sulfide ore mineral density (g/cm3) and magnetic susceptibility (10–3 Sl).
Mineral Density1 Susceptibility2
Barite 4.5 -Chalcopyrite 4.2 0.4Pyrite 5.02 5Pyrrhotite 4.62 3,200Sphalerite 4 0.8Galena 7.5 -0.03Magnetite 5.18 5,700Hematite 5.26 40
1Densities from Klein and Hurlbut (1985).2Susceptibilities from Hunt and others (1995).
density 1 > density 2
30 KILOMETERS0
30 MILES0
ll
ll l
ll
l30
0
Mill
igal
Positivegravity
anomaly(high)
mass excess
Figure 7–3. Gravity model showing that an excess mass in the crust contributes to the gravity field and produces a positive anomaly or gravity high. From Ford and others (2007).
124 7. Geophysical Characteristics of Volcanogenic Massive Sulfide Deposits
OSLs
OSLs
OSLs
OSLm
v
OSLfvOSLfv
OSLfv
A
A'
A A
A' A'
A
AA' A'
0.250 0.25
0
0.250
0.250
0.310AB−6
AB−5AB−13
AB−23
0.310
0.310
0.190
0.190
0.150
0.150
0.31
0
0.390 0.500
−240
−220
2720
28
29
30
100 METERS
Verticalexaggeration
2.22
100
MET
ERS
27.7−150nT nT/m mS/m
4433 Hz coplanarconductivity
mGal30
20
10
0
0.6 Magneticverticalgradient0.4
0.2
0
−0.2
−200
−220Total magneticfield−240
27.627.4
27.227.026.8
26.626.426.2
Gravity anomaly
−240
30.36
–207.1–223.5
–245.3
–249.7
–254.1
–257.4
–261.9
100.00
31.60
10.00
3.16
1.00
0.31
0.10
–239.1
29.67
28.36
27.68
27.15
26.86
26.56
25.86
25.35
mGalnT
mS/m
OSLs
OSLmv
OSLfv
1,000 METERS0A
B
D E
C
California Lake GroupCanoe Landing Lake Formation
Alkalic basalt
Laminated to thinly bedded shale interbedded with feldspathic sand stone and siltstone
Massive sulfides
Felsic feldspar–phyric crystal tuff and ashtuff
Stringer zone mineralization
Spruce Lake Formation
Thrust fault
EXPLANATION
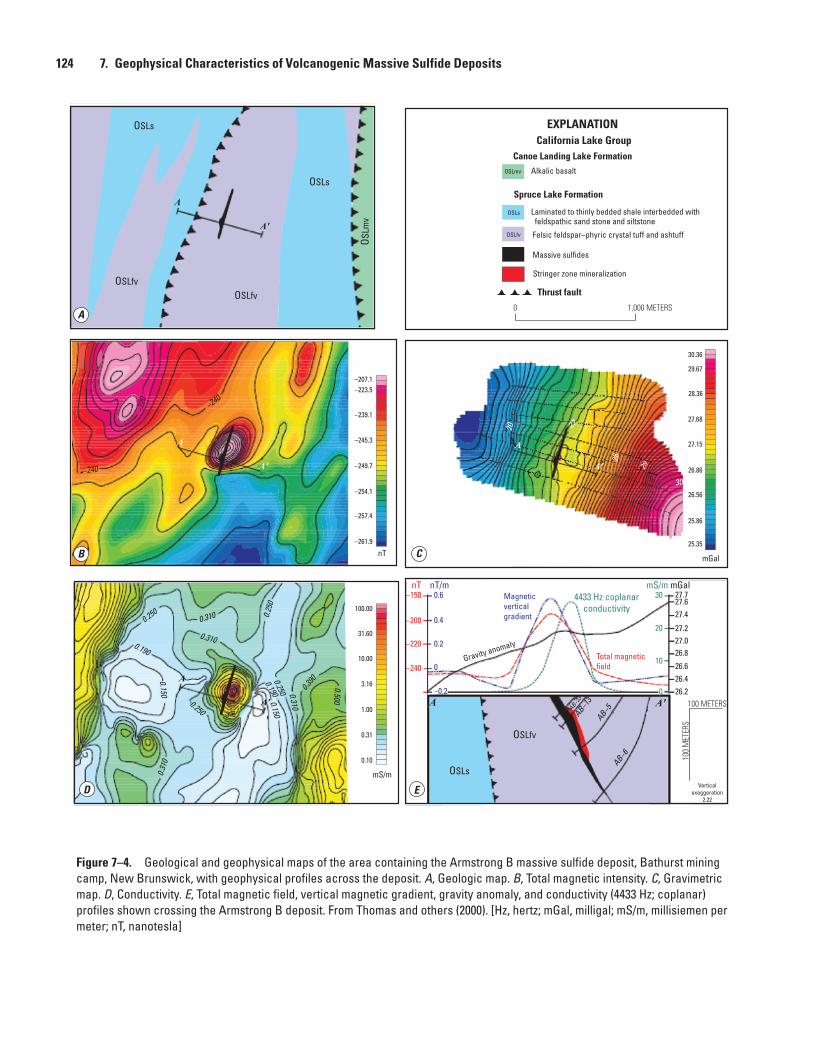
Figure 7–4. Geological and geophysical maps of the area containing the Armstrong B massive sulfide deposit, Bathurst mining camp, New Brunswick, with geophysical profiles across the deposit. A, Geologic map. B, Total magnetic intensity. C, Gravimetric map. D, Conductivity. E, Total magnetic field, vertical magnetic gradient, gravity anomaly, and conductivity (4433 Hz; coplanar) profiles shown crossing the Armstrong B deposit. From Thomas and others (2000). [Hz, hertz; mGal, milligal; mS/m, millisiemen per meter; nT, nanotesla]
Seismic Techniques 125
discovered by a regional gravity survey (McIntosh and others, 1999) that indicated an extension of the Pyrite Belt litholo-gies beneath 120 m of cover. The 14.5-Mt deposit occurs in highly altered felsic to intermediate volcanic units with minor sedimentary rocks and is located in an industrialized zone within 18 km of Seville. The gravity survey was followed by IP (induced polarization) and TEM (transient electromag-netic) surveys that were effective in defining the extent of mineralization.
Gravimetry also played a critical role in identification of a pyrite ore body with associated polymetallic VMS deposit, the Lagoa Salgada ore body, in the tectonically complex Iberian Pyrite Belt of Portugal. Here the deposit is covered by a 128-m-thick cover of Tertiary strata and is associated with a 15-m-thick gossan (Oliveira and others, 1998). The VMS min-eralization is somewhat variable and has significant values of Zn, Pb, Cu, As, Cd, Sn, Ag, Hg, and Au. The relatively dense ore body is hosted in a much less dense volcaniclastic-sedi-mentary host rock. The large contrast in density contributes to the large gravity anomaly. This anomaly has two main centers about 450 m apart and is strongly influenced by basement topography. Gravimetry has helped to delineate several struc-tural alignments or faults and identify horst-graben structures (Oliveira and others, 1998) that potentially provide structural control on the localization of sulfide ore bodies.
Radiometric Signature
All rocks are naturally radioactive and contain various proportions of radioactive elements that can be measured in radiometric surveys (Thomas and others, 2000).
Gamma-ray spectrometry (fig. 7–5) measures discrete windows within the spectrum of gamma-ray energies, permit-ting measurement of the concentrations of individual radioele-ments, specifically potassium (K), uranium (U), and thorium (Th) (fig. 7–2E), through the detection of their shorter lived decay products. These measurements respond to sources from the top 20–60 cm of the Earth’s surface and thus reflect only surficial geochemical conditions; the depth of features examined with gamma-ray spectrometry are much shal-lower in contrast to the depth of features measured below the mapped near-surface geology (tens to hundreds of meters) in other geophysical surveys, such as magnetic, electromagnetic, and gravity (Thomas and others, 2000). Tools for measuring radiation in bore holes allow the technique to be extended to the subsurface. Potassium, uranium, and thorium are measured in radiometric surveys because they are the principle elements contributing to natural radioactivity and are present in various concentrations in rocks and soils. Each element has distinct chemical properties that allow for characterization of normal and anomalous chemical and mechanical processes, which then can be further used to provide insight into ore-related processes (Ford and others, 2007). Potassium is present in most rocks and can be either significantly enriched or depleted by hydrothermal alteration. Uranium and thorium are present
in most rocks in minor abundances as relatively mobile and usually immobile elements, respectively (Thomas and others, 2000). Uranium mobility is strongly dependant on redox con-ditions and can thus be used to indicate favorable terrane for redox sensitive mineralization processes.
Gamma-ray spectrometry can be effective in geologic mapping and targeting mineralization, depending on several factors, including (1) where measurable differences in the radioactive element distributions can be related to differences in host rock lithologies, (2) where K content of the rock has been modified by alteration processes, and (3) where mineral-ization and alteration has affected surficial materials. Radio-element ratios of K, U, and Th can be applied to minimize the effects of moisture in soils, source geometry, and bedrock exposure. Preferential mobilization of individual radioele-ments in response to specific geochemical conditions allows the use of radioelement ratios as sensitive vectors in locating areas of mineralization (Thomas and others, 2000).
Alteration halos associated with VMS deposits also can contribute to their geophysical identification. As discussed by Shives and others (1997), K-altered mafic and felsic volcanic rocks are associated with a VMS deposit at Pilley’s Island, Newfoundland, and produce strong airborne and ground gamma-ray spectrometry signatures (fig. 7–5).
At the Bathurst mining camp, distinctive trends in the abundances of K, U, and Th are apparent within and between the felsic volcanic and volcaniclastic rocks within the three geological groups surveyed (Shives and others, 2003). These trends reflect different primary lithochemical variations and subsequent seawater hydrothermal alteration and (or) green-schist overprints (Shives and others, 2003). While alkaline element mobility related to hydrothermal alteration and metamorphism affects the K value in these settings, concentra-tions of Th, a nonmobile element, can be compared with other high field strength immobile elements to aid in stratigraphic correlation and establishment of a stratigraphic framework. Radioactive element abundances can be used in distinguishing between individual formations and sometimes units within a formation; they also are very helpful as chemostratigraphic indicators (Shives and others, 2003). Mapping relative abundances of K, U, and Th in VMS terranes also is useful in delineating areas of hydrothermal alteration temporally and spatially associated with VMS mineralization (Shives and oth-ers, 2003).
Seismic Techniques
Geophysical exploration in crystalline crust for VMS deposits traditionally has been accomplished using potential field techniques that have the capability of penetrating only to 100–300 m in depth. Geophysical exploration for VMS deposits has not generally incorporated seismic techniques until recently. Because surface and near-surface VMS sources are depleted, modern exploration for VMS deposits must focus on identifying mineralization at greater depths, which

126 7. Geophysical Characteristics of Volcanogenic Massive Sulfide Deposits
requires more sophisticated methodologies. Seismic tomogra-phy and reflection have been employed in detecting ore bodies (Elliot, 1967; Waboso and Mereu, 1978; Gustavsson and others, 1986; Goulty, 1993; McGaughey and others, 1994); however, whether ore bodies can be directly imaged has been debated (Dahle and others, 1985). Salisbury and others (1996) measured the acoustic properties of ores and host rocks and showed that seismic reflection profiling is an effective tech-nique in providing images of the regional structure in crystal-line crust and also in delineating large VMS deposits (Milke-reit and others, 1996). Furthermore, while surface seismic profiling is well suited for terrains with flat to moderate dips, Eaton and others (1996) and Salisbury and others (1996) show that in situations where steeply dipping or near vertical ore bodies are present, borehole seismic techniques can be used to successfully identify the ore body.
Seismic reflectivity is controlled by several factors, but one overriding factor is the difference in impedance between lithologies (Salisbury and others, 1996). Impedance is defined as the product of density and compressional wave velocity in a given material. Measurements of the specific gravities and velocities of common silicate rocks and ore minerals indicate
that ore minerals have significantly higher density values and a broad range of velocities, and therefore tend to have higher impedances than their host rocks. The difference in impedance value between the ore body and its host rock can be significant enough to result in high amplitude reflections and identifica-tion of the ore body (fig. 7–6) (Salisbury and others, 1996; Salisbury and Snyder, 2007).
Velocities of the most common sulfide minerals are quite variable and range from 8.04 km/s (kilometers per second) for pyrite to 4.68 km/s for pyrrhotite (Salisbury and others, 1996). In comparison, the measured densities are 5.02 g/cm3 (grams per cubic centimeter) for pyrite to 4.63 g/cm3 for pyr-rhotite. As noted by Salisbury and others (1996), ore minerals associated with pyrite-dominated ores increase in velocity with increasing density whereas sphalerite-, chalcopyrite-, and pyrrhotite-dominated ores typically have velocity values that decrease with increasing density. This trend of decreasing val-ues in velocity with increasing values in density is even more pronounced for mafic gangue with pyrrhotite (Salisbury and others, 1996). Host rock density values have a much narrower and lower range of density values and have a wide range of velocities (fig. 7–6).
Airbornegamma ray
spectrometry
Potassium map (%)
(Helicopter or fixed wing)
BARREN FELSICINTRUSION
LAKE
LAKELAKE
MAFICVOLCANIC
ROCKS
MAFICVOLCANIC
ROCKS
POTASSICALTERATION
POTASSICALTERATION
POTASSICALTERATION
Groundgamma ray
spectrometry
SHEAR-HOSTEDAu-Quartz
VEINS
PORPHYRYCu-Au+/-Mo
Au-Cu +/-Pb Zn
QUARTZCARBONATE
VEINS
(Handheld, backpack,vehicle-borne, boreholelogging, underground)
eUranium/eThorium ratioeThorium/Potassium ratio
Potassium (%)
Figure 7–5. Schematic diagram showing airborne and ground radiometric surveys. From Ford and others (2007).
Concealed Deposits 127
Successful seismic imaging of a zone of VMS miner-alization is a function of the size, shape, and orientation/dip of the ore body and the acquisition parameters used in the seismic survey (Salisbury and others, 1996). Vertical seismic profiling uses existing deep boreholes as sites for acquisi-tion (Eaton and others, 1996) of seismic data. Volcanogenic massive sulfide deposits are generally pyrite-dominated and, given their high acoustic impedances, are excellent candidates for high-resolution seismic exploration techniques (Bellefleur and others, 2004). Figure 7–7 shows a high-resolution seismic reflection profile through a VMS deposit at the Bathurst min-ing camp (Salisbury and Snyder, 2007).
Concealed Deposits
Geophysical surveys have been especially important in areas like northern Wisconsin where favorable volcanic terranes are covered by glacial debris. The Crandon deposit in Wisconsin, which is one of the largest VMS deposits in the United States at 68 Mt, and several other smaller depos-its (Flambeau, Thornapple, Pelican, Lynne) were discovered using airborne aeromagnetic surveys with follow-up ground magnetic surveys, mapping, and drilling (Babcock, 1996). These types of surveys were particularly instrumental in the
Ecologite
Peridotite
Pyroxenite
Metapelite
AmphiboliteGabbro
Mafic granuliteAnorthosite
Metagabbro(greenschist facies)
Intrusive granuliteQuartz mica schist
Felsic granulite
Felsic gneiss(amphibolite)
GraniteGranodiorite
Serpentinite
Quartzite
KimberlitesSediments
Mixedsediments
Hem
Mgt
Ga
R = 0.06–17.5
−Z = 20
Ccp / Sp + gSp
Ccp
Po + g
PnPo
Py + g
Density, in grams per cubic centimeter
2.5 3.0 3.5 4.0 4.5 5.0
8
7
6
5
Velo
city
, p, i
n ki
lom
eter
s pe
r sec
ond
200 MPa
Figure 7–6. Velocity values of various rock types and ore minerals plotted against their density with lines of constant acoustic impedance (Z) overlain within field. Superimposed also is the Nafe-Drake curve (shown in gray) for common rock types at a standard confining pressure of 200 MPa (MegaPascals) (modified from Salisbury and others, 2003). Represented in graph are values for pyrite (Py), pentlandite (Pn), pyrrhothite (Po), chalcopyrite (Ccp), sphalerite (Sp), hematite (Hm), and magnetite (Mgt); also shown are fields for host rock-ore mixtures. Galena is off the scale shown, having a velocity of 3.7 km/s and a density of 7.5 g/cm3. As shown, a reflection coefficient (R) of 0.06 will give a strong reflection in contrasting lithologies. From Salsibury and Snyder (2007).

128
7. Geophysical Characteristics of Volcanogenic M
assive Sulfide Deposits
figure 7.6--
seismic reflection profile at Bathurst
A.C.
Merensky Reef
UG2
100 METERS
Dept
h, in
kilo
met
ers
0.3
0.6
Distance, in kilometers
NORTH
SOUTH
D.B.
1.4 NORTH1.20.8 1.0SOUTH
Halfmile lake deposit
Dept
h, in
kilo
met
ers
0
0.5
1.0
100
200
300
400
Two-
way
trav
eltim
e, in
mill
isec
onds
Processing datumsurface
1 KILOMETER
0
1
2
3
4
WEST EAST
Halfmilelenses
3-D acousticimpedence target
HN99-119
D
Dept
h, in
kilo
met
ers
Figure 7–7. Seismic reflection profiles through volcanogenic massive sulfide (VMS) deposits. A, Seismic reflection profile showing a sulfide/platinoid-bearing Merensky Reef in the Bushveld Complex, South Afica; also shown (UG2) are strong reflectors representing a chromite layer in gabbroic cumulates. B, Three-dimensional seismic reflection profile over the Louvicourt VMS deposit, Val d’Or, Quebec. L shows location of the deposit; D is a reflection attributed to an alteration zone (modified from Adam and others, 2004; Salisbury and Snyder, 2007). C, Two-dimensional multichannel seismic image of the Halfmile Lake VMS deposit. D, Cross-section through a three-dimensional seismic cube showing the VMS deposit discovered using seismic methods at 1,300 m plus earlier discovered deposits at the Halfmile Lake VMS deposit. From Salisbury and Snyder (2007).

References Cited 129
first discovery at Flambeau, as were the VMS mineral deposit models developed in the Canadian Archean and Proterozoic areas.
The giant Kidd Creek VMS deposit near Timmins, Ontario, was also a concealed deposit that was discovered in 1959 following airborne electromagnetic surveys. Follow-up surveys at the “Kidd 55” anomaly with ground geophysics and drilling discovered one of the largest deposits in the world (Hannington and others, 1999). In this case, the publication of Oftedahl’s classic 1958 paper “A theory of exhalative-sedi-mentary ores” greatly influenced thinking during the explora-tion program at Kidd Creek, and the refined mineral deposit occurrence perspective (we would now call it an occurrence model) was very important in the discovery.
Conclusions
Volcanogenic massive sulfide mineralization occurs in volcanic, volcaniclastic, and sedimentary rocks, units that generally form low- to moderate-density strata. Volcanogenic massive sulfide mineralization results in the precipitation of pyrite, pyrrhotite, chalcopyrite, sphalerite, and galena, all minerals with high density values. The marked contrasts between the physical properties of minerals formed in associa-tion with VMS mineralization and their host rocks make VMS deposits ideally suited for geophysical exploration. Geophysi-cal surveys have played a critical role in mineral exploration (Bishop and Lewis, 1992). With depletion of VMS sources in surface or near-surface settings, exploration for VMS deposits must focus at much greater depths, which requires the more sophisticated techniques. Whereas potential field geophysical techniques have been highly successful in identifying VMS deposits at depths up to 300 m, high resolution seismic reflec-tion profiling can target much greater depths and has been key in identifying VMS deposits at depths greater than those traditionally mined.
References Cited
Adam, E., Milkereit, B., and Salmon, B., 2004, 3-D seismic exploration in the Val d’Or mining camp, Quebec, in Society of Exploration Geophysicists International Exposi-tion and 74th annual meeting, Denver, Colo., 10–15 Octo-ber 2004: Society of Exploration Geophysicists Technical Program Expanded Abstracts, v. 23, p. 1167–1170.
Babcock, R.C., 1996, History of exploration for volcanogenic massive sulfides in Wisconsin, in LaBerge, G.L., ed., Volca-nogenic massive sulfide deposits of northern Wisconsin—A commemorative volume, v. 2 of Institute on Lake Superior Geology 42d annual meeting, Cable, Wisc., 15–19 May 1996, Proceedings: St. Paul, Minn., The Institute, p. 1–15.
Bellefleur, G., Muller, C., Snyder, D., and Matthews, L., 2004, Downhole seismic imaging of a massive sulphide ore body with mode-converted waves, Halfmile Lake, New Bruns-wick: Geophysics, v. 69, p. 318–329.
Bishop, J.R., and Emerson, D.W., 1999, Geophysical proper-ties of zinc-bearing minerals: Australian Journal of Earth Sciences, v. 46, p. 311–328.
Bishop, J.R., and Lewis, R.J.G., 1992, Geophysical signatures of Australian volcanic-hosted massive sulfide deposits: Economic Geology, v. 87, p. 913–930.
Dahle, A., Gjoystday, H., Grammelvedt, G., and Soyland, H.T., 1985, Application of seismic reflection methods for ore prospecting in crystalline rock: First Break, v. 3, no. 2, p. 9–16.
Dubé, B., Gosselin, P., Mercier-Langevin, P., Hannington, M., and Galley, A., 2007, Gold-rich volcanogenic massive sul-phide deposits, in Goodfellow, W.D., ed., Mineral deposits of Canada—A synthesis of major deposit-types, district metallogeny, the evolution of geological provinces, and exploration methods: Geological Association of Canada, Mineral Deposits Division, Special Publication 5, p. 75–94.
Eaton, D., Guest, S., Milkereit, B., Bleeker, W., Crick, D., Schmitt, D., and Salisbury, M., 1996, Seismic imaging of massive Sulfide deposits—Part III. Borehole seismic imag-ing of near-vertical structures: Economic Geology, v. 91, p. 835–840.
Elliot, C.L., 1967, Some applications of seismic refraction techniques in mining exploration, in Musgrave, A.W., ed., Seismic refraction prospecting: Tulsa, Okla., Society of Exploration Geophysicists, p. 522–538.
Finn, C.A., and Morgan, L.A., 2002, High-resolution aero-magnetic mapping of volcanic terrain, Yellowstone National Park: Journal of Volcanology and Geothermal Research, v. 115, p. 207–231.
Ford, K., Keating, P., and Thomas, M.D., 2007, Overview of geophysical signatures associated with Canadian ore depos-its, in Goodfellow, W.D., ed., Mineral deposits of Canada—A synthesis of major deposit-types, district metallogeny, the evolution of geological provinces, and exploration methods: Geological Association of Canada, Mineral Deposits Divi-sion, Special Publication 5, p. 939–970.
Galley, A.G., Hannington, M., and Jonasson, I., 2007, Volca-nogenic massive sulphide deposits, in Goodfellow, W.D., ed., Mineral deposits of Canada—A synthesis of major deposit-types, district metallogeny, the evolution of geo-logical provinces, and exploration methods: Geological Association of Canada, Mineral Deposits Division, Special Publication 5, p. 141–161.

130 7. Geophysical Characteristics of Volcanogenic Massive Sulfide Deposits
Goulty, N.R., 1993, Controlled-source tomography for mining and engineering applications, in Iyer, H.M., and Hirahara, K., eds., Seismic tomography—Theory and practice: New York, Chapman and Hall, p. 797–813.
Grant, F.S., and West, G.F., 1965, Interpretation theory in applied geophysics: New York, McGraw-Hill Books Com-pany, 584 p.
Gustavsson, M., Ivansson, S., Moren, P., and Pihl, J.L., 1986, Seismic borehole tomography—Measurement system and field studies: Proceedings of the IEEE, v. 74, no. 2, p. 339–346.
Hannington, M.D., Barrie, C.T., and Bleeker, W., 1999, The giant Kidd Creek volcanogenic massive sulfide deposit, western Abitibi Subprovince, Canada—Summary and synthesis, in Hannington, M.D., and Barrie, C.T., eds., The Giant Kidd Creek volcanogenic massive sulfide deposit, western Abitibi subprovince, Canada: Economic Geology Monograph 10, p. 661–672.
Hannington, M.D., Galley, A.G., Herzig, P.M., and Petersen, S., 1998, Comparison of the TAG mound and stockwork complex with Cyprus-type massive sulfide deposits, in Herzig, P.M., Humphris, S.E., Miller, D.J., and Zierenberg, R.A., eds., TAG—Drilling an active hydrothermal system on a sediment-free slow-spreading ridge, site 957: Proceed-ings of the Ocean Drilling Program, Scientific Results, v. 158, p. 389–415.
Hunt, C.P., Moskowitz, B.M., and Banerjee, S.K., 1995, Mag-netic properties of rocks and minerals, in Ahrens, T.J., ed., Rock physics and phase relations—A handbook of physical constants: American Geophysical Union, p. 189–204.
Klein, C., and Hurlbut, C.S., 1985, Manual of mineralogy (after J.D. Dana): New York, John Wiley and Sons, 596 p.
McGaughey, W.J., McCreary, R.G., Young, R.P., and Maxwell, S.C., 1994, Mining applications of seismic tomography: Canadian Institute of Mining and Metallurgy Bulletin, vol. 87, no. 977, p. 49–56.
McIntosh, S.M., Gill, J.P., and Mountford, A.J., 1999, The geophysical response of the Las Cruces massive sulphide deposit: Exploration Geophysics, v. 30, no. 3–4, p. 123–133.
Milkereit, B., Eaton, D., Wu, J., Perron, G., and Salisbury, M., 1996, Seismic imaging of massive Sulfide deposits—Part II. Reflection seismic profiling: Economic Geology, v. 91, p. 829–834.
Oliveira, V., Matos, J., Bengala, M., Silva, N., Sousa, P., and Torres, L., 1998, Geology and geophysics as successful tools in the discovery of the Lagoa Salgada Orebody (Sado Tertiary Basin–Iberian Pyrite Belt), Grandola, Portugal: Mineralium Deposita, v. 33, p. 170–187.
Peter, J.M., Kjarsgaard, I.M., and Goodfellow, W.D., 2003, Hydrothermal sedimentary rocks of the Heath Steele Belt, Bathurst mining camp, New Brunswick—Part 1. Mineral-ogy and mineral chemistry, in Goodfellow, W.D., McCutch-eon, S.R., and Peter, J.M., eds., Massive sulfide deposits of the Bathurst mining camp, New Brunswick, and northern Maine: Economic Geology Monograph 11, p. 361–390.
Salisbury, M., Milkereit, B., and Bleeker, W., 1996, Seismic imaging of massive sulfide deposits—Part I. Rock proper-ties: Economic Geology, v. 91, p. 821–828.
Salisbury, M., and Snyder, D., 2007, Applications of seismic methods to mineral exploration, in Goodfellow, W.D., ed., Mineral deposits of Canada—A synthesis of major deposit-types, district metallogeny, the evolution of geological provinces, and exploration methods: Geological Association of Canada, Mineral Deposits Division, Special Publication 5, p. 971–982.
Shives, R.B.K., Charbonneau, B.W., and Ford, K.L., 1997, The detection of potassic alteration by gamma-ray spec-trometry—Recognition of alteration related to mineraliza-tion, in Gubins, A.G., ed., Geophysics and geochemistry at the millennium—Proceedings of Exploration 97, Fourth Decennial International Conference on Mineral Explora-tion: Toronto, Prospectors and Developers Association of Canada, p. 741–752.
Shives, R.B.K., Ford, K.L., and Peter, J.M., 2003, Mapping and exploration applications of gamma ray spectrometry in the Bathurst mining camp, northeastern New Brunswick, in Goodfellow, W.D., McCutcheon, S.R., and Peter, J.M., eds., Massive sulfide deposits of the Bathurst mining camp, New Brunswick, and northern Maine: Economic Geology Monograph 11, p. 819–840.
Telford, W.M., Geldart, L.P., and Sheriff, R.E., 1990, Applied geophysics (2d ed.): Cambridge, Cambridge University Press, 770 p.
Thomas, M.D., 1997, Gravity and magnetic prospecting for massive sulphide deposits—A short course sponsored under the Bathurst mining camp EXTECH II Initiative: Geologi-cal Survey of Canada Open File 3514, 66 p.

References Cited 131
Thomas, M.D., 2003, Gravity signatures of massive sulfide deposits, Bathurst mining camp, New Brunswick, Canada, in Goodfellow, W.D., McCutcheon, S.R., and Peter, J.M., eds., Massive sulfide deposits of the Bathurst mining camp, New Brunswick, and northern Maine: Economic Geology Monograph 11, p. 799–817.
Thomas, M.D., Walker, J.A., Keating, P., Shives, R., Kiss, F., and Goodfellow, W.D., 2000, Geophysical atlas of massive sulphide signatures, Bathurst mining camp, New Bruns-wick: Geological Survey of Canada Open File 3887, 105 p.
Tivey, M.A., Rona, P.A., and Kleinrock, M.C., 1996, Reduced crustal magnetization beneath relict hydrothermal mounds TAG hydrothermal field, Mid-Atlantic Ridge, 26oN: Geo-physical Research Letters, v. 23, p. 3511–3514.
Tivey, M.A., Rona, P.A., and Schouten, H., 1993, Reduced crustal magnetization beneath the active sulfide mound, TAG hydrothermal field, Mid-Atlantic Ridge at 26°N: Earth and Planetary Science Letters, v. 115, p. 101–115.
Tivey, M.A., and Schouten, H., 2003, A near-bottom magnetic survey of the Mid-Atlantic Ridge axis at 26oN—Implica-tions for the tectonic evolution of the TAG segment: Journal of Geophysical Research, v. 108, no. B5, 2277, 13 p., doi:10.1029/2002JB001967.
Tivey, M.K., Humphris, S.E., Thompson, G., Hannington, M.D., and Rona, P.A., 1995, Deducing patterns of fluid flow and mixing within the TAG active hydrothermal mound using mineralogical and geochemical data: Journal of Geophysical Research—Solid Earth, v. 100, no. B7, p. 12527–12555.
Tuach, J., Hewton, R.S., and Cavey, G., 1991, Exploration tar-gets for volcanogenic, base-metal sulphide deposits on Pil-ley’s Island, Newfoundland: Ore Horizons, v. 1, p. 89–98.
van Staal, C.R., 1994, Geology, Wildcat Brook, New Bruns-wick: Geological Survey of Canada, scale 1:20 000.
van Staal, C.R., Wilson, R.A., Rogers, N., Fyffe, L.R., Gower, S.J., Langton, J.P., McCutcheon, S.R., and Walker, J.A., 2003, A new geologic map of the Bathurst mining camp and surrounding areas—A product of integrated geological, geochemical, and geophysical data, in Goodfellow, W.D., McCutcheon, S.R., and Peter, J.M., eds., Massive sulfide deposits of the Bathurst mining camp, New Brunswick, and northern Maine: Economic Geology Monograph 11, p. 61–64.
Waboso, C.E., and Mereu, R.F., 1978, The feasibility of delin-eating non-layered anomalous velocity zones by a combina-tion of fan shooting and least-squares analysis: Canadian Journal of Earth Sciences, v. 15, no. 10, p. 1642–1652.