666.25 -- parametric linkage analysiscsg.sph.umich.edu/abecasis/class/666.25.pdf · zparametric...
TRANSCRIPT

Parametric Linkage Analysis
Biostatistics 666Lecture 25
Last Lecture
Elston Stewart Algorithm• Can handle large pedigrees• Proceeds one nuclear family at a time• Limited to small numbers of markers
Calculates conditional probabilities for sections of the pedigree
Today
Refresher on non-parametric analysis
Parametric linkage analysis• Evaluates a specific trait model
• Disease allele frequencies• Probability of disease for each genotype
Successfully mapped >1,000 rare disorders
Data for a Linkage Study
Pedigree• Set of individuals of known relationship
Observed marker genotypes• SNPs, VNTRs, microsatellites
Phenotype data for individuals

Linkage Analysis
Aims to relate sharing of specific chromosomal regions to phenotypic similarity
Parametric methods define explicit relationship between phenotypic and genetic similarity
Non-parametric methods test for increased sharing among affected individuals
Non-parametric Linkage Analysis
No specific model for disease locus
Evaluates whether segregation at specific locations is "not-random"
Specifically, the objective is to show increased IBD sharing among sets of affected individuals

Allele Sharing Analysis
Reject random sharing at a particular regionLess powerful than classic methods• When disease model is known
More robust than classic methods• When disease model is unknown
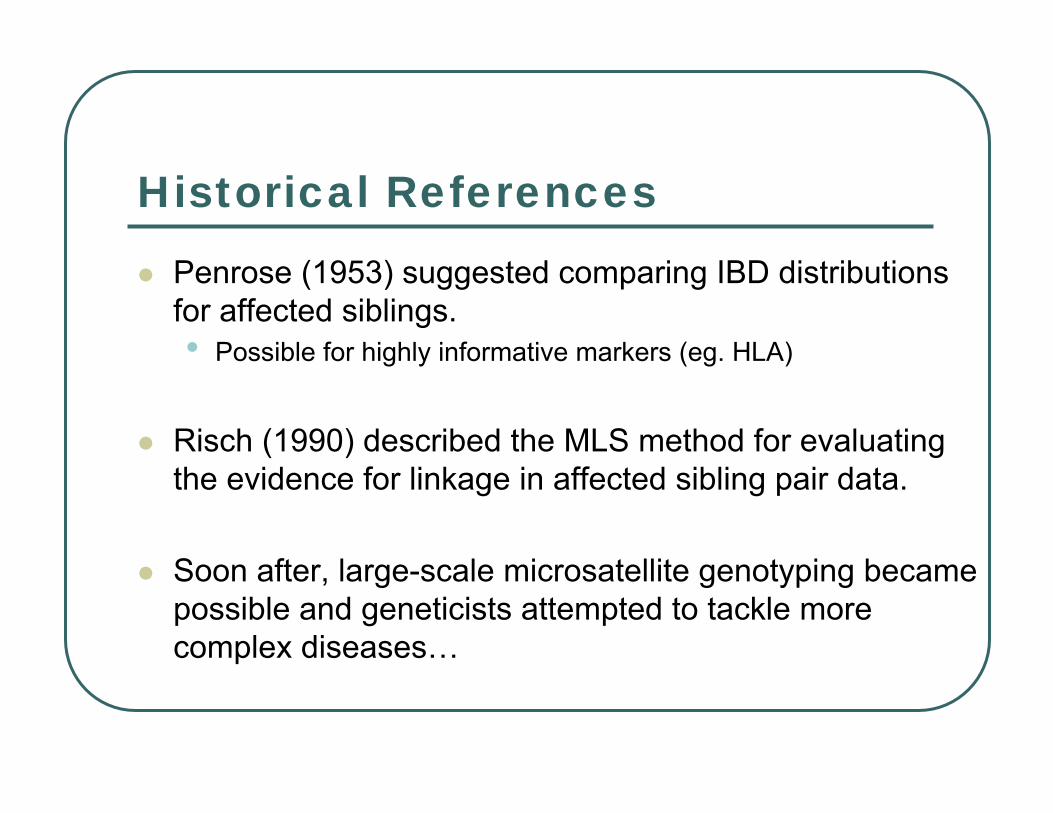
Historical ReferencesPenrose (1953) suggested comparing IBD distributions for affected siblings.• Possible for highly informative markers (eg. HLA)
Risch (1990) described the MLS method for evaluating the evidence for linkage in affected sibling pair data.
Soon after, large-scale microsatellite genotyping became possible and geneticists attempted to tackle more complex diseases…
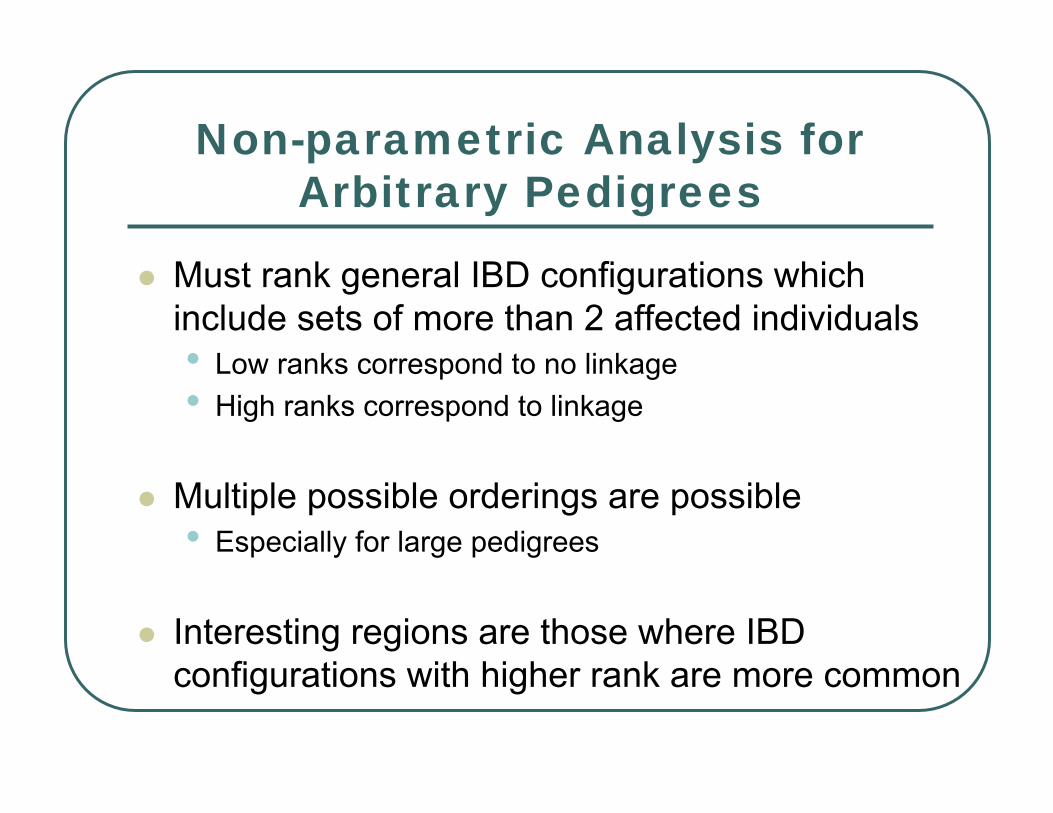
Non-parametric Analysis for Arbitrary Pedigrees
Must rank general IBD configurations which include sets of more than 2 affected individuals• Low ranks correspond to no linkage• High ranks correspond to linkage
Multiple possible orderings are possible• Especially for large pedigrees
Interesting regions are those where IBD configurations with higher rank are more common
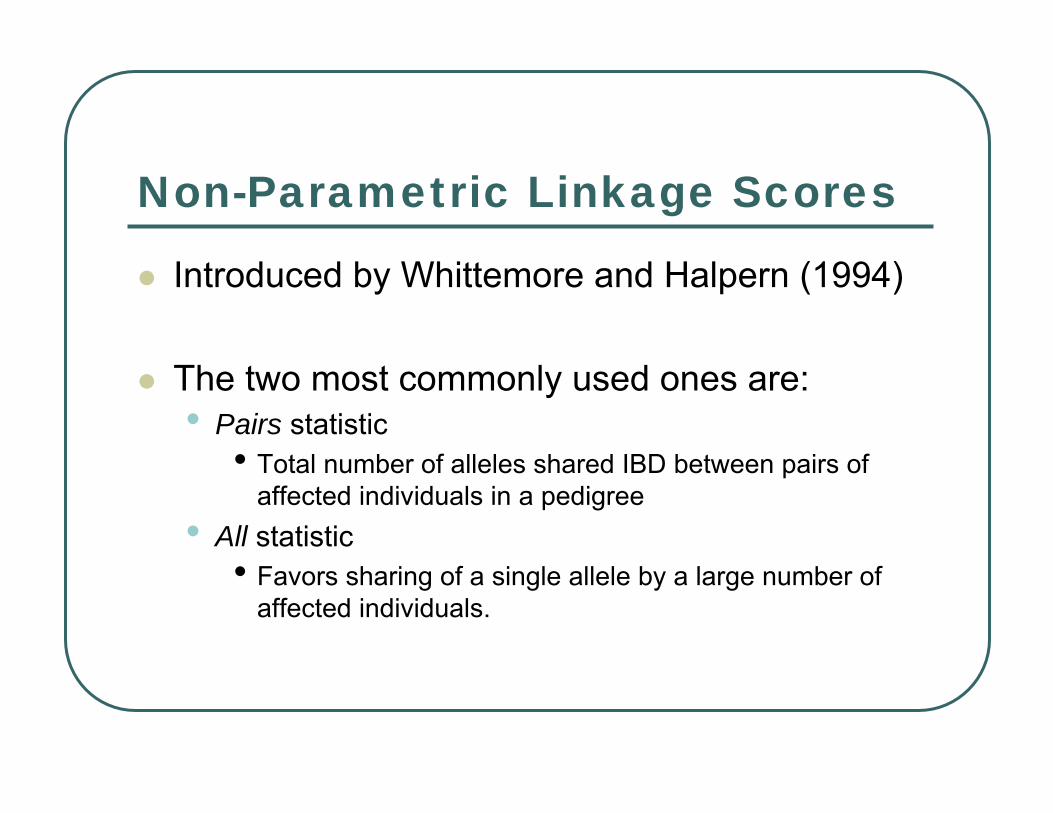
Non-Parametric Linkage Scores
Introduced by Whittemore and Halpern (1994)
The two most commonly used ones are:• Pairs statistic
• Total number of alleles shared IBD between pairs of affected individuals in a pedigree
• All statistic• Favors sharing of a single allele by a large number of
affected individuals.
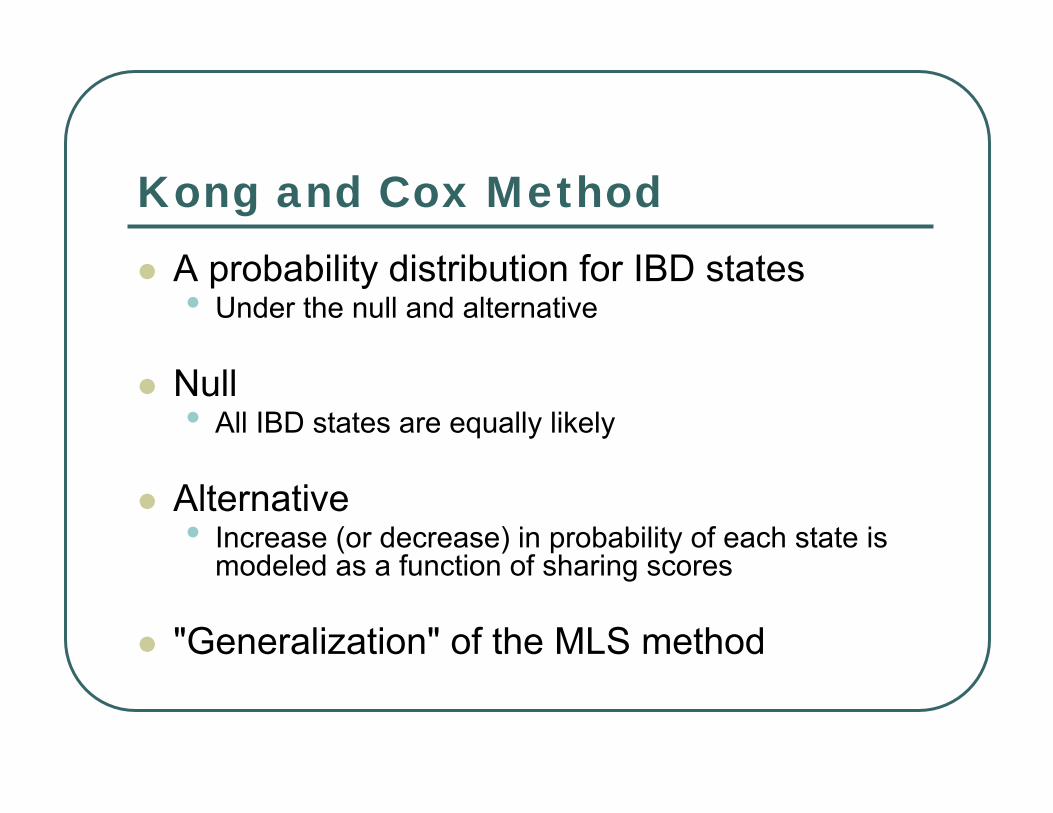
Kong and Cox MethodA probability distribution for IBD states• Under the null and alternative
Null• All IBD states are equally likely
Alternative• Increase (or decrease) in probability of each state is
modeled as a function of sharing scores
"Generalization" of the MLS method

Typical Plot forNPL Along Chromosome
Parametric Linkage Analysis
Requires a model for the disease• Frequency of disease allele(s)• Penetrance for each genotype
Typically employed for single gene disorders and Mendelian forms of complex disorders

Typical Interesting Pedigree

How it works…
Uses disease model to infer segregation of disease alleles through pedigree
Estimate the recombination fraction between disease locus and a genetic marker of known location• Summarize evidence for linkage (co-
segregation) in a LOD score
Two Point Analysis
Proceeds one marker at a time
Estimates the recombination fraction between each marker and disease locus
Trait model used to infer segregation of disease alleles
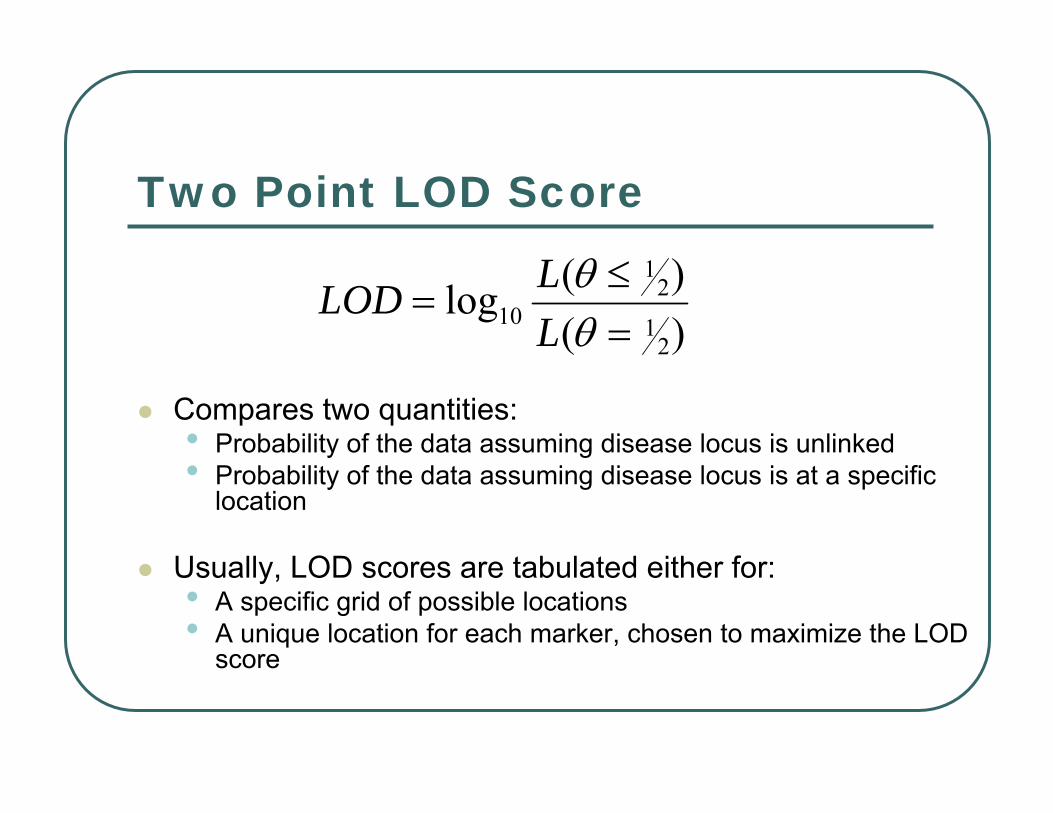
Two Point LOD Score
)()(log
21
21
10 =≤
=θθ
LLLOD
Compares two quantities:• Probability of the data assuming disease locus is unlinked• Probability of the data assuming disease locus is at a specific
location
Usually, LOD scores are tabulated either for:• A specific grid of possible locations• A unique location for each marker, chosen to maximize the LOD
score

Example:Track Segregation of Disease Allele
In this case, the model might specify an autosomal locus, with a very rare dominant allele with full penetrance.
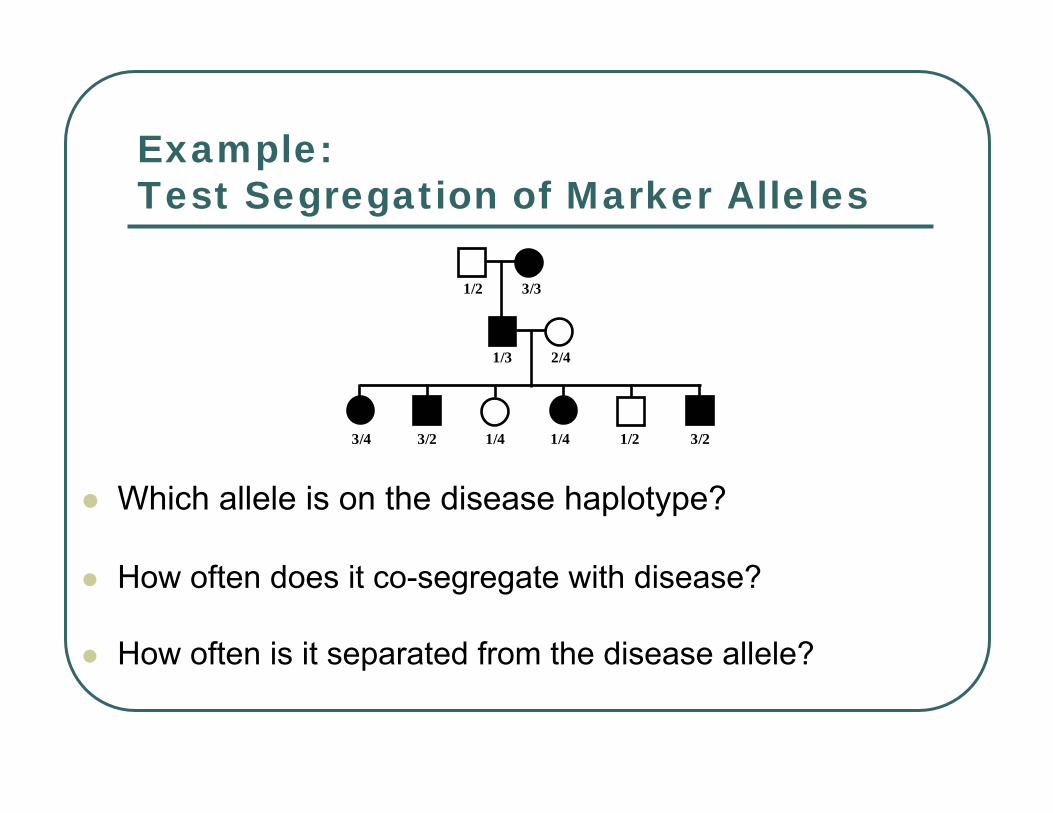
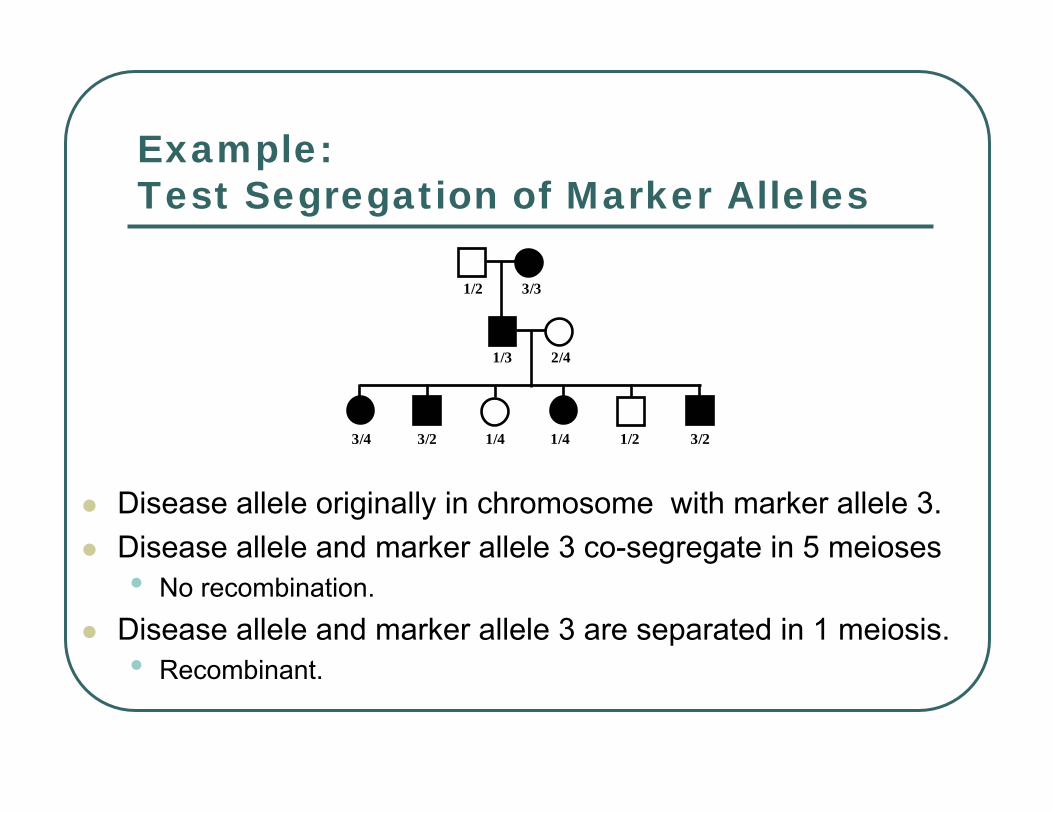
Example:Test Segregation of Marker Alleles
3/31/2
2/41/3
3/4 3/2 1/4 1/4 1/2 3/2
Which allele is on the disease haplotype?
How often does it co-segregate with disease?
How often is it separated from the disease allele?
Example:Test Segregation of Marker Alleles
3/31/2
2/41/3
3/4 3/2 1/4 1/4 1/2 3/2
Disease allele originally in chromosome with marker allele 3.Disease allele and marker allele 3 co-segregate in 5 meioses• No recombination.
Disease allele and marker allele 3 are separated in 1 meiosis.• Recombinant.
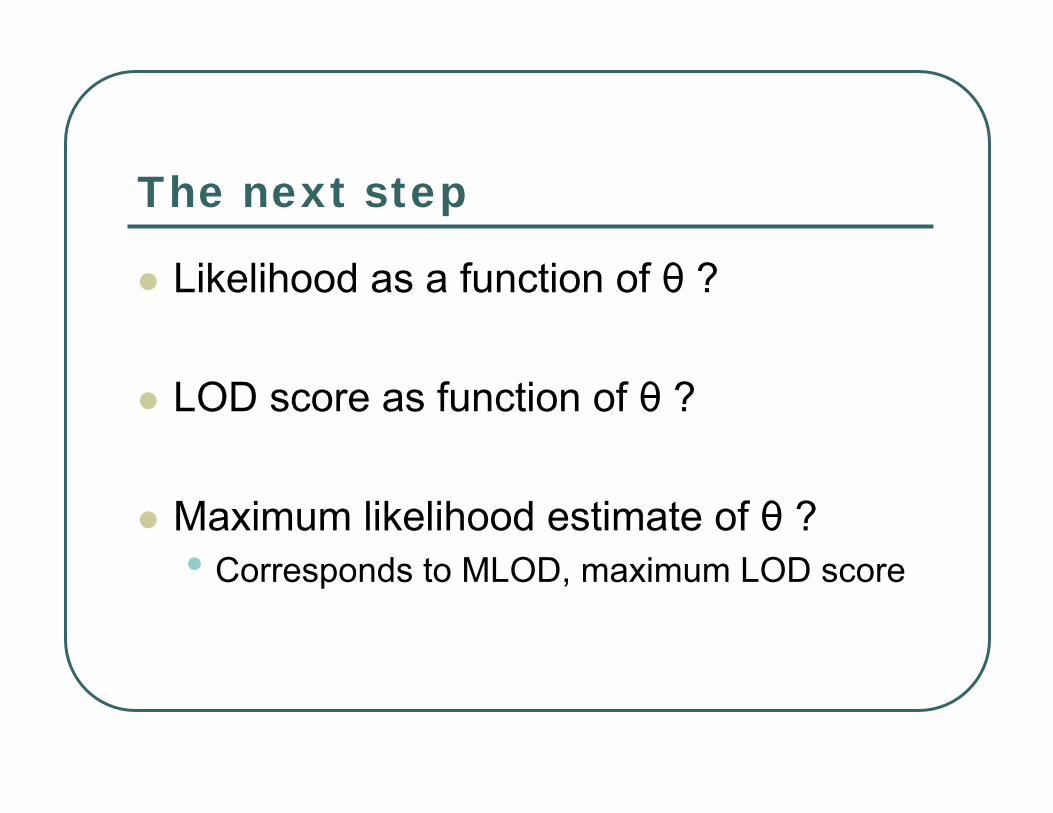
The next step
Likelihood as a function of θ ?
LOD score as function of θ ?
Maximum likelihood estimate of θ ?• Corresponds to MLOD, maximum LOD score
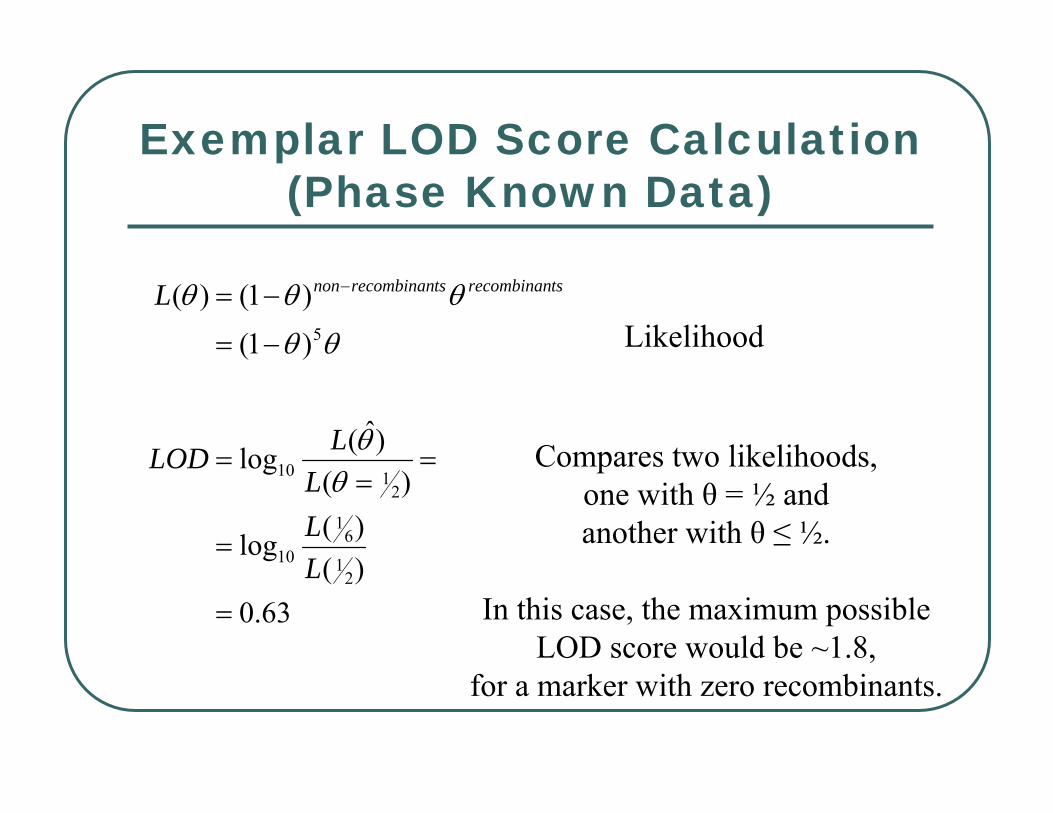
Exemplar LOD Score Calculation(Phase Known Data)
63.0)()(log
)()ˆ(log
)1()1()(
21
61
10
2110
5
=
=
==
=
−=
−= −
LLL
LLOD
L tsrecombinantsrecombinannon
θθ
θθ
θθθLikelihood
Compares two likelihoods, one with θ = ½ and another with θ ≤ ½.
In this case, the maximum possible LOD score would be ~1.8,
for a marker with zero recombinants.

Table of Two Point LOD Scores
A row could be added for each markerTypically, LOD = -∞ when θ = 0… why?Marker closest to disease locus has highest LOD• And relatively small θ
MLE0 0.1 0.2 0.3 0.4 0.5 0.167
L(θ) 0.000 0.059 0.066 0.050 0.031 0.016 0.067LOD(θ) -∞ 0.577 0.623 0.509 0.299 0.000 0.632
Recombination Fraction (Θ)
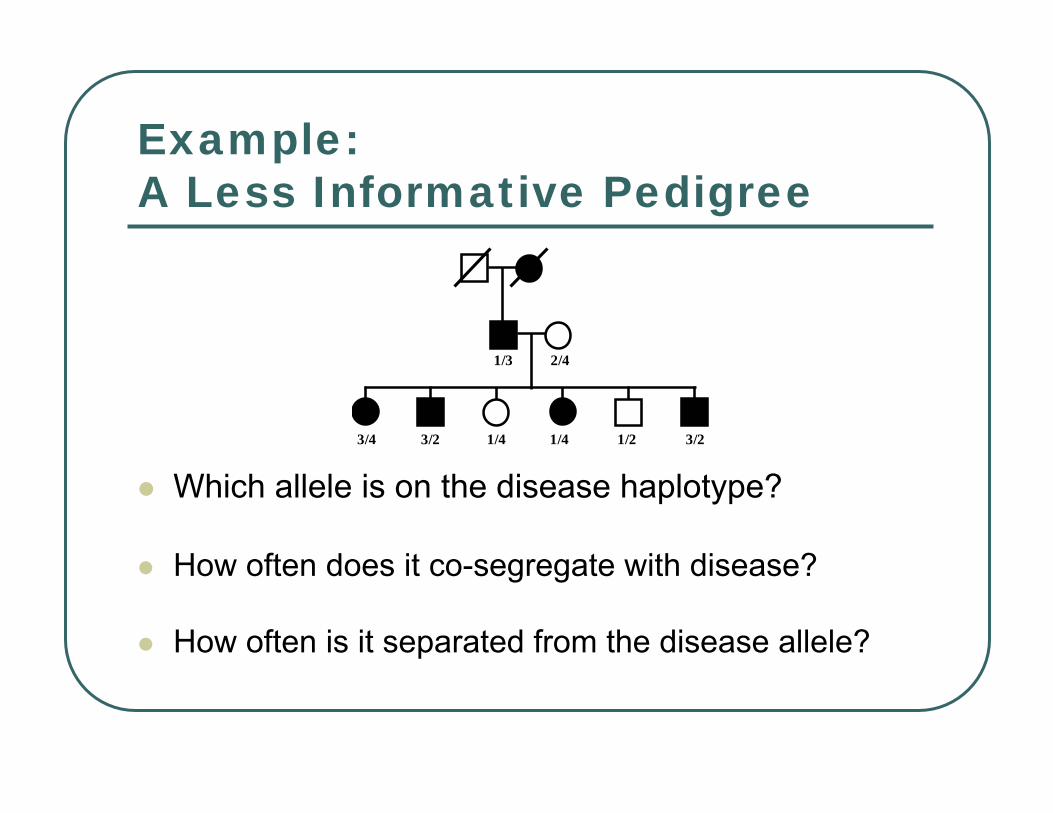
Example:A Less Informative Pedigree
Which allele is on the disease haplotype?
How often does it co-segregate with disease?
How often is it separated from the disease allele?
2/41/3
3/4 3/2 1/4 1/4 1/2 3/2

Example:A Less Informative Pedigree
Two possibilities: the disease allele might original occur in a chromosome with marker allele 3 or 1.Either 5 non-recombinants and 1 recombinant…… or 5 recombinants and 1 non-recombinant.
2/41/3
3/4 3/2 1/4 1/4 1/2 3/2

The next step
Likelihood as a function of θ ?
LOD score as function of θ ?
Maximum likelihood estimate of θ ?• Corresponds to MLOD, maximum LOD score
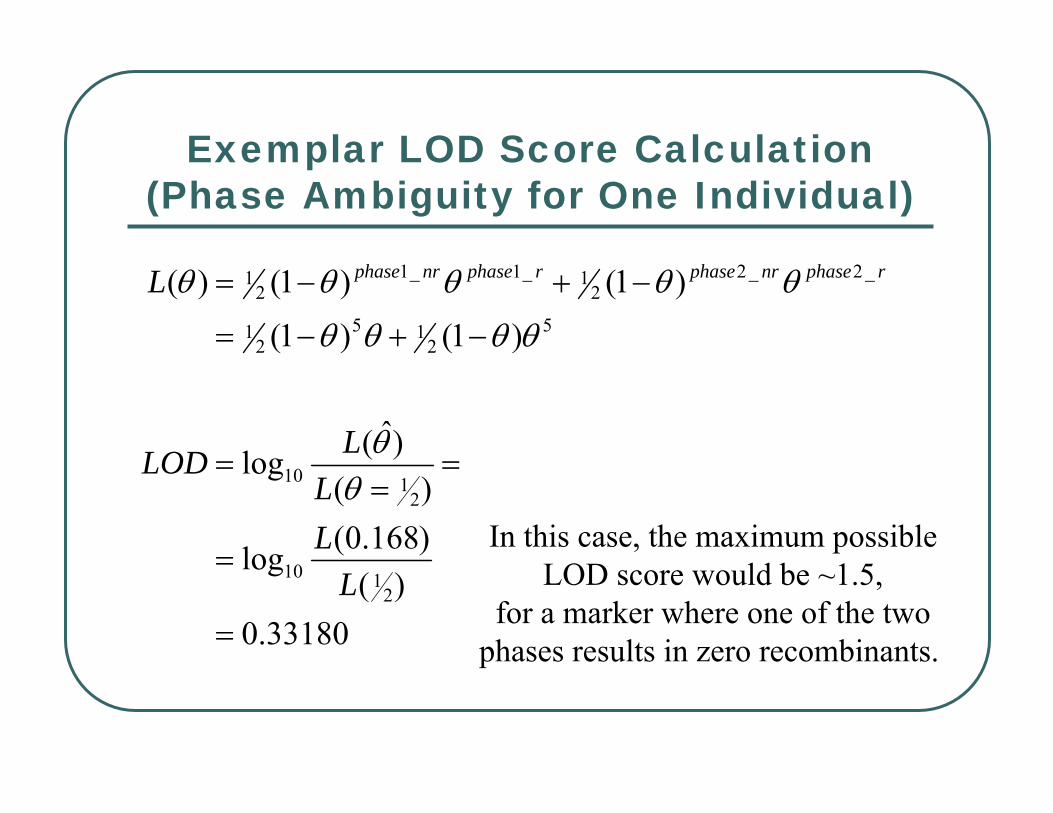
Exemplar LOD Score Calculation(Phase Ambiguity for One Individual)
33180.0)(
)168.0(log
)()ˆ(log
)1()1()1()1()(
2110
2110
52
152
1
_2_22
1_1_12
1
=
=
==
=
−+−=
−+−=
LLL
LLOD
L rphasenrphaserphasenrphase
θθ
θθθθ
θθθθθ
In this case, the maximum possibleLOD score would be ~1.5,
for a marker where one of the twophases results in zero recombinants.
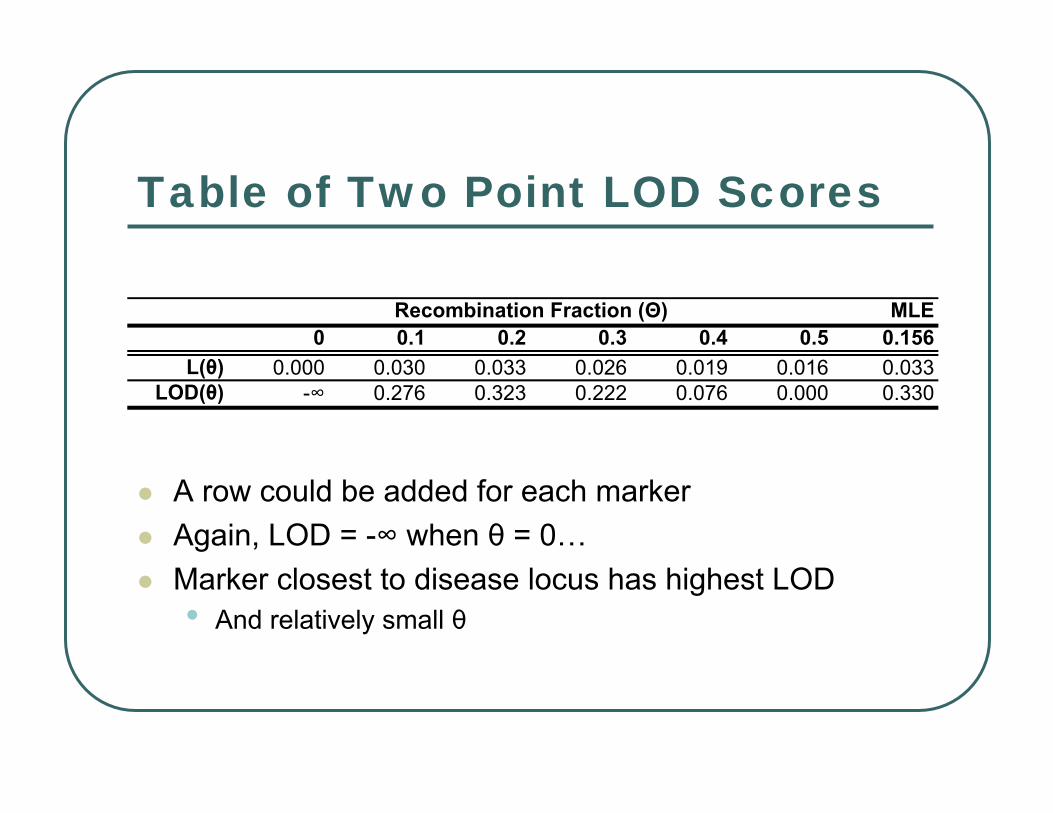
Table of Two Point LOD Scores
A row could be added for each markerAgain, LOD = -∞ when θ = 0…Marker closest to disease locus has highest LOD• And relatively small θ
MLE0 0.1 0.2 0.3 0.4 0.5 0.156
L(θ) 0.000 0.030 0.033 0.026 0.019 0.016 0.033LOD(θ) -∞ 0.276 0.323 0.222 0.076 0.000 0.330
Recombination Fraction (Θ)
In practical settings …LOD score calculations require evaluating and summing over many alternatives …• Segregation patterns for disease locus• Phases for ambiguous individuals• Alternatives for missing genotypes
Penetrances may vary between individuals or groups of individuals
Nowadays, LOD calculations are usually left to specialized computer programs…• Using either the Elston-Stewart or Lander-Green

An Uninformative Pedigree
For some markers, it may not be possible to count recombinants at all…
3/31/3
2/43/3
3/4 3/2 3/4 3/4 3/2 3/2
Multipoint AnalysisMost markers will not be informative for all the meiosis of interest
LOD scores will vary with θ and marker informativeness
Multipoint analysis uses a map of genetic markers to reconstruct inheritance along a chromosome.• Calculate LOD score by comparing each possible
location to an unlinked locus.
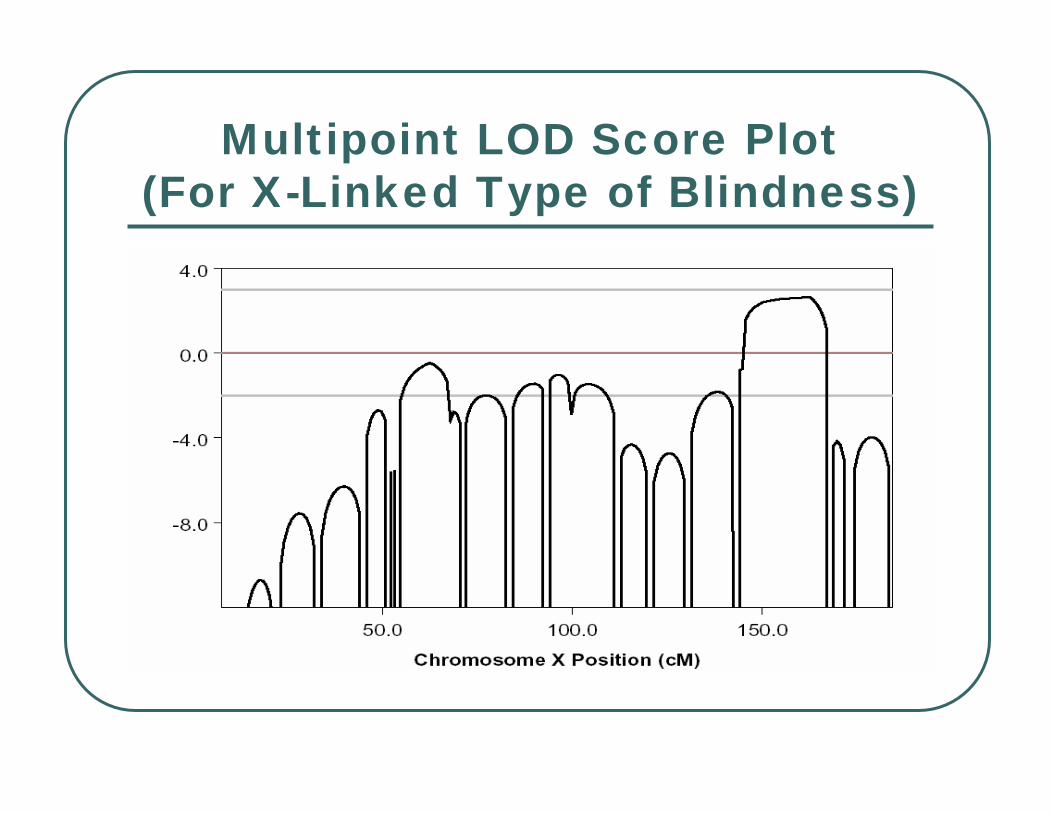
Multipoint LOD Score Plot(For X-Linked Type of Blindness)
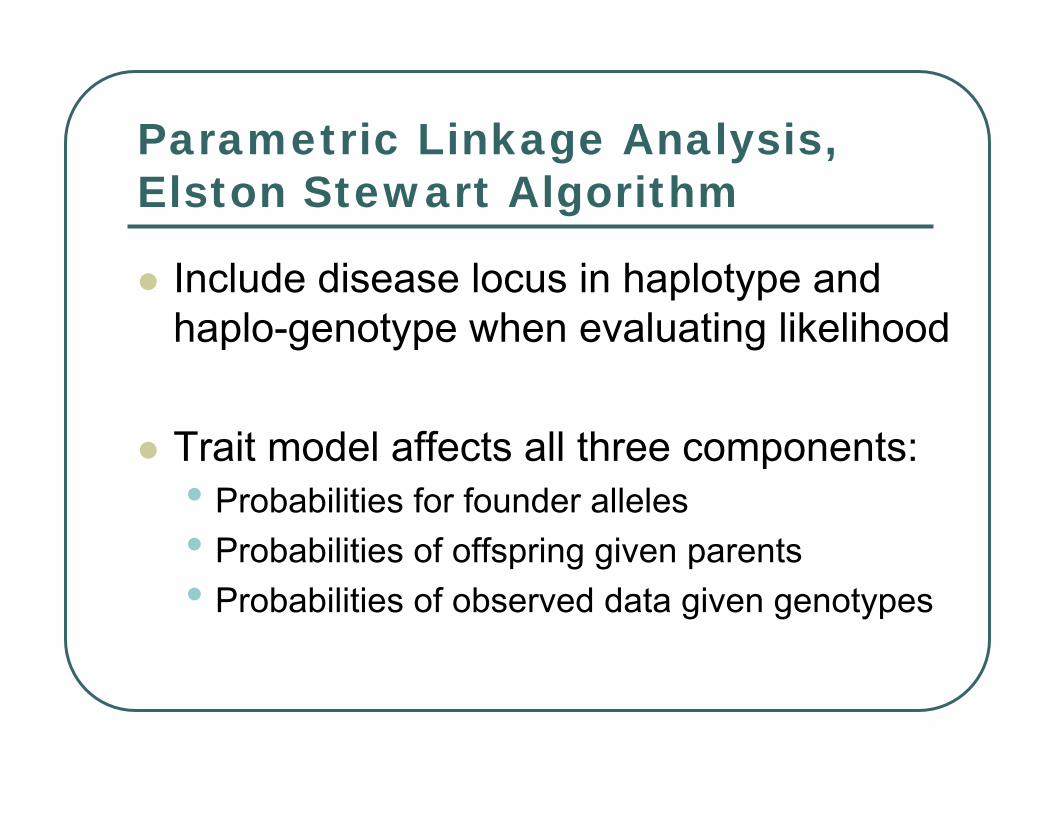
Parametric Linkage Analysis,Elston Stewart Algorithm
Include disease locus in haplotype and haplo-genotype when evaluating likelihood
Trait model affects all three components:• Probabilities for founder alleles• Probabilities of offspring given parents• Probabilities of observed data given genotypes
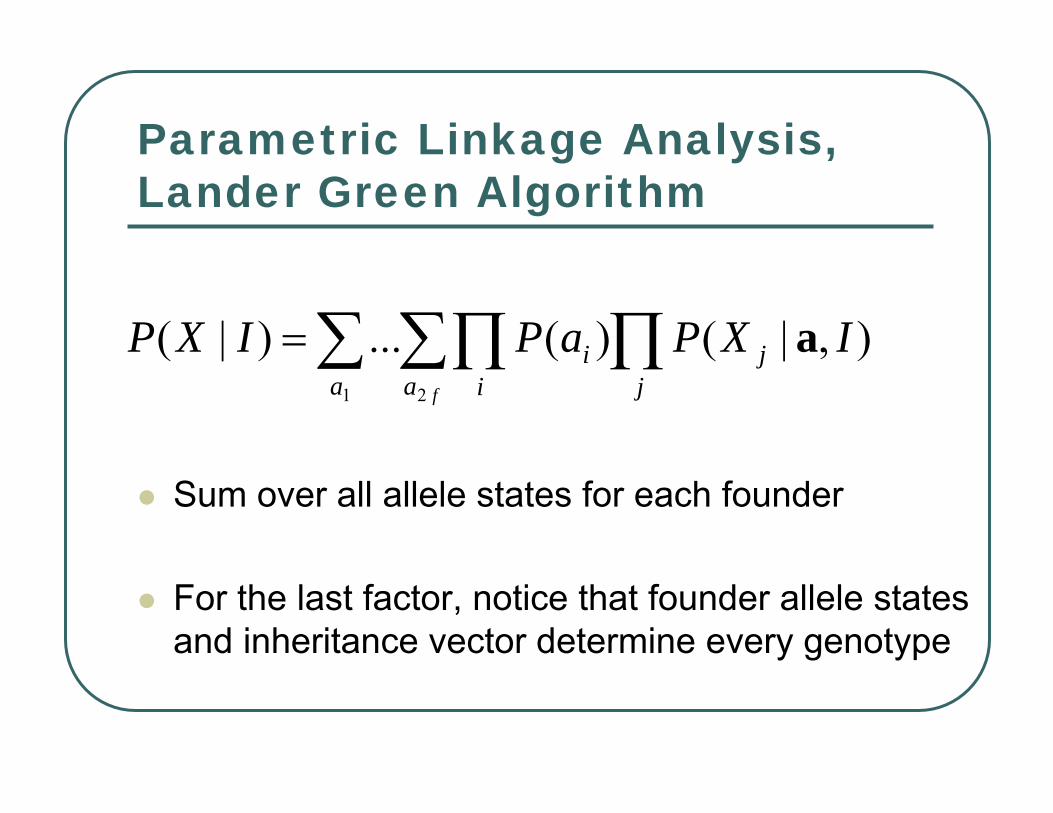
Parametric Linkage Analysis,Lander Green Algorithm
∑ ∑ ∏∏=1 2
),|()(...)|(a a j
ji
if
IXPaPIXP a
Sum over all allele states for each founder
For the last factor, notice that founder allele states and inheritance vector determine every genotype
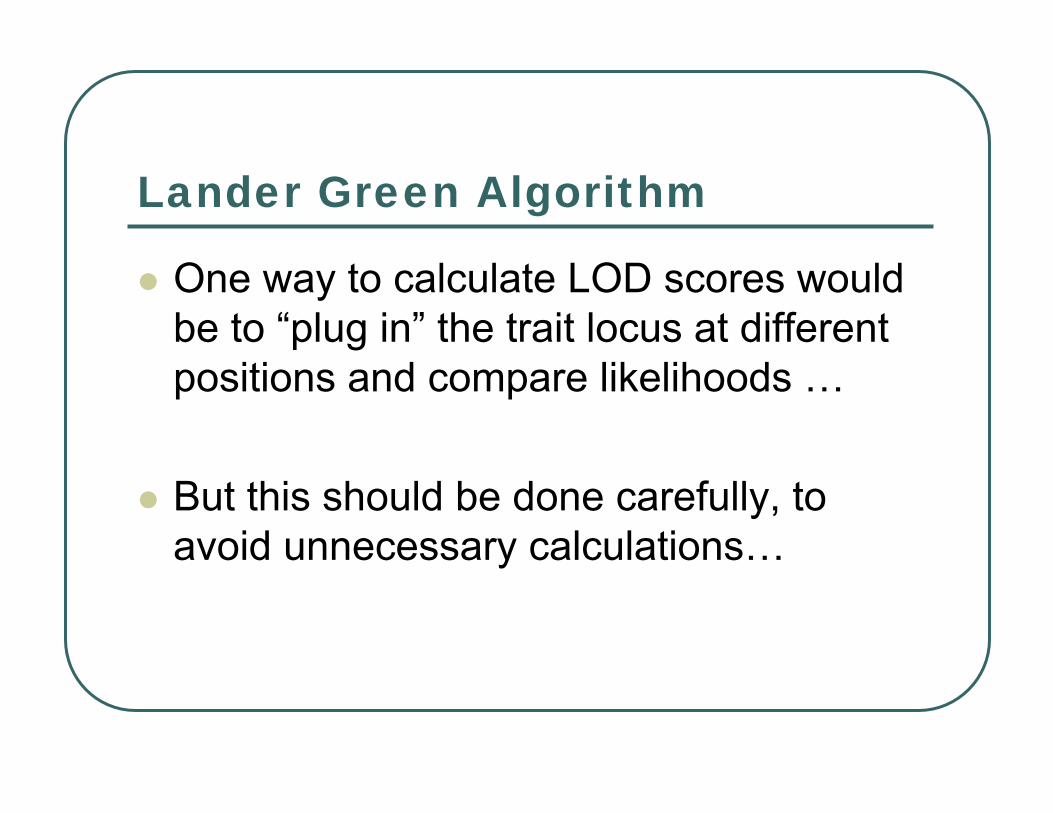
Lander Green Algorithm
One way to calculate LOD scores would be to “plug in” the trait locus at different positions and compare likelihoods …
But this should be done carefully, to avoid unnecessary calculations…
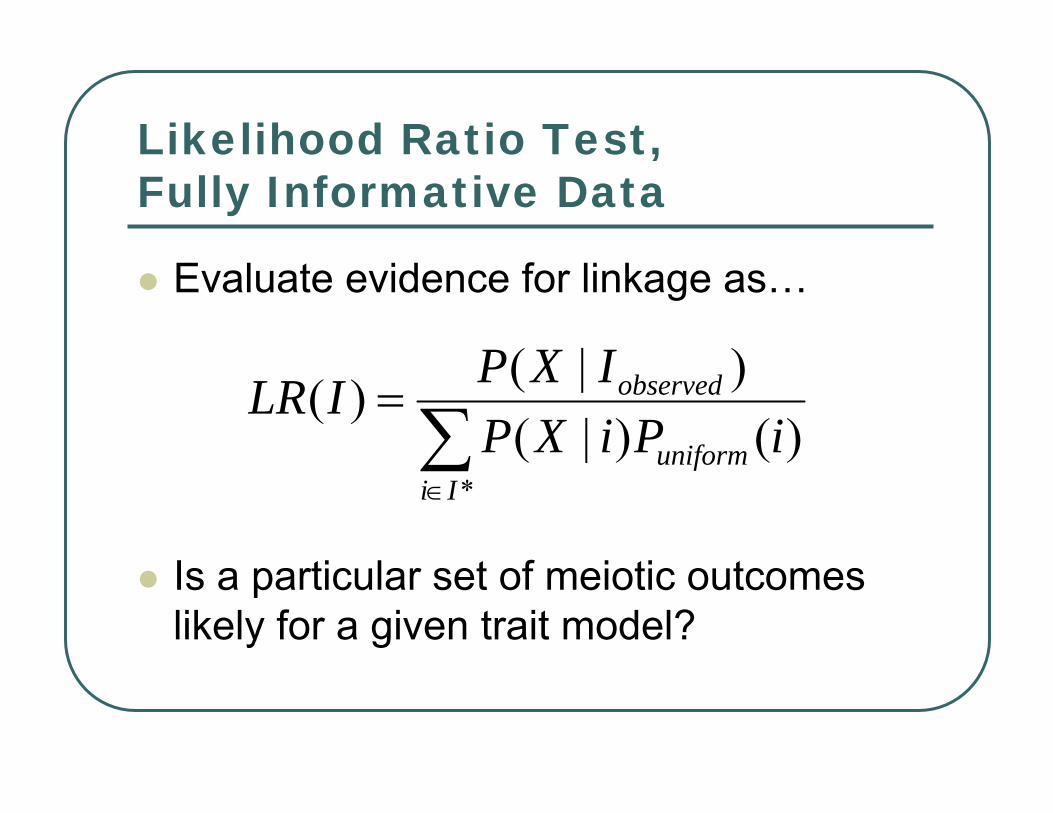
Likelihood Ratio Test,Fully Informative Data
Evaluate evidence for linkage as…
Is a particular set of meiotic outcomes likely for a given trait model?
∑∈
=
*)()|(
)|()(
Iiuniform
observed
iPiXPIXPILR
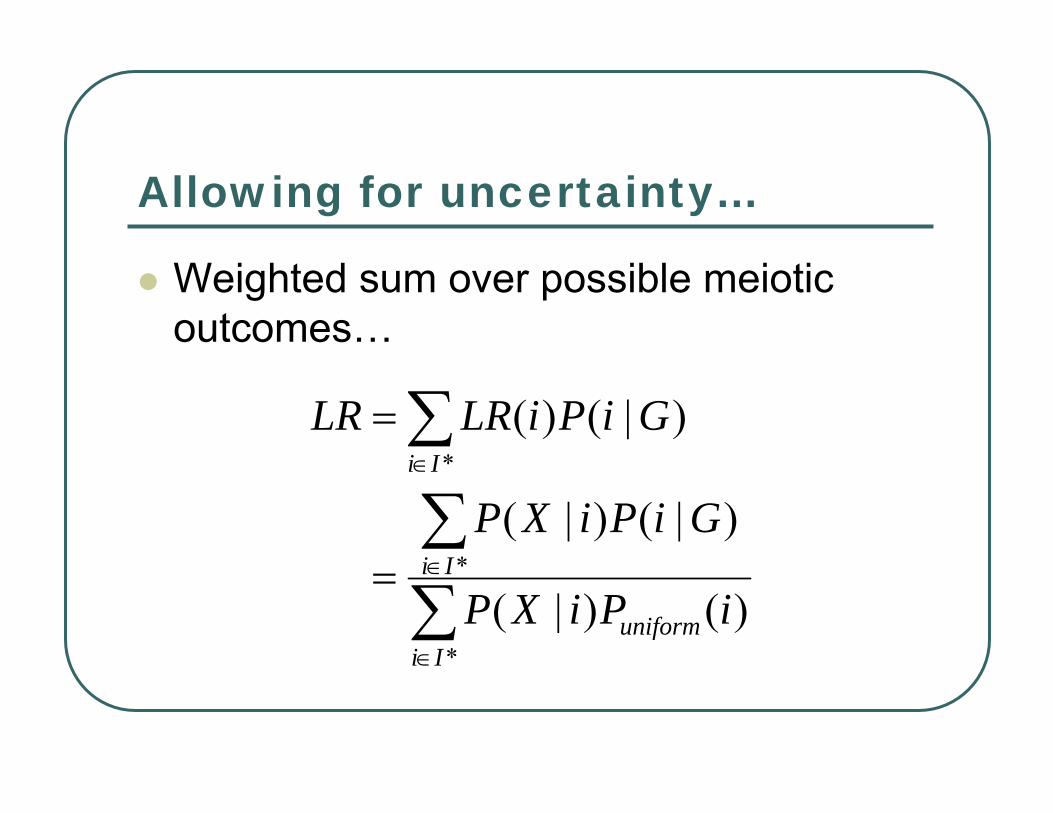
Allowing for uncertainty…
Weighted sum over possible meiotic outcomes…
∑∑
∑
∈
∈
∈
=
=
*
*
*
)()|(
)|()|(
)|()(
Iiuniform
Ii
Ii
iPiXP
GiPiXP
GiPiLRLR

Concepts for Today …
Parametric linkage analysis
Two-point analysis
Multipoint analysis
Mapping of Mendelian traits

Polio Symposium on Tuesday
Rackham Auditorium, 9:30• No class!
Polio used to affect 1:5,000 children
Award in memory of Thomas Francis, Jr., of the University of Michigan School of Public Health, who directed field trials for the vaccine