6.6 design 6.6.1 design manual, standards and codes 6.6.2 ... · 6.6 design 6.6.1 design manual,...
TRANSCRIPT

PECEM INDUSTRIAL AND PORT COMPLEX DEVELOPMENT PLAN FINAL REPORT IN THE FEDERATIVE REPUBLIC OF BRAZIL VOLUME II
6.6 Design
6.6.1 Design Manual, Standards and Codes Brazil does not have its own specified Design Manual or Standards for the offshore port facility. Up to now, international design manuals such as the British Standards, Shore Protection Manual, Japanese Design Manual, etc. have been applied for previous individual port projects.
In this study, the Japanese Design Manual (Technical Standards and commentaries on Port and Harbour Facilities in Japan, 1999) has been basically adopted for the design of port facilities. In addition, the Shore Protection Manual (1977, 1984) has also been referred to for some specific parts.
6.6.2 Design Criteria
(1) Tide Conditions For the design of existing offshore port facilities, the following tide conditions were adopted as the design criteria.
HHWL +3.20 m
LLWL (DSN) 0.00 m
HWL +2.70 m
LWL +0.30 m
From the tidal observations, which have been continuously conducted by INPH, no remarkable change of tendency has been observed. Therefore, the same conditions as in the past have been applied as the design criteria.
(2) Estimation of Design Waves
The design wave height for existing breakwater at Pecém port was originally determined as Hs=2.4m with a return period of 50 years using the wave observation data at Mucuripe port for the 5 years from 1991 to 1995 by INPH (1997). In this report, it is mentioned that the double exponential function was finally applied as the extreme distribution function for data fitting as a measure of safety. Afterward, the design wave height was reviewed after obtaining wave observation data for two years at Pecém port (INPH, 1999), and modified to Hs=3.0m considering the difference of wave height between Mucuripe and Pecém port.
In this study, the design waves have been re-examined using the wave observation data at Pecém for the seven years from 1997 to 2003. Here, each set of wave data has been increased 10% for safety considering the insufficient observation period for the analysis of extreme waves and the possibility that there are some differences between the actual wave height and the one obtained by the surface mounted buoy-type wave equipment. Three kinds of extreme distribution functions were employed; the Fisher-Tippett type I (Double exponential or Gumbel), the Fisher-Tippett type II (Frechet) and the Weibull distributions according to Goda (2000). The procedure to estimate the offshore design wave height is as follows.
MAIN REPORT 6 - 62 CHAPTER 6

PECEM INDUSTRIAL AND PORT COMPLEX DEVELOPMENT PLAN FINAL REPORT IN THE FEDERATIVE REPUBLIC OF BRAZIL VOLUME II
Selection of extreme values for each wave direction from wave observation data inPecém for seven years
Conversion of the wave height at the observation point with the depth of 18m to offshore wave height (H0) considering shoaling
Prediction of the offshore wave height with each return period by using extreme statistics analysis for each wave direction
Adoption of the wave height with a return period of 50 years as the design offshore wave height
The design wave period has been calculated using the correlation between the wave height and the period under severe wave conditions for each wave direction.
Table 6.6.1 shows the calculated offshore wave heights with each return period for each wave direction. The offshore design wave height and the design wave height for incident waves at the depth of 18m are summarized in Table 6.6.2.
Table 6.6.1 Offshore Wave Heights with Each Return Period
1 1.8 2.1 2.2 2.2 2.9 2.75 2.0 2.3 2.5 2.3 3.0 2.8
10 2.0 2.4 2.6 2.3 3.1 2.950 2.1 2.4 2.8 2.3 3.2 2.9100 2.1 2.4 2.8 2.4 3.2 2.9200 2.1 2.5 2.9 2.4 3.3 3.0
H0 (m) with n yearreturn period N NNE NE ENE E ESE
Table 6.6.2 Design Wave Heights (offshore and -18m depth)
H0 (m) 2.1 2.4 2.8 2.3 3.2 2.9H1/3 (=Hs) (m)
(at -18m depth)2.1 2.4 2.9 2.1 2.9 2.7
Tp (s) 13.7 14.2 15.9 7.7 7.7 7.7
T1/3(=Tp/1.05) (s) 13.0 13.5 15.1 7.3 7.3 7.3
ENE E ESEReturn Period(Year) N NNE NE
(3) Design Wave Height inside the Basin
It is necessary to decide the design wave height at each point inside the basin for the design study of quaywalls and revetments. Assuming the construction of these facilities located inside the breakwater will be commenced after obtaining the sheltering effect due to newly constructed breakwaters, the design wave height inside the basin can be calculated using the design wave height for incident waves shown in Table 6.6.3 and the wave height Rate (H/Hi) for each point obtained by the numerical
MAIN REPORT 6 - 63 CHAPTER 6

PECEM INDUSTRIAL AND PORT COMPLEX DEVELOPMENT PLAN FINAL REPORT IN THE FEDERATIVE REPUBLIC OF BRAZIL VOLUME II
computation of wave tranquillity shown in Table 6.6.4. Table 6.6.5 shows the calculated design wave height for each point (shown in Figure 6.5.3).
If the construction of port facilities inside the basin will commence before the construction of offshore breakwaters, the presumed wave height during the construction period without the sheltering effect due to the breakwater should be taken as the design wave height for incident waves shown in Table 6.6.3.
Table 6.6.3 Design Wave Heights for Incident Waves (18m depth) N NNE NE ENE E ESE
2.1 2.4 2.9 2.1 2.9 2.7
Design WaveHeight at -18m
depth
Table 6.6.4 Wave Height Rate for Each Point Point No N NNE NE ENE E ESE
1 0.19 0.19 0.12 0.08 0.10 0.11 2 0.06 0.06 0.04 0.03 0.05 0.06 3 0.21 0.21 0.13 0.07 0.10 0.13 4 0.14 0.14 0.09 0.05 0.07 0.08 5 0.43 0.43 0.23 0.18 0.20 0.22 6 0.32 0.32 0.17 0.11 0.15 0.18 7 0.68 0.68 0.32 0.21 0.23 0.24 8 0.62 0.62 0.30 0.18 0.21 0.24 9 0.09 0.09 0.10 0.06 0.06 0.06
10 0.12 0.12 0.15 0.10 0.12 0.13 11 0.07 0.07 0.04 0.03 0.04 0.04 12 0.12 0.12 0.07 0.09 0.10 0.10 13 0.07 0.07 0.05 0.05 0.05 0.05
Table 6.6.5 Design Wave Height Inside Basin
Point No. N NNE NE ENE E ESE1 0.40 0.46 0.35 0.17 0.29 0.30 2 0.13 0.14 0.12 0.06 0.15 0.16 3 0.44 0.50 0.38 0.15 0.29 0.35 4 0.29 0.34 0.26 0.11 0.20 0.22 5 0.90 1.03 0.67 0.38 0.58 0.59 6 0.67 0.77 0.49 0.23 0.44 0.49 7 1.43 1.63 0.93 0.44 0.67 0.65 8 1.30 1.49 0.87 0.38 0.61 0.65 9 0.19 0.22 0.29 0.13 0.17 0.16
10 0.25 0.29 0.44 0.21 0.35 0.35 11 0.14 0.16 0.11 0.06 0.10 0.11 12 0.25 0.29 0.20 0.19 0.29 0.27 13 0.15 0.17 0.15 0.11 0.15 0.14
(4) Seismic Load
The seismic disturbance is reportedly very small around Fortaleza. Considering the local condition and safety of structural stability, the seismic coefficient has been determined at 0.05 (kh) for structural design.
MAIN REPORT 6 - 64 CHAPTER 6

PECEM INDUSTRIAL AND PORT COMPLEX DEVELOPMENT PLAN FINAL REPORT IN THE FEDERATIVE REPUBLIC OF BRAZIL VOLUME II
(5) Subsoil Conditions According to the results of previous boring tests and seismic surveys, the trunk foundation is composed of gneiss. The strength of gneiss fluctuates due to its own characteristics. The upper stratum is covered by sediments composed of sand and silt. The thickness of the sediment layers varies irregularly from 0 to 16m for both the onshore-offshore and alongshore directions and it is difficult to presume the thickness of the sediment layer as a certain value. The N -values for the sediment layer also vary from less than 10 up to more than 50.
For structural designing, the soil characteristics for each layer have been determined as below.
Table 6.6.6 Preliminary Design Soil Parameters Stratum Composition N-Value Unit Weight
γt(kN/m3)Int. Friction
Angle Comp.
Strength (N/mm2)
Upper Stratum Sand 10 to 50 18 30° -
Lower Stratum Gneiss Over 50 18 35° >100
6.6.3 Design of Breakwaters
(1) Selection of Structural Type of Breakwaters There are two structural types of breakwaters called “conventional rubble mound breakwater and “berm breakwater”. The existing offshore breakwater is a berm breakwater. The berm breakwater is usually constructed with a berm that is allowed to reshape into an S-shape. When the quarry can’t provide stones large enough for a conventional rubble mound breakwater a berm breakwater may be an economical alternative because berm breakwaters allow better and more economical utilization of quarry yield than conventional type breakwaters. For that reason, berm breakwaters have recently been increasing in the world, especially in Northern Europe. In Brazil, the breakwater at Pecém Port was second berm type to be constructed.
PIANC (2003) has issued a report from a working group concerning a design method for berm rubble mound breakwaters, but no authorized design manual has been issued as of this writing. The specifications for the existing breakwater at Pecém port, such as crest elevation, crown width and size of armour rocks have been decided based on the physical model test using a 3-dimensional wave basin in INPH.
There is an advantage to obtain a large amount of stones at a low price from the neighbouring quarry site, which is located about 20km from Pecém port. For that reason, a berm breakwater is the best structural type selection, taking into account the construction cost. Basically, the same type of berm breakwater with the same specifications have been selected for the proposed breakwater for the long-term development plan, because the specifications for the existing breakwater were chosen based on many hydraulic model tests by INPH. But some of these specifications have been changed due to operational problems during the implementation work. A design study of berm breakwaters has been conducted in this study. Further, the possibility to adopt the conventional rubble mound breakwater has been also examined.
MAIN REPORT 6 - 65 CHAPTER 6

PECEM INDUSTRIAL AND PORT COMPLEX DEVELOPMENT PLAN FINAL REPORT IN THE FEDERATIVE REPUBLIC OF BRAZIL VOLUME II
(2) Crest Elevation of Breakwater According to the Japanese Design Manual (1999), in a harbour where the water area behind the breakwater is so wide that wave overtopping can be allowed to some extent, the crest elevations of the breakwaters is set at 0.6 times significant wave height (H1/3) above high water levels (HWL). Following this, the required crest elevation for the offshore breakwater has been calculated as:
+2.7m (HWL) + 0.6*2.9m (H1/3) ≒ +4.5m
The crest elevation of the existing breakwater was originally designed to be +4.0m at the berm part and +6.0m at the crown part based on the physical model testing by INPH. After commencement of the implementation work, the crest elevation has been changed to +6.0m at the berm part and +8.0m at the crown part because of operational problems with the earthwork during the construction of the upper part of the breakwater (SEINFRA, 2001). If the rubble discharging is done using barges, this problem may not occur. Considering both the original design for the existing breakwater and the result as calculated according to the Japanese Design Manual, the crest elevation for the proposed new breakwaters has been set at +4.0m at the berm part and +6.0m at the crown part, the same as the original design for the existing breakwater.
In the proposed layout of the breakwaters, there shall be seawall portions with the section about 350m and 800m where the container yard and multi-purpose berth are connected. In this section, wave overtopping should be prevented. Following the Japanese Design Manual, in a harbour where the water area behind the breakwater is small, overtopping waves should be prevented as much as possible. Hence the crest elevation of breakwaters is set at 1.25 times significant wave height (H1/3) above high water levels (HWL). Applying this guideline, the required crest elevation can be estimated as:
+2.7m (HWL) + 1.25*2.9m (H1/3) ≒ +6.8m
According to above estimation, the crest elevation at the seawall portion has been set at +6.0m at the berm part and +8.0m at the crown part, the same as the existing breakwater.
The permissible rate of wave overtopping q (m3/m*s) as a function of the degree of importance of the hinterland is presented in the Japanese Design Manual. According to this, the permissible rate of wave overtopping to the areas where there is a high concentration of houses, public facilities etc. behind the seawall have to maintain a value of less than 0.01(m3/m*s). The rate of wave overtopping with the crest elevation of +8.0m is calculated to be in the order of 10-4 (m3/m*s), and this value is a great deal less than the permissible rate mentioned above.
(3) Berm Width of the Breakwater
The berm width for the breakwater was decided considering the degree of recession (Rec) as shown in Figure 6.6.1, because the berm breakwater can be allowed to reshape into a statically or dynamically stable profile. The formula to predict the value of Rec has been proposed in PIANC (2003) based on the physical model tests. Applying this formula, Rec can be calculated to be about 3m. However, Rec exceeding 3m was observed during the preliminary study in a physical model test,
MAIN REPORT 6 - 66 CHAPTER 6

PECEM INDUSTRIAL AND PORT COMPLEX DEVELOPMENT PLAN FINAL REPORT IN THE FEDERATIVE REPUBLIC OF BRAZIL VOLUME II
especially at the corner section, where Rec exceeding 8m was observed (SEINFRA, 2001). There is significant variation in the Rec values as calculated, those produced by experimental models and actual field results. Therefore, it is not appropriate to estimate only from the calculation. Considering this point, the crown height for the new breakwater has been set the same as the existing breakwater.
Figure 6.6.1 Definition of Recession (Rec)
(4) Slope Gradient of Breakwater
The slope gradient for a rubble mound type breakwater is normally more than 1:1.5 on the seaward side of the breakwater. The slope gradient for the existing breakwater was set at 1:1.25 considering the characteristics of the stones and the construction method. Though this slope gradient is steeper than usual in a rubble mound type breakwater, it hasn’t seemed to have caused any problems concerning the stability of breakwater to date. From this, the slope gradient for the new breakwater has also been set at 1:1.25 in order to reduce the quantity of rock required.
(5) Size of Armour Stones The size of the armour stones for the existing breakwater was determined as below based on the physical model test together with consideration of the quarry condition and economy of construction cost.
East- West Breakwater: 1 to 6 ton North-South Breakwater: 1 to 4 ton
The size of the armour stones is estimated using the Hudson formula as below.
The stability number Ns can be transferred by using a slope angle α as below.
Where, KD is the stability coefficient. The stability coefficients for stones with rough angular shapes for each percentage of damaged stones have been presented in the Shore Protection Manual (1977) as shown in Table 6.6.7 (A revised edition was published in 1984, but the stability coefficient for the same condition (Rough angular and non-breaking) has not been changed).
MAIN REPORT 6 - 67 CHAPTER 6

PECEM INDUSTRIAL AND PORT COMPLEX DEVELOPMENT PLAN FINAL REPORT IN THE FEDERATIVE REPUBLIC OF BRAZIL VOLUME II
Table 6.6.7 Stability Coefficient (KD) for Stones with Rough Angular Shape 5-10% 10-15%
Breaking Wave Non Breaking Non Breaking Non Breaking
Rough angular 3.5 4 4.9 6.6
0-5%
On the other hand, the roughly estimated stability number for each category of berm breakwater has been presented in PIANC (2003) as shown in Table 6.6.8.
Table 6.6.8 Stability Number (Ns) for each category of berm breakwater Category Non reshaping Reshaping Static stable Reshaping, dynamic stable
Ns <1.75 1.75 - 2.7 >2.7
As a result of stability coefficient calculations for 3 ton average size of armour stones and with the design wave height at Pecém, it was obtained that this size of stones corresponds to a 5 to 10 % damage rate as shown in Table 6.6.7. If 0 to 5 % damage percentage is selected as the same design concept for conventional breakwaters, the required size of armour stones is calculated as 4 ton. From this, armour stones of 1 to 6 ton each are applied for the berm breakwater, which are the same as the existing. For the conventional breakwater, armour stones of 4 to 6 ton each is applied. Further investigation is necessary to judge the possibility to obtain bigger size of stones than before from the presumed quarry site.
(6) Proposed Breakwaters and Representative Dimensions The location of each breakwater is shown in Figure 6.6.2. For the West and sub breakwaters, which are connected continuously to the existing breakwater, the berm type breakwaters with the same dimensions as the exiting breakwaters have been proposed to minimize the wave overtopping to the newly constructed berth. For the main breakwaters, the conventional type of breakwaters has been proposed to reduce the volume of rocks. The representative dimensions and size of armour stones are summarized in Table 6.6.9.
West Breakwater
Main Breakwater(North Part)
Main Breakwater(East Part)
Sub Breakwater
Figure 6.6.2 Location of Breakwaters
MAIN REPORT 6 - 68 CHAPTER 6

PECEM INDUSTRIAL AND PORT COMPLEX DEVELOPMENT PLAN FINAL REPORT IN THE FEDERATIVE REPUBLIC OF BRAZIL VOLUME II
Table 6.6.9 Representative Dimensions of berm breakwater
Type
West Breakwater 800m Extension of WestBreakwater 300m North Part 1520m
Sourth Breakwater 968m Sub Breakwater(inc. Sea Wall Part) 620m East Part 1240m
Total 1768m Total 920m Total 2760m
Crown Part +8.00 Crown Part +8.00 +6.00
Berm Part +6.00 Berm Part +6.00
Crown Part 10m Crown Part 10m
Berm Part 5m Berm Part 5m
Slope Part 8m Slope Part 8m
Total 23m Total 23m
Slope Gradient
Item
1:1.25 1:1.25 1:1.5 (for outer) 1:1.25(for inner)
Crown Part 5m
Crown Part
Conventional Type
Long Term Development PlanWest and Sub Breakwater Main Breakwater
1-6ton 4-6ton1-6ton (for West Breakwater)
Length
Crest Elevation
Crown Width
Size ofArmour Rock 1-4ton (for Sourth Breakwater)
Berm Type Berm Type
Existing
(7) Standard Section of Breakwaters The typical cross sections of each breakwater at the trunk portion are shown in Figures 6.6.3 to 6.6.5.
5.00 8.00 10.00
+ 6.0
+ 3.20 (HHWL)
0.00 (DHN)
+ 8.0
-16.50
1~6 t/unit
1~6 t/unit
28.13
1:1. 25
5~100kg/unit200~500kg/unit
-6.00
30.625
1~6 t/u
n it
200~500kg /unit
Figure 6.6.3 West Breakwaters (Berm Type)
MAIN REPORT 6 - 69 CHAPTER 6

PECEM INDUSTRIAL AND PORT COMPLEX DEVELOPMENT PLAN FINAL REPORT IN THE FEDERATIVE REPUBLIC OF BRAZIL VOLUME II
5.00
1:1.25
8.00 10.00
+ 6.0
+ 3.20 (HHWL)
0.00 (DHN)
+ 8.0
-16.50
1~6 t/unit
1~6 t/unit
28.13
1:1. 25
+ 6.00
Geotextile Sheet
5~100kg/unit
(reclamation)
200~500kg/unit-6.00
30.625
6.00Drainage of WaveOvertopping
Figure 6.6.4 Seawall Portion (Berm Type)
5.00
1:1 .25
33.7528.13
+ 3.20 (HHWL)
0.00 (DHN)
+ 6.0
-16.50
22.5
0
4~6 t/unit
4~6 t/u
nit
200~500 kg/unit200~
500 kg /un it
1:1.5
5~100kg/unit
6.00
SeawardLeeward
Figure 6.6.5 Main Breakwater (Conventional Type)
6.6.4 Design of Quaywall
(1) Design Parameters
1) Ship Particulars
The berth structures have been designed to receive the expected maximum size of vessels. The maximum size vessels for the proposed long-term development plan are described below.
MAIN REPORT 6 - 70 CHAPTER 6

PECEM INDUSTRIAL AND PORT COMPLEX DEVELOPMENT PLAN FINAL REPORT IN THE FEDERATIVE REPUBLIC OF BRAZIL VOLUME II
Table 6.6.10 Design Vessel Size for Berths of Outer Port Berth Design Depth Vessel Type Vessel Size
(DWT) LOA Breadth Draft
Container -16m Post-Panamax 104,700(7200TEU) 347 42.8 14.5
Multi-Purpose -13m Panamax 51,000 182 32.2 12
Fruits -13m Reefer Ship 6,100 134 15.8 7.6
Grain -16m Capesize 114,000 266 40.56 14.5
2) Surcharge The surcharge on each berth has been determined taking account of operational conditions for each berth. The loads from cranes and cargo handling equipment have been presumed as below considering the commodities handled and operational methods. The multi- purpose and fruit berth (Pier No.3) is planned for use as a temporary container berth in the first phase of the short-term development and two gantry cranes will be installed. These two gantry cranes will be transferred from Pier No.3 to the newly constructed container berth in the second phase of short-term development.
Table 6.6.11 Surcharge Condition
Berth Crane Load Uniform Load(Normal)
Container Gantry Crane (40LT, Out Reach 50m)920t (52t/m for each Rail) 30 KN/m2
Grain Loader 2,500 t/hr, Unloader 700 t/hr 30 KN/m2
100 KN/m2
Gantry Crane (40LT, Out Reach 50m)920t (52t/m for each Rail)
Mobile Harbour Crane(HMK-360)470ton (16.8 t/wheel)
Multi-Purposeand Fruit
3) Elevation of Quaywall The head elevation of the quaywall shall be set at an appropriate height that is suitable for the main dimension of the target vessel and the natural conditions. According to the Japanese port design manual (1999), the following value can be used for the head elevation of the quaywall.
Table 6.6.12 Typical Head Elevation of Quaywall above the High Water Level When the tide range is
3.0m or moreWhen the tide range is
less than 3m
for large vessel +0.5 to 1.5 m +1.0 to +2.0m
for small vessel +0.3 to 1.0 m +0.5 to 1.5m
(Technical Standards and commentaries of Port and Harbour Facilities in Japan, 1999)
MAIN REPORT 6 - 71 CHAPTER 6

PECEM INDUSTRIAL AND PORT COMPLEX DEVELOPMENT PLAN FINAL REPORT IN THE FEDERATIVE REPUBLIC OF BRAZIL VOLUME II
The head elevation of existing Pier No.1 was set at +6.88m. This value is higher than the above standard and other neighbouring ports as shown in Table 6.6.13.
Table 6.6.13 Head Elevation for Neighbouring Port Port Max of Tide Min of Tide Berth Type Quay Elevation
Suape +2.7 -0.2 Bulk Cargo +4.6
Salvador unkown unkown Container +4.0
Oil +4.8
General Cargo +4.5
Itaqui +7.0 -0.2 Bulk Cargo +9.5
Mucuripe +3.2 0.0
For the pier structure type, it is necessary to consider the uplift force due to waves. The proposed new quaywalls can be protected from all directional incident waves by the newly constructed breakwaters, and the elevation can be lower than present pier No.1. Considering this together with the present elevation of existing port facility, the head elevation for Pier No.3 for the multi-purpose and fruit berth has been set at +5.5m. The head elevation for the new container berth has been set as +4.7m considering the concrete caisson structure type as mentioned in the next paragraph.
4) Mooring Forces Bollards should be installed along the berth front to withstand the following mooring forces corresponding to the displacement tonnage of design vessels listed in Table 5.8.14.
Table 6.6.14 Line Pull Force on Bollard Ship Displacement Line Pull Force
Up to 100,000 ton 1,000 KN
Up to 200,000 ton 1,500 KN
Over 200,000 ton 2,000 KN
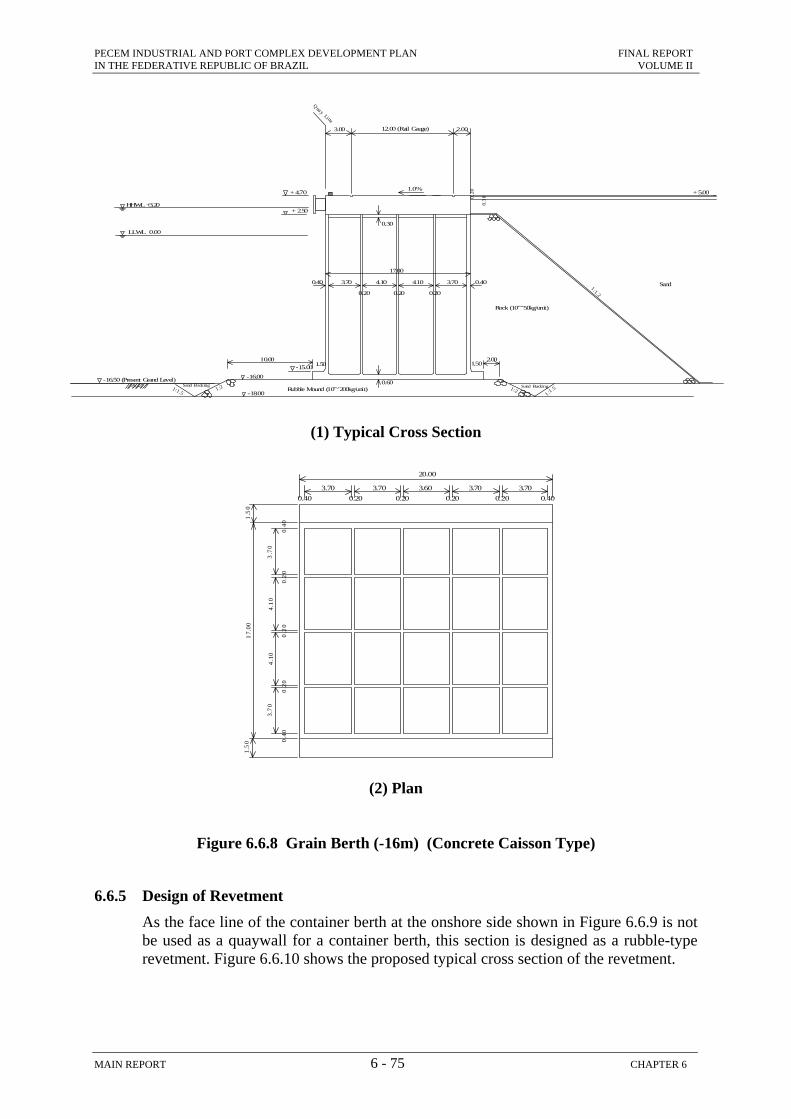
(2) Quaywall Structural Type A pill pier type with vertical piles was selected for existing pier No.1 considering the shipping, geological, operational and construction conditions. The same structural type has been proposed for the Multi-Purpose and Fruit Berth (Pier No.3) in consideration of the urgent implementation schedule. On the other hand, according to the subsoil condition around the existing offshore port facilities, there is a possibility to select concrete caisson type structures. From cost estimate mentioned in section 6.7, the quaywall for the concrete caisson type has a lower price than that for pile pier type. Therefore, the concrete caisson type structures have been proposed for the Container and Grain Berths. The proposed structure types for the Multi-Purpose and Fruit Berth (Pier No.3), Container Berth and Grain berth are shown in Figures 6.6.6 to 6.6.8.
MAIN REPORT 6 - 72 CHAPTER 6

PECEM INDUSTRIAL AND PORT COMPLEX DEVELOPMENT PLAN FINAL REPORT IN THE FEDERATIVE REPUBLIC OF BRAZIL VOLUME II
+5.75
+3.00
+5.50
LWL 0.00m
HWL+3.20m
(1) Typical Cross Section
(2) Plan of Pier Deck
+6.00+5.75
+3.00
+5.50
LWL 0.00m
HWL+3.20m
(3) Typical Cross Section Pier No.3
Figure 6.6.6 Multi-Purpose and Fruit Berth (-16m) (pier No.3) (Pile Pier Type)
MAIN REPORT 6 - 73 CHAPTER 6

PECEM INDUSTRIAL AND PORT COMPLEX DEVELOPMENT PLAN FINAL REPORT IN THE FEDERATIVE REPUBLIC OF BRAZIL VOLUME II
HWL+3.20m
LWL-0.02m
(1) Typical Cross Section
20.00
0.20 0.40
0.40
0.20
0.40
1.50
3.70
4.90
3.70
1.50
1.35
0
3.70 3.70 3.70 3.703.600.200.200.200.40
0.20
(2) Plan
Figure 6.6.7 Container Berth (-16m) (Concrete Caisson Type)
MAIN REPORT 6 - 74 CHAPTER 6
PECEM INDUSTRIAL AND PORT COMPLEX DEVELOPMENT PLAN FINAL REPORT IN THE FEDERATIVE REPUBLIC OF BRAZIL VOLUME II
1.0%
3.00
HHWL+3.20
LLWL 0.00
-16.00
12.00 (Rail Gauge)
1:1.2
-18.00
+4.70
3.70 4.10 3.70
0.20
0.40
0.30
1 :21:1.5
1.501.50
17.00
Rubble Mound (10~200kg/unit)
Rock (10~50kg/unit)
Sand Backing 0.60
+ 2.50
-16.50 (Present Grand Level)
2.0010.00
1 :1 .51:2Sand Backing
-15.00
0.20
0.30
QuayLine
0.20
0.40 Sand
+5.00
0.20
4.10
2.00
(1) Typical Cross Section
20.00
0.40 0.20
0.40
0.20
1.50
3.70
4.10
1.50
17.0
0
3.70 3.70 3.70 3.703.60
4.10
3.70
0.20 0.20 0.20 0.40
0.20
0.20
0.40
(2) Plan
Figure 6.6.8 Grain Berth (-16m) (Concrete Caisson Type)
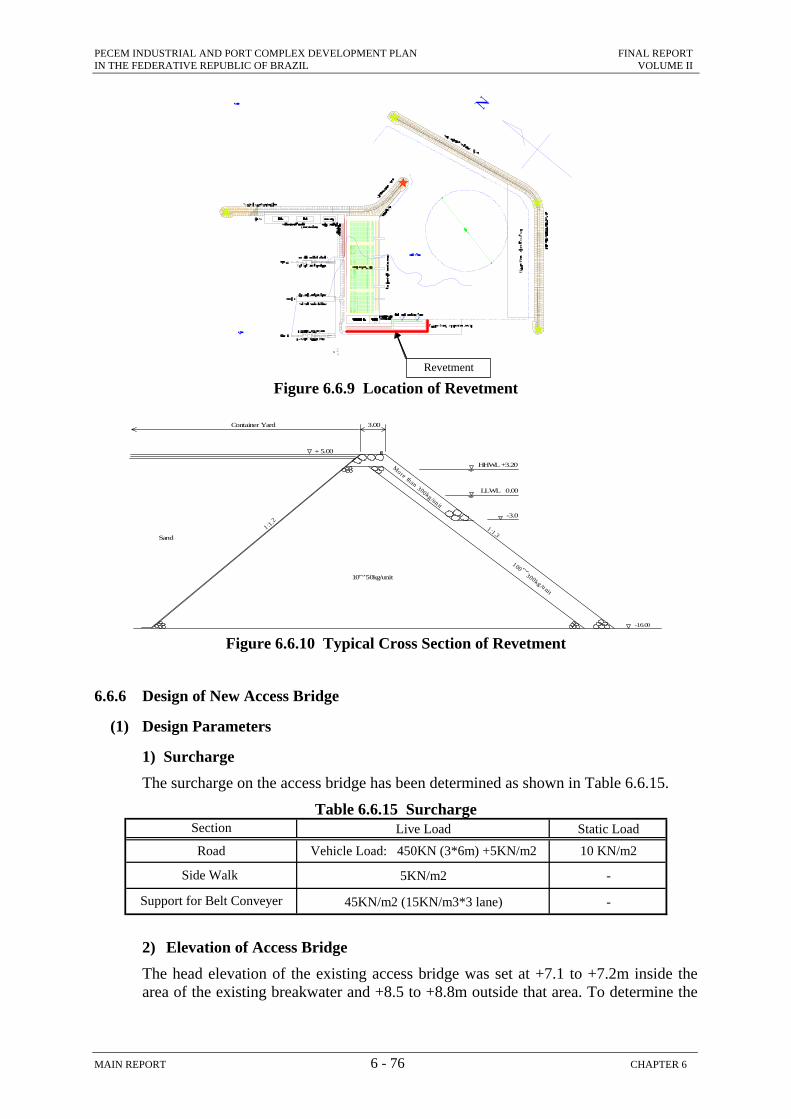
6.6.5 Design of Revetment As the face line of the container berth at the onshore side shown in Figure 6.6.9 is not be used as a quaywall for a container berth, this section is designed as a rubble-type revetment. Figure 6.6.10 shows the proposed typical cross section of the revetment.
MAIN REPORT 6 - 75 CHAPTER 6
PECEM INDUSTRIAL AND PORT COMPLEX DEVELOPMENT PLAN FINAL REPORT IN THE FEDERATIVE REPUBLIC OF BRAZIL VOLUME II
Revetment Figure 6.6.9 Location of Revetment
3.00
1:1 .31 :1.2
-16.00
+5.00
More than 300kg /un it
100~300kg/unit
10~50kg/unit
-3.0
Container Yard
HHWL +3.20
LLWL 0.00
Sand
Figure 6.6.10 Typical Cross Section of Revetment
6.6.6 Design of New Access Bridge
(1) Design Parameters
1) Surcharge The surcharge on the access bridge has been determined as shown in Table 6.6.15.
Table 6.6.15 Surcharge Live Load Static Load
Vehicle Load: 450KN (3*6m) +5KN/m2 10 KN/m2
5KN/m2 -
45KN/m2 (15KN/m3*3 lane) -
Section
Road
Side Walk
Support for Belt Conveyer
2) Elevation of Access Bridge The head elevation of the existing access bridge was set at +7.1 to +7.2m inside the area of the existing breakwater and +8.5 to +8.8m outside that area. To determine the
MAIN REPORT 6 - 76 CHAPTER 6

PECEM INDUSTRIAL AND PORT COMPLEX DEVELOPMENT PLAN FINAL REPORT IN THE FEDERATIVE REPUBLIC OF BRAZIL VOLUME II
elevation of the access bridge, the uplift forces due to waves acting on the superstructures should be taken into account. The wave height due to wave breaking (Hb) for design offshore wave height (H0=2.9m, T=8.9s) is estimated as Hb=3.5m at the water depth of 4.74m. Following the Airy theory, the wave crest height is half of the wave height. But the wave crest height increases toward the wave breaking point due to the non-linearity waves characteristics. When the wave crest height is assumed as 70% of wave height considering the design wave condition, the highest crest height at the breaking point under the design tide condition is +3.2m (HHWL) + 3.5m*0.7 = +5.65m. When the height of the superstructure including the lower part of the beam is assumed to be 2.35m, the same as the present, the required elevation of the access bridge at the wave breaking point should be higher than +8.0m to avoid the uplift force due to waves. The elevation of the access bridge outside the surf zone can be reduced because the crest height becomes smaller than that at the breaking point. As a result, the elevation of the access bridge has been proposed as below.
Inside the surf zone (Water depth is less than -5m): +8.0m Outside the surf zone(Water depth is more than -5m): +7.0m
The new access bridge is located in the wave shadow area behind the offshore breakwater. So, if the access bridge will be constructed after completion of the main breakwater, a further reduction of elevation by about 1m can be achieved due to the wave reduction from the breakwaters
3) Width of Access Bridge
The width of the existing access bridge was designed to provide 9.5m for the road and side walk, 6.2m for installation of belt conveyers, 6.75m for support of the pipe line, 22.45m in total. To decide the width for new proposed access bridge, following considerations have been taken into account. • To provide clearance between the sidewall and the road to improve the traffic
safety.
• To provide the space for three lines of belt conveyers (two lines for the transportation of soy beans and fertilizers, one line for the future expected demand).
The width of the access bridge has been set as below. Road and sidewalk: 10.5m (1m > existing bridge)
Space for belt conveyer: 9.7m (3.5m > existing bridge) Total: 20.2m (2.25m < existing bridge)
(2) Access Bridge Structural Type A combination of different segments with vertical and raking piles was applied for the existing access bridge in consideration of not disturbing the littoral drift. A pile segment was set every 20m from Pile No.1 to No.74 (onshore side), and every 10m from pile No.74 to No.108 (offshore side). For the proposed new access bridge, both the vertical and ranking pile segments have been set every 10m according to the structural calculation. The proposed cross section of the access bridge is shown in Figure 6.6.11.
MAIN REPORT 6 - 77 CHAPTER 6

PECEM INDUSTRIAL AND PORT COMPLEX DEVELOPMENT PLAN FINAL REPORT IN THE FEDERATIVE REPUBLIC OF BRAZIL VOLUME II
1.30
10.50 (for Road and Sidewalk)
7.00
20.20
0.403.60 3.60
0.400.202.00
0.65
+7.0 to +8.0
0.900.30 0.302.000.10 0.100.400.20
0.65
0.40
2.652.65 4.00 4.00
2.70
9.70 (for Belt Conveyer)
Figure 6.6.11 Cross Section of Access Bridge
6.6.7 Design of Port Road on Existing Breakwater The existing North-South Breakwater is to protect against the sea waves which approach from ENE to ESE. But after construction of the offshore main breakwaters in the proposed long-term development plan, this protection won’t be necessary because both the swell and sea waves will be completely blocked by the newly constructed offshore breakwaters. The existing North-South Breakwater is located behind the proposed container yard and also is on the same alignment as the new access bridge. Further, the crown part is 25.5m wide at the level of +6.0m. Considering these conditions, this breakwater can be used as the port road for the container terminal and for Pier No.3, and as the revetment for the new container yard. The head elevation of the existing breakwater is +6.0m at the berm part and +8.0m at the crown part. As a high level of wave tranquillity can be secured in this area, the berm height of +6.0m is sufficient for the port road and revetment. Therefore, it is proposed that the crown part with the height of +8.0m be removed to widen the crown part for utilization as a port road. The port road will consist of four lanes with the width of 3.6m each, one parking lane and a sidewalk.
The proposed cross section of the port road is shown in Figure 6.6.12.
MAIN REPORT 6 - 78 CHAPTER 6

PECEM INDUSTRIAL AND PORT COMPLEX DEVELOPMENT PLAN FINAL REPORT IN THE FEDERATIVE REPUBLIC OF BRAZIL VOLUME II
+ 6.00~+5.50
-16.50
+ 3.20 (HHWL)
9.502.00
1:1.25
7.00
+ 5.00
0.00 (LLWL)
10~50kg /un it
100~3 00kg /un it
10~50k g /un it
Sand-6.00
100~300kg /un it
1:1 .25
1 00~300 kg /un it
21.802.70
13.30
+ 6.00~+5.50
Geotextile Sheet
1.80
Existing Breakwater
16.00 23.00
0.40
0.403.60 3.601.30
0.20
3.603.60
0.40
0.40 0.90
21.80
ASPHALTPAVEMENT (t=50mm)
ASPHALTPAVEMENT FOR LOWERCOURSE (t=50mm)
BASECOURSE(t=150mm)
CRUSHEDSTONE (t=250mm)
3.40
Figure 6.6.12 Cross Section of Port Road on Existing Breakwater
6.6.8 Design of Container Yard The RTG (Rubber Tire Mounted Gantry Crane) system is planned for installation in the new offshore container yard. The representative specification concerning to the design matter are shown below. (The other specifications have been presented in 6.3.)
Rated Load: 40.0 ton
Wheel Base: 6.4 m (Min.)
Number of Gantry Wheels: 2 tires/corner (total 8 wheels)
A reinforced concrete slab with a thickness of 300mm is to be installed under the RTG traffic lane in consideration of the heavy weight. A pre-cast concrete plate with a thickness of 250mm is to be installed at the foundation for stacked containers. The width of the RTG traffic lane, chassis lane and the space for stacking shall be determined appropriately to ensure smooth storing, marshalling receipt and dispatch of containers and chassis. The layout of the container yard and the arrangement of the container stacking plate are shown in Figure 6.6.13.
MAIN REPORT 6 - 79 CHAPTER 6

PECEM INDUSTRIAL AND PORT COMPLEX DEVELOPMENT PLAN FINAL REPORT IN THE FEDERATIVE REPUBLIC OF BRAZIL VOLUME II
4.0
2.44.
04.
04.
02.
43.
2
24.0
4.0
4.0
2.4
1.5 1.522.0
1.5 1.5
23.53.0
3.0
10.4
191.
81.5 1.5
4.018.0 1.5 1.51.51.5
2.450.4
2.450.4
2.450.4
2.450.4
2.450.4
2.45
2.0
2.0
4.3
1.6
2.0
2.0
1.6
1.6
0.8 1.4 1.4 1.4 1.4 1.4 0.80.6 1.47 1.47 1.47 1.47 1.47 1.47
23.53.0
6.04
0.1
2.0
2.0
4.3
1.6
2.0
4.4
1.6
3.0
4.4
4.4
4.4
4.4
4.4
4.4
1.5
3.0
3.0
12.2
0.2
0.1
6.04
6.04
12.2
1% CH
ASS
ISL
AN
E
RT
GT
RA
FFIC
LA
NE
RT
GT
RA
FFIC
LA
NE
RT
GT
RA
FFIC
LA
NE
RT
GT
RA
FFIC
LA
NE
(ASP
HA
LT
PA
VE
MN
T)
1.5 1.5 1.5
0.6
4.0 1.50.8
1.47
1.41.4 1.41.4 1.4 0.8
1.47 1.47 1.47 1.47 1.47
1.5 1.5
Inte
rrock
ing
Blo
ck(1
2m
m)
Sand
(t=3
0m
m)
Soil
Cem
ent
(t=3
00m
m)
Cru
shed
Ston
e(t
=350
mm
)
Pre
-ca
stC
oncr
ete
pla
te(2
50m
m)
Sand
(t=3
0m
m)
Ba
seC
ours
e(t
=120
mm
)Su
bB
ase
Cou
rse
(t=1
50m
m)
Den
ceA
sph
alt
Con
cret
e(t
=50
mm
)
Bas
eC
ours
e(t
=250
mm
)Co
urs
eA
spha
ltCo
ncr
ete
(t=5
0m
m)
RC
Con
cret
eSl
ab(t
=300
mm
)Sa
nd(t
=30
mm
)So
ilC
emen
t(t
=300
mm
)
Cru
shed
Ston
e(t
=350
mm
)
Lay
outo
fD
ryC
onta
iner
Are
a
Con
tain
erS
tack
ing
Pla
tefo
rD
ryC
onta
iner
Figure 6.6.13 Layout of Container Yard
MAIN REPORT 6 - 80 CHAPTER 6

PECEM INDUSTRIAL AND PORT COMPLEX DEVELOPMENT PLAN FINAL REPORT IN THE FEDERATIVE REPUBLIC OF BRAZIL VOLUME II
6.6.9 Design of Railway According to CFN, a rail gauge of 1,600mm has been applied for the design of the railway. A typical cross section of the embankment and cut section with sub-grade is shown in Figure 6.6.14. Since the railway alignment is located in the coastal dunes, it is necessary to take some measures to avoid of the line being buried by sand due to the wind.
1.603.60
1 :1.21:1.2
0.80
5.52
1 :2 .51 :2 .5
1.00 1.00
(1) Embankment Section
1 :2.5 1 :2.51.603.60
1 :1.21:1.2
0.80
5.52 1.001.00
(2) Cutting Section
Figure 6.6.14 Layout of Container Yard
6.6.10 Navigation Safety The coastline of Brazil is approximately 7,500 km long. There are about 30 international ports and numerous domestic ports in Brazil.
On the surrounding waters, there are quite a few vessels are congested. Thus, it is important to establish navigation aids facilities in accordance with the Rules of IMO in order to secure safe navigation.
(1) Present Situation Existing entering and outgoing to approach course of Pecem Port.
Although it will enter by the opening of a port in November, 2001 in 4th years, and the number of calling vessels is also 259, there is no big confusion in 2004 and the sea accident at surrounding of Pecem port is also peaceful few, to the increase in the future number of calling vessels, the improvement of navigation aids and layout channel, and introduction of Vessel Traffic Management System (VTMS) is required.
MAIN REPORT 6 - 81 CHAPTER 6

PECEM INDUSTRIAL AND PORT COMPLEX DEVELOPMENT PLAN FINAL REPORT IN THE FEDERATIVE REPUBLIC OF BRAZIL VOLUME II
1) Entering to port • From vessel awaiting anchorage to turning point, proceed to direction 165°for
distance 2.6 nautical miles (4.8km)
• Turning point (Lat 3°- 31.2’S/ Long 38°- 49.0’W) alteration course to 125°proceed to front of pier, distance 1.1 nautical mile (2.0km)
2) Outgoing from port • From leave to along side berth, turning of the body of a ship for proceed to
direction 305°for distance 1.0 nautical mile (1.8km)
• Turning point (Lat 3°- 31.2’S/ Long 38°- 49.0’W) alteration course 345°proceed to Pilot get off point, for distance 2.0 nautical miles (3.8km) off shore.
(2) Navigation Aids Generally, vessels arrive and leave Pecem Port through the main entrance channel. Pilotage is compulsory with pilots boarding and de-boarding in the neighbour of vessel waiting anchorage of 3.5 miles off shore.
Securing safety of marine traffic is one of the most important matters for the Brazilian Government and State of Ceara. Therefore, the Government and State are promoting integrated countermeasures to ensure maritime safety.
1) Existing Navigation Aids
Existing navigation aids (lighthouse, light buoy and light beacon) are listed in the following Table 6.6.16.
Table 6.6.16 Pecem Port Existing Navigation Aids Place of Light House and Buoy Light Characteristic
Off-shore Light Buoy (3-28.9S / 38-48.5W) Fl.10 sec, R/W Off-shore Light Buoy (3-30.8S / 38-48.9W) Fl. 5 sec, R Off-shore Light Buoy (3-31.6S / 38-48.5W) Fl. 5 sec, R
Place of Light House and Buoy Light Characteristic Point of NW on Break Water (Main B/water) Fl. G 6 sec, 8M Point of SE on Break Water (Corner of B/water) Fl. Y 6 sec, 8M Point of NW on Pier No-1 end F. Y Point of NW on Pier No-2 end F. Y Point of SW on Break Water F. Y Light House = Land mark (74m 26/21m) Al. Fl. WWR 30sec
Source: Admiralty Charts # 526
2) Navigation Aids Development The target of the Pecem Port is to install at least eight (8) new navigation aids in the near future. However, it is not clear if the Pecem Port Complex will be able to realize this target. The operation rate of navigation aids in the Ceara State Government is lower than that recommended by the IMO (International Maritime Organization), IALA (International Association Lighthouse Authority) and it should be raised. The following three items are indispensable for increasing the operation rate.
• Periodical renewal of aged equipment
• Appropriate operation and maintenance of equipment
MAIN REPORT 6 - 82 CHAPTER 6

PECEM INDUSTRIAL AND PORT COMPLEX DEVELOPMENT PLAN FINAL REPORT IN THE FEDERATIVE REPUBLIC OF BRAZIL VOLUME II
• Periodical change of consumable parts and supplement of spare parts
3) Establishment of New Light Buoys and Beacons for Navigation Aids The main channel should be equipped with light buoys, light beacons and other navigation aids prescribed by the IMO (International Maritime Organization), and IALA (International Association Lighthouse Authority) regulations. The recommended implementation plan of the navigation aids is shown in table 6.6.17.
Table 6.6.17 New Navigation Aids (Required by International law) Nr. Place of Site Kind of Navigation Aid Characteristic
1. Waterway separation point (3-29.5S / 38-49.0W)
Light buoy Fl. G. 10 second
2. Off-shore (3-29.6S / 38-47.5W) Light buoy (No- 1) Fl. W. 5 second 3. Off-shore (3-30.5S / 38-47.0W) Light buoy (No- 2) Fl. W. 5 second 4. Point of Main Break water end Pole type Light Beacon Fl. G. 10 second 5. Point of Sub Break water end Pole type Light Beacon Fl. R. 10 second 6. Main B/Water S/W end Pole type Light Beacon Fl. R. 5 second 7. Point of Middle Corner of Break water Fixed warning light Red warning corner light8. Quay Side Edge warning light Jetty end marker Red warning edge light
Source: JICA Study Term
(3) Marine Accidents Near Pecem Port The Pecem Port was opened in 2001. Thus far, there have been no significant marine accidents near and around Pecem Port.
According to the report made by the Port, break of mooring ropes and contacts with berth facilities have occurred due to strong wind and wave.
It is expected that as Pecem Port develops, marine accidents due to congestion may occur.
Thus, in order to prevent such marine accidents, it is required to establish new waterways, to separate existing waterways and to establish navigation aids.
According to the records of official accident, there were no marine accidents during the one year period from June 2004 to May 2005.as shown in the Table 6.6.18
Table 6.6.18 Occurrence of Maritime Accident / Damage of Pecem Port (From June 1st 2004 to May 31st 2005)
Kind of Damage or Accident Nr, of Cases Rope breaking and collision of port facility 8 Cases Difficulty of mooring due to marine currents 1 Case Oscillation of hull by strong swell 3 Cases Tug boat bumps breaking by strong swell 1 Case Collision with pier external head by swell 1 Case Vessel Collision with pier edge 2 Cases Total Accident and Damaged 16 Cases
Source: CEARAPORTO
MAIN REPORT 6 - 83 CHAPTER 6

PECEM INDUSTRIAL AND PORT COMPLEX DEVELOPMENT PLAN FINAL REPORT IN THE FEDERATIVE REPUBLIC OF BRAZIL VOLUME II
1) Type of Marine Accidents Global marine accidents are classified into twelve (12) types as shown in Table 6.619
Table 6.6.19 Kind of Accident No. Kind of Accident Definition
1. Aground / Grounding Type of accident that results in forcing the vessel on the shore.
2. Collision Vessel traffic related accidents involving the hitting of two moving vessels.
3. Capsize Type of accident that results in the over-turning of the vessel.
4. Damage to Pier Accident that results in breaks and / or other damages in the dock.
5 Drafting Type of accident that results in the aimless floating of the vessel without its own propelled power.
6. Engine Trouble Type of accident that results from engine related problems. 7. Explosion Type of accident that results in explosion of a part of a vessel. 8. Fire Type of accident that results in burning of a part of the vessel.
9. Flooding Type of accident which results in the flow of water into a part of the vessel.
10. Hitting of Object Type of accident that results in the striking of the vessel with non-vessels (buoy, floating debris, etc,).
11. Human error Accident caused by mistake made by the seafarers or ship owner /shipping company.
12. Sinking Type of accident which represents submergence of vessel. Source: JICA Study Team
6.7 Cost Estimates
6.7.1 Cost Estimates The Port of Pecém is a new port that was started in the middle of the 1996 and completed in 2001. Therefore, the construction history is really new so that the construction methods and actual cost are actual and are applicable to the proposed construction works of the Project. The basis for the cost estimates of the Study are mostly depending on the results of analyzing as-built records of the construction of the new Pecem port.
Exchange rate: 1 US$ = R$ 2.30 1 R$ = Yen 50 ( Yen 1 = 0.020 R$ ) As of 10, Aug on Central Bank of Brazil
(1) Unit Price Based upon the unit price on the contract amount of the former port project contracted in 1996, SEINFRA who is a counterpart of the Study has analyzed and set forth a current unit price. The unit price is reliable enough to apply to the cost estimation of the study. The proposed offshore facility components are similar to the existing facilities.
General index of prices from the base of 1996 commenced construction is 265 at the present as shown on Table 6.7.1 as following.
MAIN REPORT 6 - 84 CHAPTER 6

PECEM INDUSTRIAL AND PORT COMPLEX DEVELOPMENT PLAN FINAL REPORT IN THE FEDERATIVE REPUBLIC OF BRAZIL VOLUME II
Table 6.7.1 Brazil – Macro – Economical Indicators
INDEX RATIO INDEX RATIO
1996 2.7 17.4 100.0 778,887 100.0 9.3 161,247 1.01 774,857 28.63 4.1 3.70
1997 3.3 8.3 117.4 870,743 109.3 7.5 163,471 1.08 807,215 28.58 4.2 5.20
1998 0.1 4.9 127.1 914,188 117.5 1.7 165,688 1.16 787,346 29.33 2.8 2.30
1999 0.8 5.7 133.3 973,846 119.5 20.0 167,910 1.82 536,318 31.07 3.7 0.50
2000 4.4 8.4 140.9 1,101,255 143.4 9.8 170,143 1.83 601,943 31.61 4.6 3.70
2001 1.3 7.4 152.8 1,198,736 157.4 10.4 172,386 2.35 509,623 33.4 2.5 0.40
2002 1.9 10.2 164.1 1,346,028 173.8 26.4 176,391 2.92 460,732 34.88 3 -0.50
2003 0.5 15.0 180.8 1,556,182 219.6 7.7 178,985 3.08 505,533 34.01 4 1.90
2004 4.9 8.2 208.0 1,766,621 236.6 12.1 181,586 2.93 603,787 5.1 5.50
225.1 265.2
GENERAL INDEX OFPRICES
POPULATION(PER
THOUSANDINHABITANTS)
RATES OFAVERAGE
EXCHANGE(US$)
SOURCES: DGP,IMPLICIT DEFLATE AND POPULATION : IBGE. RATIO OF TAX CHARGE: FGV/IBGE. GENERAL INDEX OF PRICES: FGV RATES OF AVERAGE EXCHANGE: Bacen. DGP INLATINAMERICA: Cepal. COMPOSITION: IPEA/DIMAC
VARIATION OFIMPLICIT DEFLATE OF
GDPYEARGROWTH OF
DGP(BRAZIL)
NOMINAL GDP DGP (10E6 XUS$)
RATIO OF TAXCHARGE (%
OF GDP)
GROWTH OFWORLD DGP
(%)
GROWTH OFDGP IN LATINAMERICA (%)
Table 6.7.2 Price Indexes of Material and Construction works
Index 100 as of 1996 Item Indexes Item Indexes
Stone ( 10kg – 6 tons) 304 Concrete works 256 Steel bar 392 Common form work 270(239-319) Steel pipe 297 Structural steel work 256 Steel wire 256 General civil works 256
* made by JICA Study Team Unit price of major material and labourers is shown on Table 6.7.3 as follows.
MAIN REPORT 6 - 85 CHAPTER 6

PECEM INDUSTRIAL AND PORT COMPLEX DEVELOPMENT PLAN FINAL REPORT IN THE FEDERATIVE REPUBLIC OF BRAZIL VOLUME II
Table 6.7.3 Unit Price of major material and labourers Unit : R$ as of August, 2005
Items Detail unit Unit price A Stones 1 Armor stone 100-1000kg Mining, selection and load m3 17.002 Armor stone 100 – 1000kg Transport by truck L=21 km m3 17.003 Armor stone 1 – 6 tons Mining, selection and load m3 21.004 Armor stone 1 – 6 tons Transport by truck L=21 km m3 21.005 Rubble stone 5 – 100kg Mining, selection and load m3 17.006 Rubble stone 5 – 100kg Transport by truck L=21 km m3 17.007 All stone Launching at site m3 6.008 Crusher run Material at site m3 50.009 Filter stone Material at site m3 40.0010 Filter stone/crusher run transport m3 17.00B Concrete 1 Lean concrete Qc=18MP m3 211.72 High performance concrete For PC pile qc=50 MP m3 473.873 PC/PS concrete Qc=50MP m3 430.804 High performance underwater m3 473.875 Common structure concrete Qc=25MP m3 335.006 Pavement concrete Qc=30MP m3 249.24C Structural steel 1 Steel bar Deformed CA=50 type kg 6.032 Steel strand wire CP-190RB kg 40.393 Steel pipe kg 7.514 Structural steel TR-68 kg 7.09D Personal wages 1 Civil engineer R$/month 4760.002 Mechanic engineer R$/month 4084.003 Assistant engineer R$/month 1264.004 Clerk R$/month 883.005 Operator R$/month 929.006 Driver R$/month 768.007 Diver 4 – 5 person include 3 divers R&/day 3000.008 Scaffold man R$/month 569.009 Carpenter R$/month 670.0010 Mason R$/month 569.0011 Welder R$/month 993.0012 Unskilled labour R$/month 360.00 * data provided by SEINFRA
(2) Portion of Local and Foreign Currency All of the civil works including buildings shall be made using Local Currency. All materials such as steel & iron products, mechanical & electrical goods, secondary concrete products and elemental raw materials shall be provided in Brazil. Regarding execution, construction machinery, equipment and floating equipment shall also be procured in Brazil. However, when concrete caisson structures are adopted at container and fruits & multipurpose quays, a floating dock for fabricating the caissons may be procured from abroad. The depreciation charge represents only a very small
MAIN REPORT 6 - 86 CHAPTER 6

PECEM INDUSTRIAL AND PORT COMPLEX DEVELOPMENT PLAN FINAL REPORT IN THE FEDERATIVE REPUBLIC OF BRAZIL VOLUME II
portion of the concerned facility construction cost. Therefore, the estimate neglects the foreign portion and transfers the cost to the local currency balance.
All of the Items for Procurement of Equipment shall be made using Foreign Currency. All of the nominated equipment shall be transported as a module directly to the site. Therefore, no local currency such as erection cost will be incurred.
(3) Major Methods of Execution
1) Stones All kinds of stones are mined at the JACURUTU quarry about 21 km from Pecém Port. The stones consist of granite containing a great deal of quartz and are suitable to use for marine construction. The stone vein extends from the top of the mountain to deep underground. The reserves seem adequate for the project.
An exclusive access road from the quarry to the port is available but has been unused for 4 years. The access road could be put take into use with a little maintenance.
a) Use of stones:
Rubble stone 1 – 100 kg 2,900,000 m3 Armor stone 100 – 1,000 kg 520,000 m3 Armor stone 1 – 6 tons 500,000 m3 TOTAL 3,920,000 m3 Facility-wise Breakwater 2,770,000 m3 Wharves 630,000 m3 Revetments 520,000 m3
b) Mining and selection of stones
Stones are mined at an open cut by blasting with dynamite. Huge armour stones are mainly mined from the underground layer and rubble stones at the mountain side. Stones are selected by the sizes as required. The selected stones are loaded onto dump trucks (16 - 20 m3 capacity) and transported to the site.
c) Throw and set up stones
Stones brought by dump trucks are loaded onto two type of stone barges at the temporary jetty.
Stones to be set below CD-6.0 meters are transported and discharged accurately by a bottom dump type stone barge. Stones positioned above - 6 meters are placed by stone carrier with grab bucket.
2) Concrete A concrete centre equipped with mixing & batching plant, pre-stress concrete pile factory, cement silo, stock yard for coarse and fine aggregate, and factory for pre-cast concrete products will be constructed westward of Pecém Port.
Planned consumption of concrete: 222,000 m3 Steel bar including steel strand wire 30,000 tons
MAIN REPORT 6 - 87 CHAPTER 6

PECEM INDUSTRIAL AND PORT COMPLEX DEVELOPMENT PLAN FINAL REPORT IN THE FEDERATIVE REPUBLIC OF BRAZIL VOLUME II
3) Concrete caissons Concrete caissons will be fabricated on a floating dock which will be procured from abroad. Two caissons are fabricated at the same time. Two fabricated caissons are launched and towed to the planned position, and set up temporally. The floating dock has two hoisting cranes at the top of the wings, and it is accompanied by a floating crane of 200 tons lifting capacity and a tug boat of 1000 HP.
Number of caissons to be fabricated 75 units Use of concrete 82,000 m3 Use of steel bar 7,380 tons 4) Piling works Pier No.3 and access bridges are designed as pile structures.
Number of PPC piles
Access bridges 300 units Pier No.3 750 units
Method of pile work: Cost estimates have been made assuming the same design as the existing facilities at Pecém Port. Piles are designed as pre-cast pre-stress concrete piles. To set up a PPC pile, after driving a steel casing to the rock layer, materials inside the casing are excavated and it is filled with underwater concrete. All of the in-situ works will be executed on a self elevated platform
(4) Cost estimates
1) Composition of cost item Cost item is composed as following:
A Offshore Civil Works
Access bridges m 2,500 Port road and temporary port road m 1,375
Breakwater m 3,680 Container Terminal offshore (d=300m) m 900 Reclamation m3 6,750,000
Fruits & Multipurpose Terminal m 680 Grain Berth m 320
Revetment and -4m port service boats m 920
B Civil Works on land
Site preparation, Fence, Gate, Buildings Ha 100 Container Terminal landside m2 250,000
Grain Silo Terminal cell 120 Belt Conveyor m 4,800 Cokes stockpile yard m2 18,200
Railway m 18,350
C Procurement of Equipment gantry crane, etc units 76
D Total of Construction Cost A + B + C
MAIN REPORT 6 - 88 CHAPTER 6

PECEM INDUSTRIAL AND PORT COMPLEX DEVELOPMENT PLAN FINAL REPORT IN THE FEDERATIVE REPUBLIC OF BRAZIL VOLUME II
E Engineering Service (A+B) x 3%+C x 1%
F Contingency D x 10%
G Project Cost (Excluding VAT) D + E + F
2) Cost comparison by alternatives Alternatives were made only for the civil works offshore. An open type wharf with vertical piles was designed to compare the cost of each Alternative.
Table 6.7.4 Cost Comparison by Alternatives Alternative Alternative 1 Alternative 2 Alternative 3 Alternative 4
Index 100.00 100.66 101.72 99.84 In the aspect of construction cost, Alternative 4 is the most economical.
3) Cost comparison by structural types Wharves of the container and fruits/multipurpose berth must be equipped bulk heads. Wharves of the gravity type such as the caisson type do not need bulkhead, but those of the open type have bulkheads constructed.
Table 6.7.5 shows a caisson structure is more economical than pier structure by approximate 39 points.
MAIN REPORT 6 - 89 CHAPTER 6

PECEM INDUSTRIAL AND PORT COMPLEX DEVELOPMENT PLAN FINAL REPORT IN THE FEDERATIVE REPUBLIC OF BRAZIL VOLUME II
Table 6.7.5 Cost Comparison by Structural Types
Quantity Unit Price Amount Quantity Unit Price Amount
1 Mobilization & Demobilization Sum 1 7,000,000 1 3,000,000
2 Container Berth m 9001 Foundation works m 900 4,890 4,401,0002 Concrete caisson units 45 2,000,000 90,000,0003 Super structure and accessories m 900 15,300 13,770,0004 108units m 900 33,000 29,700,0005 Pier fondation units 975 135,000 131,625,0006 Super structure of pier m 900 37,000 33,300,0007 Crane girder m 900 2,250 2,025,0008 Accessoris m 900 7,900 7,110,0009 Bulkhead foundation m 900 26,000 23,400,000
10 Bulkhead concrete m 900 9,320 8,388,000
3 Grain Berth m 3201 Foundation works m 320 4,890 1,564,8002 Concrete caisson units 16 2,000,000 32,000,0003 Super structure and accessories m 320 15,300 4,896,0004 108units m 320 33,000 10,560,0005 Pier fondation units 250 135,000 33,750,0006 Super structure of pier m 320 37,000 11,840,0007 Crane girder m 320 2,250 720,0008 Accessoris m 320 7,900 2,528,0009 Bulkhead foundation m 320 26,000 8,320,000
10 Bulkhead concrete m 320 9,320 2,982,400
Total 193,891,800 268,988,400
Comparative Index 100.00 139
Pier StructureItem Description Unit
Caissson Structure
4) Premises for estimating Project Cost a) Alternative 4 of facility layout plan is applied.
b) Structural type of concrete caisson is applied for container and fruits/multipurpose berth
c) Construction cost of equipment was quoted in Japanese Yen in Japan. The exchange rate of 1 Yen = 0.02 R$ was applied.
5) Project cost Preliminary project cost is 1,435 million R$ as shown in Table 6.7.6. Engineering cost of 3 % on the total cost of civil works is estimated and Training of equipment operators is estimated at 1% of cost for procurement of equipment.
MAIN REPORT 6 - 90 CHAPTER 6

PECEM INDUSTRIAL AND PORT COMPLEX DEVELOPMENT PLAN FINAL REPORT IN THE FEDERATIVE REPUBLIC OF BRAZIL VOLUME II
Table 6.7.6 Preliminary Project Cost for Long Term Development Plan Unit: R$
Description Detail Unit Quantity Unit Price AmountA Off shore Works
1 Mobilization and Demobilization LS 1 7,000,0002 Temporary works LS 1 240,0003-1 Temporary port road m 425 27,500 11,687,5003-2 New Access Bridge No.0 to Container Terminal m 1,510 43,000 64,930,0004-1 Pier No.3 m 680 270,000 183,600,0004-2 Transit shed m2 7,500 1,210 9,075,0004-3 Transfer gantry cranes 2 units sum 1 400,0005-1 Sub-breakwater m 620 57,100 35,402,0005-2 Main breakwater m 2,760 40,200 110,952,0005-3 West breakwater m 300 57,400 17,220,0006-1 Container Berth crane girder m 900 153,000 137,700,0006-2 Container Terminal (pavement) m2 243,000 140 34,020,0006-3 Port road m 900 3,110 2,799,0006-4 Reclamation m3 4,989,000 10 49,890,0006-5 Port service boats (Construct & Demolish) -4m quay m 276 56,000 15,456,0006-6 Junktion of Container berth Caisson type m 40 120,000 4,800,0007-1 Grain Berth m 320 148,000 47,360,0007-2 Crane rail and Accessories m 320 800 256,0007-3 Reclamation 70mx716mx21 m3 1,053,000 10 10,530,0007-4 -4m revetment at corner of grain berth Caisson type m 40 120,000 4,800,0007-5 New Port Service Boat Basin Caisson type m 110 120,000 13,200,0007-6 Revetment m 807 27,500 22,192,5008 Channel & Basin LS 1 8,240,000
Sub Total 791,750,000B On land works
1 Site preparation Ha 100 11,550 1,155,0002 Fence with seaside retaining wall m 2,000 270 540,0003 Gate/Watch house, Truck scale LS 1 600,000 600,0004 Administration office 30x20x3F m2 1,800 1,000 1,800,0005 Chemi-coke stockpile yard Pavement m2 18,200 91 1,656,2006 Grain silo for 230,000 tons storage 1200tons/cell cell 120 1,600,000 192,000,0007 Belt Conveyer 2500 ton/hr m 4,800 16,000 76,800,0008 Railway m 18,350 1,800 33,030,0009 Parking lot m2 10,000 90 900,000
Sub Total 308,481,200TOTAL OF CIVIL WORKS 1,100,231,200
C Procurement of equipment1 Quay Side Gantry Crane units 6 17,000,000 102,000,0002 Rubber Tire Mounted Gantry Crane units 15 2,800,000 42,000,0003 Tractor head / Trailer units 53 150,000 7,950,0004 Loadeer / Unloader units 2 9,000,000 18,000,000
Sub Total 169,950,000D TOTAL OF CONSTRUCTION COST 1,270,181,200
E Engineering services1 Consultation of the Project Civil x 0.03 % 1,100,231,200 0.03 33,006,9362 Training of equipment Equipment 1% % 169,950,000 0.01 1,699,500
Sub Total 34,706,436F Indirect Cost + Contingency % 1,304,887,636 0.10 130,488,764G GRAND TOTAL Exclude VAT R$ 1,435,376,400
Equivalent Japanese Yen ¥ 71,768,819,980
Item
6) Cost portion of Master Plan Construction cost of the Master Plan is divided four components as shown in Table 6.7.7 and 6.7.8.
MAIN REPORT 6 - 91 CHAPTER 6

PECEM INDUSTRIAL AND PORT COMPLEX DEVELOPMENT PLAN FINAL REPORT IN THE FEDERATIVE REPUBLIC OF BRAZIL VOLUME II
1F/
CD
escr
iptio
nde
tail
unit
quan
tity
unit
pric
eam
ount
%%
%%
AO
ff sh
ore
Wor
ks1
Mob
iliza
tion
and
Dem
obili
zatio
nLS
17,
000,
000
1070
0,00
090
6,30
0,00
00
00
02
Tem
pora
ry w
orks
LS1
240,
000
1843
,200
4410
5,60
022
52,8
0016
38,4
003
Acc
ess R
oad
& B
ridge
3-1
Tem
pora
ry p
ort r
oad
m
425
27,5
0011
,687
,500
364,
207,
500
364,
207,
500
141,
636,
250
141,
636,
250
3-2
New
Acc
ess B
ridge
No.
0 to
Con
tain
er T
erm
inal
m
1,51
043
,000
64,9
30,0
0033
21,4
26,9
0029
18,8
29,7
0017
11,0
38,1
0021
13,6
35,3
004
Pier
No.
34-
1Pi
er N
o.3
com
plet
ed in
yea
r 201
2m
68
027
0,00
018
3,60
0,00
033
60,5
88,0
0038
69,7
68,0
0014
25,7
04,0
0015
27,5
40,0
004-
2Tr
ansi
t she
dm
27,
500
1,21
09,
075,
000
4-3
Tran
sfer
gan
try c
rane
s2
units
sum
140
0,00
05
Bre
akw
ater
5-1
Sub-
brea
kwat
erm
620
57,1
0035
,402
,000
269,
204,
520
4616
,284
,920
165,
664,
320
124,
248,
240
5-2
Mai
n br
eakw
ater
m
1,79
039
,900
71,4
21,0
0026
18,5
69,4
6046
32,8
53,6
6016
11,4
27,3
6012
8,57
0,52
05-
3W
est b
reak
wat
erm
300
57,4
0017
,220
,000
264,
477,
200
467,
921,
200
162,
755,
200
122,
066,
400
5-4
Exte
nsio
n of
Mai
n B
reak
wat
erm
970
40,8
0039
,531
,000
2610
,278
,060
4618
,184
,260
166,
324,
960
124,
743,
720
6C
onta
iner
term
inal
6-1-
1C
onta
iner
Ber
thC
rane
gird
erm
540
153,
000
82,6
20,0
0033
27,2
64,6
0040
33,0
48,0
0012
9,91
4,40
015
12,3
93,0
006-
1-2
Exte
sion
of C
onta
iner
Ber
thm
360
153,
000
55,0
80,0
0033
18,1
76,4
0040
22,0
32,0
0012
6,60
9,60
015
8,26
2,00
06-
2-1
Con
tain
er T
erm
inal
(pav
emen
t)m
224
3,00
014
034
,020
,000
248,
164,
800
3712
,587
,400
186,
123,
600
217,
144,
200
6-2-
2Po
rt ro
adm
900
3,11
02,
799,
000
2467
1,76
037
1,03
5,63
018
503,
820
2158
7,79
06-
2-3
Rec
lam
atio
nm
32,
989,
000
1029
,890
,000
123,
586,
800
5717
,037
,300
164,
782,
400
154,
483,
500
6-3-
1B
asin
for p
ort s
ervi
ce b
oats
-4m
qua
ym
276
56,0
0015
,456
,000
406,
182,
400
284,
327,
680
152,
318,
400
172,
627,
520
6-3-
2R
ecla
mat
ion
for s
econ
d st
age
m3
2,00
0,00
010
20,0
00,0
0012
2,40
0,00
057
11,4
00,0
0016
3,20
0,00
015
3,00
0,00
06-
4-1
Junc
ktio
n of
bre
akw
ater
sC
aiss
on ty
pem
4012
0,00
04,
800,
000
301,
440,
000
432,
064,
000
1257
6,00
015
720,
000
6-4-
2-4
m re
vetm
ent a
t cor
ner o
f gra
in b
erth
Cai
sson
type
m40
120,
000
4,80
0,00
040
1,92
0,00
028
1,34
4,00
015
720,
000
1781
6,00
07
Gra
in B
erth
7-1-
1N
ew P
ort S
ervi
ce B
oat B
asin
Cai
sson
type
m11
012
0,00
013
,200
,000
405,
280,
000
283,
696,
000
151,
980,
000
172,
244,
000
7-2-
1Fo
unda
tion
wor
ksm
320
7,70
02,
464,
000
3688
7,04
033
813,
120
1946
8,16
012
295,
680
7-2-
2C
oncr
ete
cais
son
units
202,
000,
000
40,0
00,0
0030
12,0
00,0
0043
17,2
00,0
0012
4,80
0,00
015
6,00
0,00
07-
2-3
Supe
r stru
ctur
e an
d ac
cess
orie
sm
320
15,3
004,
896,
000
512,
496,
960
1783
2,32
012
587,
520
2097
9,20
07-
3-1
Cra
ne ra
il an
d A
cces
sorie
sm
32
080
025
6,00
060
153,
600
2051
,200
1025
,600
1025
,600
7-4-
1R
evet
men
tm
807
27,5
0022
,192
,500
347,
545,
450
265,
770,
050
183,
994,
650
224,
882,
350
7-5-
1R
ecla
mat
ion
70m
x716
mx2
1m
31,
053,
000
1010
,530
,000
8C
hann
el &
Bas
inLS
18,
240,
000
221,
812,
800
574,
696,
800
1298
8,80
013
1,07
1,20
0Su
b To
tal
791,
750,
000
2922
9,47
7,45
039
312,
390,
340
1411
2,19
5,94
015
118,
010,
870
Tabl
e 6.
7.7.
Pr
elim
inar
y Pr
ojec
t Cos
t Por
tion
for M
aste
r Pla
n (1
)
Cos
t bre
akdo
wn
for f
inan
cial
ana
lysi
sM
ater
ial
Fuel
,mac
hine
rysk
illed
LU
nski
lled
LIte
m
MAIN REPORT 6 - 92 CHAPTER 6

PECEM INDUSTRIAL AND PORT COMPLEX DEVELOPMENT PLAN FINAL REPORT IN THE FEDERATIVE REPUBLIC OF BRAZIL VOLUME II
2D
escr
iptio
nde
tail
unit
quan
tity
unit
pric
eam
ount
%%
%%
BO
n la
nd w
orks
1Si
te p
repa
ratio
nH
a10
011
,550
1,15
5,00
010
115,
500
6069
3,00
020
231,
000
1011
5,50
02
Fenc
e w
ith se
asid
e re
tain
ing
wal
lm
2,00
027
054
0,00
030
162,
000
2010
8,00
020
108,
000
3016
2,00
03
Gat
e/W
atch
hou
se, T
ruck
scal
eLS
160
0,00
040
240,
000
2012
0,00
020
120,
000
2012
0,00
04
Adm
inis
tratio
n of
fice
30x2
0x3F
m2
1,80
01,
000
1,80
0,00
030
540,
000
3054
0,00
020
360,
000
2036
0,00
05
Che
mi-c
oke
stoc
kpile
yar
dPa
vem
ent
m2
18,2
0091
1,65
6,20
060
993,
720
1016
5,62
010
165,
620
2033
1,24
06
Gra
in si
lo fo
r 230
,000
tons
stor
age
1200
tons
/cel
lce
ll12
01,
600,
000
192,
000,
000
5096
,000
,000
2548
,000
,000
1528
,800
,000
1019
,200
,000
7B
elt C
onve
yer
2500
ton/
hrm
4,80
016
,000
76,8
00,0
0080
61,4
40,0
0010
7,68
0,00
05
3,84
0,00
05
3,84
0,00
08
Rai
lway
m
18
,350
1,80
033
,030
,000
4514
,863
,500
206,
606,
000
154,
954,
500
206,
606,
000
9Pa
rkin
g lo
tm
210
,000
9090
0,00
060
540,
000
1090
,000
1090
,000
2018
0,00
0
Sub
Tota
l30
8,48
1,20
057
174,
894,
720
2164
,002
,620
1338
,669
,120
1030
,914
,740
TOTA
L O
F C
IVIL
WO
RK
S1,
100,
231,
200
3740
4,37
2,17
034
376,
392,
960
1415
0,86
5,06
014
148,
925,
610
CPr
ocur
emen
t of e
quip
men
t
1Q
uay
Side
Gan
try C
rane
units
617
,000
,000
102,
000,
000
100
102,
000,
000
F/C
2R
ubbe
r Tire
Mou
nted
Gan
try C
rane
units
152,
800,
000
42,0
00,0
0010
042
,000
,000
F/C
3Tr
acto
r hea
d / T
raile
run
its53
150,
000
7,95
0,00
010
07,
950,
000
F/C
4Lo
adee
r / U
nloa
der
units
29,
000,
000
18,0
00,0
00Su
b To
tal
169,
950,
000
100
151,
950,
000
00
0
DTO
TAL
OF
CO
NST
RU
CTI
ON
CO
ST1,
270,
181,
200
4455
6,32
2,17
030
376,
392,
960
1215
0,86
5,06
012
148,
925,
610
EEn
gine
erin
g se
rvic
essk
illed
unsk
illed
1C
onsu
ltatio
n of
the
Proj
ect
Civ
il x
0.03
%1,
100,
231,
200
0.03
33,0
06,9
36ye
arly
inco
me
16,0
0010
,000
2Tr
aini
ng o
f equ
ipm
ent
Equi
pmen
t 1%
%16
9,95
0,00
00.
011,
699,
500
tota
l num
ber
9,42
914
,893
Sub
Tota
l34
,706
,436
Shor
t ter
m4,
452
7,29
2Fo
r Mas
ter P
lan
4,97
77,
601
FIn
dire
ct C
ost +
Con
tinge
ncy
%1,
304,
887,
636
0.10
130,
488,
764
proj
ect y
ear
8 ye
ars
622
950
wor
k at
site
50%
311
475
GG
RA
ND
TO
TAL
Excl
ude
VA
T1,
435,
376,
400
320
480
Equ
ival
ent J
apan
ese
Yen
¥71
,768
,819
,980
Item
Cos
t bre
akdo
wn
for
finan
cial
ana
lysi
sM
ater
ial
Fuel
,mac
hine
rysk
illed
LU
nski
lled
L
Tabl
e 6.
7.8
Pre
limin
ary
Proj
ect C
ost P
ortio
n fo
r Mas
ter P
lan
(2)
MAIN REPORT 6 - 93 CHAPTER 6

PECEM INDUSTRIAL AND PORT COMPLEX DEVELOPMENT PLAN FINAL REPORT IN THE FEDERATIVE REPUBLIC OF BRAZIL VOLUME II
6.7.2 Construction Schedule
(1) Construction schedule of the major facility component To construct a breakwater of 3,680 meters length and reclaimed area fill material of approximately 7 million cubic meters, many dump trucks are required to transport stones and fill material. To procure 30 dump trucks of 30 tons capacity at the peak time (assumed to the peak ratio of 1.35) is the biggest bottle neck in the Project. At the time of construction of the existing Pecém Port, approximately 80 numbers of trucks (average 17 tons loaded) took part in the project for transporting stones. The capacity of the trucks was approximate 60% to the proposed 30 of trucks for the new project.
Reclamation fill shall be brought by sea transportation.
1) Supply of stones and reclaimed fills Table 6.7.9 shows the schedule for supplying stones and fills to facility items.
Table 6.7.9 Supply schedule for stones and reclamation fills Supply of Stones/Reclaimed fill Critical path item
unit quantity unit Quantity 1 year 2 year 3 year 4 year 5 year 6 year after 7
1 Breakwater/Revetment m3 3,920,000Dump truck 30 tons unit 19 m3 3,920,000Bottom open carrier fleet 4 m3 3,000,000Carrier with grab bucket fleet 3 m3 920,000
2 Container/Grain/Port service boats m3 633,000Dump truck 30 tons unit 3 m3 470,000Bottom open carrier fleet (1) m3 100,000Carrier with grab bucket fleet 1 m3 370,000Diver crew (Levelling work) fleet 2 m2 22,000
3 Reclaimed fill m3 5,680,0004000HP class pump dredger 1 fleet month 19 m3 5,680,000Buldozer, Roller unit 2 m2 450,000
Description
Necessary number of equipment
ITEM Cycle time etc. Capacity Number Dump truck 18m3x6time/day 30 tons 22 units
Bottom open carrier 350m3x2time/day 350 m3 4 fleets Carrier with grab bucket 300m3x1time/day 500 tons 4 fleets Diver boat with crew 45m2/day for levelling (3 divers) 2 fleets
2) Container and Grain Berth
To fabricate concrete caissons, a floating dock of 6,000 ton-capacity will be procured from abroad. Two concrete caissons will be constructed at the same time. As it takes 55 to 60 days to complete a set of caissons, the cycle time for fabrication of each caisson is estimated at one month. Fabrication of caissons may become a critical path object on the construction schedule.
Floating dock for caisson fabrication has two hoisting cranes. And it accommodates a floating crane of 200 tons lifting capacity and a 1,000 hp. tug boats
MAIN REPORT 6 - 94 CHAPTER 6

PECEM INDUSTRIAL AND PORT COMPLEX DEVELOPMENT PLAN FINAL REPORT IN THE FEDERATIVE REPUBLIC OF BRAZIL VOLUME II
Table 6.7.10 shows the construction schedule for the container and grain berths.
Table 6.7.10 Construction schedule for the Container and Grain Berth Concrete Caisson Works Critical path item *F/D Floating dock
unit equipment unit Q'ty 4 5 6 7 9 10 11
1 Container berth unit 451 Foundation stone2 Fabrication caisson 1 FD-6000 month 453 Super structure4 Reclamation5 Container yard
year 11 12 13 14 15
2 Grain Berth and Port service boats unit 301 Foundation stone2 Fabrication caisson 1 FD-6000 month 303 Super structure4 Reclamation
Description
3) Access bridges and Pier No.3 A pile foundation is designed for the access bridges and Pier No.3. As the swells of the ocean normally into the project site, a floating type of pilling pontoon is not suitable for work at the site. Therefore a self elevating platform shall be selected for pilling works.
Table 6.7.11 Construction schedule for Pier No.3 and Access bridges
Pile Foundation Structureunit quantity unit Quantity 1 year 2 year 3 year 9 10 11
1 Access Bridges m 1,4501 Fabricate/ transport piles 2unit/day sets 1.00 units 300 2 year2 Self Elevating Platform 0.5unit/day fleet 0.96 units 300 2.5 year3 Canti-traveler concrete 30m3/day units 0.76 m3 16,000 2.8 year4 Canti-travellar Form work 3m/day units 0.69 m 1,450 2.8 year
2 Pier No.3 m 3201 Fabricate/ transport piles sets 1.00 units 750 2year2 Self Elevating Platform 0.8unit/day fleet 1.44 units 750 2.6 year3 Canti-traveler (30m3/day) units 0.77 m3 15,000 2.6year4 Slab/finish concrete (1.5m/day) units 0.70 m 680 2.6year
* Working day is assumed as 250 days per year*1 SEP of 1 fleet may be provided . Canti-travellar can be made the same works as SEP.
For construction of Pier No.3, 3 canti-travellars and 1 SEP will be required.
Description
(2) Overall construction schedule Considering the schedule of each facility component, the overall schedule is prepared construction schedule as follows.
MAIN REPORT 6 - 95 CHAPTER 6

PECEM INDUSTRIAL AND PORT COMPLEX DEVELOPMENT PLAN FINAL REPORT IN THE FEDERATIVE REPUBLIC OF BRAZIL VOLUME II
Loca
l cur
renc
y
Fore
ign
curr
ency
2006
.July→
2006
2007
2008
2009
2010
2011
2012
2013
2014
2015
2016
2017
2018
2019
2020
2021
Des
crip
tion
Uni
tQ
uant
ity
AO
ff sh
ore
Wor
ks1
Mob
iliza
tion
& D
emob
iliza
tion
LS1
2Te
mpo
rary
wor
ks
LS1
3A
cces
s Roa
d &
Brid
geC
ompl
etio
n3-
1Te
mpo
rary
por
t roa
dm
440
3-2
New
acc
ess b
ridge
m
1,
510
4Pi
er N
o.3
m68
0St
art O
pera
tion
5B
reak
wat
erm
3,68
06
Con
tain
er T
erm
inal
Parti
ary
oper
atio
n st
art
Star
t ope
ratio
n6-
1C
onta
iner
Ber
ths
m90
06-
2C
onta
iner
Ter
min
alm
900
6-3
Rec
lam
atio
nm
34,
989,
000
6-4
Rev
etm
ent (
-4m
qua
y)m
276
7G
rain
Ber
thm
320
8C
hann
el &
Bas
inLS
1
BO
n la
nd w
orks
1Si
te p
repa
ratio
nH
a10
02
Fenc
e w
ith se
asid
e re
tain
ing
wal
lm
2,00
03
Gat
e/W
atch
hou
se, T
ruck
scal
eLS
1St
art o
pera
tion
4A
dmin
istra
tion
offic
em
21,
800
Gra
in te
rmin
al5
Che
mi-c
oke
stoc
kpile
yar
dm
218
,200
6G
rain
silo
for 2
30,0
00 to
ns st
orag
eC
ell
120
7B
elt C
onve
yer
m4,
800
8R
ailw
ay
m18
,350
9Pa
rkin
g lo
tm
210
,000
CPr
ocur
emen
t of e
quip
men
t
1Q
uays
ide
Gan
try C
rane
unit
62
Rub
ber T
ire M
ount
ed G
antry
Cra
nun
it15
3Tr
acto
r hea
d &
Tra
iler
unit
534
Load
ing/
Unl
oadi
ng M
achi
neun
it2
Yea
r is s
how
n as
the
Fisc
al Y
ear t
hat s
tart
in A
pril
of th
ye y
ear a
nd e
nd in
Mar
ch o
f the
nex
t yea
r
Tabl
e 6.
7.12
C
onst
ruct
ion
Sche
dule
for M
aste
r Pla
n
Item
Shor
t Ter
mL
ong
term
Phas
e I
Phas
e II
Rem
ain
Urg
ent
MAIN REPORT 6 - 96 CHAPTER 6

PECEM INDUSTRIAL AND PORT COMPLEX DEVELOPMENT PLAN FINAL REPORT IN THE FEDERATIVE REPUBLIC OF BRAZIL VOLUME II
6.8 Phased Implementation Plan
6.8.1 Phasing of the Entire Plan The Long-Term Development Plan with the target year 2022 has been proposed as the target and guideline for phased development plans. The Short-Term Development Plan with the target year 2012 that will be proposed after this is considered as the first-phase plan. The remaining portion (i.e. the entire plan, viz. Long-Term Development Plan minus the first phase plan) could be divided into several phased plans following the first phase plan. Taking account of the entire scale of plan, however, the interval between the years 2012 and 2022 viz. 10 years, is considered to be too short to divide the remaining portion into more than two phases. Thus, the entire plan will be divided into the two phased plans, viz. the first phase and the second phase plans.
6.8.2 Implementation Schedule of Phased Plans
First Phase Plan
The schedule of the First Phase Plant in terms of implementation has been roughly drafted as follows.
1) Beginning of 2006: Start of construction works
2) 2012: Completion of construction works
3) 2012: Start of terminal operations
Main project components of the first phase plan are:
• Construction of breakwater,
• Reclamation
• Construction of container, multi-purpose and fruits terminals
• Purchase of container-handling equipment
Second Phase Plan
The schedule of the Second Phase Plan has also been roughly drafted as follows.
1) Beginning of 2014: Start of construction works
2) 2021: Completion of construction works
3) 2022: Start of terminal operations
The following construction works have been planned to be implemented extending from the first and the second phase plans..
• Extension of breakwater,
• Extension of container terminal
Main project components of the second phase plan to be newly added in the second phase plan are:
• Construction of grain, fertilizer and cokes terminals
• New access bridge
MAIN REPORT 6 - 97 CHAPTER 6

PECEM INDUSTRIAL AND PORT COMPLEX DEVELOPMENT PLAN FINAL REPORT IN THE FEDERATIVE REPUBLIC OF BRAZIL VOLUME II
6.9 Economic Analysis
6.9.1 Purpose and Methodology of Economic Analysis The purpose of this section is to appraise the economic feasibility of the Project from the viewpoint of the national economy. This chapter focuses on whether the benefits of the Projects exceed those that could be derived from other investment opportunities in Brazil. All benefits and costs in the economic analysis are evaluated using economic price. In this study, The Economic Internal Rate of Return (EIRR), Net Present Value (NPV) and the benefit / cost ratio (B/C ratio) based on a cost-benefit analysis are used to appraise the feasibility.
6.9.2 Prerequisites for the Economic Analysis
(1) Base Year Costs and benefits estimated in the economic analysis are expressed in the price in the price as of some fixed year throughout the “Project Life” mentioned below. The year is called the “Base Year”. In this analysis, the year 2015 was adopted as the “Base Year” since the costs of the Project were prepared on the bases of current price as of the same year.
(2) Project Life
30 years after completion of the construction was adopted as the “Project Life”. (3) Foreign Exchange Rate
The exchange rate adopted for this analysis is as follows US$1.00 =R$ 2.30.
(4) “With-the-project” Case and “Without-the-project” Case A cost-benefit analysis was conducted on the difference between the “With-the-project” case in which an investment is made and the “Without-the-project” case in which no investment is made; that is the benefits and costs arising from the investment for the Project were compared.
(5) Cargo Throughput
1) “With-the-project” Case The cargo volumes that will be handled under the “With-the-project” case at the ports of Pecem are shown in Table 6.9.1 and Table 6.9.2.
Table 6.9.1 Conventional Cargo Volume (000 ton) Items Cargo Volume Ship Type DWT
Thick slabs 3,000 Bulk Carrier 51,000 Steel Rolls 180 Bulk Carrier 45,000 Steel billets 90 Bulk Carrier 26,000 Bagged Cement 300 Multi-purpose
Ship 32,000
Fresh Fruits 327 Reefer Ship 6,100 Cokes 200 Bulk Carrier 51,000 Soybeans 4,500 Grain Carrier 72,000 Fertilizers 1,000 Bulk Carrier 45,000
MAIN REPORT 6 - 98 CHAPTER 6

PECEM INDUSTRIAL AND PORT COMPLEX DEVELOPMENT PLAN FINAL REPORT IN THE FEDERATIVE REPUBLIC OF BRAZIL VOLUME II
Table 6.9.2 Container Cargo Volume (000 TEUs)
Laden Empty Total Export Cargo excl. CIPP 102 5 107
Cargo from Bahia 30 2 32 CIPP Cargo 71 4 75 Total 203 11 214
Import 67 147 214 Export/Import Total 270 158 428 Transshipment from
North 175 102 277
Container Total 445 260 705
2) “Without-the-project” Case In the “Without-the-project” case, Pecem Port will not provide any port services for above mentioned cargoes and Suape Port will be the only commercial port in North East Region of Brazil for the planned cargo transportation.
6.9.3 Economic Prices
(1) General For the economic analysis, all prices must be expressed as economic prices. In general, the construction costs, the operation costs and the maintenance costs are estimated at market prices. To convert market prices in to economic prices, conversion factors are used.
(2) Standard Conversion Factor (SCF) Import duties and export subsidies create a price difference between the domestic market and the international market. The Standard Conversion Factor (SCF) is applied to determine the economic prices of certain non-traded goods that cannot be valued at border prices. The SCF makes up for this price difference. The SCF is obtained by the following formula:
SCF = M + X
(M + Tm) + (X – Sx + Tx)
Where, M: Total value of imports of goods (CIF) X: Total value of exports of goods (FOB) Tm: Total value of import duties Sx: Total value of export subsidies Tx: Total value of export duties
In this report, the SCF at 2004 was adopted for the analysis. The SCF is 0.9809 (see Table 6.9.3)
MAIN REPORT 6 - 99 CHAPTER 6

PECEM INDUSTRIAL AND PORT COMPLEX DEVELOPMENT PLAN FINAL REPORT IN THE FEDERATIVE REPUBLIC OF BRAZIL VOLUME II
Table 6.9.3 Standard Conversion Factor (SCF) of Brazil (2000 – 2004) (Million USD)
Year 2,000 2,001 2,002 2,003 2,004 Total Import (CIF) M 55,837 55,572 47,240 48,260 62,782 Total Export (FOB) X 55,086 58,224 60,632 73,083 96,475 Total Import Duties Tm 4,605 3,826 2,698 2,627 3,127 Total Export Duties Tx 1 32 25 15 24 Total Export Subsidies Sx 0 0 0 0 0
SCF 96.01% 96.77% 97.58% 97.89% 98.09%
(2) Conversion Factor for Labour
1) Conversion Factor for Skilled Labor (CFSL) When computing CFSL, it is also assumed that the market mechanism is properly functioning, thus CFSL is assumed as 1.0
2) Conversion Factor for Unskilled Labor (CFUL)
Considering the current condition of Brazilian labor market for unskilled labor, CFUL is assumed as 70%.
(3) Value Added Tax (VAT) VAT (17% in Brazil) has to be excluded in the economic analysis.
6.9.4 Benefit of the Project
(1) Benefit Items As benefits to be brought about by the Project, the following items are identified:
• Saving in Container Land Transportation Costs
• Saving in Container Transhipment Costs
• Saving in Sea Transportation Costs
• Value added from soybean for export
• Promotion of regional economic development
• Increase in job opportunity in the region
In this study, items from 1) to 4) are considered to be countable in monetary benefits, and were adopted in the cost benefit analysis. The remaining items, 5) and 6) are mentioned qualitatively in this study.
(2) Estimated Benefits
1) Saving in Container Land Transportation Costs Without this project, the container cargos that are planned to be handled at Pecem port have to be diverted to Suape port. The difference of land transportation costs will be the economic benefit of the project (Table6.9.4)
2) Saving in Container Transshipment Costs Without this project, the container cargos from / to Northern Region have to be transhipped not at Pecem but at Suape. The difference of sea transportation costs
MAIN REPORT 6 - 100 CHAPTER 6

PECEM INDUSTRIAL AND PORT COMPLEX DEVELOPMENT PLAN FINAL REPORT IN THE FEDERATIVE REPUBLIC OF BRAZIL VOLUME II
constitutes the economic benefits. Estimated cost saving of transhipment is US$49 per TEU. constitutes the economic benefits. Estimated cost saving of transhipment is US$49 per TEU.
3) Saving in Sea Transportation Costs 3) Saving in Sea Transportation Costs
Saving in sea transportation costs will be generated from deeper berths to be brought by investment at Pecem Port so as to receive larger vessels (see Table 6.9.5 and Table 6.9.6). If we consider recent tariff increase trend, this estimate of cost saving might be too conservative.
Saving in sea transportation costs will be generated from deeper berths to be brought by investment at Pecem Port so as to receive larger vessels (see Table 6.9.5 and Table 6.9.6). If we consider recent tariff increase trend, this estimate of cost saving might be too conservative.
Export Export Export ExportTo Pecem To Swape Difference Excl CIPP Excl CIPP Bahia From CIPP
km km km ton ton Box Box Box Box Box (000 R$)Ceara 1 26 893 867 424 22 73 0 42,907 22 43,002 41,443Ceara 2 29 897 868 4,592 634 790 0 0 642 1,432 1,382Ceara 3 81 829 749 76,314 66,346 13,126 0 0 67,200 80,326 66,852Ceara 4 185 1,067 883 3,406 700 586 0 0 709 1,295 1,270Ceara 5 195 1,041 846 7,495 913 1,289 0 0 925 2,214 2,082Ceara 6 352 867 515 0 0 0 0 0 0 0 0Ceara 7 306 772 467 20,229 45 3,479 0 0 46 3,525 1,829Ceara 8 124 798 675 154 0 26 0 0 0 26 20Ceara 9 299 702 403 116,073 10,046 19,965 0 0 10,175 30,140 13,500Ceara 10 436 710 274 1,249 316 215 0 0 320 535 163Ceara Total 229,936 79,022 39,550 0 42,907 80,039 162,496 128,542
Piaui 614 1,208 594 8,560 3,970 1,472 0 0 4,021 5,493 3,627Pernambuco 859 47 (812) 24,026 687 4,133 0 0 696 4,828 (4,358)Paraiba 648 172 (476) 8,685 529 1,494 0 0 536 2,030 (1,074)Rio Grande de Norte 593 335 (258) 46,693 5,276 8,031 0 0 5,344 13,375 (3,835)Maranhao 1,050 1,648 598 6,862 6,407 1,180 0 0 6,489 7,670 5,098Tocantis 1,914 2,188 274 188 0 32 0 0 0 32 10Bahia 1,463 795 (668) 24,772 46 4,261 18,256 0 47 22,563 (16,752)Sergipe 1,207 463 (744) 0 67 0 0 0 68 68 (56)Alagoas 1,122 206 (916) 94 2 16 0 0 2 18 (19)Para 1,507 2,091 584 1,309 86 225 0 0 87 312 203Goias 2,670 2,476 (194) 1,084 0 186 0 0 0 186 (40)Minas Gerais 2,619 2,028 (591) 162 0 28 0 0 0 28 (18)Espirito Santo 2,460 1,810 (650) 546 0 94 0 0 0 94 (68)Others 2,350 2,176 (174) 3,685 1,432 634 0 0 1,450 2,084 (403)Sub Total 21,787 18,256 0 18,740 58,783 (17,686)Grand Total 356,602 97,524 61,337 18,256 42,907 98,779 221,279 110,856
km USD/Box R$/BoxTariff 1 0.48 1.11
Table 6.9.4 Estimated Saving of Container Land Transportation Costs
Excess CostRegionRoad Distance Import Import Total
Table 6.9.5 Estimated Tariff Difference (per 1000 ton) from 15,000 DWT bulk carrier Table 6.9.5 Estimated Tariff Difference (per 1000 ton) from 15,000 DWT bulk carrier
Un6.900 n6.900 it: Uit: USD 74,000 SD 74,000 DWT DWT Mile Mile 26,000 26,000 32,000 32,000 45,000 45,000 USA 3,683 4,245 6,561 11,578 11,993 13,584 Central America 4,217 4,856 7,504 13,242 13,724 15,571 Ukraine 5,880 6,745 10,425 18,396 19,096 21,778
Note: Prepared by the Study Team
Table 6.9.6 Saving in Sea Transportation Costs
Items TypicalDestination/Origin Distance DWT Cargo Volume
(1000 Ton)Tariff Dif per
1000 Ton Saving Saving
Mile 1000 Ton USD 1000 USD 1000 R$Thck Slabs Central America 4,217 51,000 1,500 13,724 20,586 47,348Steel Rolls Ukline 5,880 45,000 180 18,396 3,311 7,616Steel billets Central America 4,217 26,000 90 4,856 437 1,005Cement USA 3,683 32,000 300 6,561 1,968 4,527Cokes USA 3,683 51,000 200 11,993 2,399 5,517
Total 28,701 66,013
MAIN REPORT 6 - 101 CHAPTER 6

PECEM INDUSTRIAL AND PORT COMPLEX DEVELOPMENT PLAN FINAL REPORT IN THE FEDERATIVE REPUBLIC OF BRAZIL VOLUME II
4) Value added in soybean production for export In the “Without-the Project” case, soybean export will be impossible. In the “Without-the Project” case, there is no port facility that is able to handle the estimated volume of soybean export from inland area. The value added in soybean production is estimated as USD 40 per ton, considering soybean price and production cost.
6.9.5 Costs of the Project
(1) Initial Investment Costs In the economic analysis, project costs are generally divided into the two categories, viz. foreign portion (traded goods and services) and local portion (non-traded goods and services).
Local portion such as non-traded goods and services that is priced in local (domestic) market is converted into amount expressed in economic prices by multiplying conversion factors (SCF) as mentioned in Section 6.9.3.
Foreign portion such as traded goods and services that is priced in the international market is assumed to be expressed in economic prices as it is.
The project costs in the initial investment expressed in economic prices are summarized in Table 6.9.7 by cost component. The initial investment will be assumed to take seven years for construction. The construction cost was allocated evenly in seven years.
(000 R$)Description Amount
Civil Works 1,145,636Engineering services 38,427
Civil Total 1,184,063Machinery 20 112,200Machinery 15 74,745
Machinery Total 186,945Grand Total 1,371,008
Table 6.9.7 Investment Costs for Economic Analysis
Note: VAT is excluded. SCF is applied to the domestic costs and unskilledlabor cost is adjusted too.
(2) Operation and Maintenance Costs Cost items for management / operation and maintenance are listed below:
1) Maintenance Costs for Infrastructures
It is assumed to be 0.5 percent of initial investment costs of depreciable infrastructures.
2) Maintenance Costs for Equipments It is assumed to be three percent of initial investment costs of equipment.
3) M Fuel and Utilities Costs It is assumed to be five percent of initial investment cost of equipment.
MAIN REPORT 6 - 102 CHAPTER 6

PECEM INDUSTRIAL AND PORT COMPLEX DEVELOPMENT PLAN FINAL REPORT IN THE FEDERATIVE REPUBLIC OF BRAZIL VOLUME II
4) Personnel Costs Estimated personnel costs are shown in Table 6.9.8. According to the 2004 financial report of CEARAPORTOS, the total direct and indirect personnel expenses are 4.17 times of the assumed salary scale. Therefore, this multiplier is applied to all personnel .
5) Administrative Expenses Administrative expenses are assumed to be 60% of personnel expenses.
Table 6.9.8 Estimated Personnel Costs (1) Number of Staffs
GeneralManager
DivisionalManager Engineer Staff Operator Total
R$/month 8,000 3,000 2,000 1,000 800Port Administration Body 1 5 8 31 0 45Container Terminal 1 1 0 5 132Multipurpose Terminal 1 2 15 18Grain Terminal 1 2 15 18Coke Terminal 1 2 15 18Steel Terminal 1 2 15 18
Total 2 10 8 44 192 256
(2) Monthly Personnel Costs (including indirect and miscellaneous personnel costs)(R$)
GeneralMana
139
gerDivisionalManager Engineer Staff Operator Total
Port Administration Body 33,360 62,550 66,720 129,270 0 291,900Container Terminal 33,360 12,510 0 20,850 440,352 507,072Multipurpose Terminal 0 12,510 0 8,340 50,040 70,890Grain Terminal 0 12,510 0 8,340 50,040 70,890Coke Terminal 0 12,510 0 8,340 50,040 70,890Steel Terminal 0 12,510 0 8,340 50,040 70,890
1,082,532
(3) Renewal Investment Costs. From the start of operations and through the project life, equipment that will be procured in the initial stage will be renewed when use life expires. Individual use lives are assumed referring to actual operational experience in the leading ports in the range of 15 to 20 years. The shorter ones (15 years) are Rubber Tire Mounted Gantry Cranes and Loading / Unloading Machines. Longer lives (20 years) were assumed for Quayside Gantry Cranes.
(4) Total Costs
Total project costs comprising those of initial investment, yearly management/ operations and maintenance and renewal of equipment from time to time during the project life are summarized in Table 6.9.9 together with benefits to be generated from the Project and the result of subsequent EIRR calculation mentioned in the subsequent Section 6.9.6.
MAIN REPORT 6 - 103 CHAPTER 6

PECEM INDUSTRIAL AND PORT COMPLEX DEVELOPMENT PLAN FINAL REPORT IN THE FEDERATIVE REPUBLIC OF BRAZIL VOLUME II
6.9.6 Evaluation of the Projects
(1) Calculation of the EIRR (Base Case) The economic internal rate of return (EIRR) based on a cost-benefit analysis was used to appraise the economic feasibility of the said Project. The EIRR is the discount rate that makes the costs and benefits of a project during the project life equal. The formula is as follows:
∑=
− =+−n
iir
CiBi1
1 0)1(
where, n: Period of economic calculation (project life) i: Year Bi: Benefits in the i-th year Ci: Costs in the i-th year r: Discount rate
The resulting EIRR of the Project is17.73 % (see Table 6.9.9).
(2) Sensitivity Analyses
In order to see if the Project is still feasible when some factors vary, the following cases were examined as sensitivity analyses:
Case A: The initial investment costs increase by 10% Case B: The benefits decrease by 10% Case C: The initial investment costs increase by 10% and the benefits decrease
by 10% (Worst scenario) The resulting EIRRs in Cases A, Case B and Case C in the above sensitivity analyses are 16.68 %, 15.72% and 14.74%, respectively.
(3) Benefits-Costs Ratio and Net Present Value Assuming social discount rates of 9%, the respective Benefits-Costs ratios (B/C ratio) of the Project were computed. The resulting B/C ratios of 9% in the discount rate are 1.57.On the other hand, the resulting Net Present Value is 1,377 million in BR.
(4) Evaluation The leading view is that the project is feasible if the EIRR exceeds the opportunity cost of capital. Considering the opportunity cost of capital in each country, it is generally considered that a project with an EIRR of more than 10% is economically justifiable for infrastructure or social service projects.
Apart from the precise definition of the opportunity cost in economics, however, it is not easy to practically find the opportunity cost in an individual country, and hence, the yield on long-term credit adjusted from current price to real price by using deflator could be referred as substitute for the invisible opportunity cost.
Current interest rates on long-term credit in Brazil as of August 2005 are 13.75% for loans. Real interest rate excluding inflation is considered to be 6.85%. Thus, the opportunity cost of Brazil could be considered to be at most 8%. From the above, the figure of 10% as the EIRR criterion is considered to be reasonable.
MAIN REPORT 6 - 104 CHAPTER 6

PECEM INDUSTRIAL AND PORT COMPLEX DEVELOPMENT PLAN FINAL REPORT IN THE FEDERATIVE REPUBLIC OF BRAZIL VOLUME II
The resulting EIRR of the Project is 17.73% and exceeds the above-mentioned criterion in the base case. In addition, even in sensitivity analyses, all of the cases exceed 12%. Thus, the Pecem Port Project is judged economically justifiable.
MAIN REPORT 6 - 105 CHAPTER 6

PECEM INDUSTRIAL AND PORT COMPLEX DEVELOPMENT PLAN FINAL REPORT IN THE FEDERATIVE REPUBLIC OF BRAZIL VOLUME II
(0
00 R
$)
Civi
lM
achi
nery
20
Mac
hine
ry15
Civi
lM
achi
nery
20
Mac
hine
ry15
Fuel
Adm
iPe
rsonn
el
2015
169,
152
00
169,
152
00
00
0(1
69,1
52)
169,
152
0(1
69,1
52)
2016
169,
152
00
169,
152
0(1
69,1
52)
155,
185
0(1
55,1
85)
2017
169,
152
00
169,
152
0(1
69,1
52)
142,
372
0(1
42,3
72)
2018
169,
152
00
169,
152
0(1
69,1
52)
130,
616
0(1
30,6
16)
2019
169,
152
00
169,
152
0(1
69,1
52)
119,
831
0(1
19,8
31)
2020
169,
152
00
169,
152
0(1
69,1
52)
109,
937
0(1
09,9
37)
2021
169,
152
112,
200
74,7
4535
6,09
70
(356
,097
)21
2,32
90
(212
,329
)20
225,
920
112,
200
74,7
459,
347
7,79
412
,990
222,
997
110,
856
31,2
1841
4,00
066
,013
622,
087
399,
090
121,
987
340,
303
218,
316
2023
5,92
011
2,20
074
,745
9,34
77,
794
12,9
9022
2,99
711
0,85
631
,218
414,
000
66,0
1362
2,08
739
9,09
011
1,91
431
2,20
420
0,29
020
245,
920
112,
200
74,7
459,
347
7,79
412
,990
222,
997
110,
856
31,2
1841
4,00
066
,013
622,
087
399,
090
102,
674
286,
426
183,
752
2025
5,92
011
2,20
074
,745
9,34
77,
794
12,9
9022
2,99
711
0,85
631
,218
414,
000
66,0
1362
2,08
739
9,09
094
,196
262,
776
168,
580
2026
5,92
011
2,20
074
,745
9,34
77,
794
12,9
9022
2,99
711
0,85
631
,218
414,
000
66,0
1362
2,08
739
9,09
086
,418
241,
079
154,
661
2027
5,92
011
2,20
074
,745
9,34
77,
794
12,9
9022
2,99
711
0,85
631
,218
414,
000
66,0
1362
2,08
739
9,09
079
,283
221,
174
141,
891
2028
5,92
011
2,20
074
,745
9,34
77,
794
12,9
9022
2,99
711
0,85
631
,218
414,
000
66,0
1362
2,08
739
9,09
072
,737
202,
911
130,
175
2029
5,92
011
2,20
074
,745
9,34
77,
794
12,9
9022
2,99
711
0,85
631
,218
414,
000
66,0
1362
2,08
739
9,09
066
,731
186,
157
119,
426
2030
5,92
011
2,20
074
,745
9,34
77,
794
12,9
9022
2,99
711
0,85
631
,218
414,
000
66,0
1362
2,08
739
9,09
061
,221
170,
787
109,
566
2031
5,92
011
2,20
074
,745
9,34
77,
794
12,9
9022
2,99
711
0,85
631
,218
414,
000
66,0
1362
2,08
739
9,09
056
,166
156,
685
100,
519
2032
5,92
011
2,20
074
,745
9,34
77,
794
12,9
9022
2,99
711
0,85
631
,218
414,
000
66,0
1362
2,08
739
9,09
051
,529
143,
748
92,2
1920
335,
920
112,
200
74,7
459,
347
7,79
412
,990
222,
997
110,
856
31,2
1841
4,00
066
,013
622,
087
399,
090
47,2
7413
1,87
984
,605
2034
5,92
011
2,20
074
,745
9,34
77,
794
12,9
9022
2,99
711
0,85
631
,218
414,
000
66,0
1362
2,08
739
9,09
043
,371
120,
989
77,6
1920
355,
920
112,
200
74,7
459,
347
7,79
412
,990
222,
997
110,
856
31,2
1841
4,00
066
,013
622,
087
399,
090
39,7
8911
1,00
071
,210
2036
74,7
455,
920
112,
200
74,7
459,
347
7,79
412
,990
297,
742
110,
856
31,2
1841
4,00
066
,013
622,
087
324,
345
48,7
4010
1,83
453
,095
2037
5,92
011
2,20
074
,745
9,34
77,
794
12,9
9022
2,99
711
0,85
631
,218
414,
000
66,0
1362
2,08
739
9,09
033
,490
93,4
2659
,936
2038
5,92
011
2,20
074
,745
9,34
77,
794
12,9
9022
2,99
711
0,85
631
,218
414,
000
66,0
1362
2,08
739
9,09
030
,725
85,7
1254
,987
2039
5,92
011
2,20
074
,745
9,34
77,
794
12,9
9022
2,99
711
0,85
631
,218
414,
000
66,0
1362
2,08
739
9,09
028
,188
78,6
3550
,447
2040
5,92
011
2,20
074
,745
9,34
77,
794
12,9
9022
2,99
711
0,85
631
,218
414,
000
66,0
1362
2,08
739
9,09
025
,860
72,1
4246
,282
2041
112,
200
5,92
011
2,20
074
,745
9,34
77,
794
12,9
9033
5,19
711
0,85
631
,218
414,
000
66,0
1362
2,08
728
6,89
035
,662
66,1
8530
,523
2042
5,92
011
2,20
074
,745
9,34
77,
794
12,9
9022
2,99
711
0,85
631
,218
414,
000
66,0
1362
2,08
739
9,09
021
,766
60,7
2138
,954
2043
5,92
011
2,20
074
,745
9,34
77,
794
12,9
9022
2,99
711
0,85
631
,218
414,
000
66,0
1362
2,08
739
9,09
019
,969
55,7
0735
,738
2044
5,92
011
2,20
074
,745
9,34
77,
794
12,9
9022
2,99
711
0,85
631
,218
414,
000
66,0
1362
2,08
739
9,09
018
,320
51,1
0732
,787
2045
5,92
011
2,20
074
,745
9,34
77,
794
12,9
9022
2,99
711
0,85
631
,218
414,
000
66,0
1362
2,08
739
9,09
016
,808
46,8
8730
,080
2046
5,92
011
2,20
074
,745
9,34
77,
794
12,9
9022
2,99
711
0,85
631
,218
414,
000
66,0
1362
2,08
739
9,09
015
,420
43,0
1627
,596
2047
5,92
011
2,20
074
,745
9,34
77,
794
12,9
9022
2,99
711
0,85
631
,218
414,
000
66,0
1362
2,08
739
9,09
014
,147
39,4
6425
,318
2048
5,92
011
2,20
074
,745
9,34
77,
794
12,9
9022
2,99
711
0,85
631
,218
414,
000
66,0
1362
2,08
739
9,09
012
,978
36,2
0623
,227
2049
5,92
011
2,20
074
,745
9,34
77,
794
12,9
9022
2,99
711
0,85
631
,218
414,
000
66,0
1362
2,08
739
9,09
011
,907
33,2
1621
,309
2050
5,92
011
2,20
074
,745
9,34
77,
794
12,9
9022
2,99
711
0,85
631
,218
414,
000
66,0
1362
2,08
739
9,09
010
,924
30,4
7419
,550
2051
74,7
455,
920
112,
200
74,7
459,
347
7,79
412
,990
297,
742
110,
856
31,2
1841
4,00
066
,013
622,
087
324,
345
13,3
8127
,957
14,5
778,
322,
595
3,32
5,68
093
6,54
012
,420
,000
1,98
0,39
018
,662
,610
10,3
40,0
152,
432,
997
3,81
0,80
81,
377,
811
18%
5%67
%11
%10
0%B/
C=15
7%FI
RR=
17.7
3%
Econ
omic
Bene
fit
Net E
cono
mic
Bene
fit
O&M
Inve
stmen
t
Cont
ainer
Lan
dTr
ansp
ortat
ion
Tran
sshi
pmen
tSo
ybea
n Exp
ort
Net B
enef
itTo
tal C
ost
Tabl
e 6.9
.9 E
cono
mic
Inte
rnal
Rat
e of R
etur
n (F
IRR)
of M
aste
r Pla
n
Conv
entio
nal
Carg
o (e
x. S
oy)
Total
Econ
omic
Bene
fitTo
tal C
ost
Total
Bene
fit
Cost
Pres
ent V
alue a
t 9%
Year
MAIN REPORT 6 - 106 CHAPTER 6

PECEM INDUSTRIAL AND PORT COMPLEX DEVELOPMENT PLAN FINAL REPORT IN THE FEDERATIVE REPUBLIC OF BRAZIL VOLUME II
6.10 Financial Analysis6.10.1 Purposes and Methodology of Financial Analysis
The purpose of this section is to appraise the financial viability of the Project (an imaginary entity) from the viewpoint of capital investment and determine whether it could yield sufficient returns. In this study, to measure the financial viability quantitatively, the Financial Internal Rate of Return (FIRR) on gross capital bases was calculated and compared with the current long term real (excluding inflation rate) interest rate whether FIRR could exceed the interest rate.
In addition to FIRR, other typical financial indices containing profitability, loan repayment capacity and operational efficiency and financial statements were required to assess so-called financial soundness from various financial points of views. But these additional analyses will be presented at a subsequent stage of the study.
6.10.2 Prerequisites for the Financial Analysis
(1) Base Year Incomes and expenses estimated in the financial analysis are expressed in the price as of some fixed year throughout the “Project Life” mentioned below. The year is called as “Base Year”. In this analysis, the year 2015 was adopted as the “Base Year” since the costs of the Project were prepared on the bases of current price as of the same year.
(2) Project Life 30 years was adopted as the “Project Life”.
(3) Financial Terms of Loans to be Raised for the Project
The Project contains both the infrastructures that will be prepared by public investment and port facilities that will be invested by private initiatives. Financial terms of loans to these two kinds of investment will be studied in a subsequent stage of the study.
(4) Volume of Cargo and the Number of Calling Vessels at Pecem Port
1) The Volume of Cargo
Cargo handling at Pecem is assumed to be started in 2022. Yearly cargo throughput is shown in Table 6.10.1 and Table 6.10.2.
2) The Number of Calling Vessels
Conventional Cargo Ships 452 Container Ships 777
(5) Port Tariff Port Tariff is estimated by the Study Team based on the current tariff table (as of Aug. 2005) and common practice in port business.
1) Vessel Service Charge - Mooring and Unmooring: R$ 1,050 per ship call
MAIN REPORT 6 - 107 CHAPTER 6

PECEM INDUSTRIAL AND PORT COMPLEX DEVELOPMENT PLAN FINAL REPORT IN THE FEDERATIVE REPUBLIC OF BRAZIL VOLUME II
2) Wharfage -Solid Bulk R$ 2.20 per ton -Break Bulk R$ 1.68 per ton -Liquid Bulk R$ 0.39 Per ton -Laden Container R$ 27.12 per box -Empty Container R$13.92 per box
3) Cargo-Handling Charge -Solid Bulk R$ 13.20 per ton -Break Bulk R$ 10.08 per ton -Liquid Bulk R$ 2.34 per ton -Laden Container R$ 252.88 per box -Empty Container R$114.88 per box
6.10.3 Revenues Revenues will be gained from providing port services to shippers and shipping lines. The amount of the revenues is estimated by multiplying the port tariff and the volume of cargo in terms of cargo handling charge or by calculating vessel service charge The estimated annual revenues are summarized in Table 6.10.1.
(000 R$)Wharfage CHC Total
(000 TEU) (000 Box) Per Box Per Box Per BoxLaden Container 445 259 27.12 252.88 280.00 72,442Empty Container 260 151 13.92 114.08 128.00 19,349
Total 91,791
Wharfage CHC Total (000 ton) Per ton Per ton Per ton
Solid Bulk 10,700 2.20 13.20 15.40 164,780Break Bulk 3,797 1.68 10.08 11.76 44,653Liquid Bulk 9,450 0.39 2.34 2.73 25,799
Total 235,231
Port ChargeR$
Container 777 1050 816Conventional 452 1050 475
Total 1,290
328,312Total Revenue
Charge for Vessel
Cargo Volume
Cargo Volume
Charge for Cargo
Charge for Cargo
Ship Calls
Table 6.10.1 Port Revenue Estimates of Year 2022
Revenue
Revenue
Revenue
MAIN REPORT 6 - 108 CHAPTER 6

PECEM INDUSTRIAL AND PORT COMPLEX DEVELOPMENT PLAN FINAL REPORT IN THE FEDERATIVE REPUBLIC OF BRAZIL VOLUME II
6.10.4 Expenses
(1) Expenses for Initial Investment Expenses for the initial investment for the Project are summarized in Table 6.10.2 by cost component. The initial investment will be assumed to take seven years for construction. The construction cost was allocated evenly in seven years.
(000 R$)Description Amount
Civil Works 1,425,740Engineering services 44,959
Civil Total 1,470,700Machinery 20 131,274Machinery 15 87,452
Machinery Total 218,726Grand Total 1,689,425
Note: VAT (17%) is added.
Table 6.10.2 Investment Cost for Financial Analysis
(2) Management/Operations and Maintenance Expenses Expenses items for management/operations and maintenance are listed below:
1) Maintenance for Infrastructures It is assumed to be 0.5 percent of initial investment expenses of depreciable infrastructures.
2) Maintenance for Equipment It is assumed to be three percent of initial investment expenses of equipment.
3) Fuel and Utilities It is assumed to be five percent of initial investment expenses of equipment
4) Personnel Expenses Personnel expenses estimated are shown in Table 6.9.8. 5) Renewal Investment From the start of operations and through the project life, equipment that will be procured in the initial stage will be renewed when use life expires. Individual use lives are assumed referring to actual operational experience in the leading ports in the range of 15 to 20 years. The shorter ones (15 years) are Rubber Tire Mounted Gantry Cranes and Loading / Unloading Machines. Longer lives (20 years) were assumed for Quayside Gantry Cranes.
6) Total Expenses Total project expenses comprising those of initial investment, yearly management/operations and maintenance and renewal of equipment from time to time during the project life are summarized in Table 6.10.3 together with benefits to be
MAIN REPORT 6 - 109 CHAPTER 6

PECEM INDUSTRIAL AND PORT COMPLEX DEVELOPMENT PLAN FINAL REPORT IN THE FEDERATIVE REPUBLIC OF BRAZIL VOLUME II
generated from the Project and the result of subsequent FIRR calculation mentioned in the subsequent Section 6.10.5.
6.10.5 Evaluation of the Projects
(1) Viability of the Project
1) Calculation of the FIRR (Base Case) The financial internal rate of return (FIRR) was used to appraise the financial viability of the said Project. The FIRR is the discount rate that makes net present values of cash inflow and outflow during the project life equal. The formula is as follows:
∑=
− =+−n
iir
OiIi1
1 0)1(
where, n: Project life i: Year Ii: Cash inflow in the i-th year Oi: Cash outflow in the i-th year r: Discount rate
The resulting FIRR of the Project is 11.60% (see Table 6.10.3).
2) Sensitivity Analyses In order to see if the Project is still financially viable when some factors vary, the following cases were examined as sensitivity analyses:
Case A: The initial investment costs increase by 10% Case B: The benefits decrease by 10% Case C: The initial investment costs increase by 10% and the benefits decrease
by 10% (Worst scenario) The resulting FIRRs in Cases A and B in the above sensitivity analyses are 10.77%, 10.40% and 9.61%, respectively.
3) Evaluation
The resulting FIRR of the Project is 11.60% exceeds the real long term interest rate (excluding inflation rate) for private investment in current Brazil.
In addition, even in sensitivity analyses, all of the cases exceed substantially the real long term interest rate mentioned above. Thus, the Pecem Port Project is judged financially viable.
MAIN REPORT 6 - 110 CHAPTER 6

PECEM INDUSTRIAL AND PORT COMPLEX DEVELOPMENT PLAN FINAL REPORT IN THE FEDERATIVE REPUBLIC OF BRAZIL VOLUME II
Civ
ilM
achi
nery
20
Mac
hine
ry 1
5C
ivil
Mac
hine
ry 2
0M
achi
nery
15
Fuel
Ado
mi
Pers
onne
l20
1521
0,10
00
021
0,10
0(2
10,1
00)
210,
100
0(2
10,1
00)
2016
210,
100
00
210,
100
(210
,100
)19
2,75
20
(192
,752
)20
1721
0,10
00
021
0,10
0(2
10,1
00)
176,
837
0(1
76,8
37)
2018
210,
100
00
210,
100
(210
,100
)16
2,23
60
(162
,236
)20
1921
0,10
00
021
0,10
0(2
10,1
00)
148,
840
0(1
48,8
40)
2020
210,
100
00
210,
100
(210
,100
)13
6,55
10
(136
,551
)20
2121
0,10
013
1,27
487
,452
428,
826
(428
,826
)25
5,69
50
(255
,695
)20
227,
353
3,93
82,
624
10,9
367,
794
12,9
9045
,636
328,
312
282,
676
24,9
6417
9,59
815
4,63
420
237,
353
3,93
82,
624
10,9
367,
794
12,9
9045
,636
328,
312
282,
676
22,9
0316
4,76
914
1,86
620
247,
353
3,93
82,
624
10,9
367,
794
12,9
9045
,636
328,
312
282,
676
21,0
1215
1,16
413
0,15
220
257,
353
3,93
82,
624
10,9
367,
794
12,9
9045
,636
328,
312
282,
676
19,2
7713
8,68
311
9,40
620
267,
353
3,93
82,
624
10,9
367,
794
12,9
9045
,636
328,
312
282,
676
17,6
8512
7,23
210
9,54
620
277,
353
3,93
82,
624
10,9
367,
794
12,9
9045
,636
328,
312
282,
676
16,2
2511
6,72
610
0,50
120
287,
353
3,93
82,
624
10,9
367,
794
12,9
9045
,636
328,
312
282,
676
14,8
8510
7,08
892
,203
2029
7,35
33,
938
2,62
410
,936
7,79
412
,990
45,6
3632
8,31
228
2,67
613
,656
98,2
4684
,590
2030
7,35
33,
938
2,62
410
,936
7,79
412
,990
45,6
3632
8,31
228
2,67
612
,529
90,1
3477
,605
2031
7,35
33,
938
2,62
410
,936
7,79
412
,990
45,6
3632
8,31
228
2,67
611
,494
82,6
9271
,198
2032
7,35
33,
938
2,62
410
,936
7,79
412
,990
45,6
3632
8,31
228
2,67
610
,545
75,8
6465
,319
2033
7,35
33,
938
2,62
410
,936
7,79
412
,990
45,6
3632
8,31
228
2,67
69,
674
69,6
0059
,926
2034
7,35
33,
938
2,62
410
,936
7,79
412
,990
45,6
3632
8,31
228
2,67
68,
876
63,8
5354
,978
2035
7,35
33,
938
2,62
410
,936
7,79
412
,990
45,6
3632
8,31
228
2,67
68,
143
58,5
8150
,438
2036
87,4
527,
353
3,93
82,
624
10,9
367,
794
12,9
9013
3,08
732
8,31
219
5,22
521
,786
53,7
4431
,958
2037
7,35
33,
938
2,62
410
,936
7,79
412
,990
45,6
3632
8,31
228
2,67
66,
854
49,3
0642
,453
2038
7,35
33,
938
2,62
410
,936
7,79
412
,990
45,6
3632
8,31
228
2,67
66,
288
45,2
3538
,948
2039
7,35
33,
938
2,62
410
,936
7,79
412
,990
45,6
3632
8,31
228
2,67
65,
769
41,5
0035
,732
2040
7,35
33,
938
2,62
410
,936
7,79
412
,990
45,6
3632
8,31
228
2,67
65,
292
38,0
7432
,781
2041
131,
274
7,35
33,
938
2,62
410
,936
7,79
412
,990
176,
910
328,
312
151,
402
18,8
2234
,930
16,1
0820
427,
353
3,93
82,
624
10,9
367,
794
12,9
9045
,636
328,
312
282,
676
4,45
432
,046
27,5
9120
437,
353
3,93
82,
624
10,9
367,
794
12,9
9045
,636
328,
312
282,
676
4,08
729
,400
25,3
1320
447,
353
3,93
82,
624
10,9
367,
794
12,9
9045
,636
328,
312
282,
676
3,74
926
,972
23,2
2320
457,
353
3,93
82,
624
10,9
367,
794
12,9
9045
,636
328,
312
282,
676
3,44
024
,745
21,3
0620
467,
353
3,93
82,
624
10,9
367,
794
12,9
9045
,636
328,
312
282,
676
3,15
622
,702
19,5
4620
477,
353
3,93
82,
624
10,9
367,
794
12,9
9045
,636
328,
312
282,
676
2,89
520
,828
17,9
3320
487,
353
3,93
82,
624
10,9
367,
794
12,9
9045
,636
328,
312
282,
676
2,65
619
,108
16,4
5220
497,
353
3,93
82,
624
10,9
367,
794
12,9
9045
,636
328,
312
282,
676
2,43
717
,530
15,0
9320
507,
353
3,93
82,
624
10,9
367,
794
12,9
9045
,636
328,
312
282,
676
2,23
616
,083
13,8
4720
5187
,452
7,35
33,
938
2,62
410
,936
7,79
412
,990
133,
087
328,
312
195,
225
5,98
114
,755
8,77
41,
594,
779
2,01
1,18
841
6,40
9
B/C
=12
6%FI
RR
=11
.60%
Tota
l Cos
tTo
tal C
ost
Reve
nue
Net
Inco
me
Yea
r
Tab
le 6
.10.
3 F
inan
cial
Inte
rnal
Rat
e of
Ret
urn
(FIR
R) o
f Mas
ter
Plan
Pre
sent
Val
ue a
t 9%
Cost
Rev
enue
Net
Inco
me
Inve
stm
ent
O&
M
MAIN REPORT 6 - 111 CHAPTER 6

PECEM INDUSTRIAL AND PORT COMPLEX DEVELOPMENT PLAN FINAL REPORT IN THE FEDERATIVE REPUBLIC OF BRAZIL VOLUME II
CHAPTER 7 PORT MANAGEMENT AND OPERATION
7.1 Management and Operation of Pecém Port The trend today is for container vessels to become larger in size with deeper draft.
Although the Pecem port is an open port, it takes a long time manoeuvre vessels upon entering into and leaving from the port. In order to maintain competitiveness it is necessary to shorten the vessel manoeuvring time to the standard of major container ports around the world.
It is recommended that even in the case of large vessels such as Panamax sized vessels, the system should be established where the berthing and the container operation can be commenced within 1 hour.
To that end, the improvement in technique of pilots and immediate introduction of high power tug boats are essential.
Cargo handling operation system in the short-term project is just a transit point to accomplish long-term project operation system in the master plan.
To that end, it is necessary to improve the efficiency of the current whole operation system and introduce an efficient system to not only container operation but also for break-bulk cargo.
7.1.1 General The Brazilian constitution defines that the development of its ports is to be conducted directly by the federal government or by concessions of the federal government.
Pecém Port falls into the “private port which gets a concession of port development category”. Pecém Port also falls into the “Terminal ports category”, which can handle third-party cargo as well as its own cargo..
CEARÁPORTOS, which is a public company established by Ceará State, is the body of management and operation of Pecém Port. CEARÁPORTOS is close to a company of management and operation of its exclusive terminal, rather than a port management body that manages and operates port area and facilities in general.
However, Pecém Port handles a considerable number of container cargoes at the present time, and is expected to be used for more multiple purposes in the future. Pecém Port is in the process of changing from a single use terminal to a highly public port.
(1) Pecem Port has a short history since it was opened only four years ago.
Although current operational ratio is around 30% out of the total facilities, it is expected to increase because of the increase in export/import cargoes handled and the number of calling vessels due to the sharp growth of the economy around Ceara state.
Pecem Port is one of the nation’s most notable deeper sea ports. In addition, it is geographically near to the European continent and Western Africa. Thus, it is considered the most suitable port among the Brazilian ports for large-scaled container vessels.
MAIN REPORT 7 - 1 CHAPTER 7

PECEM INDUSTRIAL AND PORT COMPLEX DEVELOPMENT PLAN FINAL REPORT IN THE FEDERATIVE REPUBLIC OF BRAZIL VOLUME II
In order to take full advantage of the port, it is critical to provide port users with international standard of service with regard to port operation.
To that end, CEARAPORTOS should provide to shippers and shipping companies, which are port users in the area of port management and operation, a skilled organization and best performance.
CEARAPORTOS, in order to maintain world-class service and operation, should establish a worldwide information network so that it can create an organizational system and strategy that is a step ahead of its competitors.
(2) Port Authority Main Administration and Management Jobs
CEARAPORTOS is an entity which manages and operates Pecen Port. It was established as public corporation by State of Ceara.
Currently, CEARAPORTOS is characterized as a terminal management body rather than a port authority. The reason for this characterization is that the Pecem port was opened in 2001 and is insufficient both in organizational aspects and human resource aspects.
Generally, the affairs/businesses of a port authority are as follows:
• Port and harbour construction program under the master plan
• Management of maintenance of port and harbour facilities
• Construction management of port and harbour facilities
• Management within a port and harbour area
• General management of port and harbour facilities
• Establishment and public announcement of suitable tariff classification and rates
• Management of vessel movement
• Port statistics management
• Port and harbour utilization advancement
Although there is a slight difference among various ports in the above-mentioned affairs/businesses, it is recommended that following functions be improved promptly at the Pecem port.
• Enhancement of plan-making function and procurement of human resources
• Strengthening of operational section
• Strengthening of sales & promotion section
• Strengthening of cooperation between CIPP and CEARAPORTOS
7.1.2 Organization of CEARÁPORTOS CEARÁPORTOS has three departments under the president. One takes charge of the commercial development, that is commercial, planning and communication developments. The other department is in charge of operation and maintenance of terminal facilities. The third one is the administrative department of the firm.
MAIN REPORT 7 - 2 CHAPTER 7

PECEM INDUSTRIAL AND PORT COMPLEX DEVELOPMENT PLAN FINAL REPORT IN THE FEDERATIVE REPUBLIC OF BRAZIL VOLUME II
CEARÁPORTOS presently employs 42 persons. Figure 7.1.1 shows the organization chart of CEARÁPORTOS.
Figure 7.1.1 Organization Chart of CEARÁPORTOS
Management of Commercial Development
Management of Infrastructure & Development Operational
Management of Business Administration
Consultant-Vessels of Processes
(Board of Directors)
President
Council of Administration-1
Council Fiscal-2
King of Occupation
1. Attorney’s Office 2. Controller Office 3. Commercial, Planning & Social Communication 4. Development of Super Infrastructure 5. Business Administration & System of Information 6. Operations 7. Environment Source: CEARAPORTOS Data
General Assembly
7.1.3 Account of CEARÁPORTOS
Table 7.1.1 shows the outline of revenue and expense of CEARÁPORTOS in 2003 and 2004.
The revenue in 2004 increased by 60 % compared to that in 2003. However, the income in 2004 increased by 35 % compared to that in 2003. For this reason, the deficit of 2004 increased by R$28,000 to R$2,628,000.
Figure 7.1.2 shows the breakdown of the operating income and expenses in 2004.
As for the operating income, the “Container Handling Charge”, which includes handling and stacking charge, accounts for 42 % of all the income. The “Reefer Plug Charge” is an income basically corresponding to electricity expense. This portion is therefore appropriated for a payment of electricity expense.
Therefore the greater part of the income is obtained from handling container cargo.
MAIN REPORT 7 - 3 CHAPTER 7

PECEM INDUSTRIAL AND PORT COMPLEX DEVELOPMENT PLAN FINAL REPORT IN THE FEDERATIVE REPUBLIC OF BRAZIL VOLUME II
On the other hand, “Personal Expenses” and “Outsourcing” account for about two thirds of all the expenses
Table 7.1.1 Revenue and Expense of CEARÁPORTOS Unit:R$
2003 2004REVENUE 3,551,518.71 5,665,701.66 Operating income 3,425,885.94 5,320,248.81 Miscellaneous income 0.00 8,123.82 Interest income 125,459.25 66,222.46 Nonoperating income 173.52 271,106.57
EXPENSE 6,156,258.17 8,293,733.53 Operating expenses 6,156,258.17 8,293,733.53
Net Income(-) (2,604,739.46) (2,628,031.87)Source: CEARAPORTOS data
Breakdown of Operational Income (2004)
ContainarHandling, 42%
Reefer PlugCharge, 31%
General CargoHandling, 10%
WarehouseCharge, 13% Others, 4%
Breakdown of Operating Expenses (2004)
PesonalExpenses, 28%
Electricity,Water, etc., 19%
Outsourcing,etc., 40%
others, 13%
Figure 7.1.2 Breakdown of Income and Expenses
7.2 Problems of Management and Operation of Pecém Port
7.2.1 General
Generally, port management bodies assume the responsibility for maintaining their ports in good condition for public utilization. Thus, the following points are the functions which port management bodies are expected to have.
• To administer overall port activities
• To establish Port Development Master Plan
• To compile port statistics for port development
• To implement construction and maintenance works for port facilities
• To maintain port area and port facilities in good operating condition
• To maintain and improve environmental conditions of the port
• To regulated the use of port facilities
• To ensure the adequate provision of port services
• To prepare port tariff and collect fees and charges from port users
• To conduct surveys for port promotion
MAIN REPORT 7 - 4 CHAPTER 7

PECEM INDUSTRIAL AND PORT COMPLEX DEVELOPMENT PLAN FINAL REPORT IN THE FEDERATIVE REPUBLIC OF BRAZIL VOLUME II
As CEARÁPORTOS is considered as a port management body which manages and operates a full-scale port, it has some insufficient points in terms of functions and organization for port management body.
7.2.2 Problems of Management and Operation of Pecém Port
(1) Deficit of Revenue and Expense Accounts The revenue and expense accounts of CEARÁPORTOS have a deficit, although Pecém Port was opened only four years ago.
The greater part of the expense corresponds to the expense of personal and outsourcing for the administration. CEARÁPORTOS doesn’t pay for any depreciated cost related to the port facilities, because these facilities were constructed with public funds.
The greater part of the income is obtained from the handling and storing charges of container cargo. Although the port income increases sharply as increasing cargo handling, the amount of deficit doesn’t decrease because the income can’t cover the expense.
Therefore, CEARÁPORTOS needs to improve its revenue by setting up appropriate port tariffs, and reducing its operating expenses.
(2) Lack of Function for Port Plan CEARÁPORTOS does not have a port planning section and is not staffed with port planners. There is an insufficient capability of port development planning within CEARÁPORTOS. At present, Ceará State is the one entity assuming for planning Pecém Port.
(3) Insufficient Capability of Port Promotion For promoting the utilization of the port and collecting port cargo, it is important to conduct port promotion. However, CEARÁPORTOS has not been positively conducting port promotion. Although marketing research is also an effective measure to find cargoes, CEARÁPORTOS is not staffed with persons who have professional abilities in this area.
(4) Strengthening of Management and Operation Department
The use of Pecém Port has been increasing quickly, though no remarkable congestion in the use of the terminal facilities has occurred. As the number of calling vessels increase, Pecém Port would need to coordinate the use of the terminal facilities.
In order to perform port management efficiently, it is necessary to grasp various information related to port activities, such as the number of calling vessels, cargo data (volume, items, origin and destination, etc.), traffic data. CEARÁPORTOS does not necessarily collect and file these adequate figures.
(5) Lack of Collaboration with CIPP Pecém Port has been developed to work in collaboration with the development of CIPP. CEARÁPORTOS does not sufficiently utilize merits of CIPP as an incentive for promoting the use of Pecém Port. It is necessary for the development of Pecém Port and CIPP to introduce measures of mutual collaboration between Pecém Port and CIPP.
MAIN REPORT 7 - 5 CHAPTER 7

PECEM INDUSTRIAL AND PORT COMPLEX DEVELOPMENT PLAN FINAL REPORT IN THE FEDERATIVE REPUBLIC OF BRAZIL VOLUME II
7.3 Port Management and Operation
7.3.1 Port Management Body The management bodies of the main ports in the world have various types, because each port has their specific geographical, social and historical conditions and are under the influence of their government’s policies.
Port management bodies are divided into a public sector and a private sector, when they are roughly divided. Furthermore, they can be classified into central government, local government, public corporation and private company.
The main ports in the world are classified into the following categories, depending to category of port management body,
• Central Government
Ex. Port of Hong Kong • Local Government
Ex.-1 Both budget and decision-making are included in the other sector of the local government. Port of Hamburg, Ports in southeast area of U.S., etc.
Ex.-2 Budget is independent, but decision-making is included in the other sector.
Port of Rotterdam, Port of Antwerp, etc. Ex.-3 Both budget and decision-making are independent.
Ports in southwest area of U.S., etc. • Public Corporation
Ex.-1 Government-affiliated public corporation NY/NJ port Authority, Singapore PSA, etc.
Ex.-2 Public Corporation Port of Seattle, Port of Tacoma, Port of Portland, etc.
• Private Company
Ex. Ports of United Kingdom 7.3.2 Involvement of Central Government on Port Development
Table 7.3.1 shows the government involvement on construction and maintenance works of infrastructures in water area, such as breakwaters and channels. In the case of ports administrated by the public sector, although there are a few differences of measures between Europe countries and U.S., central governments basically perform financial participation in construction and maintenance works of breakwaters, channels and so on. Port development is highly risky because developing ports needs large investments. In particular, water area facilities such as breakwater and channels are non-profitable facilities. Therefore, in order to have the private sector participate in terminal operation and perform competitive activity, main ports in the world generally prepare the condition to attract private sectors through the involvement of central government.
MAIN REPORT 7 - 6 CHAPTER 7

PECEM INDUSTRIAL AND PORT COMPLEX DEVELOPMENT PLAN FINAL REPORT IN THE FEDERATIVE REPUBLIC OF BRAZIL VOLUME II
Table 7.3.1 Financial Scheme of Port Development
Channel Navigation Aids Breakwater Berth, Dock, Reclamation
GermanyIn port areaCG: 0%PB: 100%
Construction/MaintenanceCG: 0%PB: 100%
ConstructionCG: 100%PB: 0%
ConstructionCG: 100%PB: 0%
ConstructionCG: 60-100%PB: 40-0%
MaintenanceCG: 100%PB: 0%
MaintenanceCG: 0%PB: 100%
MaintenanceSharing-betweenLocal Government & PB
ConstructionCG: 0%PB: 100%
MaintenanceCG: 0%PB: 100%
ConstructionCG: 80%PB: 20%
ConstructionCG: 80%PB: 20%
MaintenanceCG: 100%PB: 0%
MaintenanceCG: 100%PB: 0%
ConstructionOut of port areaCG: 80-40%PB: 20-60%In port areaCG: 0%PB: 100%MaintenanceOut of port areaCG: 100%PB: 0%In port areaCG: 0%PB: 100%
Source: ESPO Fact finding Report 1996Note: CG=Central Government, PB=Port Management Body
Construction/MaintenanceOut of port areaCG: 100%PB: 0%ConstructionCG: 100% PB: 0%MaintenanceCG: 100% PB: 0%
Holland
Construction/MaintenanceCG: 0%PB: 100%
Belgium
UnitedKingdom
Construction/MaintenanceCG: 100%PB: 0%
Construction/MaintenanceCG: 100%PB: 0%
Installation/MaintenanceOut of port areaCG: 100%PB: 0%In port areaCG: 0%PB: 100%
Installation/MaintenanceOut of port areaCG: 100%PB: 0%In port areaCG: 0%PB: 100%
InstallationOut of port areaCG: 100%PB: 0%In port areaCG: 60-80%PB: 40-20%MaintenanceCG: 100%PB: 0%
Different by each port
U.S.
Construction/MaintenanceCG: 0%PB: 100%
Different by each portConstruction/MaintenanceCG: 0%PB: 0%
Installation/MaintenanceCG: 100%PB: 0%
France
7.3.3 Terminal Operation
(1) Type of Container Terminal There are three types of container terminal utilization, as follows;
• Open use (Public use)
• Prioritized use
MAIN REPORT 7 - 7 CHAPTER 7

PECEM INDUSTRIAL AND PORT COMPLEX DEVELOPMENT PLAN FINAL REPORT IN THE FEDERATIVE REPUBLIC OF BRAZIL VOLUME II
• Exclusive use
“Open use (Public use)” is a utilization type that makes every shipping companys to be served on the basis of “First come, first served”
“Prioritized use” is a utilization type where specific shipping companies are given over priorities, tariff and available time on certain conditions such as cargo volumes under “Open use”
“Exclusive use” is a utilization type where a specific shipping company exclusively leases a terminal only for its own fleets and alliance.
The principal ports in Europe adopt “Open use”. Terminal operators lease land or facilities from port management bodies and adopt “Open use”. “Open use” increases the effectiveness of terminal operation because terminal operators make their operation active and compete with other operators of the same port. And the effectiveness rises due to the use of multiple shipping companies.
On the other hand, “Exclusive use” is adopted at the ports in Japan, Taiwan, and U.S. West Coast, and is mainly used on the liner services of the Pacific. In the case in which a ship company allocates vessels and performs transhipment operation intensively, it is an important function, for there is no interference from the useinterfere of the terminal by other shipping companies. “Exclusive use” is an attractive type for port authorities because they can make their terminal active without effort. However, restructuring an alliance between shipping companies could influence the location of an exclusive terminal, due to the measures taken to prevent overlapping.
In order to cope with the shipping company’s strategy and alliance, it should be considered that ports in the future adopt not only “Exclusive use” but the utilization which combines “Open use” and “Prioritized use” properly.
(2) Patterns of Development, Management and Operation There are several patterns of development, management and operation of container terminal. Possible patterns are shown in Table 7.3.2.
The main advantages and disadvantages of each pattern are as follows;
Case A, B 1) Advantages
• Since the public sector owns the berths, it can improve the facilities or the equipment easily if necessary, according to master plan in the future.
• (Case B) Generally speaking, cargo handling performed by private stevedoring companies is more efficient than that performed by the public sector.
2) Disadvantages
• (Case A) Generally speaking, cargo handling efficiency of the public sector is lower compared with the private sector due to the absence of competition in the market.
Case C, D 1) Advantages
MAIN REPORT 7 - 8 CHAPTER 7

PECEM INDUSTRIAL AND PORT COMPLEX DEVELOPMENT PLAN FINAL REPORT IN THE FEDERATIVE REPUBLIC OF BRAZIL VOLUME II
• In case of a need for a master plan in the future, the public sector can improve
facilities or equipment since it owns the land, although the berths are occupied by a private company.
• (Case D) Since the superstructure is built by the private sector, this type is useful when the public sector does not have sufficient funds and the construction of new port facilities is urgent.
2) Disadvantages
• (Case C) Since the public sector is responsible for construction work, the public sector needs to provide funds.
Case E 1) Advantages
• In case of need, according to a master plan in the future, the public sector can improve facilities or equipment since it owns the land, although the berths are occupied by a private company.
• Since a private company reclaims land from the sea and builds the berth, the public sector does not need to provide funds.
2) Disadvantages
• In case a private company performs a reclamation, inappropriate developments of public property cannot be prevented. Therefore, the master plan should be drawn by the public sector.
Case F 1) Advantages
• Since a private company reclaims land from the sea and builds the berth, the public sector does not need provide funds.
2) Disadvantages
• Because the berths have been owned by a private company for a long time, the public sector cannot improve the port facilities or equipment easily if the implementation of its own development plan in the future becomes necessary. In particular, in case the main berths of the port are occupied by specific shipping companies, there is a risk the public sector cannot control the port.
MAIN REPORT 7 - 9 CHAPTER 7

PECEM INDUSTRIAL AND PORT COMPLEX DEVELOPMENT PLAN FINAL REPORT IN THE FEDERATIVE REPUBLIC OF BRAZIL VOLUME II
Table 7.3.2 Patterns of Development, Management and Operation of Container
Terminal A B C D E F
ChannelsBreakwaterInfrastructureSuperstructure ○ ●Land ○ ○ ○ ●Terminal Facilities ●* ●* ●* ●
○ ● ● ● ● ●
OpenOpen
(Prioritized)(Exclusive)
Open(Prioritized)(Exclusive)
Open(Prioritized)(Exclusive)
Open(Prioritized)(Exclusive)
Open(Prioritized)(Exclusive)
Note 1 ○: Public, ●: PrivateNote 2 *: Land lease system
○
Construction
Ownership ○
○○
○ ○
● ●
Terminal Operations
Master PlanPattern
Berth Allocation
7.4 Proposal of Improvement of Management and Operation of Pecém Port
7.4.1 Sharing the Roles of Government and CEARÁPORTOS
Most of the facilities in Pecém Port have been constructed with national funds. The future expansion of Pecém Port requires not only national funds, but also CEARÁPORTOS’s self - financed funds. And CEARÁPORTOS should introduce private funds if necessary. It is important that the concept of sharing the roles between government and CEARÁPORTOS be determined in advance on the basis of a contribution of Pecém Port to the regional development.
As the basic concept in the case, central and state government should have a certain involvement with the development of Pecém Port through their funds for the reasons as follows;
• The purpose of developing Pecém Port is that heavy industries such as steel industry be implemented in CIPP and the economic development of northeast region be promoted through the integrated activity of Pecém Port and CIPP, which is one of the national projects of development of northeast region.
• As it takes time to attract industries in CIPP, Pecém Port is only beginning to play a role of industrial. By contrast, Pecém Port is expected to be even more a public port because the port is obtaining a function of commercial port with increasing container cargo.
7.4.2 Improvement of the Duties of CEARÁPORTOS
(1) Formulating of Port Development Plan 1) Contents of Port Development Plan
CEARÁPORTOS should conduct the port development plan by itself in the future. The port development plan includes long-term master planning, short-time planning, individual project planning and so on.
To complete the port development plan, CEARÁPORTOS needs to examine various items as follows;
• Recognition of current situation
• Analysis of economic trend of the hinterland
MAIN REPORT 7 - 10 CHAPTER 7

PECEM INDUSTRIAL AND PORT COMPLEX DEVELOPMENT PLAN FINAL REPORT IN THE FEDERATIVE REPUBLIC OF BRAZIL VOLUME II
• Forecast of cargo volume
• Land-use planning
• Facilities layout planning
• Feasibility study
• Assessment of environmental impact
• Annual plan of projects, etc.
2) Area of Port Development Plan
The port development plan is described within the area which is required to ensure smooth activity of the said port. In the case which the port area of landside and waterside is regulated by a law, generally the port development plan is drawn up in this area. For Pecém Port, the port area is determined by a concession of the government after completing the facilities. CEARÁPORTOS therefore needs to decide the port area, which is required to ensure smooth activity of Pecém Port in the future, and to formulate its port plan.
In the case of determining the port area, it is necessary that the land area include sites that can house facilities, such as a distribution centre, which are linked directly with the port activity. In Chapter 4 of this report, JICA Study Team proposes the development of a logistics-related function area in CIPP, such as a distribution centre. When CEARÁPORTOS draws up the port development plan, CEARÁPORTOS should consider including the logistics-related facilities in the port plan. That is how these facilities would be linked directly the port activity such as container transportation.
3) Authorization of Port Development Plan
The Development plan is not related only to the construction of facilities at Pecém Port, but to the socioeconomic factors of Ceará State and northeast Brazil. For this reason, the port development plan drawn by CEARÁPORTOS requires a decision of the State. One way, by which port development plan is authorized, is that the state assembly approves it. In the case of the United States, where many ports are administrated by public corporations, they mostly have some independent decision machinery such as a port council. Mainly because a high degree of professionalism is required for discussion and decision related with the said port.
Therefore, CEARÁPORTOS needs to set up an independent port council and the council should approve every important matters related to the management and operation of Pecém Port such as port development plan and port tariff.
7.4.3 Strengthening of Organization of CEARÁPORTOS
In order to ensure sustainable management and operation of Pecém Port, CEARÁPORTOS needs to develop the system, which ensures the stability of its port account and provides a positive decision-making, with the role on the port development shared between government and port management body.
Therefore, it is necessary that CEARÁPORTOS improve the organization and the system of management and operation on the basis of the under-mentioned.
MAIN REPORT 7 - 11 CHAPTER 7

PECEM INDUSTRIAL AND PORT COMPLEX DEVELOPMENT PLAN FINAL REPORT IN THE FEDERATIVE REPUBLIC OF BRAZIL VOLUME II
(1) Establishment of Port Council
In the United States most ports are managed and operated by port authorities established by local governments (state, county, city, etc.). Generally the port authorities are managed independently from the government under the control of the “Board”, which is the highest decision council of the port authority. The first priority of this board is to benefit the region, because ports are considered as public assets which should contribute to regional development.
CEARÁPORTOS already has a council of administration. The council however does not have enough capability to examine the port development plan. Therefore Ceará State needs to establish a ‘Port Council’ which can discuss and decide every important matter related to the management and operation of Pecém Port such as port development plan, port tariffs and so on.
The Port Council should include not only the state government and CEARÁPORTOS but also representatives of the port users and the region. And the Port Council members should be elected or appointed by the state government
The Port Council should include the following members.
• State Government
• State Assembly
• CEARÁPORTOS
• Port Users
• Persons of knowledge and experience
Main functions should be as follows
• Approval of port development plan
• Approval of port tariffs
• Approval of annual budget of CEARÁPORTOS
• Supervision and council over port activities
• Coordination between CEARÁPORTOS, CIPP and port users
Regarding the decisions made by the Port Council, there are two concepts. One is that the Port Council has absolute authorization to decide. Another concept is that the state governor or the state assembly has a power of veto against the decisions of Port Council.
(2) Improvement of Organization of CEARÁPORTOS
To perform the duties proposed in the last section, CEARÁPORTOS needs to strengthen its organization.
1) Establishment of Planning Department
CEARÁPORTOS needs to set up a Planning Department which takes charge of the port planning. This department has affairs as follows;
• Formulation of port development plan
MAIN REPORT 7 - 12 CHAPTER 7

PECEM INDUSTRIAL AND PORT COMPLEX DEVELOPMENT PLAN FINAL REPORT IN THE FEDERATIVE REPUBLIC OF BRAZIL VOLUME II
• Examination of feasibility study
• Preparation of annual budget plan
• Examination of terminal lease scheme, etc.
2) Establishment of Port Promotion Section
To perform the port promotion activity in a professional manner, CEARÁPORTOS needs to set up a Port Promotion Section. This section has affairs as follows;
• Dispatch of port sales missions
• Setting port seminar
• Research of port hinterland
• Proposal to cargo owner, etc.
7.4.4 Proposal for CEARÁPORTOS’s Revenue
Port charges should be competitive but must cover construction, management and maintenance works costs of the port facilities.
Pecém Port has mainly gained its revenue out of the port tariffs until now.
If CEARÁPORTOS lends terminal facilities to private companies, it should gain a proper lease charge from them.
(1) Port Tariff
Tariff structure should not only cover expenses for management and operation of the Port but also encourage port users to use port facilities efficiently. Therefore, the followings points should be considered in terms of tariff structure.
• The revenue from the tariff can cover costs for construction, management, maintenance and repair.
• The tariff should be rational in correspondence with the service provided.
• The tariff structure should include a system which leads to more effective management and operation of the port. This implies that an incentive should be provided for vessels and cargo to move efficiently thought the port.
• The structure and the way of imposition should be as simple as possible.
(2) Revenue from Terminal Concept of revenue from terminals varies depending on construction and operation type of terminal.
1) Bulk Terminal
Bulk terminals are generally constructed by private companies and exclusively used by them. Port management body therefore can’t take revenue from terminal operators directly.
However, when private company lends existing facilities to use for an exclusive terminal, the port management body needs to impose a charge on the private company. Even if the terminal facilities were constructed with public funds and the port management body has not paid for their depreciation, the port management body
MAIN REPORT 7 - 13 CHAPTER 7

PECEM INDUSTRIAL AND PORT COMPLEX DEVELOPMENT PLAN FINAL REPORT IN THE FEDERATIVE REPUBLIC OF BRAZIL VOLUME II
should impose a charge on the private company. And this charge should correspond to an expense the port management body needs to maintain the facilities in the future.
2) Container Terminal
There are several variations of concept of revenue from terminal, depending on the construction and operation type of terminal.
For example, if the port management body develops terminal facilities and lends it to a private operator, the management body should impose a lease fee, which corresponds with costs for construction and maintenance of facilities, to the terminal operator.
In setting up the lease fee, generally there are two types. One is a flat rate, that is maintained for lease time. Another is a changing rate, that is applied depending on the terminal activity, for instance handling container volume. When the port management body determines the lease fee, it should consider bringing out the efficiency of the terminal in the private operator as well as maintaining competitiveness of the said port.
7.4.5 Scheme of Port Development
(1) Water Area Facilities
For the ports facing open sea, water area facilities, such as breakwaters, are absolutely imperative facilities. The construction of these facilities needs high investments and a long time. And these facilities cannot generate revenue directly.
Therefore, if a private company performs terminal project which includes constructing breakwaters, it would be difficult to make the project feasible.
The port development contributes to the regional economic development, but it doesn’t profit any private company. In particular, the integrated activity of Pecém Port and CIPP, which is one of the national projects of development of Northeast Region, contributes to the economic development of Ceará State and Northeast Region
For this reason, water area facilities, such as breakwaters, channels and navigation aids, should be developed with national or state funds under the responsibility of the government. In this case, it is necessary that government and port management body define a financial scheme of port development before starting the project, because the whole time span of the project would be long.
For reference, table - 7.2 shows the financial scheme of port development in Western countries.
(2) Container Terminal Unlike water area facilities such as breakwater, channel and so on, container terminals are profitable facilities. There are several variations of construction and operation schemes. With either scheme, the construction costs of terminal facilities are basically covered with the revenue from the terminal operation.
In case a private company constructs and operates a container terminal, the private company has to have a concession to construct the container terminal from the federal government. However, it is impossible for the private company to get a concession, because CEARÁPORTOS already got a concession from the federal government to develop Pecém Port.
MAIN REPORT 7 - 14 CHAPTER 7

PECEM INDUSTRIAL AND PORT COMPLEX DEVELOPMENT PLAN FINAL REPORT IN THE FEDERATIVE REPUBLIC OF BRAZIL VOLUME II
For this reason, there are two ways to construct the container terminal in Pecém Port as follows;
• CEARÁPORTOS constructs the terminal, and operates it by itself, or leases it to a private company (Pattern – A,B or C in Table 7.3.2).
• A private company constructs terminal, and transfers it to CEARÁPORTOS; afterward CEARÁPORTOS leases it to the private company (Pattern – E or F in Table 7.3.2).
(3) Bulk Terminal The bulk terminal should be constructed by a private company, since that private company plans to use it on an exclusive base.
Water area facilities, such as breakwaters and channels, which are required for the bulk terminal, are basically constructed with the private company’s resources. If the water area facilities, required for a bulk terminal of private use, also ensure calmness in the water area of the container terminal, which is of public use, then the construction costs of the water area facilities should be shared between government and private company, depending on the degree of effect of those facilities on each of the elements of the port.
7.5 Requirements of an International Port Recently the role of the container terminal occupies an important part in the total logistics function. Thus it is expected that container carriers demand more and more efficient operation towards terminal operators, and the further enhancement and improvement of the container terminal function is also expected.
Although CEARAPORTOS is not involved in the operation of Pecem port as it conducted entirely by private entities, CRARAPORTOS should be familiar with the operation of the port.
The reputation and evaluation of the port depends on user satisfaction. Provision of excellent performance by monitoring the service standard in the port by CEARAPORTOS would become one of the most important factors in attracting new shipping companies.
The liner service shipping companies can realize the scale merit and reduce operational cost at container terminal if they handle many containers.
Now many type of vessels, not only container vessels, are growing in size and draft to take advantage of the economy of scale.
7.5.1 Port Service CEARAPORTOS must carry out competent container terminal management including the provision of skilled pilots and high quality tug boats which are important factors when shipping lines select calling ports. It is indispensable to increase efficiency of the facilities through a modernization program.
Currently, container vessels are rapidly growing in size and thus ports throughout the world are increasing berth length to cope with these vessels. Pecem port is located in the far north-east part of Brazil. It maintains a water depth of over 16 meters, thereby making it one of the few Brazilian ports where such large-scaled vessels can call.
MAIN REPORT 7 - 15 CHAPTER 7

PECEM INDUSTRIAL AND PORT COMPLEX DEVELOPMENT PLAN FINAL REPORT IN THE FEDERATIVE REPUBLIC OF BRAZIL VOLUME II
As large-scale vessels call at Pecem Port as the Brazilian starting port (first calling port) as well as the final port (last calling port) in the international trade routes, the port has an advantage over other Brazilian ports.
Taking these conditions into consideration, it is expected that Pecem port can serve as a transhipment port where containers are transhipped among north-east ports.
7.5.2 Port and Harbour Administration and Management
(1) Selection of Vessel Calling Port The following factors are weighted by shipping lines when selecting a port;
Low operation cost at a port: If the operation cost (e.g. port dues and container handling charge) for all types of vessels can be reduced, shipping lines can increase profits.
Punctual operation time: The vessel schedule must be kept because container vessels have weekly service at every calling port of the service route. Delay at one port will negatively affect the schedule at subsequent ports.
• Attractive transit time of cargoes for shipper and consignees.
• Standard service that is competitive with other shipping lines.
• Safe container (cargo) handling operation.
• Prevention of cargo pilferage and sufficient security system (compliance with ISPS code).
• Enhancement to operational efficiency to prevent loss time and waiting time including provision of 24 hour service.
(2) Prerequisites for Becoming a Collection Point Shippers and consignees weigh the following factors in selecting a port:
• Superiority over other ports in terms of standard shipping costs and the number of delivery days for final destination.
• Superior standard of various port facilities and service level of the port.
• Frequent vessel call at the ports on each service route.
• Proper operation according to circumstances (i.e. some cargo should be handled quickly with extra charge)
• Careful cargo handling for special cargoes
• Convenient access to a hinterland market.
7.5.3 Port Promotion and Marketing At present marketing activities by CEARAPORTOS are inadequate and must be improved in order to attract shipping lines and port users and promote the future development of the port.
CEARAPORTOS should take the lead in such promotional activities but the Central and State government also should support and join these activities because the development of Pecem port benefits not only CEARAPORTOTS also Ceara state and the government.
MAIN REPORT 7 - 16 CHAPTER 7

PECEM INDUSTRIAL AND PORT COMPLEX DEVELOPMENT PLAN FINAL REPORT IN THE FEDERATIVE REPUBLIC OF BRAZIL VOLUME II
Furthermore, the government can enhance the social-economic stability of the country and state by actively pursuing such kind of development, and this in turn instils confidence in would-be clients.
(1) Marketing Strategy for Port Promotion Regional development of Ceara state will be realized in steps, as the resources base including financial capacity and related institutional development gradually increases.
As the regional development of Ceara progresses, the need for a port, especially for an International Container Port and North-East area Hub-Port will become greater. So far most of the cargoes, to (Import/Inbound) and from (Export/Outbound) the region are through the North-East area and Amazon Plate area.
1) Marketing Promotion Method and Materials.
Sales points, if employed properly, can become the nucleus of a marketing strategy. Port users, for example, shippers, consignees, shipping lines and their agents, forwarding agents and NVOCC operators etc, select one port over some competing ports based on (1) level of charges or fees, (2) operation performance, (3) necessary short transit-time, (4) safety operation, (5) security system.
2) Port Brochure (Pamphlet).
Printed brochure is an effective means of promotion. A well-conceived brochure can give prospective customers a solid understanding of a port’s sales points as well as an outline of its facilities and performance.
3) Promotion Compact Disk or Video.
Compact disk and Video are very useful materials and sometimes more effective than brochures. They can be used in port sales seminars and shown to port visitors. They can also be used as an initiation tool for new employees and vocational trainees.
(2) Port Promotion 1) Port Promotion
In the competition between ports, to offer better service than that of its competitive ports provides more cargoes to the said port. When cargo owners select port, it is an important point that the port have many shipping lines and a high frequency of calling vessels. Therefore CEARÁPORTOS needs to request foreign shipping companies to establish newly lines as well as domestic companies. And in order to collect cargo, CEARÁPORTOS should present to cargo owners the convenience of Pecém Port.
2) Marketing Research
From the point of view of the logistics strategy of shipping companies and cargo owners, container ports are able to acquire an advantageous position by gathering as much container cargo as possible. The view of marketing research is very important, in order to overcome the contrary relation that many cargoes gather at the port where many vessels call and many vessels call at the port where cargoes gather. In the case of a newly opened port such as Pecém Port and with the high-potential development of the port hinterland, it is crucially important that CEARÁPORTOS seek cargo produced in Ceará State and Northeast Region. CEARÁPORTOS needs to perform extensive ‘Marketing Research’, such as formulation and proposal of ‘Business
MAIN REPORT 7 - 17 CHAPTER 7

PECEM INDUSTRIAL AND PORT COMPLEX DEVELOPMENT PLAN FINAL REPORT IN THE FEDERATIVE REPUBLIC OF BRAZIL VOLUME II
Model’ relating to transportation with the use of Pecém Port and CIPP, which includes cargo distribution in the hinterland, inland transportation, assembly of cargo and value-added service within CIPP.
(3) Coordination of Relation to CIPP It is increasingly important that Pecém Port and CIPP integrally function. To develop as container port in addition to industrial port, Pecém Port needs to strengthen logistics function such as a distribution center in the future. For this reason, CEARÁPORTOS should implement various measures of promotion of utilization of CIPP.
In other hand, it is said that light industries in Ceará State need facilities in CIPP, which can deal with final manufacturing process for their exports, in order to increase the competitiveness of their exports. This means that CIPP has a potential to promote its utilization.
Therefore CEARÁPORTOS needs to propose and implement measures related to CIPP as part of its duties.
(4) Port Marketing Mission Meeting the key personnel of the industries related to ports and trade, such as trading firms, shipping lines, waterfront business parties is a good way to promote the port. It is necessary for a CEARAPORTOS Missions to be dispatched regularly to the cities and regions which are strategically most important to CEARAPORTOS. It is desirable that the mission is formed by Pecem port and CEARAPORTOS. In short, this mission is necessary to sell the name of the port so that the shippers and consignees will become familiar with name of Pecen as a transhipment port or direct destination or loading port.
(5) Home Page of Port (Web Site of CEARAPORTOS) The inter-net has become one of the defining symbols of our era, and many people from all over the world use it daily to exchange information. Therefore a web site is an essential means of spreading information about the CEARAPORTOS.
Existing web site of CEARAPORTOS is compiled from the terminal and its facilities. More specific information about the port’s strategic location, performance and its other advantages port should be added. At the same time, it is important that web site visitors come away with the impression that Port of Pecem is open for all customers who want to utilize its facilities and that all customers will obtain equal treatment.
(6) Advertisement
Advertisements should be placed in International “Mari-time News” or “World Trade and Logistics” magazines.
(7) User Friendly Management
One of the effective ways in which some major container handling ports communicate with their customers is through the advisory council which it is set up with container carriers calling the port. In this way, a reputation as a multi user terminal and user friendly port is gained. Container carriers set a high value on a port’s attitude.
MAIN REPORT 7 - 18 CHAPTER 7

PECEM INDUSTRIAL AND PORT COMPLEX DEVELOPMENT PLAN FINAL REPORT IN THE FEDERATIVE REPUBLIC OF BRAZIL VOLUME II
Through direct communication with container carriers, CEARAPORTOS can impress upon users that they will be treated equally in any service. This type of user friendly management may also encourage other container carriers to use the port.
7.5.4 Improvement of a Port Management Body's Monitoring System
(1) Monitoring the Performance of Port Operation As mentioned above, based on the new policy, law and regulations, private sectors are allowed to perform container, break bulk cargo and liquid bulk cargo handling operation. Port management and administrator should be monitoring the performance of operators and recommend the improvement of real time productivity and operating condition.
(2) Monitoring of Development Port Logistics and Industry As the development of port advances, the related industries such as port and harbour transportation will as a consequence also develop.
These port-related industries are usually carried out by private companies.
• The port management body should execute its duty of management and operation with attention to these newly established private companies.
• These related industries include, but are not limited to:
• The status of development of NVOCC (Non Vessel Operate Common Carrier) shipping business.
• As to import industries, re-packed and marking commodities.
• As to export industries, construction of temperature controlled facilities for disposition cargoes of fresh agriculture products and marine products.
• The construction of large logistic and distribution centre (large scale warehouse).
7.5.5 Expansion of Container Terminal In the cases where container yard expansion is required, it is important to assess the introduction of equipment with the initial investment budget, taking into consideration the area of the construction site, expected number of container handlings, and demand of containers and calling vessels.
(1) Increasing Container Vessel Size and Port Depth
One of the most important trends shaping the international container trades has been the steady increase in the size of vessels employed. The search for scale economies is at the centre of strategic development for most major lines. One a slot-mile bases, the savings from larger vessels are significant and also one of the few factors that are directly controlled by the container carrier. Furthermore, as soon as a major container line advances to the next size echelon, the competitive nature of the shipping industry compels other owners to follow suit. The net effect has been a rapid rise in the size of the largest vessels. It is our view that this trend still has considerably further to run.
Since the Panamax barrier was broken in 1988, there has been continuous increase in vessel sizes. At present, the largest are the MSC=Mediterranean Shipping company 9,200 TEU class units, which are employed in Far East – Europe service.
MAIN REPORT 7 - 19 CHAPTER 7

PECEM INDUSTRIAL AND PORT COMPLEX DEVELOPMENT PLAN FINAL REPORT IN THE FEDERATIVE REPUBLIC OF BRAZIL VOLUME II
The design drafts of these large class vessels are placed at between 14.0 -14.5m. Vessels are seldom fully laden by weight, and the draft is not always utilized. However, to maintain competitiveness, it is essential that current port planning includes the capacity to berth such vessels on all tides, assuming maximum utilization.
Deigns are underway for container vessels with capacity of 12,000~13,000 TEU. There are no technical or market obstacles to the introduction of such vessels, although the timeframe remains unclear. All major container ports (where it is possible) are planning for the introduction of such vessels.
(2) Introducing Modernized Facilities CEARAPORTOS must take advantage of its new port status. Pecem boasts the most modern container handling facilities and operating performance systems, including post Panamax quay side gantry cranes with 18 rows which are world-wide large class container vessel, and this gives the port further advantages over competing surrounding ports.
7.5.6 Berth Determination System
(1) Berth Allocation Method It is expected that berthing schedule may overlap because of the increase in calling vessels. Regarding the use of berths, it is important to allocate fairly among users on a “first come first served” basis.
Regarding the port management and administration system (berthing procedure) generally used in the ports, the following procedure is followed.
• Only authorized shipping company or its agent representative are allowed to apply for berth allocation
• Application for berth must be filled at the port control office from 08:00hrs to 10:00 hrs; filing of application should be 24 hours before the estimated time of arrival for a regular schedule vessels and 48 hours for tramping vessels.
• Berthing meeting shall be strictly held at exactly 10:00 hours, at the port control office to be attended by; -Harbour Master
-Shipping Line (agent) representative
-Management office Manager
-Terminal operator or stevedore Co.,
Agenda of the meeting is to discuss the availability of berth space and container (cargo) stacking area.
• When the assignment of the berth agreed by both parties the office Manager sign and approved the berth applications.
• After the approval of berthing application by the Harbour Master, the office clerk type copies will be distributed to management. Offices for their guidance in which the berth number of certain vessel is assigned.
MAIN REPORT 7 - 20 CHAPTER 7

PECEM INDUSTRIAL AND PORT COMPLEX DEVELOPMENT PLAN FINAL REPORT IN THE FEDERATIVE REPUBLIC OF BRAZIL VOLUME II
(2) Determination Method of Berth Arrangement
Under the short-term plan, multi purpose berth (which is 680m in length x 100m in width) and long-term exclusive container berth (which is 900m in length x 300m in width) will be established (however, mainly for the purpose of handling of container) and, thus, it is expected that the number of calling vessels will be increased significantly.
Since container vessels are basically serviced weekly, it is expected that the container handling will be concentrated on a certain day of the week which is advantageous for the collection of cargoes.
The allocation of berth is one of the focal points in the evaluation by shipping lines. To this end, first-come first-served principle should be applied so that the allocation to ensure fairness among the shipping lines.
7.5.7 Computer System of CEARAPORTOS Computer control centre currently installed is mainly for the system concerning ISPS (International Ship and Port Security).
Since, with regard to CEARAPOTOS, operational management is being conducted by a private entity, computer software for operational management and container storage in not installed in the current computer system. It is necessary to improve the management system in order to cope with the increase of cargo throughput which is expected in the near future.
By sharing the information among private entities and CERARAPORTOS it is necessary to improve network system regarding this information and to conduct real time monitoring by establishing an appropriate operational system, so that the performance of the port can be enriched.
In order to maintain international competitiveness, it is essential to manage and operate the ports efficiently and to provide international standard of performance to port users. In addition, it is necessary to share the information among the CEARAPORTOS and shipping companies and it agents. To that end, it should be remembered that the transfer to the system where real time monitoring is conducted even to operational management, not to mention port management is critical, so that the port administrator can oversee all operations throughout the port.
(1) Existing Control System of CARAPORTOS
Summary of description of existing control system of Pecem Port
• System auxiliary – Mooring of Vessel control system
• System of monitoring of meteorological system
• Supervision of usefulness-1 (Operation Status) system
• Supervision of usefulness-2 (Operation Status) system
Sub system= Status operation of the automatic switching system
-Status of the automatic switching system BT
-Operation of the pressurization system
• Status of alarm of the rectifier
MAIN REPORT 7 - 21 CHAPTER 7

PECEM INDUSTRIAL AND PORT COMPLEX DEVELOPMENT PLAN FINAL REPORT IN THE FEDERATIVE REPUBLIC OF BRAZIL VOLUME II
• Status of alarm of the transformers
• Status sensor passive of the in main area
• Sensor Status of the if PC-2 (electronic safety)
• Status sensor passive of the on Pier-1
• Supervision of energy status system
• Supervision of fire status system
• Control of sound status system
• Safety of electrical status system
• Telephone system
• Control of personal access and vehicles access system
• CETV camera system (observation camera)
(2) Port Management and Operation by Computer 1) Introduction of Port Management and Facilities Controlled Computer Systems
Standard are typical function of the port and harbour management and administration system.
CEARAPORTOS, role of within the Brazilian north-east region of ports, contributing greatly to the nation and state economy as an active international trade business.
• The CEARAPORTS’s total trade volume in 2004 was 941,843 tons which amounts to 0.8% of the North-east region of Brazil. Among seaports, Pecem port has the greatest influence on the Brazilian North-east region.
• Due to the increase in trade volume that comes with economic development in the South American region, the CEARAPORTOS is contributing to the world economy as a major port connecting with the European continent, the US east coast and Caribbean island sea ports.
• Regarding the port management and administration system generally used in the ports, the system is outlined in Table 7.5.1.
MAIN REPORT 7 - 22 CHAPTER 7

PECEM INDUSTRIAL AND PORT COMPLEX DEVELOPMENT PLAN FINAL REPORT IN THE FEDERATIVE REPUBLIC OF BRAZIL VOLUME II
Table 7.5.1 Port and Harbour Management System
Name of Ma Name oin System f Sub System Vessel Traffic
InformatiIncoming and outgoing vessel control system Pilot arrangemenSafety navigation assi m
on System t system stant syste
Vessel Incoming and Outgoing Management System
Berth usage and Ship movement Ships containe ber of management syst
deciding system schedule management system r (cargo) handling and numem
Warehouse and OpeStorage Area
Management Sy
Facilities using appContainer (cargoContainer (cargo) movemSpecial cargo ha
n
stem
lic nagement system ) handling area management system
ent management system
ation ma
ndling management system Container Handling Equipment Man m
Container handling ent using application and permission manaOther equipment and permission management syst
agement Systeequipm
gement system using application
em Charge and Due
Management System Cash receipt managem em Preparation billinPreparation draft-settl cumentation system Transferring to/f
ent systg and payment system
ement dorom account management system
Port Facilities ma Repair management
Port facilities manasystem Container (cargrepairing management
e ports mana
in System
tenance & gement and repairing management
o) handling equipment maintenance and system
Spar gement system Statistical Manage
SystemThrough containimport wise Shipping route atCalling vessel da
ment
er (cargo) statistical system by export and
tes manatribu gement system ta management system
Office Managem System
onnel managPay roll managemReceipt and disb
ent
Pers ement system ent system
ursements system Source: JICA Study T
(3) Documentation System Currently computers are used only for transmissiCTO and TERMARCO) to the Pecem port. Onc to CEARAPORTOS, basic information on the docledgers repeatedly. T cause some errors. A lot of personnel are engaged in such manual documentation.
If a computer system her fields, for example documentation, berth assignment, accounting, administration work an well as statistics, the documentation will be streamlined and the required timfinish necessary procedures will be shortened. Consequently, the dwelling time of
ity will increase.
eam
on of data from shipping agents (e.g. e a document is submitted
ument is entered on other sheets or his may
is introduced for otd personnel management as
e for port users
cargoes will be shortened and capac
Computerization will make it unnecessary to enter the same information on the other documents and possible to use repeatedly the information once fed into computers. It is also expected that compiling statistics concerning port activities will become easier.
MAIN REPORT 7 - 23 CHAPTER 7

PECEM INDUSTRIAL AND PORT COMPLEX DEVELOPMENT PLAN FINAL REPORT IN THE FEDERATIVE REPUBLIC OF BRAZIL VOLUME II
Although the ultimate goal of computerization is EDI (Electric Data Interchange), it takes a long time to enact or amend relevant laws and regulations and to establish
y / receiving
heck point to find a mistake. If a gate does not identify an and its agent would be in trouble.
inal operator.
Gate is the boundary separating the limit of responsibilities between consignees /
te, the responsibility of the container terminal is terminated.
um location in C.Y.
ator
n on container by
consensus and cooperation among those concerned. Therefore at first it is necessary to upgrade functions and expand the area covered by the computer system.
Consequently, the computer system will become an open system in which the parties concerned can participate.
1) Container Delivery/Receiving Control System
Strengthening of gate operation system
The principle in container terminal and yard operation lies in how to accelerate the receiving/delivery system. Basically, the operation starts from a gate and ends with agate.
Thus, the following improvements are required in the near future.
Gate office of a container terminal plays important roles in delivercontainers from/to consignees/shippers. Every container must pass through terminal gates, which are the final cerror, the consignee / shipper and shipping line Delivering is one of the most important functions of a container term
shippers and container terminal. After an export container enters through the gate, it is the responsibility of the container terminal. After an import container passes through the ga
In receiving an export container, it is important to decide its optimbased on the container information for efficient operation. In C.Y. heavy stuffed containers should be stacked on light stuffed containers since heavy containers must be loaded at the bottom of holds to keep the stability of vessels.
In delivering an import container, it is important to instruct the tractor/trailer driver to go to the place of stacking address of the containers quickly and to inform the operof container handling equipment of the tractor/trailers arrival. After loading the container on the tractor/trailer, it is necessary to check the container number, its conditions and its seal number at the gate office.
It is possible to grasp the storage location and exact informatioinputting and renewing it in a terminal computer in real time after verifying the driver’s documents and the container. Necessary information to be input into a terminal computer at the gate is as follows:
Carrying in an export container
• Name of vessel, voyage number
• Container number, size and type of box
• Port of discharging
• Container Weight
• Special cargo (hazardous or refrigerated)
Carrying in an import container
MAIN REPORT 7 - 24 CHAPTER 7

PECEM INDUSTRIAL AND PORT COMPLEX DEVELOPMENT PLAN FINAL REPORT IN THE FEDERATIVE REPUBLIC OF BRAZIL VOLUME II
• Name of vessel, voyage number
• Container number, size and type of box
ission
pty container
Car in ainer
d type of box
nt
mpty container
Car in
box
er (booking order number)
e
(or shippers name)
2) Container Loading /Discharging Operation Control System
Wh try cranes serve a vessel, it is necessary to equalize the work loads of each quay side gantry crane. Furthermore it is important to
not interfere with one another. In loading ant to load containers based on the yard planning by
wei ht tability and safe navigation of vessels. Refrigerated ust be loaded according to inte a
Req ir peration systems are as follows:
•
n time.
• Number of customs perm
• Final destination
• Name of shipping line and it agent
• Date of return the em
ry g in an empty cont
• Name of vessel, voyage number
• Container number, size an
• Number of customs permission
• Final destination
• Name of shipping line and it age
• Date of return the e
ry g out an empty container
• Container number, size and type of
• Booking reference numb
• Destination of cargo stuffing plac
• Name of shipping line and it agent
• Name of transport=trucking co.,
en two or more than two quay side gan
prepare an operation plan so that cranes do export containers, it is very import
g , port of discharge and container size for s container and hazardous container m
rn tional regulations.
u ed function for the loading/discharging o
Container discharging operation system
Container loading operation system •
Container shifting (re-handling) operation system •
• Quay side gantry crane allocation system
• Vessel hull strength calculation system
Necessary information on containers should be obtained from container carrier as early as possible. Obtaining the information in advance enables a terminal operator to prepare the working schedule indicating the order of discharging/loading containers and minimize the operatio
MAIN REPORT 7 - 25 CHAPTER 7

PECEM INDUSTRIAL AND PORT COMPLEX DEVELOPMENT PLAN FINAL REPORT IN THE FEDERATIVE REPUBLIC OF BRAZIL VOLUME II
Bef e btain the latest stowage bay plan after the st mation is as follows:
oes.
last port and estimated draft at the entry
In a va rmation is transmitted by EDI between the terminal operator and the shipping lines and its agent but in ordinary ports this involves a lot of pap w
Aft lo tor prepares the stowage bay plan or sheet, which indicates the result of the operation, and passes it to a captain or shipping line or i a
Ma ng t task of a terminal operator. In advanced container term
Stowag
• ging
ion in hold/on deck (bay-row-tier)
7.5.8 activities
d operation such as farsighted . In other words, it is important
through training to give staff full knowledge, skills and understanding both on technological and functional re ents of the port and to make them cost-conscious and efficient in conducting their duty and assignment.
At re eparing various employee training plans for the pur s necessary to examine and introdu business, development, and operation. The curriculum
or the working schedule, it is necessary to ola port’s operation. The necessary infor
• Name of vessel and voyage number
• Date of departing the last port
• Estimated time of arrival
• Details of containers
• Container number, size and weight
• Port of loading/discharging
• Special containers
• Temperature of refrigerated cargoes
• IMO classification of hazardous carg
• Draft of vessel at departure the
d nced ports, the above info
er ork.
er ading containers, the terminal opera
ts gent.
ki the stowage bay plan is an importaninals, stowage bay plan can be made with a computer system.
e bay plan includes the following information:
• Container number
• Kind of container and size
Port of loading/dischar
• Container weight and description of special cargo
• Locat
Training System At CEARAPORTOS, employees in each section should control port appropriately to materialize efficient management aninvestment, profitable financial management and so on
quirem
p sent, CEARAPORTOS is prpo e of development of human resources. It is also
ce more effective training for future port currently generally followed is shown in the Table 7.5.2.
MAIN REPORT 7 - 26 CHAPTER 7

PECEM INDUSTRIAL AND PORT COMPLEX DEVELOPMENT PLAN FINAL REPORT IN THE FEDERATIVE REPUBLIC OF BRAZIL VOLUME II
(1) Category of Training Curriculum and Method;
Table 7.5.2 For Example Training Curriculum Table Classification Training Curriculum Senior member of the staff General maritime business and harbour
transportation management and administration system
Middle-class personnel Port management, a port physical distribution lecture and personnel administration system
Newcomer personnel The present condition of place-of-work introduction and port services
Senior Class Labours Increasing skills of machine drivers and liberal studies of marine business
Junior Class labours In addition, knowledge of operation system and port work
So In addition, a s e assistance of fparticipate in in-house training or are sent to varioother government agencies and private sector. Suchlevel of awarene f the employees.
7.6 Recommendation of Management and Operation
(1) Establishment of Port and Harbour AdministratiIn order to pr tatus as an internestablished whe ion and managemprovision of high quality of service to and requests f ucted.
The members o ould be comp relevant industries and scholars. The meeting of c al times a year where im ed by users are deliberated and discussed.
By implementing the f such deliberation and e port can maintain the international standard of the po
(2) Port
mportation and exportation of
urce: JICA Study Team
eminar with th
d skil
oreign experts is held. Employees also us training courses sponsored by training is aimed to enhance the
ss an ls o
on Committee eserve its sre administrat
ational port, the committee must be ent of the whole port and review of
rom users are cond
f the committee sh rised of approximately 10 experts fromommittee should be held sever
portant issues rais
result o discussion of the committee, thrt.
Management
As preferential measures to the firms which expanded to CIPP (Complexo Industrial E Portuario do Pecem), the special treatment should be afforded to such firms.
• The reduction of storage fee against loading / discharging cargoes at Pecem Port.
• Simplification of various procedures for iproduction goods.
• Simplification of the procedure for approval of bounded cargo transportation before customs clearance between the port and the area of firms which had expanded into CIPP.
• Simplification of the procedure for inventory management before customs clearance for the firms which had expanded into CIPP.
• Preferential treatment of the use of empty container inland depot
MAIN REPORT 7 - 27 CHAPTER 7
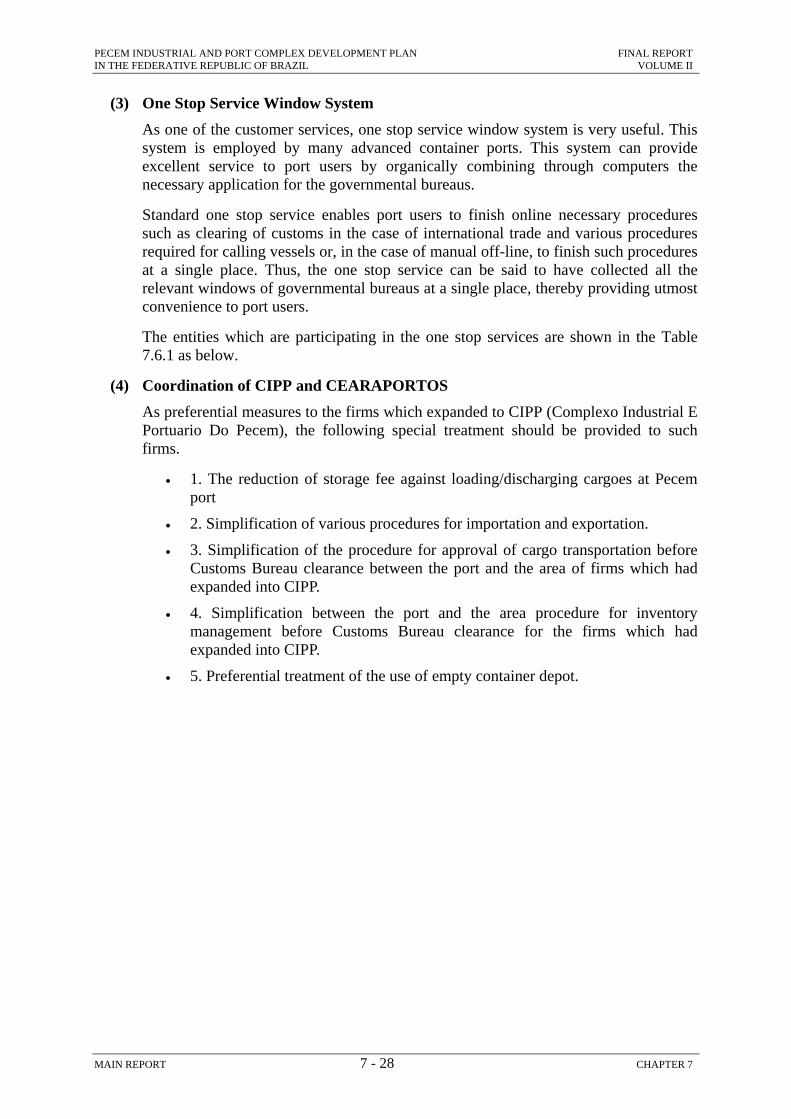
PECEM INDUSTRIAL AND PORT COMPLEX DEVELOPMENT PLAN FINAL REPORT IN THE FEDERATIVE REPUBLIC OF BRAZIL VOLUME II
(3)
w system is very useful. This y many advanced container ports. This system can provide
Stan asuch asrequired for calling vessels or, in the case of manual off-line, to finish such procedures at a sirelevant windows of governmental bureaus at a single place, thereby providing utmost con en
The en7.6.1 a
(4) Coo dAs pref o Industrial E Por ar ided to such
ortation and exportation.
.
One Stop Service Window System As one of the customer services, one stop service windosystem is employed bexcellent service to port users by organically combining through computers the necessary application for the governmental bureaus.
d rd one stop service enables port users to finish online necessary procedures clearing of customs in the case of international trade and various procedures
ngle place. Thus, the one stop service can be said to have collected all the
v ience to port users.
tities which are participating in the one stop services are shown in the Table s below.
r ination of CIPP and CEARAPORTOS erential measures to the firms which expanded to CIPP (Complex
tu io Do Pecem), the following special treatment should be provfirms.
• 1. The reduction of storage fee against loading/discharging cargoes at Pecem port
• 2. Simplification of various procedures for imp
• 3. Simplification of the procedure for approval of cargo transportation before Customs Bureau clearance between the port and the area of firms which had expanded into CIPP.
• 4. Simplification between the port and the area procedure for inventory management before Customs Bureau clearance for the firms which had expanded into CIPP
• 5. Preferential treatment of the use of empty container depot.
MAIN REPORT 7 - 28 CHAPTER 7

PECEM INDUSTRIAL AND PORT COMPLEX DEVELOPMENT PLAN FINAL REPORT IN THE FEDERATIVE REPUBLIC OF BRAZIL VOLUME II
Table 7.6.1 Standard One Stop Service Window System
Authority Concerned Application & Document Issuing of Document Immigration Office Crew List & Application Issuing of shore pass
Crew List & Application Health of certificate Quarantine Office
(National Health) Maritime Declaration of Health
General Declaration
Dangerous Cargo List Issuing of certificate
Vessel Movement & Application Issuing of certificate
In Ballast Declaration
Cargo Manifest
Crew List or Passport List
Harbor Master Office
(Port Captains Office)
Vessel Entrance Declaration
Entry-into& leaving-port license Issuing clearance
Berthing Application Issuing berthing permit Port Administration and Management Body
Stowage Plan
General Declaration Issuing calling permit
Cargo Manifest Maritime Police
Crew List or Passport List
Pilot Association Arrangement of Pilot Application Issuing of certificate
Tug Boat Company Arrangement of Tug Boat Application Issuing of certificate
Agriculture Bureau Agriculture Inspection & Application Issuing of certificate
Animal Health Bureau Animal Inspection & Application Issuing of certificate
Cargo Manifest/Dangerous Cargo List
Export Declaration Issuing of declaration
Import Permit Issuing of import permit
Bonded Cargo Storage Permit Issuing of storage permit
Bonded Over land Transport Permit Issuing transport permit
Customs Bureau
Payment of Tonnage Due Issuing of certificate
National Bank Payment of Taxation Issuing of certificate
Shipping Agents Container (cargo) Receiving and Delivery for procedure
Source: JICA Study Team (5) Establishment of Safety Operation in the Container Terminal and Port Area
The condition which is required by shipping companies to container terminal and port works is safety in port operation.
In order to operate safely, the following issues are important.
• Safety education and training on employees.
• Suitable clothes and shoes for operation.
• Safety confirmation before the commencement of the operation.
• Implementation of before and after confirmation of each operation machine.
MAIN REPORT 7 - 29 CHAPTER 7

PECEM INDUSTRIAL AND PORT COMPLEX DEVELOPMENT PLAN FINAL REPORT IN THE FEDERATIVE REPUBLIC OF BRAZIL VOLUME II
• T on o warehouse
who is charge of overall operation.
ent
ity, it is essential to minimize the breakdown time of
Competent personnel should be appointed assho d loading / discharging and a y side harbour crane/gantry crane or contain maintenance grou t
To ministac rpreven
n 6 months and annually).
n of annual merit rating system as per operator
(7) The re
Ad ncauthori urpose of covering the cost of damves ls
It is rintroduby lobbying to the Federal government and State of Ceara government.
he submissi f the operation report by the container and operator
(6) Establishment of Equipment Maintenance System of Cargo Handling EquipmMinimizing the breakdown time of container handling equipment
To achieve the targeted productivcontainer handling equipment.
a yard operator. This yard operator ul always stand by in the terminal office to monitor both y rd operation. If some trouble with a qua
er handling equipment occurs, the yard operator contacts thep o repair it.
mize the breakdown time of quay side harbour crane/gantry crane or reach ke / RTGs, back up spreaders must be procured. It is also advisable to conduct
tive maintenance at regular intervals.
• Submission of self-check list by each operator of cargo handling machines
• Establishment of regular maintenance systems (e.g. inspection of monthly, once in 3 months, once i
• Assessment of annual budget for maintenance method and spare parts for each piece of equipment.
• Implementation of training and education for personnel who are in charge of maintenance.
• Introductio
• Introduction of hourly operation system (done by actual working hour) for staffs who are in charge maintenance
Protection of Marine Oil Pollution Control Measure p vention of marine oil pollution within the port area is an important matter.
va ed ports oblige vessels to submit an insurance certificate application to the port ty (whose standardized form is as follows) for the pages caused by pollution accidents at the time of the supply of fuel oil for
se .
ecommended at Pecem port as well that the above-mentioned system be ced by the time of the completion of instalment of the fuel oil supply facilities
MAIN REPORT 7 - 30 CHAPTER 7

PECEM INDUSTRIAL AND PORT COMPLEX DEVELOPMENT PLAN FINAL REPORT IN THE FEDERATIVE REPUBLIC OF BRAZIL VOLUME II
Tab 7 r the Law on
1).Name of Ve
le .6.2 Report on the Financial Security Information UndeLiability for Oil Pollution Damage (sample format)
ssel:
2).Distinctive Number and etter of Call Sign:
L 3). IMO Number:
4).Flag of State: 5). Port of Registry:
6).Gross Tonnage:
7).Na
Expected Date of and Time:
me of Port and Expected Data and time of entry
Name of Port:
Name of Berthing Facility:
8).EnEn
try Position of the specific Area and Expected Date and time of try
Entry Position:
Expected Date and time
9).Name, Address, Telephone, and Facsimile No of the Ship-owner and the Lessee of the Vessel (if any)
Name:
Address:
Telephone:
10). Name of Address, Telephone Number the Person notifying this report
Name:
Address:
Telephone:
11).Holder of Financial Security Yes: No:
12).Certification Number (if you posses the certificate issued by MOT of State or CLC certificate issued by the contracting States)
a).Name of Insurer or Guarantor:
b).ID number of the Certificate Issued by the Insurer of Guarantor
c).Whether financial security covers Both Bunker Oil Pollution Damage and the Cost of shipwreck Removal or not
13).Fill in these items if you do not possess the Certificate mentioned in the item-2
d).Limit Amount of Insurance
14).Did you Enter any Port in State within Past 1 Year
Yes:
No:
15).Connect Point on Board the Ship
Ship’s Telephone:
INMALSAT Telephone:
Facsimile No:
Other communication method
Source: JICA Study Team
(8) Liquefied Natural Gas (LNG) Currently, LNG is one of the most dangerous materials which is shipped in general merchant vessels. LNG is shipped in ultra-low temperature.
For security purposes, a manual which complies with relevant regulations should be prepared and strict attention should be paid by all relevant parties.
In particular, utmost attention should be paid to sources of flammables and electrostatic. Ample education and training should be provided to the employees who handle LNG.
MAIN REPORT 7 - 31 CHAPTER 7

PECEM INDUSTRIAL AND PORT COMPLEX DEVELOPMENT PLAN FINAL REPORT IN THE FEDERATIVE REPUBLIC OF BRAZIL VOLUME II
CHAPTER 8 ENVIRONMENTAL AND SOCIAL CONSIDERATIONS
8.1 General The proposed structures in the Long-Term Development Plan might cause either negative or positive impacts on the natural and social environment, such as shoreline change, water deterioration and poverty reduction. It is necessary to foresee and assess the impact in order to design the proper sub-projects as well as select the priority project.
Previous study results have been collected and compiled in this report, so the Initial Environmental Examination was implemented for the long-term development plan.
This chapter comprises:
i. The environmental conservation framework;
ii. JICA guidelines for environmental and social considerations;
iii. An explanation of the existing environment of Pecem industrial and port complex and its surrounding area;
iv. Previous studies on environmental and social considerations and licensing of Pecem Industrial and Port Complex;
v. An Initial Environmental Examination for a long-term development plan;
vi. Consultation and public participation.
8.2 Environmental Conservation Framework
8.2.1 International Accord and Protocols Signed by Brazil Brazil has ratified many relevant international environmental treaties. Important treaties are as follows.
• Convention on International Trade in Endangered Species of Wild Fauna and Flora (1973)
• Convention on Wetlands of International Importance especially as Waterfowl Habitat (1971)
• Convention for the Protection of the World Cultural and Natural Heritage (1980)
• United Nations Convention on the Law of the Sea (1982)
• Convention on the Prevention of Marine Pollution by Dumping of Wastes and other Matter (1972)
• Basel Convention on the Control of Transboundary Movements of Hazardous Wastes and Their Disposal (1989)
• Convention on Biological Diversity (1992)
• Convention on the Conservation of Migratory Species of Wild Animals (1979)
• United Nations Framework Convention on Climate Change (1992)
MAIN REPORT 8 - 1 CHAPTER 8

PECEM INDUSTRIAL AND PORT COMPLEX DEVELOPMENT PLAN FINAL REPORT IN THE FEDERATIVE REPUBLIC OF BRAZIL VOLUME II
• Kyoto Protocol (2002)
• United Nations Convention to Combat Desertification in Countries Experiencing Serious Drought and/or Desertification (1994)
• Convention for the Protection of the Ozone Layer (1985)
• Montreal Protocol on Substances that Deplete the Ozone Layer (1987)
• Convention on Liability and Compensation for Damage Related to the Transport of Harmful and Noxious Substances by Sea (1996)
• Framework Accord on the Environment of Mercosur (1998).
8.2.2 Relevant Laws and Regulations Environmental law, decree, and acts/regulations are enacted under the constitution of the Federative Republic of Brazil. These have been enacted by the National Environmental Council (CONAMA), the State Environmental Councils (COEMA), and Municipalities. Some important laws are as follows.
(1) Central Government
1) Brazilian Federal Constitution - Title VIII There are several provisions that concern environmental issues. Article 225 states “Everyone has the right to an ecologically balanced environment, a possession of common use of the people, essential to a healthy quality of life, demanding that those in Public Office and the community in general comply with their duty to defend it for the present and future generations”. Several mechanisms were created by the Brazilian legal system in order to ensure the above policy.
2) The National Environment Policy Law 6938/81 All guidelines, general contents, authorities, purposes, mechanisms and instruments of Brazil’s environmental policy are foreseen in the National Environment Policy.
3) Environmental Crimes Law 9605/98 A measure covering environmental criminal activity calls for the application of criminal and administrative penalties in cases of actions or activities that may damage the environment.
4) Law Against Petroleum Discharge 9966/00 This is a law of a larger scale concerning the port activities and of maritime transport, and it makes use of the prevention, control and management of pollution caused by oil spills and other harmful or dangerous substances in water.
(2) State of Ceara
1) State Law on Strategic Environmental Policies - 11411/87 This law creates COEMA (State Environmental Council), as well as SEMACE (State Environmental Department). COEMA has the purpose of assisting the Chief of the Executive to have power over environmental policies, basically on the
MAIN REPORT 8 - 2 CHAPTER 8

PECEM INDUSTRIAL AND PORT COMPLEX DEVELOPMENT PLAN FINAL REPORT IN THE FEDERATIVE REPUBLIC OF BRAZIL VOLUME II
following matters: analyze and approve SEMACE annual and multi-annual plans and to collaborate with SEMACE and any other public or private organizations on solving environmental problems and other matters.
2) State Policy on Solid Waste 13103/01 This law determines rules and regulations for preventing and controlling pollution in order to protect and recuperate the environment quality and public health.
(3) Environmental Impact Analysis Procedures The CONAMA Resolution 237/97 stipulates that it is necessary to obtain permission, issued by environmental authorities, at a preliminary stage, when activities supposed to affect the environment or utilization of natural resources are planned. Three types of permission are prescribed: a Previous License (LP), License for Installation (LI), and License for Operation (LO). The flow of the issue of licenses is shown below.
Application for License
Technical/Law Analysis
Inspection/Evaluation
Necessity of EIA/RIMA
Issue of LP and TOR ofEnvironmental Study
Issue of LI
Issue of LO
Elaboration of TOR
Public Audience
Elaboration of TechnicalAnalysis
CONAMA
Issue of LP
Issue of LI
Issue of LO
Renewal of LO
No Yes
1 month
1 month
4 month
3 month
1 month
Figure 8.2.1 Issue of Licenses
MAIN REPORT 8 - 3 CHAPTER 8

PECEM INDUSTRIAL AND PORT COMPLEX DEVELOPMENT PLAN FINAL REPORT IN THE FEDERATIVE REPUBLIC OF BRAZIL VOLUME II
The Brazilian Institute of Environment and Natural Renewable Resources (IBAMA) issues environmental permission when the project or activity is implemented in several provinces, the area is controlled or owned by the federal government, and in preserved areas. IBAMA also issues permission when a level of environmental impact is predicted. In other cases, a State Environmental Department (SEMACE) issues the permission. IBAMA can withdraw authority to issue permissions from a SEMACE.
When entrepreneurs of projects want to get environmental permission, they are required to submit all necessary documents for analysis by environmental authorities. These required documents are determined by each environmental authority based on expected impacts. Submitted documents are determined based on the discussion between the project entrepreneur and the environmental authorities during the approval process. There are thirteen types of documents, and it is necessary to submit appropriate documents in accordance with the significance of environmental impacts stated.
Table 8.2.1 Types of Documents Type Explanation
EIA/RIMA These documents are required on a project predicted to have significant environmental impact. RIMA (Environmental Impact Report) is a summary document of an EIA.
PRAD PRAD (Plan of Recovery of Degraded Area) is required on all projects related to mining, among other projects. In the report, the whole period of mining should be considered.
PCA PCA (Environmental Control Plan) is required to obtain a license of installation for enterprises that explore civil construction works according to the terms of CONAMA Resolution 10/90.
RCA RCA (Environmental Control and Monitoring Report) is required especially for mineral extraction projects. It describes actions to be implemented during the mining process.
EVA EVA (Environmental Viability Study) required for projects that will cause low environmental impact. For example, small dams for water supply.
EAS EAS (Simplified Environmental Study) is required especially for implementation of alternative energy supplies (power), such as: wind power, sun power.
RAS RAS (Simplified Environmental Report) is required basically by CONAMA for alternative power production.
PMF PMF (Forest Management Plan) required when the company wants to deforest a specific area and must state how the company (enterprise) will manage the deforested area.
PDR PDR (Rational Deforestation Plan) is done and submitted before the environmental impact study.
RAA RAA (Environmental Consulting Report) is required especially when the enterprise is already operating, and it is also required for determining what this company is producing in terms of pollution, such as erosion
MAIN REPORT 8 - 4 CHAPTER 8

PECEM INDUSTRIAL AND PORT COMPLEX DEVELOPMENT PLAN FINAL REPORT IN THE FEDERATIVE REPUBLIC OF BRAZIL VOLUME II
(passive environmental impact).
AAE AAE (Strategic Environment Evaluation) is required for state development projects, to analyze the cumulative impacts from previous environmental projects and what might be the future cumulative impacts. For example, hydro basins.
Risk Analysis/ Risk Management Plan
RMP (Risk Management Plan) is required for immediate incident risks verification.
Contingency/ Emergency Plan
This study, when associated with the RMP, analyzes the actions to solve environmental incidents.
Source: SEMACE
(4) Environmental Standard
1) Classification of Water Bodies - CONAMA Resolution 357/2005 This law expounds the classification of water bodies and environmental guidelines, establishes conditions and parameters for effluent discharge, and other relevant controls.
2) Air quality standards: CONAMA Resolution 03/96 Air quality standards were prescribed in the CONAMA Resolution 03/96 in 1989. In the resolution, long term and short term standard values are determined using seven parameters: total suspended solids, smoke, suspended solids, sulfur dioxide, nitrogen dioxide, carbon monoxide, and ozone. Those standard values are shown in Table 8.2.2.
8.2.3 Organization Structure The Ministry of Environment (MMA) comprises the Secretariat of Environment Quality in Human Settlement (SQA), the Secretariat of Amazon Coordination (SCA), the Secretariat of Water Resources (SRH), the Secretariat of Sustainable Development Policies (SPDF) and the Secretariat of Forest and Biological Diversity (SBF). IBAMA exists apart from the five above-mentioned departments as an environmental management enforcement organization that belongs to the central part of MMA.
IBAMA is the enforcement organization of the federal government for environmental conservation and pollution control, and it is also the organization which examines environmental licenses and has the authority for approval. It has a branch office in each state, and cooperates with the environmental management organization of each state. Moreover, IBAMA approves and monitors the projects that the federal government manages, in addition to managing national parks, forest reserves, national forests, etc.
The State Secretariat General of the Environment (SOMA – created under law No.13.093 from 8th of January 2001) is the state equivalent to the MMA of the federal government. SEMACE is the state equivalent to IBAMA. SOMA became a department of the environment in 2001, and carries out legal management and legal planning of the state environment.
MAIN REPORT 8 - 5 CHAPTER 8

PECEM INDUSTRIAL AND PORT COMPLEX DEVELOPMENT PLAN FINAL REPORT IN THE FEDERATIVE REPUBLIC OF BRAZIL VOLUME II
8.3 JICA Guidelines for Environmental and Social Considerations
8.3.1 Background JICA prepared environmental guidelines for infrastructure projects in 1990, which introduced a screening and scoping process to the preparatory study of development planning studies. After more than ten years, JICA decided to revise them in response to the need to have basic principles for environmental and social considerations for all JICA’s activities. The revision extended the range to be covered by the guidelines, and promoted information disclosure.
The new guidelines for environmental and social considerations were completed in March 2004. These guidelines cover development planning studies, preliminary studies for grant aid projects and technical cooperation projects. JICA encourages the recipient governments by conducting cooperation activities to implement the appropriate measures for environmental and social considerations. At the same time JICA gives support for and examination of environmental and social considerations according to the guidelines.
8.3.2 Basic Policy Democratic decision-making is essential for environmental and social considerations, and, in order to achieve an adequate decision-making process, it is important to ensure stakeholder participation, information transparency, accountability and efficiency in addition to respect for human rights.
In this context, regarding human rights and in view of the principles of democratic governance, the measures for environmental and social considerations are implemented by ensuring a wide range of meaningful stakeholder participation and transparency of decision-making as well as by working for information disclosure and by ensuring efficiency. The governments bear responsibility for accountability and at the same time stakeholders are also responsible for their comments.
Consistent with the above views, JICA considers the environmental and social impact when implementing cooperation projects.
8.3.3 Basic Principles Regarding Environmental and Social Considerations JICA recognizes the following seven principles as very important for ensuring environmental and social consideration:
• A wide range of impacts to be addressed is covered.
The types of impact described by JICA cover a wide range of environmental and social impacts.
• Measures for environmental and social considerations are implemented at an early stage.
JICA introduces the concept of Strategic Environmental Assessment (SEA) when conducting Master Plan studies, etc., and works with the recipient governments to describe a wide range of environmental and social factors from an early stage. JICA makes an effort to include an analysis of alternatives on such occasions.
MAIN REPORT 8 - 6 CHAPTER 8

PECEM INDUSTRIAL AND PORT COMPLEX DEVELOPMENT PLAN FINAL REPORT IN THE FEDERATIVE REPUBLIC OF BRAZIL VOLUME II
• Follow-up activities are carried out after cooperation projects are terminated.
JICA asks the recipient governments to incorporate the outcome of environmental and social considerations in the implementation of projects after cooperation is terminated. JICA offers cooperation projects in accordance with other requests, when necessary.
• JICA is responsible for accountability when implementing cooperation projects.
JICA pays attention to accountability and transparency when implementing cooperation projects.
• JICA asks stakeholders for their participation.
JICA incorporates stakeholder opinions into decision-making processes regarding environmental and social considerations, and JICA ensures the meaningful participation of stakeholders in order to take considerations of environmental and social factors into account and to reach a consensus accordingly. Stakeholders participating in meetings are responsible for what they say.
• JICA discloses information.
JICA itself discloses information on environmental and social considerations in collaboration with the recipient governments, in order to ensure accountability and to promote participation of various stakeholders.
• JICA enhances organizational capacity.
JICA makes an effort to enhance the comprehensive capacity of organizations and operates to consider environmental and social factors appropriately and effectively at all times.
8.3.4 Requirements of the Recipient Government
• The recipient governments are requested to incorporate the results of environmental and social consideration studies into their planning and decision-making process once they receive authorization for a project’s implementation.
• When JICA considers either the selection of proposed projects or the support for and examination of environmental and social considerations, it examines how the recipient governments meet the requirements of JICA.
8.3.5 Procedures of Environmental and Social Considerations The Pecem port and industrial complex development plan, has been classified as Category B. It is a Master Plan Study and Feasibility Study at the stage of “Full-scale Study”. Therefore, the JICA Study Team has to make information disclosure and arrange stakeholder consultations in collaboration with the recipient governments. The information shall be disclosed four times and stakeholder consultations shall be held twice periodically during the study period.
MAIN REPORT 8 - 7 CHAPTER 8

PECEM INDUSTRIAL AND PORT COMPLEX DEVELOPMENT PLAN FINAL REPORT IN THE FEDERATIVE REPUBLIC OF BRAZIL VOLUME II
8.4 Existing Environment of Pecem Industrial and Port Complex and Surrounding Area
8.4.1 Social Environment This section analyzes the situation of the population that lives in Pecem. Data from the Institute of Research and Economic Strategy of Ceara (IPECE), tied with the Planning and Secretariat of Planning and Coordination (SEPLAN) of the State Government of Ceara, as well as data supplied by the Brazilian Institute of Geography and Statistics (IBGE), were used as a base to understand the order of population in the city.
To collect information and opinion related to port construction, an interview survey was also implemented with the people in Pecem. The result is shown in appendix 8.1.
(1) Demography Concerning Sao Goncalo do Amarante municipality, there are 6 districts: Croata (6,958 inhabitants), Pecem (8,688 inhabitants), Serrote(7,062 inhabitants), Siupe (3,061 inhabitants), Taiba (4,342 inhabitants) and Umarituba (1,319 inhabitants). Table 8.4.1 shows the population evolution of the Pecem district in relation to the municipality.
Table 8.4.1 Evolution of the Population of Pecem - 1950 to 2004
Specification 1950 1960 1970 1980 1991 2000 2004
Municipality 51,399 20,474 21,133 24,701 29,286 35,608 38,852District of Pecem 5,683 5,894 6,615 6,170 5,362 7,460 8,688 Pecem (%) 11.05 28.78 31.30 24.97 18.30 20.95 22.36
Source: IBGE - Demographic Census - 1950, 1960, 1970, 1980, 2000, and estimate of 2004 and Municipal City Hall of Sao Goncalo do Amarante. According to the Health Secretariat of Sao Goncalo, it is the only administrative department that conducts a monthly survey of the population growing, based on the number of families. For instance in the month of April, the Urban density shows 1,169 families, approximately 4,414 inhabitants, (or 50.8% of the total of the district) and Agricultural density shows 1,132 families, around 4,274 inhabitants (or 49.2% of the total number of families who live in Pecem) as shown in Table 8.4.2.
Table 8.4.2 Population of Pecem - 1991 to 2005 Variable
Resident Population (Inhabitants)
Resident Population (Percentage)
District Situation of domicile
1991 1996 2000 2005 1991 1996 2000 2005Total 5,362 6,995 7,460 8,688 100.00 100.00 100.00 100.00Urban area 2,367 2,937 2,765 4,414 44.14 41.99 37.06 50.8Pecem Rural area 2,995 4,058 4,695 4,274 55.86 58.01 62.94 49.2
Source: IBGE - Demographic Census - 1980, 1996, 2000, estimate of 2005 of the Municipal City Hall of Sao Gonçalo do Amarante.
In Pecem, regarding religious groups, the following data has been recorded, based on the head of the family:
MAIN REPORT 8 - 8 CHAPTER 8

PECEM INDUSTRIAL AND PORT COMPLEX DEVELOPMENT PLAN FINAL REPORT IN THE FEDERATIVE REPUBLIC OF BRAZIL VOLUME II
Table 8.4.3 Religion of Pecem’s families
Religion Total (%) Urban Area (%)
Rural Area (%)
Catholic 78.0 72.0 84.0 Protestant 17.0 22.0 12.0 Afro-Brazilian 0.0 0.0 0.0 No religion 3.5 6.0 1.0 Spiritist 1.5 0.0 3.0
Source: direct research
The evaluation of these numbers is always a complicated matter when thinking about Brazilian culture. Even though not attending church masses, the people are inclined to say they are Catholic, since for a long time Catholicism was Brazil´s official religion during the colonial and imperial age. The religions with indigenous and African influence, also with Christian features, classified as Afro-Brazilian (candomble, umbanda, macumba, black ceremonies, voodoo, among others), are very common everywhere in Brazil, as well as in Pecem. However, very few people say that they are just guests at the places designated for the rituals of these religions. They prefer to mention that they belong to what the majority of people accept – the Christian beliefs (religions). The Afro-Brazilian religions are the second most popular option. That explains why there is no resident in Pecem who is a member of any Afro-Brazilian religion, although it is known, that there are places especially for their rituals. Especially in the urban area (6%), some persons (3.5%) claim that they have no religion. The frequency of protestant seems to be more intense within the resettlement areas (30%). In the area occupied by the CIPP, the Catholic religion appears widely accepted (96.3%).
(2) Economical Structure At Pecem Port and Industrial Complex in the year 2005 the following enterprises operated: EDESA, Consortium CTO – Ceara Terminal Operator, TERMACO – Containers Marine Terminal and Accessory Services Ltd., WOBBEN, UNILINK Transports, DELMONTE, MPX, REFERBRAS, BEFAPI, Intermarine Terminals Ltd., CEARAPORTOS, CTIL, EIM and J2 – Construction blocks. Besides these, other industries and enterprises operate or had operated in the construction or had already used the port to transport their products, such as: Andrade Gutierrez, NUTRINOR, ENGEXATA, EMBACEL, GR, LIMPIDUS, KAUÍP Agro-industry, Locabras, RB – Water Cultures, Constructor and Ostrich Master.
In 2000, the GDP of Sao Goncalo Municipality was R$ 73,175 million, representing 0.4% of the State of Ceara and, in 2004 it was R$ 75,186 million, representing 0.3% of the State. In 2002, farming represented 25.6% of GDP, industry 4.2% and services 70.3%. In the year 2004, farming represented 15.74% of GDP, industry 33.31% and services 50.95%. It is noticed that there has been a strong increase in the industrial sector between 2002 and 2004 and a recession in services and agriculture. Per capita GDP, according to the Ceara Annual Book in 2004, was R$ 1,935.18.
In 2002, a Research on Unemployment and Underemployment conducted in Sao Goncalo by the National Employment System (SINE, Ceara – Branch Office) in the county of Sao Goncalo do Amarante indicated the following.
MAIN REPORT 8 - 9 CHAPTER 8

PECEM INDUSTRIAL AND PORT COMPLEX DEVELOPMENT PLAN FINAL REPORT IN THE FEDERATIVE REPUBLIC OF BRAZIL VOLUME II
Table 8.4.4 Employment Condition in 2001 and 2002 Specification 2001 (%) 2002 (%)
Population in active age (PIA) 81.17 82.03 Population economically active (PEA) 51.55 52.84 Population not economically active (PNEA) 48.45 47.16 Registered jobs 38.53 44.24 Casual jobs 59.87 61.13 Unemployment 21.73 15.83
Source: National Employment System
There was an increase of the casual jobs (informal occupation), decrease of the registered jobs (formal occupation), and an increase of the economically active population despite a decrease of unemployment.
The Ceara Yearbook mentions that in 2002, the Municipality Development Index (IDM) was 33.07, setting Sao Goncalo do Amarante in the 32nd position out of 184 in Ceara. The same source indicates that in 2000, the Human Development Index (IDH) was 0.639, placing Sao Goncalo at 75th position in the state and in the 3,961st position in Brazil. In 2003, the Social Exclusion Index of 0.347 indicated that the Municipality was set in the 4,117th position in Brazil.
In 2004, there were 23 Elementary schools in the Municipality, 6 Secondary schools, 1 Technical school and not even one College and/or University, although it is noted that UVA (University of Vale do Acaru) conducts some bachelor’s degree courses for some teachers who have not graduated. This University has its headquarters in the Municipality of Sobral, Ceara. The enrollment in Elementary school in 2004 numbers 8,897 students, 2,021 in Secondary school and another 1,014 in adult and youth education. The Municipality literacy index in 2000 was 73.28%; the index for Elementary school in 2002 was 97.16%, and for Secondary school it was 47.35%. In the year 2004 the Elementary school index decreased to 96.65% and the Secondary school index also decreased to 34.14%
In 2000, the Municipality of San Goncalo had 8,319 houses. In 2003 it had 57.28% of the urban population with water supply and 13.61% with sewage service. The most updated data regarding the electric power supply is from 2000 published in the Ceara Yearbook, which shows that 96.79% of homes had electric power. In November 2004 there were 11,134 customers for electric power in Sao Goncalo. In 2000, there were 4.59 telephones per 1,000 inhabitants and in November 2004, there were 2,887 customers of the telephone system.
There is no Public Defender in Sao Goncalo, there is only one Judge and a Regional Division of DECON (Consumer Rights Department) with its headquarters located in Caucaia. Until 2003 there was no radio station. Regarding the Historical heritage, there is only the Church of Nossa Senhora da Soledade located at the district of Siupe. The patron saint is Sao Goncalo do Amarante, and a few religious celebrations are held as follows: Nossa Senhora de Fatima (from 1st to 31st of May), Sao Pedro (29th June), Grande Prêmio de Pecem (August), Nossa Senhora da Soledade (7th September), the Patron Saint of celebration (November), day of the Municipality (27th November) and celebration of Nossa Senhora da Conceicao (8th December). Regarding health matters, in 2004 Sao Goncalo had one hospital with 33 beds. In 2002 there were 0.55 hospital beds per 1,000 inhabitants, 0.07 doctors per 100 inhabitants, 0.03 dentists per 100 inhabitants and the child death rate was 18.81 per 1,000 births.
MAIN REPORT 8 - 10 CHAPTER 8

PECEM INDUSTRIAL AND PORT COMPLEX DEVELOPMENT PLAN FINAL REPORT IN THE FEDERATIVE REPUBLIC OF BRAZIL VOLUME II
Altogether, in 2004 there were 26,688 voters, being 14,623 male and 12,024 female and 41 no mentioned gender. Sao Goncalo has 9 council members.
(3) Land Use The Government of the State of Ceara, through Decree Number 24.032 of 6th March 1996 declared, for expropriation purposes, an area of 335 km2 to be considered for public use. There was an alteration done by Decree 24.162 limiting CIPP’s first implementation stage to what corresponds to an area of 220km2.
(4) Public Facilities
In Pecem there are a company of the State Military Police and a branch of Banco do Estado do Ceara (BEC). There is a cooperative of fishermen comprising 296 registered persons in Pecem, and 180 in Taiba county. They do not work in a cooperative system but they grant a concession of unemployment insurance for their associates and they have a day care center that assists 102 children, in a total of 93 assisted families. They have an ice factory, a doctor and a dental cabinet which does not operate due to the lack of support from the municipality of Sao Goncalo, as informed by the president of the community, Mr. Pedro Braga Mendes, who has been the president for the last 30 years. There are around 150 fishermen who have not registered yet.
Regarding the living conditions, use of water and electrification of Pecem’s houses the following has been observed through the interview survey.
Table 8.4.5 Sanitary Conditions and Public Service Category Total (%) Urban (%) Rural (%)
House owner 82.0 82.0 82.0 Rent house 9.5 15.0 4.0 Borrow 8.5 3.0 14.0 Drinking water (public service) 54.0 81.0 27.0 No drinking water 46.0 19.0 73.0 Public Sewage system 49.0 33.0 65.0 Fossa 38.0 64.0 12.0 No sewage 13.0 3.0 23.0 Electric Energy (Services provide) 98.5 100.0 97.0 No Electric Energy 1.5 0.0 3.0
Source: direct research
It is noted that the majority of Pecem’s population live in their own houses (82.0%). Even so, 18% live in granted or rented homes. Within the resettlement areas, from all the residents with their own house, 10% live in granted homes. Regarding the use of water, it was noticed that 46% of the population does not have a water supply from the public sanitation department. This situation is even worse within the still occupied CIPP area, where 96.3% of the residents are not assisted by this service. Regarding the basic sanitation facilities, the rural area seems to have a better coverage from the public sanitation department (65%). This area is also the one that features the largest number of homes without sewage (23%). In the CIPP area still occupied, this index is 25.9%, since the cesspit system does not present an index as large as the one in the
MAIN REPORT 8 - 11 CHAPTER 8

PECEM INDUSTRIAL AND PORT COMPLEX DEVELOPMENT PLAN FINAL REPORT IN THE FEDERATIVE REPUBLIC OF BRAZIL VOLUME II
urban area (64% in urban area and 12% in rural area). Basically all residences have electric power. Only in the rural area are there still houses without electricity (3.0%).
(5) Pecem’s Low Income Population and Social Projects The Municipality Urban Defense of Sao Goncalo is in charge for enrolling the families that get only a little monthly income (R$ 150 per each family member). There are 1,424 families registered in Pecem, representing 17.9% of the families registered in the whole Municipality of Sao Goncalo (7,944 families).
The Reference Center for Social Assistance (CRAS), which is a division from the National Plan for Family Assistance (PAIF), was implemented in this county. It is an initiative of the Federal Government associated with the Ministry of Social Development and in partnership with the State and Municipal Governments. Especially in Pecem, CRAS is trying to work together with the Participative Group of Works (GTP) and Cearaportos. Since 1997 courses and projects have been conducted with the sole purpose of qualifying citizens and promoting cultural aspects. Institutions such as SEBRAE, SESC, SENAC, CVT (Sao Goncalo), Instituto Dragao do Mar, NUTEC, IDACE and SECULT, participated directly or indirectly within these projects. According to GTP, from 1997 to 2001, 1,936 students were sent to school. From this number, 631 students were from 2 to 7 years, 432 students were from 7 to 14 years; 418 enrolled in Secondary school and 455 enrolled in youth and adult education (fast learning), despite the fact that it was just in 1999 that the Secondary school was implemented in Pecem. GTP also advised that 40% of new jobs were created with the port construction, and as a result, there was a large demand for courses to qualify a population that basically featured fishermen, housekeepers and traders.
According to GTP, vocational classes were created and conducted for the civil construction sector area (348 students). The following skilled trades were included: plumber, electrician, hodman (bricklayer assistant), blacksmith, and welder. In the tourism area (322 students) the following courses were introduced: waiter, chef, pastry cooking, cultural guide, tourism guide, hygiene, food management and conservation, hospitality and customer services. About 120 students attended the classes of office assistance and information technology. Classes for freelancers (570 students) were also created in the following areas: repairs of home appliances, photography, toy repairs, costume jewelry, handcrafts, vegetable producer, gardening, herbs, drugstore, manicure and hairdresser. According to GTP 1,460 persons were qualified.
Pecem’s Families Association (ASSFAP) has projects addressing families with low monthly income, in partnership with GTP. It has already conducted a campaign for recovery of underfed children. ASSFAP also holds meetings involving 74 senior citizens, distributes construction material (for housing and construction of bathrooms), participates in the organization of activities, qualifies the health agents and has developed several social campaigns. It (ASSFAP) also maintains day care units and has an agreement with the Christian Fund for Children, where wealthy families (from other cities) donate funds for children of poor families, a sort of “adoption”, without taking the children away from their families.
MAIN REPORT 8 - 12 CHAPTER 8

PECEM INDUSTRIAL AND PORT COMPLEX DEVELOPMENT PLAN FINAL REPORT IN THE FEDERATIVE REPUBLIC OF BRAZIL VOLUME II
8.4.2 Natural Environment
(1) Topography and Geology The CIPP influence area integrates part of the Sedimentary Cenozoic Deposits with a large variety of forms and shapes. This is based on sediment deposit during the Cenozoic period. The morphologic forms of the territory reflect the influence of the accumulation process generated by fluvial activities, marine activities, wind activities or all of them combined. These activities have influenced the characteristics of the geomorphologic forms and the capacity of relief dissection, comprising different units and different forms of modeling.
Moving dune fields: Sand hills of marine and/or continental origin have been modeled by the wind. With no vegetation covering there is an active erosive process. Interruption of the natural sand dune relocation process by means of disorganized real estate construction might accelerate the coastal erosion (retro gradation).
Permanent sand dunes and Paleo-dunes: Sand dunes come from ancient dune generation, some of them eventually ruined and subjected to semi-edafization (process when the sand dunes develop properties that make them able to support the growth of vegetation). These sand dunes become unstable due to deforestation and this might reactivate the erosion process and intensify the movement of sandy sediments, causing silting up of mangroves and urban areas.
Lakes and stream coastal plains, coastal lagoons of fluvial origin and sandy plains with fluvial lakes/streams, including the lagoons: Solid waste discharge or forest degradation might result in an increase of regular flooding.
Plains with marshes: Plain areas in sedimentary fluvial marine deposits are subject to periodic floods with marsh and sandy soils. Marsh degradation decreases the biological productivity and marsh elimination would decrease the number of fish species. Sewage, solid and garbage residues all cause filling of water areas.
Fluvial plains: Plain areas have sedimentary deposits with sand and other fine sediment subject to regular floods. They contain alluvium soils and forests.
(2) Water Resources
The influence area of CIPP has seven water basins: basins of the rivers Maranguapinho, Ceara, Jua, Cahuipe, Gererau, Sao Goncalo and Curu. Considering the region of Strategic Environmental Evaluation, the main surface water resources are:
• Sitios Novos Dam (CIPP’s main source of raw water);
• Pereira de Miranda Dam (alternative source);
• Gaviao Dam (alternative source);
• Cauhipe Dam (alternative source).
A 23.5km long waterway carries the water from Sitios Novos Dam to CIPP and the urban area. This waterway has a maximum flow rate of 2.0 m3/s and, according to COGERH, it will have a flow of 1.5m3/s considering 90% warranty (with no alert volume) and 1.1m3/s with 99% warranty.
MAIN REPORT 8 - 13 CHAPTER 8

PECEM INDUSTRIAL AND PORT COMPLEX DEVELOPMENT PLAN FINAL REPORT IN THE FEDERATIVE REPUBLIC OF BRAZIL VOLUME II
(3) Marine Soil Sediment The edge of the continental platform between Fortaleza and the area shows an accentuated parallelism between the coast line and the platform border, which has a variable depth of 70 to 80 meters.
Depressions are also found over the platform that may have originated from tectonic phenomena or fluvial erosion. Bio-constructed formations prevail in the outer platform, near Pecem, and also occur in scattered spots in the inner platform. The biohermas development is the favored explanation due to the poor solid suspension sediment supply, as a consequence of the adjacent semi-arid coastal area that favors carbonate sedimentation.
The internal platform is normally formed by facies terrigena predominantly constituted by medium sand to fine quartz with scattered spots of bio-rubbish, seaweed and mud. Despite this, facies terrigena has a direct relationship with a continental influence as these sediments assume a relic character, since they are derived from the rework of the platform sediment during the last sea level alterations.
The weak competence of the streams that drain the State of Ceara imply a low concentration of suspension material, resulting in a low index of contribution of facies terrigena sediment to the platform. The small drained quantity is kept in estuaries, being only observed in restricted areas, within a small quantity of modern sand.
The JICA Study Team has conducted a bottom sediment quality survey. The result is as follows.
Chemical Analysis Results
After the collection, the sediment samples were sent to LAKEFIELD-GEOSOL Laboratories in Belo Horizonte, State of Minas Gerais, for determination of the existence and concentration of the following parameters: Mercury (Hg), Arsenic (As), Cadmium (Cd), Chromium (Cr), Lead (Pb), Cyanide (Cn), as well as the determination of existence of oils and greases (OG) and ignition loss (PF). The result is shown as follows. Sampling points were shown in Chapter 3.
Table 8.4.6 Result of Chemical Analysis
Sampling Point
Cn total
(mg/kg)
Oils and
grease (mg/kg)
Hg (ppb)
As (ppb)
Cd (ppb)
Cr (ppb)
Pb (ppb)
Ignition loss (%)
P – 1 < 0,5 62 < 50 12 < 1 78 20 24,63P – 2 < 0,5 10680 < 50 9 < 1 68 17 24,77P – 3 < 0,5 39580 < 50 7 < 1 55 18 22,93P – 4 < 0,5 24760 < 50 20 < 1 10 13 22,39P – 5 < 0,5 57740 < 50 18 < 1 24 19 16,27P – 6 < 0,5 34340 < 50 18 < 1 24 17 16,15P – 12 < 0,5 37600 < 50 36 < 1 11 8 38,43P – 16 < 0,5 3410 < 50 31 < 1 18 12 18,96
CE – 14 < 0,5 3040 < 50 23 < 1 45 17 26,69CE - 16 < 0,5 30980 < 50 16 < 1 10 13 21,43
Standard* < 0,5 - 0.2 10 5 50 10 -Source: Direct research. *: CONAMA 357
MAIN REPORT 8 - 14 CHAPTER 8

PECEM INDUSTRIAL AND PORT COMPLEX DEVELOPMENT PLAN FINAL REPORT IN THE FEDERATIVE REPUBLIC OF BRAZIL VOLUME II
Cn at 0.6 mg/kg is considered as an analytical reference for examination of water and wastewater. In this case, the results present a normal performance.
The oils and grease show different results increasing from sample 1 to sample 5 and then decreasing from sample 5 to sample 14. Sample 16 shows a medium average of oils and grease compared with all samples. The values are high and it will be necessary to analyze more samples.
For cadmium, the values are low compared to the standard. Chromium and Lead have slight differences comparing all the samples and are within a normal level of acceptance. The detection limit of mercury was too high to examine the level of acceptance.
(4) Water Quality Oils and grease were not found in any sample at levels to be considered as disapproved . This is also in accordance with visual inspection.
As for fecal coliform, from the laboratory results only one sample presented a “non null” result in the 2003 sampling. The other results are under the standard. It’s important to consider that the monitored area might suffer from the influence of contamination from Cauipe River, though it was not able to reach the port ocean area.
The studies confirm that the this area may be classified as Class 5 – Salty Water, designated acceptable for recreation, aquatic communities protection, and natural and/or intensive fish raising of species for human feeding according to CONAMA Resolution number 20/1986.
The results of the analysis show that the monitored parameters have a slight variability. It is noted that the cargo movement associated with Pecem port does not interfere with the oceanic waters environmental quality.
(5) Biodiversity
1) Fauna
Results of the fauna monitoring from 2004 to 2005 in the Pecem Industrial and Port Complex area, are as follows:
Five mammals have been identified. They can be divided into five different families. 317 birds have been identified. They belong to 28 families. 19 reptiles also have been identified belonging to 8 families.
The following table shows the main species found in the CIPP area from field research undertaken throughout 2004 and 2005. Field surveys have been developed in the dune habitats of Varzea do Cauipe River and the sea.
MAIN REPORT 8 - 15 CHAPTER 8

PECEM INDUSTRIAL AND PORT COMPLEX DEVELOPMENT PLAN FINAL REPORT IN THE FEDERATIVE REPUBLIC OF BRAZIL VOLUME II
Table 8.4.7 Main Species Found During Several Field Surveys in 2004 and 2005. Birds Todirostrum cinereum
Myiarchus swainsoni Elaenia flavogaster Hylophilus poicilotis Coereba flaveola Turdus leucomelas Columbina passerine Leptoptila verreauxi Piaya cayana Jacana jacana Xiphorhynchus picus Formicivora melanogaster Taraba major Cnemotriccus fuscatus Hemitriccus margaritaceiventer Zimmerius gracilipes Attila spadiceus Anas bahamensis Leptoptila verreauxi Chrysolampis mosquitus Tolmomyias flaviventris Formicivora melanogaster Attila spadiceus Chrysolampis mosquitus Turdus leucomelas Taraba major Thamnophilus doliatus
Mammals Procyon cancrivorus Felis wiedii Cerdocyon thous
Reptiles Cleria sp. Boa constrictor
Source: Cearaportos
2) Flora Results of the flora monitoring from 2004 to 2005 in the Pecem Industrial and Port Complex Area are as follows:
There is a renewal of its stratum due to recent deforestations, as a great number of small individuals could be observed, while ”cipo-do-rio”(liana of the river), plum, coffee and guava were observed in plantations.
It was confirmed that the Byrsonima sp. (murici) is dominant in semi-fastened dunes, in which the tops are used by some birds to search for their food and to nest. Animals also use the shadow of the vegetation, especially the shadow of murici and Anacardium ocidentale (cashew tree), during the hottest time of the day.
The identified species are shown in Table 8.4.7. There were two species not identified, which have since been identified at the UECE herbarium.
MAIN REPORT 8 - 16 CHAPTER 8

PECEM INDUSTRIAL AND PORT COMPLEX DEVELOPMENT PLAN FINAL REPORT IN THE FEDERATIVE REPUBLIC OF BRAZIL VOLUME II
Table 8.4.8 List of Flora Found in December 2004 for the Monitoring Studies. Family Species
? sp1 ? sp2 Anacardiaceae Anacardium occidentale
Astronium urudeuva Apocinaceae Plumeria sucuuba Cactaceae Cereus squamosus Caparidaceae Crataeva tapia Malpiguiaceae Byrsonima crassifolia Melastomaceae Mouriria pusa Mirtaceae Psidium sp.
Stenocalyx michelli Ocnaceae Ouratea fieldingiana Poligoniaceae Coccoloba cordifolia
Source: Cearaportos
3) Endemic and threatened species There is no endemic species and there is no study on threatened species. According to the field reconnaissance, some marine turtles lay eggs at the beach at Pecem. It is thought that some threatened species may inhabit the area around Pecem port.
A marine turtle hatchling
4) Protected areas distribution There are protected areas in the CIPP area. Two Pecem Ecological Stations (956ha) and two Pecem Environmental Protection Areas (2,009ha) have been established. Pecem’s Ecological Stations form the Integral Protection Unit, which focuses on nature protection, and the stations are used for scientific research. Pecem’s Environmental Protection Areas have been used to protect fauna and flora on the influenced area of Pecem port as well as its industrial area (compensatory measures foreseen in Pecem Port Terminal’s EIA/RIMA).
The locations of protected areas in and surrounding the CIPP are shown in the following figure.
MAIN REPORT 8 - 17 CHAPTER 8
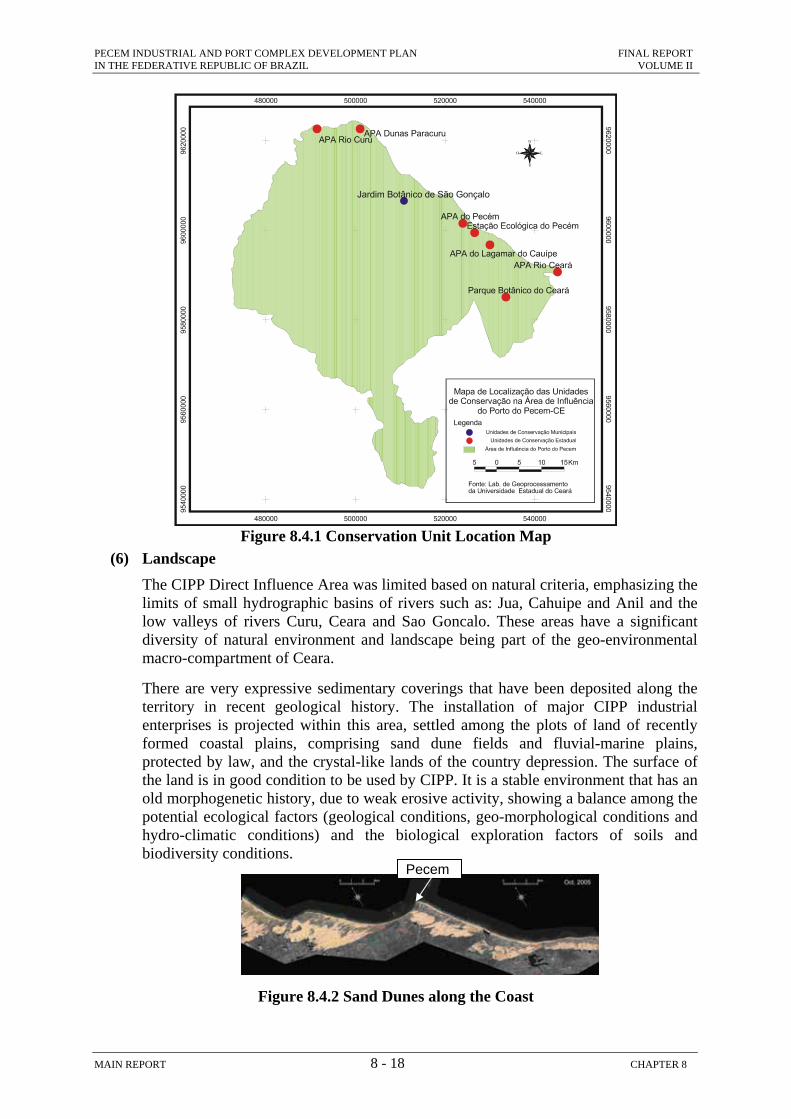
PECEM INDUSTRIAL AND PORT COMPLEX DEVELOPMENT PLAN FINAL REPORT IN THE FEDERATIVE REPUBLIC OF BRAZIL VOLUME II
Figure 8.4.1 Conservation Unit Location Map
(6) Landscape The CIPP Direct Influence Area was limited based on natural criteria, emphasizing the limits of small hydrographic basins of rivers such as: Jua, Cahuipe and Anil and the low valleys of rivers Curu, Ceara and Sao Goncalo. These areas have a significant diversity of natural environment and landscape being part of the geo-environmental macro-compartment of Ceara.
There are very expressive sedimentary coverings that have been deposited along the territory in recent geological history. The installation of major CIPP industrial enterprises is projected within this area, settled among the plots of land of recently formed coastal plains, comprising sand dune fields and fluvial-marine plains, protected by law, and the crystal-like lands of the country depression. The surface of the land is in good condition to be used by CIPP. It is a stable environment that has an old morphogenetic history, due to weak erosive activity, showing a balance among the potential ecological factors (geological conditions, geo-morphological conditions and hydro-climatic conditions) and the biological exploration factors of soils and biodiversity conditions.
m
Figure 8.4.2 Sand Du
MAIN REPORT 8 - 18
Pece
nes along the Coast
CHAPTER 8

PECEM INDUSTRIAL AND PORT COMPLEX DEVELOPMENT PLAN FINAL REPORT IN THE FEDERATIVE REPUBLIC OF BRAZIL VOLUME II
8.5 Previous Studies on Environmental and Social Considerations and Licensing of Pecem Industrial and Port Complex
8.5.1 Licensing The licensing process commenced at SEMACE with the request for the Previous License for Pecém Port and Industrial Complex Project, on the 13th of September, 1995, through the Secretariat of Energy, Transport, Works and Communication (SETECO). Subsequently, TOR No. 28/95-DILAM/UNEIA/DIPREN was issued by SEMACE. This TOR comprised the essential guidelines for the elaboration of the EIA/RIMA study by SETECO. Next SETECO contracted a company and submitted the EIA/RIMA study, which was approved by the technical team of SEMACE, through the issuing of Technical Analysis No. 88/96-SETEC/DILAM/UNEIA, as well as being approved through COEMA on July 18th, 1996. Moreover, in order to follow the required regulations, the following licenses were analysed and issued: Previous License, Installation License and Operation License.
The EIA report was updated for the recent port extension plan in 2002.
(1) Pecém Port Facilities – São Gonçalo do Amarante Municipality, Ceará
• Previous License No. 31/95 Applicant: Secretariat of Energy, Transports, Works and Communication (SETECO) Date: 11/12/1995 Process: No.: 95100067-5
• Installation License No. 42/96 Applicant: Secretariat of Energy, Transports, Works and Communication (SETECO) Date: 29/07/1996 Process: 95100067-5 Approved on the 44th COEMA ordinary meeting, according to Technical Analysis No. 88/96-DETEC/DILAM/UNEIA (18/07/96)
• Installation License Renewal No. 136/97 Applicant: Secretariat of Energy, Transports, Works and Communication (SETECO) Date: 29/07/1997 Process: No.: 95100067-5
• Installation License Renewal No. 169/98 Applicant: Secretariat of Energy, Transports, Works and Communication (SETECO) Date: 06/08/1998 Process: No.: 98167246-9
• Installation License Renewal No. 195/99 Applicant: Secretariat of Energy, Transports, Works and Communication (SETECO) Date: 22/09/1999 Process: No.: 95100067-5 and 99294831-2.
MAIN REPORT 8 - 19 CHAPTER 8

PECEM INDUSTRIAL AND PORT COMPLEX DEVELOPMENT PLAN FINAL REPORT IN THE FEDERATIVE REPUBLIC OF BRAZIL VOLUME II
(2) Fortaleza Pipeline Project – Pecém (GASFOR) – State of Ceará
• Previous License No. 55/97 Applicant: PETROBRÁS Date: 02/07/1997 Process: No.: 96209083-2
• Installation License No. 138/97 Applicant: PETROBRÁS Date: 08/09/1997 Process: No.: 96209083-2 Approved on the 55th COEMA ordinary meeting (28/08/1997).
(3) Project of Industrial Unit for the Production of Steel Products
• Previous License No. 58/97 Applicant: C.S.C – Ceará of Ceará Steel Mill Date: 09/06/1997 Process: No.: 97099669 - 1
• Installation License No. 141/97 Applicant: C.S.C – Ceará Steel Mill Date: 16/09/1997 Process: No.: 97213747-5
• Installation License No. 021/98 Applicant: C.S.C – Ceará Steel Mill Date: 05/02/1998 Process: No.: 97099669-1 Approved on the 59th COEMA ordinary meeting (18/12/1997).
(4) Project of Windmill Power Plant (5MW) at Taíba Beach – São Gonçalo do Amarante, Ceará
• Previous License No. 142/97 Applicant: Wobben Windpower Industria e Comércio Ltda. Date: 04/11/1997 Process: No.: 97232723-1
• Installation License No. 073/98 Applicant: Wobben Windpower Industria e Comércio Ltda. Date: 08/04/1998 Process: No.: 97232723-1.
(5) Industrial Project for the Manufacture and Assembly of Airgenerators by Wobben Windpower Industria e Comércio Ltda
• Installation License No. 011-S/01 – NUCAM Applicant: Windpower Industria e Comércio Ltda Date: 24/09/2001 Process: No.: 01325410-3.
MAIN REPORT 8 - 20 CHAPTER 8

PECEM INDUSTRIAL AND PORT COMPLEX DEVELOPMENT PLAN FINAL REPORT IN THE FEDERATIVE REPUBLIC OF BRAZIL VOLUME II
(6) Sítios Novos Watermain System – Pecém – São Gonçalo do Amarante and Caucaia Municipalities Channel Sítios Novos / Pecém
• Previous License No. 115/97 Applicant: Secretariat of Hydro Resources (SRH) Date: 04/09/1997 Process: no: 971676341 - 1
• Installation License No. 168/98 Applicant: Secretariat of Hydro Resources (SRH) Date: 04/08/1998 Process: No.: 98083404-0 Approved on the 64th COEMA ordinary meeting (28/05/1998).
(7) Cahuípe Public Dam
• Previous License No. 37/96 Applicant: Secretariat of Hydro Resources (SRH) Date: 29/04/1996 Process: No.: 96056044-0
• Installation License No. 095/98 Applicant: Secretariat of Hydro Resources (SRH) Date: 06/05/1998 Process: No.: 97214092-1 Approved on the 64th COEMA ordinary meeting (28/05/1998).
(8) Project of Implantation of Railway, Railway and Belt Conveyer of CIPP – São Gonçalo do Amarante and Caucaia
• Previous License No. 074/98 Applicant: Secretariat of Energy, Transports, Works and Communication (SETECO) Date: 13/03/1998 Process: No.: 98015027-2
• Installation License No. 143/98 Applicant: Secretariat of Energy, Transports, Works and Communication (SETECO) Date: 06./07/1998 Process No.: 98015027-2 Approved on the 65th COEMA ordinary meeting (25/06/1998)
• Installation License Renewal No. 059/01/NUCAM Applicant: Secretariat of Infrastructure (SEINFRA) Date: 14/03/2001 Process No.: 00264215-8 Approved on the 65th COEMA ordinary meeting (25/06/1998)
• Authorization for Deforestation No. 615/2001 Applicant: Engexata Engenharia Ltda.
MAIN REPORT 8 - 21 CHAPTER 8

PECEM INDUSTRIAL AND PORT COMPLEX DEVELOPMENT PLAN FINAL REPORT IN THE FEDERATIVE REPUBLIC OF BRAZIL VOLUME II
Date: 14/08/2001 Process No.: 01258240-9
• Installation License Renewal No. 664/2002 – COPAM/NUCAM Applicant: Secretariat of Infrastructure (SEINFRA) Date: 16/05/2002 Process No.: 00264215-8.
(9) Pecém Thermoelectric Plant Project
• Installation License No. 36/99 Applicant: Nordeste Energia S/A Date: 16/03/1999 Process No.: 98278098-2 Approved on the 22nd COEMA extraordinary meeting (11/03/1999).
(10) Project of the Power Line Transmission (LTS), at 72.5 kV, located between the existing substation and the bridge (between the stations 00+00 to 174+8.6, a total of 3,488m) in Pecém, São Gonçalo do Amarante / Ceará
• Previous License No. 230/98 Applicant: Ceará Power Company (COELCE) Date: 12/06/1998 Process No.: 98225450-4
• Installation License No. 176/98 Applicant: Ceará Power Company (COELCE) Date: 12/08/1998 Process No.: 98225617-5.
(11) Power Line Transmission LT 230kV Fortaleza II / Cauípe e SE Cauípe 230/69kV, in the municipalities of Fortaleza, Pacatuba, Maranguape e Caucaia, State of Ceará
• Previous License No. 289/98 Applicant: São Francisco Hydroelectric Company (CHESF) Date: 02/10/1998 Process No.: 98277502-4
• Installation License No. 222/98 Applicant: São Francisco Hydroelectric Company (CHESF) Date: 03/11/1998 Process No.: 98277964-0.
(12) Pecém Beach Restoration Project in São Gonçalo do Amarante municipality
• Approved on the 84th COEMA ordinary meeting (27/02/2000).
(13) Project of a Natural Gas Thermoelectric Plant Natural Gas Thermoelectric Plant – Phase I Dunas Project
• Previous License No. 68/00 Applicant: BP Brasil Ltda
MAIN REPORT 8 - 22 CHAPTER 8

PECEM INDUSTRIAL AND PORT COMPLEX DEVELOPMENT PLAN FINAL REPORT IN THE FEDERATIVE REPUBLIC OF BRAZIL VOLUME II
Date: 05/05/2000 Process No.: 00136844 – 3
Power Productor Unit comprising a LNG Unloading Sea Terminal, Regasification Unit and a Thermoelectric Plant I – Dunas Project Phase II
• Previous License No. 68/00 Applicant: BP Brasil Ltda Date: 05/05/2000 Process No.: 00136847-8, 00136846-0 and 00136845-1.
(14) Oil Refinery, to be installed at Av. Portuária, S/N – Pecém Industrial and Port Complex, Caucaia / CE
• Previous License No. 245/98 Applicant: Thyssen Comercial Brasil Exportação e Importação S/A Date: 25/08/1998 Process No.: 98225835-6
• Previous License No. 174/99 Applicant: Refinaria do Nordeste S/A (Northeastern Refinery S/A) Date: 16/08/1999 Process No.: 99257092 – 1.
(15) Project of modification of the space of the access bridge piles to the berthing piers of Pecém Port, on Pecém Beaches, São Gonçalo do Amarante Municipality / CE
• Previous License No. 103/98 Applicant: Construtora Andrade Gutierrez S/A Date: 08/04/1998 Process No.: 98083055-9
• Installation License no 182/98 Applicant: Construtora Andrade Gutierrez S/A Date: 19/08/1998 Process No.: 98225657-4.
(16) Project of Implantation of Industrial Area I, Industrial Area II and Industrial Area III at Pecém Port Complex
• Previous License No. 095/98 Applicant: Ceará Development Company (CODECE) Date: 03/04/1998 Process No.: 98083350-7.
(17) Rock Transport from the Jacurutu Quarry to Pecém Port
• Authorization (21/09/1997), based on the Technical Exam No. 21/97 – DETEC/DILAM/UNEIA (10/07/1997).
(18) Temporary Loading Terminal (TEP) of Pecém Port
• Previous License No. 116/98 Applicant: Construtora Andrade Guitierrez S/A
MAIN REPORT 8 - 23 CHAPTER 8

PECEM INDUSTRIAL AND PORT COMPLEX DEVELOPMENT PLAN FINAL REPORT IN THE FEDERATIVE REPUBLIC OF BRAZIL VOLUME II
Date: 27/04/98 Process No.: 98083056 – 7.
(19) Thermoelectric Plant Project with the capacity of 270MW, to be located on the KM 01 – South Sector of CIPP, Caucaia/Ceará
• Previous License No. 057/S/01/NUCAM Applicant: MPX Termoceará Ltda Date: 03/10/2001 Process No.: 01325411-1 Based on the Technical Exam No. 043-S/01/COPAM/NUCAM
• Authorization No. 01 – S/01 – COPAM/NUCAM Applicant: MPX Termoceará Ltda Date: 23/10/2001 Process No.: 01325411-1
• Installation License No. 034/02/NUCAM Applicant: MPX Termoceará Ltda Date: 03/10/2001 Process No.: 01325411-1 Based on the Technical Exam No. 137-S/01/COPAM/NUCAM Approved on the 96th COEMA meeting (13/12/2001).
(20) Project of Hydrocarbon and Alcohol Storage (TECEM), located at CIPP, São Gonçalo do Amarante , Caucaia, Ceará
• Installation License No. 93/99 Applicant: PETROBRÁS Date: 18/06/1999 Process No.: 99158122-9
• Installation License Renewal No. 118/01/NUCAM Applicant: Pecém Terminal Ltda. Date: 22/06/2001 Process No.: 01194284-3.
(21) Project of Pecém Windpower Plant, in the municipality of Caucaia
• Previous License No. 333/2002 – COPAM/NUCAM Applicant: Furlander Energia Brasil Ltda. Date: 01/03/2002 Process No.: 01288147 – 3
• Installation License No. 334/2002 – COPAM/NUCAM Applicant: Furlander Energia Brasil Ltda Date: 05/03/2002 Process No.: 012881147 – 3 Technical Exam No. 917/21 – NUCAM/COPAM/COFLO Approved on the 94th COEMA ordinary meeting (27/09/2001).
MAIN REPORT 8 - 24 CHAPTER 8

PECEM INDUSTRIAL AND PORT COMPLEX DEVELOPMENT PLAN FINAL REPORT IN THE FEDERATIVE REPUBLIC OF BRAZIL VOLUME II
(22) Fortaleza Thermoelectric Plant Project (UTE) Fortaleza, situated at CIPP, in the municipality of Caucaia
• Previous License No. 290/01 – NUCAM Applicant: Ceará Power Company (COELCE) Date: 29/08/2001 Process No.: 01288432 - 4
• Installation License No. 020/02 NUCAM Applicant: Fortaleza Thermoelectric Central Generator S/A Date: 07/01/2002 Process No.: 01288432-4 Based on the Technical Exam No. 334th –S/01/COPAM/NUCAM Approved on the 96th ordinary meeting (13/12/01) COEMA Resolution No. 10/01
• Authorization for Deforestation No. 112/2002 COFLO/ NUCEF Applicant: CGTF – Fortaleza Thermoelectric Central Generator S/A Date: 28/01/2002
• Authorization for Deforestation No. 660/2002 COFLO/ NUCEF Applicant: CGTF – Fortaleza Thermoelectric Central Generator S/A Date: 09/10/2002 (Renewal)
• Authorization for Deforestation No. 240/2002 COFLO/ NUCEF Applicant: CGTF – Fortaleza Thermoelectric Central Generator S/A Date: 05/03/2003
• Authorization for Deforestation No. 444/2003 COFLO/ NUCEF Applicant: CGTF – Fortaleza Thermoelectric Central Generator S/A Date: 14/05/2003.
(23) Project of Ceará Still Mill Ltda. Plant (USC)
• Previous License No. 2382/2002 – COPAM / NUCAM Applicant: CEARÁ STEEL MILL LTDA. PLANT (USC) Date: 05/12/2002 Process No.: 01325536-3 Based on the 106th ordinary meeting (28/11/02) COEMA Resolution No. 15/02.
8.5.2 Strategic Environmental Evaluation Regarding the development of the industrial area, the Strategic Environmental Evaluation (AAE) report is being prepared at the present at the request of IBAMA. The AAE must be an essential instrument to guide the land use policy in order to meet the terms of the social and economic interests and the environmental resources quality management. For the AAE it is necessary to have a large knowledge of the land and its components, with the adoption of systematic methodologies aiming to comply with the objectives of the AAE.
Each natural system represents a natural environmental organization unit. In each of these systems there is a certain amount of potential and limitation from a natural
MAIN REPORT 8 - 25 CHAPTER 8

PECEM INDUSTRIAL AND PORT COMPLEX DEVELOPMENT PLAN FINAL REPORT IN THE FEDERATIVE REPUBLIC OF BRAZIL VOLUME II
resources perspective. As such, they react according to the historical conditions of land use and occupation.
Considering the above conditions, the recent study aims to achieve the objectives below:
• Identify the main environmental variations related to land, water, climate and biodiversity;
• Prepare an environmental diagnosis of the physical environment, based on the application of a systematic methodology;
• Use specified equipment to elaborate basic cartography and the CIPP project boundary, in a compatible scale (1:50.000);
• Indicate potential, limitations and environmental systems dynamics;
• Identify the impacts resulting from the implementation of the CIPP;
• Evaluate scenery conditions through time and spatial trends; and
• Assess the environmental legislation.
8.5.3 Environmental Conservation
(1) Environmental Monitoring Environmental monitoring has been conducted for climate, waves, geomorphology, water quality and biodiversity.
(2) Monitoring of Biodiversity The Pecem Biota Monitoring Program will be implemented in the municipalities of Sao Goncalo do Amarante (Pecem district) and of Caucaia (Matoes district), State of Ceara.
The main objective of this work is to show that, although there is an activity impacting on the Pecem Port Complex, it is possible to manage and monitor the local biota.
The activities regarding the study of the fauna and flora will be concentrated in the Ecological Station of Pecem and in its environmental protection areas, as well as in some other nearby regions, like Varzea do Cauipe, Tabuleiro Litoraneo and Manguezal.
Biological studies and environmental education are necessary through direct contact with the local population.
In the case of the Pecem Port Complex, several factors were considered, such as, the geographical location of the city in relation to the capital Fortaleza, the existing road network and local oceanographic activities. An alternative would be creating new fishing areas in the local coastal platform to compensate for the area loss resulting from the Pecem port.
Regarding the marine biota of Pecem, in the municipality of Sao Goncalo, the construction of a breakwater and piers must be taken into account.
MAIN REPORT 8 - 26 CHAPTER 8

PECEM INDUSTRIAL AND PORT COMPLEX DEVELOPMENT PLAN FINAL REPORT IN THE FEDERATIVE REPUBLIC OF BRAZIL VOLUME II
The rocks brought from local quarries have been creating a particular system, forming a shelter and food source for predatory fish.
(3) Hydrological Resources Optimization A few basic policies must be prioritized, especially in areas under the influence of semi-dryness conditions. Accordingly, the Project ARIDAS (MPO, 1995), gave emphasis to the following policies that are peculiar to the CIPP area:
• Protection and renovation of the river basins, in particular river bank vegetation;
• Rationalization of the land use and occupation, to minimize negative impact such as erosion;
• Avoid environmental degradation and provide proper environment management in order to reduce impact on hydrological resources;
• Protection of the river source and of aquifers.
(4) Establishment of Protected Areas Regarding the development of the industrial area, ecological stations and APAs were established. The total area is approximately 3,000 ha (out of 32,000 ha).
(5) Other Environmental Conservation Other environmental protection in the CIPP area includes:
• Control of the deforestation;
• Control of the intensified mining activities due mainly to the exploitation of materials destined for civil construction and extension of the infra-structure;
• Control of the industrial activities that may cause water and atmospheric pollution;
• Control of the environmental impact resulting from urbanization and the expansion processes;
• Control of green house gas emission;
• Control of the impact resulting from agricultural and farming activities;
• Control of the impact resulting from disorganized occupation of the hillside;
• Control of the impact on the superficial and subterranean hydrological resources; and
• Control of solid waste disposal.
8.6 Initial Environmental Examination for Long-term Development Plan
8.6.1 Introduction Various influences were anticipated for the long-term development plan. In the first stage of examination of those influences, when alternative plans were designed, the following statements were to be taken into consideration:
MAIN REPORT 8 - 27 CHAPTER 8

PECEM INDUSTRIAL AND PORT COMPLEX DEVELOPMENT PLAN FINAL REPORT IN THE FEDERATIVE REPUBLIC OF BRAZIL VOLUME II
• Selection of the most appropriate alternative, for which negative impacts are smaller, and
• Securing conservation measures introduced by the long-term development plan at an early stage.
An Initial Environmental Examination (IEE) was implemented for the reasons above.
The items from which impact is predicted during the preparation period, construction period, and operation period by the implementation of the long-term development plan were selected from the environmental and social condition survey written in the progress report and the complementary survey. A preliminary examination of impacts on the environment and society was implemented for the environmental and social items.
The items are shown as follows. - Items
Social Environment Resettlement, Economic activity, Public facility, Tourism, Water rights, Solid waste, Wastewater, Hazards
Natural Environment Topography, Hydrology, Costal erosion, Bottom sediment, Air quality, Marine water quality, Noise and vibration, Biodiversity, Landscape
Secondary Influence Reduction of the poverty in the surrounding area, Change of land use in the surrounding area, Discharge of green house gases
Influence Concerning Life Cycle Operation period of the port dictated by the sand drift.
The measures for reducing impact were shown for items whose negative impact is predicted.
Moreover, regarding the outline of the long-term development plan, information disclosure and stakeholders meetings were carried out. Also, opinions on environmental and social considerations were collected from the stakeholders. Those opinions were referred to the IEE for the long-term development plan.
This section comprises:
i. Predicted impacts on environmental and social condition due to the long-term development plan;
ii. Evaluation of the long-term development plan;
iii. Suggested mitigation measures for the long-term development plan;
iv. Consultation and public participation.
8.6.2 Implementation of IEE Figure 8.6.1 shows the steps of the environmental and social considerations within this phase.
Dissemination of information and stakeholder meetings were carried out for consultation and public participation (see 8.7). Then the IEE was implemented to assess the environmental and social impacts of the proposed master plan and to develop mitigating measures. The results of the IEE were reflected in the master plan.
MAIN REPORT 8 - 28 CHAPTER 8

PECEM INDUSTRIAL AND PORT COMPLEX DEVELOPMENT PLAN FINAL REPORT IN THE FEDERATIVE REPUBLIC OF BRAZIL VOLUME II
Proposed Master Plan(Alternatives)
Figure 8.6.1 Steps of Initial Environmental Examination
8.6.3 Predicted Impacts on Environmental and Social Conditions due to the Long-term Development Plan The environmental and social impacts on Pecém port and the surrounding area by the long-term plan are as follows. As for the outline of a long-term development plan, refer to Chapter 6.
(1) Social Impacts
1) Economic Activity
Construction and operation periods
It is predicted that economic activity will improve during the construction and operation periods, since approximately 1800 people (680 skilled and 1120 unskilled) will be employed during the construction period, and about 1400 or
Environmental and Social Condition
Dissemination of Information
(website, translated reports)
Preliminary Scoping
Stakeholder Meeting
IEE Result
Environmental and Social Consideration
Final Master Plan
MAIN REPORT 8 - 29 CHAPTER 8

PECEM INDUSTRIAL AND PORT COMPLEX DEVELOPMENT PLAN FINAL REPORT IN THE FEDERATIVE REPUBLIC OF BRAZIL VOLUME II
more persons newly employed during the operation period (it is roughly estimated according to the plan shown in Chapter 6), and wages will be paid to the workers. Therefore the income of those people will be used within the city, increasing the local economy. In addition to this fact, an increase of casual jobs is expected due to the extension and restoration of houses. Also former unemployed citizens will find a job, and there will be a development of residential areas in order to house the population.
On the other hand, the value as a tourist attraction may decrease by the degradation of the landscape and the possible change of the shoreline by the expansion of the port. Tourism activities will lessen due to the reduction of visitors, real estate sales, etc. Negative impacts on the economy are somewhat predictable.
2) Public Facility
Operation period
With respect to public facilities, an urbanization plan will be carried out focusing on the urban zone of the CIPP area. It is expected that there will be construction of facilities such as supermarket, bank, hospital, school, water supply and sanitation system. Although this activity is scheduled within the CIPP development plan, it will be promoted according to the population increase driven by the construction activities and it is thought that the arrangements will proceed during the operation period.
3) Tourism Construction and operation periods
Tourism is not so active within the areas near Pecém port. However, there are summer houses in Pecém that are close to Pecém port. There is a perception that degradation of landscape will happen during the construction work period and it is also predicted that there will be a change of the shoreline and a reduction of sand on the beach.
On the other hand, the calm area where there are no waves will extend, and this condition is supposed to be an improvement for marine sports. This means that the potential for tourism will be higher.
4) Fishery
Construction period
There are 296 registered fishermen in Pecém village at the moment. These fishermen are mainly performing coastal fishing on small boats. Fishing around the existing breakwater that serves as a main fishery has already been restricted. However, the restricted area will expand during the construction period. Therefore, the negative impact of decreasing fishing areas is predicted. Moreover, it is predicted that fishery activity will be difficult around the construction zone due to the turbidity of water caused by the construction.
Operation period
Within the proximity of the additional breakwater, admittance will be prohibited by the hydrographic authority of Brazil. However, the diversity of fish habitats is
MAIN REPORT 8 - 30 CHAPTER 8

PECEM INDUSTRIAL AND PORT COMPLEX DEVELOPMENT PLAN FINAL REPORT IN THE FEDERATIVE REPUBLIC OF BRAZIL VOLUME II
going to increase because of the establishment of various structures and the expansion of the calm area. Therefore, an increase in the amount of fish around the port is expected.
Expected Change of Fishing Conditions
5) Solid Waste
Construction period
Scrap will be produced from construction material.
Operation period
Requests for solid waste removal by vessel may increase. However, at the present time there is no problem regarding waste management, and no problem caused by the increase of solid waste is predicted.
6) Wastewater
Construction period
Sewage will increase as a result of the increase of workers. Tanks have been installed offshore until now and the tank truck has conveyed sewage to the disposal plant periodically. Mobile baths will be used during the construction period. However, if the installation of mobile baths and transportation of sewage are overdue as a result of a rapid sewage increase, sewage may flow into the sea.
Operation period
The number of workers offshore will increase during the operation period. Therefore sewage will also increase. The same problem will appear during the construction period. Moreover, the amount of sewage on land will also increase significantly with the increase of facilities. Septic tanks are used and sludge is conveyed out at the present time. However, processing by septic tank needs to be carefully implemented with the increase of workers.
Rich Fishery No Entry Rich Fishery No Entry
MAIN REPORT 8 - 31 CHAPTER 8

PECEM INDUSTRIAL AND PORT COMPLEX DEVELOPMENT PLAN FINAL REPORT IN THE FEDERATIVE REPUBLIC OF BRAZIL VOLUME II
7) Hazard Construction period
Traffic vessels may advance into the construction zone during the construction period, and there is a risk of collision with working vessels or even with the new breakwater construction.
Operation
A calm area, wider than the present condition, will be secured during the operation period, especially at the present piers (Nos.1 and 2). It is thought that the operational safety of the port will improve.
As for the plan to construct the LNG pier (pier 0) and gas station, the details have not been determined yet and the facility will be constructed by PETROBRAS. If the pier and station are constructed, the facilities and LNG carriers will produce a high risk of accident. The potential for an accident to happen creates a huge hazard. For example, if a LNG carrier exploded, people within a distance of 500 m would suffer serious burn injuries.
(2) Natural Impacts
1) Topography
Construction and operation periods
A huge quantity of stones will be quarried out in order to construct the new break water, actually twice the amount used on the previous breakwater construction. For this reason, it is assumed that most of the hill where the quarry is located may disappear and a change of the shoreline is predicted during operation period.
2) Coastal Erosion
Preparation period
A temporary sedimentation has occurred on the northwestern side of the bridge, influenced by the removal of the temporary jetty in 2001. However, it is thought that erosion will occur again in several years.
Construction and operation periods
The erosion of the northeast shoreline is predicted as construction of the breakwater progresses. Even if the expansion of the port does not occur, erosion is predicted at the access bridge base, Pecém village, and mangrove forest areas. In the case of the implementation of the port expansion, it is predicted that the erosion will be larger in the same areas, especially at Pecem village. If on a long-term basis this erosion continues, impacts such as loss of sandy beach and collapse of properties such as summer villas and other homes on the coastal area are predicted.
MAIN REPORT 8 - 32 CHAPTER 8

PECEM INDUSTRIAL AND PORT COMPLEX DEVELOPMENT PLAN FINAL REPORT IN THE FEDERATIVE REPUBLIC OF BRAZIL VOLUME II
3) Marine Water Quality Construction period
Turbidity of the surrounding sea water is predicted from the dredging and placing of stones for the breakwater, during the construction period. Regarding the release of oil or toxic chemicals from sediment produced by the dredging, no greater impact is predicted since no high concentrations of oil or toxic chemicals were detected on the sediment survey conducted by the JICA Study Team.
Operation period
There is danger of outflows of oil from stranded vessels or even from the collision of vessels during operation period. It must be noted that in Pecém port, there is a plan to install a refueling tank and to supply fuel to vessels via a pipeline. Therefore, some leakage of oil is predicted during refueling.
4) Noise and Vibration
Construction period
The noise generated by the construction offshore and on land is slight, and the impact on neighbouring inhabitants can be insignificant.
During the transportation of the materials for the construction, especially conveyance of the stones for the breakwater construction, approximately 400 trucks/day may drive over the road (estimated roughly according to the plan shown in Chapter 5). As a consequence, an impact of noise and vibration may arise for the houses along the road.
Operation period
Approximately 1000 trucks/day are assumed to convey cargo during the operation period. For this reason, the impact of noise and vibration may arise for the houses along the road, though the area is an industrial zone and inhabitants are supposed to move in the future.
5) Biodiversity Construction period
Due to the noise and turbidity during the construction period, fish are predicted to disappear from the port surroundings, at least temporarily. It is thought that the distribution of the predatory birds which catch fish for feeding will also be influenced according to the distribution of fish.
Operation period
When the shape of the shoreline appears to change, the habitats of coast organisms will change. This is especially true for the mangrove forests located on the northwest of the port as these may be influenced by the shoreline erosion. This means that the organisms such as fish and crustaceans that inhabit the mangrove forest may be influenced.
MAIN REPORT 8 - 33 CHAPTER 8

PECEM INDUSTRIAL AND PORT COMPLEX DEVELOPMENT PLAN FINAL REPORT IN THE FEDERATIVE REPUBLIC OF BRAZIL VOLUME II
6) Landscape Construction period
The landscape will degrade as a result of the construction of the port and the traffic of the vehicles and working vessels during the construction.
Operation period
The sandy beach along Pecém village is predicted to decrease in a certain area from the erosion of shoreline during the operation period. If this situation happens, the landscape of the shoreline will be dissipated.
(3) Secondary Influence
1) Reduction of Poverty in the Surrounding Area
Construction period
The economy will be stimulated while employment increases during the construction period. As a result, the income of neighbouring inhabitants is predicted to increase.
Operation period
Employment will increase during the operation period. The population will increase, the residential area will expand, and income for the inhabitants is predicted to be generated due to the economic effects, such as construction of houses and purchase of materials and provisions. Moreover, there is an intentional urbanization plan, various infrastructures will be arranged, and the standard of living of the inhabitants is predicted to improve.
2) Change of the Land Use in the Surrounding Area
Preparation, construction and operation periods
The development of the CIPP area will continue during the preparation up to the operation period, and the land use will change in the CIPP area and in its surroundings.
Operation period
Since an increase of inhabitants is predicted during the operation period, it is predicted that a disorganized expansion of the residential area may occur.
Road networks and train lines will be used more than now in order to facilitate the movement of cargo over the wider area.
Add to this the change of large-scale land use, called conversion of the farmland, in Cerrado that may be accelerated by the expansion of Pecém port in view of the very wide area of impact. That is because Pecém port can be counted upon to function as a soybean export port. Since the development of farmland in Cerrado has already been progressing from the central states to part of the northeastern states, such as south of Piauí, without the expansion of Pecém port, the impact of the expansion of Pecém port cannot be evaluated. However, it is desired that the
MAIN REPORT 8 - 34 CHAPTER 8

PECEM INDUSTRIAL AND PORT COMPLEX DEVELOPMENT PLAN FINAL REPORT IN THE FEDERATIVE REPUBLIC OF BRAZIL VOLUME II
State of Ceará does clarify the role of Pecém port in Brazil with participation in discussion regarding the conservation and sustainable development of Cerrado.
Regarding Fortareza city, labor at Mucuripe port will be affected. Some port functions will move from Mucuripe port to Pecem port in stages. The laborers at Mucuripe port will lose their job opportunities in Fortareza in stages and have to find the same job opportunities in Pecem.
3) Discharge of Green House Gases
Construction and operation periods
The number of vessels, trucks and trains shall increase. However, the volume of the green house gas emission is relatively low. This project will develop the train network, and that is effective in restraining the discharge of green house gases.
8.6.4 Evaluation of the Long-term Development Plan Impacts of the long-term development plan are assessed and summarized in Table 8.6.1 including the “without project” case.
Negative impacts are predicted as shown in the table below. A relatively large negative impact on the shoreline is predicted during the operation period. Other impacts are almost slight. The mitigation measures for lessening impacts by port expansion are written in the following section.
MAIN REPORT 8 - 35 CHAPTER 8

PECEM INDUSTRIAL AND PORT COMPLEX DEVELOPMENT PLAN FINAL REPORT IN THE FEDERATIVE REPUBLIC OF BRAZIL VOLUME II PECEM INDUSTRIAL AND PORT COMPLEX DEVELOPMENT PLAN FINAL REPORT IN THE FEDERATIVE REPUBLIC OF BRAZIL VOLUME II
MAIN REPORT 8 - 36 CHAPTER 8
MAIN REPORT 8 - 36 CHAPTER 8

PECEM INDUSTRIAL AND PORT COMPLEX DEVELOPMENT PLAN FINAL REPORT IN THE FEDERATIVE REPUBLIC OF BRAZIL VOLUME II
8.6.5 Suggested Mitigation Measures for Long-term Development Plan The measures indicated below are preliminary to the evaluation of the IEE level for the long-term development plan. The enumeration of the measures which are supposed to be required for the environmental and social considerations when carrying out the long-term development plan contributes to the revision of the long-term development plan and financial examination. When the long-term development plan is actually implemented, it will be necessary to carry out detailed environmental research. The environmental impact assessment and conservation measures must then be re-examined.
(1) Social Environment
1) Economic Activity
a) Preparation for operation period
Impact Suggested mitigation measure Employment opportunity will increase. Vocational education should be offered and
conducted in order to promote the employment of local inhabitants.
2) Waste Water Treatment
a) Construction period
Impact Suggested mitigation measure Wastewater will increase in the construction area.
Mobile baths should be installed and wastewater should be carried out before it leaks out.
b) Operation period
Impact Suggested mitigation measure The number of employees will increase in the offshore area.
Mobile baths should be installed and wastewater should be carried out before it leaks out.
Sewage will increase with the increase of facilities on land.
A wastewater treatment system can be considered depending on the amount of wastewater.
3) Avoidance of Hazard
a) Construction period
Impact Suggested mitigation measure Traffic ships may advance into the construction zone and cause a collision with working vessels.
Invasion of a vessel to the construction zone should be prevented by the use of light buoys and flag buoys.
b) Operation period
Impact Suggested mitigation measure There is a risk of causing a collision. International Regulations for Preventing
Collisions at Sea should be applied strictly. Accidents with LNG facilities and carriers provide a serious disaster risk.
Capacity for disaster prevention should be increased with education and training. LNG facilities must be treated according to the manual. Installation of safety equipment such as stop valves is recommended.
MAIN REPORT 8 - 37 CHAPTER 8

PECEM INDUSTRIAL AND PORT COMPLEX DEVELOPMENT PLAN FINAL REPORT IN THE FEDERATIVE REPUBLIC OF BRAZIL VOLUME II
(2) Natural Environment
1) Coastal Erosion
a) Construction period Impact Suggested mitigation measure
The decrease of the sandy beach and collapse of coastal houses are predicted.
A structure that blocks the sand (such as a temporary jetty) must not be built, and the influence of the sand drift should not increase.
b) Operation period Impact Suggested mitigation measure
The decrease of the sandy beach and collapse of coastal houses are predicted.
Sand recycling should be carried out, and sediment should be transported to the eroded area. Artificial structures such as groin and revetment should be considered according to the situation of the erosion, so that houses and mangrove forests are protected.
2) Marine Water Quality
a) Construction period
Impact Suggested mitigation measure Turbidity of the surrounding seawater is predicted from dredging and injection of stones.
A silt fence should be installed, to prevent the diffusion of turbid water.
b) Operation period
Impact Suggested mitigation measure Oil may flow out when an accident occurs or when fuel is supplied to the vessels.
An oil fence should be prepared and maintained. There is an oil fence at present. However, it is desired that a larger and automatic type of oil fence be prepared.
3) Noise and Vibration
a) Construction period
Impact Suggested mitigation measure The impact of noise and vibration may arise for the houses along the road from the transportation of materials (especially stones).
A temporary road should be used, and speed should limited to 60km/h. Driving through the village must be prohibited.
b) Operation period
Impact Suggested mitigation measure The impact of noise and vibration may arise for the houses along the road from the trucks.
The speed limit should be determined at 60km/h. Driving through the village must be prohibited.
MAIN REPORT 8 - 38 CHAPTER 8

PECEM INDUSTRIAL AND PORT COMPLEX DEVELOPMENT PLAN FINAL REPORT IN THE FEDERATIVE REPUBLIC OF BRAZIL VOLUME II
4) Unpredicted Impact
a) Construction and operation periods Impact Suggested mitigation measure
Unpredicted impact at the port An Environmental Monitoring Plan (EMP) should be carried out, and the draft is as follows. Waves, marine biodiversity, water quality Survey area: Central, west and east of the port Frequency: once/month Bathymetric, bottom sediment Survey area: Central, west and east of the port Frequency: twice/year (dry and rainy seasons)
Unpredicted impact in the vicinity An Environmental Monitoring Plan (EMP) should be carried out, and the draft is as follows. Air quality, noise and vibration Survey area: Yard, roads and Pecém village Frequency: once/month Terrestrial biodiversity Survey area: Approximately 2km from the yard and mangrove forest.
(3) Secondary Influence
1) Change of the Land Use in the Surrounding Area and Fortareza
a) Preparation period Impact Suggested mitigation measure
The development of the CIPP area will proceed. Factories will be constructed.
An urbanization program should be carried out properly in the urban area, and should be maintained for the suitable expansion of the area. Vocational education should be offered and conducted in order to promote the employment of local inhabitants in the CIPP area.
b) Construction period Impact Suggested mitigation measure
The development of the CIPP area will proceed, and the number of construction laborers will increase.
Measures such as the restriction of entrance into some areas should be taken, so that the influence of construction does not affect the urban area. Intentional allocation of infrastructure should be continued in the urban area.
c) Operation period Impact Suggested mitigation measure
The CIPP area will develop, and the population number will increase.
School Education for the inhabitants should be carried out, and the idea of income generation and environmental conservation should be raised.
Some port functions will move from Mucuripe to Pecem, and laborers will have to move to Pecem.
Explanations and discussions should be held from the preparation period between the laborers (union) and Ceara state government, and Pecem port should allocate some positions and transport to the laborers.
MAIN REPORT 8 - 39 CHAPTER 8

PECEM INDUSTRIAL AND PORT COMPLEX DEVELOPMENT PLAN FINAL REPORT IN THE FEDERATIVE REPUBLIC OF BRAZIL VOLUME II
8.7 Consultation and Public Participation
8.7.1 Introduction Consultation and public participation are necessary to explain the master plan and examine the environmental and social impact of the master plan. For this reason, dissemination of information and stakeholders meetings were carried out.
8.7.2 Information Disclosure Information about the project had been disclosed through the webpage, and the newsletter of CEARAPORTOS. The webpage address is as follows.
http://www.seinfra.ce.gov.br/jica/
Web page (top page) Newsletter of CEARAPORTOS
The reports of the JICA Study Team (progress report and interim report) have also been disclosed and are available at SEPLAN, SEINFRA and CEARAPORTOS. The final report shall also be disclosed on the web page and in the above offices.
8.7.3 Stakeholders Meetings
Stakeholders meetings were held for the long-term plan and the CIPP project, as shown in Table 8.7.1, on the 16th and 22nd of August, 2005. The participants were divided into Pecem (Participative Group of Work – GTP) and Fortareza (Ceara State University – UECE), because their interests and understandings were different. The main topics were the necessity and benefits of the Pecem port development, and its environmental and social considerations.
The minutes of meetings can be read in Appendix 8.2.
Table 8.7.1 Stakeholders Meetings No. Date Place Topics 1 16th August 2005 GTP (Pecem) Background and environmental impacts 2 22nd August 2005 UECE (Fortareza) Basic strategy and cargo forecast
MAIN REPORT 8 - 40 CHAPTER 8