63623872flz2002 sap v2.0 amendment1this statistical analysis plan (sap) contains definitions of...
TRANSCRIPT

63623872FLZ2002 Statistical Analysis Plan
Page 1 of 53
Statistical Analysis Plan
A Phase 2, Randomized, Double-blind, Placebo-controlled Study to Evaluate the Pharmacokinetics, Safety, and Antiviral Activity of
JNJ-63623872 in Combination With Oseltamivir in Adult and Elderly Hospitalized Patients With Influenza A Infection
Protocol 63623872FLZ2002
JNJ-63623872
Issue/Report Date: 21 March 2017 Version: 2.0
Document No.: EDMS-ERI-134078089
Confidentiality Statement
The information in this document contains trade secrets and commercial information that are
privileged or confidential and may not be disclosed unless such disclosure is required by
applicable law or regulations. In any event, persons to whom the information is disclosed must be
informed that the information is privileged or confidential and may not be further disclosed by
them. These restrictions on disclosure will apply equally to all future information supplied to you
that is indicated as privileged or confidential.
NCT02532283
63623872FLZ2002 Statistical Analysis Plan
Page 2 of 53
Abbreviations 4
Amendments 5
1. Study description 6
1.1. Study objectives .............................................................................. 6
1.2. Study Design ................................................................................... 7
1.3. Study population .............................................................................. 8
1.4. Sample Size Justification ................................................................. 8
1.5. Randomization and Blinding .......................................................... 10
1.6. Changes to the planned analysis, not specified by protocol amendments before DB lock ......................................................... 11
2. Interim and Final analysis 12
3. General analysis specifications 13
3.1. Visit Windows, Phase Definitions and Baseline ............................. 13
3.1.1. Phase Definitions ............................................................. 13
3.1.2. Use of Unscheduled Assessments .................................. 15
3.1.3. Analysis visits ................................................................... 15
3.1.4. Analysis timepoints .......................................................... 15
3.1.5. Use of records in case more than 1 record per analysis visit/time point .................................................... 15
3.1.6. Baseline Definitions.......................................................... 16
3.2. Analysis sets ................................................................................. 16
3.3. Definition of Subgroups ................................................................. 17
3.4. Statistical Methods ........................................................................ 17
4. Analyses 19
4.1. Subject Information ....................................................................... 19
4.1.1. Subject disposition ........................................................... 19
4.1.2. Summaries will be made overall and by age category, by treatment group (and overall).Demographics parameters and baseline disease characteristics ..................................................... 19
4.1.3. Prior and Concomitant Medications ................................. 20
4.1.4. Medical history ................................................................. 21
4.1.5. Treatment Exposure and Compliance .............................. 21
4.2. Efficacy .......................................................................................... 22
4.2.1. Clinical Outcomes ............................................................ 22
4.2.2. Viral Kinetics .................................................................... 25
4.2.3. Influenza Symptom Score (FLU-iiQTM Module 1) ............. 28
4.2.4. Impact of Influenza (Flu-iiQTM Modules 2, 3, 4) ................ 30
4.2.5. FLU-iiQTM Additional Daily Diary Items ............................ 32
4.2.6. Influenza Patient Reported Outcome Diary (FLU-PRO) ................................................................................ 32
4.2.7. FLU-iiQTM Additional Daily Diary Items ............................ 35
NCT02532283

63623872FLZ2002 Statistical Analysis Plan
Page 3 of 53
4.2.8. Correlation between viral load, viral titer and changes in clinical symptoms ........................................... 35
4.2.9. Other Outcomes ............................................................... 36
4.3. Safety ............................................................................................ 36
4.3.1. Adverse events ................................................................ 36
4.3.2. Clinical laboratory tests .................................................... 38
4.3.3. Electrocardiograms .......................................................... 39
4.3.4. Vital Signs ........................................................................ 40
4.3.5. NEW Score ...................................................................... 41
4.3.6. Physical Examinations: .................................................... 41
4.4. Virology ......................................................................................... 42
4.4.1. Viral Phenotype ................................................................ 42
4.4.2. Viral Genotype ................................................................. 42
4.5. Health Care ................................................................................... 43
References 44
Appendix 1 Anticipated Events and Anticipated Event Groups 45
Appendix 2 WHO Toxicity Grading Scale for Determining the Severity of Adverse Events (Feb 2003) 48
Appendix 3 WHO grading scale Vital Signs 53
NCT02532283

63623872FLZ2002 Statistical Analysis Plan
Page 4 of 53
Abbreviations
AE Adverse event
AUC area under the curve
AUC24h area under the plasma concentration-time curve from time 0 to 24 hours
bid bis in die; twice daily
BMI body mass index
C0h predose plasma concentration
CI confidence interval
Cmax maximum plasma concentration
Cmin minimum plasma concentration
CPAP Clinical Pharmacology Analysis Plan
CTP clinical trial protocol
CV coefficient of variation
DBP diastolic blood pressure
DMC Data Monitoring Committee
ECG electrocardiogram
FAS Full Analysis Set
GMR geometric mean ratio
ICF informed consent form
ICH International Conference on Harmonization
ICU Intensive Care Unit
IDMC Independent Data Monitoring Committee
ITT Intent-To-Treat
IWRS Interactive web response system
MedDRA Medical Dictionary for Regulatory Activities
PD pharmacodynamic(s)
PK pharmacokinetic(s)
PP Per Protocol
PT preferred term
qRT-PCR quantitative reverse transcription polymerase chain reaction
RNA Ribonucleic Acid
SAE serious adverse event
SAP statistical analysis plan
SBP systolic blood pressure
SI international system
NCT02532283

63623872FLZ2002 Statistical Analysis Plan
Page 5 of 53
Amendments
Amendment 1
Changes compared to SAP version 1.0, dated 15 March 2017:
Rationale: The original analysis of viral load qRT PCR assumed that both the
limit of detection (LOD) and quantification (LOQ) were the same (2.18 log10
vp/mL). As this has been changed to two different limits: LOD of 2.05 log10
vp/mL and LOQ of 2.18 log10 vp/mL, the analysis description had to be updated
accordingly.
Updates were made to Sections 3.2 (Analysis sets) and 4.2.2 (Viral Kinetics).
NCT02532283

63623872FLZ2002 Statistical Analysis Plan
Page 6 of 53
1. Study description
This statistical analysis plan (SAP) contains definitions of analysis sets, derived
variables and statistical methods for the analysis of efficacy and safety of the
investigational compound JNJ-63623872. The SAP is to be interpreted in
conjunction with the protocol. A detailed analysis plan for the pharmacokinetic
data will be described in a Clinical Pharmacology Analysis Plan (CPAP). The
Clinical Pharmacology Analysis Plan will include the primary endpoint and all
secondary and exploratory endpoints related to PK and PK/PD for this study.
JNJ-63623872 (formerly known as VX-787) is a non-nucleotide inhibitor of the
polymerase basic protein 2 (PB2) subunit of the influenza A virus polymerase
complex and is currently in Phase 2 development as treatment for influenza A
infection.
1.1. Study objectives
Please note this SAP does not cover the primary objective and the exploratory
PK/PD relationship (efficacy and safety). These objectives will be analyzed and
reported separately according to the clinical pharmacology analysis plan (CPAP).
Primary Objective
The primary objective is to evaluate the pharmacokinetic (PK) parameters of JNJ-
63623872 in combination with oseltamivir in elderly subjects (aged 65 to ≤85
years) compared to adults (aged 18 to ≤64 years) with influenza A infection.
Secondary Objectives
Secondary objectives include the assessment of the following parameters in the
JNJ-63623872 treatment arm compared to the control arm:
■ Safety and tolerability.
■ The time to influenza viral negativity based on qRT-PCR and/or viral
culture from nasal mid-turbinate (MT) swabs and, if applicable, based on
PCR-based rapid molecular testing from nasal MT swabs.
■ Viral load over time and rate of decline in viral load during treatment as
measured by qRT-PCR and/or viral culture.
■ Area under the curve (AUC) of viral load as measured by qRT-PCR and/or
viral culture.
■ Disease status and incidence of complications associated with influenza
after the start of study treatment, and disease progression:
bacterial pneumonia (culture confirmed where possible),
other bacterial superinfections,
respiratory failure,
pulmonary disease (eg, asthma, chronic obstructive pulmonary
disease [COPD]),
cardiovascular and cerebrovascular disease (eg, myocardial
infarction, congestive heart failure [CHF], arrhythmia, stroke).
NCT02532283
63623872FLZ2002 Statistical Analysis Plan
Page 7 of 53
■ Change in duration and severity of clinical symptoms as measured by the
Flu-PRO.
■ Time to improvement of vital signs.
■ Time to improvement of respiratory status.
■ Improvement on the ordinal scale.
■ Emergence of drug resistance as detected by genotype and/or phenotype.
■ Time to return to premorbid functional status (time to return to usual
activities).
■ Time to hospital discharge.
Exploratory Objectives
Exploratory objectives include the assessment of the following parameters in the
JNJ-63623872 treatment arm compared to the control arm:
■ Use of antibiotics and/or corticosteroids during hospitalization.
■ Number of subjects admitted to the Intensive Care Unit (ICU).
■ Length of ICU stay for subjects transferred to the ICU after baseline.
■ Correlation between the decline in viral load (measured by qRT-PCR
and/or viral culture) and changes in clinical symptoms.
■ PK/PD relationship (efficacy and safety).
1.2. Study Design
This is a randomized, double-blind, placebo-controlled, multicenter Phase 2 study
to evaluate the effect of JNJ-63623872 600 mg bid versus (vs.) placebo, both in
combination with oseltamivir 75 mg bid in adult and elderly hospitalized subjects
with influenza A infection. Up to 90 subjects in total will be enrolled in this study.
An effort will be made to enroll a minimum of approximately 24 subjects per age
cohort.
Subjects who meet all eligibility criteria will be randomized in a 2:1 ratio to
receive 1 of the following 2 treatments:
■ JNJ-63623872 600 mg bid + oseltamivir 75 mg bid; OR
■ JNJ-63623872 placebo bid + oseltamivir 75 mg bid
Oseltamivir dose should be reduced to 30 mg bid for subjects with an estimated
glomerular filtration rate (eGFR) >30 and ≤60 mL/min/1.73 m² according to the
Modification of Diet in Renal Disease (MDRD) equation. Dose can be adjusted
from 30 mg to 75 mg and vice versa during the course of treatment based on the
eGFR value.
All study drugs will be taken orally.
The study will consist of a screening/baseline visit, a double-blind treatment
period of 7 days, and a follow-up period of 21 days. The entire study duration for
each subject will be 28 days with study assessments daily during the treatment
period, and on Days 10, 14, and 28 of the follow-up period. The study is
NCT02532283

63623872FLZ2002 Statistical Analysis Plan
Page 8 of 53
considered complete with the completion of the last study assessment for the last
subject participating in the study.
1.3. Study population
Eligibility will be reviewed and documented by an appropriately qualified
member of the investigator’s team before subjects are enrolled.
The inclusion and exclusion criteria for enrolling subjects in this study are
described in section 4 of the Protocol. If there is a question about the inclusion or
exclusion criteria, the investigator should consult with the appropriate sponsor
representative before enrolling a subject in the study.
1.4. Sample Size Justification
Up to 90 subjects in total will be enrolled in this study. An effort will be made to
include at least 24 subjects for each cohort, with the total of subjects allowed to be
recruited across both cohorts. It is anticipated that it is feasible to recruit at least
60 subjects, which would lead to an acceptable precision for the primary
objective.
For the primary objective of evaluating the PK of JNJ-63623872 across age
cohorts the PK parameters considered of major importance are Cmin, Cmax, and
AUC12h. As there are no data available where Day 3 has been part of extensive PK
sampling on the 600 mg bid dose, the variability on days with available data are
presented in Table 1. Based on those data a between-subjects CV of 60% was
assumed as a reasonably conservative estimate for the current study.
Table 1: Variability for Key Pharmacokinetic Parameters for JNJ-63623872 600 mg bid
(Between-subjects %CV)
Time point N Cmin Cmax AUC12h
Day 1 12 NA 65 56
Day 5 18 77 57 61
Day 5* 18 48 57 46
Day 10 12 56 44 43
Note: Based on study 63623872FLZ1001.
*JNJ-63623872 600 mg bid + oseltamivir 75 mg bid.
NA: Not applicable.
For age cohorts it was assumed that the number of hospitalizations would be
about equal for elderly and non-elderly adults. In case 60 subjects are enrolled,
there are 40 subjects on active treatment and it is assumed that at least 16 subjects
are on active treatment in each cohort). For the comparison of PK parameters of
the cohort of elderly adults (test) vs. non-elderly adults (reference) with PK data
in a 16 to 24 ratio and a between-subject coefficient of variation (CV) of 60%, the
90% confidence interval (CI) of the geometric mean ratio (GMR) for Cmin would
be predicted to have a half-width of 35%, indicating that we can be 90% confident
that the true GMR is in the interval observed GMR/1.35 to 1.35*GMR. If 90
subjects were enrolled with 60 on active treatment in a 24 to 36 ratio, the
predicted half-width would be 28%.
NCT02532283

63623872FLZ2002 Statistical Analysis Plan
Page 9 of 53
The precision was expressed as the half-width of the 90% confidence band around
the predicted mean LOESS estimate (illustrated in a simulated situation presented
in Figure 1, with circles as the individually simulated values for Cmin, as a solid
line the predicted values and the shaded area the 90% confidence band for the
prediction). With the anticipated numbers of subjects, the average half-widths and
the maximum half-width are presented in Table 2 as percentages. The average
half-width is the relative distance between the prediction and the 90% confidence
band around that mean, averaged across the observed data points. Based on 40 to
60 subjects exposed to JNJ-63623872, the 90% confidence band for the planned
LOESS regression was considered sufficiently precise (with average half-widths
less than 25%) in order to evaluate the relationship between age and the major PK
parameters.
Figure 1: Example of LOESS Regression for a Simulated Data Set for Cmin (N=50)
Table 2: Precision of the LOESS Confidence Band Around the Prediction
Cmin (CV=60%)
Number of subjects treated with JNJ-63623872
N=40 N=50 N=60
Mean half-width* 25% 22% 20%
Maximum half-width* 46% 40% 36%
*Expressed as the ratio of the upper 90% confidence band divided by the prediction derived from
the LOESS regression. Expressed as a percentage, based on 10.000 simulations.
For the safety objective of the study the sample size of 40 to 60 subjects treated
with JNJ-63623872 can be characterized by assessing the precisions for
(potentially) observed treatment-emergent AEs. For example, if no related
treatment-emergent SAE is observed in a sample of 60 subjects exposed to JNJ-
63623872, it can be concluded with 95% confidence that the true incidence of
related treatment-emergent SAEs will be less than 5%. Table 3 presents the one-
sided upper confidence limits for a range of numbers of treated subjects.
Cm
in (
ng/m
L)
0
100
200
300
400
500
600
700
800
900
Age
15 20 25 30 35 40 45 50 55 60 65 70 75 80 85
NCT02532283

63623872FLZ2002 Statistical Analysis Plan
Page 10 of 53
Table 3: Upper Confidence Limits for any Event with a Zero Incidence
Number of subjects treated with JNJ-63623872
N=40 N=50 N=60
Upper confidence limit* 7.2% 5.8% 4.9%
*Upper 95% confidence limit (one-sided) using the Clopper-Pearson method
Besides characterizing the precision for excluding significant side-effects, the
current study also allows to assess the incidence of treatment-emergent AEs on
JNJ-63623872 vs. placebo treatment. Table 4 presents the 95% CIs for the risk
difference that may potentially be observed. For example, with 4 events (out of
60) vs. 1 event (out of 30) the risk difference (95% CI) would be 3.3% (-19%,
26%).
Table 4: Risk Differences and Associated 95% Confidence Intervals for Potential Treatment-
emergent Adverse Event Incidences
Risk difference (95% CI) by sample size (active: placebo)
40:20 50:25 60:30
0% (-28%, 28%) 0% (-25%, 25%) 0% (-22%, 22%)
2.5% (-25%, 30%) 2.0% (-23%, 27%) 1.7% (-21%, 24%)
5.0% (-23%, 32%) 4.0% (-21%, 28%) 3.3% (-19%, 26%)
7.5% (-20%, 35%) 6.0% (-19%, 30%) 5.0% (-18%, 27%)
10.0% (-18%, 37%) 8.0% (-17%, 32%) 6.7% (-16%, 29%)
Based on exact 95% confidence intervals. Interval width only depends on risk difference. For zero
events in both groups the confidence interval for the risk difference is not defined.
1.5. Randomization and Blinding
Central randomization will be implemented in this study. Subjects will be
randomly assigned to 1 of 2 treatment arms in a 2:1 ratio (active vs. placebo)
based on a computer-generated randomization schedule prepared before the study
by or under the supervision of the sponsor. The randomization will be balanced by
using randomly permuted blocks and will be stratified by age cohort. An
interactive web response system (IWRS) will assign a unique treatment code,
which will dictate the treatment assignment and matching study drug kit for the
subject. The requestor must use his or her own user identification and personal
identification number when contacting the IWRS, and will then give the relevant
subject details to uniquely identify the subject.
The investigator will not be provided with randomization codes. The codes will be
maintained within the IWRS, which has the functionality to allow the investigator
to break the blind for an individual subject.
Data that may potentially unblind the treatment assignment (ie, study drug plasma
concentrations) will be handled with special care to ensure that the integrity of the
blind is maintained and the potential for bias is minimized. This can include
making special provisions, such as segregating the data in question from view by
the investigators, clinical team, or others as appropriate until the time of database
lock and unblinding.
NCT02532283

63623872FLZ2002 Statistical Analysis Plan
Page 11 of 53
Under normal circumstances, the blind should not be broken until all subjects
have completed the study and the database is finalized. Otherwise, the blind
should be broken only if specific emergency treatment/course of action would be
dictated by knowing the treatment status of the subject. In such cases, the
investigator may in an emergency determine the identity of the treatment by
contacting the IWRS. It is recommended that the investigator contact the sponsor
or its designee if possible to discuss the particular situation, before breaking the
blind. Telephone contact with the sponsor or its designee will be available 24
hours per day, 7 days per week. In the event the blind is broken, the sponsor must
be informed as soon as possible. The date, time, and reason for the unblinding
must be documented by the IWRS, in the appropriate section of the electronic
case report form (eCRF), and in the source documents. The documentation
received from the IWRS indicating the code break must be retained with the
subject's source documents in a secure manner.
1.6. Changes to the planned analysis, not specified by protocol amendments before DB lock
The protocol defines the improvement of vital signs using symptoms for
temperature, blood oxygen saturation, heart rate, SBP and respiration rate. In the
resolution criterion for temperature the protocol defines rectal and tympanic
temperatures. However, only oral temperatures are measured in the
63623872FLZ2002 trial. Additionally the trial is stratified based on age categories
for adults and elderly patients. It is known that older subjects have lower mean
oral body temperatures. Taking these aspects into account the resolution criterion
for temperature has been adapted to using oral temperature ≤ 36.5 °C for elderly
and ≤ 37.2 °C for adults instead of rectal or tympanic temperature ≤ 37.2 °C or ≤
37.8 °C respectively as specified in the protocol.
NCT02532283

63623872FLZ2002 Statistical Analysis Plan
Page 12 of 53
2. Interim and Final analysis
An IDMC will be established to monitor data on an ongoing basis. The committee
will meet periodically to review interim data. After the review, the IDMC will
make recommendations regarding the continuation of the study.
The IDMC will consist of at least one medical expert in the relevant therapeutic
area and at least one statistician. The IDMC responsibilities, authorities, and
procedures will be documented in its charter.
An interim analysis may be performed to support regulatory activities. In that case
the same Statistical Analysis Plan (SAP) will be used for the interim and the final
analysis.
Should an interim analysis be performed this analysis will be based on the number
of subjects randomized up to that timepoint. The interim analysis will be
performed by a statistical support group independent of the study biostatistician
team and any personnel directly involved in the conduct of the study. More details
about their formation, roles, responsibilities and the level of unblinding of the
different parties, can be found in the Interim Analysis Committee Charter (IAC
Charter).
NCT02532283

63623872FLZ2002 Statistical Analysis Plan
Page 13 of 53
3. General analysis specifications
All analysis dataset preparations and statistical analyses will be performed using
SAS® version 9.2.
3.1. Visit Windows, Phase Definitions and Baseline
The study is set up as shown in Figure 2. The phases will be constructed as shown
in Table 5.
Figure 2: Study time line.
Day 1 2 3 4 5 6 7 10 14 28
Arm 1 Scr. JNJ-63623872 600 mg bid
+ oseltamivir 75 mg bid*
Follow-up
Arm 2 Scr. placebo bid
+ oseltamivir 75 mg bid*
Follow-up
* Oseltamivir dose should be reduced to 30 mg bid for subjects with an estimated glomerular
filtration rate (eGFR) >30 and ≤60 mL/min/1.73 m² according to the Modification of Diet in Renal
Disease (MDRD) equation. Dose can be adjusted from 30 mg to 75 mg and vice versa during the
course of treatment based on the eGFR value.
3.1.1. Phase Definitions
Table 5: Construction of phases
Trial phase Trial sub
period*1
Start date End date
Screening
(phase 1)
The date of signing the
informed consent with 00:00
as a timepart
1 minute before the first study
medication intake
Treatment
(phase 2)
Datetime of first study
medication intake
Datetime of last
investigational medication
intake*5
+ 24 hours
Hospitalization
(sub period 1)*2
In case first intake of study
medication occurred at the
hospital*4
:
Datetime of first study
medication intake
The minimum of:
• The last date of discharge
from hospital*4
+ timepart
23:59
• The Datetime of last
investigational medication
intake*5
+ 24 hours
Outpatient
(sub period 2)*3
In case first intake of study
medication did not occur at
the hospital*4
:
Datetime of first study
medication intake
In case first intake of study
medication occurred at the
hospital*4
and last discharge
from the hospital occurred
before the end of the treatment
Datetime of last
investigational medication
intake*5
+ 24 hours
NCT02532283

63623872FLZ2002 Statistical Analysis Plan
Page 14 of 53
Trial phase Trial sub
period*1
Start date End date
phase:
End date hospitalization
phase*4
+ 1 minute
Follow-up
(phase 3)
End of the treatment phase
+1 minute
Trial termination date (date of
last contact) or cut-off date
for the Interim analysis,
whichever comes first with
23:59 as a timepart
*1: A treatment period will be constructed in the derived datasets with the same start and end date
as the treatment phase. *2
: The hospitalization phase will not be made for subjects that took the first intake of study
medication at home. *3
: The Outpatient phase will not be made for subjects that are still in hospital at the end date of the
treatment phase *4
: the start date and end date of hospitalization will be derived from the eCRF Hospitalization
page. If the start date is not available, the start date of hospitalization will be the date of first
treatment (as being hospitalized is an inclusion criterion in the protocol). If the end date is not
available the date will be derived from the subject exposure domain as the last visit that is not
‘Outpatient’ (in case no outpatient visit available in the exposure domain, the subject is assumed to
be hospitalized during the entire treatment phase). Should a subject be discharged and again
hospitalized during the treatment phase, the entire period will be regarded in the hospitalization
phase. *5
: In case the time part of the last medication intake is missing the imputed time part will be used
In case the time part of first medication intake is missing and visit time point is
available, the time will be imputed with 8:00 if the first medication was taken in
the morning or with 20:00 if the first medication was taken in the evening. In case
the time of the last medication intake is missing, the time part will be imputed
with 8:00 if the last medication was taken in the morning or with 20:00 if the last
medication was taken in the evening
The last phase, whichever it is for a subject, always ends on 23:59 of the day of
trial termination (last contact) or the cut-off date in case the data are analyzed for
an interim analysis (whichever comes first).
For phase allocation of trial termination, 23:59 will be used as time of trial
termination (on the trial termination date) in the allocation rule.
Assessments will be assigned to phases based on their date time, but seconds will
be ignored overall. If the day part of the start date of the assessment is present but
the time part is missing, the assessment will be treated as if it happened at 0:00 of
the day of the assessment (except for Adverse Events see details in section 4.3.1).
If the day part of the end date of the assessment is present but the time part is
missing, the assessment will be treated as if it happened at 23:59 of the day of the
assessment.
The number of days in the study (reldy) will be defined as:
reldy = visit day – reference day+1
for visits on or after the reference day, and
reldy = visit day – reference day
NCT02532283

63623872FLZ2002 Statistical Analysis Plan
Page 15 of 53
for visits before the reference, where the reference day equals the date of first
study medication intake.
3.1.2. Use of Unscheduled Assessments
All scheduled assessments after first administration of trial medication will be
used. Unscheduled assessments will not be used in descriptive statistics or any
per-time point analysis, but will be shown in listings as applicable. Pre-dose
unscheduled assessments will be taken into account for baseline determination
and post dose unscheduled assessments will be taken into account for worst-case
determination.
3.1.3. Analysis visits
In general, AVISIT will be derived as the day of a scheduled visit, assessment or
self-assessment (e.g. ‘Day 4’). AVISITN will be the numeric counterpart (e.g. for
‘Day 4’ AVISITN will be 4). The AVISIT for scheduled measurements before
first intake will be set to ‘Screening’ with AVISITN = -1.
For the PRO post-baseline assessments of the FLU-iiQTM
and FLU-PRO
questionnaires, AVISIT and AVISITN will be derived from the number of days in
the study relative to the start of study treatment (reldy). Post-baseline assessments
taken from 00:00 until 03:00 will be assigned to the day before (e.g. a recording
on day 4 at 01:00 will be assigned AVISIT= Day 3).
3.1.4. Analysis timepoints
In general, for parameters that were assessed more than once daily, the analysis
time point (ATPT) will the time point as reported in the database.
For the PRO assessments of the FLU-iiQTM
, all post-baseline records from day 1,
03:01 until day 15, 03:00 will be assigned to an analysis time point (ATPT) using
the following windows: morning = from 3:01 until 15:00 and evening = from
15:01 until 03:00. The measurements taken from 00:00 until 03:00 will be
assigned to the evening of the day before (e.g. a recording on day 4 at 01:00 will
be assigned AVISIT= Day 3, ATPT=Evening). For all records from day 15, 03:01
until the final study visit/Safety follow-up visit the analysis time point is the
analysis visit.
3.1.5. Use of records in case more than 1 record per analysis visit/time point
PRO assessments of FLU-iiQTM
and FLU-PRO:
- Questionnaires that have too many missing items (> 50% or for the FLU-PRO
see Minimal data requirement rules) will not be used in the anlysis. This will
also be applied for the determining the baseline questionnaire.
- For derivation of FLU-iiQTM
composite symptom score, composite impact
scores (modules 2-4) and total composite impact score; FLU-PRO domain
scores (6 domains) and FLU-PRO total score:
If two or more records, for which a compostie, total or domain score can be
calculated, are available within an analysis visit/analysis time point, only the
records from the worst questionnaire1 will be used for the analyses. The worst
NCT02532283

63623872FLZ2002 Statistical Analysis Plan
Page 16 of 53
questionnaire is the questionnaire with the highest score on an individual item.
If 2 or more questionnaires have the same highest score on an individual item,
the one with the highest average score over all items will be used (ignoring
missing items). If two or more questionnaires also have the same average
score, the one which came last in time will be used. 1A “questionnaire” is the combination of 7 symptom items for the FLU-iiQ
TM composite
symptom score; 6, 4 and 5 items for composite impact scores of module 2, module 3 and
module 4 respectively and all 15 impact score items for the total composite impact score.
Similarly, for FLU-PRO a questionnaire is the combination of the items needed to calculate
the 6 different FLU-PRO domains scores and all 32 items of FLU-PRO for the total FLU-
PRO score.
- For the analysis of the additional questions of the FLU-iiQTM
and FLU-PRO,
if two or more records are available within an analysis visit/time point, the
record to be used will be determined per individual question. Per question,
only the record with the worst1 result will be used for the tabulations. If the 2
or more records have the same worst result, the one which came last in time
will be used. 1”Worst” is defined as the lowest score for the FLU-iiQ
TM additional questions and for FLU-
PRO additional questions 7, 8 and 9. “Worst” is defined as the highest score for FLU-PRO
additional questions 1-6.
3.1.6. Baseline Definitions
In general, the baseline record is defined as the last record before the first intake
of the study drug. (For programming purposes the last record before intake will be
doubled in the ADAM datasets, the doubled record will be renamed with AVISIT
= ‘Baseline’, AVISITN = 0 and will be assigned to the treatment phase.)
For the FLU-iiQTM
and FLU-PRO questionnaire assessments, if a baseline record
is not available, the baseline record is defined as the first available assessment
within 2 hours after first intake of study drug.
3.2. Analysis sets
Population of the analyses covered by this SAP will be:
■ Randomized Analysis Set (RAND): All randomized subjects with a
randomization date at or before the date of first intake of medication, or
with a randomization date and no medication intake.
■ Randomized and/or Treated Analysis Set (RT): All randomized subjects
and/or all subjects who received at least 1 dose of study drug.
■ Safety Set or All Subjects Treated (AST): All subjects who received at least
1 dose of study drug, analyzed as treated.
■ Full Analysis Set (FAS): All randomly assigned subjects who receive at
least 1 dose of study drug and who have a confirmed infection with
influenza A. Confirmation of Influenza A will be obtained from virology
data. If there are no virology data available at cut-off of the interim
analysis, then a subject will be considered infected with Influenza A and
included in the FA set. If there are no virology data available at final
analysis, then a subject will be excluded from the FA set. Analyses on the
Full Analysis Set will be analyzed as treated.
NCT02532283
63623872FLZ2002 Statistical Analysis Plan
Page 17 of 53
A subject is considered to have a confirmed infection with influenza A if
he/she has:
at least one positive PCR result from central lab testing1 (lbtestcd =
'INFAVLD') at baseline or pre-baseline;
else
at least two positive PCR results from central lab testing1 (lbtestcd =
'INFAVLD') post-baseline;
else
at least one positive PCR result from central lab testing1 (lbtestcd =
'INFAVLD') post-baseline and one positive PCR result from local lab
testing (lbtestcd = 'INFVSCR') post-baseline, provided that both are
from a separate visit day;
else
at least one positive PCR result from local lab testing (lbtestcd =
'INFVSCR') at baseline or pre-baseline, provided that no central lab
testing is available at baseline or pre-baseline.
else
at least two positive PCR results from local lab testing (lbtestcd =
'INFVSCR') post-baseline, provided that no central, or local lab testing
is available at baseline or pre-baseline, and no central lab testing is
available post-baseline. 1Viral load results from central lab testing ( lbtestcd = 'INFAVLD') recorded as ‘TARGET
NOT DETECTED’ will be considered as negative, all other results (‘<2.18’ and numeric
results) as positive.
The Randomized and/or Treated Analysis Set (RT) will be used in all listings. The
Safety Set (AST) will be used to perform the evaluation of all safety variables.
The Full Analysis Set (FAS) will be used to perform the evaluation of all efficacy
variables.
3.3. Definition of Subgroups
The following two age categories (>=18 - <65 years, >= 65 - <= 85 years) are
strata in the study and will also be used as subgroups for the subject information,
safety and the efficacy analyses.
For demographics, baseline disease characteristics andvirology the influenza
subtype category (A/H1N1, A/H3N2 and Other) will be used as subgroup.
3.4. Statistical Methods
This SAP covers the statistical analysis for Interim and Final analyses. Details of
the single displays are described in the Data Presentation Specifications (DPS).
■ The analysis population will be indicated in the titles of the displays.
NCT02532283

63623872FLZ2002 Statistical Analysis Plan
Page 18 of 53
■ The footnote of the displays for the interim analysis will report the cut-off
date of the data snapshot or the locked database that have been used for the
analysis.
■ All results will be presented per treatment group. Tables on subject
disposition, exposure, demographic data and baseline disease
characteristics will include a ‘Total’ treatment group, pooling all subjects.
■ Tables, listings and figures will be made by age category (stratum) and
overall.
■ Listings will be presented by treatment group and ordered by subject
number and time point (if applicable).
■ All outputs should be self-explanatory and therefore appropriate footnotes
will be provided to clarify the contents of each listing, table or graph.
■ In case the X-axis of a graph shows a time component, the distances
between the time points will be proportional (not equidistant).
Furthermore, when statistics are joined over time by a line, the actual
statistics will be depicted by means of a symbol.
■ Unless specified otherwise, continuous parameters will be summarized
using the following statistics: number of observations, mean, standard
deviation, minimum, median and maximum. The mean and median will be
presented with one decimal place, while the standard deviation with two
decimal places more than the decimal places of the raw data. The
minimum and maximum will be presented to the same number of decimal
places as the raw data.
NCT02532283

63623872FLZ2002 Statistical Analysis Plan
Page 19 of 53
4. Analyses
4.1. Subject Information
All general analyses will be done on the Full Analysis Set and the Safety Set
unless specified otherwise for a specific display.
4.1.1. Subject disposition
Summaries will be provided for the following disposition information:
Number of subjects screened, screening failures, not randomized, randomized
set, randomized and not treated, randomized and/or treated, safety set, treated
but not Influenza A and full analysis set
Number of subjects who completed/discontinued treatment and/or the trial,
with the reasons of discontinuation.
Number of subjects with a visit at each scheduled analysis time point by
phase.
4.1.2. Summaries will be made overall and by age category, by treatment group (and
overall).Demographics parameters and baseline disease characteristics
All demographics and baseline disease characteristics will be summarized overall
and by age category, by treatment group (and overall); and by influenza subtype
category, by treatment group (and overall) Descriptive statistics or frequency
tabulation will be provided for the following parameters.
Demographic parameters:
• Sex (Male, Female)
• Race (White, Black or African American, Asian, American Indian or
Alaska Native, Native Hawaiian or Other Pacific Islander, Other).
The specification of the category ‘Other’ will only be listed.
• Ethnicity (Hispanic or Latino, Not Hispanic or Latino)
• Country
• Geographic region (based on country: North America (to include
Puerto Rico), Europe, Asia-Pacific, South America)
• Age (years and categories: >=18 - <65 years, >= 65 - <= 85 years)
• Weight at baseline (kg)
• Height at baseline (cm)
• BMI at baseline = Weight at baseline (kg) / (Height at baseline (m))2
(rounded to 1 decimal. Although available in the raw data, BMI will
be recalculated from last weight and height measurement before start
of treatment)
• Site ID
NCT02532283
63623872FLZ2002 Statistical Analysis Plan
Page 20 of 53
• Tobacco use: cigarettes, cigars, patches/gum, pipes, smokeless
tobacco (Yes, No: including ex-smokers)
• Childbearing Potential (only listed)
Baseline disease characteristics:
• Influenza subtype category (A/H1N1, A/H3N2, other)
• Baseline influenza A viral load (log10 copies/mL), assessed by qRT-
PCR
• Baseline influenza A viral titer (log10 TCID50/mL) assessed by viral
culture
• Composite symptom score of the seven primary influenza symptoms
at baseline from the FLU-iiQTM
(as defined in section 4.2.3)
• Baseline FLU-PRO total score (as defined in section 4.2.6)
• NEW Score at baseline
• Respiration rate at baseline
• Arterial oxygen saturation at baseline
• Supplemental oxygen at baseline (Yes, No)
• Oral temperature (°C) at baseline
• Systolic blood pressure at baseline
• Heart rate at baseline
• Level of consciousness at baseline
4.1.3. Prior and Concomitant Medications
Medications taken up to 7 days before first dose of study drug and up to the Final
Study Visit/Safety Follow-up Visit will be summarized by preferred term using
the World Health Organization-Drug Dictionary for the FA Set and the Safety Set
as frequency tables in 2 parts:
1. Prior medication: medication that started before the first dose of study
drug, regardless of when dosing of the medication ended
2. Concomitant medication: medication received at or after the first dose of
study drug, medication that was received before initial dosing and
continued after initial dosing of study drug, or medication with missing
stop date.
(Medication that started before the first dose of study drug and continued after the
first dose of study drug will be summarized as prior medication and separately as
concomitant medication.)
A frequency tabulation of concomitant medication will be shown by ATC class
level up to level 3. Frequency tabulations will be made for concomitant
antibiotics and corticosteroids by ATC class and by hospitalization status
(Yes/No). Tabulations of concomitant corticosteroids and antibiotics administered
NCT02532283

63623872FLZ2002 Statistical Analysis Plan
Page 21 of 53
because of adverse events reported as influenza complications will also be made.
Separate frequency tabulations will be made for antipyretic medication and
oxygen supplementation. Antipyretic medication will be categorized as
Paracetamol, Ibuprofen, or other. The table showing oxygen supplementation will
be tabulated per analysis visit and phase.
All tabulations will be created overall and by age group, by treatment group (and
overall).
If a prior/concomitant therapy record misses components of its start and/or stop
dates (time and/or day and/or month and/or year), the following actions will be
taken:
1. In case of partial start or stop date/times, the concomitant therapy records
will be allocated to prior and/or concomitant using the available partial
information, without imputations.
2. In case of a completely missing start date, the prior and/or concomitant
therapy will be considered as having started before the trial.
3. In case of a completely missing end date, the prior and/or concomitant
therapy will be considered as ongoing at the end of the trial.
4.1.4. Medical history
Medical history will only be listed.
The influenza vaccination status will be tabulated by previous season, current
season and both previous and current season (for subjects who got vaccinated in
both seasons), overall and by age category, by treatment group (and overall).
The use of antiviral influenza medication prior to hospitalization will be tabulated
separately, overall and by age category, by treatment group (and overall).
Influenza history will be listed, including information on first acute respiratory
symptoms, influenza vaccination and previous antiviral influenza therapy. Pre-
treatment Influenza complications will also be listed.
4.1.5. Treatment Exposure and Compliance
The treatment duration is defined as date/time of last study drug intake – date/time
of first study drug intake + 12 hours.
Note: treatment interruptions will not be taken into account for the above
definition.
Dosing compliance is calculated as the actual number of doses taken, as a
percentage of the planned number of doses. The actual number of doses taken will
be derived from the exposure information (EX domain) during hospitalization and
from the drug accountability information (DA domain) after discharge from
hospital.
In the exposure information the amount of medication administered during
hospitalization is given per visit and time point, the actual number of
tablets/capsules during hospitalization is the sum of this amount per medication
for the records that are not outpatient records.
NCT02532283

63623872FLZ2002 Statistical Analysis Plan
Page 22 of 53
The actual amount of tablets/capsules taken after discharge will be derived from
the drug accountability information as the difference between the drug
dispensation at discharge and the returned amount (in case both amounts are
known).
The actual number of doses taken during the study is the sum of the actual number
of medication taken during hospitalization and after discharge, for Placebo or
JNJ872 this number needs to be divided by 2 as the study uses 300 mg tablets. In
total, the planned number of medication is 28 tablets of Placebo or JNJ872 and 14
capsules of Oseltamivir. Hence the planned number of doses per medication
equals 14 doses.
Actual treatment duration and dosing compliance will be summarized
descriptively overall and by age category, by treatment group (and overall).
4.2. Efficacy
All efficacy analyses will be done on the full analysis set. Descriptive statistics
will be used for all efficacy endpoints and will be tabulated by treatment group
and by stratum age category (>=18 - <65 years, >= 65 - <= 85 years, overall).
Derived parameters will also be listed. No formal statistical hypothesis testing will
be performed.
4.2.1. Clinical Outcomes
Incidence of influenza complications
The incidence of influenza complications from first intake up to Day 28 will
be categorized in a hierarchical fashion. The overall category will consist of
any complication, consisting of the following subcategories
bacterial pneumonia (culture confirmed where possible),
other bacterial superinfections,
respiratory failure,
pulmonary disease: asthma, chronic obstructive pulmonary disease
[COPD]),
cardiovascular and cerebrovascular disease (eg, myocardial infarction,
congestive heart failure [CHF], arrhythmia, stroke),
post-baseline ICU admission,
all-cause mortality
The occurrence (yes/no) of influenza complications from first intake up to Day
28 of each (sub) category will be analyzed using logistic regression with
treatment group as covariate. In case influenza complications occur in both
age categories, age category will also be added as a covariate and as an
interaction with treatment group. If the model will not fit the age category and
it’s interaction will be removed. Odds ratios and associated 95% CIs will be
reported of active vs. control treatment and – if available – of elderly patients
vs. patients <65 years.
Time to improvement of vital signs
NCT02532283

63623872FLZ2002 Statistical Analysis Plan
Page 23 of 53
The time to improvement of vital signs is defined as the time (in hours) from
first study treatment until the first assessment (actual date and time) of a
successive series of 3 recordings (over 4 scheduled successive analysis time
points, 1 missing time point is allowed) where at least 4 of 5 symptoms
(temperature, blood oxygen saturation, heart rate, SBP, respiration rate) are
recovered, with at least normalization of temperature and blood oxygen
saturation. Normalization is defined in Table 6. If subjects satisfy these criteria
at entry they will be censored at that time.
Only vital signs assessments assessed during hospitalization and up to Day 14
(during hospitalization) will be taken into account to determine time to
improvement of vital signs. Assessments taken after hospital discharge or after
day 14, whichever, comes first will not be taken into account. In case, there
was more than one hospitalization period, only assessments of the first
hospitalization period will be used.
In cases where there are no sufficient recordings of clinical stability as defined
above, the endpoint will be censored. Censoring will be at the first time of clinical
stability, if and only if after this observation there is no recording of non-resolved
influenza symptoms (ignoring missing recordings). If there are no recordings of
resolved symptoms satisfying this criterion, the time of censoring is the first
possible time point an assessment could have been done after the last observation
of vital signs recordings, which is 13:00 on the same day if the last observation
was a morning assessment (from 3:01 until 11:00), 21:00 if the last observation
was an afternoon assessment (from 11:01 until 19:00), 5:00 the next day if the last
assessment was an evening assessment (from 19:01 until 03:00). There are two
exceptions: in case the last available vital signs record is on the day of discharge
in the evening or on day 14 during hospitalization in the evening. If at this record
(last record for the subject to be taken into account for time to clinical stability)
there is no clinical stability, the time of the last assessment (day of discharge,
evening or day 14, evening) will be taken as the time of censoring.
The data will be presented using a Kaplan-Meier curve and Kaplan-Meier
estimates by treatment group, overall and by age group.The time to event data
will be modeled using the accelerated failure time model. The model will use
the parametric shape, selected based on the goodness of fit criterion (AIC),
and may take a Weibull, log-logistic, lognormal, or gamma distribution. Age
category, NEW Score at baseline and treatment group will be included as
covariatesIf the data don’t provide an acceptable model fit, alternatively a Cox
proportional hazards model can be used (in case the hazards are proportional).
In case a Cox proportional hazards model is used a Log-log plot of survival
will be added to check the proportional hazard assumption. Additionally, the
time to event data will be analyzed using the logrank test and the Gehan-
Wilcoxon method.
Table 6: Resolution Criteria for Vital Signs
Assessment Resolution Criterion
Temperature Oral temperature ≤ 36.5 °C for elderly and ≤ 37.2 °C for adults
Oxygen saturation ≥ 92% on room air without supplemental oxygen*
Respiration rate ≤ 24/min
Heart rate ≤ 100/min
Systolic blood pressure ≥ 90 mmHg
NCT02532283

63623872FLZ2002 Statistical Analysis Plan
Page 24 of 53
*On room air to be obtained from “Was oxygen saturation measured on room air?” on Vital
Signs pages (SUPPVS.QVAL for SUPPVS.QNAM = ‘VSOXSMRA’
Time to improvement of respiratory status
Time to improvement of respiratory status is defined as the time (in hours)
from first study treatment until the first assessment (actual date and time) of a
successive series of 3 recordings (over 4 scheduled successive analysis time
points, 1 missing time point is allowed) where normalization of blood oxygen
saturation and respiration rate occurred (as defined in Table 6). Analysis
performed will be analogous to the analysis for the time to improvement of
vital signs. Note that the NEW Score at baseline should not be added as
covariate in the models.
Clinical outcome on day 8
The ordinal scale consists of 6 categories that are exhaustive, mutually
exclusive, and ordered (Table 7). For all patients, the category at days 1 to 15
will be established as the worst category on that day. The clinical outcome on
day 8 will be further analyzed.
The analysis of the clinical outcome on day 8 will be performed using a
proportional odds model, modeling the common odds ratio of the
improvement on the ordinal scale of active treatment versus control. Age
category (>=18 - <65 years, >= 65 - <= 85 years) and baseline clinical
outcome category will be added to the model. In case the model will not fit,
age category and subsequently baseline category will be deleted.
In case of missing data (>10%), multiple imputation under the missing-at-
random assumption will be employed as a sensitivity analysis. The Markov
chain Monte Carlo (MCMC) method will be used to create a number of
multiple imputation datasets with monotone missingness in the clinical
outcomes (baseline until day 15). The number of imputation datasets will be
the same as the percentage of missing data (White et al. 2011). A monotone
ordinal logistic regression imputation model will be used to complete the
remaining missing clinical outcomes. The models fitted using the multiple
imputation datasets will be the same as the final model on the actual data. The
results from the models on the multiple imputation datasets will be combined
taking into account the between and within variation of the results.
Additionally a Wilcoxon–Mann–Whitney test will be performed to compare
the clinical outcome on day 8 between the two treatments.
Table 7: Ordinal scale on Day 8
Outcome
Death
Admitted to ICU or mechanically ventilated/ECMO
Non-ICU + supplemental oxygen
Non-ICU + no supplemental oxygen
Not hospitalized, but unable to continue activity
Not hospitalized and continues activities
ECMO = extracorporeal membrane oxygenation; ICU = Intensive Care Unit
NCT02532283

63623872FLZ2002 Statistical Analysis Plan
Page 25 of 53
4.2.2. Viral Kinetics
Influenza viral load and viral titer will be determined and quantified in Nasal MT
swab samples taken daily until discharge or until Day 14, whichever comes first.
When subjects are discharged from the hospital and still positive for influenza A
virus, they are encouraged to perform self-swabbing at home if practically
feasible. All swabs will be analyzed using quantitative real time polymerase chain
reaction (qRT-PCR) and/or viral culture (TCID50) and/or PCR-based rapid
molecular testing (if applicable).
All analyses described below, will be done on the qRT-PCR and viral culture
results from central lab testing. As a sensitivity analysis, time to viral negativity
will also be evaluated on a combination of the qRT-PCR results from central
testing with the local rapid influenza test results (at home or on site) of days on
which the results from central lab testing were missing.
The viral culture (TCID50) measurements are analyzed using two methods
(depending on influenza subtype); i.e. NP ELISA and Hemagglutination
Inhibition Assay. For analysis purposes the results from the NP ELISA method
will be used when available, otherwise the results from the Hemagglutination
Inhibition Assay will be used. This will be determined per time point. As a
consequence the results of a subject can be a combination of both methods (for
example at baseline the NP ELISA result is used and at day 4 the
Hemagglutination Inhibition Assay result is used).
Viral load results recorded as ‘TARGET NOT DETECTED’ will be considered as
negative, all other results (‘<2.18’ and numeric results) as positive. Viral titer
results recorded as ‘<0.75’ will be considered as negative, all other results as
positive.
For analysis purposes the log10 qRT-PCR viral load will be imputed with 2.12
when the result is ‘<2.18’ (i.e. below limit of quantification) and with 0 if result is
‘TARGET NOT DETECTED’ (i.e. below limit of detection: <2.05). The log10
TCID50 viral titer will be imputed with 0.375 when the result is ‘<0.750’.
Viral load and viral titer actual values and change from baseline
Descriptive statistics and mean (SE) plots will be shown for the log10 values
of viral load and viral titer (qRT-PCR and viral culture) and the changes from
baseline calculated in log10 (vp/mL or TCID50/mL).
Incidence of influenza A viral negativity by assessment
The proportion of subjects with a negative viral load and a negative viral titer
will be tabulated at each time point.In addition, per parameter and time point a
logistic model with baseline viral load/viral titer and age category (>=18 - <65
years, >= 65 - <= 85 years) as covariates will be used to obtain the odds ratios
(95% CI) for the comparison of the incidence of influenza A viral negativity
of treatment versus placebo.
Stacked barcharts of the percentage of subjects per response category will be
made by day and treatment for viral load and viral titer. The following
response categories will be used:
� For viral load (log10 vp/mL) measurements:
o Target not detected (<2.05 log10 vp/mL)
NCT02532283

63623872FLZ2002 Statistical Analysis Plan
Page 26 of 53
o Target detected (<2.18 log10 vp/mL)
o Quantifiable (≥2.18 log10 vp/mL)
� For viral titer (log10 TCID50/mL) measurements:
o Negative (<0.75 log10 TCID50/mL)
o Positive (≥0.75 log10 TCID50/mL)
Time to influenza A viral negativity
The time to influenza A viral negativity will be determined based on nasal MT
swabs: a subject will be considered influenza A viral negative at the time point
that the first confirmed negative nasal MT swab was recorded (in days) i.e.
defined as time in days from start of treatment to first of assessments
=’negative’ and the next assessed measurement is not =’positive’(ignoring
missings, i.e. if first ‘negative’ is last available assessment or if next assessed
result after first ‘negative’ is also ‘negative’). If this doesn’t occur, a subject
will be censored at the time of the last observed nonnegative swab + 1 day.
Note that at baseline every subject is considered positive.
This will be done separately for viral load and viral titer assessments from
central lab testing. As a sensitivity analysis, time to negativity will also be
evaluated on a combination of qRT-PCR results from central lab testing and
rapid influenza test results (from self or on site swabs). The available central
lab qRT-PCR results (qualitative) will be complemented with the results of the
rapid influenza tests that are available on days where central lab testing results
are not available.
The time to influenza A viral negativity will be presented using Kaplan-Meier
curves and Kaplan-Meier estimates by treatment group, overall and by age
group. For a comparison between treatment arms, the time to influenza A
viral negativity will be analyzed using an accelerated failure time model. The
accelerated failure time model will use a Weibull, log-logistic, lognormal or
gamma distribution based on goodness of fit criteria (AIC). As covariates the
baseline viral load and the age category (>=18 - <65 years, >= 65 - <= 85
years) will be included. If the data don’t provide an acceptable model fit,
alternatively a Cox proportional hazards model can be used (in case the
hazards are proportional). In case a Cox proportional hazards model is used a
Log-log plot of survival will be added to check the proportional hazard
assumption. Additionally, the time to event data will be analyzed using the
logrank test and Gehan-Wilcoxon method.
Viral AUC calculated from baseline to Day 8
The viral AUC, calculated separately for viral load and viral titer, from
baseline to Day 8 will be estimated for each treatment arm using a mixed
model for repeated measurements, i.e., the AUC will not be calculated for
each subject and then analyzed, but the AUC will be calculated for each
treatment arm using log10 transformed viral load data over time of each
subject. This approach ensures an optimal approach towards missing data.
NCT02532283

63623872FLZ2002 Statistical Analysis Plan
Page 27 of 53
Baseline and post-baseline mean viral load values over time (at time points
Day 1 to 5 and Day 8) will be analyzed using a restricted maximum likelihood
based repeated measures approach using a constrained longitudinal data
analysis. The analysis model will include the fixed, categorical effects of visit,
treatment-by-visit interaction, age category-by-visit interaction and treatment-
by-visit-by age category interaction. The following list of covariance
structures will be applied in the model fit, in the specified order, and the first
correlation structure to yield convergence will be applied in the analysis:
● Unstructured [UN]
● Ante-dependence [ANTE(1)]
● Heterogenous Toeplitz [TOEPH]
● Heterogeneous CS [CSH]
● Heterogeneous AR(1) [ARH(1)]
● Toeplitz [TOEP]
The Kenward-Roger approximation will be used to estimate denominator
degrees of freedom.
The area under the viral load curve (viral AUC) will be based on the Full
Analysis set. The model estimates from the model above will be used to
estimate the viral AUC for each treatment and to derive the difference in the
viral AUCs for active versus placebo, overall and by age category.
A mean ±95% CI plot will also be provided for the estimated viral load and
estimated viral titer over time.
Rate of decline of viral load and viral titer
The rate of decline in quantitative viral load (log10 vp/mL per day) and
quantitative viral titer (log10 TCID50/mL per day) will be estimated per
treatment through a linear mixed model with repeated measures. Treatment
and age group will be added as categorical effects, time will be added as a
continuous covariate and the interactions between treatment and time, age
group and treatment, and age group and time will also be added. The model
will be fit with a random intercept and a random slope. In case the model will
not fit, age category and interaction terms with age group will be deleted.
Peak viral load and peak viral titer
The peak viral load/viral titer is defined as the highest value of viral load/viral
titer during treatment and follow-up (including the baseline value) calculated
as log10 (vp/mL or TCID50/mL). For the peak viral load/ viral titer a
geometric mean ratio (GMR) will be derived using a general linear model
including treatment group, age category and the interaction of both.
Descriptive statistics will be provided by treatment group, overall and by age
group.
NCT02532283

63623872FLZ2002 Statistical Analysis Plan
Page 28 of 53
4.2.3. Influenza Symptom Score (FLU-iiQTM
Module 1)
The influenza symptom score (Flu-iiQTM
Modules 1) will be assessed 2 times a
day, from study entry (Baseline, Day 1) through Day 14, and once daily from
Days 15 through Day 28 (Safety Follow-up Visit).
Composite symptom score
The subject’s composite symptom score per datetime is defined as the mean of
the corresponding non-missing 7 primary influenza symptoms of the Flu-
iiQTM
(cough, sore throat, headache, nasal congestion, feeling feverish, body
aches or pains, and fatigue (tiredness)) on a 0-3 scale calculated for each
datetime the questionnaire was filled. For each time point a change from
baseline will be calculated.
An alternative composite symptom score will be calculated using all 10
influenza symptoms included in Module 1 of the Flu-iiQTM
instrument.
If more than 50% of the items to construct a Composite symptom score are
missing, the value for that composite score is coded as missing (i.e. 4 or more
items missing for the primary symptom composite score and 6 or more items
missing for the composite score based on all 10 items).
The actual composite symptom scores and changes from baseline will be
shown descriptively and by mean (SE) plots per analysis timepoint.
Daily average symptom score
For the Flu-iiQ™ a daily average symptom score will be derived averaging
the composite symptom scores (based on 7 primary and all 10 items
respectively) per day over all post-baseline analysis timepoints. Also a total
average symptom score over the daily averages of the composite symptom
score will be calculated. The baseline value of the daily average symptom
score will be the baseline score of the respective individual influenza
symptom score or the composite symptom score..
The daily averages of the composite symptom scores will be shown
descriptively and by mean (SE) plots. The total average composite symptom
score will be shown descriptively.
Time to Resolution of Influenza
Resolution of influenza symptoms is defined as the first of a successive series
of 2 recordings in which all symptom scores for each of the 2 assessments are
0 or 1 for all 7 primary influenza symptoms of the Flu-iiQTM
(cough, sore
throat, headache, nasal congestion, feeling feverish, body aches or pains, and
fatigue (tiredness)). If the first record of a successive series of 2 recordings of
resolved influenza is before day 14 in the evening then the 2 successive
recording should have been done over 3 scheduled successive analysis
timepoints, 1 missing timepoint is allowed. If the first record of a successive
series of 2 recordings of resolved influenza is at or after the evening record of
Day 14 then the 2 successive recordings should have been done within 2
scheduled successive analysis timepoints (no missing allowed).
In cases where there are no sufficient recordings of resolved influenza as
defined above, the endpoint will be censored. Censoring will be at the first
NCT02532283

63623872FLZ2002 Statistical Analysis Plan
Page 29 of 53
time of resolved influenza symptoms, if and only if after this observation
there is no recording of non-resolved influenza symptoms (ignoring missing
recordings). If there are no recordings of resolved symptoms satisfying this
criterion, the time of censoring is the first possible time point a diary entry
could have been made after the last observation of the presence of influenza,
which is 20:00 on the same day if the last observation was a morning diary
entry (from 3:01 until 15:00), 8:00 the next day if the last entry was an
evening diary (from 15:01 until 03:00) (Day 1 until Day 14, morning). If the
last observation of the presence of influenza is on Day 14 in the evening or
after day 14 then the time of censoring is the time of the last diary entry + 24
hours. One exception is censoring at the Day 28 Visit (last study day for the
subject). If the subject is not recovered on this day, the time of the last diary
entry will be taken as the time of censoring.
Subjects who discontinue the study before resolving influenza symptoms and
have an adverse events being reported as influenzacomplication ongoing on
the day of discontinuation of the study will be censored at day 28, 20:00.
For this endpoint the difference of active dosing regimen versus placebo will
be estimated using the accelerated failure time model. The model will use the
parametric shape, selected based on the goodness of fit criterion (AIC), and
may take a Weibull, log-logistic, lognormal, or gamma distribution. As
baseline covariates the baseline composite score and age category (>=18 - <65
years, >= 65 - <= 85 years) will be included. From this model the ratio of
adjusted geometric means and the 95% confidence interval will be derived
comparing the active treatment versus placebo.
The Kaplan-Meier estimates will be tabulated and a figure with the Kaplan-
Meier curves of the time to resolution of influenza symptoms will be added by
treatment group, overall and by age group.
One stratified Cox proportional hazard model will be used to derive the
Hazard Ratio for the active treatment in comparison to placebo. A Log (-Log)
plot of survival will be added to check the proportional hazard assumption.
Additionally, the time to event data will be analyzed using the logrank test
and the Gehan-Wilcoxon method.
All analyses of Time to Resolution of Influenza will also be repeated using all
10 influenza symptoms included in Module 1 of the Flu-iiQTM
instrument.
Kaplan-Meier curves will also be provided for each individual influenza
symptom separately.
Time to Definitive Resolution of Influenza
Time to definitive resolution is defined as the first of a successive series of 2
recordings in which all symptom scores for each of the 2 assessments are 0 or
1 for all 7 primary influenza symptoms of the Flu-iiQTM
(cough, sore throat,
headache, nasal congestion, feeling feverish, body aches or pains, and fatigue
(tiredness)) AND after which all following assessments also indicate
resolution (all symptom scores 0 or 1 for all 7 primary influenza symptoms) or
are missing.
NCT02532283
63623872FLZ2002 Statistical Analysis Plan
Page 30 of 53
Definitions for a successive series of 2 recordings over time are the same as
for the Time to Resolution of Influenza. Also censoring will be done similarly
as for the Time to Resolution of Influenza.
The Time to Definitive Resolution of Influenza will be analyzed similarly as
the Time to Resolution of Influenza.
Composite symptom score AUC: The composite symptom score AUC will be calculated using the daily average
symptom scores, from baseline to Day 8 and will be estimated for each
treatment arm using a mixed model for repeated measurements, ie, the AUC
will not be calculated for each subject and then analyzed, but the AUC will be
calculated for each treatment arm using the daily average symptom scores
over time of each subject. This approach ensures an optimal approach towards
missing data.
Baseline and post-baseline daily average symptom scores over time will be
analyzed using a restricted maximum likelihood based repeated measures
approach and using a constrained longitudinal data analysis. The analysis
model will include the fixed, categorical effects visit, treatment-by-visit
interaction, age category-by-visit interaction and treatment-by-visit-by age
category interaction.
The following list of covariance structures will be applied in the model fit, in
the specified order, and the first correlation structure to yield convergence
will be applied in the analysis:
● Unstructured [UN]
● Ante-dependence [ANTE(1)]
● Heterogenous Toeplitz [TOEPH]
● Heterogeneous CS [CSH]
● Heterogeneous AR(1) [ARH(1)]
● Toeplitz [TOEP]
The Kenward-Roger approximation will be used to estimate denominator
degrees of freedom.
The composite symptom score AUCs until Day 8 will be based on the Full
Analysis set. The model estimates from the model above will be used to
estimate the composite symptom score AUCs for each treatment and to derive
the difference in the composite symptom score AUCs for active versus
placebo overall and by age category.
A mean ±95% CI plot will also be provided for the estimated average
symptom scores over time.
4.2.4. Impact of Influenza (Flu-iiQTM
Modules 2, 3, 4)
The impact of influenza (Flu-iiQTM
Modules 2, 3, 4) will be assessed 2 times a
day, from study entry (Baseline, Day 1) through Day 14, and once daily from
Days 15 through Day 28 (Safety Follow-up Visit).
NCT02532283

63623872FLZ2002 Statistical Analysis Plan
Page 31 of 53
Composite impact score
Per datetime and per module (modules 2, 3 and 4) of the FLU-iiQTM
questionnaire a composite impact score will be calculated as the mean of the
non-missing items in each module respectively on a 0-3 scale. Additionally a
“total composite impact score” will be calculated as the mean of all non-
missing items over all 3 impact score modules together (15 questions). For
each time point and composite impact score (module 2, 3,4 and total) a change
from baseline will be calculated.If more than 50% of the items to construct a
Composite Impact Score are missing, then the value for that composite score
for that individual and time point is coded as missing (i.e. 4 or more items
missing for module 2, 3 or more items missing for module 3, 3 or more items
missing for module 4 and 8 or more items missing for the total composite
impact score).
The composite impact scores will be shown descriptively and by mean (SE)
plots per analysis time point.
Daily average impact score
For the impact modules of the FLU-iiQTM
questionnaire a daily average of the
composite impact scores (for modules 2,3,4 and total) and a total average
score over the daily averages of the composite impact scores (for modules
2,3,4 and total) will be calculated similar to the daily average symptom scores
above.
The daily averages of the composite impact scores will be shown descriptively
and by mean (SE) plots. The total average composite impact scores will be
shown only descriptively.
Time to resumption of normal activities (usual activities, emotional impact and
impact on others) Per module of the FLU-iiQ
TM questionnaire on the impact of influenza a time
to resumption of normal activities is defined as the time in hours from the first
dose of investigational product till the first one of a successive series of 2
recordings where all scores in the FLU-iiQ Module are reported as “no
difficulty” (Module 2: usual activities), “not at all” (Module 3: emotional
impact) or “not at all concerned” (Module 4: impact on others). If the first
record of a successive series of 2 recordings of resumption of normal activities
is before day 14 in the evening then the 2 successive recording should have
been done over 3 scheduled successive analysis timepoints, 1 missing
timepoint is allowed. If the first record of a successive series of 2 recordings
of resumption of normal activities is at or after the evening record of Day 14
then the 2 successive recording should have been done within 2 scheduled
successive analysis time points.
Censoring will be done similar to the time to resolution of influenza, taking
into account the possible time points a diary entry could have been made after
the last observation of difficulties in usual activities, which is 20:00 on the
same day if the last observation was a morning diary entry and 8:00 the next
day if the last entry was an evening diary entry (Day 1 until Day 14, morning).
If the last observation of difficulties in usual activities is on Day 14 in the
evening or after Day 14 then the time of censoring is the time of the last diary
entry + 24 hours. One exception: if no resumption of usual activities is
NCT02532283

63623872FLZ2002 Statistical Analysis Plan
Page 32 of 53
observed at Day 28, the time of the last diary entry will be taken as the time of
censoring
Data will be presented using Kaplan-Meier curves and Kaplan-Meier
estimates by treatment group, overall and by age group. For a comparison
between treatment arms, the time to parameters will be analyzed using an
accelerated failure time model. The model will use the parametric shape,
selected based on the goodness of fit criterion (AIC), and may take a Weibull,
log-logistic, lognormal, or gamma distribution. As baseline covariates the
respective baseline composite impact scores and age category (>=18 - <65
years, >= 65 - <= 85 years) will be included. If the data don’t provide an
acceptable model fit, alternatively a Cox proportional hazards model can be
used (in case the hazards are proportional). In case a Cox proportional hazards
model is used a Log-log plot of survival will be added to check the
proportional hazard assumption. Additionally, the time to event data will be
analyzed using the logrank test and Gehan-Wilcoxon method.
4.2.5. FLU-iiQTM
Additional Daily Diary Items
For the 5 additional daily diary items of FLU-iiQTM
frequency distributions of the
number (%) of subjects per additional FLU-iiQTM
item and per response category
will be shown at baseline and all post-baseline assessments, per treatment group.
4.2.6. Influenza Patient Reported Outcome Diary (FLU-PRO)
FLU-PRO total score and FLU-PRO domain scores
The FLU-PRO total score is computed as a mean score across 32 items
contained by the instrument. Total scores can range from 0 (symptom free) to
4 (very severe symptoms).
Six FLU-PRO domain scores are computed, representing symptom severity in
each of the following body areas: Nose, Throat, Eyes, Chest/Respiratory,
Gastrointestinal and Body/Systemic. Each domain score is calculated as the
mean of all items comprising the domain, see also Table 8. Each FLU-PRO
domain score ranges from 0 to 4.
These scores will be calculated at each time point a questionnaire was filled.
A change from baseline will also be calculated.
The FLU-PRO scores and changes from baseline will be presented
descriptively over time.
Table 8: FLU-PRO domain scores
Domain Items Scoring and
Minimum Data Requirement
Nose Runny or dripping nose
Congested or stuffy nose
Sneezing
Sinus pressure
Arithmetic mean of 4 items
Daily score for 3 of 4 items must be
present to calculate domain score
Throat Scratchy or itchy throat
Sore or painful throat
Difficulty swallowing
Arithmetic mean of 3 items
Daily score for 2 of 3 items must be
present to calculate domain score
Eyes Teary or watery eyes
Sore or painful eyes
Eyes sensitive to light
Arithmetic mean of 3 items
Daily score for 2 of 3 items must be
present to calculate domain score
NCT02532283

63623872FLZ2002 Statistical Analysis Plan
Page 33 of 53
Chest/Respiratory
Trouble breathing
Chest congestion
Chest tightness
Dry or hacking cough
Wet or loose cough
Coughing
Coughed up mucus or phlegm
Arithmetic mean of 7 items
Daily score for 5 of 7 items must be
present to calculate domain score
Gastrointestinal Felt nauseous
Stomach ache
Vomit (frequency)
Diarrhea (frequency)
Arithmetic mean of 4 items
Daily score for 3 of 4 items must be
present to calculate domain score
Body/Systemic Headache
Head congestion
Felt dizzy
Lack of appetite
Sleeping more than usual
Body aches or pains
Weak or tired
Chills or shivering
Felt cold
Felt hot
Sweating
Arithmetic mean of 11 items
Daily score for 8 of 11 items must be
present to calculate domain score
Total All above 32 items Arithmetic mean of all 32 items within
FLU-PRO
In the presence of missing data, the above
conditions for the calculation of all domain
scores must be met in order to calculate the
FLU-PRO total score.
Note: The FLU-PRO questionnaire handled according to the protocol is FLU-PRO version 1.0.
The calculation of the Total score is done according to the FLU-PRO user manual version 1.1.
Hence following questions from the FLU-PRO v1.0 questionnaire will not be used in the analysis:
Swollen throat, Difficulty staying asleep, Difficulty falling asleep, Felt lightheaded, Felt
uncomfortable (general discomfort).
FLU-PRO total score AUC
The FLU-PRO total score AUC will be calculated using the FLU-PRO total
scores, from baseline to Day 8 and will be estimated for each treatment arm
using a mixed model for repeated measurements using a constrained
longitudinal data analysis model, similarly as for the composite symptom
score AUC in section 4.2.3.
Time to return to usual activity and time to return to usual health
The time to return to usual activity and the time to return to usual health are
defined as the time in hours from the first dose of investigational product till
the first one of 2 successive cases where the response is ‘Yes’ on respectively
FLU-PRO additional question 7 and FLU-PRO additional question 9. Missing
data within the series are allowed as long as within three successive planned
recordings there is at most 1 recording missing.
In cases where there are no sufficient recordings of return to usual
activity/health as defined above, the endpoint will be censored. Censoring will
be at the first time of return to usual activity/health, if and only if after this
observation there is no recording of difficulties in usual activities/health
(ignoring missing recordings). If there are no recordings of return to usual
NCT02532283

63623872FLZ2002 Statistical Analysis Plan
Page 34 of 53
activity/health satisfying this criterion, the time of censoring is the time of the
last diary entry + 24 hours. One exception is censoring at the Day 28 Visit
(last study day for the subject). If the subject is not returned to usual
activity/health on this day, the time of the last diary entry will be taken as the
time of censoring.
Data will be presented using Kaplan-Meier curves and Kaplan-Meier
estimates by treatment group, overall and by age group. For a comparison
between treatment arms, the time to parameters will be analyzed using an
accelerated failure time model. The model will use the parametric shape,
selected based on the goodness of fit criterion (AIC), and may take a Weibull,
log-logistic, lognormal, or gamma distribution. As baseline covariates the
ordinal scale at baseline category (ICU, ward+O2, ward-O2) and the age
category (>=18 - <65 years, >= 65 - <= 85 years) will be included. If the data
don’t provide an acceptable model fit, alternatively a Cox proportional hazards
model can be used (in case the hazards are proportional). In case a Cox
proportional hazards model is used a Log-log plot of survival will be added to
check the proportional hazard assumption. Additionally, the time to event data
will be analyzed using the logrank test and Gehan-Wilcoxon method.
Time to significant reduction in influenza symptom severity.
The time to significant reduction in influenza symptom severity (to mild or
none for all influenza symptoms) is defined as time in hours from the first
dose of investigational product until the first of 2 successive recordings in
which the total score for each of the 2 recordings are lower or equal to 1 and
all the domain scores are lower or equal to 1. The 2 successive recordings
should have been done within 3 scheduled successive analysis timepoints (one
missing in between is allowed).
Censoring will be done similar to the FLU-PRO time to return to usual activity
and time to return to usual health as specified above.
.
Data will be presented using Kaplan-Meier curves and Kaplan-Meier
estimates. For a comparison between treatment arms, the time to significant
reduction in influenza symptom severity will be analyzed using an accelerated
failure time model. The model will use the parametric shape, selected based
on the goodness of fit criterion (AIC), and may take a Weibull, log-logistic,
lognormal, or gamma distribution. As baseline covariate the age category
(>=18 - <65 years, >= 65 - <= 85 years) and baseline FLU-PRO total score
will be included. If the data don’t provide an acceptable model fit,
alternatively a Cox proportional hazards model can be used (in case the
hazards are proportional). In case a Cox proportional hazards model is used a
Log-log plot of survival will be added to check the proportional hazard
assumption. Additionally, the time to event data will be analyzed using the
logrank test and Gehan-Wilcoxon method.
Proportion of patients with a significant reduction in influenza symptom
severity.
The proportion of subjects with a significant reduction in symptom severity
(the total score for each of the 2 recordings are lower or equal to 1 and all the
domain scores are lower or equal to 1) at each assessment will be tabulated.
NCT02532283

63623872FLZ2002 Statistical Analysis Plan
Page 35 of 53
4.2.7. FLU-iiQTM
Additional Daily Diary Items
For the 9 additional daily diary items of FLU-PRO frequency distributions of
the number (%) of subjects per additional FLU-PRO item and per response
category will be shown at baseline and all post-baseline assessments, per
treatment group.
4.2.8. Correlation between viral load, viral titer and changes in clinical symptoms
Correlation between the decline in viral load, the decline in viral titer and
clinical symptoms
The time to influenza A viral negativity (see definition in section 4.2.2)
measured by viral load and viral titer will be correlated with the following
clinical measures (see definitions in sections 4.2.3 and 4.2.6):
1. Time to resolution of symptoms (7 primary symptoms)
2. Time to resolution of symptoms (All symptoms)
3. Time to return to usual activity,
4. Time to return to usual health and
5. Time to significant reduction in influenza symptom severity
Scatter plots with smoother curve will be shown per treatment group for the
above mentioned correlations. An additional table will be provided showing
the spearman correlation coefficients.
Correlation between the viral load, viral titer and severity of clinical
symptoms
The post-baseline log10 values of viral load and post-baseline log10 values of
viral titer from day 2 to day 7 will be correlated with the following severity of
clinical symptoms (see definitions in sections 4.2.3 and 4.2.6):
1. Flu-iiQ™ daily average symptom score post-baseline from day 2 to
day 7
2. FLU-PRO total score post-baseline from day 2 to day 7
Scatter plots with smoother curve will be shown per treatment group for the
above mentioned correlations. An additional table will be provided showing
the spearman correlation coefficients.
Correlation between baseline viral load, baseline viral titer and clinical
symptoms
The baseline viral load and baseline viral titer will be correlated with the
following clinical measures (see definitions in sections 4.2.3 and 4.2.6):
1. Time to resolution of symptoms (7 primary symptoms)
2. Time to resolution of symptoms (All symptoms)
3. Time to return to usual activity,
4. Time to return to usual health and
5. Time to significant reduction in influenza symptom severity
NCT02532283

63623872FLZ2002 Statistical Analysis Plan
Page 36 of 53
Scatter plots with smoother curve will be shown per treatment group for the
above mentioned correlations. An additional table will be provided showing
the spearman correlation coefficients.
4.2.9. Other Outcomes
Time to hospital discharge
The time to hospital discharge will be calculated from the date of first study drug
intake during hospitalization up to the date of discharge. Subjects still hospitalized
at the end of the study (end date of hospitalization missing or after trial
termination) will be censored at the trial termination date.
Data will be presented using Kaplan-Meier curves and Kaplan-Meier estimates.
For a comparison between treatment arms, the time to hospital discharge in days
will be analyzed using an accelerated failure time model. The model will use the
parametric shape, selected based on the goodness of fit criterion (AIC), and may
take a Weibull, log-logistic, lognormal, or gamma distribution. As baseline
covariate the age category (>=18 - <65 years, >= 65 - <= 85 years) will be
included. If the data don’t provide an acceptable model fit, alternatively a Cox
proportional hazards model can be used (in case the hazards are proportional). In
case a Cox proportional hazards model is used a Log-log plot of survival will be
added to check the proportional hazard assumption. Additionally, the time to
event data will be analyzed using the logrank test and the Gehan-Wilcoxon
method.
4.3. Safety
All safety analyses will be done on the Safety Set. Analyses will be presented
overall and by age category and by treatment group.
4.3.1. Adverse events
Pre-treatment AEs are defined as AEs that were reported or worsened after
signing the ICF up to the start of study drug dosing. Treatment-emergent AEs
(TEAE) are defined as AEs that were reported or worsened on or after the start of
study drug dosing through the 28-day Safety Follow-up Visit.
Adverse events with a start date and time recorded will be allocated based on their
start date and time. If there is no time recorded for the start of the adverse event
the adverse event that occurred on or after the day of first treatment intake and not
after the 28-day safety follow up visit will be considered as treatment-emergent.
Only adverse events that occur before the day of first medication intake and
after/on the day of signing ICF will be considered as pre-treatment.
In case the start date of an adverse event is partially or completely missing, a
worst case allocation will be done using the available date and time information in
the start and end date time of the adverse event (i.e. if possible based on the
available information the adverse event will be allocated to the treatment phase
and hospitalization sub period).
NCT02532283

63623872FLZ2002 Statistical Analysis Plan
Page 37 of 53
Adverse events
The variables related with adverse events are
AE term (verbatim and MedDRA preferred term and system organ class)
Onset date, End date and duration of AE
Serious AE (Yes/No)
Severity (Mild, Moderate, Severe, Life threatening)
Action taken towards study treatment (Dose increased, Dose not changed,
Dose reduced, Dose interrupted, Drug withdrawn)
Relation to study treatment (Not related, Doubtful, Possible, Probable,
Very likely)
Outcome of AE
AE leading to death (Yes/No)
Concomitant treatment taken (Yes/No)
Influenza-related complication (Yes/No)
Anticipated AE (Yes/No)
Required hospitalization/prolonged hospitalization (Yes/No)
The adverse events will be shown by MedDRA system organ class and preferred
term, in order of descending overall frequency.
Summaries of TEAEs will be presented overall and by the severity of the AE and
relationship to the study drug.
AEs leading to death, SAEs, AEs leading to dose interruption, and AEs leading to
permanent discontinuation will be listed separately. All AEs through the Safety
Follow-up Visit will be listed in an individual subject data listing, including pre-
treatment AEs. Spontaneous adverse events reported after the Safety Follow-up
Visit, including unresolved, ongoing adverse events will be listed as well.
Anticipated Events
An anticipated event is an AE (serious or non-serious) that commonly occurs as a
consequence of the underlying disease or condition under investigation (disease
related) or background regimen.
For the purposes of this study the following events will be considered anticipated
events (see Appendix 1 for the classification of AEs into Anticipated Events and
Anticipated Event Groups):
Bacterial pneumonia
Bronchitis
Sinus infections
Ear infections
Worsening of asthma, asthma attack
COPD exacerbation
Complications of sickle cell disease, sickle cell crisis
Complications of diabetes mellitus, diabetic ketoacidosis
Acute respiratory distress syndrome (ARDS)
Frequency tabulations of anticipated events and anticipated event groups will be
shown by treatment. The Incidence of Treatment Emergent anticipated events will
NCT02532283

63623872FLZ2002 Statistical Analysis Plan
Page 38 of 53
be compared between active treatment versus placebo by a one-sided Fisher exact
test (significance level < 0.10).
Influenza-related complications
Adverse Events reported as influenza-related complications will be tabulated
overall and by category and adverse event. A listing showing the AEs reported as
influenza-related complications and complication information will be made
linking the information to the AE listing.
The categories of influenza related complications as recorded on the eCRF are:
Bacterial Pneumonia
Bacterial Superinfections,
Respiratory Failure,
Pulmonary Disease
Cardiovascular and Cerebrovascular Disease.
Other
4.3.2. Clinical laboratory tests
Laboratory parameters of hematology, serum chemistry and urinalysis will be
investigated: All analyses will be done on SI-converted values as available in the
database.
In case a laboratory test result is censored (no numeric value is available, but only
a verbatim term), the following rules are applied:
● ‘<x’ or ‘>x’: a numeric value will be imputed by a value exceeding
the cut-off value with one unit
● ‘≤x’ or ‘≤x’: imputation by x.
The laboratory abnormalities will be determined according to the criteria specified
in the WHO grading table (see Appendix 2), available toxicity grades in the
laboratory raw data will not be used. In case no toxicity grades are defined for a
test, the abnormalities (above/below normal range) will be used. In determining
toxicity grades/abnormalities the following rules are applied:
• Worst grades/abnormalities are determined over the whole observational
period for each trial phase separately, including all post-reference
scheduled and unscheduled measurements of that phase.
• The abnormalities “abnormally low” and “abnormally high” are
considered equally important, i.e. if a subject has as well an abnormally
low as an abnormally high value post-reference, both abnormalities are
shown in the tables. (This means that the sum of the percentages can be
more than 100%)
• If, for a specific test, the grading list provides distinct limits for
abnormally low (=hypo) values as well as for abnormally high (=hyper)
values, this test should be repeated for hyper and hypo limits separately in
cross-tabulations.
Actual values and change from baseline will be summarized by treatment group at
each scheduled time point.
NCT02532283
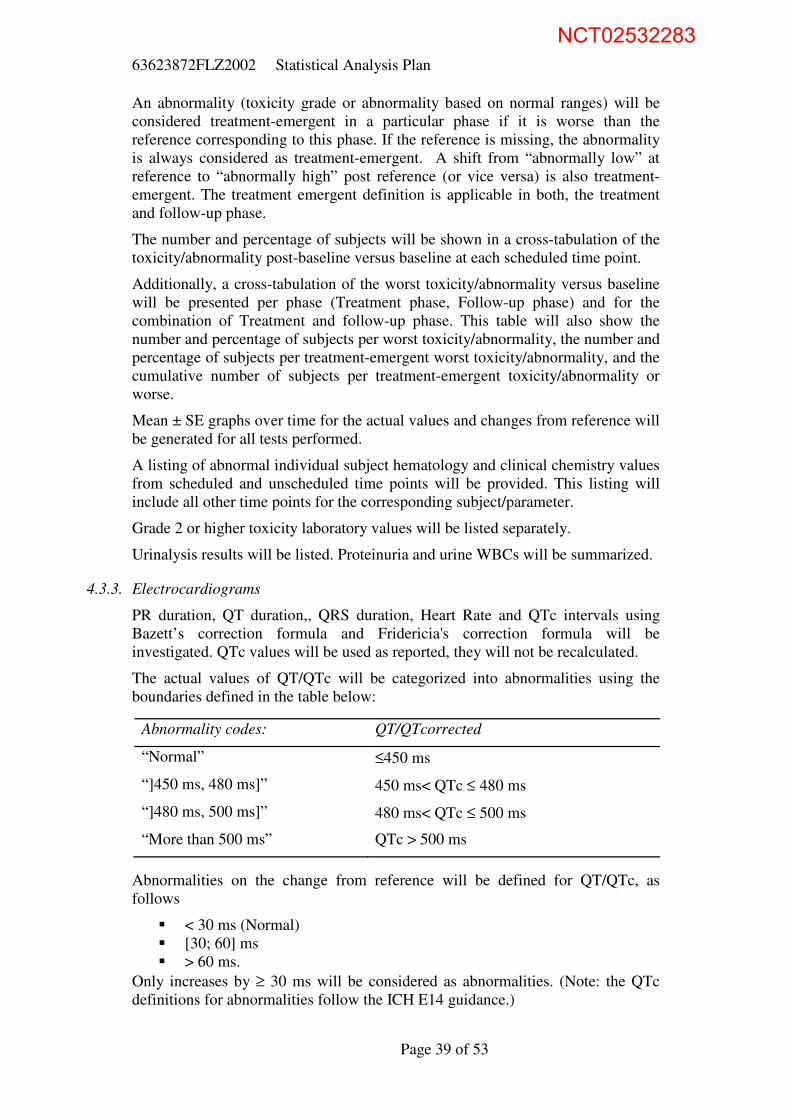
63623872FLZ2002 Statistical Analysis Plan
Page 39 of 53
An abnormality (toxicity grade or abnormality based on normal ranges) will be
considered treatment-emergent in a particular phase if it is worse than the
reference corresponding to this phase. If the reference is missing, the abnormality
is always considered as treatment-emergent. A shift from “abnormally low” at
reference to “abnormally high” post reference (or vice versa) is also treatment-
emergent. The treatment emergent definition is applicable in both, the treatment
and follow-up phase.
The number and percentage of subjects will be shown in a cross-tabulation of the
toxicity/abnormality post-baseline versus baseline at each scheduled time point.
Additionally, a cross-tabulation of the worst toxicity/abnormality versus baseline
will be presented per phase (Treatment phase, Follow-up phase) and for the
combination of Treatment and follow-up phase. This table will also show the
number and percentage of subjects per worst toxicity/abnormality, the number and
percentage of subjects per treatment-emergent worst toxicity/abnormality, and the
cumulative number of subjects per treatment-emergent toxicity/abnormality or
worse.
Mean ± SE graphs over time for the actual values and changes from reference will
be generated for all tests performed.
A listing of abnormal individual subject hematology and clinical chemistry values
from scheduled and unscheduled time points will be provided. This listing will
include all other time points for the corresponding subject/parameter.
Grade 2 or higher toxicity laboratory values will be listed separately.
Urinalysis results will be listed. Proteinuria and urine WBCs will be summarized.
4.3.3. Electrocardiograms
PR duration, QT duration,, QRS duration, Heart Rate and QTc intervals using
Bazett’s correction formula and Fridericia's correction formula will be
investigated. QTc values will be used as reported, they will not be recalculated.
The actual values of QT/QTc will be categorized into abnormalities using the
boundaries defined in the table below:
Abnormalities on the change from reference will be defined for QT/QTc, as
follows
< 30 ms (Normal)
[30; 60] ms
> 60 ms.
Only increases by ≥ 30 ms will be considered as abnormalities. (Note: the QTc
definitions for abnormalities follow the ICH E14 guidance.)
Abnormality codes: QT/QTcorrected
“Normal” ≤450 ms
“]450 ms, 480 ms]” 450 ms< QTc ≤ 480 ms
“]480 ms, 500 ms]” 480 ms< QTc ≤ 500 ms
“More than 500 ms” QTc > 500 ms
NCT02532283

63623872FLZ2002 Statistical Analysis Plan
Page 40 of 53
Worst abnormalities are determined over the whole observational period for each
trial phase separately, including all post-reference scheduled and unscheduled
measurements of that phase.
An abnormality will be considered treatment-emergent in a particular phase if it is
worse than the reference corresponding to this phase. If the reference is missing,
the abnormality is always considered as treatment-emergent. Abnormalities on
changes from reference are always defined as treatment-emergent.
Actual values and change from baseline will be summarized by treatment group at
each scheduled time point.
The number and percentage of subjects will be shown in a cross-tabulation of the
toxicity/abnormality post-baseline versus baseline at each scheduled time point.
Additionally, a cross-tabulation of the worst toxicity/abnormality versus baseline
will be presented per phase (Treatment phase, Follow-up phase) and for the
combination of Treatment and follow-up phase. This table will also show the
number and percentage of subjects per worst toxicity/abnormality, the number and
percentage of subjects per treatment-emergent worst toxicity/abnormality, and the
cumulative number of subjects per treatment-emergent toxicity/abnormality or
worse.
Mean ± SE graphs over time for the actual values and changes from reference will
be generated for all tests performed.
A tabulation of the worst QT/QTc change versus baseline per treatment per phase
will be presented.
Abnormal individual subject ECG values or abnormalities on the changes will be
listed.
4.3.4. Vital Signs
Systolic and Diastolic blood pressure, oral temperature, pulse rate, respiratory
rate, arterial oxygen saturation and level of consciousness will be investigated.
Vital Signs abnormalities will be determined according to the WHO grading scale
and the boundaries defined in Appendix 3.
Worst toxicities are determined over the whole observational period for each trial
phase separately, including all post-reference scheduled and unscheduled
measurements of that phase.
Actual values and change from baseline will be summarized by treatment group at
each scheduled time point. A toxicity will be considered treatment-emergent in a
particular phase if it is worse than the reference corresponding to this phase. If the
reference is missing, the abnormality is always considered as treatment-emergent.
The number and percentage of subjects will be shown in a cross-tabulation of the
toxicity/abnormality post-baseline versus baseline at each scheduled time point.
Additionally, a cross-tabulation of the worst toxicity/abnormality versus baseline
will be presented per phase (Treatment phase, Follow-up phase) and for the
combination of Treatment and follow-up phase. This table will also show the
number and percentage of subjects per worst toxicity/abnormality, the number and
percentage of subjects per treatment-emergent worst toxicity/abnormality, and the
NCT02532283

63623872FLZ2002 Statistical Analysis Plan
Page 41 of 53
cumulative number of subjects per treatment-emergent toxicity/abnormality or
worse.
Mean ± SE graphs over time for the actual values and changes from reference will
be generated for all tests performed.
A listing of abnormal individual subject VS values will be provided.
4.3.5. NEW Score
The NEW Score is an aggregated score with a range from 0 to 20 calculated as the
sum of the scores per parameter (see Table 9). In case information for a parameter
is missing the NEW score cannot be calculated. Descriptive statistics of the NEW
score and the change from baseline will be shown by analysis time point.
Additionally a mean +/- SE graph of the scores over time will be provided.
The NEW score will be categorized into its clinical risk according to the
following categories:
Low clinical risk: (score 1 – 4)
Medium clinical risk: (score 5 – 6, or 1 individual parameter with a score 3)
High clinical risk: (score 7 and more)
A tabulation of the clinical risk categories will be made per analysis time point.
Table 9: National Early Warning Score (NEWS)*
Physiological
Parameters 3 2 1 0 1 2 3
Respiration
Rate ≤8 9 - 11 12 - 20 21 - 24 ≥25
Oxygen
Saturations ≤91 92 - 93 94 - 95 ≥96
Any
Supplemental
Oxygen
Yes No
Temperature ≤35.0 35.1 - 36.0 36.1 - 38.0 38.1 - 39.0 ≥39.1
Systolic BP ≤90 91 - 100 101 - 110 111 - 219 ≥220
Heart Rate ≤40 41 - 50 51 - 90 91 - 110 111 - 130 ≥131
Level Of
Consciousness A V,P, or U
*The NEWS initiative flowed from the Royal College of Physicians’ NEWS Development and
Implementation Group (NEWSDIG) report, and was jointly developed and funded in collaboration
with the Royal College of Physicians, Royal College of Nursing, National Outreach Forum and
NHS Training for Innovation
4.3.6. Physical Examinations:
Abnormal physical examination results will be listed only.
NCT02532283

63623872FLZ2002 Statistical Analysis Plan
Page 42 of 53
4.4. Virology
4.4.1. Viral Phenotype
The JNJ-63623872 EC50 and Oseltamivir IC50 with their fold change values will
be analyzed at baseline and at the subject’s last study visit (FC = fold change in
EC50 (IC50) value).
● The last study visit is defined as the last time point for which an
EC50 and/or IC50 result is available.
● FC is calculated as the EC50 (or IC50) divided by the reference. If
the patient EC50 (or IC50) is censored, the fold change value get the
same censor, e.g. patient EC50 = >20 nM, reference EC50 = 4nM,
Fold Change value >5.
The following output will be provided overall and by influenza subtype category:
■ Emerging phenotypic resistance: descriptive statistics for FC in EC50 and IC50
value for JNJ-63623872 and oseltamivir respectively at baseline and the last
study visit. The number (%) of subjects by treatment arm with censored
phenotype data at baseline and the last study visit will also be shown.
■ Descriptive statistics for fold change ratio of last study visit versus baseline
including geometric mean and 95% CI.
■ A listing showing viral load data together with phenotype data (EC50, IC50 and
fold change values) per subject and influenza subtype for all available time
points including screening/baseline.
4.4.2. Viral Genotype
Assessment of viral sequences will be done to determine amino-acid sequence
changes that may be associated with resistance to JNJ-63623872 and/or
oseltamivir. To that end, genotypic data for PB2, NA and optionally other genome
segments of the influenza virus will be gathered.
All positions in the gathered regions will be analyzed.
The following 12 amino-acid positions in PB2 are of interest: Q306, F323, S324,
F325, S337, H357, F363, K376, F404, Q406, M431, and N510.
The following resistance associated mutations in NA are of interest:
● For subtype H1N1: D199N, I223R, H275Y, and N295S
● For subtype H3N2: E119V, H274Y, R292K, and N294S
The list of positions of interest might be updated during the analysis.
A mutation is treatment-emerging at a specific (post-baseline) time-point if the
amino-acid of the considered position is absent at screening/baseline and present
at that time point.
The baseline is the collection of all polymorphisms present at any time point up to
the first intake of study.
Data will be summarized using frequency tabulations (n and %). Displays and
individual mutations should be presented overall and by influenza subtype
category and for PB2 and NA separately. The following output will be provided:
NCT02532283

63623872FLZ2002 Statistical Analysis Plan
Page 43 of 53
■ Baseline polymorphisms: number (%) of subjects with available genotype
data, with any baseline polymorphism, and the number of subjects per
polymorphism, for all polymorphisms, per treatment arm.
■ Baseline polymorphisms: number (%) of subjects with any baseline
polymorphism and with specific baseline polymorphisms at the positions of
interest.
■ Frequency tabulations for the presence of all emerging mutations overall post
baseline.
■ Frequency tabulations for the presence of all emerging mutations overall post
baseline at positions of interest.
■ Listing for genotype data per subject for all available time points including
screening/baseline including viral load data (include influenza subtype and
influenza subtype category).
4.5. Health Care
The number of subjects admitted to the Intensive Care Unit (ICU) after baseline
will be tabulated.
The length of ICU stay for subjects transferred to the ICU after baseline is
calculated as:
End date in ICU – Start date in ICU +1.
If a subject has multiple periods in the ICU the durations for these separate stays
in the ICU will be summed.
Descriptive statistics of the duration in the ICU will be shown for all subjects that
were admitted to the ICU after baseline.
NCT02532283

63623872FLZ2002 Statistical Analysis Plan
Page 44 of 53
References
Bacci E.D., Kim K., Stringer S., Leidy N.K. (18 Dec 2015 v1.1) User Manual for the
InFLUenza Patient-Reported Outcome (FLU-PRO) Diary, Leidos Biomedical Research
in support of the National Institute of Health, National Institute of Allergy and Infectious
diseases, Division of Clinical Research
Royal College of Physicians of London. (2012) National early warning score (NEWS):
standardising the assessment of acute-illness severity in the NHS..
www.rcplondon.ac.uk/resources/national-earlywarning-score-news
Guideline, I. H. T. (2006). The clinical evaluation of QT/QTc interval prolongation and
proarrhythmic potential for non-antiarrhythmic drugs E14. Recommended for adoption at
Step, 4
White, I. R., Royston, P., & Wood, A. M. (2011). Multiple imputation using chained
equations: issues and guidance for practice. Statistics in medicine, 30(4), 377-399.
World Health Organization. (2003) "WHO toxicity grading scale for determining the
severity of adverse events."
NCT02532283
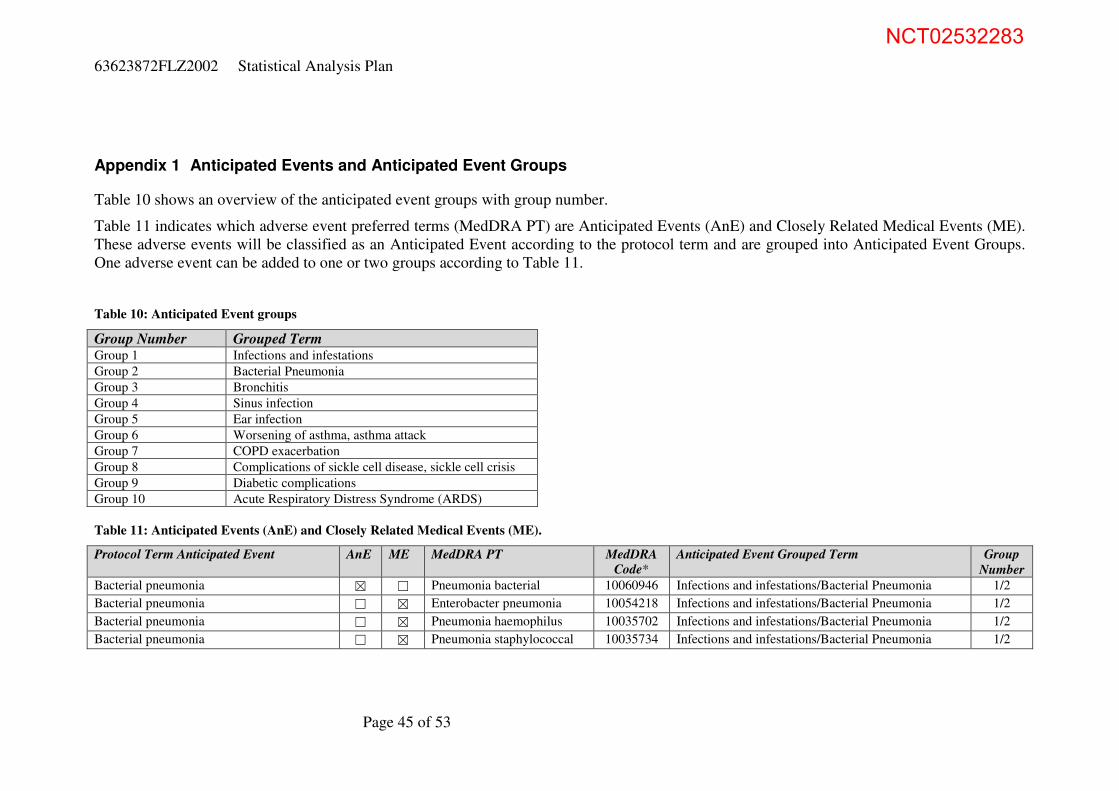
63623872FLZ2002 Statistical Analysis Plan
Page 45 of 53
Appendix 1 Anticipated Events and Anticipated Event Groups
Table 10 shows an overview of the anticipated event groups with group number.
Table 11 indicates which adverse event preferred terms (MedDRA PT) are Anticipated Events (AnE) and Closely Related Medical Events (ME).
These adverse events will be classified as an Anticipated Event according to the protocol term and are grouped into Anticipated Event Groups.
One adverse event can be added to one or two groups according to Table 11.
Table 10: Anticipated Event groups
Group Number Grouped Term Group 1 Infections and infestations
Group 2 Bacterial Pneumonia
Group 3 Bronchitis
Group 4 Sinus infection
Group 5 Ear infection
Group 6 Worsening of asthma, asthma attack
Group 7 COPD exacerbation
Group 8 Complications of sickle cell disease, sickle cell crisis
Group 9 Diabetic complications
Group 10 Acute Respiratory Distress Syndrome (ARDS)
Table 11: Anticipated Events (AnE) and Closely Related Medical Events (ME).
Protocol Term Anticipated Event AnE ME MedDRA PT MedDRA
Code*
Anticipated Event Grouped Term Group
Number
Bacterial pneumonia ☒ ☐ Pneumonia bacterial 10060946 Infections and infestations/Bacterial Pneumonia 1/2
Bacterial pneumonia ☐ ☒ Enterobacter pneumonia 10054218 Infections and infestations/Bacterial Pneumonia 1/2
Bacterial pneumonia ☐ ☒ Pneumonia haemophilus 10035702 Infections and infestations/Bacterial Pneumonia 1/2
Bacterial pneumonia ☐ ☒ Pneumonia staphylococcal 10035734 Infections and infestations/Bacterial Pneumonia 1/2
NCT02532283
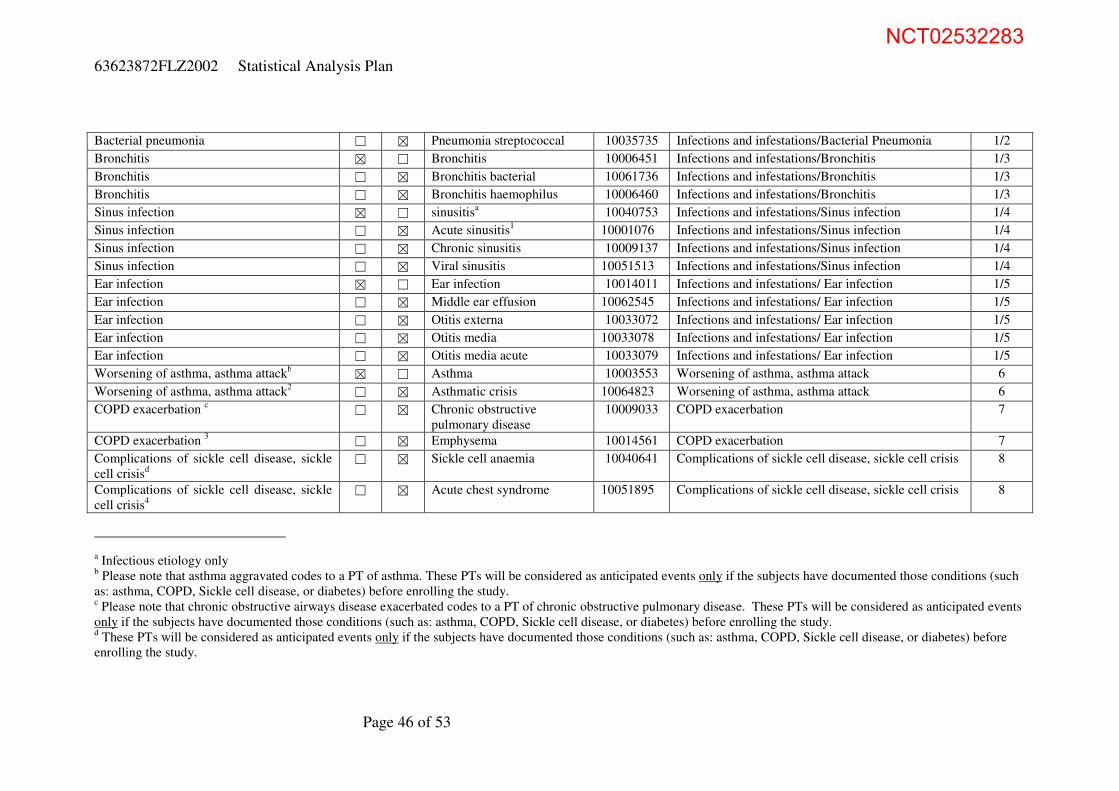
63623872FLZ2002 Statistical Analysis Plan
Page 46 of 53
Bacterial pneumonia ☐ ☒ Pneumonia streptococcal 10035735 Infections and infestations/Bacterial Pneumonia 1/2
Bronchitis ☒ ☐ Bronchitis 10006451 Infections and infestations/Bronchitis 1/3
Bronchitis ☐ ☒ Bronchitis bacterial 10061736 Infections and infestations/Bronchitis 1/3
Bronchitis ☐ ☒ Bronchitis haemophilus 10006460 Infections and infestations/Bronchitis 1/3
Sinus infection ☒ ☐ sinusitisa 10040753 Infections and infestations/Sinus infection 1/4
Sinus infection ☐ ☒ Acute sinusitis1 10001076 Infections and infestations/Sinus infection 1/4
Sinus infection ☐ ☒ Chronic sinusitis 10009137 Infections and infestations/Sinus infection 1/4
Sinus infection ☐ ☒ Viral sinusitis 10051513 Infections and infestations/Sinus infection 1/4
Ear infection ☒ ☐ Ear infection 10014011 Infections and infestations/ Ear infection 1/5
Ear infection ☐ ☒ Middle ear effusion 10062545 Infections and infestations/ Ear infection 1/5
Ear infection ☐ ☒ Otitis externa 10033072 Infections and infestations/ Ear infection 1/5
Ear infection ☐ ☒ Otitis media 10033078 Infections and infestations/ Ear infection 1/5
Ear infection ☐ ☒ Otitis media acute 10033079 Infections and infestations/ Ear infection 1/5
Worsening of asthma, asthma attackb ☒ ☐ Asthma 10003553 Worsening of asthma, asthma attack 6
Worsening of asthma, asthma attack2 ☐ ☒ Asthmatic crisis 10064823 Worsening of asthma, asthma attack 6
COPD exacerbation c ☐ ☒ Chronic obstructive
pulmonary disease
10009033 COPD exacerbation 7
COPD exacerbation 3 ☐ ☒ Emphysema 10014561 COPD exacerbation 7
Complications of sickle cell disease, sickle
cell crisisd
☐ ☒ Sickle cell anaemia 10040641 Complications of sickle cell disease, sickle cell crisis 8
Complications of sickle cell disease, sickle
cell crisis4
☐ ☒ Acute chest syndrome 10051895 Complications of sickle cell disease, sickle cell crisis 8
a Infectious etiology only
b Please note that asthma aggravated codes to a PT of asthma. These PTs will be considered as anticipated events only if the subjects have documented those conditions (such
as: asthma, COPD, Sickle cell disease, or diabetes) before enrolling the study. c Please note that chronic obstructive airways disease exacerbated codes to a PT of chronic obstructive pulmonary disease. These PTs will be considered as anticipated events
only if the subjects have documented those conditions (such as: asthma, COPD, Sickle cell disease, or diabetes) before enrolling the study. d These PTs will be considered as anticipated events only if the subjects have documented those conditions (such as: asthma, COPD, Sickle cell disease, or diabetes) before
enrolling the study.
NCT02532283

63623872FLZ2002 Statistical Analysis Plan
Page 47 of 53
Complications of sickle cell disease, sickle
cell crisis4
☐ ☒ Pain 10033371 Complications of sickle cell disease, sickle cell crisis 8
Complications of sickle cell disease, sickle
cell crisis4
☐ ☒ Ischaemic stroke 10061256 Complications of sickle cell disease, sickle cell crisis 8
Complications of sickle cell disease, sickle
cell crisis4
☐ ☒ Embolic stroke 10014498 Complications of sickle cell disease, sickle cell crisis 8
Complications of sickle cell disease, sickle
cell crisis4
☐ ☒ Deep vein thrombosis 10051055 Complications of sickle cell disease, sickle cell crisis 8
Complications of sickle cell disease, sickle
cell crisis4
☐ ☒ Pulmonary embolism 10037377 Complications of sickle cell disease, sickle cell crisis 8
Complications of diabetes mellitus, diabetic
ketoacidosise
☒ ☐ Diabetic complications 10061104 Diabetic complications 9
Complications of diabetes mellitus, diabetic
ketoacidosis5
☐ ☒ Diabetic ketoacidosis 10012671 Diabetic complications 9
Complications of diabetes mellitus, diabetic
ketoacidosis5
☐ ☒ Diabetes mellitusf 10012601 Diabetic complications 9
Complications of diabetes mellitus, diabetic
ketoacidosis5
☐ ☒ Diabetic ketoacidotic
hyperglycaemic coma
10012672 Diabetic complications 9
Complications of diabetes mellitus, diabetic
ketoacidosis5
☐ ☒ Hypoglycaemia 10020993 Diabetic complications 9
Acute Respiratory Distress Syndrome
(ARDS) ☒ ☐ Acute respiratory distress
syndrome
10001052 Acute Respiartory Distress Syndrome (ARDS) 10
Acute Respiratory Distress Syndrome
(ARDS) ☐ ☒ Acute respiratory failure
g 10001053 Acute Respiartory Distress Syndrome (ARDS) 10
e These PTs will be considered as anticipated events only if the subjects have documented those conditions (such as: asthma, COPD, Sickle cell disease, or diabetes) before
enrolling the study. f Please note that diabetes mellitus aggravated and diabetes mellitus exacerbated codes to a PT of diabetes mellitus
g This event will be considered anticipated only if it occurs in the context of ARDS
NCT02532283

63623872FLZ2002 Statistical Analysis Plan
Page 48 of 53
Appendix 2 WHO Toxicity Grading Scale for Determining the Severity of Adverse Events (Feb 2003)
ABBREVIATIONS (used in the table):
ULN = Upper Limit of Normal
Rx = Therapy
FEV1 = forced expiratory volume in 1 second
LLN = Lower Limit of Normal
IV = Intravenous
ESTIMATING SEVERITY GRADE
For abnormalities NOT found elsewhere in the Toxicity Tables use the scale below to estimate
grade of severity:
GRADE 1 Mild Transient or mild discomfort (<48 hours); no medical
intervention/therapy required.
GRADE 2 Moderate Mild to moderate limitation in activity; some assistance may
be needed; no or minimal medical intervention/ therapy
required.
GRADE 3 Severe Marked limitation in activity; some assistance usually
required; medical intervention/therapy required;
hospitalizations possible.
GRADE 4 Potentially life-
threateninga
Extreme limitation in activity; significant assistance
required; significant medical intervention/therapy required;
hospitalization or hospice care probable.
a Revised by the sponsor
COMMENTS REGARDING THE USE OF THESE TABLES
• For parameters not included in the following Toxicity Tables, sites should refer to the “Guide
For Estimating Severity Grade” located above.
• Criteria are generally grouped by body system. Some protocols may have additional protocol-
specific grading criteria, which will supersede the use of these tables for specified criteria.
NCT02532283
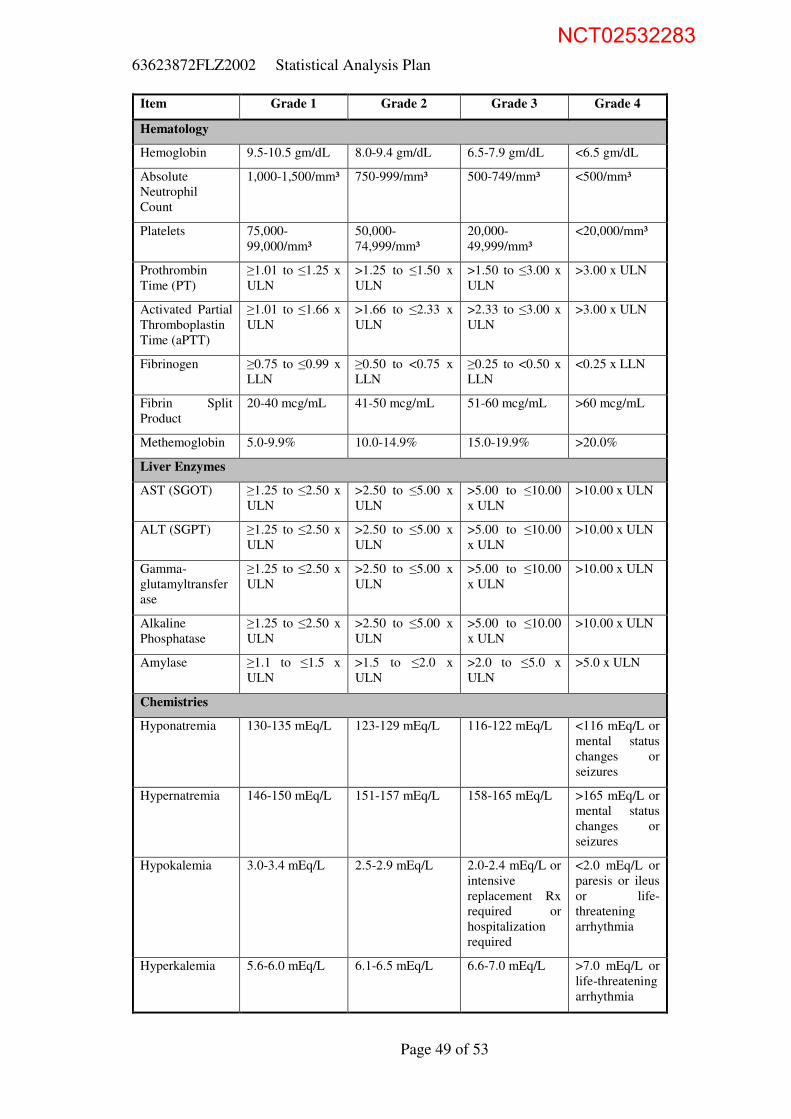
63623872FLZ2002 Statistical Analysis Plan
Page 49 of 53
Item Grade 1 Grade 2 Grade 3 Grade 4
Hematology
Hemoglobin 9.5-10.5 gm/dL 8.0-9.4 gm/dL 6.5-7.9 gm/dL <6.5 gm/dL
Absolute
Neutrophil
Count
1,000-1,500/mm³ 750-999/mm³ 500-749/mm³ <500/mm³
Platelets 75,000-
99,000/mm³
50,000-
74,999/mm³
20,000-
49,999/mm³
<20,000/mm³
Prothrombin
Time (PT)
≥1.01 to ≤1.25 x
ULN
>1.25 to ≤1.50 x
ULN
>1.50 to ≤3.00 x
ULN
>3.00 x ULN
Activated Partial
Thromboplastin
Time (aPTT)
≥1.01 to ≤1.66 x
ULN
>1.66 to ≤2.33 x
ULN
>2.33 to ≤3.00 x
ULN
>3.00 x ULN
Fibrinogen ≥0.75 to ≤0.99 x
LLN
≥0.50 to <0.75 x
LLN
≥0.25 to <0.50 x
LLN
<0.25 x LLN
Fibrin Split
Product
20-40 mcg/mL 41-50 mcg/mL 51-60 mcg/mL >60 mcg/mL
Methemoglobin 5.0-9.9% 10.0-14.9% 15.0-19.9% >20.0%
Liver Enzymes
AST (SGOT) ≥1.25 to ≤2.50 x
ULN
>2.50 to ≤5.00 x
ULN
>5.00 to ≤10.00
x ULN
>10.00 x ULN
ALT (SGPT) ≥1.25 to ≤2.50 x
ULN
>2.50 to ≤5.00 x
ULN
>5.00 to ≤10.00
x ULN
>10.00 x ULN
Gamma-
glutamyltransfer
ase
≥1.25 to ≤2.50 x
ULN
>2.50 to ≤5.00 x
ULN
>5.00 to ≤10.00
x ULN
>10.00 x ULN
Alkaline
Phosphatase
≥1.25 to ≤2.50 x
ULN
>2.50 to ≤5.00 x
ULN
>5.00 to ≤10.00
x ULN
>10.00 x ULN
Amylase ≥1.1 to ≤1.5 x
ULN
>1.5 to ≤2.0 x
ULN
>2.0 to ≤5.0 x
ULN
>5.0 x ULN
Chemistries
Hyponatremia 130-135 mEq/L 123-129 mEq/L 116-122 mEq/L <116 mEq/L or
mental status
changes or
seizures
Hypernatremia 146-150 mEq/L 151-157 mEq/L 158-165 mEq/L >165 mEq/L or
mental status
changes or
seizures
Hypokalemia 3.0-3.4 mEq/L 2.5-2.9 mEq/L 2.0-2.4 mEq/L or
intensive
replacement Rx
required or
hospitalization
required
<2.0 mEq/L or
paresis or ileus
or life-
threatening
arrhythmia
Hyperkalemia 5.6-6.0 mEq/L 6.1-6.5 mEq/L 6.6-7.0 mEq/L >7.0 mEq/L or
life-threatening
arrhythmia
NCT02532283

63623872FLZ2002 Statistical Analysis Plan
Page 50 of 53
Item Grade 1 Grade 2 Grade 3 Grade 4
Hypoglycemia 55-64 mg/dL 40-54 mg/dL 30-39 mg/dL <30 mg/dL or
mental status
changes or
coma
Hyperglycemia
(note if fasting)
116-160 mg/dL 161-250 mg/dL 251-500 mg/dL >500 mg/dL or
ketoacidosis or
seizures
Hypocalcemia
(corrected for
albumin)
8.4-7.8 mg/dL 7.7-7.0 mg/dL 6.9-6.1 mg/dL <6.1 mg/dL or
life-threatening
arrhythmia or
tetany
Hypercalcemia
(corrected for
albumin)
10.6-11.5 mg/dL 11.6-12.5 mg/dL 12.6-13.5 mg/dL >13.5 mg/dL or
life-threatening
arrhythmia
Hypomagnesemi
a
1.4-1.2 mEq/L 1.1-0.9 mEq/L 0.8-0.6 mEq/L <0.6 mEq/L or
life-threatening
arrhythmia
Hypophosphate
mia
2.0-2.4 mg/dL 1.5-1.9 mg/dL or
replacement Rx
required
1.0-1.4 mg/dL
intensive Rx or
hospitalization
required
<1.0 mg/dL or
life-threatening
arrhythmia
Hyperbilirubine
mia
≥1.1 to ≤1.5 x
ULN
>1.5 to ≤2.5 x
ULN
>2.5 to ≤5.0 x
ULN
>5.0 x ULN
BUN ≥1.25 to ≤2.50 x
ULN
>2.50 to ≤5.00 x
ULN
>5.00 to ≤10.00
x ULN
>10.00 x ULN
Creatinine ≥1.1 to ≤1.5 x
ULN
>1.5 to ≤3.0 x
ULN
>3.0 to ≤6.0 x
ULN
>6.0 x ULN or
required
dialysis
Urinalysis
Proteinuria 1+ or <0.3% or
<3g/L or
200 mg – 1 gm
loss/day
2-3+ or 0.3-1.0%
or 3-10 g/L or
1-2 gm loss/day
4+ or >1.0% or
>10 g/L or
2-3.5 gm
loss/day
nephrotic
syndrome or
>3.5 gm
loss/day
Hematuria microscopic only gross, no clots gross + clots obstructive or
required
transfusion
Cardiac Dysfunction
Cardiac Rhythm - asymptomatic,
transient signs,
no Rx required
recurrent/persiste
nt; no Rx
required
requires Rx
Hypertension transient inc.
>20 mm; no Rx
recurrent,
chronic, > 20
mm, Rx required
requires acute
Rx; no
hospitalization
requires
hospitalization
Hypotension transient
orthostatic
hypotension, no
Rx
symptoms
correctable with
oral fluids Rx
requires IV
fluids; no
hospitalization
required
requires
hospitalization
NCT02532283

63623872FLZ2002 Statistical Analysis Plan
Page 51 of 53
Item Grade 1 Grade 2 Grade 3 Grade 4
Pericarditis minimal effusion mild/moderate
asymptomatic
effusion, no Rx
symptomatic
effusion; pain;
ECG changes
tamponade;
pericardiocente
sis or surgery
required
Hemorrhage,
Blood Loss
microscopic/occul
t
mild, no
transfusion
gross blood loss;
1-2 units
transfused
massive blood
loss; >3 units
transfused
Respiratory
Cough transient; no Rx treatment
associated
cough; local Rx
uncontrolled -
Bronchospasm,
Acute
transient; no Rx
<80-70% FEV1
(or peak flow)
requires Rx
normalizes with
bronchodilator;
FEV1 50-70%
(or peak flow)
no normalization
with
bronchodilator;
FEV1 25-50%
(or peak flow
retractions)
cyanosis: FEV1
<25% (or peak
flow) or
intubated
Gastrointestinal
Stomatitis mild discomfort;
no limits on
activity
some limits on
eating/drinking
eating/talking
very limited
requires IV
fluids
Nausea mild discomfort;
maintains
reasonable intake
moderate
discomfort; intake
decreased
significantly;
some activity
limited
severe
discomfort; no
significant
intake; activities
limited
minimal fluid
intake
Vomiting transient emesis occasional/moder
ate vomiting
orthostatic
hypotension or
IV fluids
required
hypotensive
shock or
hospitalization
required for IV
fluid therapy
Constipation mild moderate severe distensions
w/vomiting
Diarrhea transient 3-4
loose stools/day
5-7 loose
stools/day
orthostatic
hypotension or
>7 loose
stools/day or
required IV
fluids
hypotensive
shock or
hospitalization
for IV fluid
therapy
required
Neuro & Neuromuscular
Neuro-
Cerebellar
slight
incoordination
dysdiadochokine
sis
intention tremor,
dysmetria, slurred
speech;
nystagmus
locomotor ataxia incapacitated
Mood mild anxiety or
depression
moderate anxiety
or depression and
Rx required
severe anxiety or
depression or
mania; needs
assistance
acute
psychosis;
incapacitated,
requires
hospitalization
NCT02532283

63623872FLZ2002 Statistical Analysis Plan
Page 52 of 53
Item Grade 1 Grade 2 Grade 3 Grade 4
Neuro Control
(ADL =
activities of daily
living)
mild difficulty
concentrating; no
Rx; mild
confusion/agitati
on; ADL
unaffected
moderate
confusion/agitatio
n some limitation
of ADL; minimal
Rx
severe
confusion/agitati
on needs
assistance for
ADL; Rx
required
toxic
psychosis;
hospitalization
Muscle Strength subjective
weakness no
objective
symptoms/ signs
mild objective
signs/symptoms
no decrease in
function
objective
weakness
function limited
paralysis
Other Parameters
Fever: oral,
>12 hours
37.7-38.5 °C or
100.0-101.5 °F
38.6-39.5 °C or
101.6-102.9 °F
39.6-40.5 °C or
103-105 °F
>40.5 °C or
>105 °F
Headache mild, no Rx transient,
moderate; Rx
required
severe; responds
to initial narcotic
therapy
intractable;
required
repeated
narcotic
therapy
Fatigue no decrease in
ADL
normal activity
decreased 25-50%
normal activity
decreased >50%
can’t work
unable to care
for self
Allergic
Reaction
pruritus without
rash
localized urticaria generalized
urticaria;
angioedema
anaphylaxis
Local Reaction tenderness or
erythema
induration <10
cm or phlebitis or
inflammation
induration >10
cm or ulceration
necrosis
Mucocutaneous
Erythema;
pruritus
diffuse,
maculopapular
rash, dry
desquamation
vesiculation,
moist
desquamation, or
ulceration
exfoliative
dermatitis,
mucous
membrane
involvement, or
erythema
multiforme or
suspected
Stevens-
Johnson or
necrosis
requiring
surgery
NCT02532283
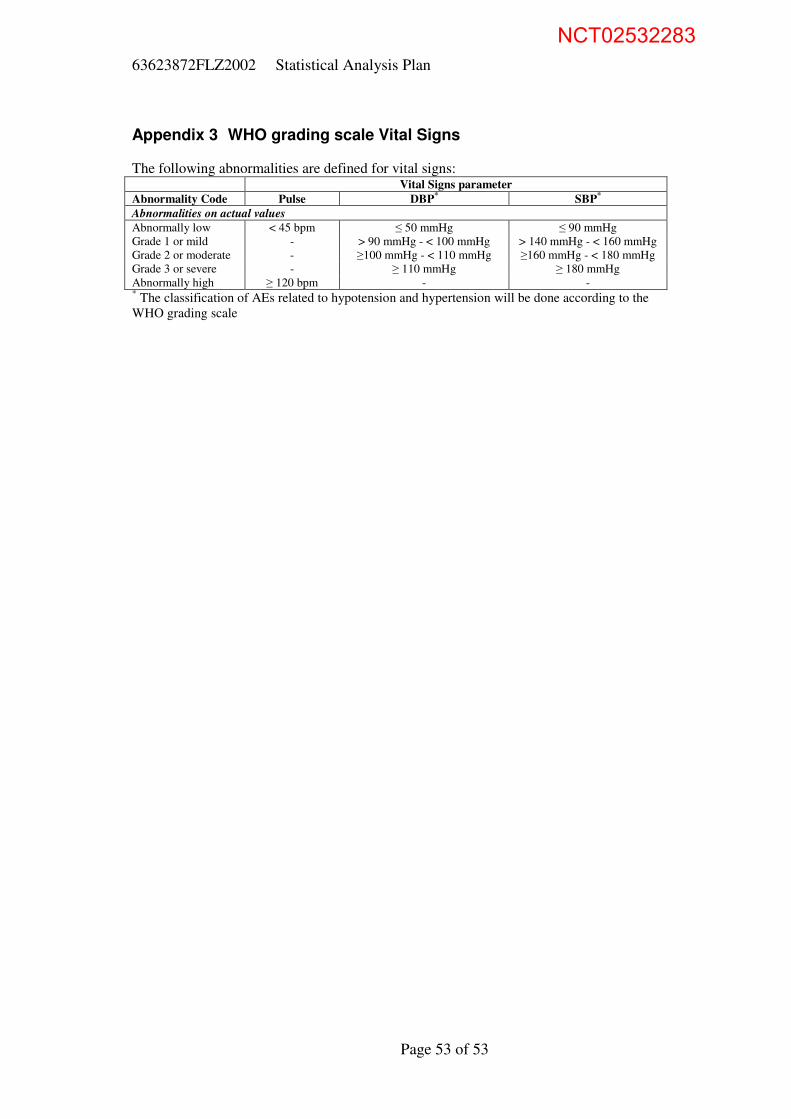
63623872FLZ2002 Statistical Analysis Plan
Page 53 of 53
Appendix 3 WHO grading scale Vital Signs
The following abnormalities are defined for vital signs: Vital Signs parameter
Abnormality Code Pulse DBP* SBP*
Abnormalities on actual values
Abnormally low < 45 bpm ≤ 50 mmHg ≤ 90 mmHg
Grade 1 or mild - > 90 mmHg - < 100 mmHg > 140 mmHg - < 160 mmHg
Grade 2 or moderate - ≥100 mmHg - < 110 mmHg ≥160 mmHg - < 180 mmHg
Grade 3 or severe - ≥ 110 mmHg ≥ 180 mmHg
Abnormally high ≥ 120 bpm - - * The classification of AEs related to hypotension and hypertension will be done according to the
WHO grading scale
NCT02532283