62962 mark scheme june
DESCRIPTION
ocrTRANSCRIPT

Oxford Cambridge and RSA Examinations
GCE
Statistics (MEI)
Advanced Subsidiary GCE AS H132
Mark Scheme for the Units June 2008
H132/MS/R/08J

OCR (Oxford, Cambridge and RSA Examinations) is a unitary awarding body, established by the University of Cambridge Local Examinations Syndicate and the RSA Examinations Board in January 1998. OCR provides a full range of GCSE, A level, GNVQ, Key Skills and other qualifications for schools and colleges in the United Kingdom, including those previously provided by MEG and OCEAC. It is also responsible for developing new syllabuses to meet national requirements and the needs of students and teachers. This mark scheme is published as an aid to teachers and students, to indicate the requirements of the examination. It shows the basis on which marks were awarded by Examiners. It does not indicate the details of the discussions which took place at an Examiners’ meeting before marking commenced. All Examiners are instructed that alternative correct answers and unexpected approaches in candidates’ scripts must be given marks that fairly reflect the relevant knowledge and skills demonstrated. Mark schemes should be read in conjunction with the published question papers and the Report on the Examination. OCR will not enter into any discussion or correspondence in connection with this mark scheme. © OCR 2008 Any enquiries about publications should be addressed to: OCR Publications PO Box 5050 Annesley NOTTINGHAM NG15 0DL Telephone: 0870 770 6622 Facsimile: 01223 552610 E-mail: [email protected]

CONTENTS
Advanced Subsidiary GCE Statistics (H132)
MARK SCHEMES FOR THE UNITS
Unit/Content Page G241 Statistics 1 1
G242 Statistics 2 9
G243 Statistics 3 13
Grade Thresholds 17

G241 Mark Scheme June 2008
G241 Statistics 1
1 (i) Mean = 7.35 (or better) Standard deviation: 3.69 – 3.70 (awfw) Allow s2 = 13.62 to 13.68 Allow rmsd = 3.64 – 3.66 (awfw) After B0, B0 scored then if at least 4 correct mid-points seen or used.{1.5, 4, 6, 8.5, 15}
Attempt of their mean =44
fx∑ , with 301≤ fx ≤ 346 and
fx strictly from mid-points not class widths or top/lower boundaries.
B2cao = 323.5 fx∑ B2cao 2fx∑ = 2964.25 (B1) for variance s.o.i.o (B1) for rmsd (B1) mid-points (B1) 6.84 mean 7.86 ≤ ≤
4
(ii) Upper limit = 7.35 + 2 × 3.69 = 14.73 or ‘their sensible mean’ + 2 × ‘their sensible s.d.’ So there could be one or more outliers
M1 ( with s.d. < mean) E1dep on B2, B2 earned and comment
2
TOTAL 6 2 (i) P(W) × P(C) = 0.20 × 0.17 = 0.034
P(W∩C) = 0.06 (given in the question)
Not equal so not independent (Allow 0.20 × 0.17 ≠ 0.06
or p (W≠ ∩C) so not independent).
M1 for multiplying or 0.034 seen A1 (numerical justification needed)
2
(ii)
The last two G marks are independent of the labels
G1 for two overlapping circles labelled G1 for 0.06 and either 0.14 or 0.11 in the correct places G1 for all 4 correct probs in the correct places (including the 0.69) NB No credit for Karnaugh maps here
3
(iii) P(W|C) = P( ) 0.06 6 0.353
P(C) 0.17 17∩
= = =W C (awrt 0.35)
M1 for 0.06 / 0.17 A1 cao
2
0.14
0.06
0.69
W C
0.11
1

G241 Mark Scheme June 2008
(iv) Children are more likely than adults to be able to speak
Welsh or ‘proportionally more children speak Welsh
than adults’
Do not accept: ‘more Welsh children speak Welsh than
adults’
E1FT Once the correct idea is seen, apply ISW
1
TOTAL 8
2

G241 Mark Scheme June 2008
3 (i) ( ) 0.5 + 0.35 + 1
so 0.15( ) 0 0.5 1 0.35 2 3 0.67 so 2 3 0.32( ) from above 2 2 0.30 so 0.02, 0.13
A p qp q
B pp q
C p qq p
+ =+ =
× + × + + =+ =
+ == =
q
B1 p + q in a correct equation before they reach p + q =0.15 B1 2p + 3q in a correct equation before they reach 2p + 3q = 0.32 (B1) for any 1 correct answer B2 for both correct answers
1 1 2
(ii) E(X2) = 0 0.5 1 0.35 4 0.13 9 0.02 1.05× + × + × + × = Var(X) = ‘their 1.05’ – 0.672 = 0.6011 (awrt 0.6) (M1, M1 can be earned with their p+
and q + but not A mark)
M1 Σx2p (at least 2 non zero terms correct) M1dep for (– 0.67²), provided Var( X ) > 0 A1 cao (No n or n-1 divisors)
3
TOTAL 7 4 (i) X ~ B(8, 0.05)
8( ) P( = 0) 0.95 0.6634 = =A X 0.663 or better Or using tables P( = 0) = 0.6634 X
78( ) P( = 1) 0.05 0.95 0.2793
1P( 1) 1 (0.6634 0.2793) 0.0573
⎛ ⎞= × × =⎜ ⎟⎝ ⎠
> = − + =
B X
X
Or using tables P(X > 1 ) = 1 – 0.9428 = 0.0572
M1 0.958 A1 CAO Or B2 (tables) M1 for P(X = 1)(allow 0.28 or better) M1 for 1 – P(X ≤ 1) must have both probabilities A1cao (0.0572 – 0.0573) M1 for P(X ≤ 1) 0.9428 M1 for 1 – P(X ≤ 1) A1 cao (must end in…2)
2
3
(ii) Expected number of days = 250 × 0.0572 = 14.3 awrt
M1 for 250 x prob(B) A1 FT but no rounding at end
2
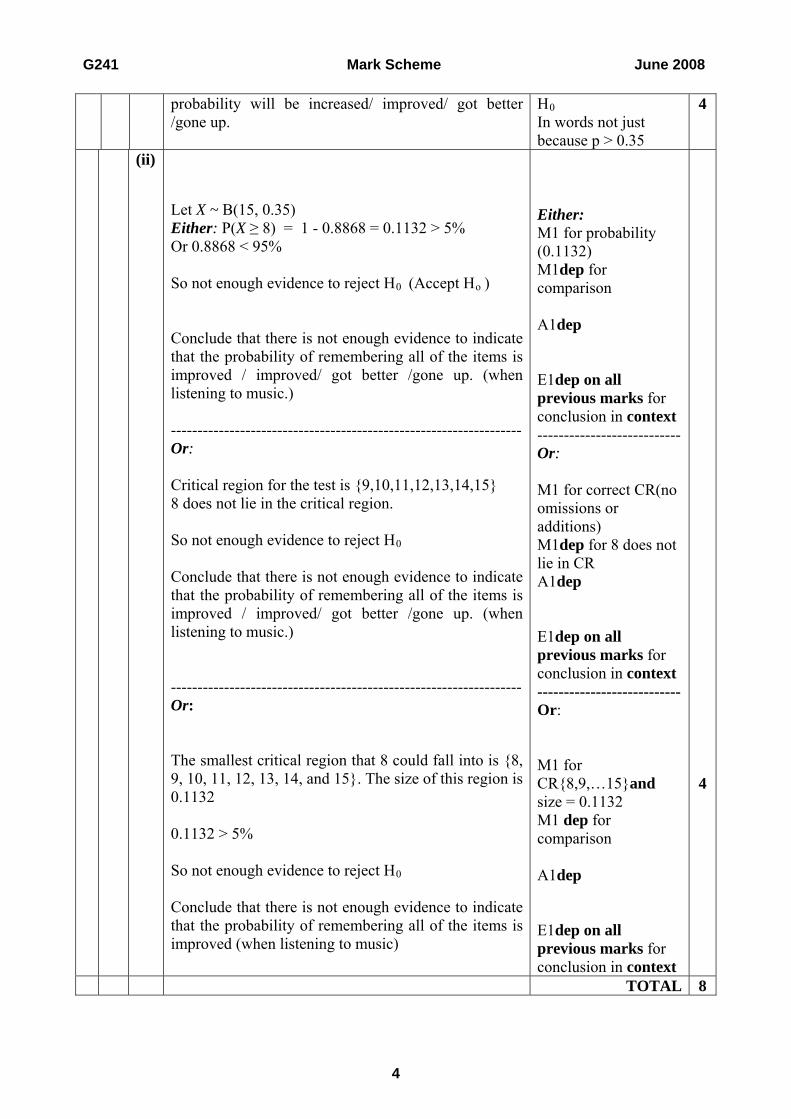
TOTAL 7 5 (i) Let p = probability of remembering or naming all
items (for population) (whilst listening to music.) H0: p = 0.35 H1: p > 0.35
H1 has this form since the student believes that the
B1 for definition of p B1 for H0 B1 for H1 E1dep on p>0.35 in
3
G241 Mark Scheme June 2008
probability will be increased/ improved/ got better /gone up.
H0 In words not just because p > 0.35
4
(ii)
Let X ~ B(15, 0.35) Either: P(X ≥ 8) = 1 - 0.8868 = 0.1132 > 5% Or 0.8868 < 95% So not enough evidence to reject H0 (Accept Ho ) Conclude that there is not enough evidence to indicate that the probability of remembering all of the items is improved / improved/ got better /gone up. (when listening to music.) ------------------------------------------------------------------ Or: Critical region for the test is {9,10,11,12,13,14,15} 8 does not lie in the critical region. So not enough evidence to reject H0
Conclude that there is not enough evidence to indicate that the probability of remembering all of the items is improved / improved/ got better /gone up. (when listening to music.) ------------------------------------------------------------------ Or: The smallest critical region that 8 could fall into is {8, 9, 10, 11, 12, 13, 14, and 15}. The size of this region is 0.1132 0.1132 > 5% So not enough evidence to reject H0
Conclude that there is not enough evidence to indicate that the probability of remembering all of the items is improved (when listening to music)
Either: M1 for probability (0.1132) M1dep for comparison A1dep E1dep on all previous marks for conclusion in context --------------------------- Or: M1 for correct CR(no omissions or additions) M1dep for 8 does not lie in CR A1dep E1dep on all previous marks for conclusion in context ---------------------------Or: M1 for CR{8,9,…15}and size = 0.1132 M1 dep for comparison A1dep E1dep on all previous marks for conclusion in context
4
TOTAL 8
4

G241 Mark Scheme June 2008
Section B 6 (i)
(A) P(both rest of UK) = 0.20 × 0.20
= 0.04 (B) Either: All 5 case P(at least one England) = (0.79 x 0.20) + (0.79 x 0.01) + (0.20 x 0.79) + (0.01 x 0.79) + (0.79 x 0.79) = 0.158 + 0.0079 + 0.158 + 0.0079 + 0.6241 = 0.9559 Or P(at least one England) = 1 – P(neither England) = 1 – (0.21 × 0.21) = 1 – 0.0441 = 0.9559 or listing all = 1 –{ ( 0.2 x 0.2) + (0.2 x 0.01) + (0.01 x 0.20) + (0.01x 0.01)} = 1 – (**) = 1 – { 0.04 + 0.002 + 0.002 + 0.0001) = 1 – 0.0441 = 0.9559 Or: All 3 case P(at least one England) = = 0.79 × 0.21 + 0.21 × 0.79 + 0.792 = 0.1659 + 0.1659 + 0.6241 = 0.9559 ---------------------------------------------------------------------------- (C)Either 0.79 x 0.79 + 0.79 x 0.2 + 0.2 x 0.79 + 0.2 x 0.2 = 0.9801 Or 0.99 × 0.99 = 0.9801 Or 1 – { 0.79 x 0.01 + 0.2 x 0.01 + 0.01 x 0.79 + 0.01 x 0.02 + 0.012 } = 1 – 0.0199 = 0.9801
M1 for multiplying
A1cao M1 for any correct term (3case or 5case) M1 for correct sum of all 3 (or of all 5) with no extras A1cao (condone 0.96 www) Or M1 for 0.21 × 0.21 or for (**) fully enumerated or 0.0441 seen M1dep for 1 – (1st part) A1cao See above for 3 case ----------------------------- M1 for sight of all 4 correct terms summed A1 cao (condone 0.98 www) or M1 for 0.99 x 0.99 A1cao Or M1 for everything 1 – {…..} A1cao
2 3 2
5

G241 Mark Scheme June 2008
(ii) P(both the rest of the UK | neither overseas)
P(the rest of the UK neither overseas)
P(neither overseas)0.04 0.0408
0.9801
and=
= =
{Watch for:)()(
CanswerAanswer as evidence of method (p
<1)}
M1 for numerator of 0.04 or ‘their answer to (i)(A)’ M1 for denominator of 0.9801 or ‘their answer to (i) (C)’ A1 FT (0 < p < 1) 0.041 at least
3
(iii) (A) Probability = 1 – 0.795 = 1 – 0.3077 = 0.6923 (accept awrt 0.69) see additional notes for alternative solution (B) 1 – 0.79n > 0.9 EITHER: 1 – 0.79n > 0.9 or 0.79n < 0.1 (condone = and throughout) but not reverse inequality
≥
n >79010
.log.log , so n > 9.768…
Minimum n = 10 Accept n 10 ≥ ------------------------------------------------------------ OR (using trial and improvement): Trial with 0.799 or 0.7910 1 – 0.799 = 0.8801 (< 0.9) or 0.799 = 0.1198 (> 0.1) 1 – 0.7910 = 0.9053 ( > 0.9 ) or 0.7910 = 0.09468 (< 0.1) Minimum n = 10 Accept n 10 ≥------------------------------------------------------------ NOTE: n = 10 unsupported scores SC1 only
M1 for 0.795 or 0.3077... M1 for 1 – 0.795 dep A1 CAO M1 for equation/inequality in n (accept either statement opposite) M1(indep) for process of
using logs i.e. ba
loglog
A1 CAO ----------------------------- M1(indep) for sight of 0.8801 or 0.1198 M1( indep) for sight of 0.9053 or 0.09468 A1 dep on both M’s cao -----------------------------
3
3
TOTAL 16
6
G241 Mark Scheme June 2008
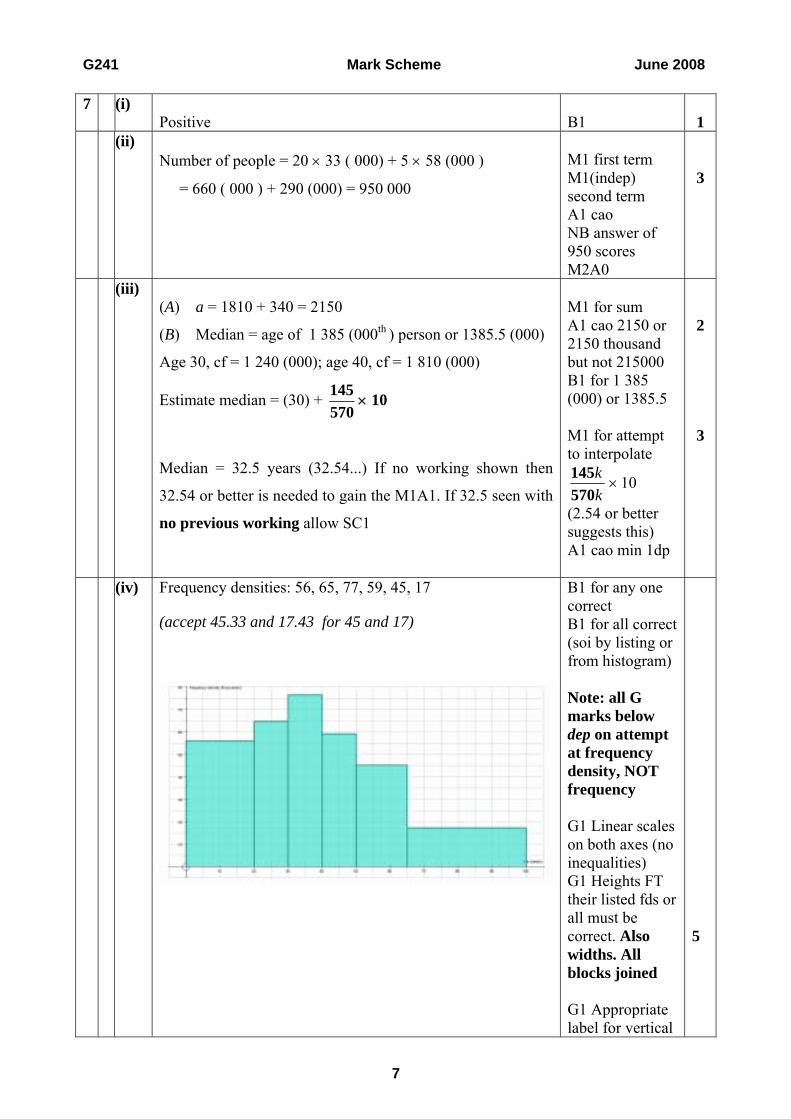
7 (i) Positive
B1
1
(ii)
Number of people = 20 × 33 ( 000) + 5 × 58 (000 )
= 660 ( 000 ) + 290 (000) = 950 000
M1 first term M1(indep) second term A1 cao NB answer of 950 scores M2A0
3
(iii)
(A) a = 1810 + 340 = 2150
(B) Median = age of 1 385 (000th ) person or 1385.5 (000)
Age 30, cf = 1 240 (000); age 40, cf = 1 810 (000)
Estimate median = (30) + 570145
× 10
Median = 32.5 years (32.54...) If no working shown then
32.54 or better is needed to gain the M1A1. If 32.5 seen with
no previous working allow SC1
M1 for sum A1 cao 2150 or 2150 thousand but not 215000 B1 for 1 385 (000) or 1385.5 M1 for attempt to interpolate
kk
570145
× 10
(2.54 or better suggests this) A1 cao min 1dp
2
3
(iv) Frequency densities: 56, 65, 77, 59, 45, 17
(accept 45.33 and 17.43 for 45 and 17)
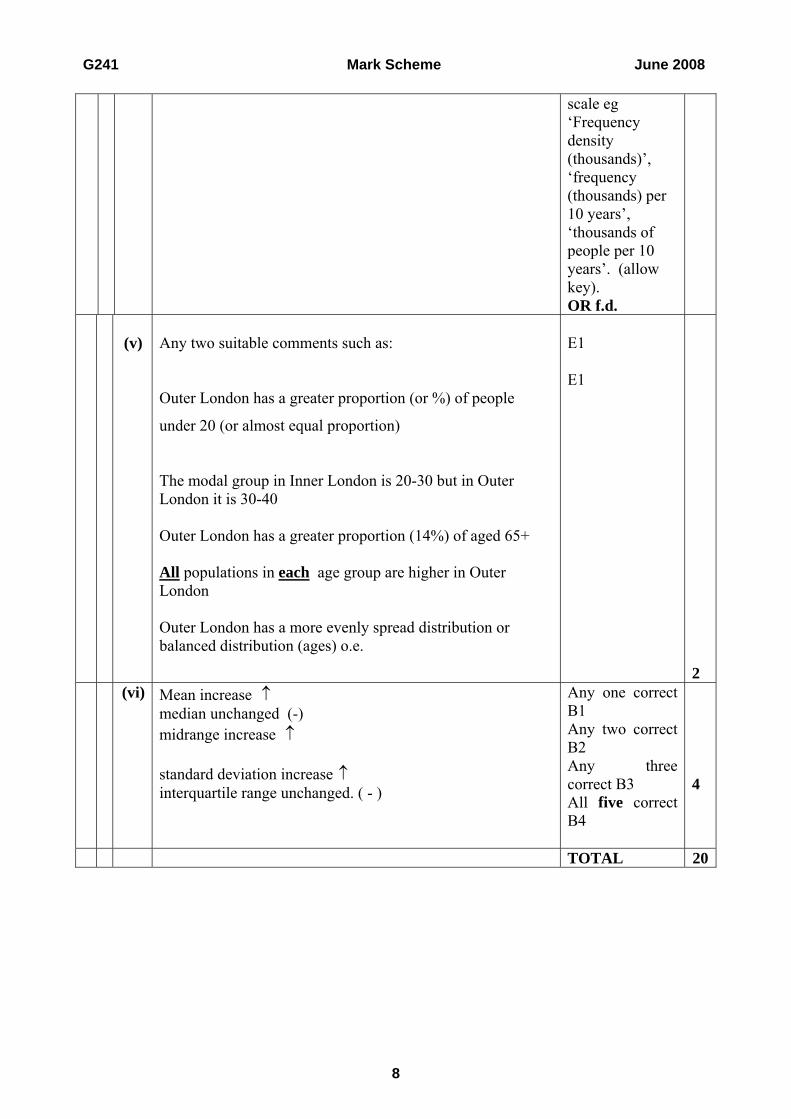
B1 for any one correct B1 for all correct (soi by listing or from histogram) Note: all G marks below dep on attempt at frequency density, NOT frequency G1 Linear scales on both axes (no inequalities) G1 Heights FT their listed fds or all must be correct. Also widths. All blocks joined G1 Appropriate label for vertical
5
7
G241 Mark Scheme June 2008
scale eg ‘Frequency density (thousands)’, ‘frequency (thousands) per 10 years’, ‘thousands of people per 10 years’. (allow key). OR f.d.
(v)
Any two suitable comments such as:
Outer London has a greater proportion (or %) of people
under 20 (or almost equal proportion)
The modal group in Inner London is 20-30 but in Outer London it is 30-40 Outer London has a greater proportion (14%) of aged 65+ All populations in each age group are higher in Outer London Outer London has a more evenly spread distribution or balanced distribution (ages) o.e.
E1 E1
2 (vi) Mean increase ↑
median unchanged (-) midrange increase ↑ standard deviation increase ↑interquartile range unchanged. ( - )
Any one correct B1 Any two correct B2 Any three correct B3 All five correct B4
4
TOTAL 20
8
G242 Mark Scheme June 2008
9
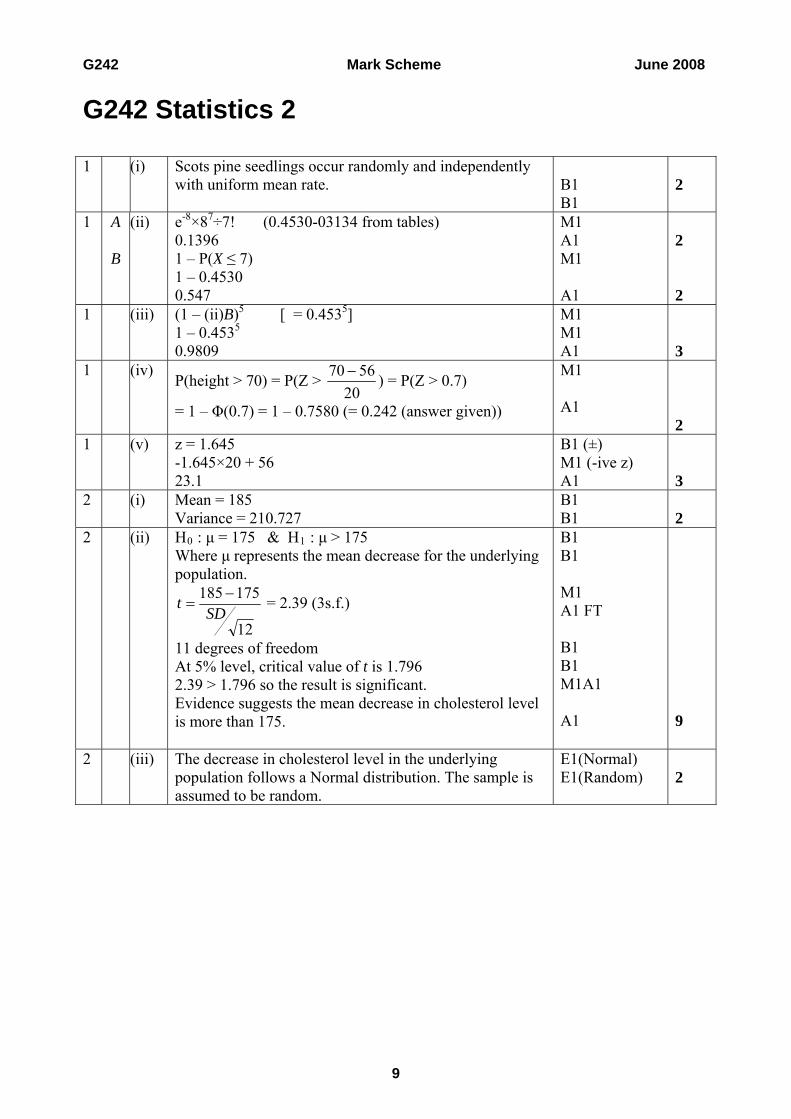
G242 Statistics 2
1 (i) Scots pine seedlings occur randomly and independently with uniform mean rate.
B1 B1
2
1
A B
(ii)
e-8×87÷7! (0.4530-03134 from tables) 0.1396 1 – P(X ≤ 7) 1 – 0.4530 0.547
M1 A1 M1 A1
2 2
1 (iii) (1 – (ii)B)5 [ = 0.4535] 1 – 0.4535 0.9809
M1 M1 A1
3
1 (iv) P(height > 70) = P(Z >
205670 − ) = P(Z > 0.7)
= 1 – Φ(0.7) = 1 – 0.7580 (= 0.242 (answer given))
M1 A1
2
1 (v) z = 1.645 -1.645×20 + 56 23.1
B1 (±) M1 (-ive z) A1
3
2 (i) Mean = 185 Variance = 210.727
B1 B1
2
2 (ii) H0 : μ = 175 & H1 : μ > 175 Where μ represents the mean decrease for the underlying population.
12
175185SD
t −= = 2.39 (3s.f.)
11 degrees of freedom At 5% level, critical value of t is 1.796 2.39 > 1.796 so the result is significant. Evidence suggests the mean decrease in cholesterol level is more than 175.
B1 B1 M1 A1 FT B1 B1 M1A1 A1
9
2 (iii) The decrease in cholesterol level in the underlying population follows a Normal distribution. The sample is assumed to be random.
E1(Normal) E1(Random)
2
G242 Mark Scheme June 2008
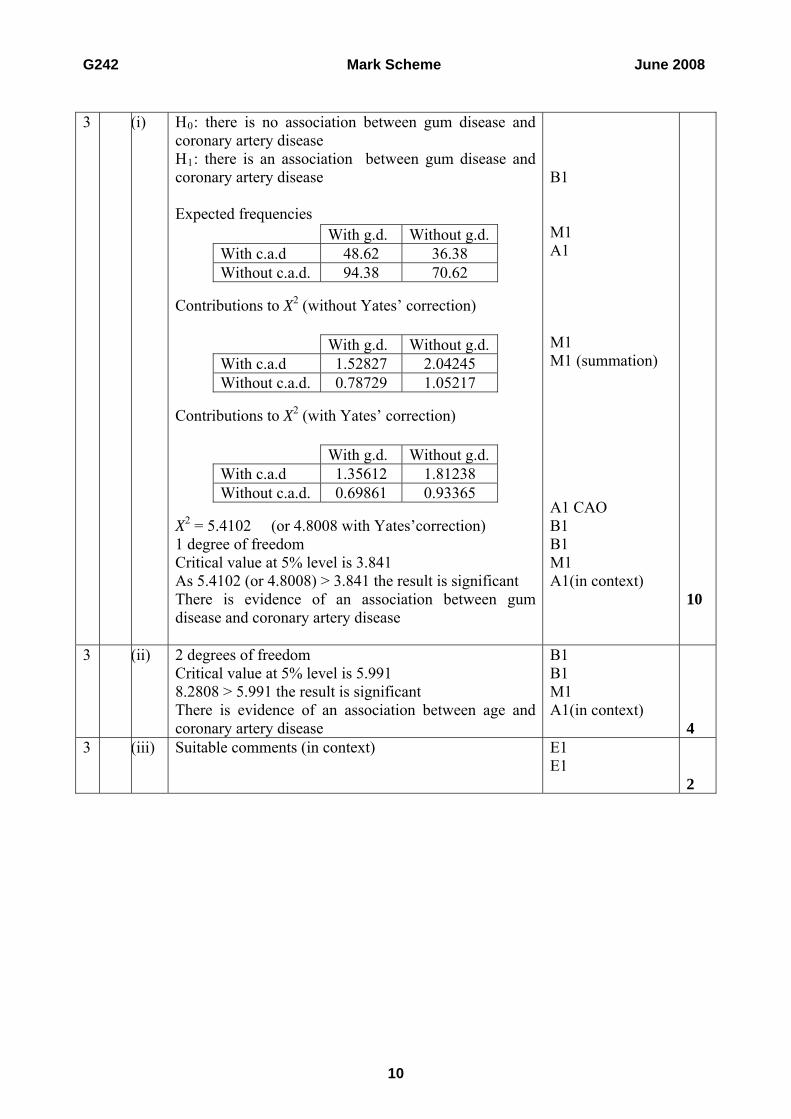
3 (i) H0: there is no association between gum disease and
coronary artery disease H1: there is an association between gum disease and coronary artery disease Expected frequencies Contributions to X2 (without Yates’ correction) Contributions to X2 (with Yates’ correction) X2 = 5.4102 (or 4.8008 with Yates’correction) 1 degree of freedom Critical value at 5% level is 3.841 As 5.4102 (or 4.8008) > 3.841 the result is significant There is evidence of an association between gum disease and coronary artery disease
With g.d. Without g.d. With c.a.d 48.62 36.38 Without c.a.d. 94.38 70.62
With g.d. Without g.d. With c.a.d 1.52827 2.04245 Without c.a.d. 0.78729 1.05217
With g.d. Without g.d. With c.a.d 1.35612 1.81238 Without c.a.d. 0.69861 0.93365
B1 M1 A1 M1 M1 (summation) A1 CAO B1 B1 M1 A1(in context)
10
3 (ii) 2 degrees of freedom Critical value at 5% level is 5.991 8.2808 > 5.991 the result is significant There is evidence of an association between age and coronary artery disease
B1 B1 M1 A1(in context)
4
3 (iii) Suitable comments (in context)
E1 E1
2
10
G242 Mark Scheme June 2008
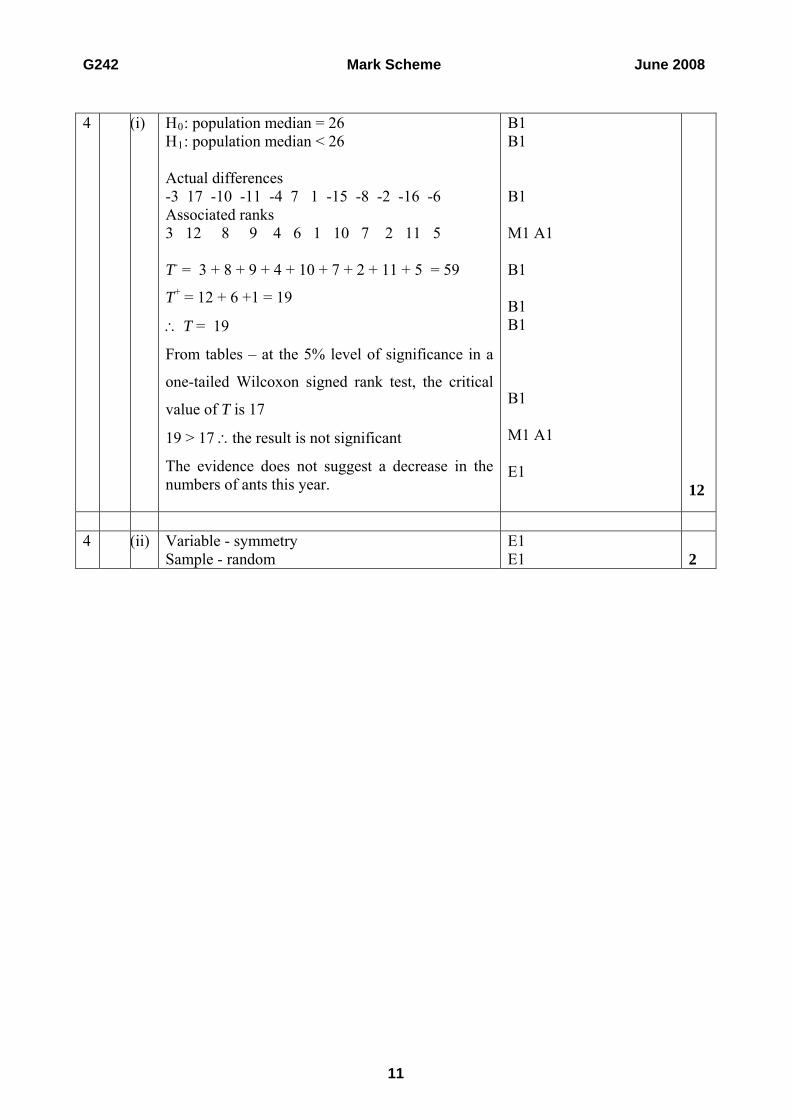
4 (i) H0: population median = 26 H1: population median < 26 Actual differences -3 17 -10 -11 -4 7 1 -15 -8 -2 -16 -6 Associated ranks 3 12 8 9 4 6 1 10 7 2 11 5 T- = 3 + 8 + 9 + 4 + 10 + 7 + 2 + 11 + 5 = 59
T+ = 12 + 6 +1 = 19
∴ T = 19
From tables – at the 5% level of significance in a
one-tailed Wilcoxon signed rank test, the critical
value of T is 17
19 > 17 ∴the result is not significant
The evidence does not suggest a decrease in the numbers of ants this year.
B1 B1 B1 M1 A1 B1 B1 B1 B1 M1 A1 E1
12
4 (ii) Variable - symmetry
Sample - random E1 E1
2
11

G242 Mark Scheme June 2008
5 (i) If hamsters choose their bedding randomly then the three options will be equally likely to occur. Hence the probability that a hamster chooses the new material will be ⅓.
E1
1
5 (ii) 0.0390, 0.1561, 0.2731, 0.2732, 0.1707, 0.0682, 0.0197 5.85, 23.415, 40.965, 40.98, 25.605, 10.23, 2.955
M1 A2 M1 A1
5
5 (iii) H0: B(8, ⅓) is a good model H1: B(8, ⅓) is not a good model Merge final two cells.
X2 = 85.5
)85.510( 2− +415.23
)415.2331( 2− + 965.40
)965.4042( 2− +
98.40)98.4034( 2− +
605.25)605.2519( 2− +
185.13)185.1314( 2−
= 8.370 5 degrees of freedom (6-1) Critical value at 5% level is 11.07 (FT their dof) 8.370 < 11.07 the result is not significant. No evidence to suggest the binomial distribution is not a good model.
B1 M1 M1 [(o-e)2/e] M1 [sum] A1 B1 B1 M1 A1
9
12

G243 Mark Scheme June 2008
13
G243 Statistics 3
1 (i) Quota sampling.
Advantage – probably the only realistic way to get a reasonably ‘representative’ sample in these circumstances. Disadvantage – non-random, so statistical analysis is complicated.
B1 E1 E1
Or other sensible comments. Eg cost or time effective as an advantage
3
(a) (ii)
0
10
20
30
40
50
60
70
80
0 5 10 15 2
Distance travelled (miles)
Mon
ey s
pent
(£)
0
G1 G1 G1
Axes, including labels. Correct zero. All points correct (allow 2 errors).
3
(b) Ranks: 1 2 3 4 5 6 7 8 9 10 11 12 13 14 15 16 17 18 19 20 3 18 1 9 8 2 14 6 5 12 7 10 4 13 19 15 20 11 17 16
d 2 16 2 5 3 4 7 2 4 2 4 2 9 1 4 1 3 7 2 4
5609.04391.0139920
58461 =−=××
−=sr
Critical point for n=20 at two-sided 5% level is 0.4466 Significant. Seems there is an association between distance travelled and money spent.
B2 M1 A1 B1 E1 E1
Allow B1 if one or two errors. CAO. No FT if wrong. No access to these marks if value of rs is nonsense.
7
(c) Some sensible explanation of “no”. Scatter diagram does not suggest bivariate Normality.
M1 A1
SC1. Allow 1 out of 2 if “bivariate” missing. SC2. Allow 1 out of 2 for sensible comment re “outliners”. No marks for “data not linear”.
2
2 (i)
BA
BA
μμμμ
≠=
:H:H
1
0
Where BA μμ , are the population mean lengths for the machines.
B1 B1 B1
Do not allow BA, or similar
unless they are clearly and explicitly stated to be population means. Hypotheses in words must include “population”.

G243 Mark Scheme June 2008
08.275
0.156
05.290
5.184
2
1
==
==
x
x
1312.07471.9)
750.15619.334(
741
2103.089715.18)
905.18494.396(
891
222
221
==−=
==−=
s
s
Because the samples are large, the values of
21s and are taken as and . 2
2s 21σ
22σ
Two-sample test based on N(0,1). Test statistic is:
)93( 46.00639.0
03.0004086.0
03.0
751312.0
900.2103
)0( 08.205.2−=−=−=
+
−−
Double-tailed 10% point of N(0,1) is 1.645. Not significant. No reason to suppose mean lengths differ.
B1 M1 A1 M1 M1 M1 A1 A1 E1 E1
For adequate verbal definition. Allow absence of “population” here if correct notation μ has been used. M0 A0 for divisor n, but FT. Accept as implicit if and are 2
1s 22s
correctly used in sequel. Accept usual alternatives. No FT if wrong.
13
(ii) Samples are large, so by the Central Limit Theorem the underlying distribution of the sample means will be approximately Normal.
E2
(2, 1, 0)
2
3
(i) Differences are: 14 16 6 -8 -24 12 2 -15 10 -1 Ranks of d 7 9 3 4 10 6 2 8 5 1 Test statistic is 4+10+8+1=23 (or 7+9+3+6+2+5=32) Refer to paired Wilcoxon table with n=10. Need lower 2½% point which is 8 (or, if 32 used, upper 2½% point which is 47). Not significant. Seems underlying median total journey times may be assumed equal.
B1 M1 A1 M1 A1 M1 A1 E1 E1
FT if M1 earned or if d (not |d|) ranked. FT if M1 earned. No FT if wrong. No FT if wrong.
9
(ii) The “pairing” will eliminate any differences between the weeks - so can compare the two airlines.
E1 E1
2
14
G243 Mark Scheme June 2008
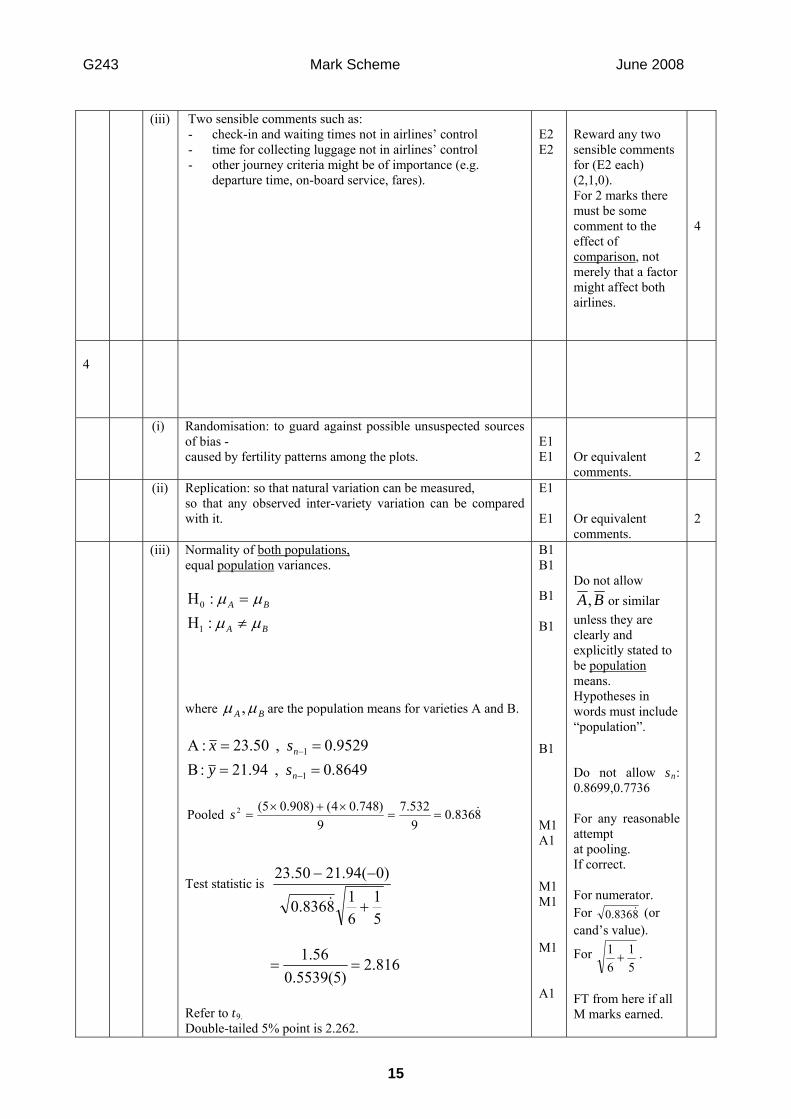
(iii) Two sensible comments such as: - check-in and waiting times not in airlines’ control - time for collecting luggage not in airlines’ control - other journey criteria might be of importance (e.g.
departure time, on-board service, fares).
E2 E2
Reward any two sensible comments for (E2 each) (2,1,0). For 2 marks there must be some comment to the effect of comparison, not merely that a factor might affect both airlines.
4
4
(i) Randomisation: to guard against possible unsuspected sources of bias - caused by fertility patterns among the plots.
E1 E1
Or equivalent comments.
2
(ii) Replication: so that natural variation can be measured, so that any observed inter-variety variation can be compared with it.
E1 E1
Or equivalent comments.
2
(iii) Normality of both populations, equal population variances.
BA
BA
μμμμ
≠=
:H:H
1
0
where BA μμ , are the population means for varieties A and B.
8649.0 , 94.21:B9529.0 , 50.23:A
1
1
====
−
−
n
n
sysx
8836.09532.7
9)748.04()908.05( Pooled 2 &==
×+×=s
Test statistic is
51
618836.0
)0(94.2150.23
+
−−
&
816.2)5(5539.0
56.1==
Refer to t9. Double-tailed 5% point is 2.262.
B1 B1 B1 B1 B1 M1 A1 M1 M1 M1 A1
Do not allow
BA, or similar unless they are clearly and explicitly stated to be population means. Hypotheses in words must include “population”. Do not allow sn: 0.8699,0.7736 For any reasonable attempt at pooling. If correct. For numerator. For 8836.0 & (or cand’s value).
For 51
61+ .
FT from here if all M marks earned.
15

G243 Mark Scheme June 2008
Significant. Appears that population mean yields are different.
M1 A1 E1 E1
No FT if wrong. [accept usual No FT if wrong. [alternatives.]
15
(iv) The pairing will eliminate differences around the field. - can compare the plots within the pairs.
E1 E1
2
(v) Refer to t4. Single-tailed 5% point is 2.132. Not significant. No evidence to reject NH that population mean yields of A and V are the same. Normality of underlying population of differences.
M1 A1 E1 E1 B1 B1
No FT if wrong. No FT if wrong.
6
16
17
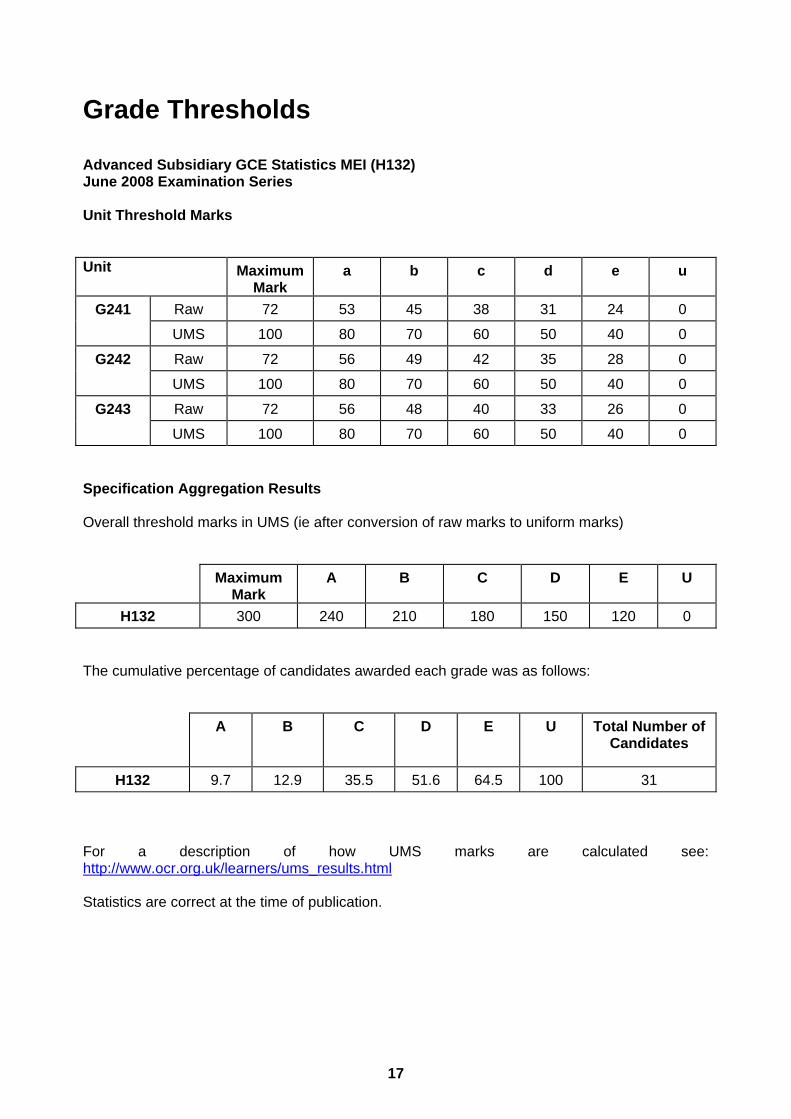
Grade Thresholds
Advanced Subsidiary GCE Statistics MEI (H132) June 2008 Examination Series Unit Threshold Marks Unit Maximum
Mark a b c d e u
Raw 72 53 45 38 31 24 0 G241 UMS 100 80 70 60 50 40 0
Raw 72 56 49 42 35 28 0 G242 UMS 100 80 70 60 50 40 0
Raw 72 56 48 40 33 26 0 G243 UMS 100 80 70 60 50 40 0
Specification Aggregation Results Overall threshold marks in UMS (ie after conversion of raw marks to uniform marks)
Maximum Mark
A B C D E U
H132 300 240 210 180 150 120 0 The cumulative percentage of candidates awarded each grade was as follows:
A B C D E U Total Number of Candidates
H132 9.7 12.9 35.5 51.6 64.5 100 31 For a description of how UMS marks are calculated see: http://www.ocr.org.uk/learners/ums_results.html Statistics are correct at the time of publication.

OCR (Oxford Cambridge and RSA Examinations) 1 Hills Road Cambridge CB1 2EU OCR Customer Contact Centre 14 – 19 Qualifications (General) Telephone: 01223 553998 Facsimile: 01223 552627 Email: [email protected] www.ocr.org.uk For staff training purposes and as part of our quality assurance programme your call may be recorded or monitored
Oxford Cambridge and RSA Examinations is a Company Limited by Guarantee Registered in England Registered Office; 1 Hills Road, Cambridge, CB1 2EU Registered Company Number: 3484466 OCR is an exempt Charity OCR (Oxford Cambridge and RSA Examinations) Head office Telephone: 01223 552552 Facsimile: 01223 552553 © OCR 2008