6.047 computational biology, lecture 20 slides - … 6.047/6.878/hst.507 - computational biology:...
TRANSCRIPT

MIT 60476878HST507 - Computational Biology Genomes Networks Evolution
Lecture 20Personal genomics disease epigenomics
systems approaches to disease
Predictive MedicineMolecular Epidemiology
Mendelian RandomizationPolygenic Risk Prediction Models
1
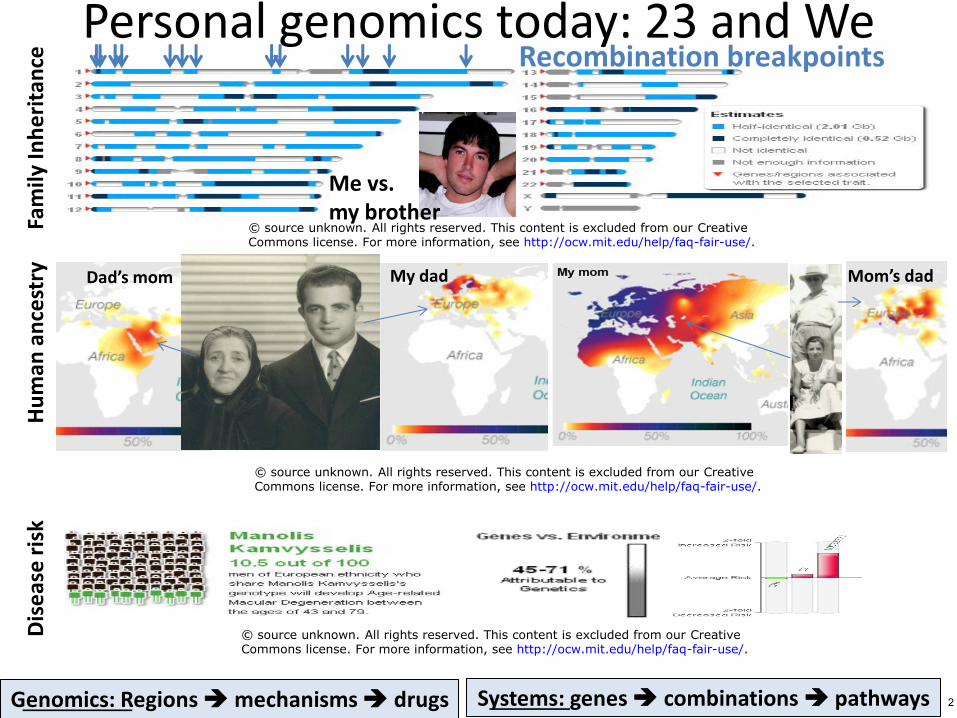
Personal genomics today 23 and We ce Recombination breakpoints
antri
eIn
hFa
mily
Me vs my brother
copy source unknown All rights reserved This content is excluded from our CreativeCommons license For more information see httpocwmiteduhelpfaq-fair-use
My dad Dadrsquos mom Momrsquos dad
Hu
man
an
cest
ry
copy source unknown All rights reserved This content is excluded from our CreativeCommons license For more information see httpocwmiteduhelpfaq-fair-use
Dis
eas
e r
isk
copy source unknown All rights reserved This content is excluded from our CreativeCommons license For more information see httpocwmiteduhelpfaq-fair-use
Genomics Regions mechanisms drugs Systems genes combinations pathways 2
Goal Personalized and Predictive Medicine 1 Intro to Epidemiology basis of human disease 2 Genetic Epidemiology
ndash Genetic basis GWAS and screening ndash Interpreting GWAS with functional genomics
Calculating functional enrichments for GWAS loci
olecular epidemiology meQTLs Genotype-Epigenome association (cis-trans-) EWAS Epigenome-Disease association
esolving Causality Statistical Mendelian Randomization Application to genotype + methylation in AD
ystems Genomics and Epigenomics of disease Beyond single loci polygenic risk prediction models
ndash 3 M
ndash ndash
4 Rndash ndash
5 Sndash ndash Sub-threshold loci and somatic heterogeneity in cancer
3
DXG
E
effects
causes
genome epigenome biomarkers
environment
disease S
symptoms
syndrome
C confounders
EpidemiologyThe study of the
patterns causes and effects of health and disease conditions
in defined populations
4
Epidemiology Definitions and terms
bullMorbidity level how sick an individual is
bull Incidence of new cases people time period
bullPrevalence Total of cases in population
bullAttributable risk rate in exposed vs not exposed
bull Population burden yrs of potential life lost (YPLL) quality-disability-adjusted life year (QALYDALY)
bullSyndrome Co-occurring signs (observed) symptomes (reported) and other phenomena (often hard to establish causality risk factors)
bullPrevention challenge Determine disease cause understand whether when and how to intervene
5
Determining disease causes study design bull Principles of experimental design
ndash Control comparison to baseline placebo effect
ndash Randomization Difficult to achieve ensure mixing ndash Replication control variability in initial sample
ndash Grouping understand variation between subgroups ndash Orthogonality all combinations of factorstreatments
ndash Combinatorics factorial design n x n x n x lt x n table
bull Challenge of human subjects
ndash Legal and ethical constraints Review boards
ndash Randomization by instrumental variables
ndash Clinical trials blind (patient) double-blind (doctor too)
6
Goal Personalized and Predictive Medicine 1 Intro to Epidemiology basis of human disease 2 Genetic Epidemiology
ndash Genetic basis GWAS and screening ndash Interpreting GWAS with functional genomics ndash Calculating functional enrichments for GWAS loci
3 Molecular epidemiology ndash meQTLs Genotype-Epigenome association (cis-trans-) ndash EWAS Epigenome-Disease association
4 Resolving Causality ndash Statistical Mendelian Randomization ndash Application to genotype + methylation in AD
5 Systems Genomics and Epigenomics of disease ndash Beyond single loci polygenic risk prediction models ndash Sub-threshold loci and somatic heterogeneity in cancer
7
confounders environment
DXG effects
causes
genome epigenome biomarkers
disease S
symptoms
C E
Genetic Epidemiology
Genetic factors contributing to disease
8
Genome-wide association studies (GWAS)
Courtesy of Macmillan Publishers Limited Used with permissionSource Mccarthy M I Abecasis G R Cardon L R Goldstein D B Little J Ioannidis J P amp HirschhornJ N (2008) Genome-wide association studies for complex traits Consensus uncertainty and challenges NatRev Genet Nature Reviews Genetics 9(5) 356-369
bull Iden Risk allele G more frequent in patients A in controls But large regions co-inherited find causal variant Genetics does not specify cell type or process
tify regions that co-vary with the disease
bull bull bull
9
All disease-associated genotypes from GWAS
bull 1000s of studies each with 1000s of individuals ndash Increasing power meta-analyses reveal additional loci ndash More loci expected only fraction of heritability explained
10
Courtesy of Burdett T (EBI) Hall PN (NHGRI) Hastings E (EBI) Hindorff LA (NHGRI) Junkins HA (NHGRI)
Klemm AK (NHGRI) MacArthur J (EBI) Manolio TA (NHGRI) Morales J (EBI) Parkinson H (EBI) and
Welter D (EBI)The NHGRI-EBI Catalog of published genome-wide association studiesAvailable at wwwebiacukgwas Used with Permission
More loci on the way GWAS growth continues
copy source unknown All rights reserved This content is excluded from our CreativeCommons license For more information see httpocwmiteduhelpfaq-fair-use
bull When to design custom chip continuously update bull httpwwwgenomegovadmingwascatalogtxt
11
Decreasing cost of whole-genome sequencing
Image by Wetterstrand KA DNA Sequencing Costs Data from the NHGRI Genome SequencingProgram ( GSP) Available at wwwgenomegovsequencingcosts Image in the public domain
bull Simply genotype all known variants at gt01 freq
bull Or sequence complete diploid genome of everyone 12
Genetic epidemiology What to test bull Family risk alleles inherited with common trait
ndash Specific genes specific variants family history
Monogenic actionable protein-coding mutations ndash Most understood highest impact easiest to interpret All coding SNPs with known disease association
ndash What if not druggable treatable Wantneed know All codingnon-coding associations from GWAS
ndash Thousands of significant associations (1350 on 62012)
All common SNPs regardless of association
ndash HapMap and 1000 Genomes capture common variants
bull
bull
bull
bull
bull Genome all SNPs CNVs rareprivate mutations 13
Predictive medicine When to screen bullDiagnostic testing after symptoms confirm a hypothesis
istinguish between possibilities
redictive risk before symptoms even manifest
ewborn heel pick store for early treatment
re-natal testing ulstrasound maternal serum vs eedles probes chorionic villus sampling
re-conception testing commonrare disorders
arrier testing specific mutation in family history
enetics vs biomarkers cause vs consequence
d
bullP
bullN
bullPn
bullP
bullC
bullG
14
Goal Personalized and Predictive Medicine 1 Intro to Epidemiology basis of human disease
enetic Epidemiology Genetic basis GWAS and screening Interpreting GWAS with functional genomics Calculating functional enrichments for GWAS loci
olecular epidemiology meQTLs Genotype-Epigenome association (cis-trans-) EWAS Epigenome-Disease association
esolving Causality Statistical Mendelian Randomization Application to genotype + methylation in AD
ystems Genomics and Epigenomics of disease Beyond single loci polygenic risk prediction models
2 Gndashndashndash
3 Mndashndash
4 Rndashndash
5 Sndashndash Sub-threshold loci and somatic heterogeneity in cancer
15
Interpreting disease associations Functional genomics of GWAS
16
GWAS CATGACTG CATGCCTG
enotype Disease
mQTLs
Epigenome MWAS
Interpreting disease-association signals
(1) Interpret variants using Epigenomics - Chromatin states Enhancers promoters motifs
- Enrichment in individual loci across 1000s of SNPs in T1D
G
(2) Epigenome changes in disease - Intermediate molecular phenotypes associated with disease
- Variation in brain methylomes of Alzheimerrsquos patients17
Complex disease strong non-coding component
Monogenic Polygenic Complex Mendelian Disease Disease
Coding
Non-coding
Human Genetic Mutation Database Catalog of GWAS studies April 2010 release Hindorff et al PNAS 2009
Slide credit Benjamin Raby 18
Genomic medicine challenge and promises
1 The promise of genetics
ndash Disease mechanism
ndash New target genes
ndash New therapeutics
ndash Personalized medicine
The challenge
ndash 90+ disease hits non-coding
ndash Cell type of action not known
ndash Causal variant not known
ndash Mechanism not known
2
Hillmer Nature Genetics 2008
GWAS simple χ2 statistical test
Courtesy of Macmillan Publishers Limited Used with permission Source Hillmer A M Brockschmidt F F Hanneken S Eigelshoven S Steffens M Flaquer A Noumlthen M M (2008) Susceptibility variants
for male-pattern baldness on chromosome 20p11 Nature Genetics Nat Genet
40(11) 1279-1281 doi101038ng228
19
Genomic medicine challenge and promises 3 The remedy
nnotation of non-coding enome (ENCODERoadmap)
inking of enhancers to egulators and target genes ew methods for utilizing them
The deliverables ndash Relevant cell type ndash Target genes ndash Causal variant ndash Upstream regulator ndash Relevant pathways
ndash Ag
ndash Lr
ndash N
Roadmap Epigenomics Nature 2015 4
ndash Intermediate phenotypes Ernst Nature 2011 20
Courtesy of NIH Roadmap Epigenomics MappingConsortium Used with permission
Courtesy of Macmillan Publishers Limited Used with permissionSource Ernst J et al (2011) Mapping and analysis of chromatinstate dynamics in nine human cell types Nature 473(7345) 43-49
This talk From loci to mechanisms
Building a reference map of the regulatory genome
Regions Enhancers promoters transcribed repressed
Enhancers Promoters Transcribed Repressed
Cell types Predict tissues and cell types of epigenomic act ivity Target genes Link variants to their target genes using eQTLs activity Hi-C Nucleotides Regulatory consequence of mutation Conservation PWMs Regulators Upstream regulators whose activity is disrupted by mutation
Application to GWAS hidden heritability and Cancer GWAS CATGCCTG bull 93 top hits non-coding Mechanism Cell type hits CGTGTCTA bull Lie in haplotype blocks Causal variant(s)
lsquoHiddenrsquo CATGCCTG bull Many variants small effects Pathway-level burdenload heritability CGTGTCTA bull Many false positives Prioritize w regulatory annotations
Cancer CATGCCTG bull Loss of function Protein-coding variants convergence mutations CATCCCTG bull Gain of function Regulatory variants heterogeneity
21
Dissecting non-coding genetic associations
3 Causal nucleotide(s)
2 Target gene(s)
1 Tissuecell type(s)
4 Upstream regulator(s) TF
TF TF
5 Cellular phenotypes 6 Organismal phenotypes
GWAS region SNPs
1 Establish relevant tissuecell type
2 Establish downstream target gene(s)
3 Establishing causal nucleotide variant
4 Establish upstream regulator causality
5 Establish cellular phenotypic consequences
6 Establish organismal phenotypic consequences 22
Using epigenomic maps to predict disease-relevant tissues
23
St
em C
Imm
un
Hea
rtLi
ver
Region of association Individual SNPs
Height Type 1 Diabetes Blood Pressure
Cholesterol
Identifying disease-relevant cell types
ells
e
Stem Cell Immune Heart Liver Enhancers Enhancers Enhancers Enhancers
bull For every trait in the GWAS catalog
ndash Identify all associated regions at P-value threshold
ndash Consider all SNPs in credible interval (R2ge8)
ndash Evaluate overlap with tissue-specific enhancers
ndash Keep tissues showing significant enrichment (Plt0001) Repeat for all traits (rows) and all cell types (columns) bull
24
GWAS hits in enhancers of relevant cell types
25
T cells B cells
Digestive
Brain
ESLiver
Heart
Linking traits to their relevant celltissue types
copy source unknown All rights reserved This content is excluded from our Creative Commons license For more information see httpocwmiteduhelpfaq-fair-use 26
27
Immune activation + neural repression in human + mouse
Courtesy of Macmillan Publishers Limited Used with permissionSource Gjoneska E Pfenning A R Mathys H Quon GKundaje A Tsai L amp Kellis M (2015) Conserved Epigenomic signals inmice and humans reveal immune basis of Alzheimerrsquos disease Nature 518 (7539) 365-369 doi101038nature14252
Sample mouse brain epigenomics during Two contrasting signatures of neurodegeneration immune activation vs neural repression
Is inflammation simply a consequence of neuronal loss 28
Genetic evidence for immune vs neuronal components
Increasing Decreasing (immune) (neuronal)
Courtesy of Macmillan Publishers Limited Used with permission Source Gjoneska E Pfenning A R Mathys H Quon G Kundaje A Tsai L amp Kellis M (2015) Conserved Epigenomic signals in mice and humans reveal immune basis of Alzheimerrsquos disease Nature 518(7539) 365-369 doi101038nature14252
Only increasing (immune) enhancers Neuronal cell types are depleted enriched in AD-associated SNPs for AD-associated SNPs
Indicates immune cell dysregulation is causal component Microglial cells resident immune cells of adult brain Macrophages infiltrate brain in neurodegeneration
29
Using epigenomic annotations for fine-mapping disease regions
30
LD both a blessing amp
a curse
Observation LD blocks in which there is no evidence for historical
copy source unknown All rights reserved This content is excluded from our Creative recombination Commons license For more information see httpocwmiteduhelpfaq-fair-use 31
Causal variant not known in most GWAS regions
Courtesy of Macmillan Publishers Limited Used with permission Source Smemo S Tena J J Kim K Gamazon E R Sakabe N JGoacutemez-Mariacuten C
Noacutebrega M A (2014) Obesity-associated variants within FTO form long-range functional
connections with IRX3 Nature 507(7492) 371-375 doi101038nature13138
copy source unknown All rights reserved This content is excluded from our Creative
Commons license For more information see httpocwmiteduhelpfaq-fair-use
LD (Linkage disequilibrium) large regions co-inherited in blocks Blessing for initial mapping (few tags) curse for fine-mapping
Use functional annotations to predict causal variant(s)32
Multiple lines of evidence for fine-mapping
Courtesy of Macmillan Publishers Limited Used with permission Ward L D amp Kellis M (2012) Interpreting noncoding genetic variation in complex traits and human disease Nat Biotechnol Nature Biotechnology 30(11) 1095-1106 doi101038nbt2422 Used with permission
Ward and Kellis Nature Biotechnology 2012
bull Epigenomic information enhancers amp linking (target genes) bull Motif information causal variants amp upstream regulators bull Evolutionary conservation causal variants amp conserved motifs 33
Detect SNPs that disrupt conserved regulatory motifs
Courtesy of Macmillan Publishers Limited Used with permissionSource Lindblad-Toh Kerstin Manuel Garber Or Zuk Michael F Lin Brian J Parker
Ste fan Washietl Po uya Kh eradpou r et al ldquoA Hi gh-Resolu t ion Map o f Human Ev olutionary
Constraint Using 29 Mammalsrdquo Nature 478 no 7370 (2011) 476ndash82do i101038nature10530
bull Functionally-associated SNPs enriched in states constraint bull Prioritize candidates increase resolution disrupted motifs
34
Allele-specific chromatin marks cis-vs-trans effects
copy source unknown All ri ghts reserved This content i s excluded from our Creative Commons license For more information see httpocwmiteduhelpfaq-fair-use
bull Maternal and paternal GM12878 genomes sequenced bull Map reads to phased genome handle SNPs indels
35bull Correlate activity changes with sequence differences35
Predict effect of common rare somatic mutations
All Regulatory and epigenomic annotations
Raresomatic Predict TF binding disruption
Richard Sallari Common allelic activity in heterozygous lines Xinchen Wang
36
HaploReg public resource for dissecting GWAS
Courtesy of the authors License CC BY-NCSource Ward Lucas D and Manolis Kellis HaploReg a resource for exploring chromatin states conservation and regulatory
motif alterations within sets of genetically linked variants Nucleic Acids Research 40 no D1 (2012) D930-D934
bull Start with any list of SNPs or select a GWA study ndash Mine ENCODE and Roadmap epigenomics data for hits ndash Hundreds of assays dozens of cells conservation motifs ndash Report significant overlaps and link to infobrowser
bull Try it out httpcompbiomiteduHaploReg Ward Kellis NAR 2011 37
37
Predicting target genes
38
Three lines of linking evidence ticPhysical Functional Gene
copy source unknown All ri ghts reserved This content Courtesy of Macmillan Pu blishers Limited Used with permission Ward L D amp Kellis M (2012)
is excluded from our Creative Commons license Interpreting noncoding genetic variation in complex traits and human disease Nat Biotechnol
For more information see httpocwmiteduhelp Nature Biotechnology 30(11) 1095-1106 doi101038nbt2422 Used with permissionfaq-fair-use
Hi-C Physical Enhancer-gene eQTL evidence SNP proximity in 3D activity correlation effect on expression
39
39
Targets 3D folding and expr genetics indicate IRX3+IRX5
Cohort of 20 homozygous risk and 18 homozygous non -risk individuals Genotype-dependent expression
Dixon Nature 2012
Topological domains span 25Mb eQTL targets IRX3 and IRX5
Implicate 8 candidate genes
Risk allele increased expression
(gain-of-function) 404
copy source unknown All rights reserved This content isexcluded from our Creative Commons license For moreinformation see httpocwmiteduhelpfaq-fair-use
copy source unknown All rights reserved This content isexcluded from our Creative Commons license For moreinformation see httpocwmiteduhelpfaq-fair-use
40
Goal Personalized and Predictive Medicine 1 Intro to Epidemiology basis of human disease 2 Genetic Epidemiology
ndash Genetic basis GWAS and screening ndash Interpreting GWAS with functional genomics ndash Calculating functional enrichments for GWAS loci
3 Molecular epidemiology ndash meQTLs Genotype-Epigenome association (cis-trans-) ndash EWAS Epigenome-Disease association
4 Resolving Causality ndash Statistical Mendelian Randomization ndash Application to genotype + methylation in AD
5 Systems Genomics and Epigenomics of disease ndash Beyond single loci polygenic risk prediction models ndash Sub-threshold loci and somatic heterogeneity in cancer
41
Interpreting disease-association signals
(1) Interpret variants using Epigenomics - Chromatin states Enhancers promoters motifs
- Enrichment in individual loci across 1000s of SNPs in T1D
GWAS CATGACTG CATGCCTG
Genotype Disease
mQTLs
Epigenome MWAS
(2) Epigenome changes in disease - Intermediate molecular phenotypes associated with disease
- Variation in brain methylomes of Alzheimerrsquos patients 42
Goal Personalized and Predictive Medicine 1 Intro to Epidemiology basis of human disease
Genetic Epidemiology Genetic basis GWAS and screening Interpreting GWAS with functional genomics Calculating functional enrichments for GWAS loci
Molecular epidemiology meQTLs Genotype-Epigenome association (cis-trans-) EWAS Epigenome-Disease association
Resolving Causality Statistical Mendelian Randomization Application to genotype + methylation in AD
Systems Genomics and Epigenomics of disease Beyond single loci polygenic risk prediction models Sub-threshold loci and somatic heterogeneity in cancer
43
2 ndashndashndash
3 ndashndash
4 ndashndash
5 ndashndash
43
DXG
effects
causes
genome epigenome biomarkers
disease S
symptoms
C Econfounders environment
Molecular EpidemiologyMolecular Biomarkers of disease state
Gene expression DNA methylation chromatin in specific cell types
44
chr2
meQTLminuslinked CpG r^2
meQTL SNP r^2
SNP AAF
Genotype
BRNMIDFRNTL E073
BRNANGGYR E067
BRNANTCAUD E068
BRNCINGGYR E069
BRNHIPPMID E071
BRNINFTMP E072
BRNSUBNIG E074
LIVADLT E066
BLDCD14PC E029
BLDCD4MPC E037
BLDCD4CD25MCD45RANPC E039
LNGIMR90 E017
GISTMCMUS E111
SKINPENFRSKFIB01 E055
MUSTRNKFET E089
BONEOSTEO E129
Genes(+)
Genes(minus)
Mean Methylation
Normalized Methylation
Methylation StdDev
meQTLminuslinked CpG r^2
0
146
293
439
586
241400000 241500000 241600000 241700000 241800000 241900000 242000000 242100000 242200000 2423000003 5
241400000 241500000 241600000 241700000 241800000 241900000 242000000 242100000 242200000 2423000005 3
Genetic and epigenetic data in 750 Alzheimerrsquos patientscontrols MAP Memory and Aging Project
+ ROS Religious Order Study
Dorsolateral PFC
Reference Chromatin
states (Bernstein)
Genotype
(1M SNPs
x700 ind)
(De Jager)
BrainLiver Blood Lung GI Skin Muscle Bone
Methylation
(450k probes
x 700 ind)
(De Jager)
copy source unknown All rights reserved This content is excluded from our CreativeCommons license For more information see httpocwmiteduhelpfaq-fair-use
750 subjects initially cognitively normal Alzheimerrsquos diagnosed by pathology (Bennett) 45
Data Matrices ndash An example scenario n=750 individuals n=750 individuals n=750 individuals n=750 individuals
Genotype
g=1
20
00
00
0
Methylation
m=4
50
00
0
e=1
5 10
ldquoEnvironmentrdquo
p=
Phenotype (Disease)
M - Illumina Methylation 450k array 450000 probes targeting CpGs genome-wide
G - Affy SNP arrays imputed against CEU thousand genomes reference panel yielding 12m SNPs
E - Clinical covariates that might mask the variation due to our phenotype eg gender smoking age or sample batch
P - Phenotype of interest sometimes measured with multiple markers (clinical Alz diagnosis vs pathology Alz diagnosis vs count of neuritic plaques)
n -gt number of individuals in cohort 46
E environment
cause D G M Alzheimer genotype
methylation effects disease 46
EWAS Capturing variability in the Epigenomeattributable to disease
D X
Epigenome DNA methylation Phenotype
lzheimerrsquos Disease
E Environment
Age Education Gender etc
Known variable correction
C Experimental Technical
Cell type mixtures Batch effects Other
Unknown Confounders
Known amp ICA inferred variable
correction
EWAS Hundreds of AD associated loci
enriched in enhancers and relevant
pathways
G meQTL Genotype (~60K
5M Common CpGs) Variants
47
Excluding discovered and known covariates
copy source unknown All ri ghts reserved This content is excluded from our Creative Commons license For more information see httpocwmiteduhelpfaq-fair-use 48
Infer covariates using ICA
compare to known
exclude both
Strongest effects
bull Plate (batch)
bull Cell mixture
bull Bisulfite conversion
bull Gender
bull Age
Variance explained
bull Known 25
bull Inferred 35
bull Together 40
C Econfounders environment
DMG effects
cause
genotype methylation Disease
GenotypeMethylation Discovering mQTLs
Methylation Quantitative Trait Loci
49
cis-meQTLs
M
n=750 n=750 Use linear models to identify cis-meQTLs win some genomic window =4
50
00
0
00
00
00
G
m 12
g=
For methyl mark mi and SNP gj mi = β0 + β1(gj) + ε
bull Given several predictors is additional predictor increasing accuracy more than complexity introduced
bull Likelihood ratio testing paradigm predict methylation with and without genotype (only works for nested models)
bull Null hypothesis H0 β1=0 Additional model complexity rsquot explain a significant portion of variation in response
LM1 mi = β0 + ε LM2 mi = β0 + β1(gj) + ε
r term
2) (q ndash p) ) ( RSSLM2 (n ndash q) ) n-q) degrees of freedom is p-value is what we report in a meQTL study SSLM2 too small vs increase in model complexity
50
doesn
Test using F statistic - p is the number of parameters in LM1 - q is the number of parameters in LM2 - n is the sample size - RSS Residual sum of squares - β parameters to learn ε residual erroUnder null hypothesis ( (RSSLM1 ndash RSSLM
Is distributed as F distribution with (q-p If F statistic significant reject null Th Otherwise no meQTL ie RSSLM1 ndash R
50
cis-meQTLs
M
n n =4
50
00
0
00
00
00
G
m 12
g=
Alternative methods of detection
Permutation bull Correlate methylation and genotype bull For i in 1 -gt nperm
bull Permute genotypes bull Correlate methylation and genotype
bull Generate empirical p-value from permuted correlations
LMM Linear mixed models
bull
bull
51
00 05 10 15 20
02
04
06
Adjusted MA Dosage
Adju
sted
Met
hyla
tion
minus05 05 15
065
075
085
Adjusted MA Dosage
Adju
sted
Met
hyla
tion
minus05 05 15
060
064
068
072
rs17836662 cg10853533 minus44352
Adjusted MA Dosage
Adju
sted
Met
hyla
tion
minus05 05 15
010
020
030
rs7924341 cg20132549 minus1847
Adjusted MA Dosage
Adju
sted
Met
hyla
tion
1 2
3 4
1
2
3 4
Most epigenomic variability is genotype-driven Manhattan plot of 450000 methylation probes
P)
10
log
-(va
lue
-P
Chromosome and genomic position
Genome-wide significance at plt3x10-10
Prune for probes disrupted by SNP
0
bullbull 140000 CpGs associated with genotype at 1 FDR
55000 at Bonferroni-corrected P-value of 10-2
52
copy source unknown All rights reserved This content is excluded from our Creative
Commons license For more information see httpocwmiteduhelpfaq-fair-use
Scaling of discovery power with individuals
copy source unknown All rights reserved This content is excluded from our Creative
Commons license For more information see httpocwmiteduhelpfaq-fair-use
bull Number of meQTLs continues to increase linearly bull Weak-effect meQTLs median R2lt01 after 400 indiv 53
Goal Personalized and Predictive Medicine 1 Intro to Epidemiology basis of human disease 2 Genetic Epidemiology
ndash Genetic basis GWAS and screening ndash Interpreting GWAS with functional genomics ndash Calculating functional enrichments for GWAS loci
3 Molecular epidemiology ndash meQTLs Genotype-Epigenome association (cis-trans-) ndash EWAS Epigenome-Disease association
4 Resolving Causality ndash Statistical Mendelian Randomization ndash Application to genotype + methylation in AD
5 Systems Genomics and Epigenomics of disease ndash Beyond single loci polygenic risk prediction models ndash Sub-threshold loci and somatic heterogeneity in cancer
54
confounders
DMG effects
cause
genotype methylation
environment
Disease
C E
MethylationDisease EWAS
Epigenome-wide association study
55
eWAS
Methylation
n n
10 Phenotype
e= (Disease)
=45
00
00
m
Link methylationphenotype (~cis-eQTLs) linear models and hypothesis testing Predict phenotype using methylation
bullbull
LM1 pi
LM2 p = β0 + β1(m ) + ε = β0 + ε
i j
56
eWAS n n
Methylation
m=4
50
00
0
Phenotype (Disease) p
=1
0
n
ldquoEnvironmentrdquo e=
15
LM1 AD = β0 + β2(gender) + ε LM2 AD = β0 + β1(mj) + β2(gender) ε
Link methylationphenotype (~cis-eQTLs) bull linear models and hypothesis testing bull Predict phenotype using methylation
Problem variance due to phenotype probably very small (unless your phenotype is cancer) Needle in a haystack Control for other sources of variance to make the variance due to the phenotype stand out If phenotype is lzheimerrsquos (D) gender incorporates more variance into your M matrix than does AD
57
eWAS
Methylation
Phenotype (Disease)
n n
m=4
50
00
0
p=
10
ldquoEnvironmentrdquo
n
e=1
5
Might have many environmental variables to control for
LM1 AD = β0 + β2(gender) + β3(age) + β4(education) + lt + ε LM2 AD = β0 + β1(mj) + β2(gender) + β3(age) + β4(education) + lt + ε
58
eWAS Need to account for variance due to genotype as well
Methylation
Phenotype (Disease)
n n
m=4
50
00
0
p=
10
ldquoEnvironmentrdquo
n
e=1
5
Genotype
n
g=1
20
00
00
0
59
Role of enhancers vs promoters in lzheimerrsquos disease association
60
Enhancers are hemi-methylated and highly variable
Enhancers show most variable methylation
Promoters show least variable methylation
copy source unknown All rights reserved This content is excluded from our Creative
Commons license For more information see httpocwmiteduhelpfaq-fair-use
bull Highly distinct signatures for promoters vs enhancers
bull Enhancers hemi-methylated Methylation level Methylation level in each person (not bimodal)
61
SNP-associated CpGs in enhancers not promoters
bull Promoter methylation less affected by genetics bull Enhancer methylation highly genotype-driven
TSS flanking Enhancers Repressed
Enric
hmen
t for
meQ
TLs
12
5 Transcribed
Promoters
TxEnh
bull TSS-flanking and repressed regions also genetic62
AD-associated probes in distal enhancers Pe
r st
ate
(O
bs ndash
Exp
)
Tota
l
Enhancers
Promoters
copy source unknown All ri ghts reserved This content is excluded from our Creative
Commons license For more information see httpocwmiteduhelpfaq-fair-use
bull After cleaning with known and inferred covariates
bull Distal and transcribed enhancers enriched
Proximal regulators (promoters) depleted 63
bull 63
ICA covariate correction cleans up enhancer signal
Before
Orange Enrichment of enhancer probes for association with the real phenotype
Grey Enrichment of enhancer probes for a scrambled phenotype
After (After conditioning on 7 surrogate variables discovered with ICA)
Empirical p=006
Empirical plt0001
copy source unknown All rights reserved This content is excluded from our Creative
Commons license For more information see httpocwmiteduhelpfaq-fair-use 64
AD predictive power highest in enhancers
AP
OE
enhancers
methylome
promoters
All SNPs
Top predictive features are bullEnhancer
ethylation
ll me thyl
SS Het
enetics incl APOE)
ausality
ommon athways
m
bull A
bull T
bullG(
bull C
bullCp
copy source unknown All rights reserved This content is excluded from our Creative
Commons license For more information see httpocwmiteduhelpfaq-fair-use65
NRSF
ELK1
All probes ranked by AD assoc P-value
Nonminussignificant pathways Significant pathways
060
065
070
075
AUC using pathway feature selection p= 1922eminus11
AD prediction reveals likely biological pathways
All probes ranked by AD assoc P-value
CTCF
copy source unknown All rights reserved This content is excluded from our Creative
Commons license For more information see httpocwmiteduhelpfaq-fair-use
Enriched regulatory motifs
suggest potential pathway s
HEBTcf12 proliferating neural and progenitor cells
GATA cell growth blood cell development
66TLX1NFIC Neuronal cell fates Mouse AD models 66
Goal Personalized and Predictive Medicine 1 Intro to Epidemiology basis of human disease 2 Genetic Epidemiology
ndash Genetic basis GWAS and screening ndash Interpreting GWAS with functional genomics ndash Calculating functional enrichments for GWAS loci
3 Molecular epidemiology ndash meQTLs Genotype-Epigenome association (cis-trans-) ndash EWAS Epigenome-Disease association
4 Resolving Causality ndash Statistical Mendelian Randomization ndash Application to genotype + methylation in AD
5 Systems Genomics and Epigenomics of disease ndash Beyond single loci polygenic risk prediction models ndash Sub-threshold loci and somatic heterogeneity in cancer
67
67
ins
C E confounders environment
Risk factor causality w instrumental variables If XY are correlated possible scenarios are bull XY bull causes X Y
G Y bull XU Y Xtrument
risk factor outcome To distinguish need effects controlled random experiment
Is risk factor X causing disease Y (or a consequence)
ndash Eg alcohol addiction smoking blood cholesterol fever stress Randomized experiment with and without X feasibility ethics
G randomized experiment (eg random Mendelian inheritance) as only some subjects have genotype
G (iv)must be correlated with Y but only through X ie if X known G gives no additional information about Y
68
bull
bull
bull
68
In silico thought experiment
0 200 400 600 80000
02
04
06
08
10
p=2946466eminus35noi
atylh
etM
Subjects
ADnonAD
0 200 400 600 80000
02
04
06
08
10
p=3847832eminus05
noiat
ylhet
M
Subjects
ADnonAD
Same effect due to Alz but with larger effect due to genotype
CC
Small but significant effect due to Alz
CA
copy source unknown All rights reserved This content is excluded from our Creative
Commons license For more information see httpocwmiteduhelpfaq-fair-use
Hemi-methylation associated with meQTL yields a p-value thatrsquos 30 orders of magnitude lower for the AD phenotype
69
MGE P+ + = GE P+ =
From G include probe-specific terms for cis-meQTLs as well as including trans-meQTLs in all comparisons
VS
Mendelian randomization approach Account for variance due to genotype how much does methylation add
With variability due to genotype and environmental covariates removed the effect due to phenotype should become more prevalent
70
Causality testing
71
Modeling complex Human diseases bull Three possible models
1 Independent Associations
D
MG X
2 Causal Pathway Model
3 Interaction Model
D
G
M
Genotype
DG M
D
MG
72
Methylation
Disease
(1) Independent Associations
D
MG X
bull Association between Factor A and Disease bull Association between Factor B and Disease bull No association between Factor A and Factor B
G Factor A
bull Example 2 independent risk genes X Factor B
Y Disease D 73
(2) Causal Pathway Models
bull Is the a direct link between risk factor (A) and disease (D)
DA
bull Does the risk factorrsquos () effect on disease (D) depend on an intermediate step (B)
DA B
bull To test ndash A is associated with B and D ndash B is associated with D ndash A is not associated with D when controlling for
ndash Note A MUST come before B temporally
B
D
G
X
Factor A
Factor B
Disease D 74
(2) Causal Pathway Models
bull In reality its a little of both rsquos affect on D is partially mediated through B
A DB
bull To test ndash A is associated with B and D ndash B is associated with D ndash The effect size of A on D is decreased when con
ndash Note A MUST come before B temporally
bull Example CR1 effect on cognitive decline
trolling for B
A Factor A Factor B Disease D D
B
75
(3) Interaction Models
bull Factor Brsquos effect on D is different depending on value for factor
B (A = Aa)
B (A = AA)
D
B (A = aa)
bull To test ndash A + B + AB D if estimate for AB is significant then ndash Stratify by levels of A
bull Example
ndash drugrsquos effect is different depending on genotype ndash More to comelt
76
Gene locus reference Published
AD AD NP
BIN1
CD2AP
CD33
rs744373
rs9349407
rs3865444
Seshadri 2010
Naj 2011Hollingsworth 2011
Naj 2011Hollingsworth 2012
16x10-11
86x10-9
16x10-9
0204
0445
0133
0480
0221
0123
ABCA7 rs3764650 Hollingsworth 2010 50x10-21 0747 0187 APOE Any ε4 12x10-13 18x10-23
CLU rs11136000 Lambert 2009Harold 2009 75x10-9 0762 0649 CR1 rs6656401 Lambert 2009 37x10-9 00009 0057
EPHA1 rs11767557 Naj 2011Hollingsworth 2011 60x10-10 0562 0391 MS4A4A rs4938933 Naj 2011 17x10-9 0792 0567 MS4A6A rs610932 Hollingsworth 2010 12x10-16 0534 0820
MTHFD1L rs11754661 Naj 2010 19x10-10 0126 0934 PICALM rs3851179 Harold 2009 19x10-8 0382 0171
Application to 12 AD GWAS loci
77
Tangles
CR1 Causal pathway model
Risk Factors Pathology Clinical Disease
Alzheimerrsquos disease
Genetic CR1
Cognitive Decline
AD specific Neuritic Plaque Neurofibulary
bull CR1 first associated with AD in 2009 bull Original associated variant is in an intron no clear function bull Unclear how CR1 locus influences AD susceptibility mechanistically
bull
Questions ndash Is the effect only on AD ndash Is there a broader effect on cognitive decline ndash Is there an association with AD pathology ndash Does it go through pathology to have an effect of cognitive decline
78
CR1 (rs6656401)
CR1 Pathology
04
045
05
055
06
065
07
075
08
085
Neuritic Plaque Neurofibillary Tangles
TT ATAA (risk allele)
CR1 Global Cognitive Decline
p=00008
p=0008 p=010
Pathology Global Cognitive Decline p lt 00001 time
79
Matt Eaton Phil De Jager
Epigenome
Genetic + Epigenetic variation in lzheimerrsquos
Relate to genotype and AD variation 723 AD patients amp controls Methylation variation in
Genome
meQTL
Phenotype
Classification Epigenome MWAS
1 2
copy source unknown All rights reserved This content isexcluded from our Creative Commons license For moreinformation see httpocwmiteduhelpfaq-fair-use
Methylation gtgt SNPs Estimate causal M roles regression Enhancers gtgt promoters of meQTL effects reduces MD
copy source unknown All rights reserved This content is excluded
from our Creative Commons license For more information see
httpocwmiteduhelpfaq-fair-use 80
Goal Personalized and Predictive Medicine 1 Intro to Epidemiology basis of human disease 2 Genetic Epidemiology
ndash Genetic basis GWAS and screening ndash Interpreting GWAS with functional genomics ndash Calculating functional enrichments for GWAS loci
3 Molecular epidemiology ndash meQTLs Genotype-Epigenome association (cis-trans-) ndash EWAS Epigenome-Disease association
4 Resolving Causality ndash Statistical Mendelian Randomization ndash Application to genotype + methylation in AD
5 Systems Genomics and Epigenomics of disease ndash Beyond single loci polygenic risk prediction models ndash Sub-threshold loci and somatic heterogeneity in cancer
81
Beyond top-scoring hits 1000s of variants of weak effect
cluster in cell type specific enhancers
82
Rank-based functional testing of weak associations
Enrichment peaks at 10000s of SNPs down the rank list even after LD pruning
copy source unknown All rights reserved This content is excluded from our Creative
Commons license For more information see httpocwmiteduhelpfaq-fair-use
bull Rank all SNPs based on GWAS signal strength bull Functional enrichment for cell types and states 83
Weak-effect T1D hits in 50k T-cell enhancers enhancers
CD4+ T-cells
T-cells B-cells
Other cell types
copy source unknown All rights reserved This content is excluded from our Creative
Commons license For more information see httpocwmiteduhelpfaq-fair-use
bull LD-pruning (CEU r2gt2) 50k 41k independ loci 84
Cell type specificity stronger for enhancers enhancers promoters
transcribed
CD4+ T-cells
T-cells B-cells
Other cell types
copy source unknown All rights reserved This content is excluded from our Creative
Commons license For more information see httpocwmiteduhelpfaq-fair-use
bull TB-cells also enriched for promoters transcribed bull Enhancer enrichment much more cell type specific 85
T1DRA-enriched enhancers spread across genome
copy source unknown All rights reserved This content is excluded from our Creative
Commons license For more information see httpocw miteduhelpfaq-fair-use
bull High concentration of loci in MHC high overlapbull Yet many distinct regions 1000s of distinct loci 86
Implications for genetic predisposition polygenic models for risk prediction
87
1
Basic setup of polygenic risk prediction studies Case-control cohort w genotype + phenotype
Training cohort Testing cohort
Selection of SNPs Estimation of effects Ranking
Apply predictor Evaluate accuracy
Apply predictor w estimated confidence
Target cohort genotyped individuals
(no phenotypes)
1
(power matters) (power matters) (power limited to one individual at a time)
2
bull Applications 1 (testing cohort) ndash Understand total heritability captured in common variants
ndash Understand disease ldquoarchitecturerdquo number of SNPs ndash Recognize functional classes associated with weak genetic associations
bull Applications 2 2 (new individuals) ndash Provide health recommendations at the individual level
ndash Prioritize high-risk individuals for subsequent testing at population level 88
How many SNPs to include in model
scor
ec
nige
ly p
ohe
of t
ue
-val
Pct
ed
peex
Dudridge PLoS Genetics 2013 pi0Proportion of markers with no effect Purcell Nature 2009
Schizophrenia risk prediction
lsquoonly 5 matterrsquo
lsquoonly 10 matterrsquo(but still canrsquot tellWhich ones until lsquoall matterrsquo Full rank list)
inclusion threshold copy source unknown All rights reserved This content is excluded from our CreativeCommons license For more information see httpocwmiteduhelpfaq-fair-use
bull It depends on ndash Architecture Fraction of SNPs that are estimated to be functional ndash Power Number of individuals in cohort ie ability to rank correctly It only peaks at 5 (asymp1-pi0) when sufficient power to rank ndash Large fraction of associated markers are hidden within non-significant SNPs
bull
bull For pi0=090 still need to include all SNPs to maximize predictive power 89
Application to pleiotropy and common risk Trait 1 (schizophrenia) Case-control cohort w genotype + phenotype
Selection of SNPs Estimation of effects Ranking
Apply predictor Evaluate accuracy
Trait 2 (bipolar disorder) Case-control cohort w genotype + phenotype
bull Ability to assess common genetic risk Are the highly-ranked SNPs for one study relevant to a different study
Is there a shared genetic architecture between seemingly unrelated traits
irst use showed schizophrenia and bipolar disorder common risk Schizophrenia-ranked SNPs in one cohortlt
lt are predictive of bipolar disorder diagnosis lt but not predictive of unrelated (cardiovascular) traits
ndashndash
bull Fndashndashndash
90
Important pointscaveats for risk prediction bull Always limited by genetic component
ndash Environment random effects play big role for most traits
bull Mendelian=deterministic vs common variants=probic
ndash Only a first screen for individuals at risk
bull Limited by discovery power
ndash Cohort size limits discriminative power and ranking ability
bull Limited by genotyped SNPvs vs all SNPs
ndash Selection pushes fitness-reducing variants to lower freq
ndash Genotyped SNPs selected to be common
bull Even if SNPs are correctly id entified their effects are not
ndash Winnerrsquos curse over-estimate above-threshold true effect
bull Training and testing cohort non-independence
ndash Relatives cryptic relatedness population stratification inflate est 91
91
Goal Personalized and Predictive Medicine 1 Intro to Epidemiology basis of human disease 2 Genetic Epidemiology
ndash Genetic basis GWAS and screening ndash Interpreting GWAS with functional genomics ndash Calculating functional enrichments for GWAS loci
3 Molecular epidemiology ndash meQTLs Genotype-Epigenome association (cis-trans-) ndash EWAS Epigenome-Disease association
4 Resolving Causality ndash Statistical Mendelian Randomization ndash Application to genotype + methylation in AD
5 Systems Genomics and Epigenomics of disease ndash Beyond single loci polygenic risk prediction models ndash Sub-threshold loci and somatic heterogeneity in cancer
92
This talk From loci to mechanisms
Building a reference map of the regulatory genome Enhancers Promoters Transcribed Repressed
Regions Enhancers promoters transcribed repressed Cell types Predict tissues and cell types of epigenomic act ivity Target genes Link variants to their target genes using eQTLs activity Hi-C Nucleotides Regulatory consequence of mutation Conservation PWMs Regulators Upstream regulators whose activity is disrupted by mutation
Application to GWAS hidden heritability and Cancer GWAS CATGCCTG bull 93 top hits non-coding Mechanism Cell type hits CGTGTCTA bull Lie in haplotype blocks Causal variant(s)
lsquoHiddenrsquo CATGCCTG bull Many variants small effects Pathway-level burdenload heritability CGTGTCTA bull Many false positives Prioritize w regulatory annotations
Cancer bull s of function CATGCCTG Los Protein-coding variants convergence mutations CATCCCTG bull Gain of function Regulatory variants heterogeneity
93
Characterizing sub-threshold variants in heart arrhythmia
copy source unknown All rights reservedThiscontent is excluded from our Creative
Commons license For more information see
httpocwmiteduhelpfaq-fair-use
Focus on sub-threshold variants
(eg rs1743292 P=10-42)
Trait QRSQT interval
(1) Large cohorts (2) many known hits (3) well-characterized tissue drivers 94
From Arking D E Pulit S L Crotti L Harst P V Munroe P BKoopmann T T Newton-Cheh C (2014) Genetic associationstudy of QT interval highlights role for calcium myocardial repolarizationNature Genetics Nat Genet 46(8) 826-836 Used with permission
Enhancers overlapping GWAS loci share functional properties
copy source unknown All rights reserved This content is excluded from our CreativeCommons license For more information see httpocwmiteduhelpfaq-fair-use
Train machine learning model to prioritize sub-threshold loci 95
Functional evidence for sub-threshold target genes
Zebrafish phenotypes Human genetics
copy source unknown All rights reserved This content is excluded from our CreativeCommons license For more information see httpocwmiteduhelpfaq-fair-use
Mouse phenotypes 96
Experimental validation of 11 sub-threshold loci
copy source unknown All rights reserved This content is excluded from our CreativeCommons license For more information see httpocwmiteduhelpfaq-fair-use
9 of 11 tested loci show allelic activity chromatin interactions
97
Functional evidence for rs1743292 causality (P=10-42)
Enhancer 4C links to target gene promoters Heart enhancer activity
Motif disruption Allelic DNase in multiple individuals copy source unknown All rights reserved This content is excluded from our CreativeCommons license For more information see httpocwmiteduhelpfaq-fair-use Allelic enha-
ncer activity 98
Target gene impact on heart conduction
Optical voltage mapping
zebrafish embryo hearts voltage-sensitive fluorescent dye
ventricle
atrium
transmembrane voltage (ventricle)
copy source unknown All rights reserved This content is excludedfrom our Creative Commons license For more information seehttpocwmiteduhelpfaq-fair-use
Detection and validation of a new cardiac locus
99
What would we need to discover rs1743292 without epigenomics
rs1743292 Minor allele frequency 0134
Effect size -05773 +- 017 msec With 68900 individuals 128 power to discover at plt5x10-8
bull rs1743292 has similar effect sizes as many genome-wide significant variants
bull Many GWAS variants discovered due to winnerrsquos curse often only have 5-
20 power to discover
bull Combining epigenomics and GWAS can
1 Confirm existing GWAS loci are real
2 Discover new sub-threshold loci with weak effect sizes low power
To reach 80 power to discover rs1743292 at plt5x10-8 we need 146700 individuals
100
Goal Personalized and Predictive Medicine 1 Intro to Epidemiology basis of human disease
enetic Epidemiology Genetic basis GWAS and screening Interpreting GWAS with functional genomics Calculating functional enrichments for GWAS loci
olecular epidemiology meQTLs Genotype-Epigenome association (cis-trans-) EWAS Epigenome-Disease association
esolving Causality Statistical Mendelian Randomization Application to genotype + methylation in AD
ystems Genomics and Epigenomics of disease Beyond single loci polygenic risk prediction models Sub-threshold loci and somatic heterogeneity in cancer
2 Gndash ndash ndash
3 Mndash ndash
4 Rndash ndash
5 Sndash ndash
101
This talk From loci to mechanisms
Building a reference map of the regulatory genome Enhancers Promoters Transcribed Repressed
Regions Enhancers promoters transcribed repressed Cell types Predict tissues and cell types of epigenomic act ivity Target genes Link variants to their target genes using eQTLs activity Hi-C Nucleotides Regulatory consequence of mutation Conservation PWMs Regulators Upstream regulators whose activity is disrupted by mutation
Application to GWAS hidden heritability and Cancer GWAS CATGCCTG bull 93 top hits non-coding Mechanism Cell type hits CGTGTCTA bull Lie in haplotype blocks Causal variant(s)
lsquoHiddenrsquo CATGCCTG bull Many variants small effects Pathway-level burdenload heritability CGTGTCTA bull Many false positives Prioritize w regulatory annotations
Cancer function CATGCCTG bull Loss of Protein-coding variants convergence mutations CATCCCTG bull Gain of function Regulatory variants heterogeneity
102
Regulatory convergence of dispersed driver mutations
copy source unknown All rights reserved This content is excluded from our CreativeCommons license For more information see httpocwmiteduhelpfaq-fair-use
Common mutations in regulatory plexus of each gene Richard Sallari 103
Cancer genes are more likely to be up-regulated
copy source unknown All rights reserved This content is excluded from our CreativeCommons license For more information see httpocwmiteduhelpfaq-fair-use
Richard Sallari 104
Dysregulated genes show dispersed non-coding mutations
copy source unknown All rights reserved This content is excluded from our CreativeCommons license For more information see httpocwmiteduhelpfaq-fair-use
Dysregulated genes are enriched for plexus mutations at all distances Richard Sallari 105
Non-coding mutations enriched in promoters enhancers active in other cell types
copy source unknown All rights reserved This content is excluded from our CreativeCommons license For more information see httpocwmiteduhelpfaq-fair-use
Disruptive mutations in lsquolowrsquo elements are enriched in enhancers and promoters in other tissues
Richard Sallari 106
Statistical model for excess of raresomatic variants
copy source unknown All rights reserved This content is excluded from our CreativeCommons license For more information see httpocwmiteduhelpfaq-fair-use
bullCorrect for region- state- tumor-specific rate variation 107
Convergence in immune signaling mitoch functions
copy source unknown All rights reserved This content is excluded from our CreativeCommons license For more information see httpocwmiteduhelpfaq-fair-use
bullPathway-level convergence hierarchical model 108
Richard Sallari
Non-coding drivers of prostate cancer dysregulation
Regulatory mutations reveal Convergence in immune signaling new cancer driver genes
mitochondrial functions
copy source unknown All rights reserved This content is excluded from our CreativeCommons license For more information see httpocwmiteduhelpfaq-fair-use
Convergence in inositol phosphate metabolism PLCB4 overexpression in PC3 prostate cancer adjacent to PTEN PIK3CA known cancer genes reduces ErkAkt activity synergistic with PTEN
109
Personal genomics tomorrow Already 100000s of complete genomes
bull Health disease quantitative traits ndash Genomics regions disease mechanism drug targets ndash Protein-coding cracking regulatory code variation ndash Single genes systems gene interactions pathways
bull Human ancestry ndash Resolve all of human ancestral relationships ndash Complete history of all migrations selective events ndash Resolve common inheritance vs trait association
bull Whatrsquos missing is the computation ndash New algorithms machine learning dimensionality reduction ndash Individualized treatment from 1000s genes genome ndash Understand missing heritability ndash Reveal co-evolution between geneselements ndash Correct for modulating effects in GWAS
110
Challenge ahead From research to clinic 1 Systematic medical genotyping sequencing
ndash Currently a curiosity future medical practice
2 Systematic medical molecular profiling
ndash Functional genomics in relevant cell types
3 Systematic perturbation studies for validation
ndash 1000s of regulatory predictions x 100s cell types
4 Systematic repurposing of approved drugs
ndash Systems-biology view of drug response
5 Genomics of drug response in cli nical trials
ndash Personalized drug prescription and combinations
6 Partnerships academia industry hospitals
ndash Interdisciplinary training in each of the instituttions 111
Summary Personalized amp Predictive Medicine 1 Intro to Epidemiology basis of human disease 2 Genetic Epidemiology
ndash Genetic basis GWAS and screening ndash Interpreting GWAS with functional genomics ndash Calculating functional enrichments for GWAS loci
3 Molecular epidemiology ndash meQTLs Genotype-Epigenome association (cis-trans-) ndash EWAS Epigenome-Disease association
4 Resolving Causality ndash Statistical Mendelian Randomization ndash Application to genotype + methylation in AD
5 Systems Genomics and Epigenomics of disease ndash Beyond single loci polygenic risk prediction models ndash Sub-threshold loci and somatic heterogeneity in cancer
112
MIT OpenCourseWarehttpocwmitedu
6047 6878 HST507 Computational BiologyFall 2015
For information about citing these materials or our Terms of Use visit httpocwmiteduterms

Goal Personalized and Predictive Medicine 1 Intro to Epidemiology basis of human disease 2 Genetic Epidemiology
ndash Genetic basis GWAS and screening ndash Interpreting GWAS with functional genomics
Calculating functional enrichments for GWAS loci
olecular epidemiology meQTLs Genotype-Epigenome association (cis-trans-) EWAS Epigenome-Disease association
esolving Causality Statistical Mendelian Randomization Application to genotype + methylation in AD
ystems Genomics and Epigenomics of disease Beyond single loci polygenic risk prediction models
ndash 3 M
ndash ndash
4 Rndash ndash
5 Sndash ndash Sub-threshold loci and somatic heterogeneity in cancer
3
DXG
E
effects
causes
genome epigenome biomarkers
environment
disease S
symptoms
syndrome
C confounders
EpidemiologyThe study of the
patterns causes and effects of health and disease conditions
in defined populations
4
Epidemiology Definitions and terms
bullMorbidity level how sick an individual is
bull Incidence of new cases people time period
bullPrevalence Total of cases in population
bullAttributable risk rate in exposed vs not exposed
bull Population burden yrs of potential life lost (YPLL) quality-disability-adjusted life year (QALYDALY)
bullSyndrome Co-occurring signs (observed) symptomes (reported) and other phenomena (often hard to establish causality risk factors)
bullPrevention challenge Determine disease cause understand whether when and how to intervene
5
Determining disease causes study design bull Principles of experimental design
ndash Control comparison to baseline placebo effect
ndash Randomization Difficult to achieve ensure mixing ndash Replication control variability in initial sample
ndash Grouping understand variation between subgroups ndash Orthogonality all combinations of factorstreatments
ndash Combinatorics factorial design n x n x n x lt x n table
bull Challenge of human subjects
ndash Legal and ethical constraints Review boards
ndash Randomization by instrumental variables
ndash Clinical trials blind (patient) double-blind (doctor too)
6
Goal Personalized and Predictive Medicine 1 Intro to Epidemiology basis of human disease 2 Genetic Epidemiology
ndash Genetic basis GWAS and screening ndash Interpreting GWAS with functional genomics ndash Calculating functional enrichments for GWAS loci
3 Molecular epidemiology ndash meQTLs Genotype-Epigenome association (cis-trans-) ndash EWAS Epigenome-Disease association
4 Resolving Causality ndash Statistical Mendelian Randomization ndash Application to genotype + methylation in AD
5 Systems Genomics and Epigenomics of disease ndash Beyond single loci polygenic risk prediction models ndash Sub-threshold loci and somatic heterogeneity in cancer
7
confounders environment
DXG effects
causes
genome epigenome biomarkers
disease S
symptoms
C E
Genetic Epidemiology
Genetic factors contributing to disease
8
Genome-wide association studies (GWAS)
Courtesy of Macmillan Publishers Limited Used with permissionSource Mccarthy M I Abecasis G R Cardon L R Goldstein D B Little J Ioannidis J P amp HirschhornJ N (2008) Genome-wide association studies for complex traits Consensus uncertainty and challenges NatRev Genet Nature Reviews Genetics 9(5) 356-369
bull Iden Risk allele G more frequent in patients A in controls But large regions co-inherited find causal variant Genetics does not specify cell type or process
tify regions that co-vary with the disease
bull bull bull
9
All disease-associated genotypes from GWAS
bull 1000s of studies each with 1000s of individuals ndash Increasing power meta-analyses reveal additional loci ndash More loci expected only fraction of heritability explained
10
Courtesy of Burdett T (EBI) Hall PN (NHGRI) Hastings E (EBI) Hindorff LA (NHGRI) Junkins HA (NHGRI)
Klemm AK (NHGRI) MacArthur J (EBI) Manolio TA (NHGRI) Morales J (EBI) Parkinson H (EBI) and
Welter D (EBI)The NHGRI-EBI Catalog of published genome-wide association studiesAvailable at wwwebiacukgwas Used with Permission
More loci on the way GWAS growth continues
copy source unknown All rights reserved This content is excluded from our CreativeCommons license For more information see httpocwmiteduhelpfaq-fair-use
bull When to design custom chip continuously update bull httpwwwgenomegovadmingwascatalogtxt
11
Decreasing cost of whole-genome sequencing
Image by Wetterstrand KA DNA Sequencing Costs Data from the NHGRI Genome SequencingProgram ( GSP) Available at wwwgenomegovsequencingcosts Image in the public domain
bull Simply genotype all known variants at gt01 freq
bull Or sequence complete diploid genome of everyone 12
Genetic epidemiology What to test bull Family risk alleles inherited with common trait
ndash Specific genes specific variants family history
Monogenic actionable protein-coding mutations ndash Most understood highest impact easiest to interpret All coding SNPs with known disease association
ndash What if not druggable treatable Wantneed know All codingnon-coding associations from GWAS
ndash Thousands of significant associations (1350 on 62012)
All common SNPs regardless of association
ndash HapMap and 1000 Genomes capture common variants
bull
bull
bull
bull
bull Genome all SNPs CNVs rareprivate mutations 13
Predictive medicine When to screen bullDiagnostic testing after symptoms confirm a hypothesis
istinguish between possibilities
redictive risk before symptoms even manifest
ewborn heel pick store for early treatment
re-natal testing ulstrasound maternal serum vs eedles probes chorionic villus sampling
re-conception testing commonrare disorders
arrier testing specific mutation in family history
enetics vs biomarkers cause vs consequence
d
bullP
bullN
bullPn
bullP
bullC
bullG
14
Goal Personalized and Predictive Medicine 1 Intro to Epidemiology basis of human disease
enetic Epidemiology Genetic basis GWAS and screening Interpreting GWAS with functional genomics Calculating functional enrichments for GWAS loci
olecular epidemiology meQTLs Genotype-Epigenome association (cis-trans-) EWAS Epigenome-Disease association
esolving Causality Statistical Mendelian Randomization Application to genotype + methylation in AD
ystems Genomics and Epigenomics of disease Beyond single loci polygenic risk prediction models
2 Gndashndashndash
3 Mndashndash
4 Rndashndash
5 Sndashndash Sub-threshold loci and somatic heterogeneity in cancer
15
Interpreting disease associations Functional genomics of GWAS
16
GWAS CATGACTG CATGCCTG
enotype Disease
mQTLs
Epigenome MWAS
Interpreting disease-association signals
(1) Interpret variants using Epigenomics - Chromatin states Enhancers promoters motifs
- Enrichment in individual loci across 1000s of SNPs in T1D
G
(2) Epigenome changes in disease - Intermediate molecular phenotypes associated with disease
- Variation in brain methylomes of Alzheimerrsquos patients17
Complex disease strong non-coding component
Monogenic Polygenic Complex Mendelian Disease Disease
Coding
Non-coding
Human Genetic Mutation Database Catalog of GWAS studies April 2010 release Hindorff et al PNAS 2009
Slide credit Benjamin Raby 18
Genomic medicine challenge and promises
1 The promise of genetics
ndash Disease mechanism
ndash New target genes
ndash New therapeutics
ndash Personalized medicine
The challenge
ndash 90+ disease hits non-coding
ndash Cell type of action not known
ndash Causal variant not known
ndash Mechanism not known
2
Hillmer Nature Genetics 2008
GWAS simple χ2 statistical test
Courtesy of Macmillan Publishers Limited Used with permission Source Hillmer A M Brockschmidt F F Hanneken S Eigelshoven S Steffens M Flaquer A Noumlthen M M (2008) Susceptibility variants
for male-pattern baldness on chromosome 20p11 Nature Genetics Nat Genet
40(11) 1279-1281 doi101038ng228
19
Genomic medicine challenge and promises 3 The remedy
nnotation of non-coding enome (ENCODERoadmap)
inking of enhancers to egulators and target genes ew methods for utilizing them
The deliverables ndash Relevant cell type ndash Target genes ndash Causal variant ndash Upstream regulator ndash Relevant pathways
ndash Ag
ndash Lr
ndash N
Roadmap Epigenomics Nature 2015 4
ndash Intermediate phenotypes Ernst Nature 2011 20
Courtesy of NIH Roadmap Epigenomics MappingConsortium Used with permission
Courtesy of Macmillan Publishers Limited Used with permissionSource Ernst J et al (2011) Mapping and analysis of chromatinstate dynamics in nine human cell types Nature 473(7345) 43-49
This talk From loci to mechanisms
Building a reference map of the regulatory genome
Regions Enhancers promoters transcribed repressed
Enhancers Promoters Transcribed Repressed
Cell types Predict tissues and cell types of epigenomic act ivity Target genes Link variants to their target genes using eQTLs activity Hi-C Nucleotides Regulatory consequence of mutation Conservation PWMs Regulators Upstream regulators whose activity is disrupted by mutation
Application to GWAS hidden heritability and Cancer GWAS CATGCCTG bull 93 top hits non-coding Mechanism Cell type hits CGTGTCTA bull Lie in haplotype blocks Causal variant(s)
lsquoHiddenrsquo CATGCCTG bull Many variants small effects Pathway-level burdenload heritability CGTGTCTA bull Many false positives Prioritize w regulatory annotations
Cancer CATGCCTG bull Loss of function Protein-coding variants convergence mutations CATCCCTG bull Gain of function Regulatory variants heterogeneity
21
Dissecting non-coding genetic associations
3 Causal nucleotide(s)
2 Target gene(s)
1 Tissuecell type(s)
4 Upstream regulator(s) TF
TF TF
5 Cellular phenotypes 6 Organismal phenotypes
GWAS region SNPs
1 Establish relevant tissuecell type
2 Establish downstream target gene(s)
3 Establishing causal nucleotide variant
4 Establish upstream regulator causality
5 Establish cellular phenotypic consequences
6 Establish organismal phenotypic consequences 22
Using epigenomic maps to predict disease-relevant tissues
23
St
em C
Imm
un
Hea
rtLi
ver
Region of association Individual SNPs
Height Type 1 Diabetes Blood Pressure
Cholesterol
Identifying disease-relevant cell types
ells
e
Stem Cell Immune Heart Liver Enhancers Enhancers Enhancers Enhancers
bull For every trait in the GWAS catalog
ndash Identify all associated regions at P-value threshold
ndash Consider all SNPs in credible interval (R2ge8)
ndash Evaluate overlap with tissue-specific enhancers
ndash Keep tissues showing significant enrichment (Plt0001) Repeat for all traits (rows) and all cell types (columns) bull
24
GWAS hits in enhancers of relevant cell types
25
T cells B cells
Digestive
Brain
ESLiver
Heart
Linking traits to their relevant celltissue types
copy source unknown All rights reserved This content is excluded from our Creative Commons license For more information see httpocwmiteduhelpfaq-fair-use 26
27
Immune activation + neural repression in human + mouse
Courtesy of Macmillan Publishers Limited Used with permissionSource Gjoneska E Pfenning A R Mathys H Quon GKundaje A Tsai L amp Kellis M (2015) Conserved Epigenomic signals inmice and humans reveal immune basis of Alzheimerrsquos disease Nature 518 (7539) 365-369 doi101038nature14252
Sample mouse brain epigenomics during Two contrasting signatures of neurodegeneration immune activation vs neural repression
Is inflammation simply a consequence of neuronal loss 28
Genetic evidence for immune vs neuronal components
Increasing Decreasing (immune) (neuronal)
Courtesy of Macmillan Publishers Limited Used with permission Source Gjoneska E Pfenning A R Mathys H Quon G Kundaje A Tsai L amp Kellis M (2015) Conserved Epigenomic signals in mice and humans reveal immune basis of Alzheimerrsquos disease Nature 518(7539) 365-369 doi101038nature14252
Only increasing (immune) enhancers Neuronal cell types are depleted enriched in AD-associated SNPs for AD-associated SNPs
Indicates immune cell dysregulation is causal component Microglial cells resident immune cells of adult brain Macrophages infiltrate brain in neurodegeneration
29
Using epigenomic annotations for fine-mapping disease regions
30
LD both a blessing amp
a curse
Observation LD blocks in which there is no evidence for historical
copy source unknown All rights reserved This content is excluded from our Creative recombination Commons license For more information see httpocwmiteduhelpfaq-fair-use 31
Causal variant not known in most GWAS regions
Courtesy of Macmillan Publishers Limited Used with permission Source Smemo S Tena J J Kim K Gamazon E R Sakabe N JGoacutemez-Mariacuten C
Noacutebrega M A (2014) Obesity-associated variants within FTO form long-range functional
connections with IRX3 Nature 507(7492) 371-375 doi101038nature13138
copy source unknown All rights reserved This content is excluded from our Creative
Commons license For more information see httpocwmiteduhelpfaq-fair-use
LD (Linkage disequilibrium) large regions co-inherited in blocks Blessing for initial mapping (few tags) curse for fine-mapping
Use functional annotations to predict causal variant(s)32
Multiple lines of evidence for fine-mapping
Courtesy of Macmillan Publishers Limited Used with permission Ward L D amp Kellis M (2012) Interpreting noncoding genetic variation in complex traits and human disease Nat Biotechnol Nature Biotechnology 30(11) 1095-1106 doi101038nbt2422 Used with permission
Ward and Kellis Nature Biotechnology 2012
bull Epigenomic information enhancers amp linking (target genes) bull Motif information causal variants amp upstream regulators bull Evolutionary conservation causal variants amp conserved motifs 33
Detect SNPs that disrupt conserved regulatory motifs
Courtesy of Macmillan Publishers Limited Used with permissionSource Lindblad-Toh Kerstin Manuel Garber Or Zuk Michael F Lin Brian J Parker
Ste fan Washietl Po uya Kh eradpou r et al ldquoA Hi gh-Resolu t ion Map o f Human Ev olutionary
Constraint Using 29 Mammalsrdquo Nature 478 no 7370 (2011) 476ndash82do i101038nature10530
bull Functionally-associated SNPs enriched in states constraint bull Prioritize candidates increase resolution disrupted motifs
34
Allele-specific chromatin marks cis-vs-trans effects
copy source unknown All ri ghts reserved This content i s excluded from our Creative Commons license For more information see httpocwmiteduhelpfaq-fair-use
bull Maternal and paternal GM12878 genomes sequenced bull Map reads to phased genome handle SNPs indels
35bull Correlate activity changes with sequence differences35
Predict effect of common rare somatic mutations
All Regulatory and epigenomic annotations
Raresomatic Predict TF binding disruption
Richard Sallari Common allelic activity in heterozygous lines Xinchen Wang
36
HaploReg public resource for dissecting GWAS
Courtesy of the authors License CC BY-NCSource Ward Lucas D and Manolis Kellis HaploReg a resource for exploring chromatin states conservation and regulatory
motif alterations within sets of genetically linked variants Nucleic Acids Research 40 no D1 (2012) D930-D934
bull Start with any list of SNPs or select a GWA study ndash Mine ENCODE and Roadmap epigenomics data for hits ndash Hundreds of assays dozens of cells conservation motifs ndash Report significant overlaps and link to infobrowser
bull Try it out httpcompbiomiteduHaploReg Ward Kellis NAR 2011 37
37
Predicting target genes
38
Three lines of linking evidence ticPhysical Functional Gene
copy source unknown All ri ghts reserved This content Courtesy of Macmillan Pu blishers Limited Used with permission Ward L D amp Kellis M (2012)
is excluded from our Creative Commons license Interpreting noncoding genetic variation in complex traits and human disease Nat Biotechnol
For more information see httpocwmiteduhelp Nature Biotechnology 30(11) 1095-1106 doi101038nbt2422 Used with permissionfaq-fair-use
Hi-C Physical Enhancer-gene eQTL evidence SNP proximity in 3D activity correlation effect on expression
39
39
Targets 3D folding and expr genetics indicate IRX3+IRX5
Cohort of 20 homozygous risk and 18 homozygous non -risk individuals Genotype-dependent expression
Dixon Nature 2012
Topological domains span 25Mb eQTL targets IRX3 and IRX5
Implicate 8 candidate genes
Risk allele increased expression
(gain-of-function) 404
copy source unknown All rights reserved This content isexcluded from our Creative Commons license For moreinformation see httpocwmiteduhelpfaq-fair-use
copy source unknown All rights reserved This content isexcluded from our Creative Commons license For moreinformation see httpocwmiteduhelpfaq-fair-use
40
Goal Personalized and Predictive Medicine 1 Intro to Epidemiology basis of human disease 2 Genetic Epidemiology
ndash Genetic basis GWAS and screening ndash Interpreting GWAS with functional genomics ndash Calculating functional enrichments for GWAS loci
3 Molecular epidemiology ndash meQTLs Genotype-Epigenome association (cis-trans-) ndash EWAS Epigenome-Disease association
4 Resolving Causality ndash Statistical Mendelian Randomization ndash Application to genotype + methylation in AD
5 Systems Genomics and Epigenomics of disease ndash Beyond single loci polygenic risk prediction models ndash Sub-threshold loci and somatic heterogeneity in cancer
41
Interpreting disease-association signals
(1) Interpret variants using Epigenomics - Chromatin states Enhancers promoters motifs
- Enrichment in individual loci across 1000s of SNPs in T1D
GWAS CATGACTG CATGCCTG
Genotype Disease
mQTLs
Epigenome MWAS
(2) Epigenome changes in disease - Intermediate molecular phenotypes associated with disease
- Variation in brain methylomes of Alzheimerrsquos patients 42
Goal Personalized and Predictive Medicine 1 Intro to Epidemiology basis of human disease
Genetic Epidemiology Genetic basis GWAS and screening Interpreting GWAS with functional genomics Calculating functional enrichments for GWAS loci
Molecular epidemiology meQTLs Genotype-Epigenome association (cis-trans-) EWAS Epigenome-Disease association
Resolving Causality Statistical Mendelian Randomization Application to genotype + methylation in AD
Systems Genomics and Epigenomics of disease Beyond single loci polygenic risk prediction models Sub-threshold loci and somatic heterogeneity in cancer
43
2 ndashndashndash
3 ndashndash
4 ndashndash
5 ndashndash
43
DXG
effects
causes
genome epigenome biomarkers
disease S
symptoms
C Econfounders environment
Molecular EpidemiologyMolecular Biomarkers of disease state
Gene expression DNA methylation chromatin in specific cell types
44
chr2
meQTLminuslinked CpG r^2
meQTL SNP r^2
SNP AAF
Genotype
BRNMIDFRNTL E073
BRNANGGYR E067
BRNANTCAUD E068
BRNCINGGYR E069
BRNHIPPMID E071
BRNINFTMP E072
BRNSUBNIG E074
LIVADLT E066
BLDCD14PC E029
BLDCD4MPC E037
BLDCD4CD25MCD45RANPC E039
LNGIMR90 E017
GISTMCMUS E111
SKINPENFRSKFIB01 E055
MUSTRNKFET E089
BONEOSTEO E129
Genes(+)
Genes(minus)
Mean Methylation
Normalized Methylation
Methylation StdDev
meQTLminuslinked CpG r^2
0
146
293
439
586
241400000 241500000 241600000 241700000 241800000 241900000 242000000 242100000 242200000 2423000003 5
241400000 241500000 241600000 241700000 241800000 241900000 242000000 242100000 242200000 2423000005 3
Genetic and epigenetic data in 750 Alzheimerrsquos patientscontrols MAP Memory and Aging Project
+ ROS Religious Order Study
Dorsolateral PFC
Reference Chromatin
states (Bernstein)
Genotype
(1M SNPs
x700 ind)
(De Jager)
BrainLiver Blood Lung GI Skin Muscle Bone
Methylation
(450k probes
x 700 ind)
(De Jager)
copy source unknown All rights reserved This content is excluded from our CreativeCommons license For more information see httpocwmiteduhelpfaq-fair-use
750 subjects initially cognitively normal Alzheimerrsquos diagnosed by pathology (Bennett) 45
Data Matrices ndash An example scenario n=750 individuals n=750 individuals n=750 individuals n=750 individuals
Genotype
g=1
20
00
00
0
Methylation
m=4
50
00
0
e=1
5 10
ldquoEnvironmentrdquo
p=
Phenotype (Disease)
M - Illumina Methylation 450k array 450000 probes targeting CpGs genome-wide
G - Affy SNP arrays imputed against CEU thousand genomes reference panel yielding 12m SNPs
E - Clinical covariates that might mask the variation due to our phenotype eg gender smoking age or sample batch
P - Phenotype of interest sometimes measured with multiple markers (clinical Alz diagnosis vs pathology Alz diagnosis vs count of neuritic plaques)
n -gt number of individuals in cohort 46
E environment
cause D G M Alzheimer genotype
methylation effects disease 46
EWAS Capturing variability in the Epigenomeattributable to disease
D X
Epigenome DNA methylation Phenotype
lzheimerrsquos Disease
E Environment
Age Education Gender etc
Known variable correction
C Experimental Technical
Cell type mixtures Batch effects Other
Unknown Confounders
Known amp ICA inferred variable
correction
EWAS Hundreds of AD associated loci
enriched in enhancers and relevant
pathways
G meQTL Genotype (~60K
5M Common CpGs) Variants
47
Excluding discovered and known covariates
copy source unknown All ri ghts reserved This content is excluded from our Creative Commons license For more information see httpocwmiteduhelpfaq-fair-use 48
Infer covariates using ICA
compare to known
exclude both
Strongest effects
bull Plate (batch)
bull Cell mixture
bull Bisulfite conversion
bull Gender
bull Age
Variance explained
bull Known 25
bull Inferred 35
bull Together 40
C Econfounders environment
DMG effects
cause
genotype methylation Disease
GenotypeMethylation Discovering mQTLs
Methylation Quantitative Trait Loci
49
cis-meQTLs
M
n=750 n=750 Use linear models to identify cis-meQTLs win some genomic window =4
50
00
0
00
00
00
G
m 12
g=
For methyl mark mi and SNP gj mi = β0 + β1(gj) + ε
bull Given several predictors is additional predictor increasing accuracy more than complexity introduced
bull Likelihood ratio testing paradigm predict methylation with and without genotype (only works for nested models)
bull Null hypothesis H0 β1=0 Additional model complexity rsquot explain a significant portion of variation in response
LM1 mi = β0 + ε LM2 mi = β0 + β1(gj) + ε
r term
2) (q ndash p) ) ( RSSLM2 (n ndash q) ) n-q) degrees of freedom is p-value is what we report in a meQTL study SSLM2 too small vs increase in model complexity
50
doesn
Test using F statistic - p is the number of parameters in LM1 - q is the number of parameters in LM2 - n is the sample size - RSS Residual sum of squares - β parameters to learn ε residual erroUnder null hypothesis ( (RSSLM1 ndash RSSLM
Is distributed as F distribution with (q-p If F statistic significant reject null Th Otherwise no meQTL ie RSSLM1 ndash R
50
cis-meQTLs
M
n n =4
50
00
0
00
00
00
G
m 12
g=
Alternative methods of detection
Permutation bull Correlate methylation and genotype bull For i in 1 -gt nperm
bull Permute genotypes bull Correlate methylation and genotype
bull Generate empirical p-value from permuted correlations
LMM Linear mixed models
bull
bull
51
00 05 10 15 20
02
04
06
Adjusted MA Dosage
Adju
sted
Met
hyla
tion
minus05 05 15
065
075
085
Adjusted MA Dosage
Adju
sted
Met
hyla
tion
minus05 05 15
060
064
068
072
rs17836662 cg10853533 minus44352
Adjusted MA Dosage
Adju
sted
Met
hyla
tion
minus05 05 15
010
020
030
rs7924341 cg20132549 minus1847
Adjusted MA Dosage
Adju
sted
Met
hyla
tion
1 2
3 4
1
2
3 4
Most epigenomic variability is genotype-driven Manhattan plot of 450000 methylation probes
P)
10
log
-(va
lue
-P
Chromosome and genomic position
Genome-wide significance at plt3x10-10
Prune for probes disrupted by SNP
0
bullbull 140000 CpGs associated with genotype at 1 FDR
55000 at Bonferroni-corrected P-value of 10-2
52
copy source unknown All rights reserved This content is excluded from our Creative
Commons license For more information see httpocwmiteduhelpfaq-fair-use
Scaling of discovery power with individuals
copy source unknown All rights reserved This content is excluded from our Creative
Commons license For more information see httpocwmiteduhelpfaq-fair-use
bull Number of meQTLs continues to increase linearly bull Weak-effect meQTLs median R2lt01 after 400 indiv 53
Goal Personalized and Predictive Medicine 1 Intro to Epidemiology basis of human disease 2 Genetic Epidemiology
ndash Genetic basis GWAS and screening ndash Interpreting GWAS with functional genomics ndash Calculating functional enrichments for GWAS loci
3 Molecular epidemiology ndash meQTLs Genotype-Epigenome association (cis-trans-) ndash EWAS Epigenome-Disease association
4 Resolving Causality ndash Statistical Mendelian Randomization ndash Application to genotype + methylation in AD
5 Systems Genomics and Epigenomics of disease ndash Beyond single loci polygenic risk prediction models ndash Sub-threshold loci and somatic heterogeneity in cancer
54
confounders
DMG effects
cause
genotype methylation
environment
Disease
C E
MethylationDisease EWAS
Epigenome-wide association study
55
eWAS
Methylation
n n
10 Phenotype
e= (Disease)
=45
00
00
m
Link methylationphenotype (~cis-eQTLs) linear models and hypothesis testing Predict phenotype using methylation
bullbull
LM1 pi
LM2 p = β0 + β1(m ) + ε = β0 + ε
i j
56
eWAS n n
Methylation
m=4
50
00
0
Phenotype (Disease) p
=1
0
n
ldquoEnvironmentrdquo e=
15
LM1 AD = β0 + β2(gender) + ε LM2 AD = β0 + β1(mj) + β2(gender) ε
Link methylationphenotype (~cis-eQTLs) bull linear models and hypothesis testing bull Predict phenotype using methylation
Problem variance due to phenotype probably very small (unless your phenotype is cancer) Needle in a haystack Control for other sources of variance to make the variance due to the phenotype stand out If phenotype is lzheimerrsquos (D) gender incorporates more variance into your M matrix than does AD
57
eWAS
Methylation
Phenotype (Disease)
n n
m=4
50
00
0
p=
10
ldquoEnvironmentrdquo
n
e=1
5
Might have many environmental variables to control for
LM1 AD = β0 + β2(gender) + β3(age) + β4(education) + lt + ε LM2 AD = β0 + β1(mj) + β2(gender) + β3(age) + β4(education) + lt + ε
58
eWAS Need to account for variance due to genotype as well
Methylation
Phenotype (Disease)
n n
m=4
50
00
0
p=
10
ldquoEnvironmentrdquo
n
e=1
5
Genotype
n
g=1
20
00
00
0
59
Role of enhancers vs promoters in lzheimerrsquos disease association
60
Enhancers are hemi-methylated and highly variable
Enhancers show most variable methylation
Promoters show least variable methylation
copy source unknown All rights reserved This content is excluded from our Creative
Commons license For more information see httpocwmiteduhelpfaq-fair-use
bull Highly distinct signatures for promoters vs enhancers
bull Enhancers hemi-methylated Methylation level Methylation level in each person (not bimodal)
61
SNP-associated CpGs in enhancers not promoters
bull Promoter methylation less affected by genetics bull Enhancer methylation highly genotype-driven
TSS flanking Enhancers Repressed
Enric
hmen
t for
meQ
TLs
12
5 Transcribed
Promoters
TxEnh
bull TSS-flanking and repressed regions also genetic62
AD-associated probes in distal enhancers Pe
r st
ate
(O
bs ndash
Exp
)
Tota
l
Enhancers
Promoters
copy source unknown All ri ghts reserved This content is excluded from our Creative
Commons license For more information see httpocwmiteduhelpfaq-fair-use
bull After cleaning with known and inferred covariates
bull Distal and transcribed enhancers enriched
Proximal regulators (promoters) depleted 63
bull 63
ICA covariate correction cleans up enhancer signal
Before
Orange Enrichment of enhancer probes for association with the real phenotype
Grey Enrichment of enhancer probes for a scrambled phenotype
After (After conditioning on 7 surrogate variables discovered with ICA)
Empirical p=006
Empirical plt0001
copy source unknown All rights reserved This content is excluded from our Creative
Commons license For more information see httpocwmiteduhelpfaq-fair-use 64
AD predictive power highest in enhancers
AP
OE
enhancers
methylome
promoters
All SNPs
Top predictive features are bullEnhancer
ethylation
ll me thyl
SS Het
enetics incl APOE)
ausality
ommon athways
m
bull A
bull T
bullG(
bull C
bullCp
copy source unknown All rights reserved This content is excluded from our Creative
Commons license For more information see httpocwmiteduhelpfaq-fair-use65
NRSF
ELK1
All probes ranked by AD assoc P-value
Nonminussignificant pathways Significant pathways
060
065
070
075
AUC using pathway feature selection p= 1922eminus11
AD prediction reveals likely biological pathways
All probes ranked by AD assoc P-value
CTCF
copy source unknown All rights reserved This content is excluded from our Creative
Commons license For more information see httpocwmiteduhelpfaq-fair-use
Enriched regulatory motifs
suggest potential pathway s
HEBTcf12 proliferating neural and progenitor cells
GATA cell growth blood cell development
66TLX1NFIC Neuronal cell fates Mouse AD models 66
Goal Personalized and Predictive Medicine 1 Intro to Epidemiology basis of human disease 2 Genetic Epidemiology
ndash Genetic basis GWAS and screening ndash Interpreting GWAS with functional genomics ndash Calculating functional enrichments for GWAS loci
3 Molecular epidemiology ndash meQTLs Genotype-Epigenome association (cis-trans-) ndash EWAS Epigenome-Disease association
4 Resolving Causality ndash Statistical Mendelian Randomization ndash Application to genotype + methylation in AD
5 Systems Genomics and Epigenomics of disease ndash Beyond single loci polygenic risk prediction models ndash Sub-threshold loci and somatic heterogeneity in cancer
67
67
ins
C E confounders environment
Risk factor causality w instrumental variables If XY are correlated possible scenarios are bull XY bull causes X Y
G Y bull XU Y Xtrument
risk factor outcome To distinguish need effects controlled random experiment
Is risk factor X causing disease Y (or a consequence)
ndash Eg alcohol addiction smoking blood cholesterol fever stress Randomized experiment with and without X feasibility ethics
G randomized experiment (eg random Mendelian inheritance) as only some subjects have genotype
G (iv)must be correlated with Y but only through X ie if X known G gives no additional information about Y
68
bull
bull
bull
68
In silico thought experiment
0 200 400 600 80000
02
04
06
08
10
p=2946466eminus35noi
atylh
etM
Subjects
ADnonAD
0 200 400 600 80000
02
04
06
08
10
p=3847832eminus05
noiat
ylhet
M
Subjects
ADnonAD
Same effect due to Alz but with larger effect due to genotype
CC
Small but significant effect due to Alz
CA
copy source unknown All rights reserved This content is excluded from our Creative
Commons license For more information see httpocwmiteduhelpfaq-fair-use
Hemi-methylation associated with meQTL yields a p-value thatrsquos 30 orders of magnitude lower for the AD phenotype
69
MGE P+ + = GE P+ =
From G include probe-specific terms for cis-meQTLs as well as including trans-meQTLs in all comparisons
VS
Mendelian randomization approach Account for variance due to genotype how much does methylation add
With variability due to genotype and environmental covariates removed the effect due to phenotype should become more prevalent
70
Causality testing
71
Modeling complex Human diseases bull Three possible models
1 Independent Associations
D
MG X
2 Causal Pathway Model
3 Interaction Model
D
G
M
Genotype
DG M
D
MG
72
Methylation
Disease
(1) Independent Associations
D
MG X
bull Association between Factor A and Disease bull Association between Factor B and Disease bull No association between Factor A and Factor B
G Factor A
bull Example 2 independent risk genes X Factor B
Y Disease D 73
(2) Causal Pathway Models
bull Is the a direct link between risk factor (A) and disease (D)
DA
bull Does the risk factorrsquos () effect on disease (D) depend on an intermediate step (B)
DA B
bull To test ndash A is associated with B and D ndash B is associated with D ndash A is not associated with D when controlling for
ndash Note A MUST come before B temporally
B
D
G
X
Factor A
Factor B
Disease D 74
(2) Causal Pathway Models
bull In reality its a little of both rsquos affect on D is partially mediated through B
A DB
bull To test ndash A is associated with B and D ndash B is associated with D ndash The effect size of A on D is decreased when con
ndash Note A MUST come before B temporally
bull Example CR1 effect on cognitive decline
trolling for B
A Factor A Factor B Disease D D
B
75
(3) Interaction Models
bull Factor Brsquos effect on D is different depending on value for factor
B (A = Aa)
B (A = AA)
D
B (A = aa)
bull To test ndash A + B + AB D if estimate for AB is significant then ndash Stratify by levels of A
bull Example
ndash drugrsquos effect is different depending on genotype ndash More to comelt
76
Gene locus reference Published
AD AD NP
BIN1
CD2AP
CD33
rs744373
rs9349407
rs3865444
Seshadri 2010
Naj 2011Hollingsworth 2011
Naj 2011Hollingsworth 2012
16x10-11
86x10-9
16x10-9
0204
0445
0133
0480
0221
0123
ABCA7 rs3764650 Hollingsworth 2010 50x10-21 0747 0187 APOE Any ε4 12x10-13 18x10-23
CLU rs11136000 Lambert 2009Harold 2009 75x10-9 0762 0649 CR1 rs6656401 Lambert 2009 37x10-9 00009 0057
EPHA1 rs11767557 Naj 2011Hollingsworth 2011 60x10-10 0562 0391 MS4A4A rs4938933 Naj 2011 17x10-9 0792 0567 MS4A6A rs610932 Hollingsworth 2010 12x10-16 0534 0820
MTHFD1L rs11754661 Naj 2010 19x10-10 0126 0934 PICALM rs3851179 Harold 2009 19x10-8 0382 0171
Application to 12 AD GWAS loci
77
Tangles
CR1 Causal pathway model
Risk Factors Pathology Clinical Disease
Alzheimerrsquos disease
Genetic CR1
Cognitive Decline
AD specific Neuritic Plaque Neurofibulary
bull CR1 first associated with AD in 2009 bull Original associated variant is in an intron no clear function bull Unclear how CR1 locus influences AD susceptibility mechanistically
bull
Questions ndash Is the effect only on AD ndash Is there a broader effect on cognitive decline ndash Is there an association with AD pathology ndash Does it go through pathology to have an effect of cognitive decline
78
CR1 (rs6656401)
CR1 Pathology
04
045
05
055
06
065
07
075
08
085
Neuritic Plaque Neurofibillary Tangles
TT ATAA (risk allele)
CR1 Global Cognitive Decline
p=00008
p=0008 p=010
Pathology Global Cognitive Decline p lt 00001 time
79
Matt Eaton Phil De Jager
Epigenome
Genetic + Epigenetic variation in lzheimerrsquos
Relate to genotype and AD variation 723 AD patients amp controls Methylation variation in
Genome
meQTL
Phenotype
Classification Epigenome MWAS
1 2
copy source unknown All rights reserved This content isexcluded from our Creative Commons license For moreinformation see httpocwmiteduhelpfaq-fair-use
Methylation gtgt SNPs Estimate causal M roles regression Enhancers gtgt promoters of meQTL effects reduces MD
copy source unknown All rights reserved This content is excluded
from our Creative Commons license For more information see
httpocwmiteduhelpfaq-fair-use 80
Goal Personalized and Predictive Medicine 1 Intro to Epidemiology basis of human disease 2 Genetic Epidemiology
ndash Genetic basis GWAS and screening ndash Interpreting GWAS with functional genomics ndash Calculating functional enrichments for GWAS loci
3 Molecular epidemiology ndash meQTLs Genotype-Epigenome association (cis-trans-) ndash EWAS Epigenome-Disease association
4 Resolving Causality ndash Statistical Mendelian Randomization ndash Application to genotype + methylation in AD
5 Systems Genomics and Epigenomics of disease ndash Beyond single loci polygenic risk prediction models ndash Sub-threshold loci and somatic heterogeneity in cancer
81
Beyond top-scoring hits 1000s of variants of weak effect
cluster in cell type specific enhancers
82
Rank-based functional testing of weak associations
Enrichment peaks at 10000s of SNPs down the rank list even after LD pruning
copy source unknown All rights reserved This content is excluded from our Creative
Commons license For more information see httpocwmiteduhelpfaq-fair-use
bull Rank all SNPs based on GWAS signal strength bull Functional enrichment for cell types and states 83
Weak-effect T1D hits in 50k T-cell enhancers enhancers
CD4+ T-cells
T-cells B-cells
Other cell types
copy source unknown All rights reserved This content is excluded from our Creative
Commons license For more information see httpocwmiteduhelpfaq-fair-use
bull LD-pruning (CEU r2gt2) 50k 41k independ loci 84
Cell type specificity stronger for enhancers enhancers promoters
transcribed
CD4+ T-cells
T-cells B-cells
Other cell types
copy source unknown All rights reserved This content is excluded from our Creative
Commons license For more information see httpocwmiteduhelpfaq-fair-use
bull TB-cells also enriched for promoters transcribed bull Enhancer enrichment much more cell type specific 85
T1DRA-enriched enhancers spread across genome
copy source unknown All rights reserved This content is excluded from our Creative
Commons license For more information see httpocw miteduhelpfaq-fair-use
bull High concentration of loci in MHC high overlapbull Yet many distinct regions 1000s of distinct loci 86
Implications for genetic predisposition polygenic models for risk prediction
87
1
Basic setup of polygenic risk prediction studies Case-control cohort w genotype + phenotype
Training cohort Testing cohort
Selection of SNPs Estimation of effects Ranking
Apply predictor Evaluate accuracy
Apply predictor w estimated confidence
Target cohort genotyped individuals
(no phenotypes)
1
(power matters) (power matters) (power limited to one individual at a time)
2
bull Applications 1 (testing cohort) ndash Understand total heritability captured in common variants
ndash Understand disease ldquoarchitecturerdquo number of SNPs ndash Recognize functional classes associated with weak genetic associations
bull Applications 2 2 (new individuals) ndash Provide health recommendations at the individual level
ndash Prioritize high-risk individuals for subsequent testing at population level 88
How many SNPs to include in model
scor
ec
nige
ly p
ohe
of t
ue
-val
Pct
ed
peex
Dudridge PLoS Genetics 2013 pi0Proportion of markers with no effect Purcell Nature 2009
Schizophrenia risk prediction
lsquoonly 5 matterrsquo
lsquoonly 10 matterrsquo(but still canrsquot tellWhich ones until lsquoall matterrsquo Full rank list)
inclusion threshold copy source unknown All rights reserved This content is excluded from our CreativeCommons license For more information see httpocwmiteduhelpfaq-fair-use
bull It depends on ndash Architecture Fraction of SNPs that are estimated to be functional ndash Power Number of individuals in cohort ie ability to rank correctly It only peaks at 5 (asymp1-pi0) when sufficient power to rank ndash Large fraction of associated markers are hidden within non-significant SNPs
bull
bull For pi0=090 still need to include all SNPs to maximize predictive power 89
Application to pleiotropy and common risk Trait 1 (schizophrenia) Case-control cohort w genotype + phenotype
Selection of SNPs Estimation of effects Ranking
Apply predictor Evaluate accuracy
Trait 2 (bipolar disorder) Case-control cohort w genotype + phenotype
bull Ability to assess common genetic risk Are the highly-ranked SNPs for one study relevant to a different study
Is there a shared genetic architecture between seemingly unrelated traits
irst use showed schizophrenia and bipolar disorder common risk Schizophrenia-ranked SNPs in one cohortlt
lt are predictive of bipolar disorder diagnosis lt but not predictive of unrelated (cardiovascular) traits
ndashndash
bull Fndashndashndash
90
Important pointscaveats for risk prediction bull Always limited by genetic component
ndash Environment random effects play big role for most traits
bull Mendelian=deterministic vs common variants=probic
ndash Only a first screen for individuals at risk
bull Limited by discovery power
ndash Cohort size limits discriminative power and ranking ability
bull Limited by genotyped SNPvs vs all SNPs
ndash Selection pushes fitness-reducing variants to lower freq
ndash Genotyped SNPs selected to be common
bull Even if SNPs are correctly id entified their effects are not
ndash Winnerrsquos curse over-estimate above-threshold true effect
bull Training and testing cohort non-independence
ndash Relatives cryptic relatedness population stratification inflate est 91
91
Goal Personalized and Predictive Medicine 1 Intro to Epidemiology basis of human disease 2 Genetic Epidemiology
ndash Genetic basis GWAS and screening ndash Interpreting GWAS with functional genomics ndash Calculating functional enrichments for GWAS loci
3 Molecular epidemiology ndash meQTLs Genotype-Epigenome association (cis-trans-) ndash EWAS Epigenome-Disease association
4 Resolving Causality ndash Statistical Mendelian Randomization ndash Application to genotype + methylation in AD
5 Systems Genomics and Epigenomics of disease ndash Beyond single loci polygenic risk prediction models ndash Sub-threshold loci and somatic heterogeneity in cancer
92
This talk From loci to mechanisms
Building a reference map of the regulatory genome Enhancers Promoters Transcribed Repressed
Regions Enhancers promoters transcribed repressed Cell types Predict tissues and cell types of epigenomic act ivity Target genes Link variants to their target genes using eQTLs activity Hi-C Nucleotides Regulatory consequence of mutation Conservation PWMs Regulators Upstream regulators whose activity is disrupted by mutation
Application to GWAS hidden heritability and Cancer GWAS CATGCCTG bull 93 top hits non-coding Mechanism Cell type hits CGTGTCTA bull Lie in haplotype blocks Causal variant(s)
lsquoHiddenrsquo CATGCCTG bull Many variants small effects Pathway-level burdenload heritability CGTGTCTA bull Many false positives Prioritize w regulatory annotations
Cancer bull s of function CATGCCTG Los Protein-coding variants convergence mutations CATCCCTG bull Gain of function Regulatory variants heterogeneity
93
Characterizing sub-threshold variants in heart arrhythmia
copy source unknown All rights reservedThiscontent is excluded from our Creative
Commons license For more information see
httpocwmiteduhelpfaq-fair-use
Focus on sub-threshold variants
(eg rs1743292 P=10-42)
Trait QRSQT interval
(1) Large cohorts (2) many known hits (3) well-characterized tissue drivers 94
From Arking D E Pulit S L Crotti L Harst P V Munroe P BKoopmann T T Newton-Cheh C (2014) Genetic associationstudy of QT interval highlights role for calcium myocardial repolarizationNature Genetics Nat Genet 46(8) 826-836 Used with permission
Enhancers overlapping GWAS loci share functional properties
copy source unknown All rights reserved This content is excluded from our CreativeCommons license For more information see httpocwmiteduhelpfaq-fair-use
Train machine learning model to prioritize sub-threshold loci 95
Functional evidence for sub-threshold target genes
Zebrafish phenotypes Human genetics
copy source unknown All rights reserved This content is excluded from our CreativeCommons license For more information see httpocwmiteduhelpfaq-fair-use
Mouse phenotypes 96
Experimental validation of 11 sub-threshold loci
copy source unknown All rights reserved This content is excluded from our CreativeCommons license For more information see httpocwmiteduhelpfaq-fair-use
9 of 11 tested loci show allelic activity chromatin interactions
97
Functional evidence for rs1743292 causality (P=10-42)
Enhancer 4C links to target gene promoters Heart enhancer activity
Motif disruption Allelic DNase in multiple individuals copy source unknown All rights reserved This content is excluded from our CreativeCommons license For more information see httpocwmiteduhelpfaq-fair-use Allelic enha-
ncer activity 98
Target gene impact on heart conduction
Optical voltage mapping
zebrafish embryo hearts voltage-sensitive fluorescent dye
ventricle
atrium
transmembrane voltage (ventricle)
copy source unknown All rights reserved This content is excludedfrom our Creative Commons license For more information seehttpocwmiteduhelpfaq-fair-use
Detection and validation of a new cardiac locus
99
What would we need to discover rs1743292 without epigenomics
rs1743292 Minor allele frequency 0134
Effect size -05773 +- 017 msec With 68900 individuals 128 power to discover at plt5x10-8
bull rs1743292 has similar effect sizes as many genome-wide significant variants
bull Many GWAS variants discovered due to winnerrsquos curse often only have 5-
20 power to discover
bull Combining epigenomics and GWAS can
1 Confirm existing GWAS loci are real
2 Discover new sub-threshold loci with weak effect sizes low power
To reach 80 power to discover rs1743292 at plt5x10-8 we need 146700 individuals
100
Goal Personalized and Predictive Medicine 1 Intro to Epidemiology basis of human disease
enetic Epidemiology Genetic basis GWAS and screening Interpreting GWAS with functional genomics Calculating functional enrichments for GWAS loci
olecular epidemiology meQTLs Genotype-Epigenome association (cis-trans-) EWAS Epigenome-Disease association
esolving Causality Statistical Mendelian Randomization Application to genotype + methylation in AD
ystems Genomics and Epigenomics of disease Beyond single loci polygenic risk prediction models Sub-threshold loci and somatic heterogeneity in cancer
2 Gndash ndash ndash
3 Mndash ndash
4 Rndash ndash
5 Sndash ndash
101
This talk From loci to mechanisms
Building a reference map of the regulatory genome Enhancers Promoters Transcribed Repressed
Regions Enhancers promoters transcribed repressed Cell types Predict tissues and cell types of epigenomic act ivity Target genes Link variants to their target genes using eQTLs activity Hi-C Nucleotides Regulatory consequence of mutation Conservation PWMs Regulators Upstream regulators whose activity is disrupted by mutation
Application to GWAS hidden heritability and Cancer GWAS CATGCCTG bull 93 top hits non-coding Mechanism Cell type hits CGTGTCTA bull Lie in haplotype blocks Causal variant(s)
lsquoHiddenrsquo CATGCCTG bull Many variants small effects Pathway-level burdenload heritability CGTGTCTA bull Many false positives Prioritize w regulatory annotations
Cancer function CATGCCTG bull Loss of Protein-coding variants convergence mutations CATCCCTG bull Gain of function Regulatory variants heterogeneity
102
Regulatory convergence of dispersed driver mutations
copy source unknown All rights reserved This content is excluded from our CreativeCommons license For more information see httpocwmiteduhelpfaq-fair-use
Common mutations in regulatory plexus of each gene Richard Sallari 103
Cancer genes are more likely to be up-regulated
copy source unknown All rights reserved This content is excluded from our CreativeCommons license For more information see httpocwmiteduhelpfaq-fair-use
Richard Sallari 104
Dysregulated genes show dispersed non-coding mutations
copy source unknown All rights reserved This content is excluded from our CreativeCommons license For more information see httpocwmiteduhelpfaq-fair-use
Dysregulated genes are enriched for plexus mutations at all distances Richard Sallari 105
Non-coding mutations enriched in promoters enhancers active in other cell types
copy source unknown All rights reserved This content is excluded from our CreativeCommons license For more information see httpocwmiteduhelpfaq-fair-use
Disruptive mutations in lsquolowrsquo elements are enriched in enhancers and promoters in other tissues
Richard Sallari 106
Statistical model for excess of raresomatic variants
copy source unknown All rights reserved This content is excluded from our CreativeCommons license For more information see httpocwmiteduhelpfaq-fair-use
bullCorrect for region- state- tumor-specific rate variation 107
Convergence in immune signaling mitoch functions
copy source unknown All rights reserved This content is excluded from our CreativeCommons license For more information see httpocwmiteduhelpfaq-fair-use
bullPathway-level convergence hierarchical model 108
Richard Sallari
Non-coding drivers of prostate cancer dysregulation
Regulatory mutations reveal Convergence in immune signaling new cancer driver genes
mitochondrial functions
copy source unknown All rights reserved This content is excluded from our CreativeCommons license For more information see httpocwmiteduhelpfaq-fair-use
Convergence in inositol phosphate metabolism PLCB4 overexpression in PC3 prostate cancer adjacent to PTEN PIK3CA known cancer genes reduces ErkAkt activity synergistic with PTEN
109
Personal genomics tomorrow Already 100000s of complete genomes
bull Health disease quantitative traits ndash Genomics regions disease mechanism drug targets ndash Protein-coding cracking regulatory code variation ndash Single genes systems gene interactions pathways
bull Human ancestry ndash Resolve all of human ancestral relationships ndash Complete history of all migrations selective events ndash Resolve common inheritance vs trait association
bull Whatrsquos missing is the computation ndash New algorithms machine learning dimensionality reduction ndash Individualized treatment from 1000s genes genome ndash Understand missing heritability ndash Reveal co-evolution between geneselements ndash Correct for modulating effects in GWAS
110
Challenge ahead From research to clinic 1 Systematic medical genotyping sequencing
ndash Currently a curiosity future medical practice
2 Systematic medical molecular profiling
ndash Functional genomics in relevant cell types
3 Systematic perturbation studies for validation
ndash 1000s of regulatory predictions x 100s cell types
4 Systematic repurposing of approved drugs
ndash Systems-biology view of drug response
5 Genomics of drug response in cli nical trials
ndash Personalized drug prescription and combinations
6 Partnerships academia industry hospitals
ndash Interdisciplinary training in each of the instituttions 111
Summary Personalized amp Predictive Medicine 1 Intro to Epidemiology basis of human disease 2 Genetic Epidemiology
ndash Genetic basis GWAS and screening ndash Interpreting GWAS with functional genomics ndash Calculating functional enrichments for GWAS loci
3 Molecular epidemiology ndash meQTLs Genotype-Epigenome association (cis-trans-) ndash EWAS Epigenome-Disease association
4 Resolving Causality ndash Statistical Mendelian Randomization ndash Application to genotype + methylation in AD
5 Systems Genomics and Epigenomics of disease ndash Beyond single loci polygenic risk prediction models ndash Sub-threshold loci and somatic heterogeneity in cancer
112
MIT OpenCourseWarehttpocwmitedu
6047 6878 HST507 Computational BiologyFall 2015
For information about citing these materials or our Terms of Use visit httpocwmiteduterms

DXG
E
effects
causes
genome epigenome biomarkers
environment
disease S
symptoms
syndrome
C confounders
EpidemiologyThe study of the
patterns causes and effects of health and disease conditions
in defined populations
4
Epidemiology Definitions and terms
bullMorbidity level how sick an individual is
bull Incidence of new cases people time period
bullPrevalence Total of cases in population
bullAttributable risk rate in exposed vs not exposed
bull Population burden yrs of potential life lost (YPLL) quality-disability-adjusted life year (QALYDALY)
bullSyndrome Co-occurring signs (observed) symptomes (reported) and other phenomena (often hard to establish causality risk factors)
bullPrevention challenge Determine disease cause understand whether when and how to intervene
5
Determining disease causes study design bull Principles of experimental design
ndash Control comparison to baseline placebo effect
ndash Randomization Difficult to achieve ensure mixing ndash Replication control variability in initial sample
ndash Grouping understand variation between subgroups ndash Orthogonality all combinations of factorstreatments
ndash Combinatorics factorial design n x n x n x lt x n table
bull Challenge of human subjects
ndash Legal and ethical constraints Review boards
ndash Randomization by instrumental variables
ndash Clinical trials blind (patient) double-blind (doctor too)
6
Goal Personalized and Predictive Medicine 1 Intro to Epidemiology basis of human disease 2 Genetic Epidemiology
ndash Genetic basis GWAS and screening ndash Interpreting GWAS with functional genomics ndash Calculating functional enrichments for GWAS loci
3 Molecular epidemiology ndash meQTLs Genotype-Epigenome association (cis-trans-) ndash EWAS Epigenome-Disease association
4 Resolving Causality ndash Statistical Mendelian Randomization ndash Application to genotype + methylation in AD
5 Systems Genomics and Epigenomics of disease ndash Beyond single loci polygenic risk prediction models ndash Sub-threshold loci and somatic heterogeneity in cancer
7
confounders environment
DXG effects
causes
genome epigenome biomarkers
disease S
symptoms
C E
Genetic Epidemiology
Genetic factors contributing to disease
8
Genome-wide association studies (GWAS)
Courtesy of Macmillan Publishers Limited Used with permissionSource Mccarthy M I Abecasis G R Cardon L R Goldstein D B Little J Ioannidis J P amp HirschhornJ N (2008) Genome-wide association studies for complex traits Consensus uncertainty and challenges NatRev Genet Nature Reviews Genetics 9(5) 356-369
bull Iden Risk allele G more frequent in patients A in controls But large regions co-inherited find causal variant Genetics does not specify cell type or process
tify regions that co-vary with the disease
bull bull bull
9
All disease-associated genotypes from GWAS
bull 1000s of studies each with 1000s of individuals ndash Increasing power meta-analyses reveal additional loci ndash More loci expected only fraction of heritability explained
10
Courtesy of Burdett T (EBI) Hall PN (NHGRI) Hastings E (EBI) Hindorff LA (NHGRI) Junkins HA (NHGRI)
Klemm AK (NHGRI) MacArthur J (EBI) Manolio TA (NHGRI) Morales J (EBI) Parkinson H (EBI) and
Welter D (EBI)The NHGRI-EBI Catalog of published genome-wide association studiesAvailable at wwwebiacukgwas Used with Permission
More loci on the way GWAS growth continues
copy source unknown All rights reserved This content is excluded from our CreativeCommons license For more information see httpocwmiteduhelpfaq-fair-use
bull When to design custom chip continuously update bull httpwwwgenomegovadmingwascatalogtxt
11
Decreasing cost of whole-genome sequencing
Image by Wetterstrand KA DNA Sequencing Costs Data from the NHGRI Genome SequencingProgram ( GSP) Available at wwwgenomegovsequencingcosts Image in the public domain
bull Simply genotype all known variants at gt01 freq
bull Or sequence complete diploid genome of everyone 12
Genetic epidemiology What to test bull Family risk alleles inherited with common trait
ndash Specific genes specific variants family history
Monogenic actionable protein-coding mutations ndash Most understood highest impact easiest to interpret All coding SNPs with known disease association
ndash What if not druggable treatable Wantneed know All codingnon-coding associations from GWAS
ndash Thousands of significant associations (1350 on 62012)
All common SNPs regardless of association
ndash HapMap and 1000 Genomes capture common variants
bull
bull
bull
bull
bull Genome all SNPs CNVs rareprivate mutations 13
Predictive medicine When to screen bullDiagnostic testing after symptoms confirm a hypothesis
istinguish between possibilities
redictive risk before symptoms even manifest
ewborn heel pick store for early treatment
re-natal testing ulstrasound maternal serum vs eedles probes chorionic villus sampling
re-conception testing commonrare disorders
arrier testing specific mutation in family history
enetics vs biomarkers cause vs consequence
d
bullP
bullN
bullPn
bullP
bullC
bullG
14
Goal Personalized and Predictive Medicine 1 Intro to Epidemiology basis of human disease
enetic Epidemiology Genetic basis GWAS and screening Interpreting GWAS with functional genomics Calculating functional enrichments for GWAS loci
olecular epidemiology meQTLs Genotype-Epigenome association (cis-trans-) EWAS Epigenome-Disease association
esolving Causality Statistical Mendelian Randomization Application to genotype + methylation in AD
ystems Genomics and Epigenomics of disease Beyond single loci polygenic risk prediction models
2 Gndashndashndash
3 Mndashndash
4 Rndashndash
5 Sndashndash Sub-threshold loci and somatic heterogeneity in cancer
15
Interpreting disease associations Functional genomics of GWAS
16
GWAS CATGACTG CATGCCTG
enotype Disease
mQTLs
Epigenome MWAS
Interpreting disease-association signals
(1) Interpret variants using Epigenomics - Chromatin states Enhancers promoters motifs
- Enrichment in individual loci across 1000s of SNPs in T1D
G
(2) Epigenome changes in disease - Intermediate molecular phenotypes associated with disease
- Variation in brain methylomes of Alzheimerrsquos patients17
Complex disease strong non-coding component
Monogenic Polygenic Complex Mendelian Disease Disease
Coding
Non-coding
Human Genetic Mutation Database Catalog of GWAS studies April 2010 release Hindorff et al PNAS 2009
Slide credit Benjamin Raby 18
Genomic medicine challenge and promises
1 The promise of genetics
ndash Disease mechanism
ndash New target genes
ndash New therapeutics
ndash Personalized medicine
The challenge
ndash 90+ disease hits non-coding
ndash Cell type of action not known
ndash Causal variant not known
ndash Mechanism not known
2
Hillmer Nature Genetics 2008
GWAS simple χ2 statistical test
Courtesy of Macmillan Publishers Limited Used with permission Source Hillmer A M Brockschmidt F F Hanneken S Eigelshoven S Steffens M Flaquer A Noumlthen M M (2008) Susceptibility variants
for male-pattern baldness on chromosome 20p11 Nature Genetics Nat Genet
40(11) 1279-1281 doi101038ng228
19
Genomic medicine challenge and promises 3 The remedy
nnotation of non-coding enome (ENCODERoadmap)
inking of enhancers to egulators and target genes ew methods for utilizing them
The deliverables ndash Relevant cell type ndash Target genes ndash Causal variant ndash Upstream regulator ndash Relevant pathways
ndash Ag
ndash Lr
ndash N
Roadmap Epigenomics Nature 2015 4
ndash Intermediate phenotypes Ernst Nature 2011 20
Courtesy of NIH Roadmap Epigenomics MappingConsortium Used with permission
Courtesy of Macmillan Publishers Limited Used with permissionSource Ernst J et al (2011) Mapping and analysis of chromatinstate dynamics in nine human cell types Nature 473(7345) 43-49
This talk From loci to mechanisms
Building a reference map of the regulatory genome
Regions Enhancers promoters transcribed repressed
Enhancers Promoters Transcribed Repressed
Cell types Predict tissues and cell types of epigenomic act ivity Target genes Link variants to their target genes using eQTLs activity Hi-C Nucleotides Regulatory consequence of mutation Conservation PWMs Regulators Upstream regulators whose activity is disrupted by mutation
Application to GWAS hidden heritability and Cancer GWAS CATGCCTG bull 93 top hits non-coding Mechanism Cell type hits CGTGTCTA bull Lie in haplotype blocks Causal variant(s)
lsquoHiddenrsquo CATGCCTG bull Many variants small effects Pathway-level burdenload heritability CGTGTCTA bull Many false positives Prioritize w regulatory annotations
Cancer CATGCCTG bull Loss of function Protein-coding variants convergence mutations CATCCCTG bull Gain of function Regulatory variants heterogeneity
21
Dissecting non-coding genetic associations
3 Causal nucleotide(s)
2 Target gene(s)
1 Tissuecell type(s)
4 Upstream regulator(s) TF
TF TF
5 Cellular phenotypes 6 Organismal phenotypes
GWAS region SNPs
1 Establish relevant tissuecell type
2 Establish downstream target gene(s)
3 Establishing causal nucleotide variant
4 Establish upstream regulator causality
5 Establish cellular phenotypic consequences
6 Establish organismal phenotypic consequences 22
Using epigenomic maps to predict disease-relevant tissues
23
St
em C
Imm
un
Hea
rtLi
ver
Region of association Individual SNPs
Height Type 1 Diabetes Blood Pressure
Cholesterol
Identifying disease-relevant cell types
ells
e
Stem Cell Immune Heart Liver Enhancers Enhancers Enhancers Enhancers
bull For every trait in the GWAS catalog
ndash Identify all associated regions at P-value threshold
ndash Consider all SNPs in credible interval (R2ge8)
ndash Evaluate overlap with tissue-specific enhancers
ndash Keep tissues showing significant enrichment (Plt0001) Repeat for all traits (rows) and all cell types (columns) bull
24
GWAS hits in enhancers of relevant cell types
25
T cells B cells
Digestive
Brain
ESLiver
Heart
Linking traits to their relevant celltissue types
copy source unknown All rights reserved This content is excluded from our Creative Commons license For more information see httpocwmiteduhelpfaq-fair-use 26
27
Immune activation + neural repression in human + mouse
Courtesy of Macmillan Publishers Limited Used with permissionSource Gjoneska E Pfenning A R Mathys H Quon GKundaje A Tsai L amp Kellis M (2015) Conserved Epigenomic signals inmice and humans reveal immune basis of Alzheimerrsquos disease Nature 518 (7539) 365-369 doi101038nature14252
Sample mouse brain epigenomics during Two contrasting signatures of neurodegeneration immune activation vs neural repression
Is inflammation simply a consequence of neuronal loss 28
Genetic evidence for immune vs neuronal components
Increasing Decreasing (immune) (neuronal)
Courtesy of Macmillan Publishers Limited Used with permission Source Gjoneska E Pfenning A R Mathys H Quon G Kundaje A Tsai L amp Kellis M (2015) Conserved Epigenomic signals in mice and humans reveal immune basis of Alzheimerrsquos disease Nature 518(7539) 365-369 doi101038nature14252
Only increasing (immune) enhancers Neuronal cell types are depleted enriched in AD-associated SNPs for AD-associated SNPs
Indicates immune cell dysregulation is causal component Microglial cells resident immune cells of adult brain Macrophages infiltrate brain in neurodegeneration
29
Using epigenomic annotations for fine-mapping disease regions
30
LD both a blessing amp
a curse
Observation LD blocks in which there is no evidence for historical
copy source unknown All rights reserved This content is excluded from our Creative recombination Commons license For more information see httpocwmiteduhelpfaq-fair-use 31
Causal variant not known in most GWAS regions
Courtesy of Macmillan Publishers Limited Used with permission Source Smemo S Tena J J Kim K Gamazon E R Sakabe N JGoacutemez-Mariacuten C
Noacutebrega M A (2014) Obesity-associated variants within FTO form long-range functional
connections with IRX3 Nature 507(7492) 371-375 doi101038nature13138
copy source unknown All rights reserved This content is excluded from our Creative
Commons license For more information see httpocwmiteduhelpfaq-fair-use
LD (Linkage disequilibrium) large regions co-inherited in blocks Blessing for initial mapping (few tags) curse for fine-mapping
Use functional annotations to predict causal variant(s)32
Multiple lines of evidence for fine-mapping
Courtesy of Macmillan Publishers Limited Used with permission Ward L D amp Kellis M (2012) Interpreting noncoding genetic variation in complex traits and human disease Nat Biotechnol Nature Biotechnology 30(11) 1095-1106 doi101038nbt2422 Used with permission
Ward and Kellis Nature Biotechnology 2012
bull Epigenomic information enhancers amp linking (target genes) bull Motif information causal variants amp upstream regulators bull Evolutionary conservation causal variants amp conserved motifs 33
Detect SNPs that disrupt conserved regulatory motifs
Courtesy of Macmillan Publishers Limited Used with permissionSource Lindblad-Toh Kerstin Manuel Garber Or Zuk Michael F Lin Brian J Parker
Ste fan Washietl Po uya Kh eradpou r et al ldquoA Hi gh-Resolu t ion Map o f Human Ev olutionary
Constraint Using 29 Mammalsrdquo Nature 478 no 7370 (2011) 476ndash82do i101038nature10530
bull Functionally-associated SNPs enriched in states constraint bull Prioritize candidates increase resolution disrupted motifs
34
Allele-specific chromatin marks cis-vs-trans effects
copy source unknown All ri ghts reserved This content i s excluded from our Creative Commons license For more information see httpocwmiteduhelpfaq-fair-use
bull Maternal and paternal GM12878 genomes sequenced bull Map reads to phased genome handle SNPs indels
35bull Correlate activity changes with sequence differences35
Predict effect of common rare somatic mutations
All Regulatory and epigenomic annotations
Raresomatic Predict TF binding disruption
Richard Sallari Common allelic activity in heterozygous lines Xinchen Wang
36
HaploReg public resource for dissecting GWAS
Courtesy of the authors License CC BY-NCSource Ward Lucas D and Manolis Kellis HaploReg a resource for exploring chromatin states conservation and regulatory
motif alterations within sets of genetically linked variants Nucleic Acids Research 40 no D1 (2012) D930-D934
bull Start with any list of SNPs or select a GWA study ndash Mine ENCODE and Roadmap epigenomics data for hits ndash Hundreds of assays dozens of cells conservation motifs ndash Report significant overlaps and link to infobrowser
bull Try it out httpcompbiomiteduHaploReg Ward Kellis NAR 2011 37
37
Predicting target genes
38
Three lines of linking evidence ticPhysical Functional Gene
copy source unknown All ri ghts reserved This content Courtesy of Macmillan Pu blishers Limited Used with permission Ward L D amp Kellis M (2012)
is excluded from our Creative Commons license Interpreting noncoding genetic variation in complex traits and human disease Nat Biotechnol
For more information see httpocwmiteduhelp Nature Biotechnology 30(11) 1095-1106 doi101038nbt2422 Used with permissionfaq-fair-use
Hi-C Physical Enhancer-gene eQTL evidence SNP proximity in 3D activity correlation effect on expression
39
39
Targets 3D folding and expr genetics indicate IRX3+IRX5
Cohort of 20 homozygous risk and 18 homozygous non -risk individuals Genotype-dependent expression
Dixon Nature 2012
Topological domains span 25Mb eQTL targets IRX3 and IRX5
Implicate 8 candidate genes
Risk allele increased expression
(gain-of-function) 404
copy source unknown All rights reserved This content isexcluded from our Creative Commons license For moreinformation see httpocwmiteduhelpfaq-fair-use
copy source unknown All rights reserved This content isexcluded from our Creative Commons license For moreinformation see httpocwmiteduhelpfaq-fair-use
40
Goal Personalized and Predictive Medicine 1 Intro to Epidemiology basis of human disease 2 Genetic Epidemiology
ndash Genetic basis GWAS and screening ndash Interpreting GWAS with functional genomics ndash Calculating functional enrichments for GWAS loci
3 Molecular epidemiology ndash meQTLs Genotype-Epigenome association (cis-trans-) ndash EWAS Epigenome-Disease association
4 Resolving Causality ndash Statistical Mendelian Randomization ndash Application to genotype + methylation in AD
5 Systems Genomics and Epigenomics of disease ndash Beyond single loci polygenic risk prediction models ndash Sub-threshold loci and somatic heterogeneity in cancer
41
Interpreting disease-association signals
(1) Interpret variants using Epigenomics - Chromatin states Enhancers promoters motifs
- Enrichment in individual loci across 1000s of SNPs in T1D
GWAS CATGACTG CATGCCTG
Genotype Disease
mQTLs
Epigenome MWAS
(2) Epigenome changes in disease - Intermediate molecular phenotypes associated with disease
- Variation in brain methylomes of Alzheimerrsquos patients 42
Goal Personalized and Predictive Medicine 1 Intro to Epidemiology basis of human disease
Genetic Epidemiology Genetic basis GWAS and screening Interpreting GWAS with functional genomics Calculating functional enrichments for GWAS loci
Molecular epidemiology meQTLs Genotype-Epigenome association (cis-trans-) EWAS Epigenome-Disease association
Resolving Causality Statistical Mendelian Randomization Application to genotype + methylation in AD
Systems Genomics and Epigenomics of disease Beyond single loci polygenic risk prediction models Sub-threshold loci and somatic heterogeneity in cancer
43
2 ndashndashndash
3 ndashndash
4 ndashndash
5 ndashndash
43
DXG
effects
causes
genome epigenome biomarkers
disease S
symptoms
C Econfounders environment
Molecular EpidemiologyMolecular Biomarkers of disease state
Gene expression DNA methylation chromatin in specific cell types
44
chr2
meQTLminuslinked CpG r^2
meQTL SNP r^2
SNP AAF
Genotype
BRNMIDFRNTL E073
BRNANGGYR E067
BRNANTCAUD E068
BRNCINGGYR E069
BRNHIPPMID E071
BRNINFTMP E072
BRNSUBNIG E074
LIVADLT E066
BLDCD14PC E029
BLDCD4MPC E037
BLDCD4CD25MCD45RANPC E039
LNGIMR90 E017
GISTMCMUS E111
SKINPENFRSKFIB01 E055
MUSTRNKFET E089
BONEOSTEO E129
Genes(+)
Genes(minus)
Mean Methylation
Normalized Methylation
Methylation StdDev
meQTLminuslinked CpG r^2
0
146
293
439
586
241400000 241500000 241600000 241700000 241800000 241900000 242000000 242100000 242200000 2423000003 5
241400000 241500000 241600000 241700000 241800000 241900000 242000000 242100000 242200000 2423000005 3
Genetic and epigenetic data in 750 Alzheimerrsquos patientscontrols MAP Memory and Aging Project
+ ROS Religious Order Study
Dorsolateral PFC
Reference Chromatin
states (Bernstein)
Genotype
(1M SNPs
x700 ind)
(De Jager)
BrainLiver Blood Lung GI Skin Muscle Bone
Methylation
(450k probes
x 700 ind)
(De Jager)
copy source unknown All rights reserved This content is excluded from our CreativeCommons license For more information see httpocwmiteduhelpfaq-fair-use
750 subjects initially cognitively normal Alzheimerrsquos diagnosed by pathology (Bennett) 45
Data Matrices ndash An example scenario n=750 individuals n=750 individuals n=750 individuals n=750 individuals
Genotype
g=1
20
00
00
0
Methylation
m=4
50
00
0
e=1
5 10
ldquoEnvironmentrdquo
p=
Phenotype (Disease)
M - Illumina Methylation 450k array 450000 probes targeting CpGs genome-wide
G - Affy SNP arrays imputed against CEU thousand genomes reference panel yielding 12m SNPs
E - Clinical covariates that might mask the variation due to our phenotype eg gender smoking age or sample batch
P - Phenotype of interest sometimes measured with multiple markers (clinical Alz diagnosis vs pathology Alz diagnosis vs count of neuritic plaques)
n -gt number of individuals in cohort 46
E environment
cause D G M Alzheimer genotype
methylation effects disease 46
EWAS Capturing variability in the Epigenomeattributable to disease
D X
Epigenome DNA methylation Phenotype
lzheimerrsquos Disease
E Environment
Age Education Gender etc
Known variable correction
C Experimental Technical
Cell type mixtures Batch effects Other
Unknown Confounders
Known amp ICA inferred variable
correction
EWAS Hundreds of AD associated loci
enriched in enhancers and relevant
pathways
G meQTL Genotype (~60K
5M Common CpGs) Variants
47
Excluding discovered and known covariates
copy source unknown All ri ghts reserved This content is excluded from our Creative Commons license For more information see httpocwmiteduhelpfaq-fair-use 48
Infer covariates using ICA
compare to known
exclude both
Strongest effects
bull Plate (batch)
bull Cell mixture
bull Bisulfite conversion
bull Gender
bull Age
Variance explained
bull Known 25
bull Inferred 35
bull Together 40
C Econfounders environment
DMG effects
cause
genotype methylation Disease
GenotypeMethylation Discovering mQTLs
Methylation Quantitative Trait Loci
49
cis-meQTLs
M
n=750 n=750 Use linear models to identify cis-meQTLs win some genomic window =4
50
00
0
00
00
00
G
m 12
g=
For methyl mark mi and SNP gj mi = β0 + β1(gj) + ε
bull Given several predictors is additional predictor increasing accuracy more than complexity introduced
bull Likelihood ratio testing paradigm predict methylation with and without genotype (only works for nested models)
bull Null hypothesis H0 β1=0 Additional model complexity rsquot explain a significant portion of variation in response
LM1 mi = β0 + ε LM2 mi = β0 + β1(gj) + ε
r term
2) (q ndash p) ) ( RSSLM2 (n ndash q) ) n-q) degrees of freedom is p-value is what we report in a meQTL study SSLM2 too small vs increase in model complexity
50
doesn
Test using F statistic - p is the number of parameters in LM1 - q is the number of parameters in LM2 - n is the sample size - RSS Residual sum of squares - β parameters to learn ε residual erroUnder null hypothesis ( (RSSLM1 ndash RSSLM
Is distributed as F distribution with (q-p If F statistic significant reject null Th Otherwise no meQTL ie RSSLM1 ndash R
50
cis-meQTLs
M
n n =4
50
00
0
00
00
00
G
m 12
g=
Alternative methods of detection
Permutation bull Correlate methylation and genotype bull For i in 1 -gt nperm
bull Permute genotypes bull Correlate methylation and genotype
bull Generate empirical p-value from permuted correlations
LMM Linear mixed models
bull
bull
51
00 05 10 15 20
02
04
06
Adjusted MA Dosage
Adju
sted
Met
hyla
tion
minus05 05 15
065
075
085
Adjusted MA Dosage
Adju
sted
Met
hyla
tion
minus05 05 15
060
064
068
072
rs17836662 cg10853533 minus44352
Adjusted MA Dosage
Adju
sted
Met
hyla
tion
minus05 05 15
010
020
030
rs7924341 cg20132549 minus1847
Adjusted MA Dosage
Adju
sted
Met
hyla
tion
1 2
3 4
1
2
3 4
Most epigenomic variability is genotype-driven Manhattan plot of 450000 methylation probes
P)
10
log
-(va
lue
-P
Chromosome and genomic position
Genome-wide significance at plt3x10-10
Prune for probes disrupted by SNP
0
bullbull 140000 CpGs associated with genotype at 1 FDR
55000 at Bonferroni-corrected P-value of 10-2
52
copy source unknown All rights reserved This content is excluded from our Creative
Commons license For more information see httpocwmiteduhelpfaq-fair-use
Scaling of discovery power with individuals
copy source unknown All rights reserved This content is excluded from our Creative
Commons license For more information see httpocwmiteduhelpfaq-fair-use
bull Number of meQTLs continues to increase linearly bull Weak-effect meQTLs median R2lt01 after 400 indiv 53
Goal Personalized and Predictive Medicine 1 Intro to Epidemiology basis of human disease 2 Genetic Epidemiology
ndash Genetic basis GWAS and screening ndash Interpreting GWAS with functional genomics ndash Calculating functional enrichments for GWAS loci
3 Molecular epidemiology ndash meQTLs Genotype-Epigenome association (cis-trans-) ndash EWAS Epigenome-Disease association
4 Resolving Causality ndash Statistical Mendelian Randomization ndash Application to genotype + methylation in AD
5 Systems Genomics and Epigenomics of disease ndash Beyond single loci polygenic risk prediction models ndash Sub-threshold loci and somatic heterogeneity in cancer
54
confounders
DMG effects
cause
genotype methylation
environment
Disease
C E
MethylationDisease EWAS
Epigenome-wide association study
55
eWAS
Methylation
n n
10 Phenotype
e= (Disease)
=45
00
00
m
Link methylationphenotype (~cis-eQTLs) linear models and hypothesis testing Predict phenotype using methylation
bullbull
LM1 pi
LM2 p = β0 + β1(m ) + ε = β0 + ε
i j
56
eWAS n n
Methylation
m=4
50
00
0
Phenotype (Disease) p
=1
0
n
ldquoEnvironmentrdquo e=
15
LM1 AD = β0 + β2(gender) + ε LM2 AD = β0 + β1(mj) + β2(gender) ε
Link methylationphenotype (~cis-eQTLs) bull linear models and hypothesis testing bull Predict phenotype using methylation
Problem variance due to phenotype probably very small (unless your phenotype is cancer) Needle in a haystack Control for other sources of variance to make the variance due to the phenotype stand out If phenotype is lzheimerrsquos (D) gender incorporates more variance into your M matrix than does AD
57
eWAS
Methylation
Phenotype (Disease)
n n
m=4
50
00
0
p=
10
ldquoEnvironmentrdquo
n
e=1
5
Might have many environmental variables to control for
LM1 AD = β0 + β2(gender) + β3(age) + β4(education) + lt + ε LM2 AD = β0 + β1(mj) + β2(gender) + β3(age) + β4(education) + lt + ε
58
eWAS Need to account for variance due to genotype as well
Methylation
Phenotype (Disease)
n n
m=4
50
00
0
p=
10
ldquoEnvironmentrdquo
n
e=1
5
Genotype
n
g=1
20
00
00
0
59
Role of enhancers vs promoters in lzheimerrsquos disease association
60
Enhancers are hemi-methylated and highly variable
Enhancers show most variable methylation
Promoters show least variable methylation
copy source unknown All rights reserved This content is excluded from our Creative
Commons license For more information see httpocwmiteduhelpfaq-fair-use
bull Highly distinct signatures for promoters vs enhancers
bull Enhancers hemi-methylated Methylation level Methylation level in each person (not bimodal)
61
SNP-associated CpGs in enhancers not promoters
bull Promoter methylation less affected by genetics bull Enhancer methylation highly genotype-driven
TSS flanking Enhancers Repressed
Enric
hmen
t for
meQ
TLs
12
5 Transcribed
Promoters
TxEnh
bull TSS-flanking and repressed regions also genetic62
AD-associated probes in distal enhancers Pe
r st
ate
(O
bs ndash
Exp
)
Tota
l
Enhancers
Promoters
copy source unknown All ri ghts reserved This content is excluded from our Creative
Commons license For more information see httpocwmiteduhelpfaq-fair-use
bull After cleaning with known and inferred covariates
bull Distal and transcribed enhancers enriched
Proximal regulators (promoters) depleted 63
bull 63
ICA covariate correction cleans up enhancer signal
Before
Orange Enrichment of enhancer probes for association with the real phenotype
Grey Enrichment of enhancer probes for a scrambled phenotype
After (After conditioning on 7 surrogate variables discovered with ICA)
Empirical p=006
Empirical plt0001
copy source unknown All rights reserved This content is excluded from our Creative
Commons license For more information see httpocwmiteduhelpfaq-fair-use 64
AD predictive power highest in enhancers
AP
OE
enhancers
methylome
promoters
All SNPs
Top predictive features are bullEnhancer
ethylation
ll me thyl
SS Het
enetics incl APOE)
ausality
ommon athways
m
bull A
bull T
bullG(
bull C
bullCp
copy source unknown All rights reserved This content is excluded from our Creative
Commons license For more information see httpocwmiteduhelpfaq-fair-use65
NRSF
ELK1
All probes ranked by AD assoc P-value
Nonminussignificant pathways Significant pathways
060
065
070
075
AUC using pathway feature selection p= 1922eminus11
AD prediction reveals likely biological pathways
All probes ranked by AD assoc P-value
CTCF
copy source unknown All rights reserved This content is excluded from our Creative
Commons license For more information see httpocwmiteduhelpfaq-fair-use
Enriched regulatory motifs
suggest potential pathway s
HEBTcf12 proliferating neural and progenitor cells
GATA cell growth blood cell development
66TLX1NFIC Neuronal cell fates Mouse AD models 66
Goal Personalized and Predictive Medicine 1 Intro to Epidemiology basis of human disease 2 Genetic Epidemiology
ndash Genetic basis GWAS and screening ndash Interpreting GWAS with functional genomics ndash Calculating functional enrichments for GWAS loci
3 Molecular epidemiology ndash meQTLs Genotype-Epigenome association (cis-trans-) ndash EWAS Epigenome-Disease association
4 Resolving Causality ndash Statistical Mendelian Randomization ndash Application to genotype + methylation in AD
5 Systems Genomics and Epigenomics of disease ndash Beyond single loci polygenic risk prediction models ndash Sub-threshold loci and somatic heterogeneity in cancer
67
67
ins
C E confounders environment
Risk factor causality w instrumental variables If XY are correlated possible scenarios are bull XY bull causes X Y
G Y bull XU Y Xtrument
risk factor outcome To distinguish need effects controlled random experiment
Is risk factor X causing disease Y (or a consequence)
ndash Eg alcohol addiction smoking blood cholesterol fever stress Randomized experiment with and without X feasibility ethics
G randomized experiment (eg random Mendelian inheritance) as only some subjects have genotype
G (iv)must be correlated with Y but only through X ie if X known G gives no additional information about Y
68
bull
bull
bull
68
In silico thought experiment
0 200 400 600 80000
02
04
06
08
10
p=2946466eminus35noi
atylh
etM
Subjects
ADnonAD
0 200 400 600 80000
02
04
06
08
10
p=3847832eminus05
noiat
ylhet
M
Subjects
ADnonAD
Same effect due to Alz but with larger effect due to genotype
CC
Small but significant effect due to Alz
CA
copy source unknown All rights reserved This content is excluded from our Creative
Commons license For more information see httpocwmiteduhelpfaq-fair-use
Hemi-methylation associated with meQTL yields a p-value thatrsquos 30 orders of magnitude lower for the AD phenotype
69
MGE P+ + = GE P+ =
From G include probe-specific terms for cis-meQTLs as well as including trans-meQTLs in all comparisons
VS
Mendelian randomization approach Account for variance due to genotype how much does methylation add
With variability due to genotype and environmental covariates removed the effect due to phenotype should become more prevalent
70
Causality testing
71
Modeling complex Human diseases bull Three possible models
1 Independent Associations
D
MG X
2 Causal Pathway Model
3 Interaction Model
D
G
M
Genotype
DG M
D
MG
72
Methylation
Disease
(1) Independent Associations
D
MG X
bull Association between Factor A and Disease bull Association between Factor B and Disease bull No association between Factor A and Factor B
G Factor A
bull Example 2 independent risk genes X Factor B
Y Disease D 73
(2) Causal Pathway Models
bull Is the a direct link between risk factor (A) and disease (D)
DA
bull Does the risk factorrsquos () effect on disease (D) depend on an intermediate step (B)
DA B
bull To test ndash A is associated with B and D ndash B is associated with D ndash A is not associated with D when controlling for
ndash Note A MUST come before B temporally
B
D
G
X
Factor A
Factor B
Disease D 74
(2) Causal Pathway Models
bull In reality its a little of both rsquos affect on D is partially mediated through B
A DB
bull To test ndash A is associated with B and D ndash B is associated with D ndash The effect size of A on D is decreased when con
ndash Note A MUST come before B temporally
bull Example CR1 effect on cognitive decline
trolling for B
A Factor A Factor B Disease D D
B
75
(3) Interaction Models
bull Factor Brsquos effect on D is different depending on value for factor
B (A = Aa)
B (A = AA)
D
B (A = aa)
bull To test ndash A + B + AB D if estimate for AB is significant then ndash Stratify by levels of A
bull Example
ndash drugrsquos effect is different depending on genotype ndash More to comelt
76
Gene locus reference Published
AD AD NP
BIN1
CD2AP
CD33
rs744373
rs9349407
rs3865444
Seshadri 2010
Naj 2011Hollingsworth 2011
Naj 2011Hollingsworth 2012
16x10-11
86x10-9
16x10-9
0204
0445
0133
0480
0221
0123
ABCA7 rs3764650 Hollingsworth 2010 50x10-21 0747 0187 APOE Any ε4 12x10-13 18x10-23
CLU rs11136000 Lambert 2009Harold 2009 75x10-9 0762 0649 CR1 rs6656401 Lambert 2009 37x10-9 00009 0057
EPHA1 rs11767557 Naj 2011Hollingsworth 2011 60x10-10 0562 0391 MS4A4A rs4938933 Naj 2011 17x10-9 0792 0567 MS4A6A rs610932 Hollingsworth 2010 12x10-16 0534 0820
MTHFD1L rs11754661 Naj 2010 19x10-10 0126 0934 PICALM rs3851179 Harold 2009 19x10-8 0382 0171
Application to 12 AD GWAS loci
77
Tangles
CR1 Causal pathway model
Risk Factors Pathology Clinical Disease
Alzheimerrsquos disease
Genetic CR1
Cognitive Decline
AD specific Neuritic Plaque Neurofibulary
bull CR1 first associated with AD in 2009 bull Original associated variant is in an intron no clear function bull Unclear how CR1 locus influences AD susceptibility mechanistically
bull
Questions ndash Is the effect only on AD ndash Is there a broader effect on cognitive decline ndash Is there an association with AD pathology ndash Does it go through pathology to have an effect of cognitive decline
78
CR1 (rs6656401)
CR1 Pathology
04
045
05
055
06
065
07
075
08
085
Neuritic Plaque Neurofibillary Tangles
TT ATAA (risk allele)
CR1 Global Cognitive Decline
p=00008
p=0008 p=010
Pathology Global Cognitive Decline p lt 00001 time
79
Matt Eaton Phil De Jager
Epigenome
Genetic + Epigenetic variation in lzheimerrsquos
Relate to genotype and AD variation 723 AD patients amp controls Methylation variation in
Genome
meQTL
Phenotype
Classification Epigenome MWAS
1 2
copy source unknown All rights reserved This content isexcluded from our Creative Commons license For moreinformation see httpocwmiteduhelpfaq-fair-use
Methylation gtgt SNPs Estimate causal M roles regression Enhancers gtgt promoters of meQTL effects reduces MD
copy source unknown All rights reserved This content is excluded
from our Creative Commons license For more information see
httpocwmiteduhelpfaq-fair-use 80
Goal Personalized and Predictive Medicine 1 Intro to Epidemiology basis of human disease 2 Genetic Epidemiology
ndash Genetic basis GWAS and screening ndash Interpreting GWAS with functional genomics ndash Calculating functional enrichments for GWAS loci
3 Molecular epidemiology ndash meQTLs Genotype-Epigenome association (cis-trans-) ndash EWAS Epigenome-Disease association
4 Resolving Causality ndash Statistical Mendelian Randomization ndash Application to genotype + methylation in AD
5 Systems Genomics and Epigenomics of disease ndash Beyond single loci polygenic risk prediction models ndash Sub-threshold loci and somatic heterogeneity in cancer
81
Beyond top-scoring hits 1000s of variants of weak effect
cluster in cell type specific enhancers
82
Rank-based functional testing of weak associations
Enrichment peaks at 10000s of SNPs down the rank list even after LD pruning
copy source unknown All rights reserved This content is excluded from our Creative
Commons license For more information see httpocwmiteduhelpfaq-fair-use
bull Rank all SNPs based on GWAS signal strength bull Functional enrichment for cell types and states 83
Weak-effect T1D hits in 50k T-cell enhancers enhancers
CD4+ T-cells
T-cells B-cells
Other cell types
copy source unknown All rights reserved This content is excluded from our Creative
Commons license For more information see httpocwmiteduhelpfaq-fair-use
bull LD-pruning (CEU r2gt2) 50k 41k independ loci 84
Cell type specificity stronger for enhancers enhancers promoters
transcribed
CD4+ T-cells
T-cells B-cells
Other cell types
copy source unknown All rights reserved This content is excluded from our Creative
Commons license For more information see httpocwmiteduhelpfaq-fair-use
bull TB-cells also enriched for promoters transcribed bull Enhancer enrichment much more cell type specific 85
T1DRA-enriched enhancers spread across genome
copy source unknown All rights reserved This content is excluded from our Creative
Commons license For more information see httpocw miteduhelpfaq-fair-use
bull High concentration of loci in MHC high overlapbull Yet many distinct regions 1000s of distinct loci 86
Implications for genetic predisposition polygenic models for risk prediction
87
1
Basic setup of polygenic risk prediction studies Case-control cohort w genotype + phenotype
Training cohort Testing cohort
Selection of SNPs Estimation of effects Ranking
Apply predictor Evaluate accuracy
Apply predictor w estimated confidence
Target cohort genotyped individuals
(no phenotypes)
1
(power matters) (power matters) (power limited to one individual at a time)
2
bull Applications 1 (testing cohort) ndash Understand total heritability captured in common variants
ndash Understand disease ldquoarchitecturerdquo number of SNPs ndash Recognize functional classes associated with weak genetic associations
bull Applications 2 2 (new individuals) ndash Provide health recommendations at the individual level
ndash Prioritize high-risk individuals for subsequent testing at population level 88
How many SNPs to include in model
scor
ec
nige
ly p
ohe
of t
ue
-val
Pct
ed
peex
Dudridge PLoS Genetics 2013 pi0Proportion of markers with no effect Purcell Nature 2009
Schizophrenia risk prediction
lsquoonly 5 matterrsquo
lsquoonly 10 matterrsquo(but still canrsquot tellWhich ones until lsquoall matterrsquo Full rank list)
inclusion threshold copy source unknown All rights reserved This content is excluded from our CreativeCommons license For more information see httpocwmiteduhelpfaq-fair-use
bull It depends on ndash Architecture Fraction of SNPs that are estimated to be functional ndash Power Number of individuals in cohort ie ability to rank correctly It only peaks at 5 (asymp1-pi0) when sufficient power to rank ndash Large fraction of associated markers are hidden within non-significant SNPs
bull
bull For pi0=090 still need to include all SNPs to maximize predictive power 89
Application to pleiotropy and common risk Trait 1 (schizophrenia) Case-control cohort w genotype + phenotype
Selection of SNPs Estimation of effects Ranking
Apply predictor Evaluate accuracy
Trait 2 (bipolar disorder) Case-control cohort w genotype + phenotype
bull Ability to assess common genetic risk Are the highly-ranked SNPs for one study relevant to a different study
Is there a shared genetic architecture between seemingly unrelated traits
irst use showed schizophrenia and bipolar disorder common risk Schizophrenia-ranked SNPs in one cohortlt
lt are predictive of bipolar disorder diagnosis lt but not predictive of unrelated (cardiovascular) traits
ndashndash
bull Fndashndashndash
90
Important pointscaveats for risk prediction bull Always limited by genetic component
ndash Environment random effects play big role for most traits
bull Mendelian=deterministic vs common variants=probic
ndash Only a first screen for individuals at risk
bull Limited by discovery power
ndash Cohort size limits discriminative power and ranking ability
bull Limited by genotyped SNPvs vs all SNPs
ndash Selection pushes fitness-reducing variants to lower freq
ndash Genotyped SNPs selected to be common
bull Even if SNPs are correctly id entified their effects are not
ndash Winnerrsquos curse over-estimate above-threshold true effect
bull Training and testing cohort non-independence
ndash Relatives cryptic relatedness population stratification inflate est 91
91
Goal Personalized and Predictive Medicine 1 Intro to Epidemiology basis of human disease 2 Genetic Epidemiology
ndash Genetic basis GWAS and screening ndash Interpreting GWAS with functional genomics ndash Calculating functional enrichments for GWAS loci
3 Molecular epidemiology ndash meQTLs Genotype-Epigenome association (cis-trans-) ndash EWAS Epigenome-Disease association
4 Resolving Causality ndash Statistical Mendelian Randomization ndash Application to genotype + methylation in AD
5 Systems Genomics and Epigenomics of disease ndash Beyond single loci polygenic risk prediction models ndash Sub-threshold loci and somatic heterogeneity in cancer
92
This talk From loci to mechanisms
Building a reference map of the regulatory genome Enhancers Promoters Transcribed Repressed
Regions Enhancers promoters transcribed repressed Cell types Predict tissues and cell types of epigenomic act ivity Target genes Link variants to their target genes using eQTLs activity Hi-C Nucleotides Regulatory consequence of mutation Conservation PWMs Regulators Upstream regulators whose activity is disrupted by mutation
Application to GWAS hidden heritability and Cancer GWAS CATGCCTG bull 93 top hits non-coding Mechanism Cell type hits CGTGTCTA bull Lie in haplotype blocks Causal variant(s)
lsquoHiddenrsquo CATGCCTG bull Many variants small effects Pathway-level burdenload heritability CGTGTCTA bull Many false positives Prioritize w regulatory annotations
Cancer bull s of function CATGCCTG Los Protein-coding variants convergence mutations CATCCCTG bull Gain of function Regulatory variants heterogeneity
93
Characterizing sub-threshold variants in heart arrhythmia
copy source unknown All rights reservedThiscontent is excluded from our Creative
Commons license For more information see
httpocwmiteduhelpfaq-fair-use
Focus on sub-threshold variants
(eg rs1743292 P=10-42)
Trait QRSQT interval
(1) Large cohorts (2) many known hits (3) well-characterized tissue drivers 94
From Arking D E Pulit S L Crotti L Harst P V Munroe P BKoopmann T T Newton-Cheh C (2014) Genetic associationstudy of QT interval highlights role for calcium myocardial repolarizationNature Genetics Nat Genet 46(8) 826-836 Used with permission
Enhancers overlapping GWAS loci share functional properties
copy source unknown All rights reserved This content is excluded from our CreativeCommons license For more information see httpocwmiteduhelpfaq-fair-use
Train machine learning model to prioritize sub-threshold loci 95
Functional evidence for sub-threshold target genes
Zebrafish phenotypes Human genetics
copy source unknown All rights reserved This content is excluded from our CreativeCommons license For more information see httpocwmiteduhelpfaq-fair-use
Mouse phenotypes 96
Experimental validation of 11 sub-threshold loci
copy source unknown All rights reserved This content is excluded from our CreativeCommons license For more information see httpocwmiteduhelpfaq-fair-use
9 of 11 tested loci show allelic activity chromatin interactions
97
Functional evidence for rs1743292 causality (P=10-42)
Enhancer 4C links to target gene promoters Heart enhancer activity
Motif disruption Allelic DNase in multiple individuals copy source unknown All rights reserved This content is excluded from our CreativeCommons license For more information see httpocwmiteduhelpfaq-fair-use Allelic enha-
ncer activity 98
Target gene impact on heart conduction
Optical voltage mapping
zebrafish embryo hearts voltage-sensitive fluorescent dye
ventricle
atrium
transmembrane voltage (ventricle)
copy source unknown All rights reserved This content is excludedfrom our Creative Commons license For more information seehttpocwmiteduhelpfaq-fair-use
Detection and validation of a new cardiac locus
99
What would we need to discover rs1743292 without epigenomics
rs1743292 Minor allele frequency 0134
Effect size -05773 +- 017 msec With 68900 individuals 128 power to discover at plt5x10-8
bull rs1743292 has similar effect sizes as many genome-wide significant variants
bull Many GWAS variants discovered due to winnerrsquos curse often only have 5-
20 power to discover
bull Combining epigenomics and GWAS can
1 Confirm existing GWAS loci are real
2 Discover new sub-threshold loci with weak effect sizes low power
To reach 80 power to discover rs1743292 at plt5x10-8 we need 146700 individuals
100
Goal Personalized and Predictive Medicine 1 Intro to Epidemiology basis of human disease
enetic Epidemiology Genetic basis GWAS and screening Interpreting GWAS with functional genomics Calculating functional enrichments for GWAS loci
olecular epidemiology meQTLs Genotype-Epigenome association (cis-trans-) EWAS Epigenome-Disease association
esolving Causality Statistical Mendelian Randomization Application to genotype + methylation in AD
ystems Genomics and Epigenomics of disease Beyond single loci polygenic risk prediction models Sub-threshold loci and somatic heterogeneity in cancer
2 Gndash ndash ndash
3 Mndash ndash
4 Rndash ndash
5 Sndash ndash
101
This talk From loci to mechanisms
Building a reference map of the regulatory genome Enhancers Promoters Transcribed Repressed
Regions Enhancers promoters transcribed repressed Cell types Predict tissues and cell types of epigenomic act ivity Target genes Link variants to their target genes using eQTLs activity Hi-C Nucleotides Regulatory consequence of mutation Conservation PWMs Regulators Upstream regulators whose activity is disrupted by mutation
Application to GWAS hidden heritability and Cancer GWAS CATGCCTG bull 93 top hits non-coding Mechanism Cell type hits CGTGTCTA bull Lie in haplotype blocks Causal variant(s)
lsquoHiddenrsquo CATGCCTG bull Many variants small effects Pathway-level burdenload heritability CGTGTCTA bull Many false positives Prioritize w regulatory annotations
Cancer function CATGCCTG bull Loss of Protein-coding variants convergence mutations CATCCCTG bull Gain of function Regulatory variants heterogeneity
102
Regulatory convergence of dispersed driver mutations
copy source unknown All rights reserved This content is excluded from our CreativeCommons license For more information see httpocwmiteduhelpfaq-fair-use
Common mutations in regulatory plexus of each gene Richard Sallari 103
Cancer genes are more likely to be up-regulated
copy source unknown All rights reserved This content is excluded from our CreativeCommons license For more information see httpocwmiteduhelpfaq-fair-use
Richard Sallari 104
Dysregulated genes show dispersed non-coding mutations
copy source unknown All rights reserved This content is excluded from our CreativeCommons license For more information see httpocwmiteduhelpfaq-fair-use
Dysregulated genes are enriched for plexus mutations at all distances Richard Sallari 105
Non-coding mutations enriched in promoters enhancers active in other cell types
copy source unknown All rights reserved This content is excluded from our CreativeCommons license For more information see httpocwmiteduhelpfaq-fair-use
Disruptive mutations in lsquolowrsquo elements are enriched in enhancers and promoters in other tissues
Richard Sallari 106
Statistical model for excess of raresomatic variants
copy source unknown All rights reserved This content is excluded from our CreativeCommons license For more information see httpocwmiteduhelpfaq-fair-use
bullCorrect for region- state- tumor-specific rate variation 107
Convergence in immune signaling mitoch functions
copy source unknown All rights reserved This content is excluded from our CreativeCommons license For more information see httpocwmiteduhelpfaq-fair-use
bullPathway-level convergence hierarchical model 108
Richard Sallari
Non-coding drivers of prostate cancer dysregulation
Regulatory mutations reveal Convergence in immune signaling new cancer driver genes
mitochondrial functions
copy source unknown All rights reserved This content is excluded from our CreativeCommons license For more information see httpocwmiteduhelpfaq-fair-use
Convergence in inositol phosphate metabolism PLCB4 overexpression in PC3 prostate cancer adjacent to PTEN PIK3CA known cancer genes reduces ErkAkt activity synergistic with PTEN
109
Personal genomics tomorrow Already 100000s of complete genomes
bull Health disease quantitative traits ndash Genomics regions disease mechanism drug targets ndash Protein-coding cracking regulatory code variation ndash Single genes systems gene interactions pathways
bull Human ancestry ndash Resolve all of human ancestral relationships ndash Complete history of all migrations selective events ndash Resolve common inheritance vs trait association
bull Whatrsquos missing is the computation ndash New algorithms machine learning dimensionality reduction ndash Individualized treatment from 1000s genes genome ndash Understand missing heritability ndash Reveal co-evolution between geneselements ndash Correct for modulating effects in GWAS
110
Challenge ahead From research to clinic 1 Systematic medical genotyping sequencing
ndash Currently a curiosity future medical practice
2 Systematic medical molecular profiling
ndash Functional genomics in relevant cell types
3 Systematic perturbation studies for validation
ndash 1000s of regulatory predictions x 100s cell types
4 Systematic repurposing of approved drugs
ndash Systems-biology view of drug response
5 Genomics of drug response in cli nical trials
ndash Personalized drug prescription and combinations
6 Partnerships academia industry hospitals
ndash Interdisciplinary training in each of the instituttions 111
Summary Personalized amp Predictive Medicine 1 Intro to Epidemiology basis of human disease 2 Genetic Epidemiology
ndash Genetic basis GWAS and screening ndash Interpreting GWAS with functional genomics ndash Calculating functional enrichments for GWAS loci
3 Molecular epidemiology ndash meQTLs Genotype-Epigenome association (cis-trans-) ndash EWAS Epigenome-Disease association
4 Resolving Causality ndash Statistical Mendelian Randomization ndash Application to genotype + methylation in AD
5 Systems Genomics and Epigenomics of disease ndash Beyond single loci polygenic risk prediction models ndash Sub-threshold loci and somatic heterogeneity in cancer
112
MIT OpenCourseWarehttpocwmitedu
6047 6878 HST507 Computational BiologyFall 2015
For information about citing these materials or our Terms of Use visit httpocwmiteduterms

Goal Personalized and Predictive Medicine 1 Intro to Epidemiology basis of human disease 2 Genetic Epidemiology
ndash Genetic basis GWAS and screening ndash Interpreting GWAS with functional genomics ndash Calculating functional enrichments for GWAS loci
3 Molecular epidemiology ndash meQTLs Genotype-Epigenome association (cis-trans-) ndash EWAS Epigenome-Disease association
4 Resolving Causality ndash Statistical Mendelian Randomization ndash Application to genotype + methylation in AD
5 Systems Genomics and Epigenomics of disease ndash Beyond single loci polygenic risk prediction models ndash Sub-threshold loci and somatic heterogeneity in cancer
7
confounders environment
DXG effects
causes
genome epigenome biomarkers
disease S
symptoms
C E
Genetic Epidemiology
Genetic factors contributing to disease
8
Genome-wide association studies (GWAS)
Courtesy of Macmillan Publishers Limited Used with permissionSource Mccarthy M I Abecasis G R Cardon L R Goldstein D B Little J Ioannidis J P amp HirschhornJ N (2008) Genome-wide association studies for complex traits Consensus uncertainty and challenges NatRev Genet Nature Reviews Genetics 9(5) 356-369
bull Iden Risk allele G more frequent in patients A in controls But large regions co-inherited find causal variant Genetics does not specify cell type or process
tify regions that co-vary with the disease
bull bull bull
9
All disease-associated genotypes from GWAS
bull 1000s of studies each with 1000s of individuals ndash Increasing power meta-analyses reveal additional loci ndash More loci expected only fraction of heritability explained
10
Courtesy of Burdett T (EBI) Hall PN (NHGRI) Hastings E (EBI) Hindorff LA (NHGRI) Junkins HA (NHGRI)
Klemm AK (NHGRI) MacArthur J (EBI) Manolio TA (NHGRI) Morales J (EBI) Parkinson H (EBI) and
Welter D (EBI)The NHGRI-EBI Catalog of published genome-wide association studiesAvailable at wwwebiacukgwas Used with Permission
More loci on the way GWAS growth continues
copy source unknown All rights reserved This content is excluded from our CreativeCommons license For more information see httpocwmiteduhelpfaq-fair-use
bull When to design custom chip continuously update bull httpwwwgenomegovadmingwascatalogtxt
11
Decreasing cost of whole-genome sequencing
Image by Wetterstrand KA DNA Sequencing Costs Data from the NHGRI Genome SequencingProgram ( GSP) Available at wwwgenomegovsequencingcosts Image in the public domain
bull Simply genotype all known variants at gt01 freq
bull Or sequence complete diploid genome of everyone 12
Genetic epidemiology What to test bull Family risk alleles inherited with common trait
ndash Specific genes specific variants family history
Monogenic actionable protein-coding mutations ndash Most understood highest impact easiest to interpret All coding SNPs with known disease association
ndash What if not druggable treatable Wantneed know All codingnon-coding associations from GWAS
ndash Thousands of significant associations (1350 on 62012)
All common SNPs regardless of association
ndash HapMap and 1000 Genomes capture common variants
bull
bull
bull
bull
bull Genome all SNPs CNVs rareprivate mutations 13
Predictive medicine When to screen bullDiagnostic testing after symptoms confirm a hypothesis
istinguish between possibilities
redictive risk before symptoms even manifest
ewborn heel pick store for early treatment
re-natal testing ulstrasound maternal serum vs eedles probes chorionic villus sampling
re-conception testing commonrare disorders
arrier testing specific mutation in family history
enetics vs biomarkers cause vs consequence
d
bullP
bullN
bullPn
bullP
bullC
bullG
14
Goal Personalized and Predictive Medicine 1 Intro to Epidemiology basis of human disease
enetic Epidemiology Genetic basis GWAS and screening Interpreting GWAS with functional genomics Calculating functional enrichments for GWAS loci
olecular epidemiology meQTLs Genotype-Epigenome association (cis-trans-) EWAS Epigenome-Disease association
esolving Causality Statistical Mendelian Randomization Application to genotype + methylation in AD
ystems Genomics and Epigenomics of disease Beyond single loci polygenic risk prediction models
2 Gndashndashndash
3 Mndashndash
4 Rndashndash
5 Sndashndash Sub-threshold loci and somatic heterogeneity in cancer
15
Interpreting disease associations Functional genomics of GWAS
16
GWAS CATGACTG CATGCCTG
enotype Disease
mQTLs
Epigenome MWAS
Interpreting disease-association signals
(1) Interpret variants using Epigenomics - Chromatin states Enhancers promoters motifs
- Enrichment in individual loci across 1000s of SNPs in T1D
G
(2) Epigenome changes in disease - Intermediate molecular phenotypes associated with disease
- Variation in brain methylomes of Alzheimerrsquos patients17
Complex disease strong non-coding component
Monogenic Polygenic Complex Mendelian Disease Disease
Coding
Non-coding
Human Genetic Mutation Database Catalog of GWAS studies April 2010 release Hindorff et al PNAS 2009
Slide credit Benjamin Raby 18
Genomic medicine challenge and promises
1 The promise of genetics
ndash Disease mechanism
ndash New target genes
ndash New therapeutics
ndash Personalized medicine
The challenge
ndash 90+ disease hits non-coding
ndash Cell type of action not known
ndash Causal variant not known
ndash Mechanism not known
2
Hillmer Nature Genetics 2008
GWAS simple χ2 statistical test
Courtesy of Macmillan Publishers Limited Used with permission Source Hillmer A M Brockschmidt F F Hanneken S Eigelshoven S Steffens M Flaquer A Noumlthen M M (2008) Susceptibility variants
for male-pattern baldness on chromosome 20p11 Nature Genetics Nat Genet
40(11) 1279-1281 doi101038ng228
19
Genomic medicine challenge and promises 3 The remedy
nnotation of non-coding enome (ENCODERoadmap)
inking of enhancers to egulators and target genes ew methods for utilizing them
The deliverables ndash Relevant cell type ndash Target genes ndash Causal variant ndash Upstream regulator ndash Relevant pathways
ndash Ag
ndash Lr
ndash N
Roadmap Epigenomics Nature 2015 4
ndash Intermediate phenotypes Ernst Nature 2011 20
Courtesy of NIH Roadmap Epigenomics MappingConsortium Used with permission
Courtesy of Macmillan Publishers Limited Used with permissionSource Ernst J et al (2011) Mapping and analysis of chromatinstate dynamics in nine human cell types Nature 473(7345) 43-49
This talk From loci to mechanisms
Building a reference map of the regulatory genome
Regions Enhancers promoters transcribed repressed
Enhancers Promoters Transcribed Repressed
Cell types Predict tissues and cell types of epigenomic act ivity Target genes Link variants to their target genes using eQTLs activity Hi-C Nucleotides Regulatory consequence of mutation Conservation PWMs Regulators Upstream regulators whose activity is disrupted by mutation
Application to GWAS hidden heritability and Cancer GWAS CATGCCTG bull 93 top hits non-coding Mechanism Cell type hits CGTGTCTA bull Lie in haplotype blocks Causal variant(s)
lsquoHiddenrsquo CATGCCTG bull Many variants small effects Pathway-level burdenload heritability CGTGTCTA bull Many false positives Prioritize w regulatory annotations
Cancer CATGCCTG bull Loss of function Protein-coding variants convergence mutations CATCCCTG bull Gain of function Regulatory variants heterogeneity
21
Dissecting non-coding genetic associations
3 Causal nucleotide(s)
2 Target gene(s)
1 Tissuecell type(s)
4 Upstream regulator(s) TF
TF TF
5 Cellular phenotypes 6 Organismal phenotypes
GWAS region SNPs
1 Establish relevant tissuecell type
2 Establish downstream target gene(s)
3 Establishing causal nucleotide variant
4 Establish upstream regulator causality
5 Establish cellular phenotypic consequences
6 Establish organismal phenotypic consequences 22
Using epigenomic maps to predict disease-relevant tissues
23
St
em C
Imm
un
Hea
rtLi
ver
Region of association Individual SNPs
Height Type 1 Diabetes Blood Pressure
Cholesterol
Identifying disease-relevant cell types
ells
e
Stem Cell Immune Heart Liver Enhancers Enhancers Enhancers Enhancers
bull For every trait in the GWAS catalog
ndash Identify all associated regions at P-value threshold
ndash Consider all SNPs in credible interval (R2ge8)
ndash Evaluate overlap with tissue-specific enhancers
ndash Keep tissues showing significant enrichment (Plt0001) Repeat for all traits (rows) and all cell types (columns) bull
24
GWAS hits in enhancers of relevant cell types
25
T cells B cells
Digestive
Brain
ESLiver
Heart
Linking traits to their relevant celltissue types
copy source unknown All rights reserved This content is excluded from our Creative Commons license For more information see httpocwmiteduhelpfaq-fair-use 26
27
Immune activation + neural repression in human + mouse
Courtesy of Macmillan Publishers Limited Used with permissionSource Gjoneska E Pfenning A R Mathys H Quon GKundaje A Tsai L amp Kellis M (2015) Conserved Epigenomic signals inmice and humans reveal immune basis of Alzheimerrsquos disease Nature 518 (7539) 365-369 doi101038nature14252
Sample mouse brain epigenomics during Two contrasting signatures of neurodegeneration immune activation vs neural repression
Is inflammation simply a consequence of neuronal loss 28
Genetic evidence for immune vs neuronal components
Increasing Decreasing (immune) (neuronal)
Courtesy of Macmillan Publishers Limited Used with permission Source Gjoneska E Pfenning A R Mathys H Quon G Kundaje A Tsai L amp Kellis M (2015) Conserved Epigenomic signals in mice and humans reveal immune basis of Alzheimerrsquos disease Nature 518(7539) 365-369 doi101038nature14252
Only increasing (immune) enhancers Neuronal cell types are depleted enriched in AD-associated SNPs for AD-associated SNPs
Indicates immune cell dysregulation is causal component Microglial cells resident immune cells of adult brain Macrophages infiltrate brain in neurodegeneration
29
Using epigenomic annotations for fine-mapping disease regions
30
LD both a blessing amp
a curse
Observation LD blocks in which there is no evidence for historical
copy source unknown All rights reserved This content is excluded from our Creative recombination Commons license For more information see httpocwmiteduhelpfaq-fair-use 31
Causal variant not known in most GWAS regions
Courtesy of Macmillan Publishers Limited Used with permission Source Smemo S Tena J J Kim K Gamazon E R Sakabe N JGoacutemez-Mariacuten C
Noacutebrega M A (2014) Obesity-associated variants within FTO form long-range functional
connections with IRX3 Nature 507(7492) 371-375 doi101038nature13138
copy source unknown All rights reserved This content is excluded from our Creative
Commons license For more information see httpocwmiteduhelpfaq-fair-use
LD (Linkage disequilibrium) large regions co-inherited in blocks Blessing for initial mapping (few tags) curse for fine-mapping
Use functional annotations to predict causal variant(s)32
Multiple lines of evidence for fine-mapping
Courtesy of Macmillan Publishers Limited Used with permission Ward L D amp Kellis M (2012) Interpreting noncoding genetic variation in complex traits and human disease Nat Biotechnol Nature Biotechnology 30(11) 1095-1106 doi101038nbt2422 Used with permission
Ward and Kellis Nature Biotechnology 2012
bull Epigenomic information enhancers amp linking (target genes) bull Motif information causal variants amp upstream regulators bull Evolutionary conservation causal variants amp conserved motifs 33
Detect SNPs that disrupt conserved regulatory motifs
Courtesy of Macmillan Publishers Limited Used with permissionSource Lindblad-Toh Kerstin Manuel Garber Or Zuk Michael F Lin Brian J Parker
Ste fan Washietl Po uya Kh eradpou r et al ldquoA Hi gh-Resolu t ion Map o f Human Ev olutionary
Constraint Using 29 Mammalsrdquo Nature 478 no 7370 (2011) 476ndash82do i101038nature10530
bull Functionally-associated SNPs enriched in states constraint bull Prioritize candidates increase resolution disrupted motifs
34
Allele-specific chromatin marks cis-vs-trans effects
copy source unknown All ri ghts reserved This content i s excluded from our Creative Commons license For more information see httpocwmiteduhelpfaq-fair-use
bull Maternal and paternal GM12878 genomes sequenced bull Map reads to phased genome handle SNPs indels
35bull Correlate activity changes with sequence differences35
Predict effect of common rare somatic mutations
All Regulatory and epigenomic annotations
Raresomatic Predict TF binding disruption
Richard Sallari Common allelic activity in heterozygous lines Xinchen Wang
36
HaploReg public resource for dissecting GWAS
Courtesy of the authors License CC BY-NCSource Ward Lucas D and Manolis Kellis HaploReg a resource for exploring chromatin states conservation and regulatory
motif alterations within sets of genetically linked variants Nucleic Acids Research 40 no D1 (2012) D930-D934
bull Start with any list of SNPs or select a GWA study ndash Mine ENCODE and Roadmap epigenomics data for hits ndash Hundreds of assays dozens of cells conservation motifs ndash Report significant overlaps and link to infobrowser
bull Try it out httpcompbiomiteduHaploReg Ward Kellis NAR 2011 37
37
Predicting target genes
38
Three lines of linking evidence ticPhysical Functional Gene
copy source unknown All ri ghts reserved This content Courtesy of Macmillan Pu blishers Limited Used with permission Ward L D amp Kellis M (2012)
is excluded from our Creative Commons license Interpreting noncoding genetic variation in complex traits and human disease Nat Biotechnol
For more information see httpocwmiteduhelp Nature Biotechnology 30(11) 1095-1106 doi101038nbt2422 Used with permissionfaq-fair-use
Hi-C Physical Enhancer-gene eQTL evidence SNP proximity in 3D activity correlation effect on expression
39
39
Targets 3D folding and expr genetics indicate IRX3+IRX5
Cohort of 20 homozygous risk and 18 homozygous non -risk individuals Genotype-dependent expression
Dixon Nature 2012
Topological domains span 25Mb eQTL targets IRX3 and IRX5
Implicate 8 candidate genes
Risk allele increased expression
(gain-of-function) 404
copy source unknown All rights reserved This content isexcluded from our Creative Commons license For moreinformation see httpocwmiteduhelpfaq-fair-use
copy source unknown All rights reserved This content isexcluded from our Creative Commons license For moreinformation see httpocwmiteduhelpfaq-fair-use
40
Goal Personalized and Predictive Medicine 1 Intro to Epidemiology basis of human disease 2 Genetic Epidemiology
ndash Genetic basis GWAS and screening ndash Interpreting GWAS with functional genomics ndash Calculating functional enrichments for GWAS loci
3 Molecular epidemiology ndash meQTLs Genotype-Epigenome association (cis-trans-) ndash EWAS Epigenome-Disease association
4 Resolving Causality ndash Statistical Mendelian Randomization ndash Application to genotype + methylation in AD
5 Systems Genomics and Epigenomics of disease ndash Beyond single loci polygenic risk prediction models ndash Sub-threshold loci and somatic heterogeneity in cancer
41
Interpreting disease-association signals
(1) Interpret variants using Epigenomics - Chromatin states Enhancers promoters motifs
- Enrichment in individual loci across 1000s of SNPs in T1D
GWAS CATGACTG CATGCCTG
Genotype Disease
mQTLs
Epigenome MWAS
(2) Epigenome changes in disease - Intermediate molecular phenotypes associated with disease
- Variation in brain methylomes of Alzheimerrsquos patients 42
Goal Personalized and Predictive Medicine 1 Intro to Epidemiology basis of human disease
Genetic Epidemiology Genetic basis GWAS and screening Interpreting GWAS with functional genomics Calculating functional enrichments for GWAS loci
Molecular epidemiology meQTLs Genotype-Epigenome association (cis-trans-) EWAS Epigenome-Disease association
Resolving Causality Statistical Mendelian Randomization Application to genotype + methylation in AD
Systems Genomics and Epigenomics of disease Beyond single loci polygenic risk prediction models Sub-threshold loci and somatic heterogeneity in cancer
43
2 ndashndashndash
3 ndashndash
4 ndashndash
5 ndashndash
43
DXG
effects
causes
genome epigenome biomarkers
disease S
symptoms
C Econfounders environment
Molecular EpidemiologyMolecular Biomarkers of disease state
Gene expression DNA methylation chromatin in specific cell types
44
chr2
meQTLminuslinked CpG r^2
meQTL SNP r^2
SNP AAF
Genotype
BRNMIDFRNTL E073
BRNANGGYR E067
BRNANTCAUD E068
BRNCINGGYR E069
BRNHIPPMID E071
BRNINFTMP E072
BRNSUBNIG E074
LIVADLT E066
BLDCD14PC E029
BLDCD4MPC E037
BLDCD4CD25MCD45RANPC E039
LNGIMR90 E017
GISTMCMUS E111
SKINPENFRSKFIB01 E055
MUSTRNKFET E089
BONEOSTEO E129
Genes(+)
Genes(minus)
Mean Methylation
Normalized Methylation
Methylation StdDev
meQTLminuslinked CpG r^2
0
146
293
439
586
241400000 241500000 241600000 241700000 241800000 241900000 242000000 242100000 242200000 2423000003 5
241400000 241500000 241600000 241700000 241800000 241900000 242000000 242100000 242200000 2423000005 3
Genetic and epigenetic data in 750 Alzheimerrsquos patientscontrols MAP Memory and Aging Project
+ ROS Religious Order Study
Dorsolateral PFC
Reference Chromatin
states (Bernstein)
Genotype
(1M SNPs
x700 ind)
(De Jager)
BrainLiver Blood Lung GI Skin Muscle Bone
Methylation
(450k probes
x 700 ind)
(De Jager)
copy source unknown All rights reserved This content is excluded from our CreativeCommons license For more information see httpocwmiteduhelpfaq-fair-use
750 subjects initially cognitively normal Alzheimerrsquos diagnosed by pathology (Bennett) 45
Data Matrices ndash An example scenario n=750 individuals n=750 individuals n=750 individuals n=750 individuals
Genotype
g=1
20
00
00
0
Methylation
m=4
50
00
0
e=1
5 10
ldquoEnvironmentrdquo
p=
Phenotype (Disease)
M - Illumina Methylation 450k array 450000 probes targeting CpGs genome-wide
G - Affy SNP arrays imputed against CEU thousand genomes reference panel yielding 12m SNPs
E - Clinical covariates that might mask the variation due to our phenotype eg gender smoking age or sample batch
P - Phenotype of interest sometimes measured with multiple markers (clinical Alz diagnosis vs pathology Alz diagnosis vs count of neuritic plaques)
n -gt number of individuals in cohort 46
E environment
cause D G M Alzheimer genotype
methylation effects disease 46
EWAS Capturing variability in the Epigenomeattributable to disease
D X
Epigenome DNA methylation Phenotype
lzheimerrsquos Disease
E Environment
Age Education Gender etc
Known variable correction
C Experimental Technical
Cell type mixtures Batch effects Other
Unknown Confounders
Known amp ICA inferred variable
correction
EWAS Hundreds of AD associated loci
enriched in enhancers and relevant
pathways
G meQTL Genotype (~60K
5M Common CpGs) Variants
47
Excluding discovered and known covariates
copy source unknown All ri ghts reserved This content is excluded from our Creative Commons license For more information see httpocwmiteduhelpfaq-fair-use 48
Infer covariates using ICA
compare to known
exclude both
Strongest effects
bull Plate (batch)
bull Cell mixture
bull Bisulfite conversion
bull Gender
bull Age
Variance explained
bull Known 25
bull Inferred 35
bull Together 40
C Econfounders environment
DMG effects
cause
genotype methylation Disease
GenotypeMethylation Discovering mQTLs
Methylation Quantitative Trait Loci
49
cis-meQTLs
M
n=750 n=750 Use linear models to identify cis-meQTLs win some genomic window =4
50
00
0
00
00
00
G
m 12
g=
For methyl mark mi and SNP gj mi = β0 + β1(gj) + ε
bull Given several predictors is additional predictor increasing accuracy more than complexity introduced
bull Likelihood ratio testing paradigm predict methylation with and without genotype (only works for nested models)
bull Null hypothesis H0 β1=0 Additional model complexity rsquot explain a significant portion of variation in response
LM1 mi = β0 + ε LM2 mi = β0 + β1(gj) + ε
r term
2) (q ndash p) ) ( RSSLM2 (n ndash q) ) n-q) degrees of freedom is p-value is what we report in a meQTL study SSLM2 too small vs increase in model complexity
50
doesn
Test using F statistic - p is the number of parameters in LM1 - q is the number of parameters in LM2 - n is the sample size - RSS Residual sum of squares - β parameters to learn ε residual erroUnder null hypothesis ( (RSSLM1 ndash RSSLM
Is distributed as F distribution with (q-p If F statistic significant reject null Th Otherwise no meQTL ie RSSLM1 ndash R
50
cis-meQTLs
M
n n =4
50
00
0
00
00
00
G
m 12
g=
Alternative methods of detection
Permutation bull Correlate methylation and genotype bull For i in 1 -gt nperm
bull Permute genotypes bull Correlate methylation and genotype
bull Generate empirical p-value from permuted correlations
LMM Linear mixed models
bull
bull
51
00 05 10 15 20
02
04
06
Adjusted MA Dosage
Adju
sted
Met
hyla
tion
minus05 05 15
065
075
085
Adjusted MA Dosage
Adju
sted
Met
hyla
tion
minus05 05 15
060
064
068
072
rs17836662 cg10853533 minus44352
Adjusted MA Dosage
Adju
sted
Met
hyla
tion
minus05 05 15
010
020
030
rs7924341 cg20132549 minus1847
Adjusted MA Dosage
Adju
sted
Met
hyla
tion
1 2
3 4
1
2
3 4
Most epigenomic variability is genotype-driven Manhattan plot of 450000 methylation probes
P)
10
log
-(va
lue
-P
Chromosome and genomic position
Genome-wide significance at plt3x10-10
Prune for probes disrupted by SNP
0
bullbull 140000 CpGs associated with genotype at 1 FDR
55000 at Bonferroni-corrected P-value of 10-2
52
copy source unknown All rights reserved This content is excluded from our Creative
Commons license For more information see httpocwmiteduhelpfaq-fair-use
Scaling of discovery power with individuals
copy source unknown All rights reserved This content is excluded from our Creative
Commons license For more information see httpocwmiteduhelpfaq-fair-use
bull Number of meQTLs continues to increase linearly bull Weak-effect meQTLs median R2lt01 after 400 indiv 53
Goal Personalized and Predictive Medicine 1 Intro to Epidemiology basis of human disease 2 Genetic Epidemiology
ndash Genetic basis GWAS and screening ndash Interpreting GWAS with functional genomics ndash Calculating functional enrichments for GWAS loci
3 Molecular epidemiology ndash meQTLs Genotype-Epigenome association (cis-trans-) ndash EWAS Epigenome-Disease association
4 Resolving Causality ndash Statistical Mendelian Randomization ndash Application to genotype + methylation in AD
5 Systems Genomics and Epigenomics of disease ndash Beyond single loci polygenic risk prediction models ndash Sub-threshold loci and somatic heterogeneity in cancer
54
confounders
DMG effects
cause
genotype methylation
environment
Disease
C E
MethylationDisease EWAS
Epigenome-wide association study
55
eWAS
Methylation
n n
10 Phenotype
e= (Disease)
=45
00
00
m
Link methylationphenotype (~cis-eQTLs) linear models and hypothesis testing Predict phenotype using methylation
bullbull
LM1 pi
LM2 p = β0 + β1(m ) + ε = β0 + ε
i j
56
eWAS n n
Methylation
m=4
50
00
0
Phenotype (Disease) p
=1
0
n
ldquoEnvironmentrdquo e=
15
LM1 AD = β0 + β2(gender) + ε LM2 AD = β0 + β1(mj) + β2(gender) ε
Link methylationphenotype (~cis-eQTLs) bull linear models and hypothesis testing bull Predict phenotype using methylation
Problem variance due to phenotype probably very small (unless your phenotype is cancer) Needle in a haystack Control for other sources of variance to make the variance due to the phenotype stand out If phenotype is lzheimerrsquos (D) gender incorporates more variance into your M matrix than does AD
57
eWAS
Methylation
Phenotype (Disease)
n n
m=4
50
00
0
p=
10
ldquoEnvironmentrdquo
n
e=1
5
Might have many environmental variables to control for
LM1 AD = β0 + β2(gender) + β3(age) + β4(education) + lt + ε LM2 AD = β0 + β1(mj) + β2(gender) + β3(age) + β4(education) + lt + ε
58
eWAS Need to account for variance due to genotype as well
Methylation
Phenotype (Disease)
n n
m=4
50
00
0
p=
10
ldquoEnvironmentrdquo
n
e=1
5
Genotype
n
g=1
20
00
00
0
59
Role of enhancers vs promoters in lzheimerrsquos disease association
60
Enhancers are hemi-methylated and highly variable
Enhancers show most variable methylation
Promoters show least variable methylation
copy source unknown All rights reserved This content is excluded from our Creative
Commons license For more information see httpocwmiteduhelpfaq-fair-use
bull Highly distinct signatures for promoters vs enhancers
bull Enhancers hemi-methylated Methylation level Methylation level in each person (not bimodal)
61
SNP-associated CpGs in enhancers not promoters
bull Promoter methylation less affected by genetics bull Enhancer methylation highly genotype-driven
TSS flanking Enhancers Repressed
Enric
hmen
t for
meQ
TLs
12
5 Transcribed
Promoters
TxEnh
bull TSS-flanking and repressed regions also genetic62
AD-associated probes in distal enhancers Pe
r st
ate
(O
bs ndash
Exp
)
Tota
l
Enhancers
Promoters
copy source unknown All ri ghts reserved This content is excluded from our Creative
Commons license For more information see httpocwmiteduhelpfaq-fair-use
bull After cleaning with known and inferred covariates
bull Distal and transcribed enhancers enriched
Proximal regulators (promoters) depleted 63
bull 63
ICA covariate correction cleans up enhancer signal
Before
Orange Enrichment of enhancer probes for association with the real phenotype
Grey Enrichment of enhancer probes for a scrambled phenotype
After (After conditioning on 7 surrogate variables discovered with ICA)
Empirical p=006
Empirical plt0001
copy source unknown All rights reserved This content is excluded from our Creative
Commons license For more information see httpocwmiteduhelpfaq-fair-use 64
AD predictive power highest in enhancers
AP
OE
enhancers
methylome
promoters
All SNPs
Top predictive features are bullEnhancer
ethylation
ll me thyl
SS Het
enetics incl APOE)
ausality
ommon athways
m
bull A
bull T
bullG(
bull C
bullCp
copy source unknown All rights reserved This content is excluded from our Creative
Commons license For more information see httpocwmiteduhelpfaq-fair-use65
NRSF
ELK1
All probes ranked by AD assoc P-value
Nonminussignificant pathways Significant pathways
060
065
070
075
AUC using pathway feature selection p= 1922eminus11
AD prediction reveals likely biological pathways
All probes ranked by AD assoc P-value
CTCF
copy source unknown All rights reserved This content is excluded from our Creative
Commons license For more information see httpocwmiteduhelpfaq-fair-use
Enriched regulatory motifs
suggest potential pathway s
HEBTcf12 proliferating neural and progenitor cells
GATA cell growth blood cell development
66TLX1NFIC Neuronal cell fates Mouse AD models 66
Goal Personalized and Predictive Medicine 1 Intro to Epidemiology basis of human disease 2 Genetic Epidemiology
ndash Genetic basis GWAS and screening ndash Interpreting GWAS with functional genomics ndash Calculating functional enrichments for GWAS loci
3 Molecular epidemiology ndash meQTLs Genotype-Epigenome association (cis-trans-) ndash EWAS Epigenome-Disease association
4 Resolving Causality ndash Statistical Mendelian Randomization ndash Application to genotype + methylation in AD
5 Systems Genomics and Epigenomics of disease ndash Beyond single loci polygenic risk prediction models ndash Sub-threshold loci and somatic heterogeneity in cancer
67
67
ins
C E confounders environment
Risk factor causality w instrumental variables If XY are correlated possible scenarios are bull XY bull causes X Y
G Y bull XU Y Xtrument
risk factor outcome To distinguish need effects controlled random experiment
Is risk factor X causing disease Y (or a consequence)
ndash Eg alcohol addiction smoking blood cholesterol fever stress Randomized experiment with and without X feasibility ethics
G randomized experiment (eg random Mendelian inheritance) as only some subjects have genotype
G (iv)must be correlated with Y but only through X ie if X known G gives no additional information about Y
68
bull
bull
bull
68
In silico thought experiment
0 200 400 600 80000
02
04
06
08
10
p=2946466eminus35noi
atylh
etM
Subjects
ADnonAD
0 200 400 600 80000
02
04
06
08
10
p=3847832eminus05
noiat
ylhet
M
Subjects
ADnonAD
Same effect due to Alz but with larger effect due to genotype
CC
Small but significant effect due to Alz
CA
copy source unknown All rights reserved This content is excluded from our Creative
Commons license For more information see httpocwmiteduhelpfaq-fair-use
Hemi-methylation associated with meQTL yields a p-value thatrsquos 30 orders of magnitude lower for the AD phenotype
69
MGE P+ + = GE P+ =
From G include probe-specific terms for cis-meQTLs as well as including trans-meQTLs in all comparisons
VS
Mendelian randomization approach Account for variance due to genotype how much does methylation add
With variability due to genotype and environmental covariates removed the effect due to phenotype should become more prevalent
70
Causality testing
71
Modeling complex Human diseases bull Three possible models
1 Independent Associations
D
MG X
2 Causal Pathway Model
3 Interaction Model
D
G
M
Genotype
DG M
D
MG
72
Methylation
Disease
(1) Independent Associations
D
MG X
bull Association between Factor A and Disease bull Association between Factor B and Disease bull No association between Factor A and Factor B
G Factor A
bull Example 2 independent risk genes X Factor B
Y Disease D 73
(2) Causal Pathway Models
bull Is the a direct link between risk factor (A) and disease (D)
DA
bull Does the risk factorrsquos () effect on disease (D) depend on an intermediate step (B)
DA B
bull To test ndash A is associated with B and D ndash B is associated with D ndash A is not associated with D when controlling for
ndash Note A MUST come before B temporally
B
D
G
X
Factor A
Factor B
Disease D 74
(2) Causal Pathway Models
bull In reality its a little of both rsquos affect on D is partially mediated through B
A DB
bull To test ndash A is associated with B and D ndash B is associated with D ndash The effect size of A on D is decreased when con
ndash Note A MUST come before B temporally
bull Example CR1 effect on cognitive decline
trolling for B
A Factor A Factor B Disease D D
B
75
(3) Interaction Models
bull Factor Brsquos effect on D is different depending on value for factor
B (A = Aa)
B (A = AA)
D
B (A = aa)
bull To test ndash A + B + AB D if estimate for AB is significant then ndash Stratify by levels of A
bull Example
ndash drugrsquos effect is different depending on genotype ndash More to comelt
76
Gene locus reference Published
AD AD NP
BIN1
CD2AP
CD33
rs744373
rs9349407
rs3865444
Seshadri 2010
Naj 2011Hollingsworth 2011
Naj 2011Hollingsworth 2012
16x10-11
86x10-9
16x10-9
0204
0445
0133
0480
0221
0123
ABCA7 rs3764650 Hollingsworth 2010 50x10-21 0747 0187 APOE Any ε4 12x10-13 18x10-23
CLU rs11136000 Lambert 2009Harold 2009 75x10-9 0762 0649 CR1 rs6656401 Lambert 2009 37x10-9 00009 0057
EPHA1 rs11767557 Naj 2011Hollingsworth 2011 60x10-10 0562 0391 MS4A4A rs4938933 Naj 2011 17x10-9 0792 0567 MS4A6A rs610932 Hollingsworth 2010 12x10-16 0534 0820
MTHFD1L rs11754661 Naj 2010 19x10-10 0126 0934 PICALM rs3851179 Harold 2009 19x10-8 0382 0171
Application to 12 AD GWAS loci
77
Tangles
CR1 Causal pathway model
Risk Factors Pathology Clinical Disease
Alzheimerrsquos disease
Genetic CR1
Cognitive Decline
AD specific Neuritic Plaque Neurofibulary
bull CR1 first associated with AD in 2009 bull Original associated variant is in an intron no clear function bull Unclear how CR1 locus influences AD susceptibility mechanistically
bull
Questions ndash Is the effect only on AD ndash Is there a broader effect on cognitive decline ndash Is there an association with AD pathology ndash Does it go through pathology to have an effect of cognitive decline
78
CR1 (rs6656401)
CR1 Pathology
04
045
05
055
06
065
07
075
08
085
Neuritic Plaque Neurofibillary Tangles
TT ATAA (risk allele)
CR1 Global Cognitive Decline
p=00008
p=0008 p=010
Pathology Global Cognitive Decline p lt 00001 time
79
Matt Eaton Phil De Jager
Epigenome
Genetic + Epigenetic variation in lzheimerrsquos
Relate to genotype and AD variation 723 AD patients amp controls Methylation variation in
Genome
meQTL
Phenotype
Classification Epigenome MWAS
1 2
copy source unknown All rights reserved This content isexcluded from our Creative Commons license For moreinformation see httpocwmiteduhelpfaq-fair-use
Methylation gtgt SNPs Estimate causal M roles regression Enhancers gtgt promoters of meQTL effects reduces MD
copy source unknown All rights reserved This content is excluded
from our Creative Commons license For more information see
httpocwmiteduhelpfaq-fair-use 80
Goal Personalized and Predictive Medicine 1 Intro to Epidemiology basis of human disease 2 Genetic Epidemiology
ndash Genetic basis GWAS and screening ndash Interpreting GWAS with functional genomics ndash Calculating functional enrichments for GWAS loci
3 Molecular epidemiology ndash meQTLs Genotype-Epigenome association (cis-trans-) ndash EWAS Epigenome-Disease association
4 Resolving Causality ndash Statistical Mendelian Randomization ndash Application to genotype + methylation in AD
5 Systems Genomics and Epigenomics of disease ndash Beyond single loci polygenic risk prediction models ndash Sub-threshold loci and somatic heterogeneity in cancer
81
Beyond top-scoring hits 1000s of variants of weak effect
cluster in cell type specific enhancers
82
Rank-based functional testing of weak associations
Enrichment peaks at 10000s of SNPs down the rank list even after LD pruning
copy source unknown All rights reserved This content is excluded from our Creative
Commons license For more information see httpocwmiteduhelpfaq-fair-use
bull Rank all SNPs based on GWAS signal strength bull Functional enrichment for cell types and states 83
Weak-effect T1D hits in 50k T-cell enhancers enhancers
CD4+ T-cells
T-cells B-cells
Other cell types
copy source unknown All rights reserved This content is excluded from our Creative
Commons license For more information see httpocwmiteduhelpfaq-fair-use
bull LD-pruning (CEU r2gt2) 50k 41k independ loci 84
Cell type specificity stronger for enhancers enhancers promoters
transcribed
CD4+ T-cells
T-cells B-cells
Other cell types
copy source unknown All rights reserved This content is excluded from our Creative
Commons license For more information see httpocwmiteduhelpfaq-fair-use
bull TB-cells also enriched for promoters transcribed bull Enhancer enrichment much more cell type specific 85
T1DRA-enriched enhancers spread across genome
copy source unknown All rights reserved This content is excluded from our Creative
Commons license For more information see httpocw miteduhelpfaq-fair-use
bull High concentration of loci in MHC high overlapbull Yet many distinct regions 1000s of distinct loci 86
Implications for genetic predisposition polygenic models for risk prediction
87
1
Basic setup of polygenic risk prediction studies Case-control cohort w genotype + phenotype
Training cohort Testing cohort
Selection of SNPs Estimation of effects Ranking
Apply predictor Evaluate accuracy
Apply predictor w estimated confidence
Target cohort genotyped individuals
(no phenotypes)
1
(power matters) (power matters) (power limited to one individual at a time)
2
bull Applications 1 (testing cohort) ndash Understand total heritability captured in common variants
ndash Understand disease ldquoarchitecturerdquo number of SNPs ndash Recognize functional classes associated with weak genetic associations
bull Applications 2 2 (new individuals) ndash Provide health recommendations at the individual level
ndash Prioritize high-risk individuals for subsequent testing at population level 88
How many SNPs to include in model
scor
ec
nige
ly p
ohe
of t
ue
-val
Pct
ed
peex
Dudridge PLoS Genetics 2013 pi0Proportion of markers with no effect Purcell Nature 2009
Schizophrenia risk prediction
lsquoonly 5 matterrsquo
lsquoonly 10 matterrsquo(but still canrsquot tellWhich ones until lsquoall matterrsquo Full rank list)
inclusion threshold copy source unknown All rights reserved This content is excluded from our CreativeCommons license For more information see httpocwmiteduhelpfaq-fair-use
bull It depends on ndash Architecture Fraction of SNPs that are estimated to be functional ndash Power Number of individuals in cohort ie ability to rank correctly It only peaks at 5 (asymp1-pi0) when sufficient power to rank ndash Large fraction of associated markers are hidden within non-significant SNPs
bull
bull For pi0=090 still need to include all SNPs to maximize predictive power 89
Application to pleiotropy and common risk Trait 1 (schizophrenia) Case-control cohort w genotype + phenotype
Selection of SNPs Estimation of effects Ranking
Apply predictor Evaluate accuracy
Trait 2 (bipolar disorder) Case-control cohort w genotype + phenotype
bull Ability to assess common genetic risk Are the highly-ranked SNPs for one study relevant to a different study
Is there a shared genetic architecture between seemingly unrelated traits
irst use showed schizophrenia and bipolar disorder common risk Schizophrenia-ranked SNPs in one cohortlt
lt are predictive of bipolar disorder diagnosis lt but not predictive of unrelated (cardiovascular) traits
ndashndash
bull Fndashndashndash
90
Important pointscaveats for risk prediction bull Always limited by genetic component
ndash Environment random effects play big role for most traits
bull Mendelian=deterministic vs common variants=probic
ndash Only a first screen for individuals at risk
bull Limited by discovery power
ndash Cohort size limits discriminative power and ranking ability
bull Limited by genotyped SNPvs vs all SNPs
ndash Selection pushes fitness-reducing variants to lower freq
ndash Genotyped SNPs selected to be common
bull Even if SNPs are correctly id entified their effects are not
ndash Winnerrsquos curse over-estimate above-threshold true effect
bull Training and testing cohort non-independence
ndash Relatives cryptic relatedness population stratification inflate est 91
91
Goal Personalized and Predictive Medicine 1 Intro to Epidemiology basis of human disease 2 Genetic Epidemiology
ndash Genetic basis GWAS and screening ndash Interpreting GWAS with functional genomics ndash Calculating functional enrichments for GWAS loci
3 Molecular epidemiology ndash meQTLs Genotype-Epigenome association (cis-trans-) ndash EWAS Epigenome-Disease association
4 Resolving Causality ndash Statistical Mendelian Randomization ndash Application to genotype + methylation in AD
5 Systems Genomics and Epigenomics of disease ndash Beyond single loci polygenic risk prediction models ndash Sub-threshold loci and somatic heterogeneity in cancer
92
This talk From loci to mechanisms
Building a reference map of the regulatory genome Enhancers Promoters Transcribed Repressed
Regions Enhancers promoters transcribed repressed Cell types Predict tissues and cell types of epigenomic act ivity Target genes Link variants to their target genes using eQTLs activity Hi-C Nucleotides Regulatory consequence of mutation Conservation PWMs Regulators Upstream regulators whose activity is disrupted by mutation
Application to GWAS hidden heritability and Cancer GWAS CATGCCTG bull 93 top hits non-coding Mechanism Cell type hits CGTGTCTA bull Lie in haplotype blocks Causal variant(s)
lsquoHiddenrsquo CATGCCTG bull Many variants small effects Pathway-level burdenload heritability CGTGTCTA bull Many false positives Prioritize w regulatory annotations
Cancer bull s of function CATGCCTG Los Protein-coding variants convergence mutations CATCCCTG bull Gain of function Regulatory variants heterogeneity
93
Characterizing sub-threshold variants in heart arrhythmia
copy source unknown All rights reservedThiscontent is excluded from our Creative
Commons license For more information see
httpocwmiteduhelpfaq-fair-use
Focus on sub-threshold variants
(eg rs1743292 P=10-42)
Trait QRSQT interval
(1) Large cohorts (2) many known hits (3) well-characterized tissue drivers 94
From Arking D E Pulit S L Crotti L Harst P V Munroe P BKoopmann T T Newton-Cheh C (2014) Genetic associationstudy of QT interval highlights role for calcium myocardial repolarizationNature Genetics Nat Genet 46(8) 826-836 Used with permission
Enhancers overlapping GWAS loci share functional properties
copy source unknown All rights reserved This content is excluded from our CreativeCommons license For more information see httpocwmiteduhelpfaq-fair-use
Train machine learning model to prioritize sub-threshold loci 95
Functional evidence for sub-threshold target genes
Zebrafish phenotypes Human genetics
copy source unknown All rights reserved This content is excluded from our CreativeCommons license For more information see httpocwmiteduhelpfaq-fair-use
Mouse phenotypes 96
Experimental validation of 11 sub-threshold loci
copy source unknown All rights reserved This content is excluded from our CreativeCommons license For more information see httpocwmiteduhelpfaq-fair-use
9 of 11 tested loci show allelic activity chromatin interactions
97
Functional evidence for rs1743292 causality (P=10-42)
Enhancer 4C links to target gene promoters Heart enhancer activity
Motif disruption Allelic DNase in multiple individuals copy source unknown All rights reserved This content is excluded from our CreativeCommons license For more information see httpocwmiteduhelpfaq-fair-use Allelic enha-
ncer activity 98
Target gene impact on heart conduction
Optical voltage mapping
zebrafish embryo hearts voltage-sensitive fluorescent dye
ventricle
atrium
transmembrane voltage (ventricle)
copy source unknown All rights reserved This content is excludedfrom our Creative Commons license For more information seehttpocwmiteduhelpfaq-fair-use
Detection and validation of a new cardiac locus
99
What would we need to discover rs1743292 without epigenomics
rs1743292 Minor allele frequency 0134
Effect size -05773 +- 017 msec With 68900 individuals 128 power to discover at plt5x10-8
bull rs1743292 has similar effect sizes as many genome-wide significant variants
bull Many GWAS variants discovered due to winnerrsquos curse often only have 5-
20 power to discover
bull Combining epigenomics and GWAS can
1 Confirm existing GWAS loci are real
2 Discover new sub-threshold loci with weak effect sizes low power
To reach 80 power to discover rs1743292 at plt5x10-8 we need 146700 individuals
100
Goal Personalized and Predictive Medicine 1 Intro to Epidemiology basis of human disease
enetic Epidemiology Genetic basis GWAS and screening Interpreting GWAS with functional genomics Calculating functional enrichments for GWAS loci
olecular epidemiology meQTLs Genotype-Epigenome association (cis-trans-) EWAS Epigenome-Disease association
esolving Causality Statistical Mendelian Randomization Application to genotype + methylation in AD
ystems Genomics and Epigenomics of disease Beyond single loci polygenic risk prediction models Sub-threshold loci and somatic heterogeneity in cancer
2 Gndash ndash ndash
3 Mndash ndash
4 Rndash ndash
5 Sndash ndash
101
This talk From loci to mechanisms
Building a reference map of the regulatory genome Enhancers Promoters Transcribed Repressed
Regions Enhancers promoters transcribed repressed Cell types Predict tissues and cell types of epigenomic act ivity Target genes Link variants to their target genes using eQTLs activity Hi-C Nucleotides Regulatory consequence of mutation Conservation PWMs Regulators Upstream regulators whose activity is disrupted by mutation
Application to GWAS hidden heritability and Cancer GWAS CATGCCTG bull 93 top hits non-coding Mechanism Cell type hits CGTGTCTA bull Lie in haplotype blocks Causal variant(s)
lsquoHiddenrsquo CATGCCTG bull Many variants small effects Pathway-level burdenload heritability CGTGTCTA bull Many false positives Prioritize w regulatory annotations
Cancer function CATGCCTG bull Loss of Protein-coding variants convergence mutations CATCCCTG bull Gain of function Regulatory variants heterogeneity
102
Regulatory convergence of dispersed driver mutations
copy source unknown All rights reserved This content is excluded from our CreativeCommons license For more information see httpocwmiteduhelpfaq-fair-use
Common mutations in regulatory plexus of each gene Richard Sallari 103
Cancer genes are more likely to be up-regulated
copy source unknown All rights reserved This content is excluded from our CreativeCommons license For more information see httpocwmiteduhelpfaq-fair-use
Richard Sallari 104
Dysregulated genes show dispersed non-coding mutations
copy source unknown All rights reserved This content is excluded from our CreativeCommons license For more information see httpocwmiteduhelpfaq-fair-use
Dysregulated genes are enriched for plexus mutations at all distances Richard Sallari 105
Non-coding mutations enriched in promoters enhancers active in other cell types
copy source unknown All rights reserved This content is excluded from our CreativeCommons license For more information see httpocwmiteduhelpfaq-fair-use
Disruptive mutations in lsquolowrsquo elements are enriched in enhancers and promoters in other tissues
Richard Sallari 106
Statistical model for excess of raresomatic variants
copy source unknown All rights reserved This content is excluded from our CreativeCommons license For more information see httpocwmiteduhelpfaq-fair-use
bullCorrect for region- state- tumor-specific rate variation 107
Convergence in immune signaling mitoch functions
copy source unknown All rights reserved This content is excluded from our CreativeCommons license For more information see httpocwmiteduhelpfaq-fair-use
bullPathway-level convergence hierarchical model 108
Richard Sallari
Non-coding drivers of prostate cancer dysregulation
Regulatory mutations reveal Convergence in immune signaling new cancer driver genes
mitochondrial functions
copy source unknown All rights reserved This content is excluded from our CreativeCommons license For more information see httpocwmiteduhelpfaq-fair-use
Convergence in inositol phosphate metabolism PLCB4 overexpression in PC3 prostate cancer adjacent to PTEN PIK3CA known cancer genes reduces ErkAkt activity synergistic with PTEN
109
Personal genomics tomorrow Already 100000s of complete genomes
bull Health disease quantitative traits ndash Genomics regions disease mechanism drug targets ndash Protein-coding cracking regulatory code variation ndash Single genes systems gene interactions pathways
bull Human ancestry ndash Resolve all of human ancestral relationships ndash Complete history of all migrations selective events ndash Resolve common inheritance vs trait association
bull Whatrsquos missing is the computation ndash New algorithms machine learning dimensionality reduction ndash Individualized treatment from 1000s genes genome ndash Understand missing heritability ndash Reveal co-evolution between geneselements ndash Correct for modulating effects in GWAS
110
Challenge ahead From research to clinic 1 Systematic medical genotyping sequencing
ndash Currently a curiosity future medical practice
2 Systematic medical molecular profiling
ndash Functional genomics in relevant cell types
3 Systematic perturbation studies for validation
ndash 1000s of regulatory predictions x 100s cell types
4 Systematic repurposing of approved drugs
ndash Systems-biology view of drug response
5 Genomics of drug response in cli nical trials
ndash Personalized drug prescription and combinations
6 Partnerships academia industry hospitals
ndash Interdisciplinary training in each of the instituttions 111
Summary Personalized amp Predictive Medicine 1 Intro to Epidemiology basis of human disease 2 Genetic Epidemiology
ndash Genetic basis GWAS and screening ndash Interpreting GWAS with functional genomics ndash Calculating functional enrichments for GWAS loci
3 Molecular epidemiology ndash meQTLs Genotype-Epigenome association (cis-trans-) ndash EWAS Epigenome-Disease association
4 Resolving Causality ndash Statistical Mendelian Randomization ndash Application to genotype + methylation in AD
5 Systems Genomics and Epigenomics of disease ndash Beyond single loci polygenic risk prediction models ndash Sub-threshold loci and somatic heterogeneity in cancer
112
MIT OpenCourseWarehttpocwmitedu
6047 6878 HST507 Computational BiologyFall 2015
For information about citing these materials or our Terms of Use visit httpocwmiteduterms
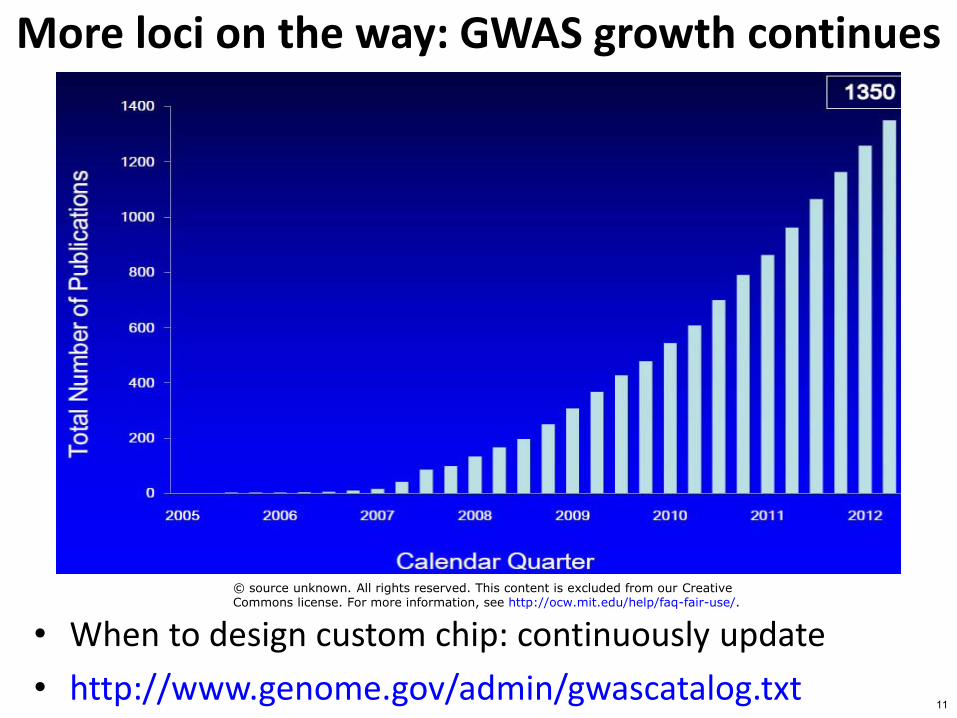

Goal Personalized and Predictive Medicine 1 Intro to Epidemiology basis of human disease
enetic Epidemiology Genetic basis GWAS and screening Interpreting GWAS with functional genomics Calculating functional enrichments for GWAS loci
olecular epidemiology meQTLs Genotype-Epigenome association (cis-trans-) EWAS Epigenome-Disease association
esolving Causality Statistical Mendelian Randomization Application to genotype + methylation in AD
ystems Genomics and Epigenomics of disease Beyond single loci polygenic risk prediction models
2 Gndashndashndash
3 Mndashndash
4 Rndashndash
5 Sndashndash Sub-threshold loci and somatic heterogeneity in cancer
15
Interpreting disease associations Functional genomics of GWAS
16
GWAS CATGACTG CATGCCTG
enotype Disease
mQTLs
Epigenome MWAS
Interpreting disease-association signals
(1) Interpret variants using Epigenomics - Chromatin states Enhancers promoters motifs
- Enrichment in individual loci across 1000s of SNPs in T1D
G
(2) Epigenome changes in disease - Intermediate molecular phenotypes associated with disease
- Variation in brain methylomes of Alzheimerrsquos patients17
Complex disease strong non-coding component
Monogenic Polygenic Complex Mendelian Disease Disease
Coding
Non-coding
Human Genetic Mutation Database Catalog of GWAS studies April 2010 release Hindorff et al PNAS 2009
Slide credit Benjamin Raby 18
Genomic medicine challenge and promises
1 The promise of genetics
ndash Disease mechanism
ndash New target genes
ndash New therapeutics
ndash Personalized medicine
The challenge
ndash 90+ disease hits non-coding
ndash Cell type of action not known
ndash Causal variant not known
ndash Mechanism not known
2
Hillmer Nature Genetics 2008
GWAS simple χ2 statistical test
Courtesy of Macmillan Publishers Limited Used with permission Source Hillmer A M Brockschmidt F F Hanneken S Eigelshoven S Steffens M Flaquer A Noumlthen M M (2008) Susceptibility variants
for male-pattern baldness on chromosome 20p11 Nature Genetics Nat Genet
40(11) 1279-1281 doi101038ng228
19
Genomic medicine challenge and promises 3 The remedy
nnotation of non-coding enome (ENCODERoadmap)
inking of enhancers to egulators and target genes ew methods for utilizing them
The deliverables ndash Relevant cell type ndash Target genes ndash Causal variant ndash Upstream regulator ndash Relevant pathways
ndash Ag
ndash Lr
ndash N
Roadmap Epigenomics Nature 2015 4
ndash Intermediate phenotypes Ernst Nature 2011 20
Courtesy of NIH Roadmap Epigenomics MappingConsortium Used with permission
Courtesy of Macmillan Publishers Limited Used with permissionSource Ernst J et al (2011) Mapping and analysis of chromatinstate dynamics in nine human cell types Nature 473(7345) 43-49
This talk From loci to mechanisms
Building a reference map of the regulatory genome
Regions Enhancers promoters transcribed repressed
Enhancers Promoters Transcribed Repressed
Cell types Predict tissues and cell types of epigenomic act ivity Target genes Link variants to their target genes using eQTLs activity Hi-C Nucleotides Regulatory consequence of mutation Conservation PWMs Regulators Upstream regulators whose activity is disrupted by mutation
Application to GWAS hidden heritability and Cancer GWAS CATGCCTG bull 93 top hits non-coding Mechanism Cell type hits CGTGTCTA bull Lie in haplotype blocks Causal variant(s)
lsquoHiddenrsquo CATGCCTG bull Many variants small effects Pathway-level burdenload heritability CGTGTCTA bull Many false positives Prioritize w regulatory annotations
Cancer CATGCCTG bull Loss of function Protein-coding variants convergence mutations CATCCCTG bull Gain of function Regulatory variants heterogeneity
21
Dissecting non-coding genetic associations
3 Causal nucleotide(s)
2 Target gene(s)
1 Tissuecell type(s)
4 Upstream regulator(s) TF
TF TF
5 Cellular phenotypes 6 Organismal phenotypes
GWAS region SNPs
1 Establish relevant tissuecell type
2 Establish downstream target gene(s)
3 Establishing causal nucleotide variant
4 Establish upstream regulator causality
5 Establish cellular phenotypic consequences
6 Establish organismal phenotypic consequences 22
Using epigenomic maps to predict disease-relevant tissues
23
St
em C
Imm
un
Hea
rtLi
ver
Region of association Individual SNPs
Height Type 1 Diabetes Blood Pressure
Cholesterol
Identifying disease-relevant cell types
ells
e
Stem Cell Immune Heart Liver Enhancers Enhancers Enhancers Enhancers
bull For every trait in the GWAS catalog
ndash Identify all associated regions at P-value threshold
ndash Consider all SNPs in credible interval (R2ge8)
ndash Evaluate overlap with tissue-specific enhancers
ndash Keep tissues showing significant enrichment (Plt0001) Repeat for all traits (rows) and all cell types (columns) bull
24
GWAS hits in enhancers of relevant cell types
25
T cells B cells
Digestive
Brain
ESLiver
Heart
Linking traits to their relevant celltissue types
copy source unknown All rights reserved This content is excluded from our Creative Commons license For more information see httpocwmiteduhelpfaq-fair-use 26
27
Immune activation + neural repression in human + mouse
Courtesy of Macmillan Publishers Limited Used with permissionSource Gjoneska E Pfenning A R Mathys H Quon GKundaje A Tsai L amp Kellis M (2015) Conserved Epigenomic signals inmice and humans reveal immune basis of Alzheimerrsquos disease Nature 518 (7539) 365-369 doi101038nature14252
Sample mouse brain epigenomics during Two contrasting signatures of neurodegeneration immune activation vs neural repression
Is inflammation simply a consequence of neuronal loss 28
Genetic evidence for immune vs neuronal components
Increasing Decreasing (immune) (neuronal)
Courtesy of Macmillan Publishers Limited Used with permission Source Gjoneska E Pfenning A R Mathys H Quon G Kundaje A Tsai L amp Kellis M (2015) Conserved Epigenomic signals in mice and humans reveal immune basis of Alzheimerrsquos disease Nature 518(7539) 365-369 doi101038nature14252
Only increasing (immune) enhancers Neuronal cell types are depleted enriched in AD-associated SNPs for AD-associated SNPs
Indicates immune cell dysregulation is causal component Microglial cells resident immune cells of adult brain Macrophages infiltrate brain in neurodegeneration
29
Using epigenomic annotations for fine-mapping disease regions
30
LD both a blessing amp
a curse
Observation LD blocks in which there is no evidence for historical
copy source unknown All rights reserved This content is excluded from our Creative recombination Commons license For more information see httpocwmiteduhelpfaq-fair-use 31
Causal variant not known in most GWAS regions
Courtesy of Macmillan Publishers Limited Used with permission Source Smemo S Tena J J Kim K Gamazon E R Sakabe N JGoacutemez-Mariacuten C
Noacutebrega M A (2014) Obesity-associated variants within FTO form long-range functional
connections with IRX3 Nature 507(7492) 371-375 doi101038nature13138
copy source unknown All rights reserved This content is excluded from our Creative
Commons license For more information see httpocwmiteduhelpfaq-fair-use
LD (Linkage disequilibrium) large regions co-inherited in blocks Blessing for initial mapping (few tags) curse for fine-mapping
Use functional annotations to predict causal variant(s)32
Multiple lines of evidence for fine-mapping
Courtesy of Macmillan Publishers Limited Used with permission Ward L D amp Kellis M (2012) Interpreting noncoding genetic variation in complex traits and human disease Nat Biotechnol Nature Biotechnology 30(11) 1095-1106 doi101038nbt2422 Used with permission
Ward and Kellis Nature Biotechnology 2012
bull Epigenomic information enhancers amp linking (target genes) bull Motif information causal variants amp upstream regulators bull Evolutionary conservation causal variants amp conserved motifs 33
Detect SNPs that disrupt conserved regulatory motifs
Courtesy of Macmillan Publishers Limited Used with permissionSource Lindblad-Toh Kerstin Manuel Garber Or Zuk Michael F Lin Brian J Parker
Ste fan Washietl Po uya Kh eradpou r et al ldquoA Hi gh-Resolu t ion Map o f Human Ev olutionary
Constraint Using 29 Mammalsrdquo Nature 478 no 7370 (2011) 476ndash82do i101038nature10530
bull Functionally-associated SNPs enriched in states constraint bull Prioritize candidates increase resolution disrupted motifs
34
Allele-specific chromatin marks cis-vs-trans effects
copy source unknown All ri ghts reserved This content i s excluded from our Creative Commons license For more information see httpocwmiteduhelpfaq-fair-use
bull Maternal and paternal GM12878 genomes sequenced bull Map reads to phased genome handle SNPs indels
35bull Correlate activity changes with sequence differences35
Predict effect of common rare somatic mutations
All Regulatory and epigenomic annotations
Raresomatic Predict TF binding disruption
Richard Sallari Common allelic activity in heterozygous lines Xinchen Wang
36
HaploReg public resource for dissecting GWAS
Courtesy of the authors License CC BY-NCSource Ward Lucas D and Manolis Kellis HaploReg a resource for exploring chromatin states conservation and regulatory
motif alterations within sets of genetically linked variants Nucleic Acids Research 40 no D1 (2012) D930-D934
bull Start with any list of SNPs or select a GWA study ndash Mine ENCODE and Roadmap epigenomics data for hits ndash Hundreds of assays dozens of cells conservation motifs ndash Report significant overlaps and link to infobrowser
bull Try it out httpcompbiomiteduHaploReg Ward Kellis NAR 2011 37
37
Predicting target genes
38
Three lines of linking evidence ticPhysical Functional Gene
copy source unknown All ri ghts reserved This content Courtesy of Macmillan Pu blishers Limited Used with permission Ward L D amp Kellis M (2012)
is excluded from our Creative Commons license Interpreting noncoding genetic variation in complex traits and human disease Nat Biotechnol
For more information see httpocwmiteduhelp Nature Biotechnology 30(11) 1095-1106 doi101038nbt2422 Used with permissionfaq-fair-use
Hi-C Physical Enhancer-gene eQTL evidence SNP proximity in 3D activity correlation effect on expression
39
39
Targets 3D folding and expr genetics indicate IRX3+IRX5
Cohort of 20 homozygous risk and 18 homozygous non -risk individuals Genotype-dependent expression
Dixon Nature 2012
Topological domains span 25Mb eQTL targets IRX3 and IRX5
Implicate 8 candidate genes
Risk allele increased expression
(gain-of-function) 404
copy source unknown All rights reserved This content isexcluded from our Creative Commons license For moreinformation see httpocwmiteduhelpfaq-fair-use
copy source unknown All rights reserved This content isexcluded from our Creative Commons license For moreinformation see httpocwmiteduhelpfaq-fair-use
40
Goal Personalized and Predictive Medicine 1 Intro to Epidemiology basis of human disease 2 Genetic Epidemiology
ndash Genetic basis GWAS and screening ndash Interpreting GWAS with functional genomics ndash Calculating functional enrichments for GWAS loci
3 Molecular epidemiology ndash meQTLs Genotype-Epigenome association (cis-trans-) ndash EWAS Epigenome-Disease association
4 Resolving Causality ndash Statistical Mendelian Randomization ndash Application to genotype + methylation in AD
5 Systems Genomics and Epigenomics of disease ndash Beyond single loci polygenic risk prediction models ndash Sub-threshold loci and somatic heterogeneity in cancer
41
Interpreting disease-association signals
(1) Interpret variants using Epigenomics - Chromatin states Enhancers promoters motifs
- Enrichment in individual loci across 1000s of SNPs in T1D
GWAS CATGACTG CATGCCTG
Genotype Disease
mQTLs
Epigenome MWAS
(2) Epigenome changes in disease - Intermediate molecular phenotypes associated with disease
- Variation in brain methylomes of Alzheimerrsquos patients 42
Goal Personalized and Predictive Medicine 1 Intro to Epidemiology basis of human disease
Genetic Epidemiology Genetic basis GWAS and screening Interpreting GWAS with functional genomics Calculating functional enrichments for GWAS loci
Molecular epidemiology meQTLs Genotype-Epigenome association (cis-trans-) EWAS Epigenome-Disease association
Resolving Causality Statistical Mendelian Randomization Application to genotype + methylation in AD
Systems Genomics and Epigenomics of disease Beyond single loci polygenic risk prediction models Sub-threshold loci and somatic heterogeneity in cancer
43
2 ndashndashndash
3 ndashndash
4 ndashndash
5 ndashndash
43
DXG
effects
causes
genome epigenome biomarkers
disease S
symptoms
C Econfounders environment
Molecular EpidemiologyMolecular Biomarkers of disease state
Gene expression DNA methylation chromatin in specific cell types
44
chr2
meQTLminuslinked CpG r^2
meQTL SNP r^2
SNP AAF
Genotype
BRNMIDFRNTL E073
BRNANGGYR E067
BRNANTCAUD E068
BRNCINGGYR E069
BRNHIPPMID E071
BRNINFTMP E072
BRNSUBNIG E074
LIVADLT E066
BLDCD14PC E029
BLDCD4MPC E037
BLDCD4CD25MCD45RANPC E039
LNGIMR90 E017
GISTMCMUS E111
SKINPENFRSKFIB01 E055
MUSTRNKFET E089
BONEOSTEO E129
Genes(+)
Genes(minus)
Mean Methylation
Normalized Methylation
Methylation StdDev
meQTLminuslinked CpG r^2
0
146
293
439
586
241400000 241500000 241600000 241700000 241800000 241900000 242000000 242100000 242200000 2423000003 5
241400000 241500000 241600000 241700000 241800000 241900000 242000000 242100000 242200000 2423000005 3
Genetic and epigenetic data in 750 Alzheimerrsquos patientscontrols MAP Memory and Aging Project
+ ROS Religious Order Study
Dorsolateral PFC
Reference Chromatin
states (Bernstein)
Genotype
(1M SNPs
x700 ind)
(De Jager)
BrainLiver Blood Lung GI Skin Muscle Bone
Methylation
(450k probes
x 700 ind)
(De Jager)
copy source unknown All rights reserved This content is excluded from our CreativeCommons license For more information see httpocwmiteduhelpfaq-fair-use
750 subjects initially cognitively normal Alzheimerrsquos diagnosed by pathology (Bennett) 45
Data Matrices ndash An example scenario n=750 individuals n=750 individuals n=750 individuals n=750 individuals
Genotype
g=1
20
00
00
0
Methylation
m=4
50
00
0
e=1
5 10
ldquoEnvironmentrdquo
p=
Phenotype (Disease)
M - Illumina Methylation 450k array 450000 probes targeting CpGs genome-wide
G - Affy SNP arrays imputed against CEU thousand genomes reference panel yielding 12m SNPs
E - Clinical covariates that might mask the variation due to our phenotype eg gender smoking age or sample batch
P - Phenotype of interest sometimes measured with multiple markers (clinical Alz diagnosis vs pathology Alz diagnosis vs count of neuritic plaques)
n -gt number of individuals in cohort 46
E environment
cause D G M Alzheimer genotype
methylation effects disease 46
EWAS Capturing variability in the Epigenomeattributable to disease
D X
Epigenome DNA methylation Phenotype
lzheimerrsquos Disease
E Environment
Age Education Gender etc
Known variable correction
C Experimental Technical
Cell type mixtures Batch effects Other
Unknown Confounders
Known amp ICA inferred variable
correction
EWAS Hundreds of AD associated loci
enriched in enhancers and relevant
pathways
G meQTL Genotype (~60K
5M Common CpGs) Variants
47
Excluding discovered and known covariates
copy source unknown All ri ghts reserved This content is excluded from our Creative Commons license For more information see httpocwmiteduhelpfaq-fair-use 48
Infer covariates using ICA
compare to known
exclude both
Strongest effects
bull Plate (batch)
bull Cell mixture
bull Bisulfite conversion
bull Gender
bull Age
Variance explained
bull Known 25
bull Inferred 35
bull Together 40
C Econfounders environment
DMG effects
cause
genotype methylation Disease
GenotypeMethylation Discovering mQTLs
Methylation Quantitative Trait Loci
49
cis-meQTLs
M
n=750 n=750 Use linear models to identify cis-meQTLs win some genomic window =4
50
00
0
00
00
00
G
m 12
g=
For methyl mark mi and SNP gj mi = β0 + β1(gj) + ε
bull Given several predictors is additional predictor increasing accuracy more than complexity introduced
bull Likelihood ratio testing paradigm predict methylation with and without genotype (only works for nested models)
bull Null hypothesis H0 β1=0 Additional model complexity rsquot explain a significant portion of variation in response
LM1 mi = β0 + ε LM2 mi = β0 + β1(gj) + ε
r term
2) (q ndash p) ) ( RSSLM2 (n ndash q) ) n-q) degrees of freedom is p-value is what we report in a meQTL study SSLM2 too small vs increase in model complexity
50
doesn
Test using F statistic - p is the number of parameters in LM1 - q is the number of parameters in LM2 - n is the sample size - RSS Residual sum of squares - β parameters to learn ε residual erroUnder null hypothesis ( (RSSLM1 ndash RSSLM
Is distributed as F distribution with (q-p If F statistic significant reject null Th Otherwise no meQTL ie RSSLM1 ndash R
50
cis-meQTLs
M
n n =4
50
00
0
00
00
00
G
m 12
g=
Alternative methods of detection
Permutation bull Correlate methylation and genotype bull For i in 1 -gt nperm
bull Permute genotypes bull Correlate methylation and genotype
bull Generate empirical p-value from permuted correlations
LMM Linear mixed models
bull
bull
51
00 05 10 15 20
02
04
06
Adjusted MA Dosage
Adju
sted
Met
hyla
tion
minus05 05 15
065
075
085
Adjusted MA Dosage
Adju
sted
Met
hyla
tion
minus05 05 15
060
064
068
072
rs17836662 cg10853533 minus44352
Adjusted MA Dosage
Adju
sted
Met
hyla
tion
minus05 05 15
010
020
030
rs7924341 cg20132549 minus1847
Adjusted MA Dosage
Adju
sted
Met
hyla
tion
1 2
3 4
1
2
3 4
Most epigenomic variability is genotype-driven Manhattan plot of 450000 methylation probes
P)
10
log
-(va
lue
-P
Chromosome and genomic position
Genome-wide significance at plt3x10-10
Prune for probes disrupted by SNP
0
bullbull 140000 CpGs associated with genotype at 1 FDR
55000 at Bonferroni-corrected P-value of 10-2
52
copy source unknown All rights reserved This content is excluded from our Creative
Commons license For more information see httpocwmiteduhelpfaq-fair-use
Scaling of discovery power with individuals
copy source unknown All rights reserved This content is excluded from our Creative
Commons license For more information see httpocwmiteduhelpfaq-fair-use
bull Number of meQTLs continues to increase linearly bull Weak-effect meQTLs median R2lt01 after 400 indiv 53
Goal Personalized and Predictive Medicine 1 Intro to Epidemiology basis of human disease 2 Genetic Epidemiology
ndash Genetic basis GWAS and screening ndash Interpreting GWAS with functional genomics ndash Calculating functional enrichments for GWAS loci
3 Molecular epidemiology ndash meQTLs Genotype-Epigenome association (cis-trans-) ndash EWAS Epigenome-Disease association
4 Resolving Causality ndash Statistical Mendelian Randomization ndash Application to genotype + methylation in AD
5 Systems Genomics and Epigenomics of disease ndash Beyond single loci polygenic risk prediction models ndash Sub-threshold loci and somatic heterogeneity in cancer
54
confounders
DMG effects
cause
genotype methylation
environment
Disease
C E
MethylationDisease EWAS
Epigenome-wide association study
55
eWAS
Methylation
n n
10 Phenotype
e= (Disease)
=45
00
00
m
Link methylationphenotype (~cis-eQTLs) linear models and hypothesis testing Predict phenotype using methylation
bullbull
LM1 pi
LM2 p = β0 + β1(m ) + ε = β0 + ε
i j
56
eWAS n n
Methylation
m=4
50
00
0
Phenotype (Disease) p
=1
0
n
ldquoEnvironmentrdquo e=
15
LM1 AD = β0 + β2(gender) + ε LM2 AD = β0 + β1(mj) + β2(gender) ε
Link methylationphenotype (~cis-eQTLs) bull linear models and hypothesis testing bull Predict phenotype using methylation
Problem variance due to phenotype probably very small (unless your phenotype is cancer) Needle in a haystack Control for other sources of variance to make the variance due to the phenotype stand out If phenotype is lzheimerrsquos (D) gender incorporates more variance into your M matrix than does AD
57
eWAS
Methylation
Phenotype (Disease)
n n
m=4
50
00
0
p=
10
ldquoEnvironmentrdquo
n
e=1
5
Might have many environmental variables to control for
LM1 AD = β0 + β2(gender) + β3(age) + β4(education) + lt + ε LM2 AD = β0 + β1(mj) + β2(gender) + β3(age) + β4(education) + lt + ε
58
eWAS Need to account for variance due to genotype as well
Methylation
Phenotype (Disease)
n n
m=4
50
00
0
p=
10
ldquoEnvironmentrdquo
n
e=1
5
Genotype
n
g=1
20
00
00
0
59
Role of enhancers vs promoters in lzheimerrsquos disease association
60
Enhancers are hemi-methylated and highly variable
Enhancers show most variable methylation
Promoters show least variable methylation
copy source unknown All rights reserved This content is excluded from our Creative
Commons license For more information see httpocwmiteduhelpfaq-fair-use
bull Highly distinct signatures for promoters vs enhancers
bull Enhancers hemi-methylated Methylation level Methylation level in each person (not bimodal)
61
SNP-associated CpGs in enhancers not promoters
bull Promoter methylation less affected by genetics bull Enhancer methylation highly genotype-driven
TSS flanking Enhancers Repressed
Enric
hmen
t for
meQ
TLs
12
5 Transcribed
Promoters
TxEnh
bull TSS-flanking and repressed regions also genetic62
AD-associated probes in distal enhancers Pe
r st
ate
(O
bs ndash
Exp
)
Tota
l
Enhancers
Promoters
copy source unknown All ri ghts reserved This content is excluded from our Creative
Commons license For more information see httpocwmiteduhelpfaq-fair-use
bull After cleaning with known and inferred covariates
bull Distal and transcribed enhancers enriched
Proximal regulators (promoters) depleted 63
bull 63
ICA covariate correction cleans up enhancer signal
Before
Orange Enrichment of enhancer probes for association with the real phenotype
Grey Enrichment of enhancer probes for a scrambled phenotype
After (After conditioning on 7 surrogate variables discovered with ICA)
Empirical p=006
Empirical plt0001
copy source unknown All rights reserved This content is excluded from our Creative
Commons license For more information see httpocwmiteduhelpfaq-fair-use 64
AD predictive power highest in enhancers
AP
OE
enhancers
methylome
promoters
All SNPs
Top predictive features are bullEnhancer
ethylation
ll me thyl
SS Het
enetics incl APOE)
ausality
ommon athways
m
bull A
bull T
bullG(
bull C
bullCp
copy source unknown All rights reserved This content is excluded from our Creative
Commons license For more information see httpocwmiteduhelpfaq-fair-use65
NRSF
ELK1
All probes ranked by AD assoc P-value
Nonminussignificant pathways Significant pathways
060
065
070
075
AUC using pathway feature selection p= 1922eminus11
AD prediction reveals likely biological pathways
All probes ranked by AD assoc P-value
CTCF
copy source unknown All rights reserved This content is excluded from our Creative
Commons license For more information see httpocwmiteduhelpfaq-fair-use
Enriched regulatory motifs
suggest potential pathway s
HEBTcf12 proliferating neural and progenitor cells
GATA cell growth blood cell development
66TLX1NFIC Neuronal cell fates Mouse AD models 66
Goal Personalized and Predictive Medicine 1 Intro to Epidemiology basis of human disease 2 Genetic Epidemiology
ndash Genetic basis GWAS and screening ndash Interpreting GWAS with functional genomics ndash Calculating functional enrichments for GWAS loci
3 Molecular epidemiology ndash meQTLs Genotype-Epigenome association (cis-trans-) ndash EWAS Epigenome-Disease association
4 Resolving Causality ndash Statistical Mendelian Randomization ndash Application to genotype + methylation in AD
5 Systems Genomics and Epigenomics of disease ndash Beyond single loci polygenic risk prediction models ndash Sub-threshold loci and somatic heterogeneity in cancer
67
67
ins
C E confounders environment
Risk factor causality w instrumental variables If XY are correlated possible scenarios are bull XY bull causes X Y
G Y bull XU Y Xtrument
risk factor outcome To distinguish need effects controlled random experiment
Is risk factor X causing disease Y (or a consequence)
ndash Eg alcohol addiction smoking blood cholesterol fever stress Randomized experiment with and without X feasibility ethics
G randomized experiment (eg random Mendelian inheritance) as only some subjects have genotype
G (iv)must be correlated with Y but only through X ie if X known G gives no additional information about Y
68
bull
bull
bull
68
In silico thought experiment
0 200 400 600 80000
02
04
06
08
10
p=2946466eminus35noi
atylh
etM
Subjects
ADnonAD
0 200 400 600 80000
02
04
06
08
10
p=3847832eminus05
noiat
ylhet
M
Subjects
ADnonAD
Same effect due to Alz but with larger effect due to genotype
CC
Small but significant effect due to Alz
CA
copy source unknown All rights reserved This content is excluded from our Creative
Commons license For more information see httpocwmiteduhelpfaq-fair-use
Hemi-methylation associated with meQTL yields a p-value thatrsquos 30 orders of magnitude lower for the AD phenotype
69
MGE P+ + = GE P+ =
From G include probe-specific terms for cis-meQTLs as well as including trans-meQTLs in all comparisons
VS
Mendelian randomization approach Account for variance due to genotype how much does methylation add
With variability due to genotype and environmental covariates removed the effect due to phenotype should become more prevalent
70
Causality testing
71
Modeling complex Human diseases bull Three possible models
1 Independent Associations
D
MG X
2 Causal Pathway Model
3 Interaction Model
D
G
M
Genotype
DG M
D
MG
72
Methylation
Disease
(1) Independent Associations
D
MG X
bull Association between Factor A and Disease bull Association between Factor B and Disease bull No association between Factor A and Factor B
G Factor A
bull Example 2 independent risk genes X Factor B
Y Disease D 73
(2) Causal Pathway Models
bull Is the a direct link between risk factor (A) and disease (D)
DA
bull Does the risk factorrsquos () effect on disease (D) depend on an intermediate step (B)
DA B
bull To test ndash A is associated with B and D ndash B is associated with D ndash A is not associated with D when controlling for
ndash Note A MUST come before B temporally
B
D
G
X
Factor A
Factor B
Disease D 74
(2) Causal Pathway Models
bull In reality its a little of both rsquos affect on D is partially mediated through B
A DB
bull To test ndash A is associated with B and D ndash B is associated with D ndash The effect size of A on D is decreased when con
ndash Note A MUST come before B temporally
bull Example CR1 effect on cognitive decline
trolling for B
A Factor A Factor B Disease D D
B
75
(3) Interaction Models
bull Factor Brsquos effect on D is different depending on value for factor
B (A = Aa)
B (A = AA)
D
B (A = aa)
bull To test ndash A + B + AB D if estimate for AB is significant then ndash Stratify by levels of A
bull Example
ndash drugrsquos effect is different depending on genotype ndash More to comelt
76
Gene locus reference Published
AD AD NP
BIN1
CD2AP
CD33
rs744373
rs9349407
rs3865444
Seshadri 2010
Naj 2011Hollingsworth 2011
Naj 2011Hollingsworth 2012
16x10-11
86x10-9
16x10-9
0204
0445
0133
0480
0221
0123
ABCA7 rs3764650 Hollingsworth 2010 50x10-21 0747 0187 APOE Any ε4 12x10-13 18x10-23
CLU rs11136000 Lambert 2009Harold 2009 75x10-9 0762 0649 CR1 rs6656401 Lambert 2009 37x10-9 00009 0057
EPHA1 rs11767557 Naj 2011Hollingsworth 2011 60x10-10 0562 0391 MS4A4A rs4938933 Naj 2011 17x10-9 0792 0567 MS4A6A rs610932 Hollingsworth 2010 12x10-16 0534 0820
MTHFD1L rs11754661 Naj 2010 19x10-10 0126 0934 PICALM rs3851179 Harold 2009 19x10-8 0382 0171
Application to 12 AD GWAS loci
77
Tangles
CR1 Causal pathway model
Risk Factors Pathology Clinical Disease
Alzheimerrsquos disease
Genetic CR1
Cognitive Decline
AD specific Neuritic Plaque Neurofibulary
bull CR1 first associated with AD in 2009 bull Original associated variant is in an intron no clear function bull Unclear how CR1 locus influences AD susceptibility mechanistically
bull
Questions ndash Is the effect only on AD ndash Is there a broader effect on cognitive decline ndash Is there an association with AD pathology ndash Does it go through pathology to have an effect of cognitive decline
78
CR1 (rs6656401)
CR1 Pathology
04
045
05
055
06
065
07
075
08
085
Neuritic Plaque Neurofibillary Tangles
TT ATAA (risk allele)
CR1 Global Cognitive Decline
p=00008
p=0008 p=010
Pathology Global Cognitive Decline p lt 00001 time
79
Matt Eaton Phil De Jager
Epigenome
Genetic + Epigenetic variation in lzheimerrsquos
Relate to genotype and AD variation 723 AD patients amp controls Methylation variation in
Genome
meQTL
Phenotype
Classification Epigenome MWAS
1 2
copy source unknown All rights reserved This content isexcluded from our Creative Commons license For moreinformation see httpocwmiteduhelpfaq-fair-use
Methylation gtgt SNPs Estimate causal M roles regression Enhancers gtgt promoters of meQTL effects reduces MD
copy source unknown All rights reserved This content is excluded
from our Creative Commons license For more information see
httpocwmiteduhelpfaq-fair-use 80
Goal Personalized and Predictive Medicine 1 Intro to Epidemiology basis of human disease 2 Genetic Epidemiology
ndash Genetic basis GWAS and screening ndash Interpreting GWAS with functional genomics ndash Calculating functional enrichments for GWAS loci
3 Molecular epidemiology ndash meQTLs Genotype-Epigenome association (cis-trans-) ndash EWAS Epigenome-Disease association
4 Resolving Causality ndash Statistical Mendelian Randomization ndash Application to genotype + methylation in AD
5 Systems Genomics and Epigenomics of disease ndash Beyond single loci polygenic risk prediction models ndash Sub-threshold loci and somatic heterogeneity in cancer
81
Beyond top-scoring hits 1000s of variants of weak effect
cluster in cell type specific enhancers
82
Rank-based functional testing of weak associations
Enrichment peaks at 10000s of SNPs down the rank list even after LD pruning
copy source unknown All rights reserved This content is excluded from our Creative
Commons license For more information see httpocwmiteduhelpfaq-fair-use
bull Rank all SNPs based on GWAS signal strength bull Functional enrichment for cell types and states 83
Weak-effect T1D hits in 50k T-cell enhancers enhancers
CD4+ T-cells
T-cells B-cells
Other cell types
copy source unknown All rights reserved This content is excluded from our Creative
Commons license For more information see httpocwmiteduhelpfaq-fair-use
bull LD-pruning (CEU r2gt2) 50k 41k independ loci 84
Cell type specificity stronger for enhancers enhancers promoters
transcribed
CD4+ T-cells
T-cells B-cells
Other cell types
copy source unknown All rights reserved This content is excluded from our Creative
Commons license For more information see httpocwmiteduhelpfaq-fair-use
bull TB-cells also enriched for promoters transcribed bull Enhancer enrichment much more cell type specific 85
T1DRA-enriched enhancers spread across genome
copy source unknown All rights reserved This content is excluded from our Creative
Commons license For more information see httpocw miteduhelpfaq-fair-use
bull High concentration of loci in MHC high overlapbull Yet many distinct regions 1000s of distinct loci 86
Implications for genetic predisposition polygenic models for risk prediction
87
1
Basic setup of polygenic risk prediction studies Case-control cohort w genotype + phenotype
Training cohort Testing cohort
Selection of SNPs Estimation of effects Ranking
Apply predictor Evaluate accuracy
Apply predictor w estimated confidence
Target cohort genotyped individuals
(no phenotypes)
1
(power matters) (power matters) (power limited to one individual at a time)
2
bull Applications 1 (testing cohort) ndash Understand total heritability captured in common variants
ndash Understand disease ldquoarchitecturerdquo number of SNPs ndash Recognize functional classes associated with weak genetic associations
bull Applications 2 2 (new individuals) ndash Provide health recommendations at the individual level
ndash Prioritize high-risk individuals for subsequent testing at population level 88
How many SNPs to include in model
scor
ec
nige
ly p
ohe
of t
ue
-val
Pct
ed
peex
Dudridge PLoS Genetics 2013 pi0Proportion of markers with no effect Purcell Nature 2009
Schizophrenia risk prediction
lsquoonly 5 matterrsquo
lsquoonly 10 matterrsquo(but still canrsquot tellWhich ones until lsquoall matterrsquo Full rank list)
inclusion threshold copy source unknown All rights reserved This content is excluded from our CreativeCommons license For more information see httpocwmiteduhelpfaq-fair-use
bull It depends on ndash Architecture Fraction of SNPs that are estimated to be functional ndash Power Number of individuals in cohort ie ability to rank correctly It only peaks at 5 (asymp1-pi0) when sufficient power to rank ndash Large fraction of associated markers are hidden within non-significant SNPs
bull
bull For pi0=090 still need to include all SNPs to maximize predictive power 89
Application to pleiotropy and common risk Trait 1 (schizophrenia) Case-control cohort w genotype + phenotype
Selection of SNPs Estimation of effects Ranking
Apply predictor Evaluate accuracy
Trait 2 (bipolar disorder) Case-control cohort w genotype + phenotype
bull Ability to assess common genetic risk Are the highly-ranked SNPs for one study relevant to a different study
Is there a shared genetic architecture between seemingly unrelated traits
irst use showed schizophrenia and bipolar disorder common risk Schizophrenia-ranked SNPs in one cohortlt
lt are predictive of bipolar disorder diagnosis lt but not predictive of unrelated (cardiovascular) traits
ndashndash
bull Fndashndashndash
90
Important pointscaveats for risk prediction bull Always limited by genetic component
ndash Environment random effects play big role for most traits
bull Mendelian=deterministic vs common variants=probic
ndash Only a first screen for individuals at risk
bull Limited by discovery power
ndash Cohort size limits discriminative power and ranking ability
bull Limited by genotyped SNPvs vs all SNPs
ndash Selection pushes fitness-reducing variants to lower freq
ndash Genotyped SNPs selected to be common
bull Even if SNPs are correctly id entified their effects are not
ndash Winnerrsquos curse over-estimate above-threshold true effect
bull Training and testing cohort non-independence
ndash Relatives cryptic relatedness population stratification inflate est 91
91
Goal Personalized and Predictive Medicine 1 Intro to Epidemiology basis of human disease 2 Genetic Epidemiology
ndash Genetic basis GWAS and screening ndash Interpreting GWAS with functional genomics ndash Calculating functional enrichments for GWAS loci
3 Molecular epidemiology ndash meQTLs Genotype-Epigenome association (cis-trans-) ndash EWAS Epigenome-Disease association
4 Resolving Causality ndash Statistical Mendelian Randomization ndash Application to genotype + methylation in AD
5 Systems Genomics and Epigenomics of disease ndash Beyond single loci polygenic risk prediction models ndash Sub-threshold loci and somatic heterogeneity in cancer
92
This talk From loci to mechanisms
Building a reference map of the regulatory genome Enhancers Promoters Transcribed Repressed
Regions Enhancers promoters transcribed repressed Cell types Predict tissues and cell types of epigenomic act ivity Target genes Link variants to their target genes using eQTLs activity Hi-C Nucleotides Regulatory consequence of mutation Conservation PWMs Regulators Upstream regulators whose activity is disrupted by mutation
Application to GWAS hidden heritability and Cancer GWAS CATGCCTG bull 93 top hits non-coding Mechanism Cell type hits CGTGTCTA bull Lie in haplotype blocks Causal variant(s)
lsquoHiddenrsquo CATGCCTG bull Many variants small effects Pathway-level burdenload heritability CGTGTCTA bull Many false positives Prioritize w regulatory annotations
Cancer bull s of function CATGCCTG Los Protein-coding variants convergence mutations CATCCCTG bull Gain of function Regulatory variants heterogeneity
93
Characterizing sub-threshold variants in heart arrhythmia
copy source unknown All rights reservedThiscontent is excluded from our Creative
Commons license For more information see
httpocwmiteduhelpfaq-fair-use
Focus on sub-threshold variants
(eg rs1743292 P=10-42)
Trait QRSQT interval
(1) Large cohorts (2) many known hits (3) well-characterized tissue drivers 94
From Arking D E Pulit S L Crotti L Harst P V Munroe P BKoopmann T T Newton-Cheh C (2014) Genetic associationstudy of QT interval highlights role for calcium myocardial repolarizationNature Genetics Nat Genet 46(8) 826-836 Used with permission
Enhancers overlapping GWAS loci share functional properties
copy source unknown All rights reserved This content is excluded from our CreativeCommons license For more information see httpocwmiteduhelpfaq-fair-use
Train machine learning model to prioritize sub-threshold loci 95
Functional evidence for sub-threshold target genes
Zebrafish phenotypes Human genetics
copy source unknown All rights reserved This content is excluded from our CreativeCommons license For more information see httpocwmiteduhelpfaq-fair-use
Mouse phenotypes 96
Experimental validation of 11 sub-threshold loci
copy source unknown All rights reserved This content is excluded from our CreativeCommons license For more information see httpocwmiteduhelpfaq-fair-use
9 of 11 tested loci show allelic activity chromatin interactions
97
Functional evidence for rs1743292 causality (P=10-42)
Enhancer 4C links to target gene promoters Heart enhancer activity
Motif disruption Allelic DNase in multiple individuals copy source unknown All rights reserved This content is excluded from our CreativeCommons license For more information see httpocwmiteduhelpfaq-fair-use Allelic enha-
ncer activity 98
Target gene impact on heart conduction
Optical voltage mapping
zebrafish embryo hearts voltage-sensitive fluorescent dye
ventricle
atrium
transmembrane voltage (ventricle)
copy source unknown All rights reserved This content is excludedfrom our Creative Commons license For more information seehttpocwmiteduhelpfaq-fair-use
Detection and validation of a new cardiac locus
99
What would we need to discover rs1743292 without epigenomics
rs1743292 Minor allele frequency 0134
Effect size -05773 +- 017 msec With 68900 individuals 128 power to discover at plt5x10-8
bull rs1743292 has similar effect sizes as many genome-wide significant variants
bull Many GWAS variants discovered due to winnerrsquos curse often only have 5-
20 power to discover
bull Combining epigenomics and GWAS can
1 Confirm existing GWAS loci are real
2 Discover new sub-threshold loci with weak effect sizes low power
To reach 80 power to discover rs1743292 at plt5x10-8 we need 146700 individuals
100
Goal Personalized and Predictive Medicine 1 Intro to Epidemiology basis of human disease
enetic Epidemiology Genetic basis GWAS and screening Interpreting GWAS with functional genomics Calculating functional enrichments for GWAS loci
olecular epidemiology meQTLs Genotype-Epigenome association (cis-trans-) EWAS Epigenome-Disease association
esolving Causality Statistical Mendelian Randomization Application to genotype + methylation in AD
ystems Genomics and Epigenomics of disease Beyond single loci polygenic risk prediction models Sub-threshold loci and somatic heterogeneity in cancer
2 Gndash ndash ndash
3 Mndash ndash
4 Rndash ndash
5 Sndash ndash
101
This talk From loci to mechanisms
Building a reference map of the regulatory genome Enhancers Promoters Transcribed Repressed
Regions Enhancers promoters transcribed repressed Cell types Predict tissues and cell types of epigenomic act ivity Target genes Link variants to their target genes using eQTLs activity Hi-C Nucleotides Regulatory consequence of mutation Conservation PWMs Regulators Upstream regulators whose activity is disrupted by mutation
Application to GWAS hidden heritability and Cancer GWAS CATGCCTG bull 93 top hits non-coding Mechanism Cell type hits CGTGTCTA bull Lie in haplotype blocks Causal variant(s)
lsquoHiddenrsquo CATGCCTG bull Many variants small effects Pathway-level burdenload heritability CGTGTCTA bull Many false positives Prioritize w regulatory annotations
Cancer function CATGCCTG bull Loss of Protein-coding variants convergence mutations CATCCCTG bull Gain of function Regulatory variants heterogeneity
102
Regulatory convergence of dispersed driver mutations
copy source unknown All rights reserved This content is excluded from our CreativeCommons license For more information see httpocwmiteduhelpfaq-fair-use
Common mutations in regulatory plexus of each gene Richard Sallari 103
Cancer genes are more likely to be up-regulated
copy source unknown All rights reserved This content is excluded from our CreativeCommons license For more information see httpocwmiteduhelpfaq-fair-use
Richard Sallari 104
Dysregulated genes show dispersed non-coding mutations
copy source unknown All rights reserved This content is excluded from our CreativeCommons license For more information see httpocwmiteduhelpfaq-fair-use
Dysregulated genes are enriched for plexus mutations at all distances Richard Sallari 105
Non-coding mutations enriched in promoters enhancers active in other cell types
copy source unknown All rights reserved This content is excluded from our CreativeCommons license For more information see httpocwmiteduhelpfaq-fair-use
Disruptive mutations in lsquolowrsquo elements are enriched in enhancers and promoters in other tissues
Richard Sallari 106
Statistical model for excess of raresomatic variants
copy source unknown All rights reserved This content is excluded from our CreativeCommons license For more information see httpocwmiteduhelpfaq-fair-use
bullCorrect for region- state- tumor-specific rate variation 107
Convergence in immune signaling mitoch functions
copy source unknown All rights reserved This content is excluded from our CreativeCommons license For more information see httpocwmiteduhelpfaq-fair-use
bullPathway-level convergence hierarchical model 108
Richard Sallari
Non-coding drivers of prostate cancer dysregulation
Regulatory mutations reveal Convergence in immune signaling new cancer driver genes
mitochondrial functions
copy source unknown All rights reserved This content is excluded from our CreativeCommons license For more information see httpocwmiteduhelpfaq-fair-use
Convergence in inositol phosphate metabolism PLCB4 overexpression in PC3 prostate cancer adjacent to PTEN PIK3CA known cancer genes reduces ErkAkt activity synergistic with PTEN
109
Personal genomics tomorrow Already 100000s of complete genomes
bull Health disease quantitative traits ndash Genomics regions disease mechanism drug targets ndash Protein-coding cracking regulatory code variation ndash Single genes systems gene interactions pathways
bull Human ancestry ndash Resolve all of human ancestral relationships ndash Complete history of all migrations selective events ndash Resolve common inheritance vs trait association
bull Whatrsquos missing is the computation ndash New algorithms machine learning dimensionality reduction ndash Individualized treatment from 1000s genes genome ndash Understand missing heritability ndash Reveal co-evolution between geneselements ndash Correct for modulating effects in GWAS
110
Challenge ahead From research to clinic 1 Systematic medical genotyping sequencing
ndash Currently a curiosity future medical practice
2 Systematic medical molecular profiling
ndash Functional genomics in relevant cell types
3 Systematic perturbation studies for validation
ndash 1000s of regulatory predictions x 100s cell types
4 Systematic repurposing of approved drugs
ndash Systems-biology view of drug response
5 Genomics of drug response in cli nical trials
ndash Personalized drug prescription and combinations
6 Partnerships academia industry hospitals
ndash Interdisciplinary training in each of the instituttions 111
Summary Personalized amp Predictive Medicine 1 Intro to Epidemiology basis of human disease 2 Genetic Epidemiology
ndash Genetic basis GWAS and screening ndash Interpreting GWAS with functional genomics ndash Calculating functional enrichments for GWAS loci
3 Molecular epidemiology ndash meQTLs Genotype-Epigenome association (cis-trans-) ndash EWAS Epigenome-Disease association
4 Resolving Causality ndash Statistical Mendelian Randomization ndash Application to genotype + methylation in AD
5 Systems Genomics and Epigenomics of disease ndash Beyond single loci polygenic risk prediction models ndash Sub-threshold loci and somatic heterogeneity in cancer
112
MIT OpenCourseWarehttpocwmitedu
6047 6878 HST507 Computational BiologyFall 2015
For information about citing these materials or our Terms of Use visit httpocwmiteduterms

GWAS CATGACTG CATGCCTG
enotype Disease
mQTLs
Epigenome MWAS
Interpreting disease-association signals
(1) Interpret variants using Epigenomics - Chromatin states Enhancers promoters motifs
- Enrichment in individual loci across 1000s of SNPs in T1D
G
(2) Epigenome changes in disease - Intermediate molecular phenotypes associated with disease
- Variation in brain methylomes of Alzheimerrsquos patients17
Complex disease strong non-coding component
Monogenic Polygenic Complex Mendelian Disease Disease
Coding
Non-coding
Human Genetic Mutation Database Catalog of GWAS studies April 2010 release Hindorff et al PNAS 2009
Slide credit Benjamin Raby 18
Genomic medicine challenge and promises
1 The promise of genetics
ndash Disease mechanism
ndash New target genes
ndash New therapeutics
ndash Personalized medicine
The challenge
ndash 90+ disease hits non-coding
ndash Cell type of action not known
ndash Causal variant not known
ndash Mechanism not known
2
Hillmer Nature Genetics 2008
GWAS simple χ2 statistical test
Courtesy of Macmillan Publishers Limited Used with permission Source Hillmer A M Brockschmidt F F Hanneken S Eigelshoven S Steffens M Flaquer A Noumlthen M M (2008) Susceptibility variants
for male-pattern baldness on chromosome 20p11 Nature Genetics Nat Genet
40(11) 1279-1281 doi101038ng228
19
Genomic medicine challenge and promises 3 The remedy
nnotation of non-coding enome (ENCODERoadmap)
inking of enhancers to egulators and target genes ew methods for utilizing them
The deliverables ndash Relevant cell type ndash Target genes ndash Causal variant ndash Upstream regulator ndash Relevant pathways
ndash Ag
ndash Lr
ndash N
Roadmap Epigenomics Nature 2015 4
ndash Intermediate phenotypes Ernst Nature 2011 20
Courtesy of NIH Roadmap Epigenomics MappingConsortium Used with permission
Courtesy of Macmillan Publishers Limited Used with permissionSource Ernst J et al (2011) Mapping and analysis of chromatinstate dynamics in nine human cell types Nature 473(7345) 43-49
This talk From loci to mechanisms
Building a reference map of the regulatory genome
Regions Enhancers promoters transcribed repressed
Enhancers Promoters Transcribed Repressed
Cell types Predict tissues and cell types of epigenomic act ivity Target genes Link variants to their target genes using eQTLs activity Hi-C Nucleotides Regulatory consequence of mutation Conservation PWMs Regulators Upstream regulators whose activity is disrupted by mutation
Application to GWAS hidden heritability and Cancer GWAS CATGCCTG bull 93 top hits non-coding Mechanism Cell type hits CGTGTCTA bull Lie in haplotype blocks Causal variant(s)
lsquoHiddenrsquo CATGCCTG bull Many variants small effects Pathway-level burdenload heritability CGTGTCTA bull Many false positives Prioritize w regulatory annotations
Cancer CATGCCTG bull Loss of function Protein-coding variants convergence mutations CATCCCTG bull Gain of function Regulatory variants heterogeneity
21
Dissecting non-coding genetic associations
3 Causal nucleotide(s)
2 Target gene(s)
1 Tissuecell type(s)
4 Upstream regulator(s) TF
TF TF
5 Cellular phenotypes 6 Organismal phenotypes
GWAS region SNPs
1 Establish relevant tissuecell type
2 Establish downstream target gene(s)
3 Establishing causal nucleotide variant
4 Establish upstream regulator causality
5 Establish cellular phenotypic consequences
6 Establish organismal phenotypic consequences 22
Using epigenomic maps to predict disease-relevant tissues
23
St
em C
Imm
un
Hea
rtLi
ver
Region of association Individual SNPs
Height Type 1 Diabetes Blood Pressure
Cholesterol
Identifying disease-relevant cell types
ells
e
Stem Cell Immune Heart Liver Enhancers Enhancers Enhancers Enhancers
bull For every trait in the GWAS catalog
ndash Identify all associated regions at P-value threshold
ndash Consider all SNPs in credible interval (R2ge8)
ndash Evaluate overlap with tissue-specific enhancers
ndash Keep tissues showing significant enrichment (Plt0001) Repeat for all traits (rows) and all cell types (columns) bull
24
GWAS hits in enhancers of relevant cell types
25
T cells B cells
Digestive
Brain
ESLiver
Heart
Linking traits to their relevant celltissue types
copy source unknown All rights reserved This content is excluded from our Creative Commons license For more information see httpocwmiteduhelpfaq-fair-use 26
27
Immune activation + neural repression in human + mouse
Courtesy of Macmillan Publishers Limited Used with permissionSource Gjoneska E Pfenning A R Mathys H Quon GKundaje A Tsai L amp Kellis M (2015) Conserved Epigenomic signals inmice and humans reveal immune basis of Alzheimerrsquos disease Nature 518 (7539) 365-369 doi101038nature14252
Sample mouse brain epigenomics during Two contrasting signatures of neurodegeneration immune activation vs neural repression
Is inflammation simply a consequence of neuronal loss 28
Genetic evidence for immune vs neuronal components
Increasing Decreasing (immune) (neuronal)
Courtesy of Macmillan Publishers Limited Used with permission Source Gjoneska E Pfenning A R Mathys H Quon G Kundaje A Tsai L amp Kellis M (2015) Conserved Epigenomic signals in mice and humans reveal immune basis of Alzheimerrsquos disease Nature 518(7539) 365-369 doi101038nature14252
Only increasing (immune) enhancers Neuronal cell types are depleted enriched in AD-associated SNPs for AD-associated SNPs
Indicates immune cell dysregulation is causal component Microglial cells resident immune cells of adult brain Macrophages infiltrate brain in neurodegeneration
29
Using epigenomic annotations for fine-mapping disease regions
30
LD both a blessing amp
a curse
Observation LD blocks in which there is no evidence for historical
copy source unknown All rights reserved This content is excluded from our Creative recombination Commons license For more information see httpocwmiteduhelpfaq-fair-use 31
Causal variant not known in most GWAS regions
Courtesy of Macmillan Publishers Limited Used with permission Source Smemo S Tena J J Kim K Gamazon E R Sakabe N JGoacutemez-Mariacuten C
Noacutebrega M A (2014) Obesity-associated variants within FTO form long-range functional
connections with IRX3 Nature 507(7492) 371-375 doi101038nature13138
copy source unknown All rights reserved This content is excluded from our Creative
Commons license For more information see httpocwmiteduhelpfaq-fair-use
LD (Linkage disequilibrium) large regions co-inherited in blocks Blessing for initial mapping (few tags) curse for fine-mapping
Use functional annotations to predict causal variant(s)32
Multiple lines of evidence for fine-mapping
Courtesy of Macmillan Publishers Limited Used with permission Ward L D amp Kellis M (2012) Interpreting noncoding genetic variation in complex traits and human disease Nat Biotechnol Nature Biotechnology 30(11) 1095-1106 doi101038nbt2422 Used with permission
Ward and Kellis Nature Biotechnology 2012
bull Epigenomic information enhancers amp linking (target genes) bull Motif information causal variants amp upstream regulators bull Evolutionary conservation causal variants amp conserved motifs 33
Detect SNPs that disrupt conserved regulatory motifs
Courtesy of Macmillan Publishers Limited Used with permissionSource Lindblad-Toh Kerstin Manuel Garber Or Zuk Michael F Lin Brian J Parker
Ste fan Washietl Po uya Kh eradpou r et al ldquoA Hi gh-Resolu t ion Map o f Human Ev olutionary
Constraint Using 29 Mammalsrdquo Nature 478 no 7370 (2011) 476ndash82do i101038nature10530
bull Functionally-associated SNPs enriched in states constraint bull Prioritize candidates increase resolution disrupted motifs
34
Allele-specific chromatin marks cis-vs-trans effects
copy source unknown All ri ghts reserved This content i s excluded from our Creative Commons license For more information see httpocwmiteduhelpfaq-fair-use
bull Maternal and paternal GM12878 genomes sequenced bull Map reads to phased genome handle SNPs indels
35bull Correlate activity changes with sequence differences35
Predict effect of common rare somatic mutations
All Regulatory and epigenomic annotations
Raresomatic Predict TF binding disruption
Richard Sallari Common allelic activity in heterozygous lines Xinchen Wang
36
HaploReg public resource for dissecting GWAS
Courtesy of the authors License CC BY-NCSource Ward Lucas D and Manolis Kellis HaploReg a resource for exploring chromatin states conservation and regulatory
motif alterations within sets of genetically linked variants Nucleic Acids Research 40 no D1 (2012) D930-D934
bull Start with any list of SNPs or select a GWA study ndash Mine ENCODE and Roadmap epigenomics data for hits ndash Hundreds of assays dozens of cells conservation motifs ndash Report significant overlaps and link to infobrowser
bull Try it out httpcompbiomiteduHaploReg Ward Kellis NAR 2011 37
37
Predicting target genes
38
Three lines of linking evidence ticPhysical Functional Gene
copy source unknown All ri ghts reserved This content Courtesy of Macmillan Pu blishers Limited Used with permission Ward L D amp Kellis M (2012)
is excluded from our Creative Commons license Interpreting noncoding genetic variation in complex traits and human disease Nat Biotechnol
For more information see httpocwmiteduhelp Nature Biotechnology 30(11) 1095-1106 doi101038nbt2422 Used with permissionfaq-fair-use
Hi-C Physical Enhancer-gene eQTL evidence SNP proximity in 3D activity correlation effect on expression
39
39
Targets 3D folding and expr genetics indicate IRX3+IRX5
Cohort of 20 homozygous risk and 18 homozygous non -risk individuals Genotype-dependent expression
Dixon Nature 2012
Topological domains span 25Mb eQTL targets IRX3 and IRX5
Implicate 8 candidate genes
Risk allele increased expression
(gain-of-function) 404
copy source unknown All rights reserved This content isexcluded from our Creative Commons license For moreinformation see httpocwmiteduhelpfaq-fair-use
copy source unknown All rights reserved This content isexcluded from our Creative Commons license For moreinformation see httpocwmiteduhelpfaq-fair-use
40
Goal Personalized and Predictive Medicine 1 Intro to Epidemiology basis of human disease 2 Genetic Epidemiology
ndash Genetic basis GWAS and screening ndash Interpreting GWAS with functional genomics ndash Calculating functional enrichments for GWAS loci
3 Molecular epidemiology ndash meQTLs Genotype-Epigenome association (cis-trans-) ndash EWAS Epigenome-Disease association
4 Resolving Causality ndash Statistical Mendelian Randomization ndash Application to genotype + methylation in AD
5 Systems Genomics and Epigenomics of disease ndash Beyond single loci polygenic risk prediction models ndash Sub-threshold loci and somatic heterogeneity in cancer
41
Interpreting disease-association signals
(1) Interpret variants using Epigenomics - Chromatin states Enhancers promoters motifs
- Enrichment in individual loci across 1000s of SNPs in T1D
GWAS CATGACTG CATGCCTG
Genotype Disease
mQTLs
Epigenome MWAS
(2) Epigenome changes in disease - Intermediate molecular phenotypes associated with disease
- Variation in brain methylomes of Alzheimerrsquos patients 42
Goal Personalized and Predictive Medicine 1 Intro to Epidemiology basis of human disease
Genetic Epidemiology Genetic basis GWAS and screening Interpreting GWAS with functional genomics Calculating functional enrichments for GWAS loci
Molecular epidemiology meQTLs Genotype-Epigenome association (cis-trans-) EWAS Epigenome-Disease association
Resolving Causality Statistical Mendelian Randomization Application to genotype + methylation in AD
Systems Genomics and Epigenomics of disease Beyond single loci polygenic risk prediction models Sub-threshold loci and somatic heterogeneity in cancer
43
2 ndashndashndash
3 ndashndash
4 ndashndash
5 ndashndash
43
DXG
effects
causes
genome epigenome biomarkers
disease S
symptoms
C Econfounders environment
Molecular EpidemiologyMolecular Biomarkers of disease state
Gene expression DNA methylation chromatin in specific cell types
44
chr2
meQTLminuslinked CpG r^2
meQTL SNP r^2
SNP AAF
Genotype
BRNMIDFRNTL E073
BRNANGGYR E067
BRNANTCAUD E068
BRNCINGGYR E069
BRNHIPPMID E071
BRNINFTMP E072
BRNSUBNIG E074
LIVADLT E066
BLDCD14PC E029
BLDCD4MPC E037
BLDCD4CD25MCD45RANPC E039
LNGIMR90 E017
GISTMCMUS E111
SKINPENFRSKFIB01 E055
MUSTRNKFET E089
BONEOSTEO E129
Genes(+)
Genes(minus)
Mean Methylation
Normalized Methylation
Methylation StdDev
meQTLminuslinked CpG r^2
0
146
293
439
586
241400000 241500000 241600000 241700000 241800000 241900000 242000000 242100000 242200000 2423000003 5
241400000 241500000 241600000 241700000 241800000 241900000 242000000 242100000 242200000 2423000005 3
Genetic and epigenetic data in 750 Alzheimerrsquos patientscontrols MAP Memory and Aging Project
+ ROS Religious Order Study
Dorsolateral PFC
Reference Chromatin
states (Bernstein)
Genotype
(1M SNPs
x700 ind)
(De Jager)
BrainLiver Blood Lung GI Skin Muscle Bone
Methylation
(450k probes
x 700 ind)
(De Jager)
copy source unknown All rights reserved This content is excluded from our CreativeCommons license For more information see httpocwmiteduhelpfaq-fair-use
750 subjects initially cognitively normal Alzheimerrsquos diagnosed by pathology (Bennett) 45
Data Matrices ndash An example scenario n=750 individuals n=750 individuals n=750 individuals n=750 individuals
Genotype
g=1
20
00
00
0
Methylation
m=4
50
00
0
e=1
5 10
ldquoEnvironmentrdquo
p=
Phenotype (Disease)
M - Illumina Methylation 450k array 450000 probes targeting CpGs genome-wide
G - Affy SNP arrays imputed against CEU thousand genomes reference panel yielding 12m SNPs
E - Clinical covariates that might mask the variation due to our phenotype eg gender smoking age or sample batch
P - Phenotype of interest sometimes measured with multiple markers (clinical Alz diagnosis vs pathology Alz diagnosis vs count of neuritic plaques)
n -gt number of individuals in cohort 46
E environment
cause D G M Alzheimer genotype
methylation effects disease 46
EWAS Capturing variability in the Epigenomeattributable to disease
D X
Epigenome DNA methylation Phenotype
lzheimerrsquos Disease
E Environment
Age Education Gender etc
Known variable correction
C Experimental Technical
Cell type mixtures Batch effects Other
Unknown Confounders
Known amp ICA inferred variable
correction
EWAS Hundreds of AD associated loci
enriched in enhancers and relevant
pathways
G meQTL Genotype (~60K
5M Common CpGs) Variants
47
Excluding discovered and known covariates
copy source unknown All ri ghts reserved This content is excluded from our Creative Commons license For more information see httpocwmiteduhelpfaq-fair-use 48
Infer covariates using ICA
compare to known
exclude both
Strongest effects
bull Plate (batch)
bull Cell mixture
bull Bisulfite conversion
bull Gender
bull Age
Variance explained
bull Known 25
bull Inferred 35
bull Together 40
C Econfounders environment
DMG effects
cause
genotype methylation Disease
GenotypeMethylation Discovering mQTLs
Methylation Quantitative Trait Loci
49
cis-meQTLs
M
n=750 n=750 Use linear models to identify cis-meQTLs win some genomic window =4
50
00
0
00
00
00
G
m 12
g=
For methyl mark mi and SNP gj mi = β0 + β1(gj) + ε
bull Given several predictors is additional predictor increasing accuracy more than complexity introduced
bull Likelihood ratio testing paradigm predict methylation with and without genotype (only works for nested models)
bull Null hypothesis H0 β1=0 Additional model complexity rsquot explain a significant portion of variation in response
LM1 mi = β0 + ε LM2 mi = β0 + β1(gj) + ε
r term
2) (q ndash p) ) ( RSSLM2 (n ndash q) ) n-q) degrees of freedom is p-value is what we report in a meQTL study SSLM2 too small vs increase in model complexity
50
doesn
Test using F statistic - p is the number of parameters in LM1 - q is the number of parameters in LM2 - n is the sample size - RSS Residual sum of squares - β parameters to learn ε residual erroUnder null hypothesis ( (RSSLM1 ndash RSSLM
Is distributed as F distribution with (q-p If F statistic significant reject null Th Otherwise no meQTL ie RSSLM1 ndash R
50
cis-meQTLs
M
n n =4
50
00
0
00
00
00
G
m 12
g=
Alternative methods of detection
Permutation bull Correlate methylation and genotype bull For i in 1 -gt nperm
bull Permute genotypes bull Correlate methylation and genotype
bull Generate empirical p-value from permuted correlations
LMM Linear mixed models
bull
bull
51
00 05 10 15 20
02
04
06
Adjusted MA Dosage
Adju
sted
Met
hyla
tion
minus05 05 15
065
075
085
Adjusted MA Dosage
Adju
sted
Met
hyla
tion
minus05 05 15
060
064
068
072
rs17836662 cg10853533 minus44352
Adjusted MA Dosage
Adju
sted
Met
hyla
tion
minus05 05 15
010
020
030
rs7924341 cg20132549 minus1847
Adjusted MA Dosage
Adju
sted
Met
hyla
tion
1 2
3 4
1
2
3 4
Most epigenomic variability is genotype-driven Manhattan plot of 450000 methylation probes
P)
10
log
-(va
lue
-P
Chromosome and genomic position
Genome-wide significance at plt3x10-10
Prune for probes disrupted by SNP
0
bullbull 140000 CpGs associated with genotype at 1 FDR
55000 at Bonferroni-corrected P-value of 10-2
52
copy source unknown All rights reserved This content is excluded from our Creative
Commons license For more information see httpocwmiteduhelpfaq-fair-use
Scaling of discovery power with individuals
copy source unknown All rights reserved This content is excluded from our Creative
Commons license For more information see httpocwmiteduhelpfaq-fair-use
bull Number of meQTLs continues to increase linearly bull Weak-effect meQTLs median R2lt01 after 400 indiv 53
Goal Personalized and Predictive Medicine 1 Intro to Epidemiology basis of human disease 2 Genetic Epidemiology
ndash Genetic basis GWAS and screening ndash Interpreting GWAS with functional genomics ndash Calculating functional enrichments for GWAS loci
3 Molecular epidemiology ndash meQTLs Genotype-Epigenome association (cis-trans-) ndash EWAS Epigenome-Disease association
4 Resolving Causality ndash Statistical Mendelian Randomization ndash Application to genotype + methylation in AD
5 Systems Genomics and Epigenomics of disease ndash Beyond single loci polygenic risk prediction models ndash Sub-threshold loci and somatic heterogeneity in cancer
54
confounders
DMG effects
cause
genotype methylation
environment
Disease
C E
MethylationDisease EWAS
Epigenome-wide association study
55
eWAS
Methylation
n n
10 Phenotype
e= (Disease)
=45
00
00
m
Link methylationphenotype (~cis-eQTLs) linear models and hypothesis testing Predict phenotype using methylation
bullbull
LM1 pi
LM2 p = β0 + β1(m ) + ε = β0 + ε
i j
56
eWAS n n
Methylation
m=4
50
00
0
Phenotype (Disease) p
=1
0
n
ldquoEnvironmentrdquo e=
15
LM1 AD = β0 + β2(gender) + ε LM2 AD = β0 + β1(mj) + β2(gender) ε
Link methylationphenotype (~cis-eQTLs) bull linear models and hypothesis testing bull Predict phenotype using methylation
Problem variance due to phenotype probably very small (unless your phenotype is cancer) Needle in a haystack Control for other sources of variance to make the variance due to the phenotype stand out If phenotype is lzheimerrsquos (D) gender incorporates more variance into your M matrix than does AD
57
eWAS
Methylation
Phenotype (Disease)
n n
m=4
50
00
0
p=
10
ldquoEnvironmentrdquo
n
e=1
5
Might have many environmental variables to control for
LM1 AD = β0 + β2(gender) + β3(age) + β4(education) + lt + ε LM2 AD = β0 + β1(mj) + β2(gender) + β3(age) + β4(education) + lt + ε
58
eWAS Need to account for variance due to genotype as well
Methylation
Phenotype (Disease)
n n
m=4
50
00
0
p=
10
ldquoEnvironmentrdquo
n
e=1
5
Genotype
n
g=1
20
00
00
0
59
Role of enhancers vs promoters in lzheimerrsquos disease association
60
Enhancers are hemi-methylated and highly variable
Enhancers show most variable methylation
Promoters show least variable methylation
copy source unknown All rights reserved This content is excluded from our Creative
Commons license For more information see httpocwmiteduhelpfaq-fair-use
bull Highly distinct signatures for promoters vs enhancers
bull Enhancers hemi-methylated Methylation level Methylation level in each person (not bimodal)
61
SNP-associated CpGs in enhancers not promoters
bull Promoter methylation less affected by genetics bull Enhancer methylation highly genotype-driven
TSS flanking Enhancers Repressed
Enric
hmen
t for
meQ
TLs
12
5 Transcribed
Promoters
TxEnh
bull TSS-flanking and repressed regions also genetic62
AD-associated probes in distal enhancers Pe
r st
ate
(O
bs ndash
Exp
)
Tota
l
Enhancers
Promoters
copy source unknown All ri ghts reserved This content is excluded from our Creative
Commons license For more information see httpocwmiteduhelpfaq-fair-use
bull After cleaning with known and inferred covariates
bull Distal and transcribed enhancers enriched
Proximal regulators (promoters) depleted 63
bull 63
ICA covariate correction cleans up enhancer signal
Before
Orange Enrichment of enhancer probes for association with the real phenotype
Grey Enrichment of enhancer probes for a scrambled phenotype
After (After conditioning on 7 surrogate variables discovered with ICA)
Empirical p=006
Empirical plt0001
copy source unknown All rights reserved This content is excluded from our Creative
Commons license For more information see httpocwmiteduhelpfaq-fair-use 64
AD predictive power highest in enhancers
AP
OE
enhancers
methylome
promoters
All SNPs
Top predictive features are bullEnhancer
ethylation
ll me thyl
SS Het
enetics incl APOE)
ausality
ommon athways
m
bull A
bull T
bullG(
bull C
bullCp
copy source unknown All rights reserved This content is excluded from our Creative
Commons license For more information see httpocwmiteduhelpfaq-fair-use65
NRSF
ELK1
All probes ranked by AD assoc P-value
Nonminussignificant pathways Significant pathways
060
065
070
075
AUC using pathway feature selection p= 1922eminus11
AD prediction reveals likely biological pathways
All probes ranked by AD assoc P-value
CTCF
copy source unknown All rights reserved This content is excluded from our Creative
Commons license For more information see httpocwmiteduhelpfaq-fair-use
Enriched regulatory motifs
suggest potential pathway s
HEBTcf12 proliferating neural and progenitor cells
GATA cell growth blood cell development
66TLX1NFIC Neuronal cell fates Mouse AD models 66
Goal Personalized and Predictive Medicine 1 Intro to Epidemiology basis of human disease 2 Genetic Epidemiology
ndash Genetic basis GWAS and screening ndash Interpreting GWAS with functional genomics ndash Calculating functional enrichments for GWAS loci
3 Molecular epidemiology ndash meQTLs Genotype-Epigenome association (cis-trans-) ndash EWAS Epigenome-Disease association
4 Resolving Causality ndash Statistical Mendelian Randomization ndash Application to genotype + methylation in AD
5 Systems Genomics and Epigenomics of disease ndash Beyond single loci polygenic risk prediction models ndash Sub-threshold loci and somatic heterogeneity in cancer
67
67
ins
C E confounders environment
Risk factor causality w instrumental variables If XY are correlated possible scenarios are bull XY bull causes X Y
G Y bull XU Y Xtrument
risk factor outcome To distinguish need effects controlled random experiment
Is risk factor X causing disease Y (or a consequence)
ndash Eg alcohol addiction smoking blood cholesterol fever stress Randomized experiment with and without X feasibility ethics
G randomized experiment (eg random Mendelian inheritance) as only some subjects have genotype
G (iv)must be correlated with Y but only through X ie if X known G gives no additional information about Y
68
bull
bull
bull
68
In silico thought experiment
0 200 400 600 80000
02
04
06
08
10
p=2946466eminus35noi
atylh
etM
Subjects
ADnonAD
0 200 400 600 80000
02
04
06
08
10
p=3847832eminus05
noiat
ylhet
M
Subjects
ADnonAD
Same effect due to Alz but with larger effect due to genotype
CC
Small but significant effect due to Alz
CA
copy source unknown All rights reserved This content is excluded from our Creative
Commons license For more information see httpocwmiteduhelpfaq-fair-use
Hemi-methylation associated with meQTL yields a p-value thatrsquos 30 orders of magnitude lower for the AD phenotype
69
MGE P+ + = GE P+ =
From G include probe-specific terms for cis-meQTLs as well as including trans-meQTLs in all comparisons
VS
Mendelian randomization approach Account for variance due to genotype how much does methylation add
With variability due to genotype and environmental covariates removed the effect due to phenotype should become more prevalent
70
Causality testing
71
Modeling complex Human diseases bull Three possible models
1 Independent Associations
D
MG X
2 Causal Pathway Model
3 Interaction Model
D
G
M
Genotype
DG M
D
MG
72
Methylation
Disease
(1) Independent Associations
D
MG X
bull Association between Factor A and Disease bull Association between Factor B and Disease bull No association between Factor A and Factor B
G Factor A
bull Example 2 independent risk genes X Factor B
Y Disease D 73
(2) Causal Pathway Models
bull Is the a direct link between risk factor (A) and disease (D)
DA
bull Does the risk factorrsquos () effect on disease (D) depend on an intermediate step (B)
DA B
bull To test ndash A is associated with B and D ndash B is associated with D ndash A is not associated with D when controlling for
ndash Note A MUST come before B temporally
B
D
G
X
Factor A
Factor B
Disease D 74
(2) Causal Pathway Models
bull In reality its a little of both rsquos affect on D is partially mediated through B
A DB
bull To test ndash A is associated with B and D ndash B is associated with D ndash The effect size of A on D is decreased when con
ndash Note A MUST come before B temporally
bull Example CR1 effect on cognitive decline
trolling for B
A Factor A Factor B Disease D D
B
75
(3) Interaction Models
bull Factor Brsquos effect on D is different depending on value for factor
B (A = Aa)
B (A = AA)
D
B (A = aa)
bull To test ndash A + B + AB D if estimate for AB is significant then ndash Stratify by levels of A
bull Example
ndash drugrsquos effect is different depending on genotype ndash More to comelt
76
Gene locus reference Published
AD AD NP
BIN1
CD2AP
CD33
rs744373
rs9349407
rs3865444
Seshadri 2010
Naj 2011Hollingsworth 2011
Naj 2011Hollingsworth 2012
16x10-11
86x10-9
16x10-9
0204
0445
0133
0480
0221
0123
ABCA7 rs3764650 Hollingsworth 2010 50x10-21 0747 0187 APOE Any ε4 12x10-13 18x10-23
CLU rs11136000 Lambert 2009Harold 2009 75x10-9 0762 0649 CR1 rs6656401 Lambert 2009 37x10-9 00009 0057
EPHA1 rs11767557 Naj 2011Hollingsworth 2011 60x10-10 0562 0391 MS4A4A rs4938933 Naj 2011 17x10-9 0792 0567 MS4A6A rs610932 Hollingsworth 2010 12x10-16 0534 0820
MTHFD1L rs11754661 Naj 2010 19x10-10 0126 0934 PICALM rs3851179 Harold 2009 19x10-8 0382 0171
Application to 12 AD GWAS loci
77
Tangles
CR1 Causal pathway model
Risk Factors Pathology Clinical Disease
Alzheimerrsquos disease
Genetic CR1
Cognitive Decline
AD specific Neuritic Plaque Neurofibulary
bull CR1 first associated with AD in 2009 bull Original associated variant is in an intron no clear function bull Unclear how CR1 locus influences AD susceptibility mechanistically
bull
Questions ndash Is the effect only on AD ndash Is there a broader effect on cognitive decline ndash Is there an association with AD pathology ndash Does it go through pathology to have an effect of cognitive decline
78
CR1 (rs6656401)
CR1 Pathology
04
045
05
055
06
065
07
075
08
085
Neuritic Plaque Neurofibillary Tangles
TT ATAA (risk allele)
CR1 Global Cognitive Decline
p=00008
p=0008 p=010
Pathology Global Cognitive Decline p lt 00001 time
79
Matt Eaton Phil De Jager
Epigenome
Genetic + Epigenetic variation in lzheimerrsquos
Relate to genotype and AD variation 723 AD patients amp controls Methylation variation in
Genome
meQTL
Phenotype
Classification Epigenome MWAS
1 2
copy source unknown All rights reserved This content isexcluded from our Creative Commons license For moreinformation see httpocwmiteduhelpfaq-fair-use
Methylation gtgt SNPs Estimate causal M roles regression Enhancers gtgt promoters of meQTL effects reduces MD
copy source unknown All rights reserved This content is excluded
from our Creative Commons license For more information see
httpocwmiteduhelpfaq-fair-use 80
Goal Personalized and Predictive Medicine 1 Intro to Epidemiology basis of human disease 2 Genetic Epidemiology
ndash Genetic basis GWAS and screening ndash Interpreting GWAS with functional genomics ndash Calculating functional enrichments for GWAS loci
3 Molecular epidemiology ndash meQTLs Genotype-Epigenome association (cis-trans-) ndash EWAS Epigenome-Disease association
4 Resolving Causality ndash Statistical Mendelian Randomization ndash Application to genotype + methylation in AD
5 Systems Genomics and Epigenomics of disease ndash Beyond single loci polygenic risk prediction models ndash Sub-threshold loci and somatic heterogeneity in cancer
81
Beyond top-scoring hits 1000s of variants of weak effect
cluster in cell type specific enhancers
82
Rank-based functional testing of weak associations
Enrichment peaks at 10000s of SNPs down the rank list even after LD pruning
copy source unknown All rights reserved This content is excluded from our Creative
Commons license For more information see httpocwmiteduhelpfaq-fair-use
bull Rank all SNPs based on GWAS signal strength bull Functional enrichment for cell types and states 83
Weak-effect T1D hits in 50k T-cell enhancers enhancers
CD4+ T-cells
T-cells B-cells
Other cell types
copy source unknown All rights reserved This content is excluded from our Creative
Commons license For more information see httpocwmiteduhelpfaq-fair-use
bull LD-pruning (CEU r2gt2) 50k 41k independ loci 84
Cell type specificity stronger for enhancers enhancers promoters
transcribed
CD4+ T-cells
T-cells B-cells
Other cell types
copy source unknown All rights reserved This content is excluded from our Creative
Commons license For more information see httpocwmiteduhelpfaq-fair-use
bull TB-cells also enriched for promoters transcribed bull Enhancer enrichment much more cell type specific 85
T1DRA-enriched enhancers spread across genome
copy source unknown All rights reserved This content is excluded from our Creative
Commons license For more information see httpocw miteduhelpfaq-fair-use
bull High concentration of loci in MHC high overlapbull Yet many distinct regions 1000s of distinct loci 86
Implications for genetic predisposition polygenic models for risk prediction
87
1
Basic setup of polygenic risk prediction studies Case-control cohort w genotype + phenotype
Training cohort Testing cohort
Selection of SNPs Estimation of effects Ranking
Apply predictor Evaluate accuracy
Apply predictor w estimated confidence
Target cohort genotyped individuals
(no phenotypes)
1
(power matters) (power matters) (power limited to one individual at a time)
2
bull Applications 1 (testing cohort) ndash Understand total heritability captured in common variants
ndash Understand disease ldquoarchitecturerdquo number of SNPs ndash Recognize functional classes associated with weak genetic associations
bull Applications 2 2 (new individuals) ndash Provide health recommendations at the individual level
ndash Prioritize high-risk individuals for subsequent testing at population level 88
How many SNPs to include in model
scor
ec
nige
ly p
ohe
of t
ue
-val
Pct
ed
peex
Dudridge PLoS Genetics 2013 pi0Proportion of markers with no effect Purcell Nature 2009
Schizophrenia risk prediction
lsquoonly 5 matterrsquo
lsquoonly 10 matterrsquo(but still canrsquot tellWhich ones until lsquoall matterrsquo Full rank list)
inclusion threshold copy source unknown All rights reserved This content is excluded from our CreativeCommons license For more information see httpocwmiteduhelpfaq-fair-use
bull It depends on ndash Architecture Fraction of SNPs that are estimated to be functional ndash Power Number of individuals in cohort ie ability to rank correctly It only peaks at 5 (asymp1-pi0) when sufficient power to rank ndash Large fraction of associated markers are hidden within non-significant SNPs
bull
bull For pi0=090 still need to include all SNPs to maximize predictive power 89
Application to pleiotropy and common risk Trait 1 (schizophrenia) Case-control cohort w genotype + phenotype
Selection of SNPs Estimation of effects Ranking
Apply predictor Evaluate accuracy
Trait 2 (bipolar disorder) Case-control cohort w genotype + phenotype
bull Ability to assess common genetic risk Are the highly-ranked SNPs for one study relevant to a different study
Is there a shared genetic architecture between seemingly unrelated traits
irst use showed schizophrenia and bipolar disorder common risk Schizophrenia-ranked SNPs in one cohortlt
lt are predictive of bipolar disorder diagnosis lt but not predictive of unrelated (cardiovascular) traits
ndashndash
bull Fndashndashndash
90
Important pointscaveats for risk prediction bull Always limited by genetic component
ndash Environment random effects play big role for most traits
bull Mendelian=deterministic vs common variants=probic
ndash Only a first screen for individuals at risk
bull Limited by discovery power
ndash Cohort size limits discriminative power and ranking ability
bull Limited by genotyped SNPvs vs all SNPs
ndash Selection pushes fitness-reducing variants to lower freq
ndash Genotyped SNPs selected to be common
bull Even if SNPs are correctly id entified their effects are not
ndash Winnerrsquos curse over-estimate above-threshold true effect
bull Training and testing cohort non-independence
ndash Relatives cryptic relatedness population stratification inflate est 91
91
Goal Personalized and Predictive Medicine 1 Intro to Epidemiology basis of human disease 2 Genetic Epidemiology
ndash Genetic basis GWAS and screening ndash Interpreting GWAS with functional genomics ndash Calculating functional enrichments for GWAS loci
3 Molecular epidemiology ndash meQTLs Genotype-Epigenome association (cis-trans-) ndash EWAS Epigenome-Disease association
4 Resolving Causality ndash Statistical Mendelian Randomization ndash Application to genotype + methylation in AD
5 Systems Genomics and Epigenomics of disease ndash Beyond single loci polygenic risk prediction models ndash Sub-threshold loci and somatic heterogeneity in cancer
92
This talk From loci to mechanisms
Building a reference map of the regulatory genome Enhancers Promoters Transcribed Repressed
Regions Enhancers promoters transcribed repressed Cell types Predict tissues and cell types of epigenomic act ivity Target genes Link variants to their target genes using eQTLs activity Hi-C Nucleotides Regulatory consequence of mutation Conservation PWMs Regulators Upstream regulators whose activity is disrupted by mutation
Application to GWAS hidden heritability and Cancer GWAS CATGCCTG bull 93 top hits non-coding Mechanism Cell type hits CGTGTCTA bull Lie in haplotype blocks Causal variant(s)
lsquoHiddenrsquo CATGCCTG bull Many variants small effects Pathway-level burdenload heritability CGTGTCTA bull Many false positives Prioritize w regulatory annotations
Cancer bull s of function CATGCCTG Los Protein-coding variants convergence mutations CATCCCTG bull Gain of function Regulatory variants heterogeneity
93
Characterizing sub-threshold variants in heart arrhythmia
copy source unknown All rights reservedThiscontent is excluded from our Creative
Commons license For more information see
httpocwmiteduhelpfaq-fair-use
Focus on sub-threshold variants
(eg rs1743292 P=10-42)
Trait QRSQT interval
(1) Large cohorts (2) many known hits (3) well-characterized tissue drivers 94
From Arking D E Pulit S L Crotti L Harst P V Munroe P BKoopmann T T Newton-Cheh C (2014) Genetic associationstudy of QT interval highlights role for calcium myocardial repolarizationNature Genetics Nat Genet 46(8) 826-836 Used with permission
Enhancers overlapping GWAS loci share functional properties
copy source unknown All rights reserved This content is excluded from our CreativeCommons license For more information see httpocwmiteduhelpfaq-fair-use
Train machine learning model to prioritize sub-threshold loci 95
Functional evidence for sub-threshold target genes
Zebrafish phenotypes Human genetics
copy source unknown All rights reserved This content is excluded from our CreativeCommons license For more information see httpocwmiteduhelpfaq-fair-use
Mouse phenotypes 96
Experimental validation of 11 sub-threshold loci
copy source unknown All rights reserved This content is excluded from our CreativeCommons license For more information see httpocwmiteduhelpfaq-fair-use
9 of 11 tested loci show allelic activity chromatin interactions
97
Functional evidence for rs1743292 causality (P=10-42)
Enhancer 4C links to target gene promoters Heart enhancer activity
Motif disruption Allelic DNase in multiple individuals copy source unknown All rights reserved This content is excluded from our CreativeCommons license For more information see httpocwmiteduhelpfaq-fair-use Allelic enha-
ncer activity 98
Target gene impact on heart conduction
Optical voltage mapping
zebrafish embryo hearts voltage-sensitive fluorescent dye
ventricle
atrium
transmembrane voltage (ventricle)
copy source unknown All rights reserved This content is excludedfrom our Creative Commons license For more information seehttpocwmiteduhelpfaq-fair-use
Detection and validation of a new cardiac locus
99
What would we need to discover rs1743292 without epigenomics
rs1743292 Minor allele frequency 0134
Effect size -05773 +- 017 msec With 68900 individuals 128 power to discover at plt5x10-8
bull rs1743292 has similar effect sizes as many genome-wide significant variants
bull Many GWAS variants discovered due to winnerrsquos curse often only have 5-
20 power to discover
bull Combining epigenomics and GWAS can
1 Confirm existing GWAS loci are real
2 Discover new sub-threshold loci with weak effect sizes low power
To reach 80 power to discover rs1743292 at plt5x10-8 we need 146700 individuals
100
Goal Personalized and Predictive Medicine 1 Intro to Epidemiology basis of human disease
enetic Epidemiology Genetic basis GWAS and screening Interpreting GWAS with functional genomics Calculating functional enrichments for GWAS loci
olecular epidemiology meQTLs Genotype-Epigenome association (cis-trans-) EWAS Epigenome-Disease association
esolving Causality Statistical Mendelian Randomization Application to genotype + methylation in AD
ystems Genomics and Epigenomics of disease Beyond single loci polygenic risk prediction models Sub-threshold loci and somatic heterogeneity in cancer
2 Gndash ndash ndash
3 Mndash ndash
4 Rndash ndash
5 Sndash ndash
101
This talk From loci to mechanisms
Building a reference map of the regulatory genome Enhancers Promoters Transcribed Repressed
Regions Enhancers promoters transcribed repressed Cell types Predict tissues and cell types of epigenomic act ivity Target genes Link variants to their target genes using eQTLs activity Hi-C Nucleotides Regulatory consequence of mutation Conservation PWMs Regulators Upstream regulators whose activity is disrupted by mutation
Application to GWAS hidden heritability and Cancer GWAS CATGCCTG bull 93 top hits non-coding Mechanism Cell type hits CGTGTCTA bull Lie in haplotype blocks Causal variant(s)
lsquoHiddenrsquo CATGCCTG bull Many variants small effects Pathway-level burdenload heritability CGTGTCTA bull Many false positives Prioritize w regulatory annotations
Cancer function CATGCCTG bull Loss of Protein-coding variants convergence mutations CATCCCTG bull Gain of function Regulatory variants heterogeneity
102
Regulatory convergence of dispersed driver mutations
copy source unknown All rights reserved This content is excluded from our CreativeCommons license For more information see httpocwmiteduhelpfaq-fair-use
Common mutations in regulatory plexus of each gene Richard Sallari 103
Cancer genes are more likely to be up-regulated
copy source unknown All rights reserved This content is excluded from our CreativeCommons license For more information see httpocwmiteduhelpfaq-fair-use
Richard Sallari 104
Dysregulated genes show dispersed non-coding mutations
copy source unknown All rights reserved This content is excluded from our CreativeCommons license For more information see httpocwmiteduhelpfaq-fair-use
Dysregulated genes are enriched for plexus mutations at all distances Richard Sallari 105
Non-coding mutations enriched in promoters enhancers active in other cell types
copy source unknown All rights reserved This content is excluded from our CreativeCommons license For more information see httpocwmiteduhelpfaq-fair-use
Disruptive mutations in lsquolowrsquo elements are enriched in enhancers and promoters in other tissues
Richard Sallari 106
Statistical model for excess of raresomatic variants
copy source unknown All rights reserved This content is excluded from our CreativeCommons license For more information see httpocwmiteduhelpfaq-fair-use
bullCorrect for region- state- tumor-specific rate variation 107
Convergence in immune signaling mitoch functions
copy source unknown All rights reserved This content is excluded from our CreativeCommons license For more information see httpocwmiteduhelpfaq-fair-use
bullPathway-level convergence hierarchical model 108
Richard Sallari
Non-coding drivers of prostate cancer dysregulation
Regulatory mutations reveal Convergence in immune signaling new cancer driver genes
mitochondrial functions
copy source unknown All rights reserved This content is excluded from our CreativeCommons license For more information see httpocwmiteduhelpfaq-fair-use
Convergence in inositol phosphate metabolism PLCB4 overexpression in PC3 prostate cancer adjacent to PTEN PIK3CA known cancer genes reduces ErkAkt activity synergistic with PTEN
109
Personal genomics tomorrow Already 100000s of complete genomes
bull Health disease quantitative traits ndash Genomics regions disease mechanism drug targets ndash Protein-coding cracking regulatory code variation ndash Single genes systems gene interactions pathways
bull Human ancestry ndash Resolve all of human ancestral relationships ndash Complete history of all migrations selective events ndash Resolve common inheritance vs trait association
bull Whatrsquos missing is the computation ndash New algorithms machine learning dimensionality reduction ndash Individualized treatment from 1000s genes genome ndash Understand missing heritability ndash Reveal co-evolution between geneselements ndash Correct for modulating effects in GWAS
110
Challenge ahead From research to clinic 1 Systematic medical genotyping sequencing
ndash Currently a curiosity future medical practice
2 Systematic medical molecular profiling
ndash Functional genomics in relevant cell types
3 Systematic perturbation studies for validation
ndash 1000s of regulatory predictions x 100s cell types
4 Systematic repurposing of approved drugs
ndash Systems-biology view of drug response
5 Genomics of drug response in cli nical trials
ndash Personalized drug prescription and combinations
6 Partnerships academia industry hospitals
ndash Interdisciplinary training in each of the instituttions 111
Summary Personalized amp Predictive Medicine 1 Intro to Epidemiology basis of human disease 2 Genetic Epidemiology
ndash Genetic basis GWAS and screening ndash Interpreting GWAS with functional genomics ndash Calculating functional enrichments for GWAS loci
3 Molecular epidemiology ndash meQTLs Genotype-Epigenome association (cis-trans-) ndash EWAS Epigenome-Disease association
4 Resolving Causality ndash Statistical Mendelian Randomization ndash Application to genotype + methylation in AD
5 Systems Genomics and Epigenomics of disease ndash Beyond single loci polygenic risk prediction models ndash Sub-threshold loci and somatic heterogeneity in cancer
112
MIT OpenCourseWarehttpocwmitedu
6047 6878 HST507 Computational BiologyFall 2015
For information about citing these materials or our Terms of Use visit httpocwmiteduterms

This talk From loci to mechanisms
Building a reference map of the regulatory genome
Regions Enhancers promoters transcribed repressed
Enhancers Promoters Transcribed Repressed
Cell types Predict tissues and cell types of epigenomic act ivity Target genes Link variants to their target genes using eQTLs activity Hi-C Nucleotides Regulatory consequence of mutation Conservation PWMs Regulators Upstream regulators whose activity is disrupted by mutation
Application to GWAS hidden heritability and Cancer GWAS CATGCCTG bull 93 top hits non-coding Mechanism Cell type hits CGTGTCTA bull Lie in haplotype blocks Causal variant(s)
lsquoHiddenrsquo CATGCCTG bull Many variants small effects Pathway-level burdenload heritability CGTGTCTA bull Many false positives Prioritize w regulatory annotations
Cancer CATGCCTG bull Loss of function Protein-coding variants convergence mutations CATCCCTG bull Gain of function Regulatory variants heterogeneity
21
Dissecting non-coding genetic associations
3 Causal nucleotide(s)
2 Target gene(s)
1 Tissuecell type(s)
4 Upstream regulator(s) TF
TF TF
5 Cellular phenotypes 6 Organismal phenotypes
GWAS region SNPs
1 Establish relevant tissuecell type
2 Establish downstream target gene(s)
3 Establishing causal nucleotide variant
4 Establish upstream regulator causality
5 Establish cellular phenotypic consequences
6 Establish organismal phenotypic consequences 22
Using epigenomic maps to predict disease-relevant tissues
23
St
em C
Imm
un
Hea
rtLi
ver
Region of association Individual SNPs
Height Type 1 Diabetes Blood Pressure
Cholesterol
Identifying disease-relevant cell types
ells
e
Stem Cell Immune Heart Liver Enhancers Enhancers Enhancers Enhancers
bull For every trait in the GWAS catalog
ndash Identify all associated regions at P-value threshold
ndash Consider all SNPs in credible interval (R2ge8)
ndash Evaluate overlap with tissue-specific enhancers
ndash Keep tissues showing significant enrichment (Plt0001) Repeat for all traits (rows) and all cell types (columns) bull
24
GWAS hits in enhancers of relevant cell types
25
T cells B cells
Digestive
Brain
ESLiver
Heart
Linking traits to their relevant celltissue types
copy source unknown All rights reserved This content is excluded from our Creative Commons license For more information see httpocwmiteduhelpfaq-fair-use 26
27
Immune activation + neural repression in human + mouse
Courtesy of Macmillan Publishers Limited Used with permissionSource Gjoneska E Pfenning A R Mathys H Quon GKundaje A Tsai L amp Kellis M (2015) Conserved Epigenomic signals inmice and humans reveal immune basis of Alzheimerrsquos disease Nature 518 (7539) 365-369 doi101038nature14252
Sample mouse brain epigenomics during Two contrasting signatures of neurodegeneration immune activation vs neural repression
Is inflammation simply a consequence of neuronal loss 28
Genetic evidence for immune vs neuronal components
Increasing Decreasing (immune) (neuronal)
Courtesy of Macmillan Publishers Limited Used with permission Source Gjoneska E Pfenning A R Mathys H Quon G Kundaje A Tsai L amp Kellis M (2015) Conserved Epigenomic signals in mice and humans reveal immune basis of Alzheimerrsquos disease Nature 518(7539) 365-369 doi101038nature14252
Only increasing (immune) enhancers Neuronal cell types are depleted enriched in AD-associated SNPs for AD-associated SNPs
Indicates immune cell dysregulation is causal component Microglial cells resident immune cells of adult brain Macrophages infiltrate brain in neurodegeneration
29
Using epigenomic annotations for fine-mapping disease regions
30
LD both a blessing amp
a curse
Observation LD blocks in which there is no evidence for historical
copy source unknown All rights reserved This content is excluded from our Creative recombination Commons license For more information see httpocwmiteduhelpfaq-fair-use 31
Causal variant not known in most GWAS regions
Courtesy of Macmillan Publishers Limited Used with permission Source Smemo S Tena J J Kim K Gamazon E R Sakabe N JGoacutemez-Mariacuten C
Noacutebrega M A (2014) Obesity-associated variants within FTO form long-range functional
connections with IRX3 Nature 507(7492) 371-375 doi101038nature13138
copy source unknown All rights reserved This content is excluded from our Creative
Commons license For more information see httpocwmiteduhelpfaq-fair-use
LD (Linkage disequilibrium) large regions co-inherited in blocks Blessing for initial mapping (few tags) curse for fine-mapping
Use functional annotations to predict causal variant(s)32
Multiple lines of evidence for fine-mapping
Courtesy of Macmillan Publishers Limited Used with permission Ward L D amp Kellis M (2012) Interpreting noncoding genetic variation in complex traits and human disease Nat Biotechnol Nature Biotechnology 30(11) 1095-1106 doi101038nbt2422 Used with permission
Ward and Kellis Nature Biotechnology 2012
bull Epigenomic information enhancers amp linking (target genes) bull Motif information causal variants amp upstream regulators bull Evolutionary conservation causal variants amp conserved motifs 33
Detect SNPs that disrupt conserved regulatory motifs
Courtesy of Macmillan Publishers Limited Used with permissionSource Lindblad-Toh Kerstin Manuel Garber Or Zuk Michael F Lin Brian J Parker
Ste fan Washietl Po uya Kh eradpou r et al ldquoA Hi gh-Resolu t ion Map o f Human Ev olutionary
Constraint Using 29 Mammalsrdquo Nature 478 no 7370 (2011) 476ndash82do i101038nature10530
bull Functionally-associated SNPs enriched in states constraint bull Prioritize candidates increase resolution disrupted motifs
34
Allele-specific chromatin marks cis-vs-trans effects
copy source unknown All ri ghts reserved This content i s excluded from our Creative Commons license For more information see httpocwmiteduhelpfaq-fair-use
bull Maternal and paternal GM12878 genomes sequenced bull Map reads to phased genome handle SNPs indels
35bull Correlate activity changes with sequence differences35
Predict effect of common rare somatic mutations
All Regulatory and epigenomic annotations
Raresomatic Predict TF binding disruption
Richard Sallari Common allelic activity in heterozygous lines Xinchen Wang
36
HaploReg public resource for dissecting GWAS
Courtesy of the authors License CC BY-NCSource Ward Lucas D and Manolis Kellis HaploReg a resource for exploring chromatin states conservation and regulatory
motif alterations within sets of genetically linked variants Nucleic Acids Research 40 no D1 (2012) D930-D934
bull Start with any list of SNPs or select a GWA study ndash Mine ENCODE and Roadmap epigenomics data for hits ndash Hundreds of assays dozens of cells conservation motifs ndash Report significant overlaps and link to infobrowser
bull Try it out httpcompbiomiteduHaploReg Ward Kellis NAR 2011 37
37
Predicting target genes
38
Three lines of linking evidence ticPhysical Functional Gene
copy source unknown All ri ghts reserved This content Courtesy of Macmillan Pu blishers Limited Used with permission Ward L D amp Kellis M (2012)
is excluded from our Creative Commons license Interpreting noncoding genetic variation in complex traits and human disease Nat Biotechnol
For more information see httpocwmiteduhelp Nature Biotechnology 30(11) 1095-1106 doi101038nbt2422 Used with permissionfaq-fair-use
Hi-C Physical Enhancer-gene eQTL evidence SNP proximity in 3D activity correlation effect on expression
39
39
Targets 3D folding and expr genetics indicate IRX3+IRX5
Cohort of 20 homozygous risk and 18 homozygous non -risk individuals Genotype-dependent expression
Dixon Nature 2012
Topological domains span 25Mb eQTL targets IRX3 and IRX5
Implicate 8 candidate genes
Risk allele increased expression
(gain-of-function) 404
copy source unknown All rights reserved This content isexcluded from our Creative Commons license For moreinformation see httpocwmiteduhelpfaq-fair-use
copy source unknown All rights reserved This content isexcluded from our Creative Commons license For moreinformation see httpocwmiteduhelpfaq-fair-use
40
Goal Personalized and Predictive Medicine 1 Intro to Epidemiology basis of human disease 2 Genetic Epidemiology
ndash Genetic basis GWAS and screening ndash Interpreting GWAS with functional genomics ndash Calculating functional enrichments for GWAS loci
3 Molecular epidemiology ndash meQTLs Genotype-Epigenome association (cis-trans-) ndash EWAS Epigenome-Disease association
4 Resolving Causality ndash Statistical Mendelian Randomization ndash Application to genotype + methylation in AD
5 Systems Genomics and Epigenomics of disease ndash Beyond single loci polygenic risk prediction models ndash Sub-threshold loci and somatic heterogeneity in cancer
41
Interpreting disease-association signals
(1) Interpret variants using Epigenomics - Chromatin states Enhancers promoters motifs
- Enrichment in individual loci across 1000s of SNPs in T1D
GWAS CATGACTG CATGCCTG
Genotype Disease
mQTLs
Epigenome MWAS
(2) Epigenome changes in disease - Intermediate molecular phenotypes associated with disease
- Variation in brain methylomes of Alzheimerrsquos patients 42
Goal Personalized and Predictive Medicine 1 Intro to Epidemiology basis of human disease
Genetic Epidemiology Genetic basis GWAS and screening Interpreting GWAS with functional genomics Calculating functional enrichments for GWAS loci
Molecular epidemiology meQTLs Genotype-Epigenome association (cis-trans-) EWAS Epigenome-Disease association
Resolving Causality Statistical Mendelian Randomization Application to genotype + methylation in AD
Systems Genomics and Epigenomics of disease Beyond single loci polygenic risk prediction models Sub-threshold loci and somatic heterogeneity in cancer
43
2 ndashndashndash
3 ndashndash
4 ndashndash
5 ndashndash
43
DXG
effects
causes
genome epigenome biomarkers
disease S
symptoms
C Econfounders environment
Molecular EpidemiologyMolecular Biomarkers of disease state
Gene expression DNA methylation chromatin in specific cell types
44
chr2
meQTLminuslinked CpG r^2
meQTL SNP r^2
SNP AAF
Genotype
BRNMIDFRNTL E073
BRNANGGYR E067
BRNANTCAUD E068
BRNCINGGYR E069
BRNHIPPMID E071
BRNINFTMP E072
BRNSUBNIG E074
LIVADLT E066
BLDCD14PC E029
BLDCD4MPC E037
BLDCD4CD25MCD45RANPC E039
LNGIMR90 E017
GISTMCMUS E111
SKINPENFRSKFIB01 E055
MUSTRNKFET E089
BONEOSTEO E129
Genes(+)
Genes(minus)
Mean Methylation
Normalized Methylation
Methylation StdDev
meQTLminuslinked CpG r^2
0
146
293
439
586
241400000 241500000 241600000 241700000 241800000 241900000 242000000 242100000 242200000 2423000003 5
241400000 241500000 241600000 241700000 241800000 241900000 242000000 242100000 242200000 2423000005 3
Genetic and epigenetic data in 750 Alzheimerrsquos patientscontrols MAP Memory and Aging Project
+ ROS Religious Order Study
Dorsolateral PFC
Reference Chromatin
states (Bernstein)
Genotype
(1M SNPs
x700 ind)
(De Jager)
BrainLiver Blood Lung GI Skin Muscle Bone
Methylation
(450k probes
x 700 ind)
(De Jager)
copy source unknown All rights reserved This content is excluded from our CreativeCommons license For more information see httpocwmiteduhelpfaq-fair-use
750 subjects initially cognitively normal Alzheimerrsquos diagnosed by pathology (Bennett) 45
Data Matrices ndash An example scenario n=750 individuals n=750 individuals n=750 individuals n=750 individuals
Genotype
g=1
20
00
00
0
Methylation
m=4
50
00
0
e=1
5 10
ldquoEnvironmentrdquo
p=
Phenotype (Disease)
M - Illumina Methylation 450k array 450000 probes targeting CpGs genome-wide
G - Affy SNP arrays imputed against CEU thousand genomes reference panel yielding 12m SNPs
E - Clinical covariates that might mask the variation due to our phenotype eg gender smoking age or sample batch
P - Phenotype of interest sometimes measured with multiple markers (clinical Alz diagnosis vs pathology Alz diagnosis vs count of neuritic plaques)
n -gt number of individuals in cohort 46
E environment
cause D G M Alzheimer genotype
methylation effects disease 46
EWAS Capturing variability in the Epigenomeattributable to disease
D X
Epigenome DNA methylation Phenotype
lzheimerrsquos Disease
E Environment
Age Education Gender etc
Known variable correction
C Experimental Technical
Cell type mixtures Batch effects Other
Unknown Confounders
Known amp ICA inferred variable
correction
EWAS Hundreds of AD associated loci
enriched in enhancers and relevant
pathways
G meQTL Genotype (~60K
5M Common CpGs) Variants
47
Excluding discovered and known covariates
copy source unknown All ri ghts reserved This content is excluded from our Creative Commons license For more information see httpocwmiteduhelpfaq-fair-use 48
Infer covariates using ICA
compare to known
exclude both
Strongest effects
bull Plate (batch)
bull Cell mixture
bull Bisulfite conversion
bull Gender
bull Age
Variance explained
bull Known 25
bull Inferred 35
bull Together 40
C Econfounders environment
DMG effects
cause
genotype methylation Disease
GenotypeMethylation Discovering mQTLs
Methylation Quantitative Trait Loci
49
cis-meQTLs
M
n=750 n=750 Use linear models to identify cis-meQTLs win some genomic window =4
50
00
0
00
00
00
G
m 12
g=
For methyl mark mi and SNP gj mi = β0 + β1(gj) + ε
bull Given several predictors is additional predictor increasing accuracy more than complexity introduced
bull Likelihood ratio testing paradigm predict methylation with and without genotype (only works for nested models)
bull Null hypothesis H0 β1=0 Additional model complexity rsquot explain a significant portion of variation in response
LM1 mi = β0 + ε LM2 mi = β0 + β1(gj) + ε
r term
2) (q ndash p) ) ( RSSLM2 (n ndash q) ) n-q) degrees of freedom is p-value is what we report in a meQTL study SSLM2 too small vs increase in model complexity
50
doesn
Test using F statistic - p is the number of parameters in LM1 - q is the number of parameters in LM2 - n is the sample size - RSS Residual sum of squares - β parameters to learn ε residual erroUnder null hypothesis ( (RSSLM1 ndash RSSLM
Is distributed as F distribution with (q-p If F statistic significant reject null Th Otherwise no meQTL ie RSSLM1 ndash R
50
cis-meQTLs
M
n n =4
50
00
0
00
00
00
G
m 12
g=
Alternative methods of detection
Permutation bull Correlate methylation and genotype bull For i in 1 -gt nperm
bull Permute genotypes bull Correlate methylation and genotype
bull Generate empirical p-value from permuted correlations
LMM Linear mixed models
bull
bull
51
00 05 10 15 20
02
04
06
Adjusted MA Dosage
Adju
sted
Met
hyla
tion
minus05 05 15
065
075
085
Adjusted MA Dosage
Adju
sted
Met
hyla
tion
minus05 05 15
060
064
068
072
rs17836662 cg10853533 minus44352
Adjusted MA Dosage
Adju
sted
Met
hyla
tion
minus05 05 15
010
020
030
rs7924341 cg20132549 minus1847
Adjusted MA Dosage
Adju
sted
Met
hyla
tion
1 2
3 4
1
2
3 4
Most epigenomic variability is genotype-driven Manhattan plot of 450000 methylation probes
P)
10
log
-(va
lue
-P
Chromosome and genomic position
Genome-wide significance at plt3x10-10
Prune for probes disrupted by SNP
0
bullbull 140000 CpGs associated with genotype at 1 FDR
55000 at Bonferroni-corrected P-value of 10-2
52
copy source unknown All rights reserved This content is excluded from our Creative
Commons license For more information see httpocwmiteduhelpfaq-fair-use
Scaling of discovery power with individuals
copy source unknown All rights reserved This content is excluded from our Creative
Commons license For more information see httpocwmiteduhelpfaq-fair-use
bull Number of meQTLs continues to increase linearly bull Weak-effect meQTLs median R2lt01 after 400 indiv 53
Goal Personalized and Predictive Medicine 1 Intro to Epidemiology basis of human disease 2 Genetic Epidemiology
ndash Genetic basis GWAS and screening ndash Interpreting GWAS with functional genomics ndash Calculating functional enrichments for GWAS loci
3 Molecular epidemiology ndash meQTLs Genotype-Epigenome association (cis-trans-) ndash EWAS Epigenome-Disease association
4 Resolving Causality ndash Statistical Mendelian Randomization ndash Application to genotype + methylation in AD
5 Systems Genomics and Epigenomics of disease ndash Beyond single loci polygenic risk prediction models ndash Sub-threshold loci and somatic heterogeneity in cancer
54
confounders
DMG effects
cause
genotype methylation
environment
Disease
C E
MethylationDisease EWAS
Epigenome-wide association study
55
eWAS
Methylation
n n
10 Phenotype
e= (Disease)
=45
00
00
m
Link methylationphenotype (~cis-eQTLs) linear models and hypothesis testing Predict phenotype using methylation
bullbull
LM1 pi
LM2 p = β0 + β1(m ) + ε = β0 + ε
i j
56
eWAS n n
Methylation
m=4
50
00
0
Phenotype (Disease) p
=1
0
n
ldquoEnvironmentrdquo e=
15
LM1 AD = β0 + β2(gender) + ε LM2 AD = β0 + β1(mj) + β2(gender) ε
Link methylationphenotype (~cis-eQTLs) bull linear models and hypothesis testing bull Predict phenotype using methylation
Problem variance due to phenotype probably very small (unless your phenotype is cancer) Needle in a haystack Control for other sources of variance to make the variance due to the phenotype stand out If phenotype is lzheimerrsquos (D) gender incorporates more variance into your M matrix than does AD
57
eWAS
Methylation
Phenotype (Disease)
n n
m=4
50
00
0
p=
10
ldquoEnvironmentrdquo
n
e=1
5
Might have many environmental variables to control for
LM1 AD = β0 + β2(gender) + β3(age) + β4(education) + lt + ε LM2 AD = β0 + β1(mj) + β2(gender) + β3(age) + β4(education) + lt + ε
58
eWAS Need to account for variance due to genotype as well
Methylation
Phenotype (Disease)
n n
m=4
50
00
0
p=
10
ldquoEnvironmentrdquo
n
e=1
5
Genotype
n
g=1
20
00
00
0
59
Role of enhancers vs promoters in lzheimerrsquos disease association
60
Enhancers are hemi-methylated and highly variable
Enhancers show most variable methylation
Promoters show least variable methylation
copy source unknown All rights reserved This content is excluded from our Creative
Commons license For more information see httpocwmiteduhelpfaq-fair-use
bull Highly distinct signatures for promoters vs enhancers
bull Enhancers hemi-methylated Methylation level Methylation level in each person (not bimodal)
61
SNP-associated CpGs in enhancers not promoters
bull Promoter methylation less affected by genetics bull Enhancer methylation highly genotype-driven
TSS flanking Enhancers Repressed
Enric
hmen
t for
meQ
TLs
12
5 Transcribed
Promoters
TxEnh
bull TSS-flanking and repressed regions also genetic62
AD-associated probes in distal enhancers Pe
r st
ate
(O
bs ndash
Exp
)
Tota
l
Enhancers
Promoters
copy source unknown All ri ghts reserved This content is excluded from our Creative
Commons license For more information see httpocwmiteduhelpfaq-fair-use
bull After cleaning with known and inferred covariates
bull Distal and transcribed enhancers enriched
Proximal regulators (promoters) depleted 63
bull 63
ICA covariate correction cleans up enhancer signal
Before
Orange Enrichment of enhancer probes for association with the real phenotype
Grey Enrichment of enhancer probes for a scrambled phenotype
After (After conditioning on 7 surrogate variables discovered with ICA)
Empirical p=006
Empirical plt0001
copy source unknown All rights reserved This content is excluded from our Creative
Commons license For more information see httpocwmiteduhelpfaq-fair-use 64
AD predictive power highest in enhancers
AP
OE
enhancers
methylome
promoters
All SNPs
Top predictive features are bullEnhancer
ethylation
ll me thyl
SS Het
enetics incl APOE)
ausality
ommon athways
m
bull A
bull T
bullG(
bull C
bullCp
copy source unknown All rights reserved This content is excluded from our Creative
Commons license For more information see httpocwmiteduhelpfaq-fair-use65
NRSF
ELK1
All probes ranked by AD assoc P-value
Nonminussignificant pathways Significant pathways
060
065
070
075
AUC using pathway feature selection p= 1922eminus11
AD prediction reveals likely biological pathways
All probes ranked by AD assoc P-value
CTCF
copy source unknown All rights reserved This content is excluded from our Creative
Commons license For more information see httpocwmiteduhelpfaq-fair-use
Enriched regulatory motifs
suggest potential pathway s
HEBTcf12 proliferating neural and progenitor cells
GATA cell growth blood cell development
66TLX1NFIC Neuronal cell fates Mouse AD models 66
Goal Personalized and Predictive Medicine 1 Intro to Epidemiology basis of human disease 2 Genetic Epidemiology
ndash Genetic basis GWAS and screening ndash Interpreting GWAS with functional genomics ndash Calculating functional enrichments for GWAS loci
3 Molecular epidemiology ndash meQTLs Genotype-Epigenome association (cis-trans-) ndash EWAS Epigenome-Disease association
4 Resolving Causality ndash Statistical Mendelian Randomization ndash Application to genotype + methylation in AD
5 Systems Genomics and Epigenomics of disease ndash Beyond single loci polygenic risk prediction models ndash Sub-threshold loci and somatic heterogeneity in cancer
67
67
ins
C E confounders environment
Risk factor causality w instrumental variables If XY are correlated possible scenarios are bull XY bull causes X Y
G Y bull XU Y Xtrument
risk factor outcome To distinguish need effects controlled random experiment
Is risk factor X causing disease Y (or a consequence)
ndash Eg alcohol addiction smoking blood cholesterol fever stress Randomized experiment with and without X feasibility ethics
G randomized experiment (eg random Mendelian inheritance) as only some subjects have genotype
G (iv)must be correlated with Y but only through X ie if X known G gives no additional information about Y
68
bull
bull
bull
68
In silico thought experiment
0 200 400 600 80000
02
04
06
08
10
p=2946466eminus35noi
atylh
etM
Subjects
ADnonAD
0 200 400 600 80000
02
04
06
08
10
p=3847832eminus05
noiat
ylhet
M
Subjects
ADnonAD
Same effect due to Alz but with larger effect due to genotype
CC
Small but significant effect due to Alz
CA
copy source unknown All rights reserved This content is excluded from our Creative
Commons license For more information see httpocwmiteduhelpfaq-fair-use
Hemi-methylation associated with meQTL yields a p-value thatrsquos 30 orders of magnitude lower for the AD phenotype
69
MGE P+ + = GE P+ =
From G include probe-specific terms for cis-meQTLs as well as including trans-meQTLs in all comparisons
VS
Mendelian randomization approach Account for variance due to genotype how much does methylation add
With variability due to genotype and environmental covariates removed the effect due to phenotype should become more prevalent
70
Causality testing
71
Modeling complex Human diseases bull Three possible models
1 Independent Associations
D
MG X
2 Causal Pathway Model
3 Interaction Model
D
G
M
Genotype
DG M
D
MG
72
Methylation
Disease
(1) Independent Associations
D
MG X
bull Association between Factor A and Disease bull Association between Factor B and Disease bull No association between Factor A and Factor B
G Factor A
bull Example 2 independent risk genes X Factor B
Y Disease D 73
(2) Causal Pathway Models
bull Is the a direct link between risk factor (A) and disease (D)
DA
bull Does the risk factorrsquos () effect on disease (D) depend on an intermediate step (B)
DA B
bull To test ndash A is associated with B and D ndash B is associated with D ndash A is not associated with D when controlling for
ndash Note A MUST come before B temporally
B
D
G
X
Factor A
Factor B
Disease D 74
(2) Causal Pathway Models
bull In reality its a little of both rsquos affect on D is partially mediated through B
A DB
bull To test ndash A is associated with B and D ndash B is associated with D ndash The effect size of A on D is decreased when con
ndash Note A MUST come before B temporally
bull Example CR1 effect on cognitive decline
trolling for B
A Factor A Factor B Disease D D
B
75
(3) Interaction Models
bull Factor Brsquos effect on D is different depending on value for factor
B (A = Aa)
B (A = AA)
D
B (A = aa)
bull To test ndash A + B + AB D if estimate for AB is significant then ndash Stratify by levels of A
bull Example
ndash drugrsquos effect is different depending on genotype ndash More to comelt
76
Gene locus reference Published
AD AD NP
BIN1
CD2AP
CD33
rs744373
rs9349407
rs3865444
Seshadri 2010
Naj 2011Hollingsworth 2011
Naj 2011Hollingsworth 2012
16x10-11
86x10-9
16x10-9
0204
0445
0133
0480
0221
0123
ABCA7 rs3764650 Hollingsworth 2010 50x10-21 0747 0187 APOE Any ε4 12x10-13 18x10-23
CLU rs11136000 Lambert 2009Harold 2009 75x10-9 0762 0649 CR1 rs6656401 Lambert 2009 37x10-9 00009 0057
EPHA1 rs11767557 Naj 2011Hollingsworth 2011 60x10-10 0562 0391 MS4A4A rs4938933 Naj 2011 17x10-9 0792 0567 MS4A6A rs610932 Hollingsworth 2010 12x10-16 0534 0820
MTHFD1L rs11754661 Naj 2010 19x10-10 0126 0934 PICALM rs3851179 Harold 2009 19x10-8 0382 0171
Application to 12 AD GWAS loci
77
Tangles
CR1 Causal pathway model
Risk Factors Pathology Clinical Disease
Alzheimerrsquos disease
Genetic CR1
Cognitive Decline
AD specific Neuritic Plaque Neurofibulary
bull CR1 first associated with AD in 2009 bull Original associated variant is in an intron no clear function bull Unclear how CR1 locus influences AD susceptibility mechanistically
bull
Questions ndash Is the effect only on AD ndash Is there a broader effect on cognitive decline ndash Is there an association with AD pathology ndash Does it go through pathology to have an effect of cognitive decline
78
CR1 (rs6656401)
CR1 Pathology
04
045
05
055
06
065
07
075
08
085
Neuritic Plaque Neurofibillary Tangles
TT ATAA (risk allele)
CR1 Global Cognitive Decline
p=00008
p=0008 p=010
Pathology Global Cognitive Decline p lt 00001 time
79
Matt Eaton Phil De Jager
Epigenome
Genetic + Epigenetic variation in lzheimerrsquos
Relate to genotype and AD variation 723 AD patients amp controls Methylation variation in
Genome
meQTL
Phenotype
Classification Epigenome MWAS
1 2
copy source unknown All rights reserved This content isexcluded from our Creative Commons license For moreinformation see httpocwmiteduhelpfaq-fair-use
Methylation gtgt SNPs Estimate causal M roles regression Enhancers gtgt promoters of meQTL effects reduces MD
copy source unknown All rights reserved This content is excluded
from our Creative Commons license For more information see
httpocwmiteduhelpfaq-fair-use 80
Goal Personalized and Predictive Medicine 1 Intro to Epidemiology basis of human disease 2 Genetic Epidemiology
ndash Genetic basis GWAS and screening ndash Interpreting GWAS with functional genomics ndash Calculating functional enrichments for GWAS loci
3 Molecular epidemiology ndash meQTLs Genotype-Epigenome association (cis-trans-) ndash EWAS Epigenome-Disease association
4 Resolving Causality ndash Statistical Mendelian Randomization ndash Application to genotype + methylation in AD
5 Systems Genomics and Epigenomics of disease ndash Beyond single loci polygenic risk prediction models ndash Sub-threshold loci and somatic heterogeneity in cancer
81
Beyond top-scoring hits 1000s of variants of weak effect
cluster in cell type specific enhancers
82
Rank-based functional testing of weak associations
Enrichment peaks at 10000s of SNPs down the rank list even after LD pruning
copy source unknown All rights reserved This content is excluded from our Creative
Commons license For more information see httpocwmiteduhelpfaq-fair-use
bull Rank all SNPs based on GWAS signal strength bull Functional enrichment for cell types and states 83
Weak-effect T1D hits in 50k T-cell enhancers enhancers
CD4+ T-cells
T-cells B-cells
Other cell types
copy source unknown All rights reserved This content is excluded from our Creative
Commons license For more information see httpocwmiteduhelpfaq-fair-use
bull LD-pruning (CEU r2gt2) 50k 41k independ loci 84
Cell type specificity stronger for enhancers enhancers promoters
transcribed
CD4+ T-cells
T-cells B-cells
Other cell types
copy source unknown All rights reserved This content is excluded from our Creative
Commons license For more information see httpocwmiteduhelpfaq-fair-use
bull TB-cells also enriched for promoters transcribed bull Enhancer enrichment much more cell type specific 85
T1DRA-enriched enhancers spread across genome
copy source unknown All rights reserved This content is excluded from our Creative
Commons license For more information see httpocw miteduhelpfaq-fair-use
bull High concentration of loci in MHC high overlapbull Yet many distinct regions 1000s of distinct loci 86
Implications for genetic predisposition polygenic models for risk prediction
87
1
Basic setup of polygenic risk prediction studies Case-control cohort w genotype + phenotype
Training cohort Testing cohort
Selection of SNPs Estimation of effects Ranking
Apply predictor Evaluate accuracy
Apply predictor w estimated confidence
Target cohort genotyped individuals
(no phenotypes)
1
(power matters) (power matters) (power limited to one individual at a time)
2
bull Applications 1 (testing cohort) ndash Understand total heritability captured in common variants
ndash Understand disease ldquoarchitecturerdquo number of SNPs ndash Recognize functional classes associated with weak genetic associations
bull Applications 2 2 (new individuals) ndash Provide health recommendations at the individual level
ndash Prioritize high-risk individuals for subsequent testing at population level 88
How many SNPs to include in model
scor
ec
nige
ly p
ohe
of t
ue
-val
Pct
ed
peex
Dudridge PLoS Genetics 2013 pi0Proportion of markers with no effect Purcell Nature 2009
Schizophrenia risk prediction
lsquoonly 5 matterrsquo
lsquoonly 10 matterrsquo(but still canrsquot tellWhich ones until lsquoall matterrsquo Full rank list)
inclusion threshold copy source unknown All rights reserved This content is excluded from our CreativeCommons license For more information see httpocwmiteduhelpfaq-fair-use
bull It depends on ndash Architecture Fraction of SNPs that are estimated to be functional ndash Power Number of individuals in cohort ie ability to rank correctly It only peaks at 5 (asymp1-pi0) when sufficient power to rank ndash Large fraction of associated markers are hidden within non-significant SNPs
bull
bull For pi0=090 still need to include all SNPs to maximize predictive power 89
Application to pleiotropy and common risk Trait 1 (schizophrenia) Case-control cohort w genotype + phenotype
Selection of SNPs Estimation of effects Ranking
Apply predictor Evaluate accuracy
Trait 2 (bipolar disorder) Case-control cohort w genotype + phenotype
bull Ability to assess common genetic risk Are the highly-ranked SNPs for one study relevant to a different study
Is there a shared genetic architecture between seemingly unrelated traits
irst use showed schizophrenia and bipolar disorder common risk Schizophrenia-ranked SNPs in one cohortlt
lt are predictive of bipolar disorder diagnosis lt but not predictive of unrelated (cardiovascular) traits
ndashndash
bull Fndashndashndash
90
Important pointscaveats for risk prediction bull Always limited by genetic component
ndash Environment random effects play big role for most traits
bull Mendelian=deterministic vs common variants=probic
ndash Only a first screen for individuals at risk
bull Limited by discovery power
ndash Cohort size limits discriminative power and ranking ability
bull Limited by genotyped SNPvs vs all SNPs
ndash Selection pushes fitness-reducing variants to lower freq
ndash Genotyped SNPs selected to be common
bull Even if SNPs are correctly id entified their effects are not
ndash Winnerrsquos curse over-estimate above-threshold true effect
bull Training and testing cohort non-independence
ndash Relatives cryptic relatedness population stratification inflate est 91
91
Goal Personalized and Predictive Medicine 1 Intro to Epidemiology basis of human disease 2 Genetic Epidemiology
ndash Genetic basis GWAS and screening ndash Interpreting GWAS with functional genomics ndash Calculating functional enrichments for GWAS loci
3 Molecular epidemiology ndash meQTLs Genotype-Epigenome association (cis-trans-) ndash EWAS Epigenome-Disease association
4 Resolving Causality ndash Statistical Mendelian Randomization ndash Application to genotype + methylation in AD
5 Systems Genomics and Epigenomics of disease ndash Beyond single loci polygenic risk prediction models ndash Sub-threshold loci and somatic heterogeneity in cancer
92
This talk From loci to mechanisms
Building a reference map of the regulatory genome Enhancers Promoters Transcribed Repressed
Regions Enhancers promoters transcribed repressed Cell types Predict tissues and cell types of epigenomic act ivity Target genes Link variants to their target genes using eQTLs activity Hi-C Nucleotides Regulatory consequence of mutation Conservation PWMs Regulators Upstream regulators whose activity is disrupted by mutation
Application to GWAS hidden heritability and Cancer GWAS CATGCCTG bull 93 top hits non-coding Mechanism Cell type hits CGTGTCTA bull Lie in haplotype blocks Causal variant(s)
lsquoHiddenrsquo CATGCCTG bull Many variants small effects Pathway-level burdenload heritability CGTGTCTA bull Many false positives Prioritize w regulatory annotations
Cancer bull s of function CATGCCTG Los Protein-coding variants convergence mutations CATCCCTG bull Gain of function Regulatory variants heterogeneity
93
Characterizing sub-threshold variants in heart arrhythmia
copy source unknown All rights reservedThiscontent is excluded from our Creative
Commons license For more information see
httpocwmiteduhelpfaq-fair-use
Focus on sub-threshold variants
(eg rs1743292 P=10-42)
Trait QRSQT interval
(1) Large cohorts (2) many known hits (3) well-characterized tissue drivers 94
From Arking D E Pulit S L Crotti L Harst P V Munroe P BKoopmann T T Newton-Cheh C (2014) Genetic associationstudy of QT interval highlights role for calcium myocardial repolarizationNature Genetics Nat Genet 46(8) 826-836 Used with permission
Enhancers overlapping GWAS loci share functional properties
copy source unknown All rights reserved This content is excluded from our CreativeCommons license For more information see httpocwmiteduhelpfaq-fair-use
Train machine learning model to prioritize sub-threshold loci 95
Functional evidence for sub-threshold target genes
Zebrafish phenotypes Human genetics
copy source unknown All rights reserved This content is excluded from our CreativeCommons license For more information see httpocwmiteduhelpfaq-fair-use
Mouse phenotypes 96
Experimental validation of 11 sub-threshold loci
copy source unknown All rights reserved This content is excluded from our CreativeCommons license For more information see httpocwmiteduhelpfaq-fair-use
9 of 11 tested loci show allelic activity chromatin interactions
97
Functional evidence for rs1743292 causality (P=10-42)
Enhancer 4C links to target gene promoters Heart enhancer activity
Motif disruption Allelic DNase in multiple individuals copy source unknown All rights reserved This content is excluded from our CreativeCommons license For more information see httpocwmiteduhelpfaq-fair-use Allelic enha-
ncer activity 98
Target gene impact on heart conduction
Optical voltage mapping
zebrafish embryo hearts voltage-sensitive fluorescent dye
ventricle
atrium
transmembrane voltage (ventricle)
copy source unknown All rights reserved This content is excludedfrom our Creative Commons license For more information seehttpocwmiteduhelpfaq-fair-use
Detection and validation of a new cardiac locus
99
What would we need to discover rs1743292 without epigenomics
rs1743292 Minor allele frequency 0134
Effect size -05773 +- 017 msec With 68900 individuals 128 power to discover at plt5x10-8
bull rs1743292 has similar effect sizes as many genome-wide significant variants
bull Many GWAS variants discovered due to winnerrsquos curse often only have 5-
20 power to discover
bull Combining epigenomics and GWAS can
1 Confirm existing GWAS loci are real
2 Discover new sub-threshold loci with weak effect sizes low power
To reach 80 power to discover rs1743292 at plt5x10-8 we need 146700 individuals
100
Goal Personalized and Predictive Medicine 1 Intro to Epidemiology basis of human disease
enetic Epidemiology Genetic basis GWAS and screening Interpreting GWAS with functional genomics Calculating functional enrichments for GWAS loci
olecular epidemiology meQTLs Genotype-Epigenome association (cis-trans-) EWAS Epigenome-Disease association
esolving Causality Statistical Mendelian Randomization Application to genotype + methylation in AD
ystems Genomics and Epigenomics of disease Beyond single loci polygenic risk prediction models Sub-threshold loci and somatic heterogeneity in cancer
2 Gndash ndash ndash
3 Mndash ndash
4 Rndash ndash
5 Sndash ndash
101
This talk From loci to mechanisms
Building a reference map of the regulatory genome Enhancers Promoters Transcribed Repressed
Regions Enhancers promoters transcribed repressed Cell types Predict tissues and cell types of epigenomic act ivity Target genes Link variants to their target genes using eQTLs activity Hi-C Nucleotides Regulatory consequence of mutation Conservation PWMs Regulators Upstream regulators whose activity is disrupted by mutation
Application to GWAS hidden heritability and Cancer GWAS CATGCCTG bull 93 top hits non-coding Mechanism Cell type hits CGTGTCTA bull Lie in haplotype blocks Causal variant(s)
lsquoHiddenrsquo CATGCCTG bull Many variants small effects Pathway-level burdenload heritability CGTGTCTA bull Many false positives Prioritize w regulatory annotations
Cancer function CATGCCTG bull Loss of Protein-coding variants convergence mutations CATCCCTG bull Gain of function Regulatory variants heterogeneity
102
Regulatory convergence of dispersed driver mutations
copy source unknown All rights reserved This content is excluded from our CreativeCommons license For more information see httpocwmiteduhelpfaq-fair-use
Common mutations in regulatory plexus of each gene Richard Sallari 103
Cancer genes are more likely to be up-regulated
copy source unknown All rights reserved This content is excluded from our CreativeCommons license For more information see httpocwmiteduhelpfaq-fair-use
Richard Sallari 104
Dysregulated genes show dispersed non-coding mutations
copy source unknown All rights reserved This content is excluded from our CreativeCommons license For more information see httpocwmiteduhelpfaq-fair-use
Dysregulated genes are enriched for plexus mutations at all distances Richard Sallari 105
Non-coding mutations enriched in promoters enhancers active in other cell types
copy source unknown All rights reserved This content is excluded from our CreativeCommons license For more information see httpocwmiteduhelpfaq-fair-use
Disruptive mutations in lsquolowrsquo elements are enriched in enhancers and promoters in other tissues
Richard Sallari 106
Statistical model for excess of raresomatic variants
copy source unknown All rights reserved This content is excluded from our CreativeCommons license For more information see httpocwmiteduhelpfaq-fair-use
bullCorrect for region- state- tumor-specific rate variation 107
Convergence in immune signaling mitoch functions
copy source unknown All rights reserved This content is excluded from our CreativeCommons license For more information see httpocwmiteduhelpfaq-fair-use
bullPathway-level convergence hierarchical model 108
Richard Sallari
Non-coding drivers of prostate cancer dysregulation
Regulatory mutations reveal Convergence in immune signaling new cancer driver genes
mitochondrial functions
copy source unknown All rights reserved This content is excluded from our CreativeCommons license For more information see httpocwmiteduhelpfaq-fair-use
Convergence in inositol phosphate metabolism PLCB4 overexpression in PC3 prostate cancer adjacent to PTEN PIK3CA known cancer genes reduces ErkAkt activity synergistic with PTEN
109
Personal genomics tomorrow Already 100000s of complete genomes
bull Health disease quantitative traits ndash Genomics regions disease mechanism drug targets ndash Protein-coding cracking regulatory code variation ndash Single genes systems gene interactions pathways
bull Human ancestry ndash Resolve all of human ancestral relationships ndash Complete history of all migrations selective events ndash Resolve common inheritance vs trait association
bull Whatrsquos missing is the computation ndash New algorithms machine learning dimensionality reduction ndash Individualized treatment from 1000s genes genome ndash Understand missing heritability ndash Reveal co-evolution between geneselements ndash Correct for modulating effects in GWAS
110
Challenge ahead From research to clinic 1 Systematic medical genotyping sequencing
ndash Currently a curiosity future medical practice
2 Systematic medical molecular profiling
ndash Functional genomics in relevant cell types
3 Systematic perturbation studies for validation
ndash 1000s of regulatory predictions x 100s cell types
4 Systematic repurposing of approved drugs
ndash Systems-biology view of drug response
5 Genomics of drug response in cli nical trials
ndash Personalized drug prescription and combinations
6 Partnerships academia industry hospitals
ndash Interdisciplinary training in each of the instituttions 111
Summary Personalized amp Predictive Medicine 1 Intro to Epidemiology basis of human disease 2 Genetic Epidemiology
ndash Genetic basis GWAS and screening ndash Interpreting GWAS with functional genomics ndash Calculating functional enrichments for GWAS loci
3 Molecular epidemiology ndash meQTLs Genotype-Epigenome association (cis-trans-) ndash EWAS Epigenome-Disease association
4 Resolving Causality ndash Statistical Mendelian Randomization ndash Application to genotype + methylation in AD
5 Systems Genomics and Epigenomics of disease ndash Beyond single loci polygenic risk prediction models ndash Sub-threshold loci and somatic heterogeneity in cancer
112
MIT OpenCourseWarehttpocwmitedu
6047 6878 HST507 Computational BiologyFall 2015
For information about citing these materials or our Terms of Use visit httpocwmiteduterms
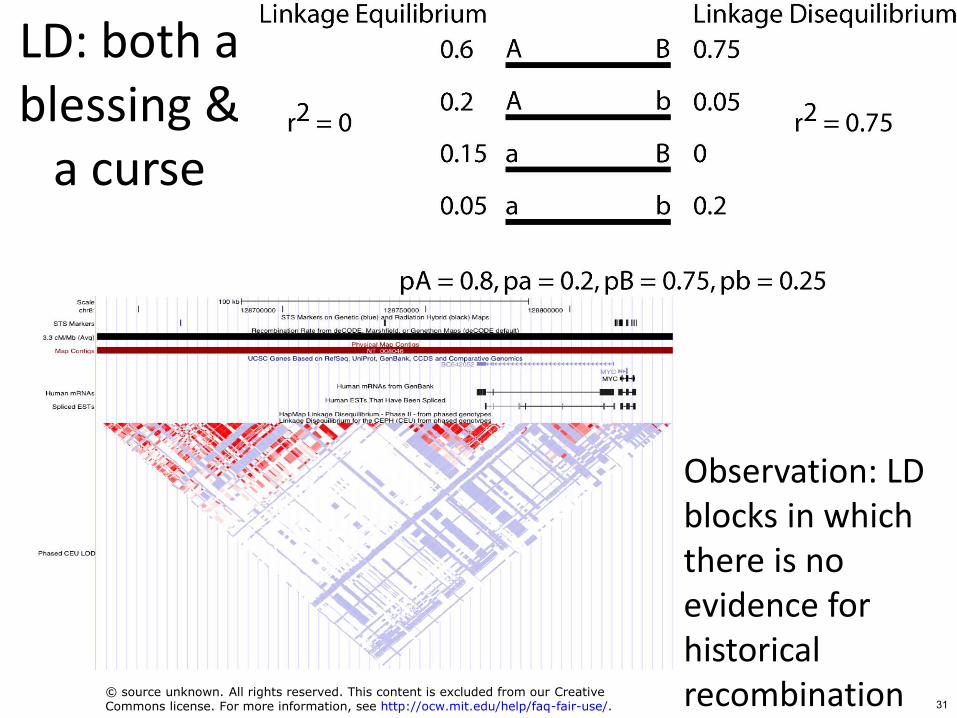

Goal Personalized and Predictive Medicine 1 Intro to Epidemiology basis of human disease 2 Genetic Epidemiology
ndash Genetic basis GWAS and screening ndash Interpreting GWAS with functional genomics ndash Calculating functional enrichments for GWAS loci
3 Molecular epidemiology ndash meQTLs Genotype-Epigenome association (cis-trans-) ndash EWAS Epigenome-Disease association
4 Resolving Causality ndash Statistical Mendelian Randomization ndash Application to genotype + methylation in AD
5 Systems Genomics and Epigenomics of disease ndash Beyond single loci polygenic risk prediction models ndash Sub-threshold loci and somatic heterogeneity in cancer
41
Interpreting disease-association signals
(1) Interpret variants using Epigenomics - Chromatin states Enhancers promoters motifs
- Enrichment in individual loci across 1000s of SNPs in T1D
GWAS CATGACTG CATGCCTG
Genotype Disease
mQTLs
Epigenome MWAS
(2) Epigenome changes in disease - Intermediate molecular phenotypes associated with disease
- Variation in brain methylomes of Alzheimerrsquos patients 42
Goal Personalized and Predictive Medicine 1 Intro to Epidemiology basis of human disease
Genetic Epidemiology Genetic basis GWAS and screening Interpreting GWAS with functional genomics Calculating functional enrichments for GWAS loci
Molecular epidemiology meQTLs Genotype-Epigenome association (cis-trans-) EWAS Epigenome-Disease association
Resolving Causality Statistical Mendelian Randomization Application to genotype + methylation in AD
Systems Genomics and Epigenomics of disease Beyond single loci polygenic risk prediction models Sub-threshold loci and somatic heterogeneity in cancer
43
2 ndashndashndash
3 ndashndash
4 ndashndash
5 ndashndash
43
DXG
effects
causes
genome epigenome biomarkers
disease S
symptoms
C Econfounders environment
Molecular EpidemiologyMolecular Biomarkers of disease state
Gene expression DNA methylation chromatin in specific cell types
44
chr2
meQTLminuslinked CpG r^2
meQTL SNP r^2
SNP AAF
Genotype
BRNMIDFRNTL E073
BRNANGGYR E067
BRNANTCAUD E068
BRNCINGGYR E069
BRNHIPPMID E071
BRNINFTMP E072
BRNSUBNIG E074
LIVADLT E066
BLDCD14PC E029
BLDCD4MPC E037
BLDCD4CD25MCD45RANPC E039
LNGIMR90 E017
GISTMCMUS E111
SKINPENFRSKFIB01 E055
MUSTRNKFET E089
BONEOSTEO E129
Genes(+)
Genes(minus)
Mean Methylation
Normalized Methylation
Methylation StdDev
meQTLminuslinked CpG r^2
0
146
293
439
586
241400000 241500000 241600000 241700000 241800000 241900000 242000000 242100000 242200000 2423000003 5
241400000 241500000 241600000 241700000 241800000 241900000 242000000 242100000 242200000 2423000005 3
Genetic and epigenetic data in 750 Alzheimerrsquos patientscontrols MAP Memory and Aging Project
+ ROS Religious Order Study
Dorsolateral PFC
Reference Chromatin
states (Bernstein)
Genotype
(1M SNPs
x700 ind)
(De Jager)
BrainLiver Blood Lung GI Skin Muscle Bone
Methylation
(450k probes
x 700 ind)
(De Jager)
copy source unknown All rights reserved This content is excluded from our CreativeCommons license For more information see httpocwmiteduhelpfaq-fair-use
750 subjects initially cognitively normal Alzheimerrsquos diagnosed by pathology (Bennett) 45
Data Matrices ndash An example scenario n=750 individuals n=750 individuals n=750 individuals n=750 individuals
Genotype
g=1
20
00
00
0
Methylation
m=4
50
00
0
e=1
5 10
ldquoEnvironmentrdquo
p=
Phenotype (Disease)
M - Illumina Methylation 450k array 450000 probes targeting CpGs genome-wide
G - Affy SNP arrays imputed against CEU thousand genomes reference panel yielding 12m SNPs
E - Clinical covariates that might mask the variation due to our phenotype eg gender smoking age or sample batch
P - Phenotype of interest sometimes measured with multiple markers (clinical Alz diagnosis vs pathology Alz diagnosis vs count of neuritic plaques)
n -gt number of individuals in cohort 46
E environment
cause D G M Alzheimer genotype
methylation effects disease 46
EWAS Capturing variability in the Epigenomeattributable to disease
D X
Epigenome DNA methylation Phenotype
lzheimerrsquos Disease
E Environment
Age Education Gender etc
Known variable correction
C Experimental Technical
Cell type mixtures Batch effects Other
Unknown Confounders
Known amp ICA inferred variable
correction
EWAS Hundreds of AD associated loci
enriched in enhancers and relevant
pathways
G meQTL Genotype (~60K
5M Common CpGs) Variants
47
Excluding discovered and known covariates
copy source unknown All ri ghts reserved This content is excluded from our Creative Commons license For more information see httpocwmiteduhelpfaq-fair-use 48
Infer covariates using ICA
compare to known
exclude both
Strongest effects
bull Plate (batch)
bull Cell mixture
bull Bisulfite conversion
bull Gender
bull Age
Variance explained
bull Known 25
bull Inferred 35
bull Together 40
C Econfounders environment
DMG effects
cause
genotype methylation Disease
GenotypeMethylation Discovering mQTLs
Methylation Quantitative Trait Loci
49
cis-meQTLs
M
n=750 n=750 Use linear models to identify cis-meQTLs win some genomic window =4
50
00
0
00
00
00
G
m 12
g=
For methyl mark mi and SNP gj mi = β0 + β1(gj) + ε
bull Given several predictors is additional predictor increasing accuracy more than complexity introduced
bull Likelihood ratio testing paradigm predict methylation with and without genotype (only works for nested models)
bull Null hypothesis H0 β1=0 Additional model complexity rsquot explain a significant portion of variation in response
LM1 mi = β0 + ε LM2 mi = β0 + β1(gj) + ε
r term
2) (q ndash p) ) ( RSSLM2 (n ndash q) ) n-q) degrees of freedom is p-value is what we report in a meQTL study SSLM2 too small vs increase in model complexity
50
doesn
Test using F statistic - p is the number of parameters in LM1 - q is the number of parameters in LM2 - n is the sample size - RSS Residual sum of squares - β parameters to learn ε residual erroUnder null hypothesis ( (RSSLM1 ndash RSSLM
Is distributed as F distribution with (q-p If F statistic significant reject null Th Otherwise no meQTL ie RSSLM1 ndash R
50
cis-meQTLs
M
n n =4
50
00
0
00
00
00
G
m 12
g=
Alternative methods of detection
Permutation bull Correlate methylation and genotype bull For i in 1 -gt nperm
bull Permute genotypes bull Correlate methylation and genotype
bull Generate empirical p-value from permuted correlations
LMM Linear mixed models
bull
bull
51
00 05 10 15 20
02
04
06
Adjusted MA Dosage
Adju
sted
Met
hyla
tion
minus05 05 15
065
075
085
Adjusted MA Dosage
Adju
sted
Met
hyla
tion
minus05 05 15
060
064
068
072
rs17836662 cg10853533 minus44352
Adjusted MA Dosage
Adju
sted
Met
hyla
tion
minus05 05 15
010
020
030
rs7924341 cg20132549 minus1847
Adjusted MA Dosage
Adju
sted
Met
hyla
tion
1 2
3 4
1
2
3 4
Most epigenomic variability is genotype-driven Manhattan plot of 450000 methylation probes
P)
10
log
-(va
lue
-P
Chromosome and genomic position
Genome-wide significance at plt3x10-10
Prune for probes disrupted by SNP
0
bullbull 140000 CpGs associated with genotype at 1 FDR
55000 at Bonferroni-corrected P-value of 10-2
52
copy source unknown All rights reserved This content is excluded from our Creative
Commons license For more information see httpocwmiteduhelpfaq-fair-use
Scaling of discovery power with individuals
copy source unknown All rights reserved This content is excluded from our Creative
Commons license For more information see httpocwmiteduhelpfaq-fair-use
bull Number of meQTLs continues to increase linearly bull Weak-effect meQTLs median R2lt01 after 400 indiv 53
Goal Personalized and Predictive Medicine 1 Intro to Epidemiology basis of human disease 2 Genetic Epidemiology
ndash Genetic basis GWAS and screening ndash Interpreting GWAS with functional genomics ndash Calculating functional enrichments for GWAS loci
3 Molecular epidemiology ndash meQTLs Genotype-Epigenome association (cis-trans-) ndash EWAS Epigenome-Disease association
4 Resolving Causality ndash Statistical Mendelian Randomization ndash Application to genotype + methylation in AD
5 Systems Genomics and Epigenomics of disease ndash Beyond single loci polygenic risk prediction models ndash Sub-threshold loci and somatic heterogeneity in cancer
54
confounders
DMG effects
cause
genotype methylation
environment
Disease
C E
MethylationDisease EWAS
Epigenome-wide association study
55
eWAS
Methylation
n n
10 Phenotype
e= (Disease)
=45
00
00
m
Link methylationphenotype (~cis-eQTLs) linear models and hypothesis testing Predict phenotype using methylation
bullbull
LM1 pi
LM2 p = β0 + β1(m ) + ε = β0 + ε
i j
56
eWAS n n
Methylation
m=4
50
00
0
Phenotype (Disease) p
=1
0
n
ldquoEnvironmentrdquo e=
15
LM1 AD = β0 + β2(gender) + ε LM2 AD = β0 + β1(mj) + β2(gender) ε
Link methylationphenotype (~cis-eQTLs) bull linear models and hypothesis testing bull Predict phenotype using methylation
Problem variance due to phenotype probably very small (unless your phenotype is cancer) Needle in a haystack Control for other sources of variance to make the variance due to the phenotype stand out If phenotype is lzheimerrsquos (D) gender incorporates more variance into your M matrix than does AD
57
eWAS
Methylation
Phenotype (Disease)
n n
m=4
50
00
0
p=
10
ldquoEnvironmentrdquo
n
e=1
5
Might have many environmental variables to control for
LM1 AD = β0 + β2(gender) + β3(age) + β4(education) + lt + ε LM2 AD = β0 + β1(mj) + β2(gender) + β3(age) + β4(education) + lt + ε
58
eWAS Need to account for variance due to genotype as well
Methylation
Phenotype (Disease)
n n
m=4
50
00
0
p=
10
ldquoEnvironmentrdquo
n
e=1
5
Genotype
n
g=1
20
00
00
0
59
Role of enhancers vs promoters in lzheimerrsquos disease association
60
Enhancers are hemi-methylated and highly variable
Enhancers show most variable methylation
Promoters show least variable methylation
copy source unknown All rights reserved This content is excluded from our Creative
Commons license For more information see httpocwmiteduhelpfaq-fair-use
bull Highly distinct signatures for promoters vs enhancers
bull Enhancers hemi-methylated Methylation level Methylation level in each person (not bimodal)
61
SNP-associated CpGs in enhancers not promoters
bull Promoter methylation less affected by genetics bull Enhancer methylation highly genotype-driven
TSS flanking Enhancers Repressed
Enric
hmen
t for
meQ
TLs
12
5 Transcribed
Promoters
TxEnh
bull TSS-flanking and repressed regions also genetic62
AD-associated probes in distal enhancers Pe
r st
ate
(O
bs ndash
Exp
)
Tota
l
Enhancers
Promoters
copy source unknown All ri ghts reserved This content is excluded from our Creative
Commons license For more information see httpocwmiteduhelpfaq-fair-use
bull After cleaning with known and inferred covariates
bull Distal and transcribed enhancers enriched
Proximal regulators (promoters) depleted 63
bull 63
ICA covariate correction cleans up enhancer signal
Before
Orange Enrichment of enhancer probes for association with the real phenotype
Grey Enrichment of enhancer probes for a scrambled phenotype
After (After conditioning on 7 surrogate variables discovered with ICA)
Empirical p=006
Empirical plt0001
copy source unknown All rights reserved This content is excluded from our Creative
Commons license For more information see httpocwmiteduhelpfaq-fair-use 64
AD predictive power highest in enhancers
AP
OE
enhancers
methylome
promoters
All SNPs
Top predictive features are bullEnhancer
ethylation
ll me thyl
SS Het
enetics incl APOE)
ausality
ommon athways
m
bull A
bull T
bullG(
bull C
bullCp
copy source unknown All rights reserved This content is excluded from our Creative
Commons license For more information see httpocwmiteduhelpfaq-fair-use65
NRSF
ELK1
All probes ranked by AD assoc P-value
Nonminussignificant pathways Significant pathways
060
065
070
075
AUC using pathway feature selection p= 1922eminus11
AD prediction reveals likely biological pathways
All probes ranked by AD assoc P-value
CTCF
copy source unknown All rights reserved This content is excluded from our Creative
Commons license For more information see httpocwmiteduhelpfaq-fair-use
Enriched regulatory motifs
suggest potential pathway s
HEBTcf12 proliferating neural and progenitor cells
GATA cell growth blood cell development
66TLX1NFIC Neuronal cell fates Mouse AD models 66
Goal Personalized and Predictive Medicine 1 Intro to Epidemiology basis of human disease 2 Genetic Epidemiology
ndash Genetic basis GWAS and screening ndash Interpreting GWAS with functional genomics ndash Calculating functional enrichments for GWAS loci
3 Molecular epidemiology ndash meQTLs Genotype-Epigenome association (cis-trans-) ndash EWAS Epigenome-Disease association
4 Resolving Causality ndash Statistical Mendelian Randomization ndash Application to genotype + methylation in AD
5 Systems Genomics and Epigenomics of disease ndash Beyond single loci polygenic risk prediction models ndash Sub-threshold loci and somatic heterogeneity in cancer
67
67
ins
C E confounders environment
Risk factor causality w instrumental variables If XY are correlated possible scenarios are bull XY bull causes X Y
G Y bull XU Y Xtrument
risk factor outcome To distinguish need effects controlled random experiment
Is risk factor X causing disease Y (or a consequence)
ndash Eg alcohol addiction smoking blood cholesterol fever stress Randomized experiment with and without X feasibility ethics
G randomized experiment (eg random Mendelian inheritance) as only some subjects have genotype
G (iv)must be correlated with Y but only through X ie if X known G gives no additional information about Y
68
bull
bull
bull
68
In silico thought experiment
0 200 400 600 80000
02
04
06
08
10
p=2946466eminus35noi
atylh
etM
Subjects
ADnonAD
0 200 400 600 80000
02
04
06
08
10
p=3847832eminus05
noiat
ylhet
M
Subjects
ADnonAD
Same effect due to Alz but with larger effect due to genotype
CC
Small but significant effect due to Alz
CA
copy source unknown All rights reserved This content is excluded from our Creative
Commons license For more information see httpocwmiteduhelpfaq-fair-use
Hemi-methylation associated with meQTL yields a p-value thatrsquos 30 orders of magnitude lower for the AD phenotype
69
MGE P+ + = GE P+ =
From G include probe-specific terms for cis-meQTLs as well as including trans-meQTLs in all comparisons
VS
Mendelian randomization approach Account for variance due to genotype how much does methylation add
With variability due to genotype and environmental covariates removed the effect due to phenotype should become more prevalent
70
Causality testing
71
Modeling complex Human diseases bull Three possible models
1 Independent Associations
D
MG X
2 Causal Pathway Model
3 Interaction Model
D
G
M
Genotype
DG M
D
MG
72
Methylation
Disease
(1) Independent Associations
D
MG X
bull Association between Factor A and Disease bull Association between Factor B and Disease bull No association between Factor A and Factor B
G Factor A
bull Example 2 independent risk genes X Factor B
Y Disease D 73
(2) Causal Pathway Models
bull Is the a direct link between risk factor (A) and disease (D)
DA
bull Does the risk factorrsquos () effect on disease (D) depend on an intermediate step (B)
DA B
bull To test ndash A is associated with B and D ndash B is associated with D ndash A is not associated with D when controlling for
ndash Note A MUST come before B temporally
B
D
G
X
Factor A
Factor B
Disease D 74
(2) Causal Pathway Models
bull In reality its a little of both rsquos affect on D is partially mediated through B
A DB
bull To test ndash A is associated with B and D ndash B is associated with D ndash The effect size of A on D is decreased when con
ndash Note A MUST come before B temporally
bull Example CR1 effect on cognitive decline
trolling for B
A Factor A Factor B Disease D D
B
75
(3) Interaction Models
bull Factor Brsquos effect on D is different depending on value for factor
B (A = Aa)
B (A = AA)
D
B (A = aa)
bull To test ndash A + B + AB D if estimate for AB is significant then ndash Stratify by levels of A
bull Example
ndash drugrsquos effect is different depending on genotype ndash More to comelt
76
Gene locus reference Published
AD AD NP
BIN1
CD2AP
CD33
rs744373
rs9349407
rs3865444
Seshadri 2010
Naj 2011Hollingsworth 2011
Naj 2011Hollingsworth 2012
16x10-11
86x10-9
16x10-9
0204
0445
0133
0480
0221
0123
ABCA7 rs3764650 Hollingsworth 2010 50x10-21 0747 0187 APOE Any ε4 12x10-13 18x10-23
CLU rs11136000 Lambert 2009Harold 2009 75x10-9 0762 0649 CR1 rs6656401 Lambert 2009 37x10-9 00009 0057
EPHA1 rs11767557 Naj 2011Hollingsworth 2011 60x10-10 0562 0391 MS4A4A rs4938933 Naj 2011 17x10-9 0792 0567 MS4A6A rs610932 Hollingsworth 2010 12x10-16 0534 0820
MTHFD1L rs11754661 Naj 2010 19x10-10 0126 0934 PICALM rs3851179 Harold 2009 19x10-8 0382 0171
Application to 12 AD GWAS loci
77
Tangles
CR1 Causal pathway model
Risk Factors Pathology Clinical Disease
Alzheimerrsquos disease
Genetic CR1
Cognitive Decline
AD specific Neuritic Plaque Neurofibulary
bull CR1 first associated with AD in 2009 bull Original associated variant is in an intron no clear function bull Unclear how CR1 locus influences AD susceptibility mechanistically
bull
Questions ndash Is the effect only on AD ndash Is there a broader effect on cognitive decline ndash Is there an association with AD pathology ndash Does it go through pathology to have an effect of cognitive decline
78
CR1 (rs6656401)
CR1 Pathology
04
045
05
055
06
065
07
075
08
085
Neuritic Plaque Neurofibillary Tangles
TT ATAA (risk allele)
CR1 Global Cognitive Decline
p=00008
p=0008 p=010
Pathology Global Cognitive Decline p lt 00001 time
79
Matt Eaton Phil De Jager
Epigenome
Genetic + Epigenetic variation in lzheimerrsquos
Relate to genotype and AD variation 723 AD patients amp controls Methylation variation in
Genome
meQTL
Phenotype
Classification Epigenome MWAS
1 2
copy source unknown All rights reserved This content isexcluded from our Creative Commons license For moreinformation see httpocwmiteduhelpfaq-fair-use
Methylation gtgt SNPs Estimate causal M roles regression Enhancers gtgt promoters of meQTL effects reduces MD
copy source unknown All rights reserved This content is excluded
from our Creative Commons license For more information see
httpocwmiteduhelpfaq-fair-use 80
Goal Personalized and Predictive Medicine 1 Intro to Epidemiology basis of human disease 2 Genetic Epidemiology
ndash Genetic basis GWAS and screening ndash Interpreting GWAS with functional genomics ndash Calculating functional enrichments for GWAS loci
3 Molecular epidemiology ndash meQTLs Genotype-Epigenome association (cis-trans-) ndash EWAS Epigenome-Disease association
4 Resolving Causality ndash Statistical Mendelian Randomization ndash Application to genotype + methylation in AD
5 Systems Genomics and Epigenomics of disease ndash Beyond single loci polygenic risk prediction models ndash Sub-threshold loci and somatic heterogeneity in cancer
81
Beyond top-scoring hits 1000s of variants of weak effect
cluster in cell type specific enhancers
82
Rank-based functional testing of weak associations
Enrichment peaks at 10000s of SNPs down the rank list even after LD pruning
copy source unknown All rights reserved This content is excluded from our Creative
Commons license For more information see httpocwmiteduhelpfaq-fair-use
bull Rank all SNPs based on GWAS signal strength bull Functional enrichment for cell types and states 83
Weak-effect T1D hits in 50k T-cell enhancers enhancers
CD4+ T-cells
T-cells B-cells
Other cell types
copy source unknown All rights reserved This content is excluded from our Creative
Commons license For more information see httpocwmiteduhelpfaq-fair-use
bull LD-pruning (CEU r2gt2) 50k 41k independ loci 84
Cell type specificity stronger for enhancers enhancers promoters
transcribed
CD4+ T-cells
T-cells B-cells
Other cell types
copy source unknown All rights reserved This content is excluded from our Creative
Commons license For more information see httpocwmiteduhelpfaq-fair-use
bull TB-cells also enriched for promoters transcribed bull Enhancer enrichment much more cell type specific 85
T1DRA-enriched enhancers spread across genome
copy source unknown All rights reserved This content is excluded from our Creative
Commons license For more information see httpocw miteduhelpfaq-fair-use
bull High concentration of loci in MHC high overlapbull Yet many distinct regions 1000s of distinct loci 86
Implications for genetic predisposition polygenic models for risk prediction
87
1
Basic setup of polygenic risk prediction studies Case-control cohort w genotype + phenotype
Training cohort Testing cohort
Selection of SNPs Estimation of effects Ranking
Apply predictor Evaluate accuracy
Apply predictor w estimated confidence
Target cohort genotyped individuals
(no phenotypes)
1
(power matters) (power matters) (power limited to one individual at a time)
2
bull Applications 1 (testing cohort) ndash Understand total heritability captured in common variants
ndash Understand disease ldquoarchitecturerdquo number of SNPs ndash Recognize functional classes associated with weak genetic associations
bull Applications 2 2 (new individuals) ndash Provide health recommendations at the individual level
ndash Prioritize high-risk individuals for subsequent testing at population level 88
How many SNPs to include in model
scor
ec
nige
ly p
ohe
of t
ue
-val
Pct
ed
peex
Dudridge PLoS Genetics 2013 pi0Proportion of markers with no effect Purcell Nature 2009
Schizophrenia risk prediction
lsquoonly 5 matterrsquo
lsquoonly 10 matterrsquo(but still canrsquot tellWhich ones until lsquoall matterrsquo Full rank list)
inclusion threshold copy source unknown All rights reserved This content is excluded from our CreativeCommons license For more information see httpocwmiteduhelpfaq-fair-use
bull It depends on ndash Architecture Fraction of SNPs that are estimated to be functional ndash Power Number of individuals in cohort ie ability to rank correctly It only peaks at 5 (asymp1-pi0) when sufficient power to rank ndash Large fraction of associated markers are hidden within non-significant SNPs
bull
bull For pi0=090 still need to include all SNPs to maximize predictive power 89
Application to pleiotropy and common risk Trait 1 (schizophrenia) Case-control cohort w genotype + phenotype
Selection of SNPs Estimation of effects Ranking
Apply predictor Evaluate accuracy
Trait 2 (bipolar disorder) Case-control cohort w genotype + phenotype
bull Ability to assess common genetic risk Are the highly-ranked SNPs for one study relevant to a different study
Is there a shared genetic architecture between seemingly unrelated traits
irst use showed schizophrenia and bipolar disorder common risk Schizophrenia-ranked SNPs in one cohortlt
lt are predictive of bipolar disorder diagnosis lt but not predictive of unrelated (cardiovascular) traits
ndashndash
bull Fndashndashndash
90
Important pointscaveats for risk prediction bull Always limited by genetic component
ndash Environment random effects play big role for most traits
bull Mendelian=deterministic vs common variants=probic
ndash Only a first screen for individuals at risk
bull Limited by discovery power
ndash Cohort size limits discriminative power and ranking ability
bull Limited by genotyped SNPvs vs all SNPs
ndash Selection pushes fitness-reducing variants to lower freq
ndash Genotyped SNPs selected to be common
bull Even if SNPs are correctly id entified their effects are not
ndash Winnerrsquos curse over-estimate above-threshold true effect
bull Training and testing cohort non-independence
ndash Relatives cryptic relatedness population stratification inflate est 91
91
Goal Personalized and Predictive Medicine 1 Intro to Epidemiology basis of human disease 2 Genetic Epidemiology
ndash Genetic basis GWAS and screening ndash Interpreting GWAS with functional genomics ndash Calculating functional enrichments for GWAS loci
3 Molecular epidemiology ndash meQTLs Genotype-Epigenome association (cis-trans-) ndash EWAS Epigenome-Disease association
4 Resolving Causality ndash Statistical Mendelian Randomization ndash Application to genotype + methylation in AD
5 Systems Genomics and Epigenomics of disease ndash Beyond single loci polygenic risk prediction models ndash Sub-threshold loci and somatic heterogeneity in cancer
92
This talk From loci to mechanisms
Building a reference map of the regulatory genome Enhancers Promoters Transcribed Repressed
Regions Enhancers promoters transcribed repressed Cell types Predict tissues and cell types of epigenomic act ivity Target genes Link variants to their target genes using eQTLs activity Hi-C Nucleotides Regulatory consequence of mutation Conservation PWMs Regulators Upstream regulators whose activity is disrupted by mutation
Application to GWAS hidden heritability and Cancer GWAS CATGCCTG bull 93 top hits non-coding Mechanism Cell type hits CGTGTCTA bull Lie in haplotype blocks Causal variant(s)
lsquoHiddenrsquo CATGCCTG bull Many variants small effects Pathway-level burdenload heritability CGTGTCTA bull Many false positives Prioritize w regulatory annotations
Cancer bull s of function CATGCCTG Los Protein-coding variants convergence mutations CATCCCTG bull Gain of function Regulatory variants heterogeneity
93
Characterizing sub-threshold variants in heart arrhythmia
copy source unknown All rights reservedThiscontent is excluded from our Creative
Commons license For more information see
httpocwmiteduhelpfaq-fair-use
Focus on sub-threshold variants
(eg rs1743292 P=10-42)
Trait QRSQT interval
(1) Large cohorts (2) many known hits (3) well-characterized tissue drivers 94
From Arking D E Pulit S L Crotti L Harst P V Munroe P BKoopmann T T Newton-Cheh C (2014) Genetic associationstudy of QT interval highlights role for calcium myocardial repolarizationNature Genetics Nat Genet 46(8) 826-836 Used with permission
Enhancers overlapping GWAS loci share functional properties
copy source unknown All rights reserved This content is excluded from our CreativeCommons license For more information see httpocwmiteduhelpfaq-fair-use
Train machine learning model to prioritize sub-threshold loci 95
Functional evidence for sub-threshold target genes
Zebrafish phenotypes Human genetics
copy source unknown All rights reserved This content is excluded from our CreativeCommons license For more information see httpocwmiteduhelpfaq-fair-use
Mouse phenotypes 96
Experimental validation of 11 sub-threshold loci
copy source unknown All rights reserved This content is excluded from our CreativeCommons license For more information see httpocwmiteduhelpfaq-fair-use
9 of 11 tested loci show allelic activity chromatin interactions
97
Functional evidence for rs1743292 causality (P=10-42)
Enhancer 4C links to target gene promoters Heart enhancer activity
Motif disruption Allelic DNase in multiple individuals copy source unknown All rights reserved This content is excluded from our CreativeCommons license For more information see httpocwmiteduhelpfaq-fair-use Allelic enha-
ncer activity 98
Target gene impact on heart conduction
Optical voltage mapping
zebrafish embryo hearts voltage-sensitive fluorescent dye
ventricle
atrium
transmembrane voltage (ventricle)
copy source unknown All rights reserved This content is excludedfrom our Creative Commons license For more information seehttpocwmiteduhelpfaq-fair-use
Detection and validation of a new cardiac locus
99
What would we need to discover rs1743292 without epigenomics
rs1743292 Minor allele frequency 0134
Effect size -05773 +- 017 msec With 68900 individuals 128 power to discover at plt5x10-8
bull rs1743292 has similar effect sizes as many genome-wide significant variants
bull Many GWAS variants discovered due to winnerrsquos curse often only have 5-
20 power to discover
bull Combining epigenomics and GWAS can
1 Confirm existing GWAS loci are real
2 Discover new sub-threshold loci with weak effect sizes low power
To reach 80 power to discover rs1743292 at plt5x10-8 we need 146700 individuals
100
Goal Personalized and Predictive Medicine 1 Intro to Epidemiology basis of human disease
enetic Epidemiology Genetic basis GWAS and screening Interpreting GWAS with functional genomics Calculating functional enrichments for GWAS loci
olecular epidemiology meQTLs Genotype-Epigenome association (cis-trans-) EWAS Epigenome-Disease association
esolving Causality Statistical Mendelian Randomization Application to genotype + methylation in AD
ystems Genomics and Epigenomics of disease Beyond single loci polygenic risk prediction models Sub-threshold loci and somatic heterogeneity in cancer
2 Gndash ndash ndash
3 Mndash ndash
4 Rndash ndash
5 Sndash ndash
101
This talk From loci to mechanisms
Building a reference map of the regulatory genome Enhancers Promoters Transcribed Repressed
Regions Enhancers promoters transcribed repressed Cell types Predict tissues and cell types of epigenomic act ivity Target genes Link variants to their target genes using eQTLs activity Hi-C Nucleotides Regulatory consequence of mutation Conservation PWMs Regulators Upstream regulators whose activity is disrupted by mutation
Application to GWAS hidden heritability and Cancer GWAS CATGCCTG bull 93 top hits non-coding Mechanism Cell type hits CGTGTCTA bull Lie in haplotype blocks Causal variant(s)
lsquoHiddenrsquo CATGCCTG bull Many variants small effects Pathway-level burdenload heritability CGTGTCTA bull Many false positives Prioritize w regulatory annotations
Cancer function CATGCCTG bull Loss of Protein-coding variants convergence mutations CATCCCTG bull Gain of function Regulatory variants heterogeneity
102
Regulatory convergence of dispersed driver mutations
copy source unknown All rights reserved This content is excluded from our CreativeCommons license For more information see httpocwmiteduhelpfaq-fair-use
Common mutations in regulatory plexus of each gene Richard Sallari 103
Cancer genes are more likely to be up-regulated
copy source unknown All rights reserved This content is excluded from our CreativeCommons license For more information see httpocwmiteduhelpfaq-fair-use
Richard Sallari 104
Dysregulated genes show dispersed non-coding mutations
copy source unknown All rights reserved This content is excluded from our CreativeCommons license For more information see httpocwmiteduhelpfaq-fair-use
Dysregulated genes are enriched for plexus mutations at all distances Richard Sallari 105
Non-coding mutations enriched in promoters enhancers active in other cell types
copy source unknown All rights reserved This content is excluded from our CreativeCommons license For more information see httpocwmiteduhelpfaq-fair-use
Disruptive mutations in lsquolowrsquo elements are enriched in enhancers and promoters in other tissues
Richard Sallari 106
Statistical model for excess of raresomatic variants
copy source unknown All rights reserved This content is excluded from our CreativeCommons license For more information see httpocwmiteduhelpfaq-fair-use
bullCorrect for region- state- tumor-specific rate variation 107
Convergence in immune signaling mitoch functions
copy source unknown All rights reserved This content is excluded from our CreativeCommons license For more information see httpocwmiteduhelpfaq-fair-use
bullPathway-level convergence hierarchical model 108
Richard Sallari
Non-coding drivers of prostate cancer dysregulation
Regulatory mutations reveal Convergence in immune signaling new cancer driver genes
mitochondrial functions
copy source unknown All rights reserved This content is excluded from our CreativeCommons license For more information see httpocwmiteduhelpfaq-fair-use
Convergence in inositol phosphate metabolism PLCB4 overexpression in PC3 prostate cancer adjacent to PTEN PIK3CA known cancer genes reduces ErkAkt activity synergistic with PTEN
109
Personal genomics tomorrow Already 100000s of complete genomes
bull Health disease quantitative traits ndash Genomics regions disease mechanism drug targets ndash Protein-coding cracking regulatory code variation ndash Single genes systems gene interactions pathways
bull Human ancestry ndash Resolve all of human ancestral relationships ndash Complete history of all migrations selective events ndash Resolve common inheritance vs trait association
bull Whatrsquos missing is the computation ndash New algorithms machine learning dimensionality reduction ndash Individualized treatment from 1000s genes genome ndash Understand missing heritability ndash Reveal co-evolution between geneselements ndash Correct for modulating effects in GWAS
110
Challenge ahead From research to clinic 1 Systematic medical genotyping sequencing
ndash Currently a curiosity future medical practice
2 Systematic medical molecular profiling
ndash Functional genomics in relevant cell types
3 Systematic perturbation studies for validation
ndash 1000s of regulatory predictions x 100s cell types
4 Systematic repurposing of approved drugs
ndash Systems-biology view of drug response
5 Genomics of drug response in cli nical trials
ndash Personalized drug prescription and combinations
6 Partnerships academia industry hospitals
ndash Interdisciplinary training in each of the instituttions 111
Summary Personalized amp Predictive Medicine 1 Intro to Epidemiology basis of human disease 2 Genetic Epidemiology
ndash Genetic basis GWAS and screening ndash Interpreting GWAS with functional genomics ndash Calculating functional enrichments for GWAS loci
3 Molecular epidemiology ndash meQTLs Genotype-Epigenome association (cis-trans-) ndash EWAS Epigenome-Disease association
4 Resolving Causality ndash Statistical Mendelian Randomization ndash Application to genotype + methylation in AD
5 Systems Genomics and Epigenomics of disease ndash Beyond single loci polygenic risk prediction models ndash Sub-threshold loci and somatic heterogeneity in cancer
112
MIT OpenCourseWarehttpocwmitedu
6047 6878 HST507 Computational BiologyFall 2015
For information about citing these materials or our Terms of Use visit httpocwmiteduterms

Goal Personalized and Predictive Medicine 1 Intro to Epidemiology basis of human disease
Genetic Epidemiology Genetic basis GWAS and screening Interpreting GWAS with functional genomics Calculating functional enrichments for GWAS loci
Molecular epidemiology meQTLs Genotype-Epigenome association (cis-trans-) EWAS Epigenome-Disease association
Resolving Causality Statistical Mendelian Randomization Application to genotype + methylation in AD
Systems Genomics and Epigenomics of disease Beyond single loci polygenic risk prediction models Sub-threshold loci and somatic heterogeneity in cancer
43
2 ndashndashndash
3 ndashndash
4 ndashndash
5 ndashndash
43
DXG
effects
causes
genome epigenome biomarkers
disease S
symptoms
C Econfounders environment
Molecular EpidemiologyMolecular Biomarkers of disease state
Gene expression DNA methylation chromatin in specific cell types
44
chr2
meQTLminuslinked CpG r^2
meQTL SNP r^2
SNP AAF
Genotype
BRNMIDFRNTL E073
BRNANGGYR E067
BRNANTCAUD E068
BRNCINGGYR E069
BRNHIPPMID E071
BRNINFTMP E072
BRNSUBNIG E074
LIVADLT E066
BLDCD14PC E029
BLDCD4MPC E037
BLDCD4CD25MCD45RANPC E039
LNGIMR90 E017
GISTMCMUS E111
SKINPENFRSKFIB01 E055
MUSTRNKFET E089
BONEOSTEO E129
Genes(+)
Genes(minus)
Mean Methylation
Normalized Methylation
Methylation StdDev
meQTLminuslinked CpG r^2
0
146
293
439
586
241400000 241500000 241600000 241700000 241800000 241900000 242000000 242100000 242200000 2423000003 5
241400000 241500000 241600000 241700000 241800000 241900000 242000000 242100000 242200000 2423000005 3
Genetic and epigenetic data in 750 Alzheimerrsquos patientscontrols MAP Memory and Aging Project
+ ROS Religious Order Study
Dorsolateral PFC
Reference Chromatin
states (Bernstein)
Genotype
(1M SNPs
x700 ind)
(De Jager)
BrainLiver Blood Lung GI Skin Muscle Bone
Methylation
(450k probes
x 700 ind)
(De Jager)
copy source unknown All rights reserved This content is excluded from our CreativeCommons license For more information see httpocwmiteduhelpfaq-fair-use
750 subjects initially cognitively normal Alzheimerrsquos diagnosed by pathology (Bennett) 45
Data Matrices ndash An example scenario n=750 individuals n=750 individuals n=750 individuals n=750 individuals
Genotype
g=1
20
00
00
0
Methylation
m=4
50
00
0
e=1
5 10
ldquoEnvironmentrdquo
p=
Phenotype (Disease)
M - Illumina Methylation 450k array 450000 probes targeting CpGs genome-wide
G - Affy SNP arrays imputed against CEU thousand genomes reference panel yielding 12m SNPs
E - Clinical covariates that might mask the variation due to our phenotype eg gender smoking age or sample batch
P - Phenotype of interest sometimes measured with multiple markers (clinical Alz diagnosis vs pathology Alz diagnosis vs count of neuritic plaques)
n -gt number of individuals in cohort 46
E environment
cause D G M Alzheimer genotype
methylation effects disease 46
EWAS Capturing variability in the Epigenomeattributable to disease
D X
Epigenome DNA methylation Phenotype
lzheimerrsquos Disease
E Environment
Age Education Gender etc
Known variable correction
C Experimental Technical
Cell type mixtures Batch effects Other
Unknown Confounders
Known amp ICA inferred variable
correction
EWAS Hundreds of AD associated loci
enriched in enhancers and relevant
pathways
G meQTL Genotype (~60K
5M Common CpGs) Variants
47
Excluding discovered and known covariates
copy source unknown All ri ghts reserved This content is excluded from our Creative Commons license For more information see httpocwmiteduhelpfaq-fair-use 48
Infer covariates using ICA
compare to known
exclude both
Strongest effects
bull Plate (batch)
bull Cell mixture
bull Bisulfite conversion
bull Gender
bull Age
Variance explained
bull Known 25
bull Inferred 35
bull Together 40
C Econfounders environment
DMG effects
cause
genotype methylation Disease
GenotypeMethylation Discovering mQTLs
Methylation Quantitative Trait Loci
49
cis-meQTLs
M
n=750 n=750 Use linear models to identify cis-meQTLs win some genomic window =4
50
00
0
00
00
00
G
m 12
g=
For methyl mark mi and SNP gj mi = β0 + β1(gj) + ε
bull Given several predictors is additional predictor increasing accuracy more than complexity introduced
bull Likelihood ratio testing paradigm predict methylation with and without genotype (only works for nested models)
bull Null hypothesis H0 β1=0 Additional model complexity rsquot explain a significant portion of variation in response
LM1 mi = β0 + ε LM2 mi = β0 + β1(gj) + ε
r term
2) (q ndash p) ) ( RSSLM2 (n ndash q) ) n-q) degrees of freedom is p-value is what we report in a meQTL study SSLM2 too small vs increase in model complexity
50
doesn
Test using F statistic - p is the number of parameters in LM1 - q is the number of parameters in LM2 - n is the sample size - RSS Residual sum of squares - β parameters to learn ε residual erroUnder null hypothesis ( (RSSLM1 ndash RSSLM
Is distributed as F distribution with (q-p If F statistic significant reject null Th Otherwise no meQTL ie RSSLM1 ndash R
50
cis-meQTLs
M
n n =4
50
00
0
00
00
00
G
m 12
g=
Alternative methods of detection
Permutation bull Correlate methylation and genotype bull For i in 1 -gt nperm
bull Permute genotypes bull Correlate methylation and genotype
bull Generate empirical p-value from permuted correlations
LMM Linear mixed models
bull
bull
51
00 05 10 15 20
02
04
06
Adjusted MA Dosage
Adju
sted
Met
hyla
tion
minus05 05 15
065
075
085
Adjusted MA Dosage
Adju
sted
Met
hyla
tion
minus05 05 15
060
064
068
072
rs17836662 cg10853533 minus44352
Adjusted MA Dosage
Adju
sted
Met
hyla
tion
minus05 05 15
010
020
030
rs7924341 cg20132549 minus1847
Adjusted MA Dosage
Adju
sted
Met
hyla
tion
1 2
3 4
1
2
3 4
Most epigenomic variability is genotype-driven Manhattan plot of 450000 methylation probes
P)
10
log
-(va
lue
-P
Chromosome and genomic position
Genome-wide significance at plt3x10-10
Prune for probes disrupted by SNP
0
bullbull 140000 CpGs associated with genotype at 1 FDR
55000 at Bonferroni-corrected P-value of 10-2
52
copy source unknown All rights reserved This content is excluded from our Creative
Commons license For more information see httpocwmiteduhelpfaq-fair-use
Scaling of discovery power with individuals
copy source unknown All rights reserved This content is excluded from our Creative
Commons license For more information see httpocwmiteduhelpfaq-fair-use
bull Number of meQTLs continues to increase linearly bull Weak-effect meQTLs median R2lt01 after 400 indiv 53
Goal Personalized and Predictive Medicine 1 Intro to Epidemiology basis of human disease 2 Genetic Epidemiology
ndash Genetic basis GWAS and screening ndash Interpreting GWAS with functional genomics ndash Calculating functional enrichments for GWAS loci
3 Molecular epidemiology ndash meQTLs Genotype-Epigenome association (cis-trans-) ndash EWAS Epigenome-Disease association
4 Resolving Causality ndash Statistical Mendelian Randomization ndash Application to genotype + methylation in AD
5 Systems Genomics and Epigenomics of disease ndash Beyond single loci polygenic risk prediction models ndash Sub-threshold loci and somatic heterogeneity in cancer
54
confounders
DMG effects
cause
genotype methylation
environment
Disease
C E
MethylationDisease EWAS
Epigenome-wide association study
55
eWAS
Methylation
n n
10 Phenotype
e= (Disease)
=45
00
00
m
Link methylationphenotype (~cis-eQTLs) linear models and hypothesis testing Predict phenotype using methylation
bullbull
LM1 pi
LM2 p = β0 + β1(m ) + ε = β0 + ε
i j
56
eWAS n n
Methylation
m=4
50
00
0
Phenotype (Disease) p
=1
0
n
ldquoEnvironmentrdquo e=
15
LM1 AD = β0 + β2(gender) + ε LM2 AD = β0 + β1(mj) + β2(gender) ε
Link methylationphenotype (~cis-eQTLs) bull linear models and hypothesis testing bull Predict phenotype using methylation
Problem variance due to phenotype probably very small (unless your phenotype is cancer) Needle in a haystack Control for other sources of variance to make the variance due to the phenotype stand out If phenotype is lzheimerrsquos (D) gender incorporates more variance into your M matrix than does AD
57
eWAS
Methylation
Phenotype (Disease)
n n
m=4
50
00
0
p=
10
ldquoEnvironmentrdquo
n
e=1
5
Might have many environmental variables to control for
LM1 AD = β0 + β2(gender) + β3(age) + β4(education) + lt + ε LM2 AD = β0 + β1(mj) + β2(gender) + β3(age) + β4(education) + lt + ε
58
eWAS Need to account for variance due to genotype as well
Methylation
Phenotype (Disease)
n n
m=4
50
00
0
p=
10
ldquoEnvironmentrdquo
n
e=1
5
Genotype
n
g=1
20
00
00
0
59
Role of enhancers vs promoters in lzheimerrsquos disease association
60
Enhancers are hemi-methylated and highly variable
Enhancers show most variable methylation
Promoters show least variable methylation
copy source unknown All rights reserved This content is excluded from our Creative
Commons license For more information see httpocwmiteduhelpfaq-fair-use
bull Highly distinct signatures for promoters vs enhancers
bull Enhancers hemi-methylated Methylation level Methylation level in each person (not bimodal)
61
SNP-associated CpGs in enhancers not promoters
bull Promoter methylation less affected by genetics bull Enhancer methylation highly genotype-driven
TSS flanking Enhancers Repressed
Enric
hmen
t for
meQ
TLs
12
5 Transcribed
Promoters
TxEnh
bull TSS-flanking and repressed regions also genetic62
AD-associated probes in distal enhancers Pe
r st
ate
(O
bs ndash
Exp
)
Tota
l
Enhancers
Promoters
copy source unknown All ri ghts reserved This content is excluded from our Creative
Commons license For more information see httpocwmiteduhelpfaq-fair-use
bull After cleaning with known and inferred covariates
bull Distal and transcribed enhancers enriched
Proximal regulators (promoters) depleted 63
bull 63
ICA covariate correction cleans up enhancer signal
Before
Orange Enrichment of enhancer probes for association with the real phenotype
Grey Enrichment of enhancer probes for a scrambled phenotype
After (After conditioning on 7 surrogate variables discovered with ICA)
Empirical p=006
Empirical plt0001
copy source unknown All rights reserved This content is excluded from our Creative
Commons license For more information see httpocwmiteduhelpfaq-fair-use 64
AD predictive power highest in enhancers
AP
OE
enhancers
methylome
promoters
All SNPs
Top predictive features are bullEnhancer
ethylation
ll me thyl
SS Het
enetics incl APOE)
ausality
ommon athways
m
bull A
bull T
bullG(
bull C
bullCp
copy source unknown All rights reserved This content is excluded from our Creative
Commons license For more information see httpocwmiteduhelpfaq-fair-use65
NRSF
ELK1
All probes ranked by AD assoc P-value
Nonminussignificant pathways Significant pathways
060
065
070
075
AUC using pathway feature selection p= 1922eminus11
AD prediction reveals likely biological pathways
All probes ranked by AD assoc P-value
CTCF
copy source unknown All rights reserved This content is excluded from our Creative
Commons license For more information see httpocwmiteduhelpfaq-fair-use
Enriched regulatory motifs
suggest potential pathway s
HEBTcf12 proliferating neural and progenitor cells
GATA cell growth blood cell development
66TLX1NFIC Neuronal cell fates Mouse AD models 66
Goal Personalized and Predictive Medicine 1 Intro to Epidemiology basis of human disease 2 Genetic Epidemiology
ndash Genetic basis GWAS and screening ndash Interpreting GWAS with functional genomics ndash Calculating functional enrichments for GWAS loci
3 Molecular epidemiology ndash meQTLs Genotype-Epigenome association (cis-trans-) ndash EWAS Epigenome-Disease association
4 Resolving Causality ndash Statistical Mendelian Randomization ndash Application to genotype + methylation in AD
5 Systems Genomics and Epigenomics of disease ndash Beyond single loci polygenic risk prediction models ndash Sub-threshold loci and somatic heterogeneity in cancer
67
67
ins
C E confounders environment
Risk factor causality w instrumental variables If XY are correlated possible scenarios are bull XY bull causes X Y
G Y bull XU Y Xtrument
risk factor outcome To distinguish need effects controlled random experiment
Is risk factor X causing disease Y (or a consequence)
ndash Eg alcohol addiction smoking blood cholesterol fever stress Randomized experiment with and without X feasibility ethics
G randomized experiment (eg random Mendelian inheritance) as only some subjects have genotype
G (iv)must be correlated with Y but only through X ie if X known G gives no additional information about Y
68
bull
bull
bull
68
In silico thought experiment
0 200 400 600 80000
02
04
06
08
10
p=2946466eminus35noi
atylh
etM
Subjects
ADnonAD
0 200 400 600 80000
02
04
06
08
10
p=3847832eminus05
noiat
ylhet
M
Subjects
ADnonAD
Same effect due to Alz but with larger effect due to genotype
CC
Small but significant effect due to Alz
CA
copy source unknown All rights reserved This content is excluded from our Creative
Commons license For more information see httpocwmiteduhelpfaq-fair-use
Hemi-methylation associated with meQTL yields a p-value thatrsquos 30 orders of magnitude lower for the AD phenotype
69
MGE P+ + = GE P+ =
From G include probe-specific terms for cis-meQTLs as well as including trans-meQTLs in all comparisons
VS
Mendelian randomization approach Account for variance due to genotype how much does methylation add
With variability due to genotype and environmental covariates removed the effect due to phenotype should become more prevalent
70
Causality testing
71
Modeling complex Human diseases bull Three possible models
1 Independent Associations
D
MG X
2 Causal Pathway Model
3 Interaction Model
D
G
M
Genotype
DG M
D
MG
72
Methylation
Disease
(1) Independent Associations
D
MG X
bull Association between Factor A and Disease bull Association between Factor B and Disease bull No association between Factor A and Factor B
G Factor A
bull Example 2 independent risk genes X Factor B
Y Disease D 73
(2) Causal Pathway Models
bull Is the a direct link between risk factor (A) and disease (D)
DA
bull Does the risk factorrsquos () effect on disease (D) depend on an intermediate step (B)
DA B
bull To test ndash A is associated with B and D ndash B is associated with D ndash A is not associated with D when controlling for
ndash Note A MUST come before B temporally
B
D
G
X
Factor A
Factor B
Disease D 74
(2) Causal Pathway Models
bull In reality its a little of both rsquos affect on D is partially mediated through B
A DB
bull To test ndash A is associated with B and D ndash B is associated with D ndash The effect size of A on D is decreased when con
ndash Note A MUST come before B temporally
bull Example CR1 effect on cognitive decline
trolling for B
A Factor A Factor B Disease D D
B
75
(3) Interaction Models
bull Factor Brsquos effect on D is different depending on value for factor
B (A = Aa)
B (A = AA)
D
B (A = aa)
bull To test ndash A + B + AB D if estimate for AB is significant then ndash Stratify by levels of A
bull Example
ndash drugrsquos effect is different depending on genotype ndash More to comelt
76
Gene locus reference Published
AD AD NP
BIN1
CD2AP
CD33
rs744373
rs9349407
rs3865444
Seshadri 2010
Naj 2011Hollingsworth 2011
Naj 2011Hollingsworth 2012
16x10-11
86x10-9
16x10-9
0204
0445
0133
0480
0221
0123
ABCA7 rs3764650 Hollingsworth 2010 50x10-21 0747 0187 APOE Any ε4 12x10-13 18x10-23
CLU rs11136000 Lambert 2009Harold 2009 75x10-9 0762 0649 CR1 rs6656401 Lambert 2009 37x10-9 00009 0057
EPHA1 rs11767557 Naj 2011Hollingsworth 2011 60x10-10 0562 0391 MS4A4A rs4938933 Naj 2011 17x10-9 0792 0567 MS4A6A rs610932 Hollingsworth 2010 12x10-16 0534 0820
MTHFD1L rs11754661 Naj 2010 19x10-10 0126 0934 PICALM rs3851179 Harold 2009 19x10-8 0382 0171
Application to 12 AD GWAS loci
77
Tangles
CR1 Causal pathway model
Risk Factors Pathology Clinical Disease
Alzheimerrsquos disease
Genetic CR1
Cognitive Decline
AD specific Neuritic Plaque Neurofibulary
bull CR1 first associated with AD in 2009 bull Original associated variant is in an intron no clear function bull Unclear how CR1 locus influences AD susceptibility mechanistically
bull
Questions ndash Is the effect only on AD ndash Is there a broader effect on cognitive decline ndash Is there an association with AD pathology ndash Does it go through pathology to have an effect of cognitive decline
78
CR1 (rs6656401)
CR1 Pathology
04
045
05
055
06
065
07
075
08
085
Neuritic Plaque Neurofibillary Tangles
TT ATAA (risk allele)
CR1 Global Cognitive Decline
p=00008
p=0008 p=010
Pathology Global Cognitive Decline p lt 00001 time
79
Matt Eaton Phil De Jager
Epigenome
Genetic + Epigenetic variation in lzheimerrsquos
Relate to genotype and AD variation 723 AD patients amp controls Methylation variation in
Genome
meQTL
Phenotype
Classification Epigenome MWAS
1 2
copy source unknown All rights reserved This content isexcluded from our Creative Commons license For moreinformation see httpocwmiteduhelpfaq-fair-use
Methylation gtgt SNPs Estimate causal M roles regression Enhancers gtgt promoters of meQTL effects reduces MD
copy source unknown All rights reserved This content is excluded
from our Creative Commons license For more information see
httpocwmiteduhelpfaq-fair-use 80
Goal Personalized and Predictive Medicine 1 Intro to Epidemiology basis of human disease 2 Genetic Epidemiology
ndash Genetic basis GWAS and screening ndash Interpreting GWAS with functional genomics ndash Calculating functional enrichments for GWAS loci
3 Molecular epidemiology ndash meQTLs Genotype-Epigenome association (cis-trans-) ndash EWAS Epigenome-Disease association
4 Resolving Causality ndash Statistical Mendelian Randomization ndash Application to genotype + methylation in AD
5 Systems Genomics and Epigenomics of disease ndash Beyond single loci polygenic risk prediction models ndash Sub-threshold loci and somatic heterogeneity in cancer
81
Beyond top-scoring hits 1000s of variants of weak effect
cluster in cell type specific enhancers
82
Rank-based functional testing of weak associations
Enrichment peaks at 10000s of SNPs down the rank list even after LD pruning
copy source unknown All rights reserved This content is excluded from our Creative
Commons license For more information see httpocwmiteduhelpfaq-fair-use
bull Rank all SNPs based on GWAS signal strength bull Functional enrichment for cell types and states 83
Weak-effect T1D hits in 50k T-cell enhancers enhancers
CD4+ T-cells
T-cells B-cells
Other cell types
copy source unknown All rights reserved This content is excluded from our Creative
Commons license For more information see httpocwmiteduhelpfaq-fair-use
bull LD-pruning (CEU r2gt2) 50k 41k independ loci 84
Cell type specificity stronger for enhancers enhancers promoters
transcribed
CD4+ T-cells
T-cells B-cells
Other cell types
copy source unknown All rights reserved This content is excluded from our Creative
Commons license For more information see httpocwmiteduhelpfaq-fair-use
bull TB-cells also enriched for promoters transcribed bull Enhancer enrichment much more cell type specific 85
T1DRA-enriched enhancers spread across genome
copy source unknown All rights reserved This content is excluded from our Creative
Commons license For more information see httpocw miteduhelpfaq-fair-use
bull High concentration of loci in MHC high overlapbull Yet many distinct regions 1000s of distinct loci 86
Implications for genetic predisposition polygenic models for risk prediction
87
1
Basic setup of polygenic risk prediction studies Case-control cohort w genotype + phenotype
Training cohort Testing cohort
Selection of SNPs Estimation of effects Ranking
Apply predictor Evaluate accuracy
Apply predictor w estimated confidence
Target cohort genotyped individuals
(no phenotypes)
1
(power matters) (power matters) (power limited to one individual at a time)
2
bull Applications 1 (testing cohort) ndash Understand total heritability captured in common variants
ndash Understand disease ldquoarchitecturerdquo number of SNPs ndash Recognize functional classes associated with weak genetic associations
bull Applications 2 2 (new individuals) ndash Provide health recommendations at the individual level
ndash Prioritize high-risk individuals for subsequent testing at population level 88
How many SNPs to include in model
scor
ec
nige
ly p
ohe
of t
ue
-val
Pct
ed
peex
Dudridge PLoS Genetics 2013 pi0Proportion of markers with no effect Purcell Nature 2009
Schizophrenia risk prediction
lsquoonly 5 matterrsquo
lsquoonly 10 matterrsquo(but still canrsquot tellWhich ones until lsquoall matterrsquo Full rank list)
inclusion threshold copy source unknown All rights reserved This content is excluded from our CreativeCommons license For more information see httpocwmiteduhelpfaq-fair-use
bull It depends on ndash Architecture Fraction of SNPs that are estimated to be functional ndash Power Number of individuals in cohort ie ability to rank correctly It only peaks at 5 (asymp1-pi0) when sufficient power to rank ndash Large fraction of associated markers are hidden within non-significant SNPs
bull
bull For pi0=090 still need to include all SNPs to maximize predictive power 89
Application to pleiotropy and common risk Trait 1 (schizophrenia) Case-control cohort w genotype + phenotype
Selection of SNPs Estimation of effects Ranking
Apply predictor Evaluate accuracy
Trait 2 (bipolar disorder) Case-control cohort w genotype + phenotype
bull Ability to assess common genetic risk Are the highly-ranked SNPs for one study relevant to a different study
Is there a shared genetic architecture between seemingly unrelated traits
irst use showed schizophrenia and bipolar disorder common risk Schizophrenia-ranked SNPs in one cohortlt
lt are predictive of bipolar disorder diagnosis lt but not predictive of unrelated (cardiovascular) traits
ndashndash
bull Fndashndashndash
90
Important pointscaveats for risk prediction bull Always limited by genetic component
ndash Environment random effects play big role for most traits
bull Mendelian=deterministic vs common variants=probic
ndash Only a first screen for individuals at risk
bull Limited by discovery power
ndash Cohort size limits discriminative power and ranking ability
bull Limited by genotyped SNPvs vs all SNPs
ndash Selection pushes fitness-reducing variants to lower freq
ndash Genotyped SNPs selected to be common
bull Even if SNPs are correctly id entified their effects are not
ndash Winnerrsquos curse over-estimate above-threshold true effect
bull Training and testing cohort non-independence
ndash Relatives cryptic relatedness population stratification inflate est 91
91
Goal Personalized and Predictive Medicine 1 Intro to Epidemiology basis of human disease 2 Genetic Epidemiology
ndash Genetic basis GWAS and screening ndash Interpreting GWAS with functional genomics ndash Calculating functional enrichments for GWAS loci
3 Molecular epidemiology ndash meQTLs Genotype-Epigenome association (cis-trans-) ndash EWAS Epigenome-Disease association
4 Resolving Causality ndash Statistical Mendelian Randomization ndash Application to genotype + methylation in AD
5 Systems Genomics and Epigenomics of disease ndash Beyond single loci polygenic risk prediction models ndash Sub-threshold loci and somatic heterogeneity in cancer
92
This talk From loci to mechanisms
Building a reference map of the regulatory genome Enhancers Promoters Transcribed Repressed
Regions Enhancers promoters transcribed repressed Cell types Predict tissues and cell types of epigenomic act ivity Target genes Link variants to their target genes using eQTLs activity Hi-C Nucleotides Regulatory consequence of mutation Conservation PWMs Regulators Upstream regulators whose activity is disrupted by mutation
Application to GWAS hidden heritability and Cancer GWAS CATGCCTG bull 93 top hits non-coding Mechanism Cell type hits CGTGTCTA bull Lie in haplotype blocks Causal variant(s)
lsquoHiddenrsquo CATGCCTG bull Many variants small effects Pathway-level burdenload heritability CGTGTCTA bull Many false positives Prioritize w regulatory annotations
Cancer bull s of function CATGCCTG Los Protein-coding variants convergence mutations CATCCCTG bull Gain of function Regulatory variants heterogeneity
93
Characterizing sub-threshold variants in heart arrhythmia
copy source unknown All rights reservedThiscontent is excluded from our Creative
Commons license For more information see
httpocwmiteduhelpfaq-fair-use
Focus on sub-threshold variants
(eg rs1743292 P=10-42)
Trait QRSQT interval
(1) Large cohorts (2) many known hits (3) well-characterized tissue drivers 94
From Arking D E Pulit S L Crotti L Harst P V Munroe P BKoopmann T T Newton-Cheh C (2014) Genetic associationstudy of QT interval highlights role for calcium myocardial repolarizationNature Genetics Nat Genet 46(8) 826-836 Used with permission
Enhancers overlapping GWAS loci share functional properties
copy source unknown All rights reserved This content is excluded from our CreativeCommons license For more information see httpocwmiteduhelpfaq-fair-use
Train machine learning model to prioritize sub-threshold loci 95
Functional evidence for sub-threshold target genes
Zebrafish phenotypes Human genetics
copy source unknown All rights reserved This content is excluded from our CreativeCommons license For more information see httpocwmiteduhelpfaq-fair-use
Mouse phenotypes 96
Experimental validation of 11 sub-threshold loci
copy source unknown All rights reserved This content is excluded from our CreativeCommons license For more information see httpocwmiteduhelpfaq-fair-use
9 of 11 tested loci show allelic activity chromatin interactions
97
Functional evidence for rs1743292 causality (P=10-42)
Enhancer 4C links to target gene promoters Heart enhancer activity
Motif disruption Allelic DNase in multiple individuals copy source unknown All rights reserved This content is excluded from our CreativeCommons license For more information see httpocwmiteduhelpfaq-fair-use Allelic enha-
ncer activity 98
Target gene impact on heart conduction
Optical voltage mapping
zebrafish embryo hearts voltage-sensitive fluorescent dye
ventricle
atrium
transmembrane voltage (ventricle)
copy source unknown All rights reserved This content is excludedfrom our Creative Commons license For more information seehttpocwmiteduhelpfaq-fair-use
Detection and validation of a new cardiac locus
99
What would we need to discover rs1743292 without epigenomics
rs1743292 Minor allele frequency 0134
Effect size -05773 +- 017 msec With 68900 individuals 128 power to discover at plt5x10-8
bull rs1743292 has similar effect sizes as many genome-wide significant variants
bull Many GWAS variants discovered due to winnerrsquos curse often only have 5-
20 power to discover
bull Combining epigenomics and GWAS can
1 Confirm existing GWAS loci are real
2 Discover new sub-threshold loci with weak effect sizes low power
To reach 80 power to discover rs1743292 at plt5x10-8 we need 146700 individuals
100
Goal Personalized and Predictive Medicine 1 Intro to Epidemiology basis of human disease
enetic Epidemiology Genetic basis GWAS and screening Interpreting GWAS with functional genomics Calculating functional enrichments for GWAS loci
olecular epidemiology meQTLs Genotype-Epigenome association (cis-trans-) EWAS Epigenome-Disease association
esolving Causality Statistical Mendelian Randomization Application to genotype + methylation in AD
ystems Genomics and Epigenomics of disease Beyond single loci polygenic risk prediction models Sub-threshold loci and somatic heterogeneity in cancer
2 Gndash ndash ndash
3 Mndash ndash
4 Rndash ndash
5 Sndash ndash
101
This talk From loci to mechanisms
Building a reference map of the regulatory genome Enhancers Promoters Transcribed Repressed
Regions Enhancers promoters transcribed repressed Cell types Predict tissues and cell types of epigenomic act ivity Target genes Link variants to their target genes using eQTLs activity Hi-C Nucleotides Regulatory consequence of mutation Conservation PWMs Regulators Upstream regulators whose activity is disrupted by mutation
Application to GWAS hidden heritability and Cancer GWAS CATGCCTG bull 93 top hits non-coding Mechanism Cell type hits CGTGTCTA bull Lie in haplotype blocks Causal variant(s)
lsquoHiddenrsquo CATGCCTG bull Many variants small effects Pathway-level burdenload heritability CGTGTCTA bull Many false positives Prioritize w regulatory annotations
Cancer function CATGCCTG bull Loss of Protein-coding variants convergence mutations CATCCCTG bull Gain of function Regulatory variants heterogeneity
102
Regulatory convergence of dispersed driver mutations
copy source unknown All rights reserved This content is excluded from our CreativeCommons license For more information see httpocwmiteduhelpfaq-fair-use
Common mutations in regulatory plexus of each gene Richard Sallari 103
Cancer genes are more likely to be up-regulated
copy source unknown All rights reserved This content is excluded from our CreativeCommons license For more information see httpocwmiteduhelpfaq-fair-use
Richard Sallari 104
Dysregulated genes show dispersed non-coding mutations
copy source unknown All rights reserved This content is excluded from our CreativeCommons license For more information see httpocwmiteduhelpfaq-fair-use
Dysregulated genes are enriched for plexus mutations at all distances Richard Sallari 105
Non-coding mutations enriched in promoters enhancers active in other cell types
copy source unknown All rights reserved This content is excluded from our CreativeCommons license For more information see httpocwmiteduhelpfaq-fair-use
Disruptive mutations in lsquolowrsquo elements are enriched in enhancers and promoters in other tissues
Richard Sallari 106
Statistical model for excess of raresomatic variants
copy source unknown All rights reserved This content is excluded from our CreativeCommons license For more information see httpocwmiteduhelpfaq-fair-use
bullCorrect for region- state- tumor-specific rate variation 107
Convergence in immune signaling mitoch functions
copy source unknown All rights reserved This content is excluded from our CreativeCommons license For more information see httpocwmiteduhelpfaq-fair-use
bullPathway-level convergence hierarchical model 108
Richard Sallari
Non-coding drivers of prostate cancer dysregulation
Regulatory mutations reveal Convergence in immune signaling new cancer driver genes
mitochondrial functions
copy source unknown All rights reserved This content is excluded from our CreativeCommons license For more information see httpocwmiteduhelpfaq-fair-use
Convergence in inositol phosphate metabolism PLCB4 overexpression in PC3 prostate cancer adjacent to PTEN PIK3CA known cancer genes reduces ErkAkt activity synergistic with PTEN
109
Personal genomics tomorrow Already 100000s of complete genomes
bull Health disease quantitative traits ndash Genomics regions disease mechanism drug targets ndash Protein-coding cracking regulatory code variation ndash Single genes systems gene interactions pathways
bull Human ancestry ndash Resolve all of human ancestral relationships ndash Complete history of all migrations selective events ndash Resolve common inheritance vs trait association
bull Whatrsquos missing is the computation ndash New algorithms machine learning dimensionality reduction ndash Individualized treatment from 1000s genes genome ndash Understand missing heritability ndash Reveal co-evolution between geneselements ndash Correct for modulating effects in GWAS
110
Challenge ahead From research to clinic 1 Systematic medical genotyping sequencing
ndash Currently a curiosity future medical practice
2 Systematic medical molecular profiling
ndash Functional genomics in relevant cell types
3 Systematic perturbation studies for validation
ndash 1000s of regulatory predictions x 100s cell types
4 Systematic repurposing of approved drugs
ndash Systems-biology view of drug response
5 Genomics of drug response in cli nical trials
ndash Personalized drug prescription and combinations
6 Partnerships academia industry hospitals
ndash Interdisciplinary training in each of the instituttions 111
Summary Personalized amp Predictive Medicine 1 Intro to Epidemiology basis of human disease 2 Genetic Epidemiology
ndash Genetic basis GWAS and screening ndash Interpreting GWAS with functional genomics ndash Calculating functional enrichments for GWAS loci
3 Molecular epidemiology ndash meQTLs Genotype-Epigenome association (cis-trans-) ndash EWAS Epigenome-Disease association
4 Resolving Causality ndash Statistical Mendelian Randomization ndash Application to genotype + methylation in AD
5 Systems Genomics and Epigenomics of disease ndash Beyond single loci polygenic risk prediction models ndash Sub-threshold loci and somatic heterogeneity in cancer
112
MIT OpenCourseWarehttpocwmitedu
6047 6878 HST507 Computational BiologyFall 2015
For information about citing these materials or our Terms of Use visit httpocwmiteduterms
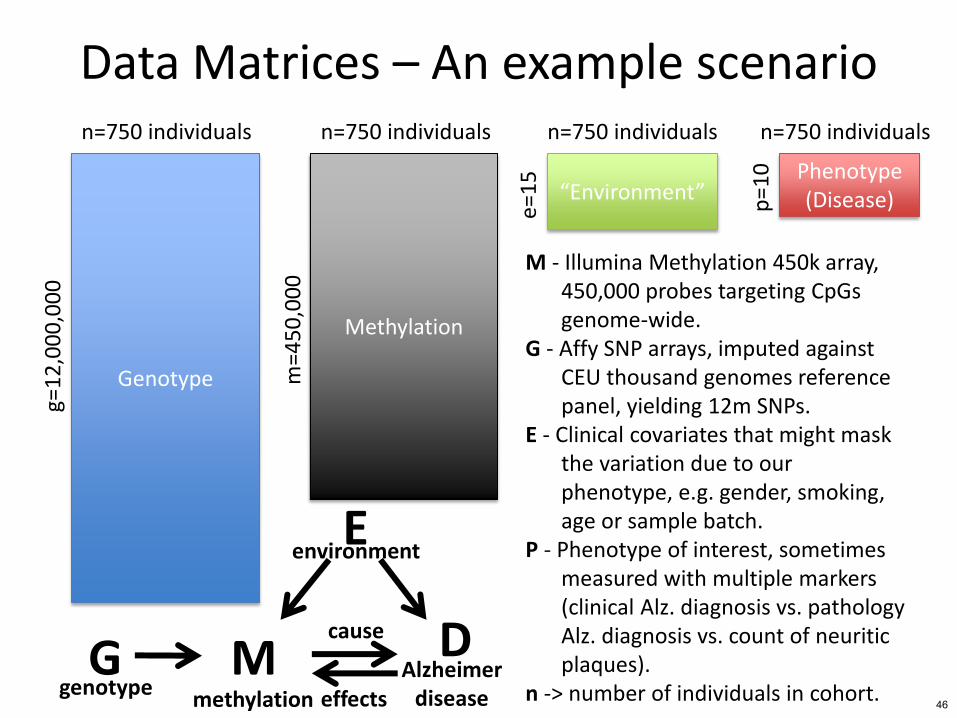

cis-meQTLs
M
n n =4
50
00
0
00
00
00
G
m 12
g=
Alternative methods of detection
Permutation bull Correlate methylation and genotype bull For i in 1 -gt nperm
bull Permute genotypes bull Correlate methylation and genotype
bull Generate empirical p-value from permuted correlations
LMM Linear mixed models
bull
bull
51
00 05 10 15 20
02
04
06
Adjusted MA Dosage
Adju
sted
Met
hyla
tion
minus05 05 15
065
075
085
Adjusted MA Dosage
Adju
sted
Met
hyla
tion
minus05 05 15
060
064
068
072
rs17836662 cg10853533 minus44352
Adjusted MA Dosage
Adju
sted
Met
hyla
tion
minus05 05 15
010
020
030
rs7924341 cg20132549 minus1847
Adjusted MA Dosage
Adju
sted
Met
hyla
tion
1 2
3 4
1
2
3 4
Most epigenomic variability is genotype-driven Manhattan plot of 450000 methylation probes
P)
10
log
-(va
lue
-P
Chromosome and genomic position
Genome-wide significance at plt3x10-10
Prune for probes disrupted by SNP
0
bullbull 140000 CpGs associated with genotype at 1 FDR
55000 at Bonferroni-corrected P-value of 10-2
52
copy source unknown All rights reserved This content is excluded from our Creative
Commons license For more information see httpocwmiteduhelpfaq-fair-use
Scaling of discovery power with individuals
copy source unknown All rights reserved This content is excluded from our Creative
Commons license For more information see httpocwmiteduhelpfaq-fair-use
bull Number of meQTLs continues to increase linearly bull Weak-effect meQTLs median R2lt01 after 400 indiv 53
Goal Personalized and Predictive Medicine 1 Intro to Epidemiology basis of human disease 2 Genetic Epidemiology
ndash Genetic basis GWAS and screening ndash Interpreting GWAS with functional genomics ndash Calculating functional enrichments for GWAS loci
3 Molecular epidemiology ndash meQTLs Genotype-Epigenome association (cis-trans-) ndash EWAS Epigenome-Disease association
4 Resolving Causality ndash Statistical Mendelian Randomization ndash Application to genotype + methylation in AD
5 Systems Genomics and Epigenomics of disease ndash Beyond single loci polygenic risk prediction models ndash Sub-threshold loci and somatic heterogeneity in cancer
54
confounders
DMG effects
cause
genotype methylation
environment
Disease
C E
MethylationDisease EWAS
Epigenome-wide association study
55
eWAS
Methylation
n n
10 Phenotype
e= (Disease)
=45
00
00
m
Link methylationphenotype (~cis-eQTLs) linear models and hypothesis testing Predict phenotype using methylation
bullbull
LM1 pi
LM2 p = β0 + β1(m ) + ε = β0 + ε
i j
56
eWAS n n
Methylation
m=4
50
00
0
Phenotype (Disease) p
=1
0
n
ldquoEnvironmentrdquo e=
15
LM1 AD = β0 + β2(gender) + ε LM2 AD = β0 + β1(mj) + β2(gender) ε
Link methylationphenotype (~cis-eQTLs) bull linear models and hypothesis testing bull Predict phenotype using methylation
Problem variance due to phenotype probably very small (unless your phenotype is cancer) Needle in a haystack Control for other sources of variance to make the variance due to the phenotype stand out If phenotype is lzheimerrsquos (D) gender incorporates more variance into your M matrix than does AD
57
eWAS
Methylation
Phenotype (Disease)
n n
m=4
50
00
0
p=
10
ldquoEnvironmentrdquo
n
e=1
5
Might have many environmental variables to control for
LM1 AD = β0 + β2(gender) + β3(age) + β4(education) + lt + ε LM2 AD = β0 + β1(mj) + β2(gender) + β3(age) + β4(education) + lt + ε
58
eWAS Need to account for variance due to genotype as well
Methylation
Phenotype (Disease)
n n
m=4
50
00
0
p=
10
ldquoEnvironmentrdquo
n
e=1
5
Genotype
n
g=1
20
00
00
0
59
Role of enhancers vs promoters in lzheimerrsquos disease association
60
Enhancers are hemi-methylated and highly variable
Enhancers show most variable methylation
Promoters show least variable methylation
copy source unknown All rights reserved This content is excluded from our Creative
Commons license For more information see httpocwmiteduhelpfaq-fair-use
bull Highly distinct signatures for promoters vs enhancers
bull Enhancers hemi-methylated Methylation level Methylation level in each person (not bimodal)
61
SNP-associated CpGs in enhancers not promoters
bull Promoter methylation less affected by genetics bull Enhancer methylation highly genotype-driven
TSS flanking Enhancers Repressed
Enric
hmen
t for
meQ
TLs
12
5 Transcribed
Promoters
TxEnh
bull TSS-flanking and repressed regions also genetic62
AD-associated probes in distal enhancers Pe
r st
ate
(O
bs ndash
Exp
)
Tota
l
Enhancers
Promoters
copy source unknown All ri ghts reserved This content is excluded from our Creative
Commons license For more information see httpocwmiteduhelpfaq-fair-use
bull After cleaning with known and inferred covariates
bull Distal and transcribed enhancers enriched
Proximal regulators (promoters) depleted 63
bull 63
ICA covariate correction cleans up enhancer signal
Before
Orange Enrichment of enhancer probes for association with the real phenotype
Grey Enrichment of enhancer probes for a scrambled phenotype
After (After conditioning on 7 surrogate variables discovered with ICA)
Empirical p=006
Empirical plt0001
copy source unknown All rights reserved This content is excluded from our Creative
Commons license For more information see httpocwmiteduhelpfaq-fair-use 64
AD predictive power highest in enhancers
AP
OE
enhancers
methylome
promoters
All SNPs
Top predictive features are bullEnhancer
ethylation
ll me thyl
SS Het
enetics incl APOE)
ausality
ommon athways
m
bull A
bull T
bullG(
bull C
bullCp
copy source unknown All rights reserved This content is excluded from our Creative
Commons license For more information see httpocwmiteduhelpfaq-fair-use65
NRSF
ELK1
All probes ranked by AD assoc P-value
Nonminussignificant pathways Significant pathways
060
065
070
075
AUC using pathway feature selection p= 1922eminus11
AD prediction reveals likely biological pathways
All probes ranked by AD assoc P-value
CTCF
copy source unknown All rights reserved This content is excluded from our Creative
Commons license For more information see httpocwmiteduhelpfaq-fair-use
Enriched regulatory motifs
suggest potential pathway s
HEBTcf12 proliferating neural and progenitor cells
GATA cell growth blood cell development
66TLX1NFIC Neuronal cell fates Mouse AD models 66
Goal Personalized and Predictive Medicine 1 Intro to Epidemiology basis of human disease 2 Genetic Epidemiology
ndash Genetic basis GWAS and screening ndash Interpreting GWAS with functional genomics ndash Calculating functional enrichments for GWAS loci
3 Molecular epidemiology ndash meQTLs Genotype-Epigenome association (cis-trans-) ndash EWAS Epigenome-Disease association
4 Resolving Causality ndash Statistical Mendelian Randomization ndash Application to genotype + methylation in AD
5 Systems Genomics and Epigenomics of disease ndash Beyond single loci polygenic risk prediction models ndash Sub-threshold loci and somatic heterogeneity in cancer
67
67
ins
C E confounders environment
Risk factor causality w instrumental variables If XY are correlated possible scenarios are bull XY bull causes X Y
G Y bull XU Y Xtrument
risk factor outcome To distinguish need effects controlled random experiment
Is risk factor X causing disease Y (or a consequence)
ndash Eg alcohol addiction smoking blood cholesterol fever stress Randomized experiment with and without X feasibility ethics
G randomized experiment (eg random Mendelian inheritance) as only some subjects have genotype
G (iv)must be correlated with Y but only through X ie if X known G gives no additional information about Y
68
bull
bull
bull
68
In silico thought experiment
0 200 400 600 80000
02
04
06
08
10
p=2946466eminus35noi
atylh
etM
Subjects
ADnonAD
0 200 400 600 80000
02
04
06
08
10
p=3847832eminus05
noiat
ylhet
M
Subjects
ADnonAD
Same effect due to Alz but with larger effect due to genotype
CC
Small but significant effect due to Alz
CA
copy source unknown All rights reserved This content is excluded from our Creative
Commons license For more information see httpocwmiteduhelpfaq-fair-use
Hemi-methylation associated with meQTL yields a p-value thatrsquos 30 orders of magnitude lower for the AD phenotype
69
MGE P+ + = GE P+ =
From G include probe-specific terms for cis-meQTLs as well as including trans-meQTLs in all comparisons
VS
Mendelian randomization approach Account for variance due to genotype how much does methylation add
With variability due to genotype and environmental covariates removed the effect due to phenotype should become more prevalent
70
Causality testing
71
Modeling complex Human diseases bull Three possible models
1 Independent Associations
D
MG X
2 Causal Pathway Model
3 Interaction Model
D
G
M
Genotype
DG M
D
MG
72
Methylation
Disease
(1) Independent Associations
D
MG X
bull Association between Factor A and Disease bull Association between Factor B and Disease bull No association between Factor A and Factor B
G Factor A
bull Example 2 independent risk genes X Factor B
Y Disease D 73
(2) Causal Pathway Models
bull Is the a direct link between risk factor (A) and disease (D)
DA
bull Does the risk factorrsquos () effect on disease (D) depend on an intermediate step (B)
DA B
bull To test ndash A is associated with B and D ndash B is associated with D ndash A is not associated with D when controlling for
ndash Note A MUST come before B temporally
B
D
G
X
Factor A
Factor B
Disease D 74
(2) Causal Pathway Models
bull In reality its a little of both rsquos affect on D is partially mediated through B
A DB
bull To test ndash A is associated with B and D ndash B is associated with D ndash The effect size of A on D is decreased when con
ndash Note A MUST come before B temporally
bull Example CR1 effect on cognitive decline
trolling for B
A Factor A Factor B Disease D D
B
75
(3) Interaction Models
bull Factor Brsquos effect on D is different depending on value for factor
B (A = Aa)
B (A = AA)
D
B (A = aa)
bull To test ndash A + B + AB D if estimate for AB is significant then ndash Stratify by levels of A
bull Example
ndash drugrsquos effect is different depending on genotype ndash More to comelt
76
Gene locus reference Published
AD AD NP
BIN1
CD2AP
CD33
rs744373
rs9349407
rs3865444
Seshadri 2010
Naj 2011Hollingsworth 2011
Naj 2011Hollingsworth 2012
16x10-11
86x10-9
16x10-9
0204
0445
0133
0480
0221
0123
ABCA7 rs3764650 Hollingsworth 2010 50x10-21 0747 0187 APOE Any ε4 12x10-13 18x10-23
CLU rs11136000 Lambert 2009Harold 2009 75x10-9 0762 0649 CR1 rs6656401 Lambert 2009 37x10-9 00009 0057
EPHA1 rs11767557 Naj 2011Hollingsworth 2011 60x10-10 0562 0391 MS4A4A rs4938933 Naj 2011 17x10-9 0792 0567 MS4A6A rs610932 Hollingsworth 2010 12x10-16 0534 0820
MTHFD1L rs11754661 Naj 2010 19x10-10 0126 0934 PICALM rs3851179 Harold 2009 19x10-8 0382 0171
Application to 12 AD GWAS loci
77
Tangles
CR1 Causal pathway model
Risk Factors Pathology Clinical Disease
Alzheimerrsquos disease
Genetic CR1
Cognitive Decline
AD specific Neuritic Plaque Neurofibulary
bull CR1 first associated with AD in 2009 bull Original associated variant is in an intron no clear function bull Unclear how CR1 locus influences AD susceptibility mechanistically
bull
Questions ndash Is the effect only on AD ndash Is there a broader effect on cognitive decline ndash Is there an association with AD pathology ndash Does it go through pathology to have an effect of cognitive decline
78
CR1 (rs6656401)
CR1 Pathology
04
045
05
055
06
065
07
075
08
085
Neuritic Plaque Neurofibillary Tangles
TT ATAA (risk allele)
CR1 Global Cognitive Decline
p=00008
p=0008 p=010
Pathology Global Cognitive Decline p lt 00001 time
79
Matt Eaton Phil De Jager
Epigenome
Genetic + Epigenetic variation in lzheimerrsquos
Relate to genotype and AD variation 723 AD patients amp controls Methylation variation in
Genome
meQTL
Phenotype
Classification Epigenome MWAS
1 2
copy source unknown All rights reserved This content isexcluded from our Creative Commons license For moreinformation see httpocwmiteduhelpfaq-fair-use
Methylation gtgt SNPs Estimate causal M roles regression Enhancers gtgt promoters of meQTL effects reduces MD
copy source unknown All rights reserved This content is excluded
from our Creative Commons license For more information see
httpocwmiteduhelpfaq-fair-use 80
Goal Personalized and Predictive Medicine 1 Intro to Epidemiology basis of human disease 2 Genetic Epidemiology
ndash Genetic basis GWAS and screening ndash Interpreting GWAS with functional genomics ndash Calculating functional enrichments for GWAS loci
3 Molecular epidemiology ndash meQTLs Genotype-Epigenome association (cis-trans-) ndash EWAS Epigenome-Disease association
4 Resolving Causality ndash Statistical Mendelian Randomization ndash Application to genotype + methylation in AD
5 Systems Genomics and Epigenomics of disease ndash Beyond single loci polygenic risk prediction models ndash Sub-threshold loci and somatic heterogeneity in cancer
81
Beyond top-scoring hits 1000s of variants of weak effect
cluster in cell type specific enhancers
82
Rank-based functional testing of weak associations
Enrichment peaks at 10000s of SNPs down the rank list even after LD pruning
copy source unknown All rights reserved This content is excluded from our Creative
Commons license For more information see httpocwmiteduhelpfaq-fair-use
bull Rank all SNPs based on GWAS signal strength bull Functional enrichment for cell types and states 83
Weak-effect T1D hits in 50k T-cell enhancers enhancers
CD4+ T-cells
T-cells B-cells
Other cell types
copy source unknown All rights reserved This content is excluded from our Creative
Commons license For more information see httpocwmiteduhelpfaq-fair-use
bull LD-pruning (CEU r2gt2) 50k 41k independ loci 84
Cell type specificity stronger for enhancers enhancers promoters
transcribed
CD4+ T-cells
T-cells B-cells
Other cell types
copy source unknown All rights reserved This content is excluded from our Creative
Commons license For more information see httpocwmiteduhelpfaq-fair-use
bull TB-cells also enriched for promoters transcribed bull Enhancer enrichment much more cell type specific 85
T1DRA-enriched enhancers spread across genome
copy source unknown All rights reserved This content is excluded from our Creative
Commons license For more information see httpocw miteduhelpfaq-fair-use
bull High concentration of loci in MHC high overlapbull Yet many distinct regions 1000s of distinct loci 86
Implications for genetic predisposition polygenic models for risk prediction
87
1
Basic setup of polygenic risk prediction studies Case-control cohort w genotype + phenotype
Training cohort Testing cohort
Selection of SNPs Estimation of effects Ranking
Apply predictor Evaluate accuracy
Apply predictor w estimated confidence
Target cohort genotyped individuals
(no phenotypes)
1
(power matters) (power matters) (power limited to one individual at a time)
2
bull Applications 1 (testing cohort) ndash Understand total heritability captured in common variants
ndash Understand disease ldquoarchitecturerdquo number of SNPs ndash Recognize functional classes associated with weak genetic associations
bull Applications 2 2 (new individuals) ndash Provide health recommendations at the individual level
ndash Prioritize high-risk individuals for subsequent testing at population level 88
How many SNPs to include in model
scor
ec
nige
ly p
ohe
of t
ue
-val
Pct
ed
peex
Dudridge PLoS Genetics 2013 pi0Proportion of markers with no effect Purcell Nature 2009
Schizophrenia risk prediction
lsquoonly 5 matterrsquo
lsquoonly 10 matterrsquo(but still canrsquot tellWhich ones until lsquoall matterrsquo Full rank list)
inclusion threshold copy source unknown All rights reserved This content is excluded from our CreativeCommons license For more information see httpocwmiteduhelpfaq-fair-use
bull It depends on ndash Architecture Fraction of SNPs that are estimated to be functional ndash Power Number of individuals in cohort ie ability to rank correctly It only peaks at 5 (asymp1-pi0) when sufficient power to rank ndash Large fraction of associated markers are hidden within non-significant SNPs
bull
bull For pi0=090 still need to include all SNPs to maximize predictive power 89
Application to pleiotropy and common risk Trait 1 (schizophrenia) Case-control cohort w genotype + phenotype
Selection of SNPs Estimation of effects Ranking
Apply predictor Evaluate accuracy
Trait 2 (bipolar disorder) Case-control cohort w genotype + phenotype
bull Ability to assess common genetic risk Are the highly-ranked SNPs for one study relevant to a different study
Is there a shared genetic architecture between seemingly unrelated traits
irst use showed schizophrenia and bipolar disorder common risk Schizophrenia-ranked SNPs in one cohortlt
lt are predictive of bipolar disorder diagnosis lt but not predictive of unrelated (cardiovascular) traits
ndashndash
bull Fndashndashndash
90
Important pointscaveats for risk prediction bull Always limited by genetic component
ndash Environment random effects play big role for most traits
bull Mendelian=deterministic vs common variants=probic
ndash Only a first screen for individuals at risk
bull Limited by discovery power
ndash Cohort size limits discriminative power and ranking ability
bull Limited by genotyped SNPvs vs all SNPs
ndash Selection pushes fitness-reducing variants to lower freq
ndash Genotyped SNPs selected to be common
bull Even if SNPs are correctly id entified their effects are not
ndash Winnerrsquos curse over-estimate above-threshold true effect
bull Training and testing cohort non-independence
ndash Relatives cryptic relatedness population stratification inflate est 91
91
Goal Personalized and Predictive Medicine 1 Intro to Epidemiology basis of human disease 2 Genetic Epidemiology
ndash Genetic basis GWAS and screening ndash Interpreting GWAS with functional genomics ndash Calculating functional enrichments for GWAS loci
3 Molecular epidemiology ndash meQTLs Genotype-Epigenome association (cis-trans-) ndash EWAS Epigenome-Disease association
4 Resolving Causality ndash Statistical Mendelian Randomization ndash Application to genotype + methylation in AD
5 Systems Genomics and Epigenomics of disease ndash Beyond single loci polygenic risk prediction models ndash Sub-threshold loci and somatic heterogeneity in cancer
92
This talk From loci to mechanisms
Building a reference map of the regulatory genome Enhancers Promoters Transcribed Repressed
Regions Enhancers promoters transcribed repressed Cell types Predict tissues and cell types of epigenomic act ivity Target genes Link variants to their target genes using eQTLs activity Hi-C Nucleotides Regulatory consequence of mutation Conservation PWMs Regulators Upstream regulators whose activity is disrupted by mutation
Application to GWAS hidden heritability and Cancer GWAS CATGCCTG bull 93 top hits non-coding Mechanism Cell type hits CGTGTCTA bull Lie in haplotype blocks Causal variant(s)
lsquoHiddenrsquo CATGCCTG bull Many variants small effects Pathway-level burdenload heritability CGTGTCTA bull Many false positives Prioritize w regulatory annotations
Cancer bull s of function CATGCCTG Los Protein-coding variants convergence mutations CATCCCTG bull Gain of function Regulatory variants heterogeneity
93
Characterizing sub-threshold variants in heart arrhythmia
copy source unknown All rights reservedThiscontent is excluded from our Creative
Commons license For more information see
httpocwmiteduhelpfaq-fair-use
Focus on sub-threshold variants
(eg rs1743292 P=10-42)
Trait QRSQT interval
(1) Large cohorts (2) many known hits (3) well-characterized tissue drivers 94
From Arking D E Pulit S L Crotti L Harst P V Munroe P BKoopmann T T Newton-Cheh C (2014) Genetic associationstudy of QT interval highlights role for calcium myocardial repolarizationNature Genetics Nat Genet 46(8) 826-836 Used with permission
Enhancers overlapping GWAS loci share functional properties
copy source unknown All rights reserved This content is excluded from our CreativeCommons license For more information see httpocwmiteduhelpfaq-fair-use
Train machine learning model to prioritize sub-threshold loci 95
Functional evidence for sub-threshold target genes
Zebrafish phenotypes Human genetics
copy source unknown All rights reserved This content is excluded from our CreativeCommons license For more information see httpocwmiteduhelpfaq-fair-use
Mouse phenotypes 96
Experimental validation of 11 sub-threshold loci
copy source unknown All rights reserved This content is excluded from our CreativeCommons license For more information see httpocwmiteduhelpfaq-fair-use
9 of 11 tested loci show allelic activity chromatin interactions
97
Functional evidence for rs1743292 causality (P=10-42)
Enhancer 4C links to target gene promoters Heart enhancer activity
Motif disruption Allelic DNase in multiple individuals copy source unknown All rights reserved This content is excluded from our CreativeCommons license For more information see httpocwmiteduhelpfaq-fair-use Allelic enha-
ncer activity 98
Target gene impact on heart conduction
Optical voltage mapping
zebrafish embryo hearts voltage-sensitive fluorescent dye
ventricle
atrium
transmembrane voltage (ventricle)
copy source unknown All rights reserved This content is excludedfrom our Creative Commons license For more information seehttpocwmiteduhelpfaq-fair-use
Detection and validation of a new cardiac locus
99
What would we need to discover rs1743292 without epigenomics
rs1743292 Minor allele frequency 0134
Effect size -05773 +- 017 msec With 68900 individuals 128 power to discover at plt5x10-8
bull rs1743292 has similar effect sizes as many genome-wide significant variants
bull Many GWAS variants discovered due to winnerrsquos curse often only have 5-
20 power to discover
bull Combining epigenomics and GWAS can
1 Confirm existing GWAS loci are real
2 Discover new sub-threshold loci with weak effect sizes low power
To reach 80 power to discover rs1743292 at plt5x10-8 we need 146700 individuals
100
Goal Personalized and Predictive Medicine 1 Intro to Epidemiology basis of human disease
enetic Epidemiology Genetic basis GWAS and screening Interpreting GWAS with functional genomics Calculating functional enrichments for GWAS loci
olecular epidemiology meQTLs Genotype-Epigenome association (cis-trans-) EWAS Epigenome-Disease association
esolving Causality Statistical Mendelian Randomization Application to genotype + methylation in AD
ystems Genomics and Epigenomics of disease Beyond single loci polygenic risk prediction models Sub-threshold loci and somatic heterogeneity in cancer
2 Gndash ndash ndash
3 Mndash ndash
4 Rndash ndash
5 Sndash ndash
101
This talk From loci to mechanisms
Building a reference map of the regulatory genome Enhancers Promoters Transcribed Repressed
Regions Enhancers promoters transcribed repressed Cell types Predict tissues and cell types of epigenomic act ivity Target genes Link variants to their target genes using eQTLs activity Hi-C Nucleotides Regulatory consequence of mutation Conservation PWMs Regulators Upstream regulators whose activity is disrupted by mutation
Application to GWAS hidden heritability and Cancer GWAS CATGCCTG bull 93 top hits non-coding Mechanism Cell type hits CGTGTCTA bull Lie in haplotype blocks Causal variant(s)
lsquoHiddenrsquo CATGCCTG bull Many variants small effects Pathway-level burdenload heritability CGTGTCTA bull Many false positives Prioritize w regulatory annotations
Cancer function CATGCCTG bull Loss of Protein-coding variants convergence mutations CATCCCTG bull Gain of function Regulatory variants heterogeneity
102
Regulatory convergence of dispersed driver mutations
copy source unknown All rights reserved This content is excluded from our CreativeCommons license For more information see httpocwmiteduhelpfaq-fair-use
Common mutations in regulatory plexus of each gene Richard Sallari 103
Cancer genes are more likely to be up-regulated
copy source unknown All rights reserved This content is excluded from our CreativeCommons license For more information see httpocwmiteduhelpfaq-fair-use
Richard Sallari 104
Dysregulated genes show dispersed non-coding mutations
copy source unknown All rights reserved This content is excluded from our CreativeCommons license For more information see httpocwmiteduhelpfaq-fair-use
Dysregulated genes are enriched for plexus mutations at all distances Richard Sallari 105
Non-coding mutations enriched in promoters enhancers active in other cell types
copy source unknown All rights reserved This content is excluded from our CreativeCommons license For more information see httpocwmiteduhelpfaq-fair-use
Disruptive mutations in lsquolowrsquo elements are enriched in enhancers and promoters in other tissues
Richard Sallari 106
Statistical model for excess of raresomatic variants
copy source unknown All rights reserved This content is excluded from our CreativeCommons license For more information see httpocwmiteduhelpfaq-fair-use
bullCorrect for region- state- tumor-specific rate variation 107
Convergence in immune signaling mitoch functions
copy source unknown All rights reserved This content is excluded from our CreativeCommons license For more information see httpocwmiteduhelpfaq-fair-use
bullPathway-level convergence hierarchical model 108
Richard Sallari
Non-coding drivers of prostate cancer dysregulation
Regulatory mutations reveal Convergence in immune signaling new cancer driver genes
mitochondrial functions
copy source unknown All rights reserved This content is excluded from our CreativeCommons license For more information see httpocwmiteduhelpfaq-fair-use
Convergence in inositol phosphate metabolism PLCB4 overexpression in PC3 prostate cancer adjacent to PTEN PIK3CA known cancer genes reduces ErkAkt activity synergistic with PTEN
109
Personal genomics tomorrow Already 100000s of complete genomes
bull Health disease quantitative traits ndash Genomics regions disease mechanism drug targets ndash Protein-coding cracking regulatory code variation ndash Single genes systems gene interactions pathways
bull Human ancestry ndash Resolve all of human ancestral relationships ndash Complete history of all migrations selective events ndash Resolve common inheritance vs trait association
bull Whatrsquos missing is the computation ndash New algorithms machine learning dimensionality reduction ndash Individualized treatment from 1000s genes genome ndash Understand missing heritability ndash Reveal co-evolution between geneselements ndash Correct for modulating effects in GWAS
110
Challenge ahead From research to clinic 1 Systematic medical genotyping sequencing
ndash Currently a curiosity future medical practice
2 Systematic medical molecular profiling
ndash Functional genomics in relevant cell types
3 Systematic perturbation studies for validation
ndash 1000s of regulatory predictions x 100s cell types
4 Systematic repurposing of approved drugs
ndash Systems-biology view of drug response
5 Genomics of drug response in cli nical trials
ndash Personalized drug prescription and combinations
6 Partnerships academia industry hospitals
ndash Interdisciplinary training in each of the instituttions 111
Summary Personalized amp Predictive Medicine 1 Intro to Epidemiology basis of human disease 2 Genetic Epidemiology
ndash Genetic basis GWAS and screening ndash Interpreting GWAS with functional genomics ndash Calculating functional enrichments for GWAS loci
3 Molecular epidemiology ndash meQTLs Genotype-Epigenome association (cis-trans-) ndash EWAS Epigenome-Disease association
4 Resolving Causality ndash Statistical Mendelian Randomization ndash Application to genotype + methylation in AD
5 Systems Genomics and Epigenomics of disease ndash Beyond single loci polygenic risk prediction models ndash Sub-threshold loci and somatic heterogeneity in cancer
112
MIT OpenCourseWarehttpocwmitedu
6047 6878 HST507 Computational BiologyFall 2015
For information about citing these materials or our Terms of Use visit httpocwmiteduterms

Goal Personalized and Predictive Medicine 1 Intro to Epidemiology basis of human disease 2 Genetic Epidemiology
ndash Genetic basis GWAS and screening ndash Interpreting GWAS with functional genomics ndash Calculating functional enrichments for GWAS loci
3 Molecular epidemiology ndash meQTLs Genotype-Epigenome association (cis-trans-) ndash EWAS Epigenome-Disease association
4 Resolving Causality ndash Statistical Mendelian Randomization ndash Application to genotype + methylation in AD
5 Systems Genomics and Epigenomics of disease ndash Beyond single loci polygenic risk prediction models ndash Sub-threshold loci and somatic heterogeneity in cancer
54
confounders
DMG effects
cause
genotype methylation
environment
Disease
C E
MethylationDisease EWAS
Epigenome-wide association study
55
eWAS
Methylation
n n
10 Phenotype
e= (Disease)
=45
00
00
m
Link methylationphenotype (~cis-eQTLs) linear models and hypothesis testing Predict phenotype using methylation
bullbull
LM1 pi
LM2 p = β0 + β1(m ) + ε = β0 + ε
i j
56
eWAS n n
Methylation
m=4
50
00
0
Phenotype (Disease) p
=1
0
n
ldquoEnvironmentrdquo e=
15
LM1 AD = β0 + β2(gender) + ε LM2 AD = β0 + β1(mj) + β2(gender) ε
Link methylationphenotype (~cis-eQTLs) bull linear models and hypothesis testing bull Predict phenotype using methylation
Problem variance due to phenotype probably very small (unless your phenotype is cancer) Needle in a haystack Control for other sources of variance to make the variance due to the phenotype stand out If phenotype is lzheimerrsquos (D) gender incorporates more variance into your M matrix than does AD
57
eWAS
Methylation
Phenotype (Disease)
n n
m=4
50
00
0
p=
10
ldquoEnvironmentrdquo
n
e=1
5
Might have many environmental variables to control for
LM1 AD = β0 + β2(gender) + β3(age) + β4(education) + lt + ε LM2 AD = β0 + β1(mj) + β2(gender) + β3(age) + β4(education) + lt + ε
58
eWAS Need to account for variance due to genotype as well
Methylation
Phenotype (Disease)
n n
m=4
50
00
0
p=
10
ldquoEnvironmentrdquo
n
e=1
5
Genotype
n
g=1
20
00
00
0
59
Role of enhancers vs promoters in lzheimerrsquos disease association
60
Enhancers are hemi-methylated and highly variable
Enhancers show most variable methylation
Promoters show least variable methylation
copy source unknown All rights reserved This content is excluded from our Creative
Commons license For more information see httpocwmiteduhelpfaq-fair-use
bull Highly distinct signatures for promoters vs enhancers
bull Enhancers hemi-methylated Methylation level Methylation level in each person (not bimodal)
61
SNP-associated CpGs in enhancers not promoters
bull Promoter methylation less affected by genetics bull Enhancer methylation highly genotype-driven
TSS flanking Enhancers Repressed
Enric
hmen
t for
meQ
TLs
12
5 Transcribed
Promoters
TxEnh
bull TSS-flanking and repressed regions also genetic62
AD-associated probes in distal enhancers Pe
r st
ate
(O
bs ndash
Exp
)
Tota
l
Enhancers
Promoters
copy source unknown All ri ghts reserved This content is excluded from our Creative
Commons license For more information see httpocwmiteduhelpfaq-fair-use
bull After cleaning with known and inferred covariates
bull Distal and transcribed enhancers enriched
Proximal regulators (promoters) depleted 63
bull 63
ICA covariate correction cleans up enhancer signal
Before
Orange Enrichment of enhancer probes for association with the real phenotype
Grey Enrichment of enhancer probes for a scrambled phenotype
After (After conditioning on 7 surrogate variables discovered with ICA)
Empirical p=006
Empirical plt0001
copy source unknown All rights reserved This content is excluded from our Creative
Commons license For more information see httpocwmiteduhelpfaq-fair-use 64
AD predictive power highest in enhancers
AP
OE
enhancers
methylome
promoters
All SNPs
Top predictive features are bullEnhancer
ethylation
ll me thyl
SS Het
enetics incl APOE)
ausality
ommon athways
m
bull A
bull T
bullG(
bull C
bullCp
copy source unknown All rights reserved This content is excluded from our Creative
Commons license For more information see httpocwmiteduhelpfaq-fair-use65
NRSF
ELK1
All probes ranked by AD assoc P-value
Nonminussignificant pathways Significant pathways
060
065
070
075
AUC using pathway feature selection p= 1922eminus11
AD prediction reveals likely biological pathways
All probes ranked by AD assoc P-value
CTCF
copy source unknown All rights reserved This content is excluded from our Creative
Commons license For more information see httpocwmiteduhelpfaq-fair-use
Enriched regulatory motifs
suggest potential pathway s
HEBTcf12 proliferating neural and progenitor cells
GATA cell growth blood cell development
66TLX1NFIC Neuronal cell fates Mouse AD models 66
Goal Personalized and Predictive Medicine 1 Intro to Epidemiology basis of human disease 2 Genetic Epidemiology
ndash Genetic basis GWAS and screening ndash Interpreting GWAS with functional genomics ndash Calculating functional enrichments for GWAS loci
3 Molecular epidemiology ndash meQTLs Genotype-Epigenome association (cis-trans-) ndash EWAS Epigenome-Disease association
4 Resolving Causality ndash Statistical Mendelian Randomization ndash Application to genotype + methylation in AD
5 Systems Genomics and Epigenomics of disease ndash Beyond single loci polygenic risk prediction models ndash Sub-threshold loci and somatic heterogeneity in cancer
67
67
ins
C E confounders environment
Risk factor causality w instrumental variables If XY are correlated possible scenarios are bull XY bull causes X Y
G Y bull XU Y Xtrument
risk factor outcome To distinguish need effects controlled random experiment
Is risk factor X causing disease Y (or a consequence)
ndash Eg alcohol addiction smoking blood cholesterol fever stress Randomized experiment with and without X feasibility ethics
G randomized experiment (eg random Mendelian inheritance) as only some subjects have genotype
G (iv)must be correlated with Y but only through X ie if X known G gives no additional information about Y
68
bull
bull
bull
68
In silico thought experiment
0 200 400 600 80000
02
04
06
08
10
p=2946466eminus35noi
atylh
etM
Subjects
ADnonAD
0 200 400 600 80000
02
04
06
08
10
p=3847832eminus05
noiat
ylhet
M
Subjects
ADnonAD
Same effect due to Alz but with larger effect due to genotype
CC
Small but significant effect due to Alz
CA
copy source unknown All rights reserved This content is excluded from our Creative
Commons license For more information see httpocwmiteduhelpfaq-fair-use
Hemi-methylation associated with meQTL yields a p-value thatrsquos 30 orders of magnitude lower for the AD phenotype
69
MGE P+ + = GE P+ =
From G include probe-specific terms for cis-meQTLs as well as including trans-meQTLs in all comparisons
VS
Mendelian randomization approach Account for variance due to genotype how much does methylation add
With variability due to genotype and environmental covariates removed the effect due to phenotype should become more prevalent
70
Causality testing
71
Modeling complex Human diseases bull Three possible models
1 Independent Associations
D
MG X
2 Causal Pathway Model
3 Interaction Model
D
G
M
Genotype
DG M
D
MG
72
Methylation
Disease
(1) Independent Associations
D
MG X
bull Association between Factor A and Disease bull Association between Factor B and Disease bull No association between Factor A and Factor B
G Factor A
bull Example 2 independent risk genes X Factor B
Y Disease D 73
(2) Causal Pathway Models
bull Is the a direct link between risk factor (A) and disease (D)
DA
bull Does the risk factorrsquos () effect on disease (D) depend on an intermediate step (B)
DA B
bull To test ndash A is associated with B and D ndash B is associated with D ndash A is not associated with D when controlling for
ndash Note A MUST come before B temporally
B
D
G
X
Factor A
Factor B
Disease D 74
(2) Causal Pathway Models
bull In reality its a little of both rsquos affect on D is partially mediated through B
A DB
bull To test ndash A is associated with B and D ndash B is associated with D ndash The effect size of A on D is decreased when con
ndash Note A MUST come before B temporally
bull Example CR1 effect on cognitive decline
trolling for B
A Factor A Factor B Disease D D
B
75
(3) Interaction Models
bull Factor Brsquos effect on D is different depending on value for factor
B (A = Aa)
B (A = AA)
D
B (A = aa)
bull To test ndash A + B + AB D if estimate for AB is significant then ndash Stratify by levels of A
bull Example
ndash drugrsquos effect is different depending on genotype ndash More to comelt
76
Gene locus reference Published
AD AD NP
BIN1
CD2AP
CD33
rs744373
rs9349407
rs3865444
Seshadri 2010
Naj 2011Hollingsworth 2011
Naj 2011Hollingsworth 2012
16x10-11
86x10-9
16x10-9
0204
0445
0133
0480
0221
0123
ABCA7 rs3764650 Hollingsworth 2010 50x10-21 0747 0187 APOE Any ε4 12x10-13 18x10-23
CLU rs11136000 Lambert 2009Harold 2009 75x10-9 0762 0649 CR1 rs6656401 Lambert 2009 37x10-9 00009 0057
EPHA1 rs11767557 Naj 2011Hollingsworth 2011 60x10-10 0562 0391 MS4A4A rs4938933 Naj 2011 17x10-9 0792 0567 MS4A6A rs610932 Hollingsworth 2010 12x10-16 0534 0820
MTHFD1L rs11754661 Naj 2010 19x10-10 0126 0934 PICALM rs3851179 Harold 2009 19x10-8 0382 0171
Application to 12 AD GWAS loci
77
Tangles
CR1 Causal pathway model
Risk Factors Pathology Clinical Disease
Alzheimerrsquos disease
Genetic CR1
Cognitive Decline
AD specific Neuritic Plaque Neurofibulary
bull CR1 first associated with AD in 2009 bull Original associated variant is in an intron no clear function bull Unclear how CR1 locus influences AD susceptibility mechanistically
bull
Questions ndash Is the effect only on AD ndash Is there a broader effect on cognitive decline ndash Is there an association with AD pathology ndash Does it go through pathology to have an effect of cognitive decline
78
CR1 (rs6656401)
CR1 Pathology
04
045
05
055
06
065
07
075
08
085
Neuritic Plaque Neurofibillary Tangles
TT ATAA (risk allele)
CR1 Global Cognitive Decline
p=00008
p=0008 p=010
Pathology Global Cognitive Decline p lt 00001 time
79
Matt Eaton Phil De Jager
Epigenome
Genetic + Epigenetic variation in lzheimerrsquos
Relate to genotype and AD variation 723 AD patients amp controls Methylation variation in
Genome
meQTL
Phenotype
Classification Epigenome MWAS
1 2
copy source unknown All rights reserved This content isexcluded from our Creative Commons license For moreinformation see httpocwmiteduhelpfaq-fair-use
Methylation gtgt SNPs Estimate causal M roles regression Enhancers gtgt promoters of meQTL effects reduces MD
copy source unknown All rights reserved This content is excluded
from our Creative Commons license For more information see
httpocwmiteduhelpfaq-fair-use 80
Goal Personalized and Predictive Medicine 1 Intro to Epidemiology basis of human disease 2 Genetic Epidemiology
ndash Genetic basis GWAS and screening ndash Interpreting GWAS with functional genomics ndash Calculating functional enrichments for GWAS loci
3 Molecular epidemiology ndash meQTLs Genotype-Epigenome association (cis-trans-) ndash EWAS Epigenome-Disease association
4 Resolving Causality ndash Statistical Mendelian Randomization ndash Application to genotype + methylation in AD
5 Systems Genomics and Epigenomics of disease ndash Beyond single loci polygenic risk prediction models ndash Sub-threshold loci and somatic heterogeneity in cancer
81
Beyond top-scoring hits 1000s of variants of weak effect
cluster in cell type specific enhancers
82
Rank-based functional testing of weak associations
Enrichment peaks at 10000s of SNPs down the rank list even after LD pruning
copy source unknown All rights reserved This content is excluded from our Creative
Commons license For more information see httpocwmiteduhelpfaq-fair-use
bull Rank all SNPs based on GWAS signal strength bull Functional enrichment for cell types and states 83
Weak-effect T1D hits in 50k T-cell enhancers enhancers
CD4+ T-cells
T-cells B-cells
Other cell types
copy source unknown All rights reserved This content is excluded from our Creative
Commons license For more information see httpocwmiteduhelpfaq-fair-use
bull LD-pruning (CEU r2gt2) 50k 41k independ loci 84
Cell type specificity stronger for enhancers enhancers promoters
transcribed
CD4+ T-cells
T-cells B-cells
Other cell types
copy source unknown All rights reserved This content is excluded from our Creative
Commons license For more information see httpocwmiteduhelpfaq-fair-use
bull TB-cells also enriched for promoters transcribed bull Enhancer enrichment much more cell type specific 85
T1DRA-enriched enhancers spread across genome
copy source unknown All rights reserved This content is excluded from our Creative
Commons license For more information see httpocw miteduhelpfaq-fair-use
bull High concentration of loci in MHC high overlapbull Yet many distinct regions 1000s of distinct loci 86
Implications for genetic predisposition polygenic models for risk prediction
87
1
Basic setup of polygenic risk prediction studies Case-control cohort w genotype + phenotype
Training cohort Testing cohort
Selection of SNPs Estimation of effects Ranking
Apply predictor Evaluate accuracy
Apply predictor w estimated confidence
Target cohort genotyped individuals
(no phenotypes)
1
(power matters) (power matters) (power limited to one individual at a time)
2
bull Applications 1 (testing cohort) ndash Understand total heritability captured in common variants
ndash Understand disease ldquoarchitecturerdquo number of SNPs ndash Recognize functional classes associated with weak genetic associations
bull Applications 2 2 (new individuals) ndash Provide health recommendations at the individual level
ndash Prioritize high-risk individuals for subsequent testing at population level 88
How many SNPs to include in model
scor
ec
nige
ly p
ohe
of t
ue
-val
Pct
ed
peex
Dudridge PLoS Genetics 2013 pi0Proportion of markers with no effect Purcell Nature 2009
Schizophrenia risk prediction
lsquoonly 5 matterrsquo
lsquoonly 10 matterrsquo(but still canrsquot tellWhich ones until lsquoall matterrsquo Full rank list)
inclusion threshold copy source unknown All rights reserved This content is excluded from our CreativeCommons license For more information see httpocwmiteduhelpfaq-fair-use
bull It depends on ndash Architecture Fraction of SNPs that are estimated to be functional ndash Power Number of individuals in cohort ie ability to rank correctly It only peaks at 5 (asymp1-pi0) when sufficient power to rank ndash Large fraction of associated markers are hidden within non-significant SNPs
bull
bull For pi0=090 still need to include all SNPs to maximize predictive power 89
Application to pleiotropy and common risk Trait 1 (schizophrenia) Case-control cohort w genotype + phenotype
Selection of SNPs Estimation of effects Ranking
Apply predictor Evaluate accuracy
Trait 2 (bipolar disorder) Case-control cohort w genotype + phenotype
bull Ability to assess common genetic risk Are the highly-ranked SNPs for one study relevant to a different study
Is there a shared genetic architecture between seemingly unrelated traits
irst use showed schizophrenia and bipolar disorder common risk Schizophrenia-ranked SNPs in one cohortlt
lt are predictive of bipolar disorder diagnosis lt but not predictive of unrelated (cardiovascular) traits
ndashndash
bull Fndashndashndash
90
Important pointscaveats for risk prediction bull Always limited by genetic component
ndash Environment random effects play big role for most traits
bull Mendelian=deterministic vs common variants=probic
ndash Only a first screen for individuals at risk
bull Limited by discovery power
ndash Cohort size limits discriminative power and ranking ability
bull Limited by genotyped SNPvs vs all SNPs
ndash Selection pushes fitness-reducing variants to lower freq
ndash Genotyped SNPs selected to be common
bull Even if SNPs are correctly id entified their effects are not
ndash Winnerrsquos curse over-estimate above-threshold true effect
bull Training and testing cohort non-independence
ndash Relatives cryptic relatedness population stratification inflate est 91
91
Goal Personalized and Predictive Medicine 1 Intro to Epidemiology basis of human disease 2 Genetic Epidemiology
ndash Genetic basis GWAS and screening ndash Interpreting GWAS with functional genomics ndash Calculating functional enrichments for GWAS loci
3 Molecular epidemiology ndash meQTLs Genotype-Epigenome association (cis-trans-) ndash EWAS Epigenome-Disease association
4 Resolving Causality ndash Statistical Mendelian Randomization ndash Application to genotype + methylation in AD
5 Systems Genomics and Epigenomics of disease ndash Beyond single loci polygenic risk prediction models ndash Sub-threshold loci and somatic heterogeneity in cancer
92
This talk From loci to mechanisms
Building a reference map of the regulatory genome Enhancers Promoters Transcribed Repressed
Regions Enhancers promoters transcribed repressed Cell types Predict tissues and cell types of epigenomic act ivity Target genes Link variants to their target genes using eQTLs activity Hi-C Nucleotides Regulatory consequence of mutation Conservation PWMs Regulators Upstream regulators whose activity is disrupted by mutation
Application to GWAS hidden heritability and Cancer GWAS CATGCCTG bull 93 top hits non-coding Mechanism Cell type hits CGTGTCTA bull Lie in haplotype blocks Causal variant(s)
lsquoHiddenrsquo CATGCCTG bull Many variants small effects Pathway-level burdenload heritability CGTGTCTA bull Many false positives Prioritize w regulatory annotations
Cancer bull s of function CATGCCTG Los Protein-coding variants convergence mutations CATCCCTG bull Gain of function Regulatory variants heterogeneity
93
Characterizing sub-threshold variants in heart arrhythmia
copy source unknown All rights reservedThiscontent is excluded from our Creative
Commons license For more information see
httpocwmiteduhelpfaq-fair-use
Focus on sub-threshold variants
(eg rs1743292 P=10-42)
Trait QRSQT interval
(1) Large cohorts (2) many known hits (3) well-characterized tissue drivers 94
From Arking D E Pulit S L Crotti L Harst P V Munroe P BKoopmann T T Newton-Cheh C (2014) Genetic associationstudy of QT interval highlights role for calcium myocardial repolarizationNature Genetics Nat Genet 46(8) 826-836 Used with permission
Enhancers overlapping GWAS loci share functional properties
copy source unknown All rights reserved This content is excluded from our CreativeCommons license For more information see httpocwmiteduhelpfaq-fair-use
Train machine learning model to prioritize sub-threshold loci 95
Functional evidence for sub-threshold target genes
Zebrafish phenotypes Human genetics
copy source unknown All rights reserved This content is excluded from our CreativeCommons license For more information see httpocwmiteduhelpfaq-fair-use
Mouse phenotypes 96
Experimental validation of 11 sub-threshold loci
copy source unknown All rights reserved This content is excluded from our CreativeCommons license For more information see httpocwmiteduhelpfaq-fair-use
9 of 11 tested loci show allelic activity chromatin interactions
97
Functional evidence for rs1743292 causality (P=10-42)
Enhancer 4C links to target gene promoters Heart enhancer activity
Motif disruption Allelic DNase in multiple individuals copy source unknown All rights reserved This content is excluded from our CreativeCommons license For more information see httpocwmiteduhelpfaq-fair-use Allelic enha-
ncer activity 98
Target gene impact on heart conduction
Optical voltage mapping
zebrafish embryo hearts voltage-sensitive fluorescent dye
ventricle
atrium
transmembrane voltage (ventricle)
copy source unknown All rights reserved This content is excludedfrom our Creative Commons license For more information seehttpocwmiteduhelpfaq-fair-use
Detection and validation of a new cardiac locus
99
What would we need to discover rs1743292 without epigenomics
rs1743292 Minor allele frequency 0134
Effect size -05773 +- 017 msec With 68900 individuals 128 power to discover at plt5x10-8
bull rs1743292 has similar effect sizes as many genome-wide significant variants
bull Many GWAS variants discovered due to winnerrsquos curse often only have 5-
20 power to discover
bull Combining epigenomics and GWAS can
1 Confirm existing GWAS loci are real
2 Discover new sub-threshold loci with weak effect sizes low power
To reach 80 power to discover rs1743292 at plt5x10-8 we need 146700 individuals
100
Goal Personalized and Predictive Medicine 1 Intro to Epidemiology basis of human disease
enetic Epidemiology Genetic basis GWAS and screening Interpreting GWAS with functional genomics Calculating functional enrichments for GWAS loci
olecular epidemiology meQTLs Genotype-Epigenome association (cis-trans-) EWAS Epigenome-Disease association
esolving Causality Statistical Mendelian Randomization Application to genotype + methylation in AD
ystems Genomics and Epigenomics of disease Beyond single loci polygenic risk prediction models Sub-threshold loci and somatic heterogeneity in cancer
2 Gndash ndash ndash
3 Mndash ndash
4 Rndash ndash
5 Sndash ndash
101
This talk From loci to mechanisms
Building a reference map of the regulatory genome Enhancers Promoters Transcribed Repressed
Regions Enhancers promoters transcribed repressed Cell types Predict tissues and cell types of epigenomic act ivity Target genes Link variants to their target genes using eQTLs activity Hi-C Nucleotides Regulatory consequence of mutation Conservation PWMs Regulators Upstream regulators whose activity is disrupted by mutation
Application to GWAS hidden heritability and Cancer GWAS CATGCCTG bull 93 top hits non-coding Mechanism Cell type hits CGTGTCTA bull Lie in haplotype blocks Causal variant(s)
lsquoHiddenrsquo CATGCCTG bull Many variants small effects Pathway-level burdenload heritability CGTGTCTA bull Many false positives Prioritize w regulatory annotations
Cancer function CATGCCTG bull Loss of Protein-coding variants convergence mutations CATCCCTG bull Gain of function Regulatory variants heterogeneity
102
Regulatory convergence of dispersed driver mutations
copy source unknown All rights reserved This content is excluded from our CreativeCommons license For more information see httpocwmiteduhelpfaq-fair-use
Common mutations in regulatory plexus of each gene Richard Sallari 103
Cancer genes are more likely to be up-regulated
copy source unknown All rights reserved This content is excluded from our CreativeCommons license For more information see httpocwmiteduhelpfaq-fair-use
Richard Sallari 104
Dysregulated genes show dispersed non-coding mutations
copy source unknown All rights reserved This content is excluded from our CreativeCommons license For more information see httpocwmiteduhelpfaq-fair-use
Dysregulated genes are enriched for plexus mutations at all distances Richard Sallari 105
Non-coding mutations enriched in promoters enhancers active in other cell types
copy source unknown All rights reserved This content is excluded from our CreativeCommons license For more information see httpocwmiteduhelpfaq-fair-use
Disruptive mutations in lsquolowrsquo elements are enriched in enhancers and promoters in other tissues
Richard Sallari 106
Statistical model for excess of raresomatic variants
copy source unknown All rights reserved This content is excluded from our CreativeCommons license For more information see httpocwmiteduhelpfaq-fair-use
bullCorrect for region- state- tumor-specific rate variation 107
Convergence in immune signaling mitoch functions
copy source unknown All rights reserved This content is excluded from our CreativeCommons license For more information see httpocwmiteduhelpfaq-fair-use
bullPathway-level convergence hierarchical model 108
Richard Sallari
Non-coding drivers of prostate cancer dysregulation
Regulatory mutations reveal Convergence in immune signaling new cancer driver genes
mitochondrial functions
copy source unknown All rights reserved This content is excluded from our CreativeCommons license For more information see httpocwmiteduhelpfaq-fair-use
Convergence in inositol phosphate metabolism PLCB4 overexpression in PC3 prostate cancer adjacent to PTEN PIK3CA known cancer genes reduces ErkAkt activity synergistic with PTEN
109
Personal genomics tomorrow Already 100000s of complete genomes
bull Health disease quantitative traits ndash Genomics regions disease mechanism drug targets ndash Protein-coding cracking regulatory code variation ndash Single genes systems gene interactions pathways
bull Human ancestry ndash Resolve all of human ancestral relationships ndash Complete history of all migrations selective events ndash Resolve common inheritance vs trait association
bull Whatrsquos missing is the computation ndash New algorithms machine learning dimensionality reduction ndash Individualized treatment from 1000s genes genome ndash Understand missing heritability ndash Reveal co-evolution between geneselements ndash Correct for modulating effects in GWAS
110
Challenge ahead From research to clinic 1 Systematic medical genotyping sequencing
ndash Currently a curiosity future medical practice
2 Systematic medical molecular profiling
ndash Functional genomics in relevant cell types
3 Systematic perturbation studies for validation
ndash 1000s of regulatory predictions x 100s cell types
4 Systematic repurposing of approved drugs
ndash Systems-biology view of drug response
5 Genomics of drug response in cli nical trials
ndash Personalized drug prescription and combinations
6 Partnerships academia industry hospitals
ndash Interdisciplinary training in each of the instituttions 111
Summary Personalized amp Predictive Medicine 1 Intro to Epidemiology basis of human disease 2 Genetic Epidemiology
ndash Genetic basis GWAS and screening ndash Interpreting GWAS with functional genomics ndash Calculating functional enrichments for GWAS loci
3 Molecular epidemiology ndash meQTLs Genotype-Epigenome association (cis-trans-) ndash EWAS Epigenome-Disease association
4 Resolving Causality ndash Statistical Mendelian Randomization ndash Application to genotype + methylation in AD
5 Systems Genomics and Epigenomics of disease ndash Beyond single loci polygenic risk prediction models ndash Sub-threshold loci and somatic heterogeneity in cancer
112
MIT OpenCourseWarehttpocwmitedu
6047 6878 HST507 Computational BiologyFall 2015
For information about citing these materials or our Terms of Use visit httpocwmiteduterms

eWAS
Methylation
n n
10 Phenotype
e= (Disease)
=45
00
00
m
Link methylationphenotype (~cis-eQTLs) linear models and hypothesis testing Predict phenotype using methylation
bullbull
LM1 pi
LM2 p = β0 + β1(m ) + ε = β0 + ε
i j
56
eWAS n n
Methylation
m=4
50
00
0
Phenotype (Disease) p
=1
0
n
ldquoEnvironmentrdquo e=
15
LM1 AD = β0 + β2(gender) + ε LM2 AD = β0 + β1(mj) + β2(gender) ε
Link methylationphenotype (~cis-eQTLs) bull linear models and hypothesis testing bull Predict phenotype using methylation
Problem variance due to phenotype probably very small (unless your phenotype is cancer) Needle in a haystack Control for other sources of variance to make the variance due to the phenotype stand out If phenotype is lzheimerrsquos (D) gender incorporates more variance into your M matrix than does AD
57
eWAS
Methylation
Phenotype (Disease)
n n
m=4
50
00
0
p=
10
ldquoEnvironmentrdquo
n
e=1
5
Might have many environmental variables to control for
LM1 AD = β0 + β2(gender) + β3(age) + β4(education) + lt + ε LM2 AD = β0 + β1(mj) + β2(gender) + β3(age) + β4(education) + lt + ε
58
eWAS Need to account for variance due to genotype as well
Methylation
Phenotype (Disease)
n n
m=4
50
00
0
p=
10
ldquoEnvironmentrdquo
n
e=1
5
Genotype
n
g=1
20
00
00
0
59
Role of enhancers vs promoters in lzheimerrsquos disease association
60
Enhancers are hemi-methylated and highly variable
Enhancers show most variable methylation
Promoters show least variable methylation
copy source unknown All rights reserved This content is excluded from our Creative
Commons license For more information see httpocwmiteduhelpfaq-fair-use
bull Highly distinct signatures for promoters vs enhancers
bull Enhancers hemi-methylated Methylation level Methylation level in each person (not bimodal)
61
SNP-associated CpGs in enhancers not promoters
bull Promoter methylation less affected by genetics bull Enhancer methylation highly genotype-driven
TSS flanking Enhancers Repressed
Enric
hmen
t for
meQ
TLs
12
5 Transcribed
Promoters
TxEnh
bull TSS-flanking and repressed regions also genetic62
AD-associated probes in distal enhancers Pe
r st
ate
(O
bs ndash
Exp
)
Tota
l
Enhancers
Promoters
copy source unknown All ri ghts reserved This content is excluded from our Creative
Commons license For more information see httpocwmiteduhelpfaq-fair-use
bull After cleaning with known and inferred covariates
bull Distal and transcribed enhancers enriched
Proximal regulators (promoters) depleted 63
bull 63
ICA covariate correction cleans up enhancer signal
Before
Orange Enrichment of enhancer probes for association with the real phenotype
Grey Enrichment of enhancer probes for a scrambled phenotype
After (After conditioning on 7 surrogate variables discovered with ICA)
Empirical p=006
Empirical plt0001
copy source unknown All rights reserved This content is excluded from our Creative
Commons license For more information see httpocwmiteduhelpfaq-fair-use 64
AD predictive power highest in enhancers
AP
OE
enhancers
methylome
promoters
All SNPs
Top predictive features are bullEnhancer
ethylation
ll me thyl
SS Het
enetics incl APOE)
ausality
ommon athways
m
bull A
bull T
bullG(
bull C
bullCp
copy source unknown All rights reserved This content is excluded from our Creative
Commons license For more information see httpocwmiteduhelpfaq-fair-use65
NRSF
ELK1
All probes ranked by AD assoc P-value
Nonminussignificant pathways Significant pathways
060
065
070
075
AUC using pathway feature selection p= 1922eminus11
AD prediction reveals likely biological pathways
All probes ranked by AD assoc P-value
CTCF
copy source unknown All rights reserved This content is excluded from our Creative
Commons license For more information see httpocwmiteduhelpfaq-fair-use
Enriched regulatory motifs
suggest potential pathway s
HEBTcf12 proliferating neural and progenitor cells
GATA cell growth blood cell development
66TLX1NFIC Neuronal cell fates Mouse AD models 66
Goal Personalized and Predictive Medicine 1 Intro to Epidemiology basis of human disease 2 Genetic Epidemiology
ndash Genetic basis GWAS and screening ndash Interpreting GWAS with functional genomics ndash Calculating functional enrichments for GWAS loci
3 Molecular epidemiology ndash meQTLs Genotype-Epigenome association (cis-trans-) ndash EWAS Epigenome-Disease association
4 Resolving Causality ndash Statistical Mendelian Randomization ndash Application to genotype + methylation in AD
5 Systems Genomics and Epigenomics of disease ndash Beyond single loci polygenic risk prediction models ndash Sub-threshold loci and somatic heterogeneity in cancer
67
67
ins
C E confounders environment
Risk factor causality w instrumental variables If XY are correlated possible scenarios are bull XY bull causes X Y
G Y bull XU Y Xtrument
risk factor outcome To distinguish need effects controlled random experiment
Is risk factor X causing disease Y (or a consequence)
ndash Eg alcohol addiction smoking blood cholesterol fever stress Randomized experiment with and without X feasibility ethics
G randomized experiment (eg random Mendelian inheritance) as only some subjects have genotype
G (iv)must be correlated with Y but only through X ie if X known G gives no additional information about Y
68
bull
bull
bull
68
In silico thought experiment
0 200 400 600 80000
02
04
06
08
10
p=2946466eminus35noi
atylh
etM
Subjects
ADnonAD
0 200 400 600 80000
02
04
06
08
10
p=3847832eminus05
noiat
ylhet
M
Subjects
ADnonAD
Same effect due to Alz but with larger effect due to genotype
CC
Small but significant effect due to Alz
CA
copy source unknown All rights reserved This content is excluded from our Creative
Commons license For more information see httpocwmiteduhelpfaq-fair-use
Hemi-methylation associated with meQTL yields a p-value thatrsquos 30 orders of magnitude lower for the AD phenotype
69
MGE P+ + = GE P+ =
From G include probe-specific terms for cis-meQTLs as well as including trans-meQTLs in all comparisons
VS
Mendelian randomization approach Account for variance due to genotype how much does methylation add
With variability due to genotype and environmental covariates removed the effect due to phenotype should become more prevalent
70
Causality testing
71
Modeling complex Human diseases bull Three possible models
1 Independent Associations
D
MG X
2 Causal Pathway Model
3 Interaction Model
D
G
M
Genotype
DG M
D
MG
72
Methylation
Disease
(1) Independent Associations
D
MG X
bull Association between Factor A and Disease bull Association between Factor B and Disease bull No association between Factor A and Factor B
G Factor A
bull Example 2 independent risk genes X Factor B
Y Disease D 73
(2) Causal Pathway Models
bull Is the a direct link between risk factor (A) and disease (D)
DA
bull Does the risk factorrsquos () effect on disease (D) depend on an intermediate step (B)
DA B
bull To test ndash A is associated with B and D ndash B is associated with D ndash A is not associated with D when controlling for
ndash Note A MUST come before B temporally
B
D
G
X
Factor A
Factor B
Disease D 74
(2) Causal Pathway Models
bull In reality its a little of both rsquos affect on D is partially mediated through B
A DB
bull To test ndash A is associated with B and D ndash B is associated with D ndash The effect size of A on D is decreased when con
ndash Note A MUST come before B temporally
bull Example CR1 effect on cognitive decline
trolling for B
A Factor A Factor B Disease D D
B
75
(3) Interaction Models
bull Factor Brsquos effect on D is different depending on value for factor
B (A = Aa)
B (A = AA)
D
B (A = aa)
bull To test ndash A + B + AB D if estimate for AB is significant then ndash Stratify by levels of A
bull Example
ndash drugrsquos effect is different depending on genotype ndash More to comelt
76
Gene locus reference Published
AD AD NP
BIN1
CD2AP
CD33
rs744373
rs9349407
rs3865444
Seshadri 2010
Naj 2011Hollingsworth 2011
Naj 2011Hollingsworth 2012
16x10-11
86x10-9
16x10-9
0204
0445
0133
0480
0221
0123
ABCA7 rs3764650 Hollingsworth 2010 50x10-21 0747 0187 APOE Any ε4 12x10-13 18x10-23
CLU rs11136000 Lambert 2009Harold 2009 75x10-9 0762 0649 CR1 rs6656401 Lambert 2009 37x10-9 00009 0057
EPHA1 rs11767557 Naj 2011Hollingsworth 2011 60x10-10 0562 0391 MS4A4A rs4938933 Naj 2011 17x10-9 0792 0567 MS4A6A rs610932 Hollingsworth 2010 12x10-16 0534 0820
MTHFD1L rs11754661 Naj 2010 19x10-10 0126 0934 PICALM rs3851179 Harold 2009 19x10-8 0382 0171
Application to 12 AD GWAS loci
77
Tangles
CR1 Causal pathway model
Risk Factors Pathology Clinical Disease
Alzheimerrsquos disease
Genetic CR1
Cognitive Decline
AD specific Neuritic Plaque Neurofibulary
bull CR1 first associated with AD in 2009 bull Original associated variant is in an intron no clear function bull Unclear how CR1 locus influences AD susceptibility mechanistically
bull
Questions ndash Is the effect only on AD ndash Is there a broader effect on cognitive decline ndash Is there an association with AD pathology ndash Does it go through pathology to have an effect of cognitive decline
78
CR1 (rs6656401)
CR1 Pathology
04
045
05
055
06
065
07
075
08
085
Neuritic Plaque Neurofibillary Tangles
TT ATAA (risk allele)
CR1 Global Cognitive Decline
p=00008
p=0008 p=010
Pathology Global Cognitive Decline p lt 00001 time
79
Matt Eaton Phil De Jager
Epigenome
Genetic + Epigenetic variation in lzheimerrsquos
Relate to genotype and AD variation 723 AD patients amp controls Methylation variation in
Genome
meQTL
Phenotype
Classification Epigenome MWAS
1 2
copy source unknown All rights reserved This content isexcluded from our Creative Commons license For moreinformation see httpocwmiteduhelpfaq-fair-use
Methylation gtgt SNPs Estimate causal M roles regression Enhancers gtgt promoters of meQTL effects reduces MD
copy source unknown All rights reserved This content is excluded
from our Creative Commons license For more information see
httpocwmiteduhelpfaq-fair-use 80
Goal Personalized and Predictive Medicine 1 Intro to Epidemiology basis of human disease 2 Genetic Epidemiology
ndash Genetic basis GWAS and screening ndash Interpreting GWAS with functional genomics ndash Calculating functional enrichments for GWAS loci
3 Molecular epidemiology ndash meQTLs Genotype-Epigenome association (cis-trans-) ndash EWAS Epigenome-Disease association
4 Resolving Causality ndash Statistical Mendelian Randomization ndash Application to genotype + methylation in AD
5 Systems Genomics and Epigenomics of disease ndash Beyond single loci polygenic risk prediction models ndash Sub-threshold loci and somatic heterogeneity in cancer
81
Beyond top-scoring hits 1000s of variants of weak effect
cluster in cell type specific enhancers
82
Rank-based functional testing of weak associations
Enrichment peaks at 10000s of SNPs down the rank list even after LD pruning
copy source unknown All rights reserved This content is excluded from our Creative
Commons license For more information see httpocwmiteduhelpfaq-fair-use
bull Rank all SNPs based on GWAS signal strength bull Functional enrichment for cell types and states 83
Weak-effect T1D hits in 50k T-cell enhancers enhancers
CD4+ T-cells
T-cells B-cells
Other cell types
copy source unknown All rights reserved This content is excluded from our Creative
Commons license For more information see httpocwmiteduhelpfaq-fair-use
bull LD-pruning (CEU r2gt2) 50k 41k independ loci 84
Cell type specificity stronger for enhancers enhancers promoters
transcribed
CD4+ T-cells
T-cells B-cells
Other cell types
copy source unknown All rights reserved This content is excluded from our Creative
Commons license For more information see httpocwmiteduhelpfaq-fair-use
bull TB-cells also enriched for promoters transcribed bull Enhancer enrichment much more cell type specific 85
T1DRA-enriched enhancers spread across genome
copy source unknown All rights reserved This content is excluded from our Creative
Commons license For more information see httpocw miteduhelpfaq-fair-use
bull High concentration of loci in MHC high overlapbull Yet many distinct regions 1000s of distinct loci 86
Implications for genetic predisposition polygenic models for risk prediction
87
1
Basic setup of polygenic risk prediction studies Case-control cohort w genotype + phenotype
Training cohort Testing cohort
Selection of SNPs Estimation of effects Ranking
Apply predictor Evaluate accuracy
Apply predictor w estimated confidence
Target cohort genotyped individuals
(no phenotypes)
1
(power matters) (power matters) (power limited to one individual at a time)
2
bull Applications 1 (testing cohort) ndash Understand total heritability captured in common variants
ndash Understand disease ldquoarchitecturerdquo number of SNPs ndash Recognize functional classes associated with weak genetic associations
bull Applications 2 2 (new individuals) ndash Provide health recommendations at the individual level
ndash Prioritize high-risk individuals for subsequent testing at population level 88
How many SNPs to include in model
scor
ec
nige
ly p
ohe
of t
ue
-val
Pct
ed
peex
Dudridge PLoS Genetics 2013 pi0Proportion of markers with no effect Purcell Nature 2009
Schizophrenia risk prediction
lsquoonly 5 matterrsquo
lsquoonly 10 matterrsquo(but still canrsquot tellWhich ones until lsquoall matterrsquo Full rank list)
inclusion threshold copy source unknown All rights reserved This content is excluded from our CreativeCommons license For more information see httpocwmiteduhelpfaq-fair-use
bull It depends on ndash Architecture Fraction of SNPs that are estimated to be functional ndash Power Number of individuals in cohort ie ability to rank correctly It only peaks at 5 (asymp1-pi0) when sufficient power to rank ndash Large fraction of associated markers are hidden within non-significant SNPs
bull
bull For pi0=090 still need to include all SNPs to maximize predictive power 89
Application to pleiotropy and common risk Trait 1 (schizophrenia) Case-control cohort w genotype + phenotype
Selection of SNPs Estimation of effects Ranking
Apply predictor Evaluate accuracy
Trait 2 (bipolar disorder) Case-control cohort w genotype + phenotype
bull Ability to assess common genetic risk Are the highly-ranked SNPs for one study relevant to a different study
Is there a shared genetic architecture between seemingly unrelated traits
irst use showed schizophrenia and bipolar disorder common risk Schizophrenia-ranked SNPs in one cohortlt
lt are predictive of bipolar disorder diagnosis lt but not predictive of unrelated (cardiovascular) traits
ndashndash
bull Fndashndashndash
90
Important pointscaveats for risk prediction bull Always limited by genetic component
ndash Environment random effects play big role for most traits
bull Mendelian=deterministic vs common variants=probic
ndash Only a first screen for individuals at risk
bull Limited by discovery power
ndash Cohort size limits discriminative power and ranking ability
bull Limited by genotyped SNPvs vs all SNPs
ndash Selection pushes fitness-reducing variants to lower freq
ndash Genotyped SNPs selected to be common
bull Even if SNPs are correctly id entified their effects are not
ndash Winnerrsquos curse over-estimate above-threshold true effect
bull Training and testing cohort non-independence
ndash Relatives cryptic relatedness population stratification inflate est 91
91
Goal Personalized and Predictive Medicine 1 Intro to Epidemiology basis of human disease 2 Genetic Epidemiology
ndash Genetic basis GWAS and screening ndash Interpreting GWAS with functional genomics ndash Calculating functional enrichments for GWAS loci
3 Molecular epidemiology ndash meQTLs Genotype-Epigenome association (cis-trans-) ndash EWAS Epigenome-Disease association
4 Resolving Causality ndash Statistical Mendelian Randomization ndash Application to genotype + methylation in AD
5 Systems Genomics and Epigenomics of disease ndash Beyond single loci polygenic risk prediction models ndash Sub-threshold loci and somatic heterogeneity in cancer
92
This talk From loci to mechanisms
Building a reference map of the regulatory genome Enhancers Promoters Transcribed Repressed
Regions Enhancers promoters transcribed repressed Cell types Predict tissues and cell types of epigenomic act ivity Target genes Link variants to their target genes using eQTLs activity Hi-C Nucleotides Regulatory consequence of mutation Conservation PWMs Regulators Upstream regulators whose activity is disrupted by mutation
Application to GWAS hidden heritability and Cancer GWAS CATGCCTG bull 93 top hits non-coding Mechanism Cell type hits CGTGTCTA bull Lie in haplotype blocks Causal variant(s)
lsquoHiddenrsquo CATGCCTG bull Many variants small effects Pathway-level burdenload heritability CGTGTCTA bull Many false positives Prioritize w regulatory annotations
Cancer bull s of function CATGCCTG Los Protein-coding variants convergence mutations CATCCCTG bull Gain of function Regulatory variants heterogeneity
93
Characterizing sub-threshold variants in heart arrhythmia
copy source unknown All rights reservedThiscontent is excluded from our Creative
Commons license For more information see
httpocwmiteduhelpfaq-fair-use
Focus on sub-threshold variants
(eg rs1743292 P=10-42)
Trait QRSQT interval
(1) Large cohorts (2) many known hits (3) well-characterized tissue drivers 94
From Arking D E Pulit S L Crotti L Harst P V Munroe P BKoopmann T T Newton-Cheh C (2014) Genetic associationstudy of QT interval highlights role for calcium myocardial repolarizationNature Genetics Nat Genet 46(8) 826-836 Used with permission
Enhancers overlapping GWAS loci share functional properties
copy source unknown All rights reserved This content is excluded from our CreativeCommons license For more information see httpocwmiteduhelpfaq-fair-use
Train machine learning model to prioritize sub-threshold loci 95
Functional evidence for sub-threshold target genes
Zebrafish phenotypes Human genetics
copy source unknown All rights reserved This content is excluded from our CreativeCommons license For more information see httpocwmiteduhelpfaq-fair-use
Mouse phenotypes 96
Experimental validation of 11 sub-threshold loci
copy source unknown All rights reserved This content is excluded from our CreativeCommons license For more information see httpocwmiteduhelpfaq-fair-use
9 of 11 tested loci show allelic activity chromatin interactions
97
Functional evidence for rs1743292 causality (P=10-42)
Enhancer 4C links to target gene promoters Heart enhancer activity
Motif disruption Allelic DNase in multiple individuals copy source unknown All rights reserved This content is excluded from our CreativeCommons license For more information see httpocwmiteduhelpfaq-fair-use Allelic enha-
ncer activity 98
Target gene impact on heart conduction
Optical voltage mapping
zebrafish embryo hearts voltage-sensitive fluorescent dye
ventricle
atrium
transmembrane voltage (ventricle)
copy source unknown All rights reserved This content is excludedfrom our Creative Commons license For more information seehttpocwmiteduhelpfaq-fair-use
Detection and validation of a new cardiac locus
99
What would we need to discover rs1743292 without epigenomics
rs1743292 Minor allele frequency 0134
Effect size -05773 +- 017 msec With 68900 individuals 128 power to discover at plt5x10-8
bull rs1743292 has similar effect sizes as many genome-wide significant variants
bull Many GWAS variants discovered due to winnerrsquos curse often only have 5-
20 power to discover
bull Combining epigenomics and GWAS can
1 Confirm existing GWAS loci are real
2 Discover new sub-threshold loci with weak effect sizes low power
To reach 80 power to discover rs1743292 at plt5x10-8 we need 146700 individuals
100
Goal Personalized and Predictive Medicine 1 Intro to Epidemiology basis of human disease
enetic Epidemiology Genetic basis GWAS and screening Interpreting GWAS with functional genomics Calculating functional enrichments for GWAS loci
olecular epidemiology meQTLs Genotype-Epigenome association (cis-trans-) EWAS Epigenome-Disease association
esolving Causality Statistical Mendelian Randomization Application to genotype + methylation in AD
ystems Genomics and Epigenomics of disease Beyond single loci polygenic risk prediction models Sub-threshold loci and somatic heterogeneity in cancer
2 Gndash ndash ndash
3 Mndash ndash
4 Rndash ndash
5 Sndash ndash
101
This talk From loci to mechanisms
Building a reference map of the regulatory genome Enhancers Promoters Transcribed Repressed
Regions Enhancers promoters transcribed repressed Cell types Predict tissues and cell types of epigenomic act ivity Target genes Link variants to their target genes using eQTLs activity Hi-C Nucleotides Regulatory consequence of mutation Conservation PWMs Regulators Upstream regulators whose activity is disrupted by mutation
Application to GWAS hidden heritability and Cancer GWAS CATGCCTG bull 93 top hits non-coding Mechanism Cell type hits CGTGTCTA bull Lie in haplotype blocks Causal variant(s)
lsquoHiddenrsquo CATGCCTG bull Many variants small effects Pathway-level burdenload heritability CGTGTCTA bull Many false positives Prioritize w regulatory annotations
Cancer function CATGCCTG bull Loss of Protein-coding variants convergence mutations CATCCCTG bull Gain of function Regulatory variants heterogeneity
102
Regulatory convergence of dispersed driver mutations
copy source unknown All rights reserved This content is excluded from our CreativeCommons license For more information see httpocwmiteduhelpfaq-fair-use
Common mutations in regulatory plexus of each gene Richard Sallari 103
Cancer genes are more likely to be up-regulated
copy source unknown All rights reserved This content is excluded from our CreativeCommons license For more information see httpocwmiteduhelpfaq-fair-use
Richard Sallari 104
Dysregulated genes show dispersed non-coding mutations
copy source unknown All rights reserved This content is excluded from our CreativeCommons license For more information see httpocwmiteduhelpfaq-fair-use
Dysregulated genes are enriched for plexus mutations at all distances Richard Sallari 105
Non-coding mutations enriched in promoters enhancers active in other cell types
copy source unknown All rights reserved This content is excluded from our CreativeCommons license For more information see httpocwmiteduhelpfaq-fair-use
Disruptive mutations in lsquolowrsquo elements are enriched in enhancers and promoters in other tissues
Richard Sallari 106
Statistical model for excess of raresomatic variants
copy source unknown All rights reserved This content is excluded from our CreativeCommons license For more information see httpocwmiteduhelpfaq-fair-use
bullCorrect for region- state- tumor-specific rate variation 107
Convergence in immune signaling mitoch functions
copy source unknown All rights reserved This content is excluded from our CreativeCommons license For more information see httpocwmiteduhelpfaq-fair-use
bullPathway-level convergence hierarchical model 108
Richard Sallari
Non-coding drivers of prostate cancer dysregulation
Regulatory mutations reveal Convergence in immune signaling new cancer driver genes
mitochondrial functions
copy source unknown All rights reserved This content is excluded from our CreativeCommons license For more information see httpocwmiteduhelpfaq-fair-use
Convergence in inositol phosphate metabolism PLCB4 overexpression in PC3 prostate cancer adjacent to PTEN PIK3CA known cancer genes reduces ErkAkt activity synergistic with PTEN
109
Personal genomics tomorrow Already 100000s of complete genomes
bull Health disease quantitative traits ndash Genomics regions disease mechanism drug targets ndash Protein-coding cracking regulatory code variation ndash Single genes systems gene interactions pathways
bull Human ancestry ndash Resolve all of human ancestral relationships ndash Complete history of all migrations selective events ndash Resolve common inheritance vs trait association
bull Whatrsquos missing is the computation ndash New algorithms machine learning dimensionality reduction ndash Individualized treatment from 1000s genes genome ndash Understand missing heritability ndash Reveal co-evolution between geneselements ndash Correct for modulating effects in GWAS
110
Challenge ahead From research to clinic 1 Systematic medical genotyping sequencing
ndash Currently a curiosity future medical practice
2 Systematic medical molecular profiling
ndash Functional genomics in relevant cell types
3 Systematic perturbation studies for validation
ndash 1000s of regulatory predictions x 100s cell types
4 Systematic repurposing of approved drugs
ndash Systems-biology view of drug response
5 Genomics of drug response in cli nical trials
ndash Personalized drug prescription and combinations
6 Partnerships academia industry hospitals
ndash Interdisciplinary training in each of the instituttions 111
Summary Personalized amp Predictive Medicine 1 Intro to Epidemiology basis of human disease 2 Genetic Epidemiology
ndash Genetic basis GWAS and screening ndash Interpreting GWAS with functional genomics ndash Calculating functional enrichments for GWAS loci
3 Molecular epidemiology ndash meQTLs Genotype-Epigenome association (cis-trans-) ndash EWAS Epigenome-Disease association
4 Resolving Causality ndash Statistical Mendelian Randomization ndash Application to genotype + methylation in AD
5 Systems Genomics and Epigenomics of disease ndash Beyond single loci polygenic risk prediction models ndash Sub-threshold loci and somatic heterogeneity in cancer
112
MIT OpenCourseWarehttpocwmitedu
6047 6878 HST507 Computational BiologyFall 2015
For information about citing these materials or our Terms of Use visit httpocwmiteduterms

Goal Personalized and Predictive Medicine 1 Intro to Epidemiology basis of human disease 2 Genetic Epidemiology
ndash Genetic basis GWAS and screening ndash Interpreting GWAS with functional genomics ndash Calculating functional enrichments for GWAS loci
3 Molecular epidemiology ndash meQTLs Genotype-Epigenome association (cis-trans-) ndash EWAS Epigenome-Disease association
4 Resolving Causality ndash Statistical Mendelian Randomization ndash Application to genotype + methylation in AD
5 Systems Genomics and Epigenomics of disease ndash Beyond single loci polygenic risk prediction models ndash Sub-threshold loci and somatic heterogeneity in cancer
67
67
ins
C E confounders environment
Risk factor causality w instrumental variables If XY are correlated possible scenarios are bull XY bull causes X Y
G Y bull XU Y Xtrument
risk factor outcome To distinguish need effects controlled random experiment
Is risk factor X causing disease Y (or a consequence)
ndash Eg alcohol addiction smoking blood cholesterol fever stress Randomized experiment with and without X feasibility ethics
G randomized experiment (eg random Mendelian inheritance) as only some subjects have genotype
G (iv)must be correlated with Y but only through X ie if X known G gives no additional information about Y
68
bull
bull
bull
68
In silico thought experiment
0 200 400 600 80000
02
04
06
08
10
p=2946466eminus35noi
atylh
etM
Subjects
ADnonAD
0 200 400 600 80000
02
04
06
08
10
p=3847832eminus05
noiat
ylhet
M
Subjects
ADnonAD
Same effect due to Alz but with larger effect due to genotype
CC
Small but significant effect due to Alz
CA
copy source unknown All rights reserved This content is excluded from our Creative
Commons license For more information see httpocwmiteduhelpfaq-fair-use
Hemi-methylation associated with meQTL yields a p-value thatrsquos 30 orders of magnitude lower for the AD phenotype
69
MGE P+ + = GE P+ =
From G include probe-specific terms for cis-meQTLs as well as including trans-meQTLs in all comparisons
VS
Mendelian randomization approach Account for variance due to genotype how much does methylation add
With variability due to genotype and environmental covariates removed the effect due to phenotype should become more prevalent
70
Causality testing
71
Modeling complex Human diseases bull Three possible models
1 Independent Associations
D
MG X
2 Causal Pathway Model
3 Interaction Model
D
G
M
Genotype
DG M
D
MG
72
Methylation
Disease
(1) Independent Associations
D
MG X
bull Association between Factor A and Disease bull Association between Factor B and Disease bull No association between Factor A and Factor B
G Factor A
bull Example 2 independent risk genes X Factor B
Y Disease D 73
(2) Causal Pathway Models
bull Is the a direct link between risk factor (A) and disease (D)
DA
bull Does the risk factorrsquos () effect on disease (D) depend on an intermediate step (B)
DA B
bull To test ndash A is associated with B and D ndash B is associated with D ndash A is not associated with D when controlling for
ndash Note A MUST come before B temporally
B
D
G
X
Factor A
Factor B
Disease D 74
(2) Causal Pathway Models
bull In reality its a little of both rsquos affect on D is partially mediated through B
A DB
bull To test ndash A is associated with B and D ndash B is associated with D ndash The effect size of A on D is decreased when con
ndash Note A MUST come before B temporally
bull Example CR1 effect on cognitive decline
trolling for B
A Factor A Factor B Disease D D
B
75
(3) Interaction Models
bull Factor Brsquos effect on D is different depending on value for factor
B (A = Aa)
B (A = AA)
D
B (A = aa)
bull To test ndash A + B + AB D if estimate for AB is significant then ndash Stratify by levels of A
bull Example
ndash drugrsquos effect is different depending on genotype ndash More to comelt
76
Gene locus reference Published
AD AD NP
BIN1
CD2AP
CD33
rs744373
rs9349407
rs3865444
Seshadri 2010
Naj 2011Hollingsworth 2011
Naj 2011Hollingsworth 2012
16x10-11
86x10-9
16x10-9
0204
0445
0133
0480
0221
0123
ABCA7 rs3764650 Hollingsworth 2010 50x10-21 0747 0187 APOE Any ε4 12x10-13 18x10-23
CLU rs11136000 Lambert 2009Harold 2009 75x10-9 0762 0649 CR1 rs6656401 Lambert 2009 37x10-9 00009 0057
EPHA1 rs11767557 Naj 2011Hollingsworth 2011 60x10-10 0562 0391 MS4A4A rs4938933 Naj 2011 17x10-9 0792 0567 MS4A6A rs610932 Hollingsworth 2010 12x10-16 0534 0820
MTHFD1L rs11754661 Naj 2010 19x10-10 0126 0934 PICALM rs3851179 Harold 2009 19x10-8 0382 0171
Application to 12 AD GWAS loci
77
Tangles
CR1 Causal pathway model
Risk Factors Pathology Clinical Disease
Alzheimerrsquos disease
Genetic CR1
Cognitive Decline
AD specific Neuritic Plaque Neurofibulary
bull CR1 first associated with AD in 2009 bull Original associated variant is in an intron no clear function bull Unclear how CR1 locus influences AD susceptibility mechanistically
bull
Questions ndash Is the effect only on AD ndash Is there a broader effect on cognitive decline ndash Is there an association with AD pathology ndash Does it go through pathology to have an effect of cognitive decline
78
CR1 (rs6656401)
CR1 Pathology
04
045
05
055
06
065
07
075
08
085
Neuritic Plaque Neurofibillary Tangles
TT ATAA (risk allele)
CR1 Global Cognitive Decline
p=00008
p=0008 p=010
Pathology Global Cognitive Decline p lt 00001 time
79
Matt Eaton Phil De Jager
Epigenome
Genetic + Epigenetic variation in lzheimerrsquos
Relate to genotype and AD variation 723 AD patients amp controls Methylation variation in
Genome
meQTL
Phenotype
Classification Epigenome MWAS
1 2
copy source unknown All rights reserved This content isexcluded from our Creative Commons license For moreinformation see httpocwmiteduhelpfaq-fair-use
Methylation gtgt SNPs Estimate causal M roles regression Enhancers gtgt promoters of meQTL effects reduces MD
copy source unknown All rights reserved This content is excluded
from our Creative Commons license For more information see
httpocwmiteduhelpfaq-fair-use 80
Goal Personalized and Predictive Medicine 1 Intro to Epidemiology basis of human disease 2 Genetic Epidemiology
ndash Genetic basis GWAS and screening ndash Interpreting GWAS with functional genomics ndash Calculating functional enrichments for GWAS loci
3 Molecular epidemiology ndash meQTLs Genotype-Epigenome association (cis-trans-) ndash EWAS Epigenome-Disease association
4 Resolving Causality ndash Statistical Mendelian Randomization ndash Application to genotype + methylation in AD
5 Systems Genomics and Epigenomics of disease ndash Beyond single loci polygenic risk prediction models ndash Sub-threshold loci and somatic heterogeneity in cancer
81
Beyond top-scoring hits 1000s of variants of weak effect
cluster in cell type specific enhancers
82
Rank-based functional testing of weak associations
Enrichment peaks at 10000s of SNPs down the rank list even after LD pruning
copy source unknown All rights reserved This content is excluded from our Creative
Commons license For more information see httpocwmiteduhelpfaq-fair-use
bull Rank all SNPs based on GWAS signal strength bull Functional enrichment for cell types and states 83
Weak-effect T1D hits in 50k T-cell enhancers enhancers
CD4+ T-cells
T-cells B-cells
Other cell types
copy source unknown All rights reserved This content is excluded from our Creative
Commons license For more information see httpocwmiteduhelpfaq-fair-use
bull LD-pruning (CEU r2gt2) 50k 41k independ loci 84
Cell type specificity stronger for enhancers enhancers promoters
transcribed
CD4+ T-cells
T-cells B-cells
Other cell types
copy source unknown All rights reserved This content is excluded from our Creative
Commons license For more information see httpocwmiteduhelpfaq-fair-use
bull TB-cells also enriched for promoters transcribed bull Enhancer enrichment much more cell type specific 85
T1DRA-enriched enhancers spread across genome
copy source unknown All rights reserved This content is excluded from our Creative
Commons license For more information see httpocw miteduhelpfaq-fair-use
bull High concentration of loci in MHC high overlapbull Yet many distinct regions 1000s of distinct loci 86
Implications for genetic predisposition polygenic models for risk prediction
87
1
Basic setup of polygenic risk prediction studies Case-control cohort w genotype + phenotype
Training cohort Testing cohort
Selection of SNPs Estimation of effects Ranking
Apply predictor Evaluate accuracy
Apply predictor w estimated confidence
Target cohort genotyped individuals
(no phenotypes)
1
(power matters) (power matters) (power limited to one individual at a time)
2
bull Applications 1 (testing cohort) ndash Understand total heritability captured in common variants
ndash Understand disease ldquoarchitecturerdquo number of SNPs ndash Recognize functional classes associated with weak genetic associations
bull Applications 2 2 (new individuals) ndash Provide health recommendations at the individual level
ndash Prioritize high-risk individuals for subsequent testing at population level 88
How many SNPs to include in model
scor
ec
nige
ly p
ohe
of t
ue
-val
Pct
ed
peex
Dudridge PLoS Genetics 2013 pi0Proportion of markers with no effect Purcell Nature 2009
Schizophrenia risk prediction
lsquoonly 5 matterrsquo
lsquoonly 10 matterrsquo(but still canrsquot tellWhich ones until lsquoall matterrsquo Full rank list)
inclusion threshold copy source unknown All rights reserved This content is excluded from our CreativeCommons license For more information see httpocwmiteduhelpfaq-fair-use
bull It depends on ndash Architecture Fraction of SNPs that are estimated to be functional ndash Power Number of individuals in cohort ie ability to rank correctly It only peaks at 5 (asymp1-pi0) when sufficient power to rank ndash Large fraction of associated markers are hidden within non-significant SNPs
bull
bull For pi0=090 still need to include all SNPs to maximize predictive power 89
Application to pleiotropy and common risk Trait 1 (schizophrenia) Case-control cohort w genotype + phenotype
Selection of SNPs Estimation of effects Ranking
Apply predictor Evaluate accuracy
Trait 2 (bipolar disorder) Case-control cohort w genotype + phenotype
bull Ability to assess common genetic risk Are the highly-ranked SNPs for one study relevant to a different study
Is there a shared genetic architecture between seemingly unrelated traits
irst use showed schizophrenia and bipolar disorder common risk Schizophrenia-ranked SNPs in one cohortlt
lt are predictive of bipolar disorder diagnosis lt but not predictive of unrelated (cardiovascular) traits
ndashndash
bull Fndashndashndash
90
Important pointscaveats for risk prediction bull Always limited by genetic component
ndash Environment random effects play big role for most traits
bull Mendelian=deterministic vs common variants=probic
ndash Only a first screen for individuals at risk
bull Limited by discovery power
ndash Cohort size limits discriminative power and ranking ability
bull Limited by genotyped SNPvs vs all SNPs
ndash Selection pushes fitness-reducing variants to lower freq
ndash Genotyped SNPs selected to be common
bull Even if SNPs are correctly id entified their effects are not
ndash Winnerrsquos curse over-estimate above-threshold true effect
bull Training and testing cohort non-independence
ndash Relatives cryptic relatedness population stratification inflate est 91
91
Goal Personalized and Predictive Medicine 1 Intro to Epidemiology basis of human disease 2 Genetic Epidemiology
ndash Genetic basis GWAS and screening ndash Interpreting GWAS with functional genomics ndash Calculating functional enrichments for GWAS loci
3 Molecular epidemiology ndash meQTLs Genotype-Epigenome association (cis-trans-) ndash EWAS Epigenome-Disease association
4 Resolving Causality ndash Statistical Mendelian Randomization ndash Application to genotype + methylation in AD
5 Systems Genomics and Epigenomics of disease ndash Beyond single loci polygenic risk prediction models ndash Sub-threshold loci and somatic heterogeneity in cancer
92
This talk From loci to mechanisms
Building a reference map of the regulatory genome Enhancers Promoters Transcribed Repressed
Regions Enhancers promoters transcribed repressed Cell types Predict tissues and cell types of epigenomic act ivity Target genes Link variants to their target genes using eQTLs activity Hi-C Nucleotides Regulatory consequence of mutation Conservation PWMs Regulators Upstream regulators whose activity is disrupted by mutation
Application to GWAS hidden heritability and Cancer GWAS CATGCCTG bull 93 top hits non-coding Mechanism Cell type hits CGTGTCTA bull Lie in haplotype blocks Causal variant(s)
lsquoHiddenrsquo CATGCCTG bull Many variants small effects Pathway-level burdenload heritability CGTGTCTA bull Many false positives Prioritize w regulatory annotations
Cancer bull s of function CATGCCTG Los Protein-coding variants convergence mutations CATCCCTG bull Gain of function Regulatory variants heterogeneity
93
Characterizing sub-threshold variants in heart arrhythmia
copy source unknown All rights reservedThiscontent is excluded from our Creative
Commons license For more information see
httpocwmiteduhelpfaq-fair-use
Focus on sub-threshold variants
(eg rs1743292 P=10-42)
Trait QRSQT interval
(1) Large cohorts (2) many known hits (3) well-characterized tissue drivers 94
From Arking D E Pulit S L Crotti L Harst P V Munroe P BKoopmann T T Newton-Cheh C (2014) Genetic associationstudy of QT interval highlights role for calcium myocardial repolarizationNature Genetics Nat Genet 46(8) 826-836 Used with permission
Enhancers overlapping GWAS loci share functional properties
copy source unknown All rights reserved This content is excluded from our CreativeCommons license For more information see httpocwmiteduhelpfaq-fair-use
Train machine learning model to prioritize sub-threshold loci 95
Functional evidence for sub-threshold target genes
Zebrafish phenotypes Human genetics
copy source unknown All rights reserved This content is excluded from our CreativeCommons license For more information see httpocwmiteduhelpfaq-fair-use
Mouse phenotypes 96
Experimental validation of 11 sub-threshold loci
copy source unknown All rights reserved This content is excluded from our CreativeCommons license For more information see httpocwmiteduhelpfaq-fair-use
9 of 11 tested loci show allelic activity chromatin interactions
97
Functional evidence for rs1743292 causality (P=10-42)
Enhancer 4C links to target gene promoters Heart enhancer activity
Motif disruption Allelic DNase in multiple individuals copy source unknown All rights reserved This content is excluded from our CreativeCommons license For more information see httpocwmiteduhelpfaq-fair-use Allelic enha-
ncer activity 98
Target gene impact on heart conduction
Optical voltage mapping
zebrafish embryo hearts voltage-sensitive fluorescent dye
ventricle
atrium
transmembrane voltage (ventricle)
copy source unknown All rights reserved This content is excludedfrom our Creative Commons license For more information seehttpocwmiteduhelpfaq-fair-use
Detection and validation of a new cardiac locus
99
What would we need to discover rs1743292 without epigenomics
rs1743292 Minor allele frequency 0134
Effect size -05773 +- 017 msec With 68900 individuals 128 power to discover at plt5x10-8
bull rs1743292 has similar effect sizes as many genome-wide significant variants
bull Many GWAS variants discovered due to winnerrsquos curse often only have 5-
20 power to discover
bull Combining epigenomics and GWAS can
1 Confirm existing GWAS loci are real
2 Discover new sub-threshold loci with weak effect sizes low power
To reach 80 power to discover rs1743292 at plt5x10-8 we need 146700 individuals
100
Goal Personalized and Predictive Medicine 1 Intro to Epidemiology basis of human disease
enetic Epidemiology Genetic basis GWAS and screening Interpreting GWAS with functional genomics Calculating functional enrichments for GWAS loci
olecular epidemiology meQTLs Genotype-Epigenome association (cis-trans-) EWAS Epigenome-Disease association
esolving Causality Statistical Mendelian Randomization Application to genotype + methylation in AD
ystems Genomics and Epigenomics of disease Beyond single loci polygenic risk prediction models Sub-threshold loci and somatic heterogeneity in cancer
2 Gndash ndash ndash
3 Mndash ndash
4 Rndash ndash
5 Sndash ndash
101
This talk From loci to mechanisms
Building a reference map of the regulatory genome Enhancers Promoters Transcribed Repressed
Regions Enhancers promoters transcribed repressed Cell types Predict tissues and cell types of epigenomic act ivity Target genes Link variants to their target genes using eQTLs activity Hi-C Nucleotides Regulatory consequence of mutation Conservation PWMs Regulators Upstream regulators whose activity is disrupted by mutation
Application to GWAS hidden heritability and Cancer GWAS CATGCCTG bull 93 top hits non-coding Mechanism Cell type hits CGTGTCTA bull Lie in haplotype blocks Causal variant(s)
lsquoHiddenrsquo CATGCCTG bull Many variants small effects Pathway-level burdenload heritability CGTGTCTA bull Many false positives Prioritize w regulatory annotations
Cancer function CATGCCTG bull Loss of Protein-coding variants convergence mutations CATCCCTG bull Gain of function Regulatory variants heterogeneity
102
Regulatory convergence of dispersed driver mutations
copy source unknown All rights reserved This content is excluded from our CreativeCommons license For more information see httpocwmiteduhelpfaq-fair-use
Common mutations in regulatory plexus of each gene Richard Sallari 103
Cancer genes are more likely to be up-regulated
copy source unknown All rights reserved This content is excluded from our CreativeCommons license For more information see httpocwmiteduhelpfaq-fair-use
Richard Sallari 104
Dysregulated genes show dispersed non-coding mutations
copy source unknown All rights reserved This content is excluded from our CreativeCommons license For more information see httpocwmiteduhelpfaq-fair-use
Dysregulated genes are enriched for plexus mutations at all distances Richard Sallari 105
Non-coding mutations enriched in promoters enhancers active in other cell types
copy source unknown All rights reserved This content is excluded from our CreativeCommons license For more information see httpocwmiteduhelpfaq-fair-use
Disruptive mutations in lsquolowrsquo elements are enriched in enhancers and promoters in other tissues
Richard Sallari 106
Statistical model for excess of raresomatic variants
copy source unknown All rights reserved This content is excluded from our CreativeCommons license For more information see httpocwmiteduhelpfaq-fair-use
bullCorrect for region- state- tumor-specific rate variation 107
Convergence in immune signaling mitoch functions
copy source unknown All rights reserved This content is excluded from our CreativeCommons license For more information see httpocwmiteduhelpfaq-fair-use
bullPathway-level convergence hierarchical model 108
Richard Sallari
Non-coding drivers of prostate cancer dysregulation
Regulatory mutations reveal Convergence in immune signaling new cancer driver genes
mitochondrial functions
copy source unknown All rights reserved This content is excluded from our CreativeCommons license For more information see httpocwmiteduhelpfaq-fair-use
Convergence in inositol phosphate metabolism PLCB4 overexpression in PC3 prostate cancer adjacent to PTEN PIK3CA known cancer genes reduces ErkAkt activity synergistic with PTEN
109
Personal genomics tomorrow Already 100000s of complete genomes
bull Health disease quantitative traits ndash Genomics regions disease mechanism drug targets ndash Protein-coding cracking regulatory code variation ndash Single genes systems gene interactions pathways
bull Human ancestry ndash Resolve all of human ancestral relationships ndash Complete history of all migrations selective events ndash Resolve common inheritance vs trait association
bull Whatrsquos missing is the computation ndash New algorithms machine learning dimensionality reduction ndash Individualized treatment from 1000s genes genome ndash Understand missing heritability ndash Reveal co-evolution between geneselements ndash Correct for modulating effects in GWAS
110
Challenge ahead From research to clinic 1 Systematic medical genotyping sequencing
ndash Currently a curiosity future medical practice
2 Systematic medical molecular profiling
ndash Functional genomics in relevant cell types
3 Systematic perturbation studies for validation
ndash 1000s of regulatory predictions x 100s cell types
4 Systematic repurposing of approved drugs
ndash Systems-biology view of drug response
5 Genomics of drug response in cli nical trials
ndash Personalized drug prescription and combinations
6 Partnerships academia industry hospitals
ndash Interdisciplinary training in each of the instituttions 111
Summary Personalized amp Predictive Medicine 1 Intro to Epidemiology basis of human disease 2 Genetic Epidemiology
ndash Genetic basis GWAS and screening ndash Interpreting GWAS with functional genomics ndash Calculating functional enrichments for GWAS loci
3 Molecular epidemiology ndash meQTLs Genotype-Epigenome association (cis-trans-) ndash EWAS Epigenome-Disease association
4 Resolving Causality ndash Statistical Mendelian Randomization ndash Application to genotype + methylation in AD
5 Systems Genomics and Epigenomics of disease ndash Beyond single loci polygenic risk prediction models ndash Sub-threshold loci and somatic heterogeneity in cancer
112
MIT OpenCourseWarehttpocwmitedu
6047 6878 HST507 Computational BiologyFall 2015
For information about citing these materials or our Terms of Use visit httpocwmiteduterms

(2) Causal Pathway Models
bull In reality its a little of both rsquos affect on D is partially mediated through B
A DB
bull To test ndash A is associated with B and D ndash B is associated with D ndash The effect size of A on D is decreased when con
ndash Note A MUST come before B temporally
bull Example CR1 effect on cognitive decline
trolling for B
A Factor A Factor B Disease D D
B
75
(3) Interaction Models
bull Factor Brsquos effect on D is different depending on value for factor
B (A = Aa)
B (A = AA)
D
B (A = aa)
bull To test ndash A + B + AB D if estimate for AB is significant then ndash Stratify by levels of A
bull Example
ndash drugrsquos effect is different depending on genotype ndash More to comelt
76
Gene locus reference Published
AD AD NP
BIN1
CD2AP
CD33
rs744373
rs9349407
rs3865444
Seshadri 2010
Naj 2011Hollingsworth 2011
Naj 2011Hollingsworth 2012
16x10-11
86x10-9
16x10-9
0204
0445
0133
0480
0221
0123
ABCA7 rs3764650 Hollingsworth 2010 50x10-21 0747 0187 APOE Any ε4 12x10-13 18x10-23
CLU rs11136000 Lambert 2009Harold 2009 75x10-9 0762 0649 CR1 rs6656401 Lambert 2009 37x10-9 00009 0057
EPHA1 rs11767557 Naj 2011Hollingsworth 2011 60x10-10 0562 0391 MS4A4A rs4938933 Naj 2011 17x10-9 0792 0567 MS4A6A rs610932 Hollingsworth 2010 12x10-16 0534 0820
MTHFD1L rs11754661 Naj 2010 19x10-10 0126 0934 PICALM rs3851179 Harold 2009 19x10-8 0382 0171
Application to 12 AD GWAS loci
77
Tangles
CR1 Causal pathway model
Risk Factors Pathology Clinical Disease
Alzheimerrsquos disease
Genetic CR1
Cognitive Decline
AD specific Neuritic Plaque Neurofibulary
bull CR1 first associated with AD in 2009 bull Original associated variant is in an intron no clear function bull Unclear how CR1 locus influences AD susceptibility mechanistically
bull
Questions ndash Is the effect only on AD ndash Is there a broader effect on cognitive decline ndash Is there an association with AD pathology ndash Does it go through pathology to have an effect of cognitive decline
78
CR1 (rs6656401)
CR1 Pathology
04
045
05
055
06
065
07
075
08
085
Neuritic Plaque Neurofibillary Tangles
TT ATAA (risk allele)
CR1 Global Cognitive Decline
p=00008
p=0008 p=010
Pathology Global Cognitive Decline p lt 00001 time
79
Matt Eaton Phil De Jager
Epigenome
Genetic + Epigenetic variation in lzheimerrsquos
Relate to genotype and AD variation 723 AD patients amp controls Methylation variation in
Genome
meQTL
Phenotype
Classification Epigenome MWAS
1 2
copy source unknown All rights reserved This content isexcluded from our Creative Commons license For moreinformation see httpocwmiteduhelpfaq-fair-use
Methylation gtgt SNPs Estimate causal M roles regression Enhancers gtgt promoters of meQTL effects reduces MD
copy source unknown All rights reserved This content is excluded
from our Creative Commons license For more information see
httpocwmiteduhelpfaq-fair-use 80
Goal Personalized and Predictive Medicine 1 Intro to Epidemiology basis of human disease 2 Genetic Epidemiology
ndash Genetic basis GWAS and screening ndash Interpreting GWAS with functional genomics ndash Calculating functional enrichments for GWAS loci
3 Molecular epidemiology ndash meQTLs Genotype-Epigenome association (cis-trans-) ndash EWAS Epigenome-Disease association
4 Resolving Causality ndash Statistical Mendelian Randomization ndash Application to genotype + methylation in AD
5 Systems Genomics and Epigenomics of disease ndash Beyond single loci polygenic risk prediction models ndash Sub-threshold loci and somatic heterogeneity in cancer
81
Beyond top-scoring hits 1000s of variants of weak effect
cluster in cell type specific enhancers
82
Rank-based functional testing of weak associations
Enrichment peaks at 10000s of SNPs down the rank list even after LD pruning
copy source unknown All rights reserved This content is excluded from our Creative
Commons license For more information see httpocwmiteduhelpfaq-fair-use
bull Rank all SNPs based on GWAS signal strength bull Functional enrichment for cell types and states 83
Weak-effect T1D hits in 50k T-cell enhancers enhancers
CD4+ T-cells
T-cells B-cells
Other cell types
copy source unknown All rights reserved This content is excluded from our Creative
Commons license For more information see httpocwmiteduhelpfaq-fair-use
bull LD-pruning (CEU r2gt2) 50k 41k independ loci 84
Cell type specificity stronger for enhancers enhancers promoters
transcribed
CD4+ T-cells
T-cells B-cells
Other cell types
copy source unknown All rights reserved This content is excluded from our Creative
Commons license For more information see httpocwmiteduhelpfaq-fair-use
bull TB-cells also enriched for promoters transcribed bull Enhancer enrichment much more cell type specific 85
T1DRA-enriched enhancers spread across genome
copy source unknown All rights reserved This content is excluded from our Creative
Commons license For more information see httpocw miteduhelpfaq-fair-use
bull High concentration of loci in MHC high overlapbull Yet many distinct regions 1000s of distinct loci 86
Implications for genetic predisposition polygenic models for risk prediction
87
1
Basic setup of polygenic risk prediction studies Case-control cohort w genotype + phenotype
Training cohort Testing cohort
Selection of SNPs Estimation of effects Ranking
Apply predictor Evaluate accuracy
Apply predictor w estimated confidence
Target cohort genotyped individuals
(no phenotypes)
1
(power matters) (power matters) (power limited to one individual at a time)
2
bull Applications 1 (testing cohort) ndash Understand total heritability captured in common variants
ndash Understand disease ldquoarchitecturerdquo number of SNPs ndash Recognize functional classes associated with weak genetic associations
bull Applications 2 2 (new individuals) ndash Provide health recommendations at the individual level
ndash Prioritize high-risk individuals for subsequent testing at population level 88
How many SNPs to include in model
scor
ec
nige
ly p
ohe
of t
ue
-val
Pct
ed
peex
Dudridge PLoS Genetics 2013 pi0Proportion of markers with no effect Purcell Nature 2009
Schizophrenia risk prediction
lsquoonly 5 matterrsquo
lsquoonly 10 matterrsquo(but still canrsquot tellWhich ones until lsquoall matterrsquo Full rank list)
inclusion threshold copy source unknown All rights reserved This content is excluded from our CreativeCommons license For more information see httpocwmiteduhelpfaq-fair-use
bull It depends on ndash Architecture Fraction of SNPs that are estimated to be functional ndash Power Number of individuals in cohort ie ability to rank correctly It only peaks at 5 (asymp1-pi0) when sufficient power to rank ndash Large fraction of associated markers are hidden within non-significant SNPs
bull
bull For pi0=090 still need to include all SNPs to maximize predictive power 89
Application to pleiotropy and common risk Trait 1 (schizophrenia) Case-control cohort w genotype + phenotype
Selection of SNPs Estimation of effects Ranking
Apply predictor Evaluate accuracy
Trait 2 (bipolar disorder) Case-control cohort w genotype + phenotype
bull Ability to assess common genetic risk Are the highly-ranked SNPs for one study relevant to a different study
Is there a shared genetic architecture between seemingly unrelated traits
irst use showed schizophrenia and bipolar disorder common risk Schizophrenia-ranked SNPs in one cohortlt
lt are predictive of bipolar disorder diagnosis lt but not predictive of unrelated (cardiovascular) traits
ndashndash
bull Fndashndashndash
90
Important pointscaveats for risk prediction bull Always limited by genetic component
ndash Environment random effects play big role for most traits
bull Mendelian=deterministic vs common variants=probic
ndash Only a first screen for individuals at risk
bull Limited by discovery power
ndash Cohort size limits discriminative power and ranking ability
bull Limited by genotyped SNPvs vs all SNPs
ndash Selection pushes fitness-reducing variants to lower freq
ndash Genotyped SNPs selected to be common
bull Even if SNPs are correctly id entified their effects are not
ndash Winnerrsquos curse over-estimate above-threshold true effect
bull Training and testing cohort non-independence
ndash Relatives cryptic relatedness population stratification inflate est 91
91
Goal Personalized and Predictive Medicine 1 Intro to Epidemiology basis of human disease 2 Genetic Epidemiology
ndash Genetic basis GWAS and screening ndash Interpreting GWAS with functional genomics ndash Calculating functional enrichments for GWAS loci
3 Molecular epidemiology ndash meQTLs Genotype-Epigenome association (cis-trans-) ndash EWAS Epigenome-Disease association
4 Resolving Causality ndash Statistical Mendelian Randomization ndash Application to genotype + methylation in AD
5 Systems Genomics and Epigenomics of disease ndash Beyond single loci polygenic risk prediction models ndash Sub-threshold loci and somatic heterogeneity in cancer
92
This talk From loci to mechanisms
Building a reference map of the regulatory genome Enhancers Promoters Transcribed Repressed
Regions Enhancers promoters transcribed repressed Cell types Predict tissues and cell types of epigenomic act ivity Target genes Link variants to their target genes using eQTLs activity Hi-C Nucleotides Regulatory consequence of mutation Conservation PWMs Regulators Upstream regulators whose activity is disrupted by mutation
Application to GWAS hidden heritability and Cancer GWAS CATGCCTG bull 93 top hits non-coding Mechanism Cell type hits CGTGTCTA bull Lie in haplotype blocks Causal variant(s)
lsquoHiddenrsquo CATGCCTG bull Many variants small effects Pathway-level burdenload heritability CGTGTCTA bull Many false positives Prioritize w regulatory annotations
Cancer bull s of function CATGCCTG Los Protein-coding variants convergence mutations CATCCCTG bull Gain of function Regulatory variants heterogeneity
93
Characterizing sub-threshold variants in heart arrhythmia
copy source unknown All rights reservedThiscontent is excluded from our Creative
Commons license For more information see
httpocwmiteduhelpfaq-fair-use
Focus on sub-threshold variants
(eg rs1743292 P=10-42)
Trait QRSQT interval
(1) Large cohorts (2) many known hits (3) well-characterized tissue drivers 94
From Arking D E Pulit S L Crotti L Harst P V Munroe P BKoopmann T T Newton-Cheh C (2014) Genetic associationstudy of QT interval highlights role for calcium myocardial repolarizationNature Genetics Nat Genet 46(8) 826-836 Used with permission
Enhancers overlapping GWAS loci share functional properties
copy source unknown All rights reserved This content is excluded from our CreativeCommons license For more information see httpocwmiteduhelpfaq-fair-use
Train machine learning model to prioritize sub-threshold loci 95
Functional evidence for sub-threshold target genes
Zebrafish phenotypes Human genetics
copy source unknown All rights reserved This content is excluded from our CreativeCommons license For more information see httpocwmiteduhelpfaq-fair-use
Mouse phenotypes 96
Experimental validation of 11 sub-threshold loci
copy source unknown All rights reserved This content is excluded from our CreativeCommons license For more information see httpocwmiteduhelpfaq-fair-use
9 of 11 tested loci show allelic activity chromatin interactions
97
Functional evidence for rs1743292 causality (P=10-42)
Enhancer 4C links to target gene promoters Heart enhancer activity
Motif disruption Allelic DNase in multiple individuals copy source unknown All rights reserved This content is excluded from our CreativeCommons license For more information see httpocwmiteduhelpfaq-fair-use Allelic enha-
ncer activity 98
Target gene impact on heart conduction
Optical voltage mapping
zebrafish embryo hearts voltage-sensitive fluorescent dye
ventricle
atrium
transmembrane voltage (ventricle)
copy source unknown All rights reserved This content is excludedfrom our Creative Commons license For more information seehttpocwmiteduhelpfaq-fair-use
Detection and validation of a new cardiac locus
99
What would we need to discover rs1743292 without epigenomics
rs1743292 Minor allele frequency 0134
Effect size -05773 +- 017 msec With 68900 individuals 128 power to discover at plt5x10-8
bull rs1743292 has similar effect sizes as many genome-wide significant variants
bull Many GWAS variants discovered due to winnerrsquos curse often only have 5-
20 power to discover
bull Combining epigenomics and GWAS can
1 Confirm existing GWAS loci are real
2 Discover new sub-threshold loci with weak effect sizes low power
To reach 80 power to discover rs1743292 at plt5x10-8 we need 146700 individuals
100
Goal Personalized and Predictive Medicine 1 Intro to Epidemiology basis of human disease
enetic Epidemiology Genetic basis GWAS and screening Interpreting GWAS with functional genomics Calculating functional enrichments for GWAS loci
olecular epidemiology meQTLs Genotype-Epigenome association (cis-trans-) EWAS Epigenome-Disease association
esolving Causality Statistical Mendelian Randomization Application to genotype + methylation in AD
ystems Genomics and Epigenomics of disease Beyond single loci polygenic risk prediction models Sub-threshold loci and somatic heterogeneity in cancer
2 Gndash ndash ndash
3 Mndash ndash
4 Rndash ndash
5 Sndash ndash
101
This talk From loci to mechanisms
Building a reference map of the regulatory genome Enhancers Promoters Transcribed Repressed
Regions Enhancers promoters transcribed repressed Cell types Predict tissues and cell types of epigenomic act ivity Target genes Link variants to their target genes using eQTLs activity Hi-C Nucleotides Regulatory consequence of mutation Conservation PWMs Regulators Upstream regulators whose activity is disrupted by mutation
Application to GWAS hidden heritability and Cancer GWAS CATGCCTG bull 93 top hits non-coding Mechanism Cell type hits CGTGTCTA bull Lie in haplotype blocks Causal variant(s)
lsquoHiddenrsquo CATGCCTG bull Many variants small effects Pathway-level burdenload heritability CGTGTCTA bull Many false positives Prioritize w regulatory annotations
Cancer function CATGCCTG bull Loss of Protein-coding variants convergence mutations CATCCCTG bull Gain of function Regulatory variants heterogeneity
102
Regulatory convergence of dispersed driver mutations
copy source unknown All rights reserved This content is excluded from our CreativeCommons license For more information see httpocwmiteduhelpfaq-fair-use
Common mutations in regulatory plexus of each gene Richard Sallari 103
Cancer genes are more likely to be up-regulated
copy source unknown All rights reserved This content is excluded from our CreativeCommons license For more information see httpocwmiteduhelpfaq-fair-use
Richard Sallari 104
Dysregulated genes show dispersed non-coding mutations
copy source unknown All rights reserved This content is excluded from our CreativeCommons license For more information see httpocwmiteduhelpfaq-fair-use
Dysregulated genes are enriched for plexus mutations at all distances Richard Sallari 105
Non-coding mutations enriched in promoters enhancers active in other cell types
copy source unknown All rights reserved This content is excluded from our CreativeCommons license For more information see httpocwmiteduhelpfaq-fair-use
Disruptive mutations in lsquolowrsquo elements are enriched in enhancers and promoters in other tissues
Richard Sallari 106
Statistical model for excess of raresomatic variants
copy source unknown All rights reserved This content is excluded from our CreativeCommons license For more information see httpocwmiteduhelpfaq-fair-use
bullCorrect for region- state- tumor-specific rate variation 107
Convergence in immune signaling mitoch functions
copy source unknown All rights reserved This content is excluded from our CreativeCommons license For more information see httpocwmiteduhelpfaq-fair-use
bullPathway-level convergence hierarchical model 108
Richard Sallari
Non-coding drivers of prostate cancer dysregulation
Regulatory mutations reveal Convergence in immune signaling new cancer driver genes
mitochondrial functions
copy source unknown All rights reserved This content is excluded from our CreativeCommons license For more information see httpocwmiteduhelpfaq-fair-use
Convergence in inositol phosphate metabolism PLCB4 overexpression in PC3 prostate cancer adjacent to PTEN PIK3CA known cancer genes reduces ErkAkt activity synergistic with PTEN
109
Personal genomics tomorrow Already 100000s of complete genomes
bull Health disease quantitative traits ndash Genomics regions disease mechanism drug targets ndash Protein-coding cracking regulatory code variation ndash Single genes systems gene interactions pathways
bull Human ancestry ndash Resolve all of human ancestral relationships ndash Complete history of all migrations selective events ndash Resolve common inheritance vs trait association
bull Whatrsquos missing is the computation ndash New algorithms machine learning dimensionality reduction ndash Individualized treatment from 1000s genes genome ndash Understand missing heritability ndash Reveal co-evolution between geneselements ndash Correct for modulating effects in GWAS
110
Challenge ahead From research to clinic 1 Systematic medical genotyping sequencing
ndash Currently a curiosity future medical practice
2 Systematic medical molecular profiling
ndash Functional genomics in relevant cell types
3 Systematic perturbation studies for validation
ndash 1000s of regulatory predictions x 100s cell types
4 Systematic repurposing of approved drugs
ndash Systems-biology view of drug response
5 Genomics of drug response in cli nical trials
ndash Personalized drug prescription and combinations
6 Partnerships academia industry hospitals
ndash Interdisciplinary training in each of the instituttions 111
Summary Personalized amp Predictive Medicine 1 Intro to Epidemiology basis of human disease 2 Genetic Epidemiology
ndash Genetic basis GWAS and screening ndash Interpreting GWAS with functional genomics ndash Calculating functional enrichments for GWAS loci
3 Molecular epidemiology ndash meQTLs Genotype-Epigenome association (cis-trans-) ndash EWAS Epigenome-Disease association
4 Resolving Causality ndash Statistical Mendelian Randomization ndash Application to genotype + methylation in AD
5 Systems Genomics and Epigenomics of disease ndash Beyond single loci polygenic risk prediction models ndash Sub-threshold loci and somatic heterogeneity in cancer
112
MIT OpenCourseWarehttpocwmitedu
6047 6878 HST507 Computational BiologyFall 2015
For information about citing these materials or our Terms of Use visit httpocwmiteduterms
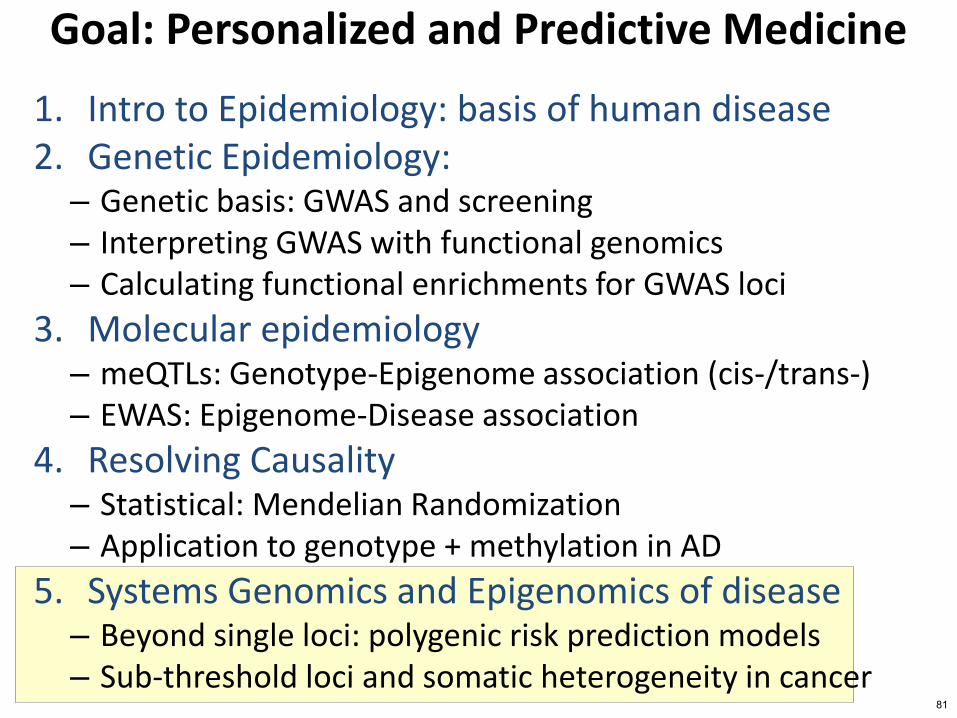
Goal Personalized and Predictive Medicine 1 Intro to Epidemiology basis of human disease 2 Genetic Epidemiology
ndash Genetic basis GWAS and screening ndash Interpreting GWAS with functional genomics ndash Calculating functional enrichments for GWAS loci
3 Molecular epidemiology ndash meQTLs Genotype-Epigenome association (cis-trans-) ndash EWAS Epigenome-Disease association
4 Resolving Causality ndash Statistical Mendelian Randomization ndash Application to genotype + methylation in AD
5 Systems Genomics and Epigenomics of disease ndash Beyond single loci polygenic risk prediction models ndash Sub-threshold loci and somatic heterogeneity in cancer
81
Beyond top-scoring hits 1000s of variants of weak effect
cluster in cell type specific enhancers
82
Rank-based functional testing of weak associations
Enrichment peaks at 10000s of SNPs down the rank list even after LD pruning
copy source unknown All rights reserved This content is excluded from our Creative
Commons license For more information see httpocwmiteduhelpfaq-fair-use
bull Rank all SNPs based on GWAS signal strength bull Functional enrichment for cell types and states 83
Weak-effect T1D hits in 50k T-cell enhancers enhancers
CD4+ T-cells
T-cells B-cells
Other cell types
copy source unknown All rights reserved This content is excluded from our Creative
Commons license For more information see httpocwmiteduhelpfaq-fair-use
bull LD-pruning (CEU r2gt2) 50k 41k independ loci 84
Cell type specificity stronger for enhancers enhancers promoters
transcribed
CD4+ T-cells
T-cells B-cells
Other cell types
copy source unknown All rights reserved This content is excluded from our Creative
Commons license For more information see httpocwmiteduhelpfaq-fair-use
bull TB-cells also enriched for promoters transcribed bull Enhancer enrichment much more cell type specific 85
T1DRA-enriched enhancers spread across genome
copy source unknown All rights reserved This content is excluded from our Creative
Commons license For more information see httpocw miteduhelpfaq-fair-use
bull High concentration of loci in MHC high overlapbull Yet many distinct regions 1000s of distinct loci 86
Implications for genetic predisposition polygenic models for risk prediction
87
1
Basic setup of polygenic risk prediction studies Case-control cohort w genotype + phenotype
Training cohort Testing cohort
Selection of SNPs Estimation of effects Ranking
Apply predictor Evaluate accuracy
Apply predictor w estimated confidence
Target cohort genotyped individuals
(no phenotypes)
1
(power matters) (power matters) (power limited to one individual at a time)
2
bull Applications 1 (testing cohort) ndash Understand total heritability captured in common variants
ndash Understand disease ldquoarchitecturerdquo number of SNPs ndash Recognize functional classes associated with weak genetic associations
bull Applications 2 2 (new individuals) ndash Provide health recommendations at the individual level
ndash Prioritize high-risk individuals for subsequent testing at population level 88
How many SNPs to include in model
scor
ec
nige
ly p
ohe
of t
ue
-val
Pct
ed
peex
Dudridge PLoS Genetics 2013 pi0Proportion of markers with no effect Purcell Nature 2009
Schizophrenia risk prediction
lsquoonly 5 matterrsquo
lsquoonly 10 matterrsquo(but still canrsquot tellWhich ones until lsquoall matterrsquo Full rank list)
inclusion threshold copy source unknown All rights reserved This content is excluded from our CreativeCommons license For more information see httpocwmiteduhelpfaq-fair-use
bull It depends on ndash Architecture Fraction of SNPs that are estimated to be functional ndash Power Number of individuals in cohort ie ability to rank correctly It only peaks at 5 (asymp1-pi0) when sufficient power to rank ndash Large fraction of associated markers are hidden within non-significant SNPs
bull
bull For pi0=090 still need to include all SNPs to maximize predictive power 89
Application to pleiotropy and common risk Trait 1 (schizophrenia) Case-control cohort w genotype + phenotype
Selection of SNPs Estimation of effects Ranking
Apply predictor Evaluate accuracy
Trait 2 (bipolar disorder) Case-control cohort w genotype + phenotype
bull Ability to assess common genetic risk Are the highly-ranked SNPs for one study relevant to a different study
Is there a shared genetic architecture between seemingly unrelated traits
irst use showed schizophrenia and bipolar disorder common risk Schizophrenia-ranked SNPs in one cohortlt
lt are predictive of bipolar disorder diagnosis lt but not predictive of unrelated (cardiovascular) traits
ndashndash
bull Fndashndashndash
90
Important pointscaveats for risk prediction bull Always limited by genetic component
ndash Environment random effects play big role for most traits
bull Mendelian=deterministic vs common variants=probic
ndash Only a first screen for individuals at risk
bull Limited by discovery power
ndash Cohort size limits discriminative power and ranking ability
bull Limited by genotyped SNPvs vs all SNPs
ndash Selection pushes fitness-reducing variants to lower freq
ndash Genotyped SNPs selected to be common
bull Even if SNPs are correctly id entified their effects are not
ndash Winnerrsquos curse over-estimate above-threshold true effect
bull Training and testing cohort non-independence
ndash Relatives cryptic relatedness population stratification inflate est 91
91
Goal Personalized and Predictive Medicine 1 Intro to Epidemiology basis of human disease 2 Genetic Epidemiology
ndash Genetic basis GWAS and screening ndash Interpreting GWAS with functional genomics ndash Calculating functional enrichments for GWAS loci
3 Molecular epidemiology ndash meQTLs Genotype-Epigenome association (cis-trans-) ndash EWAS Epigenome-Disease association
4 Resolving Causality ndash Statistical Mendelian Randomization ndash Application to genotype + methylation in AD
5 Systems Genomics and Epigenomics of disease ndash Beyond single loci polygenic risk prediction models ndash Sub-threshold loci and somatic heterogeneity in cancer
92
This talk From loci to mechanisms
Building a reference map of the regulatory genome Enhancers Promoters Transcribed Repressed
Regions Enhancers promoters transcribed repressed Cell types Predict tissues and cell types of epigenomic act ivity Target genes Link variants to their target genes using eQTLs activity Hi-C Nucleotides Regulatory consequence of mutation Conservation PWMs Regulators Upstream regulators whose activity is disrupted by mutation
Application to GWAS hidden heritability and Cancer GWAS CATGCCTG bull 93 top hits non-coding Mechanism Cell type hits CGTGTCTA bull Lie in haplotype blocks Causal variant(s)
lsquoHiddenrsquo CATGCCTG bull Many variants small effects Pathway-level burdenload heritability CGTGTCTA bull Many false positives Prioritize w regulatory annotations
Cancer bull s of function CATGCCTG Los Protein-coding variants convergence mutations CATCCCTG bull Gain of function Regulatory variants heterogeneity
93
Characterizing sub-threshold variants in heart arrhythmia
copy source unknown All rights reservedThiscontent is excluded from our Creative
Commons license For more information see
httpocwmiteduhelpfaq-fair-use
Focus on sub-threshold variants
(eg rs1743292 P=10-42)
Trait QRSQT interval
(1) Large cohorts (2) many known hits (3) well-characterized tissue drivers 94
From Arking D E Pulit S L Crotti L Harst P V Munroe P BKoopmann T T Newton-Cheh C (2014) Genetic associationstudy of QT interval highlights role for calcium myocardial repolarizationNature Genetics Nat Genet 46(8) 826-836 Used with permission
Enhancers overlapping GWAS loci share functional properties
copy source unknown All rights reserved This content is excluded from our CreativeCommons license For more information see httpocwmiteduhelpfaq-fair-use
Train machine learning model to prioritize sub-threshold loci 95
Functional evidence for sub-threshold target genes
Zebrafish phenotypes Human genetics
copy source unknown All rights reserved This content is excluded from our CreativeCommons license For more information see httpocwmiteduhelpfaq-fair-use
Mouse phenotypes 96
Experimental validation of 11 sub-threshold loci
copy source unknown All rights reserved This content is excluded from our CreativeCommons license For more information see httpocwmiteduhelpfaq-fair-use
9 of 11 tested loci show allelic activity chromatin interactions
97
Functional evidence for rs1743292 causality (P=10-42)
Enhancer 4C links to target gene promoters Heart enhancer activity
Motif disruption Allelic DNase in multiple individuals copy source unknown All rights reserved This content is excluded from our CreativeCommons license For more information see httpocwmiteduhelpfaq-fair-use Allelic enha-
ncer activity 98
Target gene impact on heart conduction
Optical voltage mapping
zebrafish embryo hearts voltage-sensitive fluorescent dye
ventricle
atrium
transmembrane voltage (ventricle)
copy source unknown All rights reserved This content is excludedfrom our Creative Commons license For more information seehttpocwmiteduhelpfaq-fair-use
Detection and validation of a new cardiac locus
99
What would we need to discover rs1743292 without epigenomics
rs1743292 Minor allele frequency 0134
Effect size -05773 +- 017 msec With 68900 individuals 128 power to discover at plt5x10-8
bull rs1743292 has similar effect sizes as many genome-wide significant variants
bull Many GWAS variants discovered due to winnerrsquos curse often only have 5-
20 power to discover
bull Combining epigenomics and GWAS can
1 Confirm existing GWAS loci are real
2 Discover new sub-threshold loci with weak effect sizes low power
To reach 80 power to discover rs1743292 at plt5x10-8 we need 146700 individuals
100
Goal Personalized and Predictive Medicine 1 Intro to Epidemiology basis of human disease
enetic Epidemiology Genetic basis GWAS and screening Interpreting GWAS with functional genomics Calculating functional enrichments for GWAS loci
olecular epidemiology meQTLs Genotype-Epigenome association (cis-trans-) EWAS Epigenome-Disease association
esolving Causality Statistical Mendelian Randomization Application to genotype + methylation in AD
ystems Genomics and Epigenomics of disease Beyond single loci polygenic risk prediction models Sub-threshold loci and somatic heterogeneity in cancer
2 Gndash ndash ndash
3 Mndash ndash
4 Rndash ndash
5 Sndash ndash
101
This talk From loci to mechanisms
Building a reference map of the regulatory genome Enhancers Promoters Transcribed Repressed
Regions Enhancers promoters transcribed repressed Cell types Predict tissues and cell types of epigenomic act ivity Target genes Link variants to their target genes using eQTLs activity Hi-C Nucleotides Regulatory consequence of mutation Conservation PWMs Regulators Upstream regulators whose activity is disrupted by mutation
Application to GWAS hidden heritability and Cancer GWAS CATGCCTG bull 93 top hits non-coding Mechanism Cell type hits CGTGTCTA bull Lie in haplotype blocks Causal variant(s)
lsquoHiddenrsquo CATGCCTG bull Many variants small effects Pathway-level burdenload heritability CGTGTCTA bull Many false positives Prioritize w regulatory annotations
Cancer function CATGCCTG bull Loss of Protein-coding variants convergence mutations CATCCCTG bull Gain of function Regulatory variants heterogeneity
102
Regulatory convergence of dispersed driver mutations
copy source unknown All rights reserved This content is excluded from our CreativeCommons license For more information see httpocwmiteduhelpfaq-fair-use
Common mutations in regulatory plexus of each gene Richard Sallari 103
Cancer genes are more likely to be up-regulated
copy source unknown All rights reserved This content is excluded from our CreativeCommons license For more information see httpocwmiteduhelpfaq-fair-use
Richard Sallari 104
Dysregulated genes show dispersed non-coding mutations
copy source unknown All rights reserved This content is excluded from our CreativeCommons license For more information see httpocwmiteduhelpfaq-fair-use
Dysregulated genes are enriched for plexus mutations at all distances Richard Sallari 105
Non-coding mutations enriched in promoters enhancers active in other cell types
copy source unknown All rights reserved This content is excluded from our CreativeCommons license For more information see httpocwmiteduhelpfaq-fair-use
Disruptive mutations in lsquolowrsquo elements are enriched in enhancers and promoters in other tissues
Richard Sallari 106
Statistical model for excess of raresomatic variants
copy source unknown All rights reserved This content is excluded from our CreativeCommons license For more information see httpocwmiteduhelpfaq-fair-use
bullCorrect for region- state- tumor-specific rate variation 107
Convergence in immune signaling mitoch functions
copy source unknown All rights reserved This content is excluded from our CreativeCommons license For more information see httpocwmiteduhelpfaq-fair-use
bullPathway-level convergence hierarchical model 108
Richard Sallari
Non-coding drivers of prostate cancer dysregulation
Regulatory mutations reveal Convergence in immune signaling new cancer driver genes
mitochondrial functions
copy source unknown All rights reserved This content is excluded from our CreativeCommons license For more information see httpocwmiteduhelpfaq-fair-use
Convergence in inositol phosphate metabolism PLCB4 overexpression in PC3 prostate cancer adjacent to PTEN PIK3CA known cancer genes reduces ErkAkt activity synergistic with PTEN
109
Personal genomics tomorrow Already 100000s of complete genomes
bull Health disease quantitative traits ndash Genomics regions disease mechanism drug targets ndash Protein-coding cracking regulatory code variation ndash Single genes systems gene interactions pathways
bull Human ancestry ndash Resolve all of human ancestral relationships ndash Complete history of all migrations selective events ndash Resolve common inheritance vs trait association
bull Whatrsquos missing is the computation ndash New algorithms machine learning dimensionality reduction ndash Individualized treatment from 1000s genes genome ndash Understand missing heritability ndash Reveal co-evolution between geneselements ndash Correct for modulating effects in GWAS
110
Challenge ahead From research to clinic 1 Systematic medical genotyping sequencing
ndash Currently a curiosity future medical practice
2 Systematic medical molecular profiling
ndash Functional genomics in relevant cell types
3 Systematic perturbation studies for validation
ndash 1000s of regulatory predictions x 100s cell types
4 Systematic repurposing of approved drugs
ndash Systems-biology view of drug response
5 Genomics of drug response in cli nical trials
ndash Personalized drug prescription and combinations
6 Partnerships academia industry hospitals
ndash Interdisciplinary training in each of the instituttions 111
Summary Personalized amp Predictive Medicine 1 Intro to Epidemiology basis of human disease 2 Genetic Epidemiology
ndash Genetic basis GWAS and screening ndash Interpreting GWAS with functional genomics ndash Calculating functional enrichments for GWAS loci
3 Molecular epidemiology ndash meQTLs Genotype-Epigenome association (cis-trans-) ndash EWAS Epigenome-Disease association
4 Resolving Causality ndash Statistical Mendelian Randomization ndash Application to genotype + methylation in AD
5 Systems Genomics and Epigenomics of disease ndash Beyond single loci polygenic risk prediction models ndash Sub-threshold loci and somatic heterogeneity in cancer
112
MIT OpenCourseWarehttpocwmitedu
6047 6878 HST507 Computational BiologyFall 2015
For information about citing these materials or our Terms of Use visit httpocwmiteduterms

1
Basic setup of polygenic risk prediction studies Case-control cohort w genotype + phenotype
Training cohort Testing cohort
Selection of SNPs Estimation of effects Ranking
Apply predictor Evaluate accuracy
Apply predictor w estimated confidence
Target cohort genotyped individuals
(no phenotypes)
1
(power matters) (power matters) (power limited to one individual at a time)
2
bull Applications 1 (testing cohort) ndash Understand total heritability captured in common variants
ndash Understand disease ldquoarchitecturerdquo number of SNPs ndash Recognize functional classes associated with weak genetic associations
bull Applications 2 2 (new individuals) ndash Provide health recommendations at the individual level
ndash Prioritize high-risk individuals for subsequent testing at population level 88
How many SNPs to include in model
scor
ec
nige
ly p
ohe
of t
ue
-val
Pct
ed
peex
Dudridge PLoS Genetics 2013 pi0Proportion of markers with no effect Purcell Nature 2009
Schizophrenia risk prediction
lsquoonly 5 matterrsquo
lsquoonly 10 matterrsquo(but still canrsquot tellWhich ones until lsquoall matterrsquo Full rank list)
inclusion threshold copy source unknown All rights reserved This content is excluded from our CreativeCommons license For more information see httpocwmiteduhelpfaq-fair-use
bull It depends on ndash Architecture Fraction of SNPs that are estimated to be functional ndash Power Number of individuals in cohort ie ability to rank correctly It only peaks at 5 (asymp1-pi0) when sufficient power to rank ndash Large fraction of associated markers are hidden within non-significant SNPs
bull
bull For pi0=090 still need to include all SNPs to maximize predictive power 89
Application to pleiotropy and common risk Trait 1 (schizophrenia) Case-control cohort w genotype + phenotype
Selection of SNPs Estimation of effects Ranking
Apply predictor Evaluate accuracy
Trait 2 (bipolar disorder) Case-control cohort w genotype + phenotype
bull Ability to assess common genetic risk Are the highly-ranked SNPs for one study relevant to a different study
Is there a shared genetic architecture between seemingly unrelated traits
irst use showed schizophrenia and bipolar disorder common risk Schizophrenia-ranked SNPs in one cohortlt
lt are predictive of bipolar disorder diagnosis lt but not predictive of unrelated (cardiovascular) traits
ndashndash
bull Fndashndashndash
90
Important pointscaveats for risk prediction bull Always limited by genetic component
ndash Environment random effects play big role for most traits
bull Mendelian=deterministic vs common variants=probic
ndash Only a first screen for individuals at risk
bull Limited by discovery power
ndash Cohort size limits discriminative power and ranking ability
bull Limited by genotyped SNPvs vs all SNPs
ndash Selection pushes fitness-reducing variants to lower freq
ndash Genotyped SNPs selected to be common
bull Even if SNPs are correctly id entified their effects are not
ndash Winnerrsquos curse over-estimate above-threshold true effect
bull Training and testing cohort non-independence
ndash Relatives cryptic relatedness population stratification inflate est 91
91
Goal Personalized and Predictive Medicine 1 Intro to Epidemiology basis of human disease 2 Genetic Epidemiology
ndash Genetic basis GWAS and screening ndash Interpreting GWAS with functional genomics ndash Calculating functional enrichments for GWAS loci
3 Molecular epidemiology ndash meQTLs Genotype-Epigenome association (cis-trans-) ndash EWAS Epigenome-Disease association
4 Resolving Causality ndash Statistical Mendelian Randomization ndash Application to genotype + methylation in AD
5 Systems Genomics and Epigenomics of disease ndash Beyond single loci polygenic risk prediction models ndash Sub-threshold loci and somatic heterogeneity in cancer
92
This talk From loci to mechanisms
Building a reference map of the regulatory genome Enhancers Promoters Transcribed Repressed
Regions Enhancers promoters transcribed repressed Cell types Predict tissues and cell types of epigenomic act ivity Target genes Link variants to their target genes using eQTLs activity Hi-C Nucleotides Regulatory consequence of mutation Conservation PWMs Regulators Upstream regulators whose activity is disrupted by mutation
Application to GWAS hidden heritability and Cancer GWAS CATGCCTG bull 93 top hits non-coding Mechanism Cell type hits CGTGTCTA bull Lie in haplotype blocks Causal variant(s)
lsquoHiddenrsquo CATGCCTG bull Many variants small effects Pathway-level burdenload heritability CGTGTCTA bull Many false positives Prioritize w regulatory annotations
Cancer bull s of function CATGCCTG Los Protein-coding variants convergence mutations CATCCCTG bull Gain of function Regulatory variants heterogeneity
93
Characterizing sub-threshold variants in heart arrhythmia
copy source unknown All rights reservedThiscontent is excluded from our Creative
Commons license For more information see
httpocwmiteduhelpfaq-fair-use
Focus on sub-threshold variants
(eg rs1743292 P=10-42)
Trait QRSQT interval
(1) Large cohorts (2) many known hits (3) well-characterized tissue drivers 94
From Arking D E Pulit S L Crotti L Harst P V Munroe P BKoopmann T T Newton-Cheh C (2014) Genetic associationstudy of QT interval highlights role for calcium myocardial repolarizationNature Genetics Nat Genet 46(8) 826-836 Used with permission
Enhancers overlapping GWAS loci share functional properties
copy source unknown All rights reserved This content is excluded from our CreativeCommons license For more information see httpocwmiteduhelpfaq-fair-use
Train machine learning model to prioritize sub-threshold loci 95
Functional evidence for sub-threshold target genes
Zebrafish phenotypes Human genetics
copy source unknown All rights reserved This content is excluded from our CreativeCommons license For more information see httpocwmiteduhelpfaq-fair-use
Mouse phenotypes 96
Experimental validation of 11 sub-threshold loci
copy source unknown All rights reserved This content is excluded from our CreativeCommons license For more information see httpocwmiteduhelpfaq-fair-use
9 of 11 tested loci show allelic activity chromatin interactions
97
Functional evidence for rs1743292 causality (P=10-42)
Enhancer 4C links to target gene promoters Heart enhancer activity
Motif disruption Allelic DNase in multiple individuals copy source unknown All rights reserved This content is excluded from our CreativeCommons license For more information see httpocwmiteduhelpfaq-fair-use Allelic enha-
ncer activity 98
Target gene impact on heart conduction
Optical voltage mapping
zebrafish embryo hearts voltage-sensitive fluorescent dye
ventricle
atrium
transmembrane voltage (ventricle)
copy source unknown All rights reserved This content is excludedfrom our Creative Commons license For more information seehttpocwmiteduhelpfaq-fair-use
Detection and validation of a new cardiac locus
99
What would we need to discover rs1743292 without epigenomics
rs1743292 Minor allele frequency 0134
Effect size -05773 +- 017 msec With 68900 individuals 128 power to discover at plt5x10-8
bull rs1743292 has similar effect sizes as many genome-wide significant variants
bull Many GWAS variants discovered due to winnerrsquos curse often only have 5-
20 power to discover
bull Combining epigenomics and GWAS can
1 Confirm existing GWAS loci are real
2 Discover new sub-threshold loci with weak effect sizes low power
To reach 80 power to discover rs1743292 at plt5x10-8 we need 146700 individuals
100
Goal Personalized and Predictive Medicine 1 Intro to Epidemiology basis of human disease
enetic Epidemiology Genetic basis GWAS and screening Interpreting GWAS with functional genomics Calculating functional enrichments for GWAS loci
olecular epidemiology meQTLs Genotype-Epigenome association (cis-trans-) EWAS Epigenome-Disease association
esolving Causality Statistical Mendelian Randomization Application to genotype + methylation in AD
ystems Genomics and Epigenomics of disease Beyond single loci polygenic risk prediction models Sub-threshold loci and somatic heterogeneity in cancer
2 Gndash ndash ndash
3 Mndash ndash
4 Rndash ndash
5 Sndash ndash
101
This talk From loci to mechanisms
Building a reference map of the regulatory genome Enhancers Promoters Transcribed Repressed
Regions Enhancers promoters transcribed repressed Cell types Predict tissues and cell types of epigenomic act ivity Target genes Link variants to their target genes using eQTLs activity Hi-C Nucleotides Regulatory consequence of mutation Conservation PWMs Regulators Upstream regulators whose activity is disrupted by mutation
Application to GWAS hidden heritability and Cancer GWAS CATGCCTG bull 93 top hits non-coding Mechanism Cell type hits CGTGTCTA bull Lie in haplotype blocks Causal variant(s)
lsquoHiddenrsquo CATGCCTG bull Many variants small effects Pathway-level burdenload heritability CGTGTCTA bull Many false positives Prioritize w regulatory annotations
Cancer function CATGCCTG bull Loss of Protein-coding variants convergence mutations CATCCCTG bull Gain of function Regulatory variants heterogeneity
102
Regulatory convergence of dispersed driver mutations
copy source unknown All rights reserved This content is excluded from our CreativeCommons license For more information see httpocwmiteduhelpfaq-fair-use
Common mutations in regulatory plexus of each gene Richard Sallari 103
Cancer genes are more likely to be up-regulated
copy source unknown All rights reserved This content is excluded from our CreativeCommons license For more information see httpocwmiteduhelpfaq-fair-use
Richard Sallari 104
Dysregulated genes show dispersed non-coding mutations
copy source unknown All rights reserved This content is excluded from our CreativeCommons license For more information see httpocwmiteduhelpfaq-fair-use
Dysregulated genes are enriched for plexus mutations at all distances Richard Sallari 105
Non-coding mutations enriched in promoters enhancers active in other cell types
copy source unknown All rights reserved This content is excluded from our CreativeCommons license For more information see httpocwmiteduhelpfaq-fair-use
Disruptive mutations in lsquolowrsquo elements are enriched in enhancers and promoters in other tissues
Richard Sallari 106
Statistical model for excess of raresomatic variants
copy source unknown All rights reserved This content is excluded from our CreativeCommons license For more information see httpocwmiteduhelpfaq-fair-use
bullCorrect for region- state- tumor-specific rate variation 107
Convergence in immune signaling mitoch functions
copy source unknown All rights reserved This content is excluded from our CreativeCommons license For more information see httpocwmiteduhelpfaq-fair-use
bullPathway-level convergence hierarchical model 108
Richard Sallari
Non-coding drivers of prostate cancer dysregulation
Regulatory mutations reveal Convergence in immune signaling new cancer driver genes
mitochondrial functions
copy source unknown All rights reserved This content is excluded from our CreativeCommons license For more information see httpocwmiteduhelpfaq-fair-use
Convergence in inositol phosphate metabolism PLCB4 overexpression in PC3 prostate cancer adjacent to PTEN PIK3CA known cancer genes reduces ErkAkt activity synergistic with PTEN
109
Personal genomics tomorrow Already 100000s of complete genomes
bull Health disease quantitative traits ndash Genomics regions disease mechanism drug targets ndash Protein-coding cracking regulatory code variation ndash Single genes systems gene interactions pathways
bull Human ancestry ndash Resolve all of human ancestral relationships ndash Complete history of all migrations selective events ndash Resolve common inheritance vs trait association
bull Whatrsquos missing is the computation ndash New algorithms machine learning dimensionality reduction ndash Individualized treatment from 1000s genes genome ndash Understand missing heritability ndash Reveal co-evolution between geneselements ndash Correct for modulating effects in GWAS
110
Challenge ahead From research to clinic 1 Systematic medical genotyping sequencing
ndash Currently a curiosity future medical practice
2 Systematic medical molecular profiling
ndash Functional genomics in relevant cell types
3 Systematic perturbation studies for validation
ndash 1000s of regulatory predictions x 100s cell types
4 Systematic repurposing of approved drugs
ndash Systems-biology view of drug response
5 Genomics of drug response in cli nical trials
ndash Personalized drug prescription and combinations
6 Partnerships academia industry hospitals
ndash Interdisciplinary training in each of the instituttions 111
Summary Personalized amp Predictive Medicine 1 Intro to Epidemiology basis of human disease 2 Genetic Epidemiology
ndash Genetic basis GWAS and screening ndash Interpreting GWAS with functional genomics ndash Calculating functional enrichments for GWAS loci
3 Molecular epidemiology ndash meQTLs Genotype-Epigenome association (cis-trans-) ndash EWAS Epigenome-Disease association
4 Resolving Causality ndash Statistical Mendelian Randomization ndash Application to genotype + methylation in AD
5 Systems Genomics and Epigenomics of disease ndash Beyond single loci polygenic risk prediction models ndash Sub-threshold loci and somatic heterogeneity in cancer
112
MIT OpenCourseWarehttpocwmitedu
6047 6878 HST507 Computational BiologyFall 2015
For information about citing these materials or our Terms of Use visit httpocwmiteduterms

This talk From loci to mechanisms
Building a reference map of the regulatory genome Enhancers Promoters Transcribed Repressed
Regions Enhancers promoters transcribed repressed Cell types Predict tissues and cell types of epigenomic act ivity Target genes Link variants to their target genes using eQTLs activity Hi-C Nucleotides Regulatory consequence of mutation Conservation PWMs Regulators Upstream regulators whose activity is disrupted by mutation
Application to GWAS hidden heritability and Cancer GWAS CATGCCTG bull 93 top hits non-coding Mechanism Cell type hits CGTGTCTA bull Lie in haplotype blocks Causal variant(s)
lsquoHiddenrsquo CATGCCTG bull Many variants small effects Pathway-level burdenload heritability CGTGTCTA bull Many false positives Prioritize w regulatory annotations
Cancer bull s of function CATGCCTG Los Protein-coding variants convergence mutations CATCCCTG bull Gain of function Regulatory variants heterogeneity
93
Characterizing sub-threshold variants in heart arrhythmia
copy source unknown All rights reservedThiscontent is excluded from our Creative
Commons license For more information see
httpocwmiteduhelpfaq-fair-use
Focus on sub-threshold variants
(eg rs1743292 P=10-42)
Trait QRSQT interval
(1) Large cohorts (2) many known hits (3) well-characterized tissue drivers 94
From Arking D E Pulit S L Crotti L Harst P V Munroe P BKoopmann T T Newton-Cheh C (2014) Genetic associationstudy of QT interval highlights role for calcium myocardial repolarizationNature Genetics Nat Genet 46(8) 826-836 Used with permission
Enhancers overlapping GWAS loci share functional properties
copy source unknown All rights reserved This content is excluded from our CreativeCommons license For more information see httpocwmiteduhelpfaq-fair-use
Train machine learning model to prioritize sub-threshold loci 95
Functional evidence for sub-threshold target genes
Zebrafish phenotypes Human genetics
copy source unknown All rights reserved This content is excluded from our CreativeCommons license For more information see httpocwmiteduhelpfaq-fair-use
Mouse phenotypes 96
Experimental validation of 11 sub-threshold loci
copy source unknown All rights reserved This content is excluded from our CreativeCommons license For more information see httpocwmiteduhelpfaq-fair-use
9 of 11 tested loci show allelic activity chromatin interactions
97
Functional evidence for rs1743292 causality (P=10-42)
Enhancer 4C links to target gene promoters Heart enhancer activity
Motif disruption Allelic DNase in multiple individuals copy source unknown All rights reserved This content is excluded from our CreativeCommons license For more information see httpocwmiteduhelpfaq-fair-use Allelic enha-
ncer activity 98
Target gene impact on heart conduction
Optical voltage mapping
zebrafish embryo hearts voltage-sensitive fluorescent dye
ventricle
atrium
transmembrane voltage (ventricle)
copy source unknown All rights reserved This content is excludedfrom our Creative Commons license For more information seehttpocwmiteduhelpfaq-fair-use
Detection and validation of a new cardiac locus
99
What would we need to discover rs1743292 without epigenomics
rs1743292 Minor allele frequency 0134
Effect size -05773 +- 017 msec With 68900 individuals 128 power to discover at plt5x10-8
bull rs1743292 has similar effect sizes as many genome-wide significant variants
bull Many GWAS variants discovered due to winnerrsquos curse often only have 5-
20 power to discover
bull Combining epigenomics and GWAS can
1 Confirm existing GWAS loci are real
2 Discover new sub-threshold loci with weak effect sizes low power
To reach 80 power to discover rs1743292 at plt5x10-8 we need 146700 individuals
100
Goal Personalized and Predictive Medicine 1 Intro to Epidemiology basis of human disease
enetic Epidemiology Genetic basis GWAS and screening Interpreting GWAS with functional genomics Calculating functional enrichments for GWAS loci
olecular epidemiology meQTLs Genotype-Epigenome association (cis-trans-) EWAS Epigenome-Disease association
esolving Causality Statistical Mendelian Randomization Application to genotype + methylation in AD
ystems Genomics and Epigenomics of disease Beyond single loci polygenic risk prediction models Sub-threshold loci and somatic heterogeneity in cancer
2 Gndash ndash ndash
3 Mndash ndash
4 Rndash ndash
5 Sndash ndash
101
This talk From loci to mechanisms
Building a reference map of the regulatory genome Enhancers Promoters Transcribed Repressed
Regions Enhancers promoters transcribed repressed Cell types Predict tissues and cell types of epigenomic act ivity Target genes Link variants to their target genes using eQTLs activity Hi-C Nucleotides Regulatory consequence of mutation Conservation PWMs Regulators Upstream regulators whose activity is disrupted by mutation
Application to GWAS hidden heritability and Cancer GWAS CATGCCTG bull 93 top hits non-coding Mechanism Cell type hits CGTGTCTA bull Lie in haplotype blocks Causal variant(s)
lsquoHiddenrsquo CATGCCTG bull Many variants small effects Pathway-level burdenload heritability CGTGTCTA bull Many false positives Prioritize w regulatory annotations
Cancer function CATGCCTG bull Loss of Protein-coding variants convergence mutations CATCCCTG bull Gain of function Regulatory variants heterogeneity
102
Regulatory convergence of dispersed driver mutations
copy source unknown All rights reserved This content is excluded from our CreativeCommons license For more information see httpocwmiteduhelpfaq-fair-use
Common mutations in regulatory plexus of each gene Richard Sallari 103
Cancer genes are more likely to be up-regulated
copy source unknown All rights reserved This content is excluded from our CreativeCommons license For more information see httpocwmiteduhelpfaq-fair-use
Richard Sallari 104
Dysregulated genes show dispersed non-coding mutations
copy source unknown All rights reserved This content is excluded from our CreativeCommons license For more information see httpocwmiteduhelpfaq-fair-use
Dysregulated genes are enriched for plexus mutations at all distances Richard Sallari 105
Non-coding mutations enriched in promoters enhancers active in other cell types
copy source unknown All rights reserved This content is excluded from our CreativeCommons license For more information see httpocwmiteduhelpfaq-fair-use
Disruptive mutations in lsquolowrsquo elements are enriched in enhancers and promoters in other tissues
Richard Sallari 106
Statistical model for excess of raresomatic variants
copy source unknown All rights reserved This content is excluded from our CreativeCommons license For more information see httpocwmiteduhelpfaq-fair-use
bullCorrect for region- state- tumor-specific rate variation 107
Convergence in immune signaling mitoch functions
copy source unknown All rights reserved This content is excluded from our CreativeCommons license For more information see httpocwmiteduhelpfaq-fair-use
bullPathway-level convergence hierarchical model 108
Richard Sallari
Non-coding drivers of prostate cancer dysregulation
Regulatory mutations reveal Convergence in immune signaling new cancer driver genes
mitochondrial functions
copy source unknown All rights reserved This content is excluded from our CreativeCommons license For more information see httpocwmiteduhelpfaq-fair-use
Convergence in inositol phosphate metabolism PLCB4 overexpression in PC3 prostate cancer adjacent to PTEN PIK3CA known cancer genes reduces ErkAkt activity synergistic with PTEN
109
Personal genomics tomorrow Already 100000s of complete genomes
bull Health disease quantitative traits ndash Genomics regions disease mechanism drug targets ndash Protein-coding cracking regulatory code variation ndash Single genes systems gene interactions pathways
bull Human ancestry ndash Resolve all of human ancestral relationships ndash Complete history of all migrations selective events ndash Resolve common inheritance vs trait association
bull Whatrsquos missing is the computation ndash New algorithms machine learning dimensionality reduction ndash Individualized treatment from 1000s genes genome ndash Understand missing heritability ndash Reveal co-evolution between geneselements ndash Correct for modulating effects in GWAS
110
Challenge ahead From research to clinic 1 Systematic medical genotyping sequencing
ndash Currently a curiosity future medical practice
2 Systematic medical molecular profiling
ndash Functional genomics in relevant cell types
3 Systematic perturbation studies for validation
ndash 1000s of regulatory predictions x 100s cell types
4 Systematic repurposing of approved drugs
ndash Systems-biology view of drug response
5 Genomics of drug response in cli nical trials
ndash Personalized drug prescription and combinations
6 Partnerships academia industry hospitals
ndash Interdisciplinary training in each of the instituttions 111
Summary Personalized amp Predictive Medicine 1 Intro to Epidemiology basis of human disease 2 Genetic Epidemiology
ndash Genetic basis GWAS and screening ndash Interpreting GWAS with functional genomics ndash Calculating functional enrichments for GWAS loci
3 Molecular epidemiology ndash meQTLs Genotype-Epigenome association (cis-trans-) ndash EWAS Epigenome-Disease association
4 Resolving Causality ndash Statistical Mendelian Randomization ndash Application to genotype + methylation in AD
5 Systems Genomics and Epigenomics of disease ndash Beyond single loci polygenic risk prediction models ndash Sub-threshold loci and somatic heterogeneity in cancer
112
MIT OpenCourseWarehttpocwmitedu
6047 6878 HST507 Computational BiologyFall 2015
For information about citing these materials or our Terms of Use visit httpocwmiteduterms
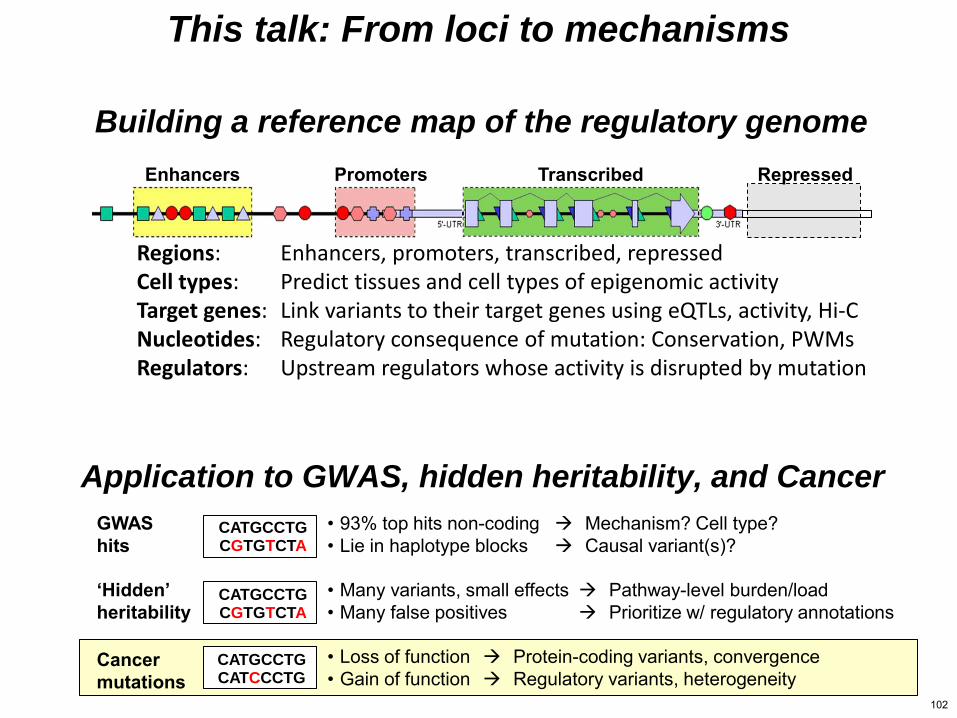
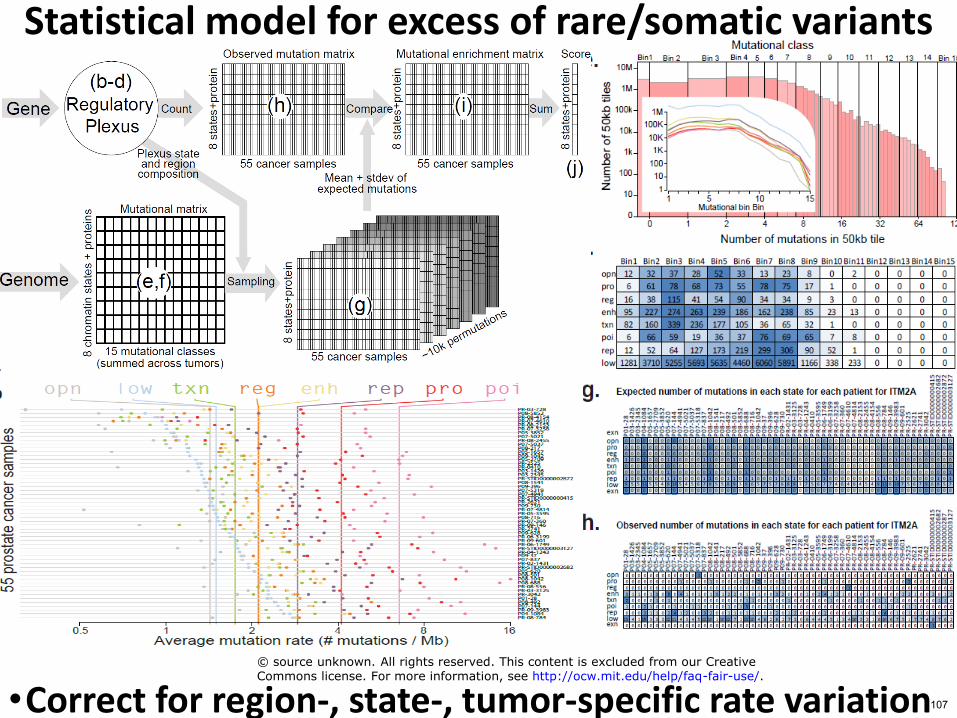
MIT OpenCourseWarehttpocwmitedu
6047 6878 HST507 Computational BiologyFall 2015
For information about citing these materials or our Terms of Use visit httpocwmiteduterms