6.0 costs and benefits of storm water bmps - us - us … costs and benefits of storm water bmps ......
TRANSCRIPT

6 - 1
6.0 Costs and Benefits of Storm Water BMPs
Storm water best management practices (BMPs) are the primary tool to improve thequality of urban streams and meet the requirements of NPDES permits. They include both thestructural and non-structural options reviewed in Section 5.2 of this report. Some BMPs canrepresent a significant cost to communities, but these costs should be weighed against the variousbenefits they provide. This chapter will focus on reviewing available data on the costs andpotential benefits of both structural and non-structural BMPs designed to improve the quality ofurban and urbanizing streams, and the larger water bodies to which they drain.
As described in previous chapters, storm water runoff can contribute loadings of nutrients,metals, oil and grease, and litter that result in impairment of local water bodies. The extent towhich these impairments are eliminated by BMPs will depend on a number of factors, includingthe number, intensity, and duration of wet weather events; BMP construction and maintenanceactivities; and the site-specific water quality and physical conditions. Because these factors willvary substantially from site to site, data and information are not available with which to developdollar estimates of costs and benefits for individual types of BMPs. However, EPA’s nationalestimates of costs and benefits associated with implementation of the NPDES Phase II rule arediscussed in Section 6.4.
6.1 Structural BMP Costs
The term structural BMPs, often referred to as “Treatment BMPs,” refers to physicalstructures designed to remove pollutants from storm water runoff, reduce downstream erosion,provide flood control and promote groundwater recharge. In contrast with non-structural BMPs,structural measures include some engineering design and construction.
Structural BMPs evaluated in this report include:
• Retention Basins• Detention Basins• Constructed Wetlands• Infiltration Practices• Filters• Bioretention• Biofilters (swales and filter strips).
The two infiltration systems focused on in this report are infiltration trenches andinfiltration basins. Although bioretention can serve as a filtering system or infiltration practice, itis discussed separately because it has separate cost data and design criteria. In this report, wetswales are assumed to have the same cost as biofilters, because there are little cost data availableon this practice. Additional information about these structural BMPs, including descriptions,applicability and performance data can be found in Chapter 5 of this report. Other BMPs include

4 Land cost is the largest variable influencing overall BMP cost.
6 - 2
experimental and proprietary products, as well as some conventional structures such as waterquality inlets. They are not included in this analysis because sufficient data are not available tosupport either the performance or the cost of these practices.
6.1.1 Base Capital Costs
The base capital costs refer primarily to the cost of constructing the BMP. This mayinclude the cost of erosion and sediment control during construction. The costs of design,geotechnical testing, legal fees, land costs, and other unexpected or additional costs are notincluded in this estimate. The cost of constructing any BMP is variable and depends largely onsite conditions and drainage area. For example, if a BMP is constructed in very rocky soils, theincreased excavation costs may substantially increase the cost of construction. Also, landacquisition costs vary greatly from site to site.4 In addition, designs vary slightly among BMPtypes. A wet pond may be designed with or without various levels of landscaping, for example. The data in Table 6-1 represent typical unit costs (dollars per cubic foot of treated water volume)from various studies, and should be considered planning level. In the case of retention anddetention basins, ranges are used to reflect the economies of scale involved in designing theseBMPs.

6 - 3
Table 6-1. Typical Base Capital Construction Costs for BMPs
BMPType
TypicalCost*($/cf)
Notes Source
Retention andDetentionBasins
0.50-1.00
Cost range reflects economies of scale in designingthis BMP. The lowest unit cost represents approx.150,000 cubic feet of storage, while the highest isapprox. 15,000 cubic feet. Typically, dry detentionbasins are the least expensive design options amongretention and detention practices.
Adapted fromBrown andSchueler (1997b)
ConstructedWetland
0.60-1.25
Although little data are available to assess the cost ofwetlands, it is assumed that they are approx. 25%more expensive (because of plant selection andsediment forebay requirements) than retentionbasins..
Adapted fromBrown andSchueler (1997b)
InfiltrationTrench
4.00 Represents typical costs for a 100-foot long trench.Adapted fromSWRPC (1991)
InfiltrationBasin
1.30Represents typical costs for a 0.25-acre infiltrationbasin.
Adapted fromSWRPC (1991)
Sand Filter 3.00-6.00
The range in costs for sand filter construction islargely due to the different sand filter designs. Of thethree most common options available, perimeter sandfilters are moderate cost whereas surface sand filtersand underground sand filters are the most expensive.
Adapted fromBrown andSchueler (1997b)
Bioretention 5.30Bioretention is relatively constant in cost, because itis usually designed as a constant fraction of the totaldrainage area.
Adapted fromBrown andSchueler (1997b)
GrassSwale
0.50Based on cost per square foot, and assuming 6 inchesof storage in the filter.
Adapted fromSWRPC (1991)
Filter Strip 0.00-1.30
Based on cost per square foot, and assuming 6 inchesof storage in the filter strip. The lowest cost assumesthat the buffer uses existing vegetation, and thehighest cost assumes that sod was used to establishthe filter strip.
Adapted fromSWRPC (1991)
* Base year for all cost data: 1997
In some ways there is no such value as the “average” construction cost for some BMPs,because many BMPs can be designed for widely varying drainage areas. However, there is some

6 - 4
value in assessing the cost of a typical application of each BMP. The data in Table 6-2 reflectbase capital costs for typical applications of each category of BMP. It is important to note that,since many BMPs have economies of scale, it is not practical to extrapolate these values to largeror smaller drainage areas in many cases.
Table 6-2. Base Costs of Typical Applications of Storm Water BMPs1
BMP TypeTypical Cost
($/BMP)Application Data Source
RetentionBasin
$100,00050-Acre Residential Site(Impervious Cover =35%)
Adapted from Brown and Schueler (1997b)
Wetland $125,00050-Acre Residential Site(Impervious Cover =35%)
Adapted from Brown and Schueler (1997b)
InfiltrationTrench
$45,0005-Acre Commercial Site(Impervious Cover =65%)
Adapted from SWRPC(1991)
InfiltrationBasin
$15,0005-Acre Commercial Site(Impervious Cover =65%)
Adapted from SWRPC(1991)
Sand Filter$35,000-$70,0002,3
5-Acre Commercial Site(Impervious Cover =65%)
Adapted from Brown andSchueler (1997b)
Bioretention $60,0005-Acre Commercial Site(Impervious Cover =65%)
Adapted from Brown andSchueler (1997b)
Grass Swale $3,5005-Acre Residential Site(Impervious Cover =35%)
Adapted from SWRPC(1991)
Filter Strip $0-$9,00035-Acre Residential Site(Impervious Cover =35%)
Adapted from SWRPC(1991)
1. Base costs do not include land costs.2. Total capital costs can typically be determined by increasing these costs by approximately 30%.3. A range is given to account for design variations.

6 - 5
Although various manuals report construction cost estimates for storm water ponds, EPAhas identified only three studies that have systematically evaluated the construction costsassociated with structural BMPs since 1985. The three studies used slightly different estimationprocedures. Two of these studies were conducted in the Washington, DC region and used asimilar methodology (Wiegand et al, 1986; Brown and Schueler, 1997b). In both studies, thecosts were determined based on engineering estimates of construction costs from actual BMPsthroughout the region. In the third study, conducted in Southeastern Wisconsin, costs weredetermined using standardized cost data for different elements of the BMP, and assumptions ofBMP design (SWRPC, 1991).
Any costs reported in the literature need to be adjusted for inflation and regionaldifferences. All costs reported in this report assume a 3 percent annual inflation rate. In addition,studies are adjusted to the “twenty cities average” construction cost index, to adjust for regionalbiases, based on a methodology followed by the American Public Works Association (APWA,1992). Using EPA’s rainfall zones (see Figure 6-1), a cost adjustment factor is assigned to eachzone (Table 6-3). For example, rainfall region 1 has a factor of 1.12. Thus, all studies in theNortheastern United States are divided by 1.12 in order to adjust for this bias.
Table 6-3. Regional Cost Adjustment Factors
Rainfall Zone 1 2 3 4 5 6 7 8 9
AdjustmentFactor
1.12 0.90 0.67 0.92 0.67 1.24 1.04 1.04 0.76
Source: Modified from APWA, 1992

6 - 6
Figure 6-1. Rainfall Zones of the United States
Not shown: Alaska (Zone 7); Hawaii (Zone 7); Northern Mariana Islands (Zone 7); Guam (Zone7); American Samoa (Zone 7); Trust Territory of the Pacific Islands (Zone 7); Puerto Rico (Zone3) Virgin Islands (Zone 3).Source: NPDES Phase I regulations, 40 CFR Part 122, Appendix E (US EPA, 1990)
6.1.1.1 Retention/Detention Basins and Constructed Wetlands
The total volume of the basin is generally a strong predictor of cost (Table 6-4). Thereare some economies of scale associated with constructing these systems, as evidenced by theslope of the volume equations derived. This is largely because of the costs of inlet and outletdesign, and mobilization of heavy equipment that are relatively similar regardless of basin size.
Erosion and sediment control represents only about 5 percent of the construction cost ofbasins and wetlands (Brown and Schueler, 1997b). Thus, the construction cost estimatespresented in Table 6-2 are comparable. The cost of building storm water retention and detentionsystems has increased since 1986 (Figure 6-2), even after adjusting for inflation. Part of thereason for this increase is thought to be attributable to the improved design of these systems toenhance water quality driven by a more complex regulatory and review environment (Brown andSchueler, 1997b). The cost estimations made by SWRPC (1991) were generally a mid-rangebetween the earlier and more recent studies.

6 - 7
Table 6-4. Base Capital Costs for Storm Water Ponds and Wetlands
BMPType
Cost Equation or EstimateCosts Included
SourceConstruc-tion
E&SControl
RetentionBasinsandWetlands
7.75V0.75 U U Wiegand et al, 1986
18.5V0.70 UBrown and Schueler,1997b
DetentionBasins
7.47V0.78 U UBrown and Schueler,1997b
RetentionBasins
1.06V: 0.25 acre retention basin(23,300 cubic feet)
U SWRPC, 1991
0.43V: 1.0 acre retention basin(148,000 cubic feet)
0.33V: 3.0 acre retention basin(547,000 cubic feet)
0.31V: 5.0 acre retention basin(952,000 cubic feet)
NotesV refers to the total basin volume in cubic feetCosts presented from SWRPC (1991) are “moderate” costs reported in that study.

6 - 8
Figure 6-2. Retention Basin Construction Cost
6.1.1.2 Infiltration Practices
Costs for infiltration BMPs are highly variable from site to site, depending on soils andother geotechnical information. Perhaps because of this variability, cost estimates for infiltrationtrenches have been widely different (Table 6-5; Figure 6-3). Brown and Schueler (1997b)concluded that the Wiegand (1986) equation underestimated cost, partially because of the lack ofpretreatment in earlier designs, although they were unable to develop a consistent equation due toa small sample size.
It is difficult to estimate the cost of infiltration basins, mainly due to a lack of recent costdata. The costs estimates for SWRPC are dramatically higher than those estimated by Schueler,1987 (Figure 6-4). This is largely because the SWRPC document assumes that 50 percent

6 - 9
additional volume is excavated for the spillway, while Schueler uses a retention basin costequation.
Table 6-5. Base Capital Costs for Infiltration Practices
BMPType
Cost Equation or Estimate4
Costs IncludedSourceConstruc-
tionE&S
Control
InfiltrationTrenches1
33.7V0.63 U Wiegand et al, 1986
2V to 4V; average of 2.5V U Brown and Schueler, 1997b
$4,400: 3-foot deep, 4-footwide, 100-foot long trench
U SWRPC, 1991$10,400: 6-foot deep, 10-footwide, 100-foot long trench
3.9V+2,900: 3-foot deep, 100-foot long trench
UModified from SWRPC,1991
InfiltrationBasins2
13.2V0.69 U USchueler, 1987; Modifiedfrom Wiegand et al, 1986
1.3V: 0.25-acre infiltrationbasin (15,000 cubic feet)
U SWRPC, 19910.8V: 1.0-acre infiltration basin(76,300 cubic feet)
PorousPavement3
50,000A U SWRPC, 1991
80,000A U Schueler, 1987
1. V for infiltration trenches refers to the treatment volume (cubic feet) within the trench, assuming aporosity of 32%.2. V for infiltration basins refers to the total basin volume (cubic feet).3. A is the surface area in acres of porous pavement.4. Costs presented from SWRPC (1991) are “moderate” costs reported in that study.

6-10
$100
$1,000
$10,000
$100,000
100 1,000 10,000
Volume (cubic feet)
Co
st
3-foot Deep (SWRPC, 1991) Wiegand et al., 1986
Brown and Schueler, 1997b (low) Brown and Schueler, 1997b (high)
Figure 6-3. Infiltration Trench Cost

6 - 11
0 100,000 200,000 300,000 400,000 500,000 600,000
Volume (cubic feet)
0
20,000
40,000
60,000
80,000
100,000
120,000C
ost
Schueler, 1987SWRPC, 1991
Figure 6-4. Infiltration Basin Construction Cost
6.1.1.3 Sand Filters
Since sand filters have not been used as long as other BMPs, less information is availableon their cost than on most BMPs. In addition, the costs of sand filters vary significantly due tothe wide range of design criteria for sand filters (Table 6-6). Brown and Schueler (1997b) wereunable to derive a valid relationship between sand filter cost and water quality volume, with costsranging between $2 and $6 per cubic foot of water quality volume, with a mean cost of $2.50 percubic foot. The water quality volume includes the pore space in the sand filter, plus additionalstorage in the pretreatment basin.
Because of the lack of cost data, no equation referencing the economies of scale has beendeveloped. However, it appears that economies of scale do exist. For example, data from Austinindicates that the cost per acre decreased by over 80 percent for a design of a 20-acre drainagearea, when compared with a 1-acre drainage area. (Schueler, 1994a).

6 - 12
Table 6-6. Construction Costs for Various Sand Filters
Region (Design) Cost/Impervious Acre
Delaware $10,000
Alexandria, VA (Delaware) $23,500
Austin, TX ( < 2 acres) $16,000
Austin, TX ( > 5 acres) $3,400
Washington, DC (underground) $14,000
Denver, CO $30,000-$50,000
Source: Schueler, 1994a
6.1.1.4 Bioretention
Little information is available on the costs of bioretention because it is a relatively newpractice. Brown and Schueler (1997b) found consistent construction costs of approximately$5.30 per cubic foot of water quality volume for the construction cost. The water quality volumeincludes 9 inches above the surface area of the bioretention structure.
6.1.1.5 Vegetative BMPs
The two major types of vegetative BMPs include filter strips and grassed swales (alsocalled “biofilters”). The costs for these BMPs vary, and largely depend on the method used toestablish vegetation (Table 6-7).

6 - 13
Table 6-7. Base Capital Costs of Vegetative BMPs
BMPType
Cost Equation or Estimate1
Costs IncludedSourceConstruc-
tionE&S
Control
FilterStrips
Existing Vegetation: 0
U SWRPC, 1991Seed: $13,800/acre
Sod: $29,000/acre
GrassedChannels
25¢ per square foot U SWRPC, 1991
1. Costs presented from SWRPC (1991) are “moderate” costs reported in that study.
6.1.2 Design, Contingency and Permitting Costs
Most BMP cost studies assess only part of the cost of constructing a BMP, usuallyexcluding permitting fees, engineering design and contingency or unexpected costs. In general,these costs are expressed as a fraction of the construction cost (Table 6-8). These costs aregenerally only estimates, based on the experience of designers.
Table 6-8. Design, Contingency and Permitting Costs
Additional Costs Estimate(Fraction of base construction costs)
Source Comments
25%Wiegand etal, 1986
Includes design, contingencies and permittingfees
32%Brown andSchueler,1997b
Includes design, contingencies, permittingprocess and erosion and sediment control
6.1.3 Land Costs
The cost of land is extremely variable both regionally and by surrounding land use. Forexample, many suburban jurisdictions require open space allocations within the developed site,reducing the effective cost of land for BMPs to zero (Schueler, 1987). On the other hand, thecost of land may far outweigh construction and design costs in ultra-urban settings. For this

6 - 14
reason, some underground BMPs that are relatively expensive to construct may be attractive inthis “ultra-urban” setting if sub-surface conditions are suitable (Lundgren, 1996). The landconsumed per treatment volume depends largely on how much of the BMP’s treatment isunderground, and varies considerably (Table 6-9).
Table 6-9. Relative Land Consumption ofStorm Water BMPs
BMP Type Land consumption(% of Impervious Area)
Retention Basin 2-3%
ConstructedWetland
3-5%
Infiltration Trench 2-3%
Infiltration Basin 2-3%
Porous Pavement 0%
Sand Filters 0%-3%
Bioretention 5%
Swales 10%-20%
Filter Strips 100%
Note: Represents the amount of land needed as a percentof the impervious area that drains to the practice toachieve effective treatment.Source: Claytor and Schueler, 1996
6.1.4 Operation and Maintenance Costs
Maintenance can be broken down into two primary categories: aesthetic/nuisancemaintenance and functional maintenance. Functional maintenance is important for performanceand safety reasons, while aesthetic maintenance is important primarily for public acceptance ofBMPs, and because it may also reduce needed functional maintenance. Aesthetic maintenance isobviously more important for BMPs that are very visible, such as ponds and biofiltration facilities.
In most studies, operation and maintenance (O&M) costs have been estimated as apercentage of base construction costs (Table 6-10). While some BMPs require infrequent, costly

5 Maintenance costs can also vary significantly based on a variety of site- and region-specific parameters, therefore the maintenance costs presented in Table 6-10 should be consideredonly as general guidelines.
6 - 15
maintenance, others need more frequent but less costly maintenance.5 Accordingly, selection ofappropriate structural BMPs must factor in maintenance cost (and a responsible party to carry outmaintenance) to ensure the necessary long-term performance. Typical maintenance activities areincluded in Table 5-3.
Table 6-10. Annual Maintenance Costs
BMPAnnual Maintenance Cost(% of Construction Cost)
Source(s)
Retention Basins andConstructed Wetlands
3%-6%Wiegand et al, 1986 Schueler, 1987SWRPC, 1991
Detention Basins1 <1% Livingston et al, 1997;Brown and Schueler, 1997b
Constructed Wetlands1 2% Livingston et al, 1997;Brown and Schueler, 1997b
Infiltration Trench 5%-20% Schueler, 1987SWRPC, 1991
Infiltration Basin1
1%-3% Livingston et al, 1997;SWRPC, 1991
5%-10%
Wiegand et al, 1986;Schueler, 1987;SWRPC, 1991
Sand Filters1 11%-13% Livingston et al, 1997; Brown and Schueler, 1997b
Swales 5%-7% SWRPC, 1991
Bioretention 5%-7% (Assumes the same as swales)
Filter strips $320/acre (maintained) SWRPC, 1991
1. Livingston et al (1997) reported maintenance costs from the maintenance budgets of several cities,and percentages were derived from costs in other studies

6 Although these evaluations are useful for comparing potential costs of various structuralBMPs, they should not be applied for use in all areas of the country. In addition, the BMPs,selected in these examples and the sizing criteria that the costs were based on should not beconsidered as recommendations for actual BMP selection and design. They are presented solelyfor illustrative purposes.
7 “Water quality volume” refers to the volume of water that the BMP is designed to treat. For example, a BMP may be designed to capture the first inch of runoff from the drainage area. Any volume of rainfall over the first inch would bypass the BMP. Therefore water quality volumefor this BMP would be one watershed inch.
6 - 16
6.1.5 Long-Term BMP Costs: Two Scenarios
In order to compare various BMP options, costs were calculated for a 5-acre commercialsite and a 38-acre residential site.6 Construction costs were evaluated using the following steps:
1. Calculate the water quality volume (WQv).7
Using a water quality volume based on a 1-inch storm, the volume is equal to:
WQv = ( .05 + .9I ) A/12
where: WQv = Water Quality Volume (Acre-Feet)I = Impervious Fraction in the WatershedA = Watershed Area (Acres)
2. Calculate the detention storage volume.Total detention storage was determined using standard peak flow methods (USDA/NRCS,1986). Detention storage was calculated for a 5-inch storm.
3. Calculate total volume.Many BMPs do not require any detention storage, but for BMPs that do provide floodstorage, the total volume is the sum of the water quality and detention volumes calculatedin steps 1 and 2.
4. Determine the construction cost.The construction cost for each BMP is determined based on equations described inSection 6.1.1.
6 - 17
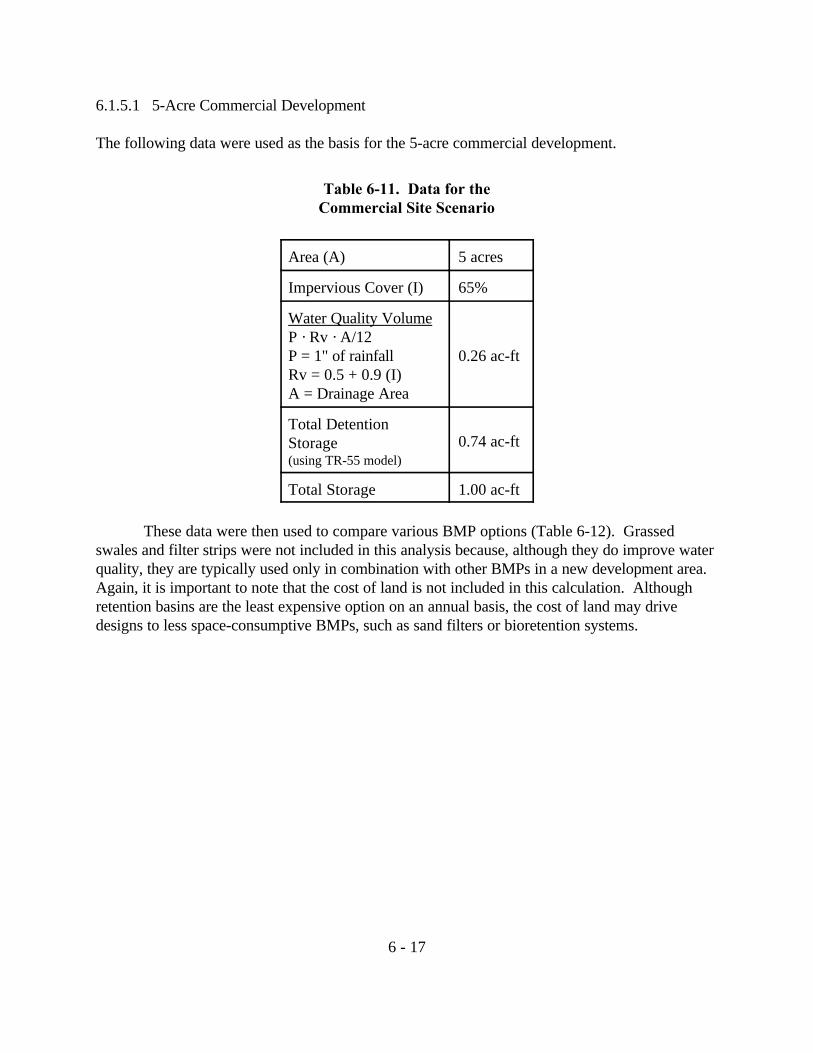
6.1.5.1 5-Acre Commercial Development
The following data were used as the basis for the 5-acre commercial development.
Table 6-11. Data for theCommercial Site Scenario
Area (A) 5 acres
Impervious Cover (I) 65%
Water Quality VolumeP · Rv · A/12P = 1" of rainfallRv = 0.5 + 0.9 (I)A = Drainage Area
0.26 ac-ft
Total DetentionStorage(using TR-55 model)
0.74 ac-ft
Total Storage 1.00 ac-ft
These data were then used to compare various BMP options (Table 6-12). Grassedswales and filter strips were not included in this analysis because, although they do improve waterquality, they are typically used only in combination with other BMPs in a new development area. Again, it is important to note that the cost of land is not included in this calculation. Althoughretention basins are the least expensive option on an annual basis, the cost of land may drivedesigns to less space-consumptive BMPs, such as sand filters or bioretention systems.

6 - 18
Table 6-12. BMP Costs for a Five Acre Commercial Development
BMPType
ConstructionCost
Equation
ConstructionCost
Typical Design,Contingency & Other
Capital Costs (30% ofConstruction Costs)
AnnualMaintenanceCosts (% of
Construction, $)
Notes Sources
RetentionBasin
18.5Vt 0.70 $32,700 $9,810 5%; $1,640
Much of the cost associated withthis BMP is the extra storage toprovide flood control and channelprotection. Ponds are very reliable.
a, b, c,d, e
InfiltrationTrench
3.9WQv
+2,900$47,100 $14,100 12%; $5,650
Although infiltration trenches aredesigned to last a long time, theyneed to be inspected and rebuiltif they become clogged.
c, d, e
InfiltrationBasin
1.3WQv $14,700 $4,410 8%; $1,180Infiltration basins require carefulsiting and design to performeffectively..
b, c, d, e
Sand Filter 4WQv $45,200 $13,600 12%; $5,420Sand filters require frequentmaintenance in order to functionlong-term.
a, e, f
Bioretention 5.30WQv $60,000 $18,000 6%; $3,600Bioretention is a relatively newBMP. Little is known about itslong-term performance.
a, d
1. WQv = Water Quality Volume, cu. ft. 2. Vt = Total Volume, cu. ft.3. Sand filter volume was estimated at 4WQv, which is slightly high, to account for the relatively small drainage area.
a. Brown and Schueler, 1997b b. Wiegand et al, 1986 c. Schueler, 1987 d. SWRPC, 1991 e. US EPA, 1993a f. Livingston et al, 1997

6 - 19
6.1.5.2 38-Acre Residential Development
The following data were used as the basis for the 38-acre residential development.
Table 6-13. Data for theResidential Site Scenario
Area (A) 38 acres
Impervious Cover (I) 36%
Water Quality Volume 1.1 ac-ft
Total Detention Storage(using TR-55 model)
2.8 ac-ft
Total Storage 3.9 ac-ft
The same analysis conducted for the commercial site was repeated for the larger site(Table 6-14). Bioretention and infiltration systems were not included in this analysis, becausethese BMPs are best applied on smaller sites. The costs of swales and filter strips were also notincluded, although they could be effectively used in combination with retention systems to providepretreatment.
6.1.6 Adjusting Costs Regionally
The cost data in these examples can be adjusted to specific zones of the country using theregional cost adjustment factors in Table 6-3. For example, if costs for Rainfall Zone 1 wereneeded, the data in Tables 6-12 or 6-14 would be multiplied by 1.12.
In addition, design variations in different regions of the country may cause prices to bechanged. For example, wetland and wet ponds may be restricted in arid regions of the country. Furthermore, while retention basins are used in semi-arid regions, they usually incorporate designvariations to improve their performance (Saunders and Gilroy, 1997). In cold regions, BMPs mayneed to be adapted to account for snowmelt treatment, deep freezes and road salt application(Oberts, 1994; Caraco and Claytor, 1997), which will cause additional changes in BMP costs.

6 - 20
Table 6-14. BMP Costs for a Thirty-Eight Acre Residential Development
BMPType
ConstructionCost Equation
ConstructionCost
Design, Contingencyand other Capital
Costs (30% ofConstruction)
Annual MaintenanceCosts (% of
Construction; $)Notes Sources
RetentionBasin
18.5Vt 0.70 $84,800 $25,400 5%; $4,240
Pond systems arerelatively easy to apply tolarge sites.
a, b, c, d, e
Sand Filter 2WQv $95,800 $28,700 12%; $11,500
Although the sand filter isused in this example,some evidence suggeststhat sand filters may besubject to clogging if usedon a site that drains arelatively perviousdrainage area such as thisone.
a, e, f
1. WQv = Water Quality Volume, cu. ft. 2. Vt = Total Volume, cu. ft.3. Sand filter volume was estimated at 2V, which is slightly low, to account for the relatively large drainage area
a. Brown and Schueler, 1997b b. Wiegand et al, 1986 c. Schueler, 1987 d. SWRPC, 1991 e. US EPA, 1993a f. Livingston et al, 1997

6 - 21
6.2 Non-Structural BMP Costs
Non-structural BMPs are management measures that prevent degradation of waterresources by preventing pollution at the source, rather than treating polluted runoff. Non-structural practices include a variety of site-specific and regional practices, including: streetsweeping, illicit connection identification and elimination, public education and outreach, land usemodifications to minimize the amount of impervious surface area, waste collection and propermaterials storage. While non-structural practices play an invaluable role in protecting surfacewaters, their costs are generally not as easily quantified as for structural BMPs. This is primarilybecause there are no “design standards” for these practices. For example, the cost of a publiceducation program may vary due to staff size. However, it is possible to identify costs associatedwith specific components of these programs based on past experience.
6.2.1 Street Sweeping
The costs of street sweeping include the capital costs of purchasing the equipment, plusthe maintenance and operational costs to operate the sweepers, as well as costs of disposing thematerials that are removed. Both equipment and operating costs vary depending on the type ofsweeper selected. There are several different options for sweepers, but the two basic choices aremechanical sweepers versus vacuum-assisted sweepers. Mechanical sweepers use brushes toremove particles from streets. Vacuum-assisted dry sweepers, on the other hand, use aspecialized brush and vacuum system in order to remove finer particles. While the equipmentcosts of mechanical sweepers are significantly higher, the total operation and maintenance costs ofvacuum sweepers can be lower (Table 6-15).
Table 6-15. Street Sweeper Cost Data
Sweeper TypeLife
(Years)PurchasePrice ($)
Operation andMaintenanceCosts ($/curb
mile)
Sources
Mechanical 5 75,000 30 Finley, 1996; SWRPC, 1991
Vacuum-assisted 8 150,000 15Satterfield, 1996; SWRPC,1991
Using these data, the cost of operating street sweepers per curb mile were developed,assuming various sweeping frequencies (Table 6-16). The following assumptions were made toconduct this analysis:
• One sweeper serves 8,160 curb miles during a year (SWRPC, 1991).

6 - 22
• The annual interest rate is 8 percent.
Table 6-16. Annualized Sweeper Costs ($/curb mile/year)
SweeperType
Sweeping Frequency
Weekly Bi-weekly MonthlyFour times
per yearTwice
per yearAnnual
Mechanical 1,680 840 388 129 65 32
Vacuum-Assisted
946 473 218 73 36 18
Modified from Finley, 1996; SWRPC, 1991; and Satterfield, 1996
6.2.2 Illicit Connection Identification and Elimination
One source of pollutants is direct connections or infiltration to the storm drain system ofwastewaters other than storm water, such as industrial wastes. These pollutants are thendischarged through the storm drain system directly to streams without receiving treatment. Theseillicit connections can be identified using visual inspection during dry weather or through the useof smoke or dye tests. Using visual inspection techniques, illicit connections can be identified forbetween $1,250 and $1,750 per square mile (Center for Watershed Protection, 1996).
6.2.3 Public Education and Outreach
Public education programs encompass many other more specific programs, such asfertilizer and pesticide management, public involvement in stream restoration and monitoringprojects, storm drain stenciling, and overall awareness of aquatic resources. All public educationprograms seek to reduce pollutant loads by changing people’s behavior. They also make thepublic aware of and gain support for programs in place to protect water resources. Mostmunicipalities have at least some educational component as a part of their program. A recentsurvey found that 30 of the 32 municipal storm water programs surveyed (94 percent) incorporatean education element and 11 programs (34 percent) mandated this element in law or regulation(Livingston et al, 1997).
The City of Seattle, with a population of approximately 535,000, has a relativelyaggressive education program, including classroom and field involvement programs. The 1997budget for some aspects of the program is included in Table 6-17. Although this does notnecessarily reflect typical effort or expenditures, it does provide information on some educationalexpenditures. These data represent only a portion of the entire annual budget.

6 - 23
Table 6-17. Public Education Costs in Seattle, Washington
Item Description 1997 Budget
Supplies for VolunteersCovers supplies for the Stewardship ThroughEnvironmental Partnership Program
$17,500
Communications Communications strategy highlighting a newlyformed program within the city
$18,000
Environmental Education Transportation costs from schools to field visits(105 schools with four trips each)
$46,500
Education Services /Field Trips
Fees for student visits to various sites$55,000
Teacher TrainingCovers the cost of training classroom teachersfor the environmental education program
$3,400
Equipment Equipment for classroom education, includingdisplays, handouts, etc.
$38,800
Water InterpretiveSpecialist: Staff
Staff to provide public information at twocreeks
$79,300
Water InterpretiveSpecialist: Equipment
Materials and equipment to support interpretivespecialist program
$12,100
Youth Conservation Corps Supports clean-up activities in creeks $210,900
Source: Washington DOE, 1997
Some unit costs for educational program components (based on two different programs) areincluded in Table 6-18.

6 - 24
Table 6-18. Unit Program Costs for Public Education Programs
Item Cost Source
Public AttitudeSurvey
$1,250-$1,750 per 1,000households
Center for Watershed Protection,1996
Flyers 10-25¢/ flyer Ferguson et al, 1997
Soil Test Kit* $10 Ferguson et al, 1997
Paint 25-30¢/SD Stencil Ferguson et al, 1997
Safety Vests forVolunteers
$2 Ferguson et al, 1997
* Includes cost of testing, but not sampling.
Although public education has the intended benefit of raising public awareness, andtherefore creating support of environmental programs, it is difficult to quantify actual pollutantreductions associated with education efforts. Public attitudes can be used as a gauge of how theseprograms perform, however. In Prince George's County, Maryland a public survey was used incombination with modeling to estimate pollutant load reductions associated with public education(Smith et al, 1994; Claytor, 1996; Figure 6-5). An initial study was conducted to estimatepollution from field application of fertilizers, and use of detergents, oil and antifreeze. Pollutantreductions were then completed assuming that 70 percent of the population complied withrecommendations of the public education program. A follow-up survey was used to assess theeffectiveness of the program. Although insufficient data were available to support a second modelrun, a follow-up survey indicated that educational programs influenced many citizen behaviors,such as recycling. They were unsuccessful, however, at changing the rate at which citizens applylawn fertilizers.

6 - 25
Phosphorous Nitrogen Antifreeze Motor Oil Detergent
0
5
10
15
Po
lluta
nt
Lo
ad (
1,00
0 lb
/yea
r)
Pre-Program Post-Program
Figure 6-5. Changes in Pollutant Load Associated with a Public Education ProgramBased on a Public Survey
Source: Claytor, 1996
6.2.4 Land Use Modifications
One of the most effective tools to reduce the impacts of urbanization on water resources isto modify the way growth and development occurs across the landscape. At the jurisdictional orregional level, growth can be managed to minimize the outward extension of development. Jurisdictions can direct growth away from environmentally sensitive areas using such techniquesas open space preservation, re-zoning or the transfer of development rights. At the site level, thenature of development can be modified to reduce the impacts of impervious cover at individualdevelopment projects through techniques such as reduced street widths, clustered housing,smaller parking lots, and incorporation of vegetative BMPs into site design. While there are legalfees associated with changing both local and regional zoning codes, data suggest thatconcentrating development and minimizing impervious cover at the site level can actually reduceconstruction costs to both developers and local governments.
By concentrating development near urban areas, the capital costs of development can belowered substantially due to existing infrastructure and other public services. With conventionaldevelopment patterns, the cost of servicing residential developments exceeds the tax revenuesfrom these developments by approximately 15 percent (Pelley, 1997). By encouraging growth tooccur in a compact region, rather than over a large area, these capital costs can be reducedsubstantially (Table 6-19).

6 - 26
Table 6-19. Comparison of Capital Costs of MunicipalInfrastructure for a Single Dwelling Unit
Development PatternCapital Costs1
(1987 Dollars)
Compact Growth2 $18,000
Low-Density Growth (3 units/acre) $35,000
Low-Density Growth, 10 Miles fromExisting Development3
$48,000
Notes1. Costs include streets (full curb and gutter), central sewers and watersupply, storm drainage and school construction.2. Assumes housing mix of 30% single family units and townhouses; 70%apartments.3. Assumes housing is located 10 miles from major concentration ofemployment, drinking water plant and sewage treatment plant.
Source: Frank, 1989
Savings can also be realized at the site level by reducing the costs of clearing and grading,paving and drainage infrastructure. A recent study compared conventional development planswith alternative options designed to reduce the impacts of development on the quality of waterresources. The cost savings realized through these alternative options are summarized in Table 6-20. In all site designs, the road width was reduced from 28 feet to 20 feet, lot sizes were reducedor reconfigured to consume less open space, and on-site storm water treatment was provided.

6 - 27
Table 6-20. Impervious Cover Reduction and CostSavings of Conservation Development
Location Techniques UsedImpervious Cover
ReductionCost
Savings
SussexCounty,DE
1. Reduced street widths2. Smaller lots3. Cluster development
38% 52%
NewCastleCounty,DE
4.Houses clustered into attachedunits around courtyards
6% 63%
KentCounty,DE
5. Reduced road and drivewaywidths6. Minimum disturbance boundary
24% 39%
Source: Delaware DNREC, 1997
6.2.5 Oil and Hazardous Waste Collection
Providing a central location for the disposal of oil or hazardous wastes protects waterquality by offering citizens an alternative to disposing of these materials in the storm drain. Disposal costs vary considerably depending on the size of the program, and what types of wastesare collected. One study estimated the capital costs at approximately $30,000, with about$12,000 maintenance for a used oil collection recycling program in a typical MS4 (US EPA,1998b). This estimate was based on data from the Galveston Bay National Estuary Program. Data from the City of Livonia, Michigan indicates that the cost of hazardous waste disposalaverages about $12 per gallon (Ferguson et al, 1997).
6.2.6 Proper Storage of Materials
Proper storage of materials can prevent accidental spills or runoff into the storm drain. The design of storage structures varies depending on the needs of the facility. There are alsotraining costs associated with the proper storage of materials. Typical cost estimates, based onstandard construction data, are $6 to $11 per square foot for pre-engineered buildings and $3.40to $5 per square foot for a 6-inch thick concrete slab (Ferguson et al, 1997).

6 - 28
6.3 Benefits of Storm Water BMPs
Although it is possible to estimate the economic benefits of water quality improvement(US EPA, 1983a), it is difficult to create a “balance sheet” of economic costs and benefits forindividual BMPs. Ideally, benefits analysis would specify and quantify a chain of events: pollutantloading reductions achieved by the BMP; the physical-chemical properties of receiving streamsand consequent linkages to biologic/ecologic responses in the aquatic environment; and humanresponses and values associated with these changes. However, the necessary data to conductsuch an analysis does not currently exist. Instead, the benefits can be outlined in terms of: 1)effectiveness at reducing pollutant loads; 2) direct water quality impacts; and 3) economic benefitsor costs.
6.3.1 Storm Water Pollutant Reduction
A primary function of storm water BMPs is to prevent pollutants from reaching streamsand rivers. While all BMPs achieve this function to some extent, there is considerable variabilitybetween different types of BMPs. The extent of benefits from non-structural BMPs may be morespeculative, partly because their ability to influence human behavior is difficult to predict.
A detailed discussion of pollution removal efficiencies for individual structural BMPs isprovided in Section 5.5 of this report, so only non-structural BMPs will be reviewed in thissection. Unlike structural BMPs, it is generally not possible to associate specific pollutantremoval rates with non-structural BMPs, with the exception of street sweeping (Satterfield,1996). However, some non-structural BMPs are targeted at specific pollutants. Table 6-21outlines non-structural BMPs believed by designers to be the most effective for removing specifictypes of pollutants.

8 Therefore, regular sweeping programs in these areas can potentially remove largeamounts of solids from roadways.
6 - 29
Table 6-21. Non-Structural BMPs Suited to Controlling Various Pollutants
Pollutant Appropriate BMPs
Solids Street Sweeping Land Use Modifications
Oxygen-DemandingSubstances
Street SweepingEducation: Storm Drain StencilingLand Use Modifications
Education: Pet Scoop OrdinanceIllicit Connections Eliminated
Nitrogen andPhosphorus
Street SweepingEducation: Pet Scoop OrdinanceLand Use ModificationsProper Materials Handling
Illicit Connections EliminatedEducation: Lawn CareMaterials Storage and Recycling
Pathogens Illicit Connections EliminatedLand Use Modifications
Education: Pet Scoop Ordinance
PetroleumHydrocarbons
Street SweepingEducation: Storm Drain StencilingProper Materials Handling
Illicit Connections EliminatedMaterials Storage and RecyclingLand Use Modifications
MetalsStreet SweepingEducation: Storm Drain StencilingProper Materials Handling
Illicit Connections EliminatedMaterials Storage and RecyclingLand Use Modifications
SyntheticOrganics
Illicit Connections EliminatedEducation: Storm Drain StencilingProper Materials Handling
Education: Lawn CareMaterials Storage and RecyclingLand Use Modifications
Temperature Land Use Modifications
pH Illicit Connections EliminatedProper Materials Handling
Materials Storage and RecyclingLand Use Modifications
6.3.1.1 Solids
Both highway runoff and soil erosion can be sources of solids in urban runoff. Streetsweeping can reduce solids in urban runoff by removing solids from roadways and parking lotsbefore they can be detached and transported by runoff. The benefits associated with streetsweeping depend largely on the climate. In arid regions, airborne pollutants are a serious concern,and there is a long time between storms for pollutants to accumulate8. In humid regions, on theother hand, frequent rainfall makes the use of sweepers between storms less practical. In colder

6 - 30
regions, sweeping is recommended twice per year: once in the fall after leaves fall and once in thespring in anticipation of the spring snowmelt (MPCA, 1989).
Modifying land use to preserve open space and to limit the impervious cover can alsoreduce solids loads. By preserving open space and maintaining vegetative cover, the amount ofland cleared is limited, thus reducing the erosion potential during construction. Natural vegetatedcover has less than one percent of the erosion potential of bare soil (Wischmeier and Smith,1978).
6.3.1.2 Oxygen-Demanding Substances
Since the primary oxygen-demanding substances are organic materials (such as leaves andyard waste), BMPs that target these substances are best suited to reducing the oxygen demand instorm water. BMPs that reduce sediment loads often also reduce the loads of the organic materialassociated with that sediment. Pet waste is also a significant source of organic pollutants, and itscontrol can reduce the loads of oxygen demanding substances in urban runoff. Finally, programsgeared at reducing illegal dumping and eliminating illicit connections and accidental spills ofmaterials can reduce the oxygen demand associated with these sources.
6.3.1.3 Nitrogen and Phosphorus
Nitrogen and phosphorus are prevalent in urban and suburban storm water. Nitrogen andphosphorus are natural components of soil, and can enter runoff from storm-induced erosion.Additional sources include the use of fertilizer on urban lawns and airborne deposition. Streetsweeping can reduce nutrient loads by removing deposited nutrients from the street surface. Programs that focus on lawn chemical handling or replacing turf with natural vegetation also actto reduce nutrient loading. Finally, programs that educate the public or industry about illegaldumping to storm drains can result in reducing the nutrient loads associated with dumpingchemicals that have high nutrient content. Energy conservation and reduced automobile use canreduce airborne nitrogen deposition.
6.3.1.4 Pathogens
Pathogens, including protozoa, viruses and bacteria, are prevalent in urban runoff. Bacteria can be found naturally in soil, and the urban landscape can produce large loads ofbacteria that can be carried by runoff. Dogs in particular can be a significant source of pathogens.Thus, pet scoop ordinances and associated education are effective tools at reducing bacteria inurban runoff. Illicit connections of sewage may also be a source of pathogens, thereforeeliminating these sources can effectively reduce pathogens in runoff.

6 - 31
6.3.1.5 Petroleum Hydrocarbons
Petroleum hydrocarbons are present in many chemicals used in the urban environment,from gasoline to cleaning solvents. Since roadways are a major source of petroleum pollution,scheduled street sweeping can be used to remove hydrocarbon build-up prior to storm waterrunoff. Programs geared at preventing spills of chemicals to the storm drain, either throughdeliberate or accidental dumping, are effective at reducing hydrocarbon loads. Modifying the wayland is developed can reduce hydrocarbon loads on both a site and a regional level by reducing theuse of the automobile and replacing impervious surfaces with natural vegetation.
6.3.1.6 Metals
Metals sources in urban runoff include automobiles and household chemicals, which cancontain trace metals. Street sweeping can reduce metals loads deposited on the road surface. Inaddition, programs that focus on reducing dumping and proper material storage can reduceaccidental or purposeful spills of chemicals with trace metals to the storm drain system. Finally,modifying land use can reduce metals loads by reducing impervious cover, thus reducing totalrunoff containing metals, and reducing the roadway length, which is often a source of runoffcontaining metals.
6.3.1.7 Synthetic Organics
Much of the source of synthetic organics in the urban landscape is household cleaners andpesticides. Thus, education programs geared at reducing chemical and pesticide use, and properstorage and handling of these chemicals, can reduce their concentrations in urban runoff. Inaddition, land use modifications that replace turf with natural vegetation will reduce pesticide use.
6.3.1.8 Temperature
Most non-structural BMPs are not able to prevent the increase in temperature associatedwith urban development. One exception is the use of site designs that more closely mimic thenatural hydrograph by reducing impervious cover and encouraging infiltration.
6.3.1.9 pH
The primary source of low pH in urban runoff is acid rain, and most non-structural BMPsare not used to treat this problem. BMPs that focus on proper materials handling and disposal canprevent dumping of chemicals with extremely high or low pH, but this is generally not a majorproblem in urban watersheds.

6 - 32
6.3.2 Hydrological and Habitat Benefits
As reviewed in Chapter 4, one major impact of urbanization is induced through theconversion of farmland, forests, wetlands, and meadows to rooftops, roads, and lawns. Thisprocess of urbanization has a profound influence on surface water hydrology, morphology, waterquality, and ecology (Horner et al, 1994). In this section, the hydrologic and related habitatimpacts are briefly discussed as well as the potential benefits that can be achieved by managingstorm water runoff using structural and non-structural BMPs.
Many of these impacts can be directly or indirectly related to the change in the hydrologiccycle from a natural system to the urban system. Figure 4-1 illustrates the fundamental effectsthat occur along with the development process. In the natural setting, very little annual rainfall isconverted to runoff and about half is infiltrated into the underlying soils and water table. Thiswater is filtered by the soils, supplies deep water aquifers, and helps support adjacent surfacewaters with clean water during dry periods. In the urbanizing conditions, less and less annualrainfall is infiltrated and more and more volume is converted to runoff. Not only is this runoffvolume greater, it also occurs more frequently and at higher magnitudes. The result is that lesswater is available to streams and waterways during dry periods and more flow is occurring duringstorms. A recent study in the Pacific Northwest found that the ratio of the two-year storm to thebaseflow discharge increased more than 20 percent in developed sub-watersheds (imperviouscover approximately 50 percent) versus undeveloped sub-watersheds (May et al, 1997).
As a result of urbanization, runoff from storm events increases and accelerates flows,increases stream channel erosion, and causes accelerated channel widening and down cutting(Booth, 1990). This accelerated erosion is a significant source of sediment delivery to receivingwaters and also can have a smothering effect on stream channel substrates, thereby eliminatingaquatic species habitat. As a result, aquatic habitat is often degraded or eliminated in many urbanstreams. The results are that aquatic biological communities are among the first to be impactedand/or simplified by land conversion and resulting stream channel modifications. Subsurfacedrainage systems which frequently serve urbanized areas also contribute to the problem, bybypassing any attenuation achieved through surface flows over vegetated areas.
A unifying theme in stream degradation is this direct link with impervious cover.Impervious cover, or imperviousness, is defined as the sum of roads, parking lots, sidewalks,rooftops, and other impermeable surfaces in the urban landscape. This unifying theme can beused to guide the efforts of the many participants in watershed protection. Figure 6-6 visuallyillustrates this trend in degradation for a series of small headwater streams in the Mid-AtlanticPiedmont. Here, four stream segments, each with approximately the same drainage area, andsubjected to the same physiographic conditions, respond to the effects of increased imperviouscover. Similar results have been observed in the Southern United States with studies in Virginia,North Carolina and Georgia evidencing this same decline in fish and macroinvertebratepopulations with increasing impervious cover (Crawford and Lenant, 1989; Weaver and Garman,1994; Couch et al, 1996)

6 - 33
Figure 6-6. Effects of Impervious Cover on Stream Quality
Sensitive Stream º(Impervious Cover #10%)
- Stable Channel- Excellent Biodiversity- Excellent Water Quality
» Impacted Stream(Impervious Cover 10-20%)
- Channel Becoming Unstable- Fair to Good Biodiversity- Fair to Good Water Quality
Restorable Stream º(Impervious Cover .40%)
- Highly Unstable Channel- Poor Biodiversity- Poor to Fair Water Quality
Non-Supporting Stream º (Impervious Cover .65%) - Poor to No Biodiversity - Poor Water Quality

6 - 34
Figure 6-7. Stormwater Control Points Along the RainfallFrequency Spectrum
To mitigate this impact, many local and state governments have required the installation ofstorm water management detention basins to attenuate this increased runoff volume. It isimportant to recognize that the change in hydrology caused by urbanization affects more than justa single storm return interval (e.g., the two-year event). Urbanization shifts the entire "rainfallfrequency spectrum" (RFS) to a higher magnitude. As illustrated in Figure 6-7, the mostsignificant change is to the smallest, most frequent storms that occur several times per year. Inthe undeveloped condition, most of the rainfall from these events is infiltrated into the underlyingsoil. In the developed condition, much of this rainfall is runoff. As the storm return intervalincreases, the difference between the undeveloped and developed condition narrows. Manyjurisdictions only require management of specific storms, usually the two, ten and sometimes, theone hundred year events. The two-year storm is probably the most frequently used control pointalong this frequency spectrum. Hence, while BMPs may do a fairly good job of managing thesespecific control points, there have been very few locations across the country that have specificcriteria in place to manage storm water over a wide range of runoff events. Claytor and Schueler(1996) describe the RFS as:
...classes of frequencies often broken down by return interval, such as the two year storm returninterval. Four principal classes are typically targeted for control by stormwater managementpractices. The two smallest, most frequent classes [Zones 1 and 2] are often referred to as waterquality storms, where the control objectives are groundwater recharge, pollutant load reduction,and to some extent control of channel erosion producing events. The two larger classes [Zones 3and 4] are typically referred to as quantity storms, where the control objectives are channelerosion control, overbank control, and flood control.
Source: Claytor and Schueler, 1996

6 - 35
One recent study by MacRae (1997) concluded that stream channels below storm waterdetention basins designed to manage the two year storm experienced accelerated erosion at threetimes the pre-developed rate. His findings went on to suggest that the streams were eroding atmuch the same rate as if no storm water controls existed.
Other jurisdictions have employed an additional level of detention storage above andbeyond that required for the two year storm. This concept is often called “extended detention”(ED). McCuen and Moglen (1988) conducted a theoretical analysis of this design criteria basedon sediment transport capacity of the pre-developed channel versus that with ED control. Thisstudy found ED could produce an 85 percent reduction in the pre-developed peak flow of thetwo-year storm. What it did not analyze, however, was the erosion potential over a wide range ofstorms. MacRae (1993) suggested a different storm water control criterion called “distributedrunoff control” (DRC). Here, channel erosion is minimized if the erosion potential along achannel's perimeter is maintained constant with pre-developed levels. This is accomplished byproviding a non-uniform distribution of the storage-discharge relationship within a BMP, wheremultiple control points are provided along the runoff frequency spectrum.
6.3.2.1 Benefits of BMPs to Control Hydrologic Impacts
Numerous prior studies have documented the degradation of aquatic ecosystems of urbanand suburban headwater streams. As stated above, in general, the studies point to a decrease instream quality with increasing urbanization. Unfortunately, the benefits of BMPs to protectstreams from hydrologic impacts have only recently been investigated and only for a few studies.
Maxted and Shaver (1997), Jones et al (1997), and Horner et al (1997) attempted toisolate the potential beneficial influence of local storm water best management practices on theimpervious cover/stream quality relationship. Horner examined the possible influence of stream-side management on stream quality as a function of urbanization. Coffman et al (1998) recentlypresented data on the potential hydrologic benefits of alternative land development techniques. Called the “Low Impact Development Approach,” this methodology attempts to mimic pre-developed hydrology by infiltrating more rainfall at the source, increasing the flow path and timeof concentration of the remaining runoff, and providing more detention storage throughout thedrainage network, as opposed to a one location at the end of the pipe.
The preliminary findings of Maxted and Shaver, and Jones et al, suggest that, for theBMPs examined, stream quality (as measured by a limited group of environmental indicators)cannot be sustained when compared to reference stream conditions. Jones assessed several BMPsby conducting biomonitoring (fish and macroinvertebrate sampling) above and below BMPs andcomparing them to a reference watershed. He found that the biological community tended to bedegraded immediately below BMPs as compared to the reference watersheds. One major flaw inthe study was the lack of analysis in developed watersheds without BMPs. This would havecompared the influence of BMPs on the aquatic community as compared to no BMPs.
6 - 36
Maxted and Shaver examined eight sub-watersheds with and without BMPs. Their studyalso concluded that BMPs did not adequately mitigate the impacts of urbanization once watershedimpervious reached 20 percent cover. While this study was useful in defining the cumulativeimpacts of BMPs on watersheds, several critical questions remain. First, since no sub-watershedswith less than 22 percent impervious cover were analyzed, little is known about BMP ability toprotect the most sensitive species seen in less developed watersheds. Data for sub-watershedswith BMPs was collected approximately three years after data for the sub-watersheds withoutBMPs, so climatic/seasonal constraints may have affected the outcome as much, or more than theBMPs themselves.
Horner et al (1997) evaluated several sub-watersheds, with varying levels of imperviouscover, but only tangentially related the effectiveness of BMPs to protecting stream quality. Horner found that at relatively low levels of urbanization (approximately 4 percent imperviousarea) the most sensitive aquatic biological communities (e.g., salmonids) were adversely affected,and stream quality degradation (as measured by a several indicators) continued at a relativelycontinuous rate with increasing impervious area. Horner's study demonstrates a link betweenurbanization and stream quality in the Puget Sound region, but since the effects of BMPs were notdirectly assessed, the question of whether BMPs could "raise" these thresholds could not beanswered.
Horner did find a positive relationship between stream quality and riparian buffer widthand quality. Here, the otherwise direct relationship of degrading stream quality with increasingimpervious cover was positively altered where good riparian cover existed. In other words,increasing the buffer width and condition tended to keep the stream systems healthier.
Coffman demonstrated techniques for maintaining pre-developed hydrologic parametersby replicating the curve number and time of concentration. The analysis indicated the amount ofstorage required on-site to accommodate the change in site imperviousness. The benefits of thistype of development, while not yet fully monitored in a field study, are likely to include increasedgroundwater recharge, reduced channel erosion potential, and decreased flood potential.
One major hydrologic benefit of storm water management structures is the ability tomitigate for the potential flooding associated with medium to larger storms. Storm waterdetention and retention facilities have been applied in many parts of the country since about 1970(Ferguson and Debo, 1990). These facilities include wet and dry basins, as well as rooftop andparking lot detention and underground storage vaults. These storage facilities attempt to reduceflooding downstream from developments by reducing the rate of flow out of the particularstructure being used. Although the rate of flow is reduced, the volume of flow is generally notreduced. Instead, this volume is delivered downstream at a slower rate, and stretched out over alonger time. With the exception of properly design wet ponds, these structures do not provideany water quality benefit beyond the hydrologic modifications. This technique has proved to be asuccessful method of suppressing flood peaks when properly applied on a watershed-wide basis.

6 - 37
6.3.3 Human Health Benefits
Storm water can impact human health through direct contact from swimming or throughcontamination of seafood. Most human health problems are caused by pathogens, but metals andsynthetic organics may cause increased cancer risks if contaminated seafood are consumed. Mercury, PCBs, and some pesticides have been linked to human birth defects, cancer,neurological disorders and kidney ailments. The risks may be greater to sensitive populationssuch as children or the elderly. BMPs that reduce pathogens, metals and synthetic organics willhelp to limit these health risks.
Economic benefits of avoiding human health problems can include swimming andrecreation costs, as well as saved medical costs. One study in Saginaw, Michigan estimated thatthe swimming and beach recreation benefits associated with a CSO retention project exceededseven million dollars (US EPA, 1998c). As another example, EPA initially estimated thatproposed Phase II storm water controls would reduce the cost of shellfish-related illnesses bybetween $73,000 and $300,000 per year (US EPA, 1997d).
6.3.4 Additional and Aesthetic Benefits
Storm water BMPs can be perceived as assets or detriments to a community, dependingon their design. Some examples of benefits include: increased wildlife habitat, increased propertyvalues, recreational opportunities, and supplemental uses. Detriments include: mosquito breeding,reduced property values, less developable land and safety concerns. These detriments can bemitigated through careful design.
6.3.4.1 Property Values and Public Perception
The impacts of BMPs on property values are site-specific. The presence of a structuralBMP can affect property values in one of three ways: increase the value, decrease the value, orhave no impact. BMPs that are visually aesthetic and safe for children can lead to increasedproperty values. A practice becoming more prevalent is to situate developments around man-made ponds, lakes, or wetlands created to control flooding and reduce the impacts of urbanrunoff. Buffer zones and open areas that control runoff also provide land for outdoor recreationsuch as walking or hiking and for wildlife habitat. In many cases, developers are able to realizeadditional profits and quicker sales from units that are adjacent to such areas. A survey ofresidents in an Illinois subdivision indicates that residents are willing to pay between 5 percent and25 percent more to be located next to a wet pond, but that being located next to a poorly-designed dry detention basin can reduce home values (Emmerling-Dinovo, 1995).
Safety is also a concern among the public. A childless adult may perceive a wet pond asan amenity, but a family might view it as a potential hazard to children. These concerns can bealleviated using such design features as gently sloping edges, a safety “bench” (a flat area

9 The six minimum measures are:• Public Education and Outreach on Storm Water Impacts• Public Involvement/Participation• Illicit Discharge Detection and Elimination• Construction Site Storm Water Runoff Control• Post-Construction Storm Water Management in New Development and Redevelopment• Pollution Prevention/Good Housekeeping for Municipal Operations (US EPA, 1998c).
6 - 38
surrounding a pond) and the use of dense vegetation surrounding ponds and infiltration basins toact as a barrier.
Aesthetic maintenance is also important when considering long term impacts on propertyvalues. Poorly-maintained wet ponds or constructed wetlands may be unsightly due to excessalgal growth or public littering. Wet ponds and constructed wetlands can also become mosquitobreeding grounds. However, mosquito problems can usually be reduced or eliminated throughproper design and/or organic controls such as mosquito-eating fish. Successful designs avoidshallow or stagnant water, and reduce large areas of periodic drying, as occur in a dry detentionbasin (McLean, 1995). All BMPs need to have trash and debris removed periodically to preventodor and preserve aesthetic values.
6.3.4.2 Dual-Use Systems
Since BMPs can consume a large amount of space, communities may opt to use thesefacilities for other purposes in addition to storm water management. Two examples are “waterreuse” ponds and dual use infiltration or detention basins. In one study, a storm water pond wasused to irrigate a golf course in Florida, decreasing the cost of irrigation by approximately 85percent (Schueler, 1994b). In the southwestern United States, BMPs are often completely dry inbetween rain events. In these regions, it is very common to design infiltration basins or detentionbasins as parks that are maintained as a public open space (Livingston et al, 1997).
6.4 Review of Economic Analysis of the NPDES Phase II Storm Water Rule
The proposed storm water Phase II rule specifies that Phase II municipalities andoperators of construction sites disturbing between one and five acres of land must apply for andreceive a storm water permit. To meet this requirement, municipalities must develop a stormwater pollution prevention plan that addresses six minimum measures9. Operators of constructionsites are required to incorporate soil and erosion controls into their construction sites andimplement a water pollution prevention plan. The analysis presented here is a summary of themost recent benefit-cost analysis prepared for the proposed Phase II storm water rule (Preliminarydraft number 3). In order to address the issues raised in the public comments and during internalreview, EPA gathered additional data and information to refine the analysis of potential benefitsand costs conducted for the proposed Phase II rule. These data, analyses, and results aredescribed in detail in the Preliminary Draft of the Economic Analysis of the Final Phase II Storm
10 Estimated annual per household cost of compliance ranged from $0.63 to $60.44. SeeSection 4.2.1.2 in the Draft Final EA for a discussion of how EPA chose the mean value of $9.09per household. Note that the estimated per household cost does not include municipalexpenditures for post-construction storm water controls.
6 - 39
Water Rule (“EA”), and are summarized in the sections that follow. All cost and benefit estimatesare presented in 1998 dollars.
The reader should note that the Agency continues to revise the analysis based on internalreview and new data and information. EPA envisions completing the economic analysis inconjunction with the Storm Water Phase II Final Rule. Hence, all estimates are subject to futurerefinement.
6.4.1 Analyses of Potential Costs
This section provides an overview of the methodology used to estimate costs andpollutant loading reductions for both municipalities and construction sites subject to the finalPhase II rulemaking. The specific components of the analysis are discussed in detail in the DraftFinal EA. Current Agency estimates of national compliance costs, which are subject to change,are also provided.
6.4.1.1 Municipal Costs
EPA estimated annual per household program cost for automatically designatedmunicipalities (MS4s) using actual expenditures reported by 35 Phase I municipalities. Based oncensus data, EPA estimated the Phase II municipal universe to be 5,040 MS4s with a totalpopulation of 85 million people and 32.5 million households. An average annual per householdadministrative cost was estimated to address application, record keeping, and reportingrequirements, which was added to the program per household cost to derive a total average perhousehold cost. To obtain the national estimate of compliance costs, the Agency multiplied theestimated total per household compliance cost ($9.09) by the expected number of households inPhase II communities. EPA estimates the national Phase II municipal compliance costs to beapproximately $295 million (see Section 4.2.1.3 in the draft EA)10. 6.4.1.2 Construction Costs
In estimating incremental costs attributable to the final Phase II rule, EPA estimated a persite cost for construction sites of one, three, and five acres and multiplied the cost by the totalnumber of Phase II construction starts in these size categories to obtain a national estimate ofcompliance costs. The Agency used construction start data from eleven municipalities that recordconstruction start information to estimate the number of construction starts disturbing betweenone and five acres of land (see Section 4.2.2.1 in the Draft Final EA).

6 - 40
In estimating construction BMP costs, EPA used standard cost estimates from R.S. Means(R.S. Means, 1997a and 1997b) and created 27 model sites of typical site conditions in the UnitedStates. The model sites considered three different site sizes (1, 3, and 5 acres), three slopevariations (3, 7, and 12 percent), and three soil erosivity conditions (low, medium, and high). TheAgency used a database compiled by the Water Environment Federation (1992) to develop andapply BMP combinations appropriate to the model site conditions. For example, sites withshallow slopes and a low erosivity require few BMPs, while larger, steeper, and more erosive sitesrequired more BMPs. Detailed site plans, assumptions, and BMPs that could be used are found inAppendix B-3 of the Draft Final EA. Based on the assumption that any combination of sitefactors are equally likely to occur on a given site, EPA averaged the matrix of estimated costs todevelop an average cost for one, three, and five acre starts for all soil erodibilities and slopes. Theaverage BMP cost was estimated to be $1,206 for a one-acre site, $4,598 for a three-acre site,and $8,709 for a five-acre site.
Administrative costs for the following elements were estimated per construction site andadded to each BMP cost: submittal of a notice of intent (NOI) for permit coverage ($74);notification to municipalities ($17); development of a storm water pollution prevention plan($1,219); record retention ($2); and submittal of a notice of termination ($17) for a total cost of$1,329 per site. From this analysis, EPA estimated total average compliance costs (BMP plusadministrative) for a Phase II construction site of $2,535 for sites disturbing between one and twoacres of land, $5,927 for sites disturbing between two and four acres, and $10,038 for sitesdisturbing between four and five acres of land.
The total per site costs were then multiplied by the total number of Phase II constructionsites within each of those size categories to obtain the national compliance cost estimate. EPAestimated construction costs for 15 climatic zones to reflect regional variations in rainfallintensity and amount. Once the Phase II storm water rule is fully implemented, the total annualcompliance cost is expected to be approximately $512 million (assuming 109,652 constructionstarts in 1998).
6.4.1.3 Pollutant Loading Reductions
To estimate municipal pollutant loading reductions for the final Phase II rulemaking, EPAused the results from a 1997 EPA draft report that calculated national municipal loadingreductions for TSS based on the NURP study (US EPA, 1997d). To estimate pollutant loadingreductions from Phase II construction starts, the U.S. Army Corps of Engineers developed amodel based on EPA’s 27 models sites to estimate sediment loads from construction starts withand without Phase II controls (US ACE, 1998). Estimating the pollutant loading reduction forTSS does not capture the full extent of potential loading reductions that result from implementingstorm water controls, but provides a minimum estimate of the reductions that may result from the

11 To date, there are no national studies that estimate pollutant loading reductions due tothe implementation of municipal storm water controls for the other pollutants found in stormwater runoff and discharges.
12EPA adjusted the WTP amounts to account for inflation growth in real per capitaincome, inflation, and a 30 percent increase in attitudes towards pollution control.
6 - 41
Phase II rule11. EPA also anticipates that the rule will result in reductions in oil and grease,nitrogen, phosphorus, pathogens, lead, copper, zinc and other metals. Estimated annual TSSloading reductions range from 639,115 to approximately 4 million tons for municipalities and 2million to 8 million tons for construction sites assuming BMP effectiveness of 20 to 80 percent.
6.4.2 Assessment of Potential Benefits
A number of potential problems are associated with assessing the benefits from the PhaseII rule, including identifying the regulated municipalities as sources of current impairment towaters and determining the likely effectiveness of various measures; difficulties in water qualitymodeling; difficulties in modeling construction site BMP effectiveness; and most importantly, theinability to monetize some categories of benefits with currently available data.
The national benefits of Phase II controls will depend on a number of factors, includingthe number, intensity, and duration of wet weather events; the success of municipal programs; theeffectiveness of the selected construction site BMPs; the site-specific water quality and physicalconditions of receiving waters; the current and potential use of receiving waters; and the existenceof nearby “substitute” sites of unimpaired waters. Because these factors will vary substantiallyfrom site to site, data are not available with which to develop estimates of benefits for each siteand aggregate to obtain a national estimate. As a result, the Agency developed national levelestimates of benefits based largely on a benefits transfer approach. This approach allowsestimates of value developed for one site and level of environmental change to be applied in theanalysis of similar sites and environmental changes.
6.4.2.1 Anticipated Benefits of Municipal Measures
As part of an effort to quantify the value of the United States’ waters impaired by stormwater discharges, EPA applied adjusted Carson and Mitchell (1993) estimates of willingness topay (WTP) for incremental water quality improvements to estimates of waters impaired by stormwater discharges as reported by states in their biennial Water Quality Inventory reports12. Potential Phase II benefits are assumed to equal the WTP for the different water quality levelsmultiplied by the water quality impairment associated with Phase II municipalities multiplied bythe relevant number of households (WTP x percent impaired x number of households).
The Carson and Mitchell estimates apply to all fresh water, however it is not clear howthese values would be apportioned among rivers, lakes and the Great Lakes. Lakes are the water

6 - 42
bodies most impaired by urban runoff and discharges, followed closely by the Great Lakes andthen rivers. Hence, EPA applied the WTP values to the categories separately and assumed thatthe higher resulting value for lakes represents the high end of the range and the lower resultingvalue for rivers represents the low end of a value range for all fresh waters (i.e. high end assumesthat lake impairment is more indicative of national fresh water impairment while low end assumesthat river impairment is more indicative).
The extent to which impairment will be eliminated by the municipal measures is uncertain;hence, estimates are adjusted for a range of potential effectiveness of municipal measures. EPAexpects that municipal programs will achieve at least 80% effectiveness, resulting in estimatedannual benefits from fresh water use and passive use in the range of $67.2 to $241.2 million. Thepotential value of improvements in marine waters and human health benefits have not beenquantified at this time.
6.4.2.2 Anticipated Benefits of Construction Site Controls
EPA estimates the benefits of construction site controls using a benefits transfer approach applying WTP estimates for an erosion and sediment control plan from Paterson et al (1993)contingent valuation (CV) survey of North Carolina residents. The adjusted WTP estimates areintended to reflect potential benefits of erosion and sediment control programs that protect alllakes, rivers, and streams. In order to transfer adjusted WTP results to estimate the potentialbenefits of the Phase II rule, EPA calculated the percentage of Phase II construction starts thatare not covered by a state program or CZARA for each state. This percentage is multiplied by thenumber of households in the state and the adjusted mean WTP of $25. The results were thensummed across all states and indicate that WTP for the erosion and sediment controls of thePhase II rule may be as high as $624.2 million per year.
6.4.3 Comparison of Benefits and Costs
EPA estimates the total compliance costs of the rule to be $807.2 million. The largestportion of the total cost, $512 million, is associated with erosion and sediment controls atconstruction sites. EPA was able to develop a partial monetary estimate of expected benefits ofboth the six minimum municipal measures and the construction components of the rule. The sumof these benefits ranges from $700 to $865 million annually [assuming 80 percent effectiveness ofmunicipal programs and using the mean WTP ($25) from Paterson]. The largest portion ofbenefits, $624 million, are associated with erosion and sediment controls for construction sites.
6.5 Financial Issues
Effective storm water programs require both the existence of well-performing, cost-effective BMPs and sufficient funding. Financing issues are discussed extensively in other Agency
13 EPA has prepared publications to assist local governments in planning for programfunding (US EPA, 1994b). More recently the Agency has established an internet site with currentinformation, the “Environmental Finance Information Network.” The website address ishttp://www.epa.gov/efinpage/efin.htm .
6 - 43
reports and only briefly reviewed below.13 Section 6.5.1 focuses on financing options formunicipal storm water programs but does not discuss regulatory impacts on municipalities.
6.5.1 Municipal Financing of Storm Water Programs
Around the nation, local government general tax funds are the most commonly usedsource of funding for storm water programs. However, this may be the least suitable source ofstorm water program or maintenance funding. General tax revenues originate at a number ofsources and are used to finance an equally diverse number of public programs, includingeducation, police and fire protection, civil and criminal courts, and social and economic supportprograms. Storm water programs and maintenance must compete against a large number of othervital public programs for a very limited number of tax dollars. This problem has beencompounded in recent years by tax caps and the public’s general opposition to new or highertaxes.
The unreliability of general tax funds has led many communities around the country todevelop storm water utilities. Storm water utilities rely on dedicated user charges related to thelevel of service provided. Charges are typically paid by property owners and managed in aseparate enterprise fund. A variety of methods are used to determine charges, but are usuallybased on some estimate of the amount of storm water runoff contributed by the property, such asthe total impervious surface or a ratio of impervious surface to total property area. Generally aflat rate is charged for residential properties.
There are several advantages of using utility fees to finance storm water programs. Unlikegeneral tax revenues, utility charges are a dedicated, stable, and predictable source of funds andare not subject to state “tax cap” limitations. Also, because charges are based on the user’scontribution to storm water runoff, it is often seen as more equitable or fair. Finally, utility feesprovide a mechanism to incorporate economic incentives for implementation of on-site stormwater management through reduced charges. For example, credits or discounts are oftenprovided for on-site retention of storm water by nonresidential property owners. Providing suchincentives creates greater flexibility by allowing each user to choose the cheaper option - payingthe utility charge or implementing on-site controls. Storm water utilities are now well establishedas an effective financing option. As of 1991, over 100 communities across the country hadinstituted storm water utilities (US EPA, 1994a).
Similar to utility fees, the use of inspection or permit fees to help publicly finance stormwater programs represents a relatively new application of an established component ofgovernment revenues. Often, these fees are associated with the issuance of a permit, such as a

6 - 44
building permit, clearing permit, storm water permit, or sewer connection permit. A permitprogram based upon fees for annual inspections, such as a storm water discharge or storm wateroperating permit, can provide a continuing source of funds. However, many permit or inspectionfees are a one time charge, typically when the facility is first constructed. These are generally nota good funding source for continuing storm water system maintenance.
Finally, the use of dedicated contributions from land developers may be used to financepublic maintenance of storm water systems. Under this program, the local government assumesthe operation and maintenance of a storm water system constructed as part of a privatedevelopment. All or a portion of the estimated required funding for the O&M is obtained througha one-time contribution by the land developer to a dedicated account which is controlled by thelocal government. Often the developer is responsible for O&M during a “warranty period,”frequently the first two years. Dedicated contributions provide a secure, dedicated funding sourcethat is not subject to state tax cap limits. A disadvantage is that dedicated contributions are onlyapplicable to new storm water systems.
6.6 Summary
The use of BMPs to control storm water runoff and discharges where none previouslyexisted will ultimately result in a change in pollutant loadings, and there are indications that in theaggregate BMPs will improve water quality. The actual manner in which the loadings reductionsare achieved will depend on the BMPs selected, which will determine the associated costs. Thephysical-chemical properties of receiving streams and consequent linkages to biologic/ecologicresponses in the aquatic environment, and human responses and values associated with thesechanges will determine the benefits.