6 june 18108 world health statistics...
TRANSCRIPT
ISBN 978 92 4 156558 5
2018 2018

2018

World health statistics 2018: monitoring health for the SDGs, sustainable development goals
ISBN 978-92-4-156558-5
© World Health Organization 2018
Some rights reserved. This work is available under the Creative Commons Attribution-NonCommercial-ShareAlike 3.0 IGO licence (CC BY-NC-SA 3.0 IGO; https://creativecommons.org/licenses/by-nc-sa/3.0/igo).
Under the terms of this licence, you may copy, redistribute and adapt the work for non-commercial purposes, provided the work is appropriately cited, as indicated below. In any use of this work, there should be no suggestion that WHO endorses any specific organization, products or services. The use of the WHO logo is not permitted. If you adapt the work, then you must license your work under the same or equivalent Creative Commons licence. If you create a translation of this work, you should add the following disclaimer along with the suggested citation: “This translation was not created by the World Health Organization (WHO). WHO is not responsible for the content or accuracy of this translation. The original English edition shall be the binding and authentic edition”.
Any mediation relating to disputes arising under the licence shall be conducted in accordance with the mediation rules of the World Intellectual Property Organization.
Suggested citation. World health statistics 2018: monitoring health for the SDGs, sustainable development goals. Geneva: World Health Organization; 2018. Licence: CC BY-NC-SA 3.0 IGO.
Cataloguing-in-Publication (CIP) data. CIP data are available at http://apps.who.int/iris.
Sales, rights and licensing. To purchase WHO publications, see http://apps.who.int/bookorders. To submit requests for commercial use and queries on rights and licensing, see http://www.who.int/about/licensing.
Third-party materials. If you wish to reuse material from this work that is attributed to a third party, such as tables, figures or images, it is your responsibility to determine whether permission is needed for that reuse and to obtain permission from the copyright holder. The risk of claims resulting from infringement of any third-party-owned component in the work rests solely with the user.
General disclaimers. The designations employed and the presentation of the material in this publication do not imply the expression of any opinion whatsoever on the part of WHO concerning the legal status of any country, territory, city or area or of its authorities, or concerning the delimitation of its frontiers or boundaries. Dotted and dashed lines on maps represent approximate border lines for which there may not yet be full agreement.
The mention of specific companies or of certain manufacturers’ products does not imply that they are endorsed or recommended by WHO in preference to others of a similar nature that are not mentioned. Errors and omissions excepted, the names of proprietary products are distinguished by initial capital letters.
All reasonable precautions have been taken by WHO to verify the information contained in this publication. However, the published material is being distributed without warranty of any kind, either expressed or implied. The responsibility for the interpretation and use of the material lies with the reader. In no event shall WHO be liable for damages arising from its use.
Photo credits: page v WHO; page vi (upper) Lubna A. Al-Ansary; page vi (lower) WHO/Christopher Black; page 1 WHO/Andrew Esiebo; page 4 WHO/Diego Rodriguez; page 13 WHO/Tom Pietrasik.
Design and layout by L’IV Com Sàrl, Villars-sous-Yens, Switzerland.
Printed in Luxembourg.
Foreword . . . . . . . . . . . . . . . . . . . . . . . . . . . . . . . . . . . . . . . . . . . . . . . . . . . . . . . . . . . . . . . . . . . . . . . . . . . . . . . v
Preface . . . . . . . . . . . . . . . . . . . . . . . . . . . . . . . . . . . . . . . . . . . . . . . . . . . . . . . . . . . . . . . . . . . . . . . . . . . . . . . vi
Abbreviations . . . . . . . . . . . . . . . . . . . . . . . . . . . . . . . . . . . . . . . . . . . . . . . . . . . . . . . . . . . . . . . . . . . . . . . . . . vii
Introduction . . . . . . . . . . . . . . . . . . . . . . . . . . . . . . . . . . . . . . . . . . . . . . . . . . . . . . . . . . . . . . . . . . . . . . . . . . . viii
Part 1Understanding data in the World Health Statistics series . . . . . . . . . . . . . . . . . . . . . . . . . . . . . . . . . . . . . . . . . . 1
Part 2Status of the health-related SDGs . . . . . . . . . . . . . . . . . . . . . . . . . . . . . . . . . . . . . . . . . . . . . . . . . . . . . . . . . . . . 42.1 Reproductive, maternal, newborn and child health . . . . . . . . . . . . . . . . . . . . . . . . . . . . . . . . . . . . . . . . . . . . 42.2 Infectious diseases . . . . . . . . . . . . . . . . . . . . . . . . . . . . . . . . . . . . . . . . . . . . . . . . . . . . . . . . . . . . . . . . . . . 52.3 Noncommunicable diseases and mental health . . . . . . . . . . . . . . . . . . . . . . . . . . . . . . . . . . . . . . . . . . . . . . 72.4 Injuries and violence . . . . . . . . . . . . . . . . . . . . . . . . . . . . . . . . . . . . . . . . . . . . . . . . . . . . . . . . . . . . . . . . . . 72.5 Universal health coverage and health systems . . . . . . . . . . . . . . . . . . . . . . . . . . . . . . . . . . . . . . . . . . . . . . . 82.6 Environmental risks . . . . . . . . . . . . . . . . . . . . . . . . . . . . . . . . . . . . . . . . . . . . . . . . . . . . . . . . . . . . . . . . . . . 92.7 Health risks and disease outbreaks . . . . . . . . . . . . . . . . . . . . . . . . . . . . . . . . . . . . . . . . . . . . . . . . . . . . . . . . 10References . . . . . . . . . . . . . . . . . . . . . . . . . . . . . . . . . . . . . . . . . . . . . . . . . . . . . . . . . . . . . . . . . . . . . . . . . . . . . 1 1
Part 3A broad spectrum of health challenges – selected issues . . . . . . . . . . . . . . . . . . . . . . . . . . . . . . . . . . . . . . . . 133.1 Increasing the coverage of essential health services . . . . . . . . . . . . . . . . . . . . . . . . . . . . . . . . . . . . . . . . . . . 143.2 Cholera – an underreported threat to progress . . . . . . . . . . . . . . . . . . . . . . . . . . . . . . . . . . . . . . . . . . . . . . . 163.3 Turning the rising tide of obesity in the young . . . . . . . . . . . . . . . . . . . . . . . . . . . . . . . . . . . . . . . . . . . . . . . . 18References . . . . . . . . . . . . . . . . . . . . . . . . . . . . . . . . . . . . . . . . . . . . . . . . . . . . . . . . . . . . . . . . . . . . . . . . . . . . . 21
Annex A: Summaries of selected health-related SDG indicators . . . . . . . . . . . . . . . . . . . . . . . . . . . . . . . . . . . 22Explanatory notes . . . . . . . . . . . . . . . . . . . . . . . . . . . . . . . . . . . . . . . . . . . . . . . . . . . . . . . . . . . . . . . . . . . . . . . . 22Indicator 3.1.1 Maternal mortality . . . . . . . . . . . . . . . . . . . . . . . . . . . . . . . . . . . . . . . . . . . . . . . . . . . . . 23Indicator 3.1.2 Skilled birth attendance . . . . . . . . . . . . . . . . . . . . . . . . . . . . . . . . . . . . . . . . . . . . . . . . 24Indicators 3.2.1/3.2.2 Child mortality . . . . . . . . . . . . . . . . . . . . . . . . . . . . . . . . . . . . . . . . . . . . . . . . . . . . . . . 25Indicator 3.3.1 HIV incidence . . . . . . . . . . . . . . . . . . . . . . . . . . . . . . . . . . . . . . . . . . . . . . . . . . . . . . . 26Indicator 3.3.2 Tuberculosis incidence . . . . . . . . . . . . . . . . . . . . . . . . . . . . . . . . . . . . . . . . . . . . . . . . . . 27Indicator 3.3.3 Malaria incidence . . . . . . . . . . . . . . . . . . . . . . . . . . . . . . . . . . . . . . . . . . . . . . . . . . . . 28Indicator 3.3.4 Hepatitis B incidence . . . . . . . . . . . . . . . . . . . . . . . . . . . . . . . . . . . . . . . . . . . . . . . . . . 29Indicator 3.3.5 Need for neglected tropical disease interventions . . . . . . . . . . . . . . . . . . . . . . . . . . . . . 30Indicator 3.4.1 Mortality due to noncommunicable diseases . . . . . . . . . . . . . . . . . . . . . . . . . . . . . . . . 3 1Indicator 3.4.2 Suicide mortality rate . . . . . . . . . . . . . . . . . . . . . . . . . . . . . . . . . . . . . . . . . . . . . . . . . . . 32Indicator 3.5.2 Alcohol use . . . . . . . . . . . . . . . . . . . . . . . . . . . . . . . . . . . . . . . . . . . . . . . . . . . . . . . . . . 33Indicator 3.6.1 Deaths from road traffic injuries . . . . . . . . . . . . . . . . . . . . . . . . . . . . . . . . . . . . . . . . . . 34Indicator 3.7.1 Family planning . . . . . . . . . . . . . . . . . . . . . . . . . . . . . . . . . . . . . . . . . . . . . . . . . . . . . . . 35Indicator 3.7.2 Adolescent birth rate . . . . . . . . . . . . . . . . . . . . . . . . . . . . . . . . . . . . . . . . . . . . . . . . . . 36Indicator 3.8.1 Universal health coverage: service coverage . . . . . . . . . . . . . . . . . . . . . . . . . . . . . . . . . . 37Indicator 3.8.2 Universal health coverage: financial protection . . . . . . . . . . . . . . . . . . . . . . . . . . . . . . . 38Indicator 3.9.1 Mortality due to air pollution . . . . . . . . . . . . . . . . . . . . . . . . . . . . . . . . . . . . . . . . . . . . 39
CONTENTS
iiiMONITORING HEALTH FOR THE SDGs

Indicator 3.9.2 Mortality due to unsafe WASH services . . . . . . . . . . . . . . . . . . . . . . . . . . . . . . . . . . . . 40Indicator 3.9.3 Mortality due to unintentional poisoning . . . . . . . . . . . . . . . . . . . . . . . . . . . . . . . . . . . 4 1Indicator 3.a.1 Tobacco use. . . . . . . . . . . . . . . . . . . . . . . . . . . . . . . . . . . . . . . . . . . . . . . . . . . . . . . . . 42Indicator 3.b.1 Vaccine coverage . . . . . . . . . . . . . . . . . . . . . . . . . . . . . . . . . . . . . . . . . . . . . . . . . . . . . 43Indicator 3.b.2 Development assistance for health . . . . . . . . . . . . . . . . . . . . . . . . . . . . . . . . . . . . . . . . 44Indicator 3.c.1 Health workers . . . . . . . . . . . . . . . . . . . . . . . . . . . . . . . . . . . . . . . . . . . . . . . . . . . . . . 45Indicator 3.d.1 IHR capacity and health emergency preparedness . . . . . . . . . . . . . . . . . . . . . . . . . . . . . 46Indicator 1.a.2 Government spending on essential services, including health . . . . . . . . . . . . . . . . . . . . 47Indicator 2.2.1 Stunting among children . . . . . . . . . . . . . . . . . . . . . . . . . . . . . . . . . . . . . . . . . . . . . . . 48Indicator 2.2.2 Wasting and overweight among children . . . . . . . . . . . . . . . . . . . . . . . . . . . . . . . . . . . 49Indicator 6.1.1 Safely managed drinking-water services . . . . . . . . . . . . . . . . . . . . . . . . . . . . . . . . . . . . 50Indicator 6.2.1 Safely managed sanitation services . . . . . . . . . . . . . . . . . . . . . . . . . . . . . . . . . . . . . . . 5 1Indicator 7.1.2 Clean household energy . . . . . . . . . . . . . . . . . . . . . . . . . . . . . . . . . . . . . . . . . . . . . . . . 52Indicator 11.6.2 Air pollution . . . . . . . . . . . . . . . . . . . . . . . . . . . . . . . . . . . . . . . . . . . . . . . . . . . . . . . . 53Indicator 13.1.1 Mortality due to disasters . . . . . . . . . . . . . . . . . . . . . . . . . . . . . . . . . . . . . . . . . . . . . . 54Indicator 16.1.1 Homicide . . . . . . . . . . . . . . . . . . . . . . . . . . . . . . . . . . . . . . . . . . . . . . . . . . . . . . . . . . 55Indicator 16.1.2 Mortality due to conflicts . . . . . . . . . . . . . . . . . . . . . . . . . . . . . . . . . . . . . . . . . . . . . . . 56Indicator 17.19.2 Death registration . . . . . . . . . . . . . . . . . . . . . . . . . . . . . . . . . . . . . . . . . . . . . . . . . . . . 57
Annex B: Tables of health-related SDG statistics by country, WHO region and globally . . . . . . . . . . . . . . . . . . 59Explanatory notes . . . . . . . . . . . . . . . . . . . . . . . . . . . . . . . . . . . . . . . . . . . . . . . . . . . . . . . . . . . . . . . . . . . . . . . 59
Annex C: WHO regional groupings . . . . . . . . . . . . . . . . . . . . . . . . . . . . . . . . . . . . . . . . . . . . . . . . . . . . . . . . . . . 86
iv WORLD HEALTH STATISTICS: 2018
FOREWORD
In 2015, countries adopted the ambitious Sustainable Development Goals (SDGs), each of which has specific targets to be achieved over the next 15 years. The SDGs include one health goal and over 50 health-related targets which are applicable to all countries, irrespective of
their level of development. It is essential that we track progress towards these targets in all countries – a mammoth task in itself.
One of the key roles of the World Health Organization (WHO) is to monitor global health trends. The World Health Statistics series, published annually since 2005, is WHO’s annual snapshot of the state of the world’s health. Since 2016, the World Health Statistics series has focused on monitoring progress towards the SDGs and this 2018 edition contains the latest available data for 36 health-related SDG indicators.
The story it tells is that while we have made remarkable progress on several fronts, huge challenges remain if we are to reach the targets for health we have set ourselves. In some areas progress has stalled and the gains we have made could easily be lost.
Under-five mortality has improved dramatically – yet each and every day in 2016, 15 000 children died before reaching their fifth birthday. After unprecedented global gains in malaria control, progress has stalled because of a range of challenges, including a lack of sustainable and predictable funding. And while the risk of dying from cardiovascular disease, chronic respiratory disease, diabetes or cancer has decreased since 2000, an estimated 13 million people under the age of 70 still died due to these diseases in 2016.
Maintaining the momentum towards the SDGs is only possible if countries have the political will and the capacity to prioritize regular, timely and reliable data collection to guide policy decisions and public health interventions. I care about outcomes and about accountability and I want to ensure that WHO, together with our partners, is doing all we can to get countries on track to reach the SDGs.
The WHO’s 13th General Programme of Work is designed to do exactly that. At its heart are the ambitious “triple billion” targets: one billion more people benefitting from universal health coverage (UHC); one billion more people better protected from health emergencies; and one billion more people enjoying better health and well-being. To keep ourselves accountable, we have developed an “Impact Framework” for the 13th General Programme of Work, aligned with the SDGs. This will allow us to measure the only progress that really matters: less death and disease, and more healthy living for everyone, everywhere.
Dr Tedros Adhanom Ghebreyesus Director-GeneralWorld Health Organization
vMONITORING HEALTH FOR THE SDGs

PREFACE
W orld health statistics 2018 signals WHO’s continued commitment to work with Member States and all partners to ensure WHO provides the most trusted health-related data that are up to date, disaggregated and disseminated in an
open manner, and widely used. These data are an essential resource to achieve the health-related SDGs and UHC. Robust health metrics, improved and focused measurement, and use of evidence and research are high priorities in the WHO’s 13th General Programme of Work. The Health Metrics and Measurement cluster works across WHO as the hub streamlining the flow of data from Member States and within the Organization, reducing the reporting burden on Member States, and coordinating research activities. For the first time in the World Health Statistics series, World health statistics 2018 provides labels to help users understand the types of data in the report. It also includes many updated data series as well as new indicators, and
Part 3 is organized around WHO’s new priority areas of work: UHC, health emergencies, and healthier populations. Our ultimate goal is to support countries to make ethical and evidence-informed decisions to maximize health gains for their populations. Sincere thanks are extended to all who helped in collecting, processing and presenting these data at the country, regional and headquarters levels. World health statistics 2018 could not have been produced without this enormous dedicated collective effort.
W orld health statistics 2018 is the world’s summary of health-related data produced through concerted engagement with WHO Member States. The report helps us to understand where data or estimates are available and, conversely, where we
lack insights. We are at a pivotal moment to reset the global health data agenda and ensure continued focus on measuring the health-related SDG indicators. Improving data collection at the source, strengthening country capacity for data analysis and use, and introducing innovations in data capture, analysis and dissemination are WHO’s primary objectives in the 13th General Programme of Work. In the coming years, we will support country-level capacity-strengthening through essential tools and public goods that focus on the fundamentals for reliable statistics. We will improve statistical analysis, expand support for the curation and dissemination of national data, strengthen civil registration and vital statistics systems, and
promote the availability of timely and quality data for the SDG era. We look forward to engaging with Member States and partners on this journey to 2030, to ensure health for all.
Dr Lubna A. Al-Ansary Assistant Director-General Health Metrics and MeasurementWHO headquartersGeneva, Switzerland
Dr John T. Grove DirectorInformation, Evidence and ResearchHealth Metrics and MeasurementWHO headquartersGeneva, Switzerland
ABBREVIATIONS
AFR WHO African Region
AIDS acquired immunodeficiency syndrome
AMR WHO Region of the Americas
ANC antenatal care
ART antiretroviral therapy
BMI body mass index
CRD chronic respiratory disease
CVD cardiovascular disease
DHS Demographic and Health Survey
DTP diphtheria-tetanus-pertussis
EMR WHO Eastern Mediterranean Region
EUR WHO European Region
FCTC Framework Convention on Tobacco Control
GATHER Guidelines for Accurate and Transparent Health Estimates Reporting
GHO Global Health Observatory
GNI gross national income
HBsAg hepatitis B surface antigen
HBV hepatitis B virus
HCV hepatitis C virus
HIV human immunodeficiency virus
IHR International Health Regulations
LMIC low- and middle-income countries
MCV measles-containing vaccine
NCD noncommunicable disease
NTD neglected tropical disease
PCV pneumococcal-conjugated vaccine
PM particulate matter
RMNCH reproductive, maternal, newborn and child health
SDG Sustainable Development Goal
SEAR WHO South-East Asia Region
TB tuberculosis
UHC universal health coverage
UN-IGME United Nations Inter-agency Group for Child Mortality Estimation
UNAIDS Joint United Nations Programme on HIV/AIDS
UNICEF United Nations Children’s Fund
WASH water, sanitation and hygiene
WPR WHO Western Pacific Region
viiMONITORING HEALTH FOR THE SDGs
INTRODUCTION
The World Health Statistics series is WHO’s annual compilation of health statistics for its 194 Member States. The series is produced by the WHO Department of Information, Evidence and Research, of the Health Metrics and Measurement Cluster, in collaboration with all relevant WHO technical departments.
World health statistics 2018 focuses on the health and health-related Sustainable Development Goals (SDGs) and associated targets by bringing together data on a wide range of health-related SDG indicators. It also links to the three SDG-aligned strategic priorities of the WHO’s 13th General Programme of Work, 2019¬2023.1
World health statistics 2018 is organized into three parts. First, in order to improve understanding and interpretation of the data presented, Part 1 outlines the different types of data used and provides an overview of their compilation, processing and analysis. The resulting statistics are then publicized by WHO through its flagship products such as the World Health Statistics series. In Part 2 summaries are provided of the current status of selected health-related SDG indicators at global and regional levels, based on data available as of early 2018. As indicated above, World health statistics 2018 links to the SDG-aligned strategic priorities of the WHO’s 13th General Programme of Work. In Part 3, each of these three strategic priorities of achieving universal health coverage (UHC), addressing health emergencies and promoting healthier populations are illustrated through the use of highlight stories. In Annexes A and B, country-level statistics are presented for selected health-related SDG indicators. Additionally, Annex B also presents statistics at WHO regional and global levels. For the first time, the type of data used for each indicator (“comparable estimate”; “primary data”; or “other data”), as described in Part 1, is also shown.
The statistics presented in World health statistics 2018 are official WHO statistics based on data available for global monitoring in early 2018, and all comparable estimates have been consulted with Member States. The statistics have been compiled primarily using publications and databases produced and maintained by WHO or by United Nations groups of which WHO is a member, such as the United Nations Inter-agency Group for Child Mortality Estimation (UN-IGME). Additionally, a number of statistics have been derived from data produced and maintained by other international organizations, such as the United Nations Department of Economic and Social Affairs and its Population Division.
It is important to note that comparable estimates are subject to considerable uncertainty, especially for countries where the availability and quality of the underlying primary data are limited. However, to ensure readability while covering such a comprehensive range of health topics, the printed and online versions of the World Health Statistics series do not include the margins of uncertainty which are instead made available through online WHO databases such as the Global Health Observatory.
In some cases, as SDG indicator definitions are being refined and baseline data are being collected, proxy indicators have been presented. All such proxy indicators are clearly indicated as such through the use of accompanying footnotes. For indicators with a reference period expressed as a range, country values refer to the latest available year in the range unless otherwise noted. Changes in the values shown for indicators reported on in previous editions of the World Health Statistics series should not be assumed to accurately reflect underlying trends. This applies to all data types (comparable estimate, primary data and other data) and all reporting levels (country, regional and global).
More details on the indicators and statistics presented here are available at the WHO Global Health Observatory.2
1 Draft 13th General Programme of Work, 2019–2023. Scheduled for consideration by the Seventy-first World Health Assembly in May 2018 (http://www.who.int/about/what-we-do/gpw-thirteen-consultation/en/, accessed 28 March 2018).
2 The Global Health Observatory (GHO) is WHO’s portal providing access to data and analyses for monitoring the global health situation. See: http://www.who.int/gho/en/, accessed 28 March 2018.
viii WORLD HEALTH STATISTICS: 2018
1 UNDERSTANDING DATA IN THE WORLD HEALTH STATISTICS SERIES
1MONITORING HEALTH FOR THE SDGs
Since 2016 the World Health Statistics series has served as WHO’s annual report on the health-related Sustainable Development Goals (SDGs). The effective monitoring of SDG indicators requires comprehensive national health information strategies based on the use of data from sources such as civil registration and vital statistics systems, household and other population-based surveys, routine health-facility reporting systems and health-facility surveys, administrative data systems and surveillance systems. Some indicators also rely on non-health-sector data sources.
Making sense of the often complex available data on health indicators can be highly challenging. Health data derived from health information systems, including health-facility records, surveys or vital statistics, may not be representative of the entire population of a country and in some cases may not even be accurate. Comparisons between populations or over time can also be complicated by differences in data definitions and/or measurement methods. Although some countries may have multiple sources of data for the same year, it is more usual for data not to be available for every population or year. For example, measurement frequency for data collected through household surveys is typically every 3–5 years. This means that the years for which data are available differ by country. To overcome these and other issues and allow for comparisons to be made across
countries and over time, analysts develop mathematical and statistical models with the aim of producing unbiased estimates that are representative and comparable.
In World health statistics 2017,1 more than 50 health-related SDG indicators were identified. Currently, sufficient monitoring data are available for 36 indicators and these data are presented in Annexes A and B of the current report, as well as online in the WHO Global Health Observatory (www.who.int/gho/en). For most indicators, comparable estimates are reported if they are available. Such data have been generated using a database of primary data and a mathematical or statistical model, followed by consultation with the relevant WHO Member State. In these cases, the database of primary data used to derive the estimates is available online, together with other documentation required by the Guidelines for Accurate and Transparent Health Estimates Reporting (GATHER).2
For other indicators, the most recent observation from a database of primary data is reported. Primary data is
1 World Health Statistics 2017. Geneva: World Health Organization; 2017 (http://www.who.int/gho/publications/world_health_statistics/2017/en/, accessed 28 March 2018).
2 Stevens GA, Alkema L, Black RE, Boerma JT, Collins GS, Ezzati M et al. Guidelines for Accurate and Transparent Health Estimates Reporting: the GATHER statement. Lancet. 2016;388(10062):1–5 (https://www.researchgate.net/publication/304576854_Guidelines_for_Accurate_and_Transparent_Health_Estimates_Reporting_The_GATHER_statement, accessed 28 March 2018).
2 WORLD HEALTH STATISTICS: 2018
Via o�
cial re
quest
Some
prim
ary da
ta are
forw
arded
for o
�cial
publi
catio
n
Publi
cly av
ailab
le da
ta
O�cia
l pub
licati
onof
healt
h stat
istics
DATA
COLLE
CTION
WHO c
ollec
ts da
ta fro
m a
variet
y of s
ource
s thro
ugh
o�cia
l requ
ests o
r acc
essing
pu
blicly
avail
able
data.
1DA
TA CO
MPILA
TION
AND V
ALIDA
TION
While
some
prim
ary da
ta ne
edto
be co
mpile
d, pro
cesse
d and
val
idated
, othe
r prim
ary da
taare
forw
arded
for p
ublic
ation
.
2CO
NSUL
TATIO
N
After
initia
l stati
stics
areob
taine
d, Me
mber
States
are
given
an op
portu
nity t
oco
mmen
t on m
ethod
s or
provid
e new
prim
ary da
ta.
4RE
PORT
ING
Data
and m
ethod
s are
report
ed in
line w
ith
GATH
ER.
5PU
BLICA
TION A
NDDIS
SEMI
NATIO
NWH
O pub
lishes
its o�
cial
statis
tics t
hroug
h its
flags
hippro
ducts
such
as th
e Worl
dHe
alth S
tatist
ics se
ries.
6
Note:
Data
on em
ergen
cies d
oes n
ot pa
ss thr
ough
the c
ountr
y con
sultat
ion an
d rep
orting
proc
ess in
most
cases
Repo
rting
in lin
e with
GATH
ER
COMP
ARAB
LEES
TIMAT
ESA s
tatist
ical o
r math
emati
cal
mode
l is us
ed to
calcu
late
comp
arable
estim
ates.
3
COMPARA
BLE E
STIMA
TES
Key i
nform
ant d
ata m
ay be
valid
ated b
efore
o�cia
l pub
licati
on
A cou
ntry c
onsul
tation
may
be ca
rried
out
CONS
ULTA
TION
Fig.
1.1
Sc
hem
atic
ove
rvie
w o
f WHO
dat
a co
mpi
latio
n, p
roce
ssin
g, a
naly
sis,
con
sulta
tion
and
repo
rtin
g
3MONITORING HEALTH FOR THE SDGs
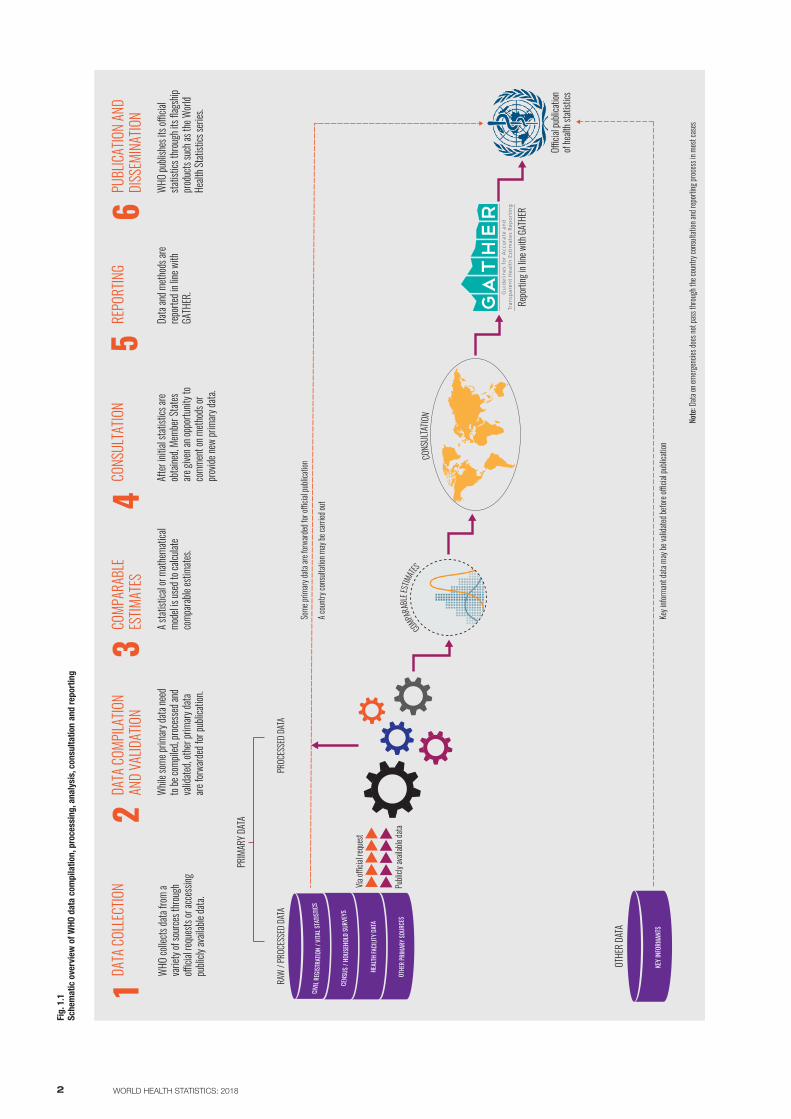
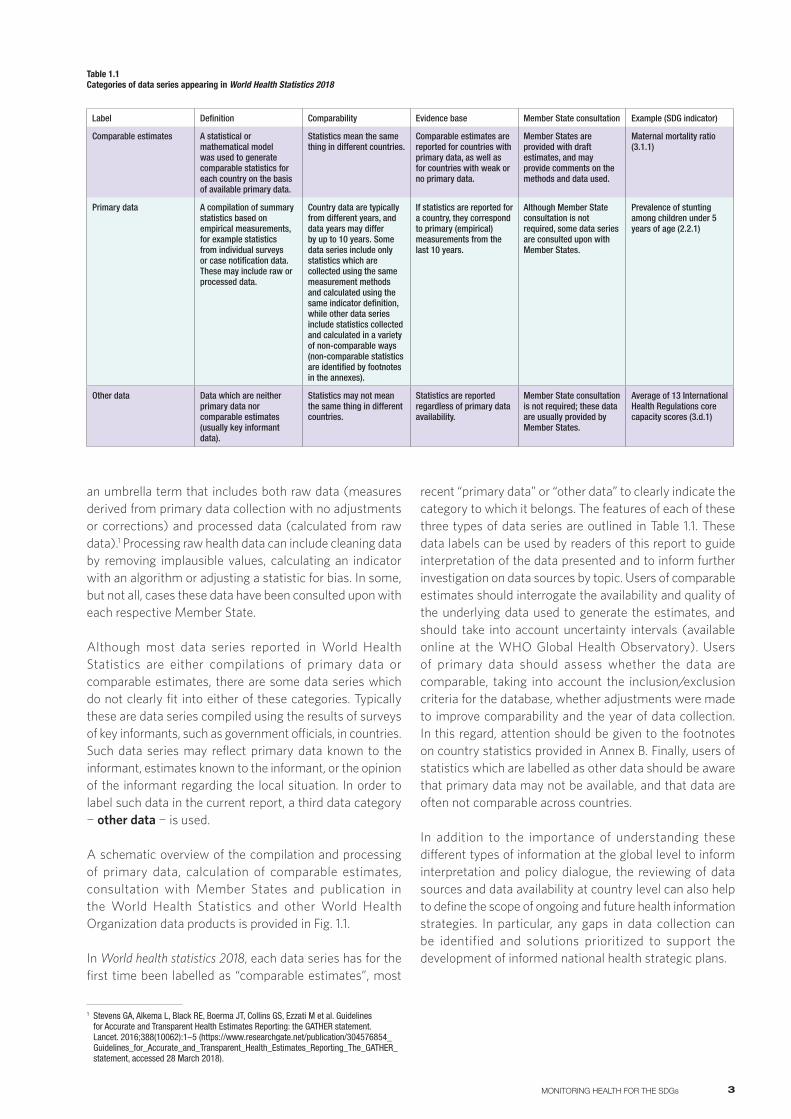
an umbrella term that includes both raw data (measures derived from primary data collection with no adjustments or corrections) and processed data (calculated from raw data).1 Processing raw health data can include cleaning data by removing implausible values, calculating an indicator with an algorithm or adjusting a statistic for bias. In some, but not all, cases these data have been consulted upon with each respective Member State.
Although most data series reported in World Health Statistics are either compilations of primary data or comparable estimates, there are some data series which do not clearly fit into either of these categories. Typically these are data series compiled using the results of surveys of key informants, such as government officials, in countries. Such data series may reflect primary data known to the informant, estimates known to the informant, or the opinion of the informant regarding the local situation. In order to label such data in the current report, a third data category ¬ other data ¬ is used.
A schematic overview of the compilation and processing of primary data, calculation of comparable estimates, consultation with Member States and publication in the World Health Statistics and other World Health Organization data products is provided in Fig. 1.1.
In World health statistics 2018, each data series has for the first time been labelled as “comparable estimates”, most
1 Stevens GA, Alkema L, Black RE, Boerma JT, Collins GS, Ezzati M et al. Guidelines for Accurate and Transparent Health Estimates Reporting: the GATHER statement. Lancet. 2016;388(10062):1–5 (https://www.researchgate.net/publication/304576854_Guidelines_for_Accurate_and_Transparent_Health_Estimates_Reporting_The_GATHER_statement, accessed 28 March 2018).
recent “primary data” or “other data” to clearly indicate the category to which it belongs. The features of each of these three types of data series are outlined in Table 1.1. These data labels can be used by readers of this report to guide interpretation of the data presented and to inform further investigation on data sources by topic. Users of comparable estimates should interrogate the availability and quality of the underlying data used to generate the estimates, and should take into account uncertainty intervals (available online at the WHO Global Health Observatory). Users of primary data should assess whether the data are comparable, taking into account the inclusion/exclusion criteria for the database, whether adjustments were made to improve comparability and the year of data collection. In this regard, attention should be given to the footnotes on country statistics provided in Annex B. Finally, users of statistics which are labelled as other data should be aware that primary data may not be available, and that data are often not comparable across countries.
In addition to the importance of understanding these different types of information at the global level to inform interpretation and policy dialogue, the reviewing of data sources and data availability at country level can also help to define the scope of ongoing and future health information strategies. In particular, any gaps in data collection can be identified and solutions prioritized to support the development of informed national health strategic plans.
Table 1.1 Categories of data series appearing in World Health Statistics 2018
Label Definition Comparability Evidence base Member State consultation Example (SDG indicator)
Comparable estimates A statistical or mathematical model was used to generate comparable statistics for each country on the basis of available primary data.
Statistics mean the same thing in different countries.
Comparable estimates are reported for countries with primary data, as well as for countries with weak or no primary data.
Member States are provided with draft estimates, and may provide comments on the methods and data used.
Maternal mortality ratio (3.1.1)
Primary data A compilation of summary statistics based on empirical measurements, for example statistics from individual surveys or case notification data. These may include raw or processed data.
Country data are typically from different years, and data years may differ by up to 10 years. Some data series include only statistics which are collected using the same measurement methods and calculated using the same indicator definition, while other data series include statistics collected and calculated in a variety of non-comparable ways (non-comparable statistics are identified by footnotes in the annexes).
If statistics are reported for a country, they correspond to primary (empirical) measurements from the last 10 years.
Although Member State consultation is not required, some data series are consulted upon with Member States.
Prevalence of stunting among children under 5 years of age (2.2.1)
Other data Data which are neither primary data nor comparable estimates (usually key informant data).
Statistics may not mean the same thing in different countries.
Statistics are reported regardless of primary data availability.
Member State consultation is not required; these data are usually provided by Member States.
Average of 13 International Health Regulations core capacity scores (3.d.1)
4 WORLD HEALTH STATISTICS: 2018
STATUS OF THE HEALTH-RELATED SDGs
Overview
While SDG 3 is the main SDG with an explicit focus on health, at least 10 other goals are also concerned with health issues. In total, more than 50 SDG indicators have been agreed upon internationally to measure health outcomes, proximal determinants of health or health-service provision (1). These health-related indicators may be grouped into the following seven thematic areas:
• reproductive, maternal, newborn and child health• infectious diseases• noncommunicable diseases (NCDs) and mental health• injuries and violence• universal health coverage (UHC) and health systems• environmental risks• health risks and disease outbreaks.
Despite all the progress made during the Millennium Development Goal (MDG) era, major challenges persist in the MDG priority areas. These challenges will need to be addressed if further progress is to be made in reducing maternal and child mortality, improving nutrition, and combating communicable diseases such as HIV/AIDS, tuberculosis (TB), and malaria. Furthermore, the crucial importance of addressing NCDs and their risk factors ¬ such
as tobacco use, harmful use of alcohol and environmental conditions ¬ within the sustainable development agenda is becoming ever clearer. However, in many countries, weak health systems remain an obstacle to progress and lead to shortages in coverage of even the most basic health services, as well as poor preparedness for health emergencies. Based on the latest available data, the global and regional situations in relation to the above seven thematic areas are summarized below. Where available, country-specific data for health-related SDG indicators are presented graphically in Annex A and in tabular form in Annex B.
2.1 Reproductive, maternal, newborn and child health
Far too many women still suffer ¬ and die from ¬ serious health issues during pregnancy and childbirth. In 2015, an estimated 303 000 women worldwide died due to maternal causes. Almost all of these deaths (99%) occurred in low- and middle-income countries (LMIC), with almost two thirds (64%) occurring in the WHO African Region (2). Reducing maternal mortality crucially depends upon ensuring that women have access to quality care before, during and after childbirth. WHO recommends that pregnant women initiate first antenatal care contact in the first trimester of
2
5MONITORING HEALTH FOR THE SDGs
pregnancy ¬ referred to as early antenatal care. Such care enables the early management of conditions which may adversely impact upon pregnancy, thus potentially reducing the risk of complications for women and newborns during and after delivery. However, globally, it is estimated that more than 40% of all pregnant women were not receiving early antenatal care in 2013 (3). Latest available data suggest that while in most high-income and upper-middle-income countries more than 90% of all births benefitted from the presence of a trained midwife, doctor or nurse, less than half of all births in several low-income and lower-middle-income countries were assisted by such skilled health personnel (4).
An estimated 77% of women of reproductive age who are married or in-union have their family planning needs met with a modern contraceptive method ¬ leaving nearly 208 million women with unmet need (5). Latest estimates indicate that that there are 12.8 million births among adolescent girls aged 15¬19 years every year, representing 44 births per 1000 adolescent girls in this age group (6). Early childbearing can increase risks for newborns as well as for the young mothers.
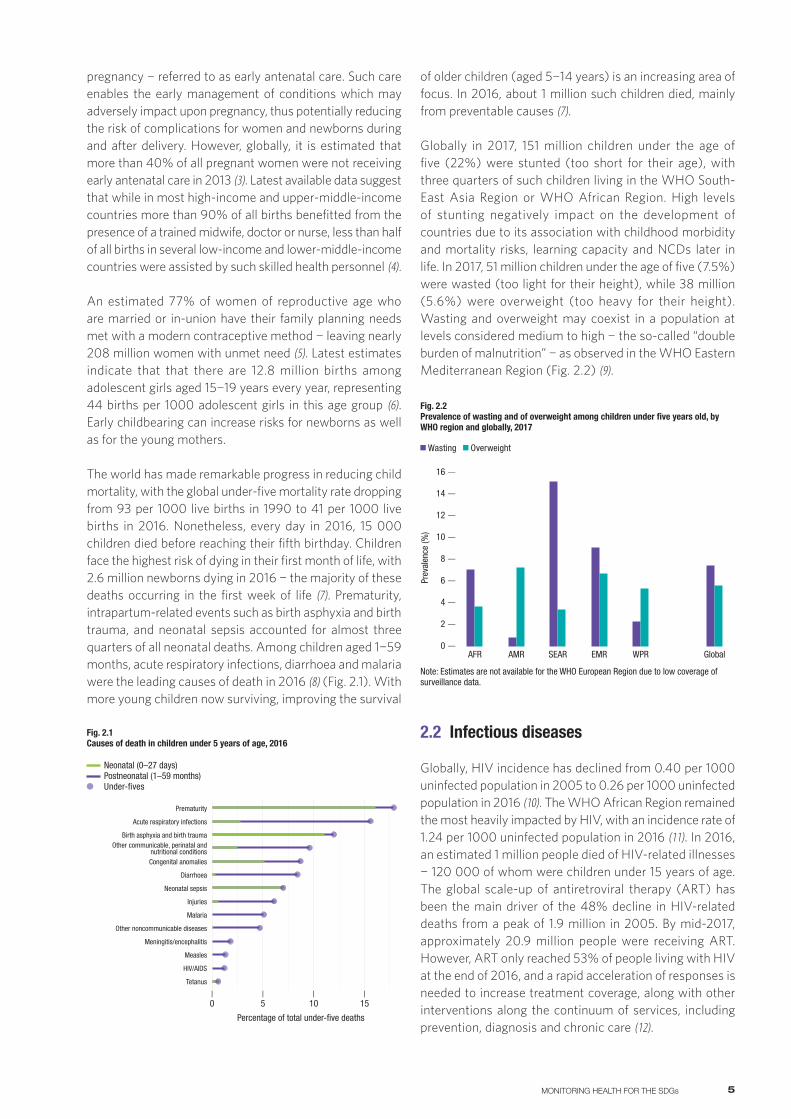
The world has made remarkable progress in reducing child mortality, with the global under-five mortality rate dropping from 93 per 1000 live births in 1990 to 41 per 1000 live births in 2016. Nonetheless, every day in 2016, 15 000 children died before reaching their fifth birthday. Children face the highest risk of dying in their first month of life, with 2.6 million newborns dying in 2016 ¬ the majority of these deaths occurring in the first week of life (7). Prematurity, intrapartum-related events such as birth asphyxia and birth trauma, and neonatal sepsis accounted for almost three quarters of all neonatal deaths. Among children aged 1¬59 months, acute respiratory infections, diarrhoea and malaria were the leading causes of death in 2016 (8) (Fig. 2.1). With more young children now surviving, improving the survival
of older children (aged 5¬14 years) is an increasing area of focus. In 2016, about 1 million such children died, mainly from preventable causes (7).
Globally in 2017, 151 million children under the age of five (22%) were stunted (too short for their age), with three quarters of such children living in the WHO South-East Asia Region or WHO African Region. High levels of stunting negatively impact on the development of countries due to its association with childhood morbidity and mortality risks, learning capacity and NCDs later in life. In 2017, 51 million children under the age of five (7.5%) were wasted (too light for their height), while 38 million (5.6%) were overweight (too heavy for their height). Wasting and overweight may coexist in a population at levels considered medium to high ¬ the so-called “double burden of malnutrition” ¬ as observed in the WHO Eastern Mediterranean Region (Fig. 2.2) (9).
4 —
2 —
6 —
10 —
8 —
14 —
Prev
alen
ce (%
)
Fig. 2.2 Prevalence of wasting and of overweight among children under five years old, by WHO region and globally, 2017
AFR AMR SEAR EMR0 —
Wasting Overweight
12 —
WPR Global
16 —
Note: Estimates are not available for the WHO European Region due to low coverage of surveillance data.
2.2 Infectious diseases
Globally, HIV incidence has declined from 0.40 per 1000 uninfected population in 2005 to 0.26 per 1000 uninfected population in 2016 (10). The WHO African Region remained the most heavily impacted by HIV, with an incidence rate of 1.24 per 1000 uninfected population in 2016 (11). In 2016, an estimated 1 million people died of HIV-related illnesses ¬ 120 000 of whom were children under 15 years of age. The global scale-up of antiretroviral therapy (ART) has been the main driver of the 48% decline in HIV-related deaths from a peak of 1.9 million in 2005. By mid-2017, approximately 20.9 million people were receiving ART. However, ART only reached 53% of people living with HIV at the end of 2016, and a rapid acceleration of responses is needed to increase treatment coverage, along with other interventions along the continuum of services, including prevention, diagnosis and chronic care (12).
Tetanus
HIV/AIDS
Measles
Meningitis/encephalitis
Other noncommunicable diseases
Malaria
Injuries
Neonatal sepsis
Diarrhoea
Congenital anomalies
Other communicable, perinataland nutritional conditions
Birth asphyxia and birth trauma
Acute respiratory infections
Prematurity
0 5 10 15Percentage of total under−five deaths
Neonatal(0−27 days)
Postneonatal(1−59 months)
Under−fives
Fig. 2.1 Causes of death in children under 5 years of age, 2016
Neonatal (0–27 days) Postneonatal (1–59 months)
Under-fives
Percentage of total under-five deaths
Prematurity
Acute respiratory infections
Birth asphyxia and birth trauma
Tetanus
HIV/AIDS
Measles
Meningitis/encephalitis
Other noncommunicable diseases
Malaria
Injuries
Neonatal sepsis
Diarrhoea
Congenital anomalies
Other communicable, perinatal and nutritional conditions
l0
l5
l15
l10
6 WORLD HEALTH STATISTICS: 2018
After unprecedented global gains in malaria control, progress has stalled. Globally, an estimated 216 million cases of malaria occurred in 2016, compared with 237 million cases in 2010, and 210 million cases in 2013. Malaria claimed the lives of approximately 445 000 people in 2016 ¬ a similar number to the previous year. The main challenge that countries face in tackling malaria is a lack of sustainable and predictable funding. Other challenges impeding the ability of countries to control and eliminate malaria include the risks posed by conflict in malaria endemic zones, anomalous climate patterns and mosquito resistance to insecticides, particularly those used for indoor residual spraying (13).
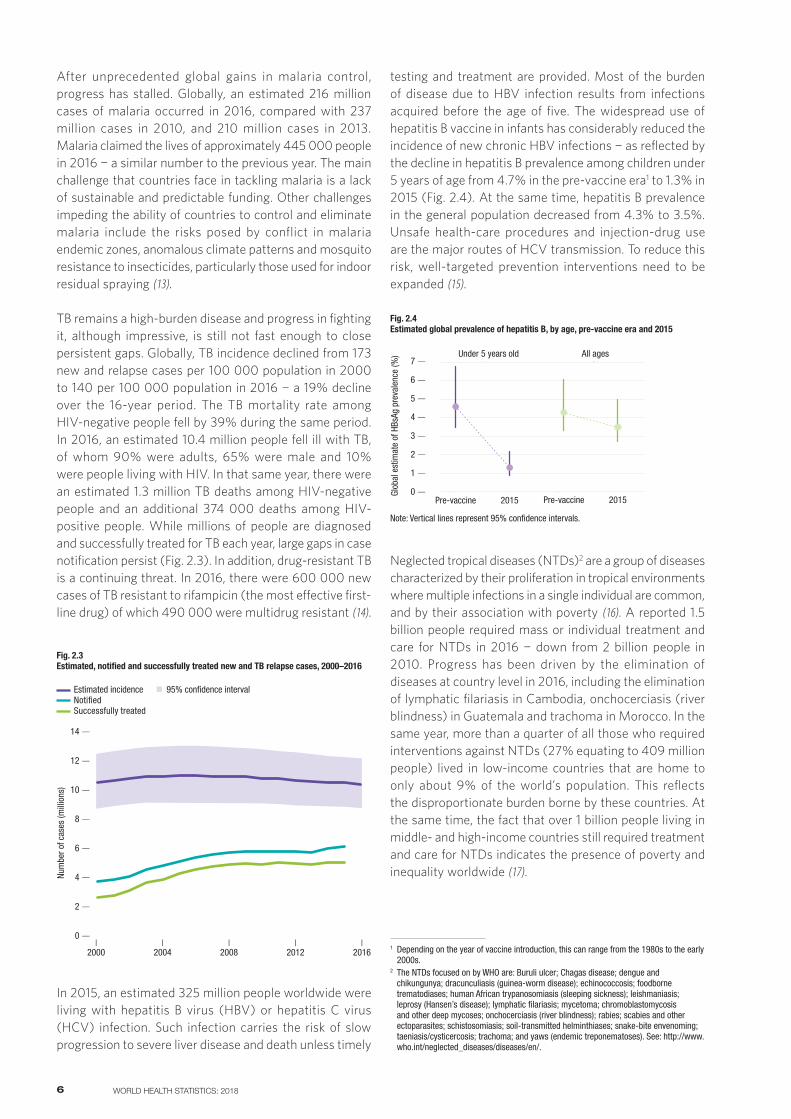
TB remains a high-burden disease and progress in fighting it, although impressive, is still not fast enough to close persistent gaps. Globally, TB incidence declined from 173 new and relapse cases per 100 000 population in 2000 to 140 per 100 000 population in 2016 ¬ a 19% decline over the 16-year period. The TB mortality rate among HIV-negative people fell by 39% during the same period. In 2016, an estimated 10.4 million people fell ill with TB, of whom 90% were adults, 65% were male and 10% were people living with HIV. In that same year, there were an estimated 1.3 million TB deaths among HIV-negative people and an additional 374 000 deaths among HIV-positive people. While millions of people are diagnosed and successfully treated for TB each year, large gaps in case notification persist (Fig. 2.3). In addition, drug-resistant TB is a continuing threat. In 2016, there were 600 000 new cases of TB resistant to rifampicin (the most effective first-line drug) of which 490 000 were multidrug resistant (14).
Fig. 2.3 Estimated, notified and successfully treated new and TB relapse cases, 2000–2016
l2000
Num
ber o
f cas
es (m
illio
ns) 10 —
6 —
4 —
8 —
12 —
0 —
2 —
l2004
l2008
14 —
l2016
l2012
Estimated incidence 95% confidence interval Notified Successfully treated
In 2015, an estimated 325 million people worldwide were living with hepatitis B virus (HBV) or hepatitis C virus (HCV) infection. Such infection carries the risk of slow progression to severe liver disease and death unless timely
testing and treatment are provided. Most of the burden of disease due to HBV infection results from infections acquired before the age of five. The widespread use of hepatitis B vaccine in infants has considerably reduced the incidence of new chronic HBV infections ¬ as reflected by the decline in hepatitis B prevalence among children under 5 years of age from 4.7% in the pre-vaccine era1 to 1.3% in 2015 (Fig. 2.4). At the same time, hepatitis B prevalence in the general population decreased from 4.3% to 3.5%. Unsafe health-care procedures and injection-drug use are the major routes of HCV transmission. To reduce this risk, well-targeted prevention interventions need to be expanded (15).
4 —
3 —
6 —Gl
obal
est
imat
e of
HBs
Ag p
reva
lenc
e (%
)
Fig. 2.4 Estimated global prevalence of hepatitis B, by age, pre-vaccine era and 2015
0 —
7 —Under 5 years old All ages
Glo
bal e
stim
ate
of H
BsAg
pre
vale
nce
(%)
Pre−vaccine
2015 Pre−vaccine
2015
Under 5 years old All ages
0
1
2
3
4
5
6
7
0
1
2
3
4
5
6
7
2 —
5 —
1 —
2015 Pre-vaccine 2015Pre-vaccine
Note: Vertical lines represent 95% confidence intervals.
Neglected tropical diseases (NTDs)2 are a group of diseases characterized by their proliferation in tropical environments where multiple infections in a single individual are common, and by their association with poverty (16). A reported 1.5 billion people required mass or individual treatment and care for NTDs in 2016 ¬ down from 2 billion people in 2010. Progress has been driven by the elimination of diseases at country level in 2016, including the elimination of lymphatic filariasis in Cambodia, onchocerciasis (river blindness) in Guatemala and trachoma in Morocco. In the same year, more than a quarter of all those who required interventions against NTDs (27% equating to 409 million people) lived in low-income countries that are home to only about 9% of the world’s population. This reflects the disproportionate burden borne by these countries. At the same time, the fact that over 1 billion people living in middle- and high-income countries still required treatment and care for NTDs indicates the presence of poverty and inequality worldwide (17).
1 Depending on the year of vaccine introduction, this can range from the 1980s to the early 2000s.
2 The NTDs focused on by WHO are: Buruli ulcer; Chagas disease; dengue and chikungunya; dracunculiasis (guinea-worm disease); echinococcosis; foodborne trematodiases; human African trypanosomiasis (sleeping sickness); leishmaniasis; leprosy (Hansen’s disease); lymphatic filariasis; mycetoma; chromoblastomycosis and other deep mycoses; onchocerciasis (river blindness); rabies; scabies and other ectoparasites; schistosomiasis; soil-transmitted helminthiases; snake-bite envenoming; taeniasis/cysticercosis; trachoma; and yaws (endemic treponematoses). See: http://www.who.int/neglected_diseases/diseases/en/.
7MONITORING HEALTH FOR THE SDGs
2.3 Noncommunicable diseases and mental health
In 2016, an estimated 41 million deaths occurred due to noncommunicable diseases (NCDs), accounting for 71% of the overall total of 57 million deaths. The majority of such deaths were caused by the four main NCDs, namely: cardiovascular disease (17.9 million deaths; accounting for 44% of all NCD deaths); cancer (9.0 million deaths; 22%); chronic respiratory disease (3.8 million deaths; 9%); and diabetes (1.6 million deaths; 4%). In 2016, a 30-year-old man had a higher risk of dying before reaching the age of 70 from one of the four main NCDs than a 30-year-old woman (22% compared to 15% respectively). Adults in low- and lower-middle-income countries faced the highest risks (21% and 23% respectively) ¬ almost double the rate for adults in high-income countries (12%). Globally, the risk of dying from any one of the four main NCDs between ages 30 and 70 decreased from 22% in 2000 to 18% in 2016 (18). Meeting the SDG target of reducing premature NCD mortality by one third by 2030 will require the acceleration of progress, including action to reduce key risk factors such as tobacco use, air pollution, unhealthy diet, physical inactivity and harmful use of alcohol ¬ as well as improved disease detection and treatment.
The worldwide level of alcohol consumption in 2016 was 6.4 litres of pure alcohol per person aged 15 years or older, a level that remained stable since 2010. Consumption levels and trends vary across WHO regions. Consumption in the WHO South-East Asia Region increased by almost 30% since 2010, while that of the WHO European Region decreased by 12%, but remaining the highest in the world in 2016 at 9.8 litres of pure alcohol per person aged 15 years or older (Fig. 2.5) (19). Available data indicate that treatment coverage for alcohol and drug-use disorders is inadequate, though further work is needed to improve the measurement of such coverage.
4 —
2 —
6 —
10 —
8 —
Tota
l alc
ohol
per
cap
ita (
> 1
5 ye
ars
of a
ge)
cons
umpt
ion
(litre
s of
pur
e al
coho
l)
Fig. 2.5 Trends in alcohol consumption among people aged 15 years or older, by WHO region and globally, 2010–2016
AFR AMR SEAR EUR0 —
2010 2016
WPR Global
12 —
EMR
Tobacco use is a major risk factor for cardiovascular disease (CVD), cancers and chronic respiratory disease (CRD), and has negative social, environmental and economic consequences. In 2016, globally more than 1.1 billion people aged 15 years or older smoked tobacco (34% of all males and 6% of all females in this age group) (20). To date, the WHO Framework Convention on Tobacco Control (WHO FCTC) (21) has been ratified by 181 Parties, representing over 90% of the global population. During the period 2015¬2016, over half (98) of WHO Member States strengthened their implementation of the WHO FCTC through various measures, such as introducing or strengthening legislation requiring health warnings to appear on tobacco product packaging (92 countries) and improving the national monitoring of tobacco use (14 countries). Although 146 countries are currently monitoring the smoking behaviour of their populations, only 109 are monitoring the use of all types of tobacco products.
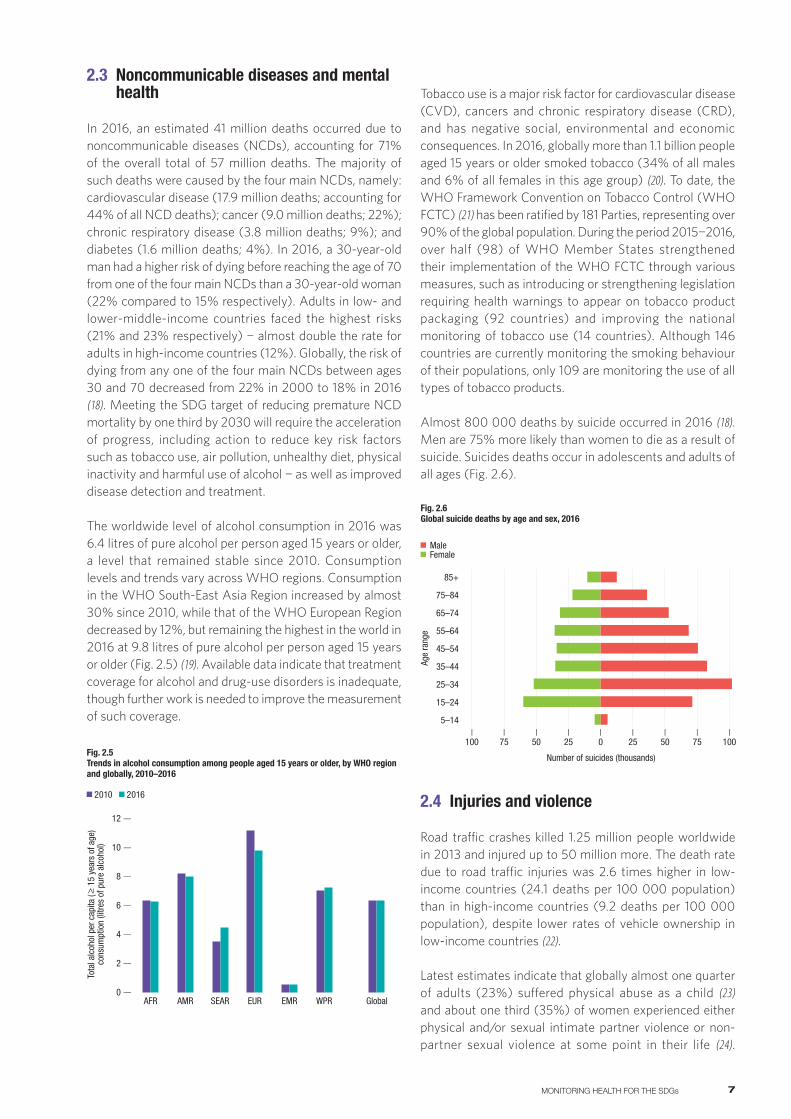
Almost 800 000 deaths by suicide occurred in 2016 (18). Men are 75% more likely than women to die as a result of suicide. Suicides deaths occur in adolescents and adults of all ages (Fig. 2.6).
l100
l75
l100
l50
l0
l25
Fig. 2.6Global suicide deaths by age and sex, 2016
5−14
15−24
25−34
35−44
45−54
55−64
65−74
75−84
85+
100 75 50 25 0 25 50 75 100Number of suicides (thousands)
Age r
ange
MaleFemale
Male Female
Number of suicides (thousands)
l75
l50
l25
Age
rang
e
85+
75–84
65–74
55–64
45–54
35–44
25–34
15–24
5–14
2.4 Injuries and violence
Road traffic crashes killed 1.25 million people worldwide in 2013 and injured up to 50 million more. The death rate due to road traffic injuries was 2.6 times higher in low-income countries (24.1 deaths per 100 000 population) than in high-income countries (9.2 deaths per 100 000 population), despite lower rates of vehicle ownership in low-income countries (22).
Latest estimates indicate that globally almost one quarter of adults (23%) suffered physical abuse as a child (23) and about one third (35%) of women experienced either physical and/or sexual intimate partner violence or non-partner sexual violence at some point in their life (24).

8 WORLD HEALTH STATISTICS: 2018
Violence against children has lifelong impacts on the health and well-being of children, families, communities and nations. Violence against women results in serious short- and long-term physical, mental, sexual and reproductive health problems, affects their children, and leads to high social and economic costs for women, their families and societies.
Over the period 2012¬2016, on average there were 11 000 deaths globally each year due to natural disasters, equating to 0.15 deaths per 100 000 population (18). Low- and lower-middle-income countries typically have higher mortality rates and struggle to meet financial, logistical and humanitarian needs for recovery from disasters.
An estimated 477 000 murders occurred globally in 2016, with four fifths of all homicide victims being male (Fig. 2.7). Men in the WHO Region of the Americas suffered the highest rate of homicide deaths at 31.8 per 100 000 population ¬ down from 33.5 per 100 000 population in 2000 (18).
Female Male
Fig. 2.7 Homicide numbers and rates per 100 000 population, by sex and by WHO region, 2016
WPR28 0002.9
SEAR60 0006.0
EUR
EMR34 0009.9
AMR156 00031.8
AFR81 00015.9
WPR
SEAR20 0002.1
EUREMR11 0003.4
AMR22 0004.3
AFR25 0004.9
It is estimated that in 2016, 180 000 people were killed in wars and conflicts, not including deaths due to the indirect effects of war and conflict such as the spread of diseases, poor nutrition and collapse of health services. The average death rate due to conflicts in the past five years (2012¬2016), at 2.5 deaths per 100 000 population, was more than double the average rate in the preceding five-year period (2007¬2011) (18).1
2.5 UHC and health systems
Globally, the average national percentage of total government expenditure devoted to health was 11.7% in 2014, ranging from 8.8% in the WHO Eastern Mediterranean Region to 13.6% in the WHO Region of the Americas.2 This measure
1 Conflict deaths include deaths due to collective violence and exclude deaths due to legal intervention.
2 Unweighted averages of country-specific data from: WHO Global Health Expenditure Database [online database]. Geneva: World Health Organization (see: http://apps.who.int/nha/database/Select/Indicators/en).
indicates the level of government spending on health within the total expenditure for public sector operations in a country, and could constitute part of SDG indicator 1.a.2 on the proportion of total government spending on essential services (education, health and social protection).
SDG Target 3.8 on achieving UHC has two indicators: 3.8.1 on coverage of essential health services and 3.8.2 on the proportion of a country’s population with large household expenditures on health relative to their total household expenditure. Both of these aspects must be measured together in order to obtain a clear picture of those who are unable to access health care and those who face financial hardship due to health-care spending. The UHC service coverage index is a single indicator computed from tracer indicators of the coverage of essential services in the areas of reproductive, maternal, newborn and child health (RMNCH), infectious disease control, NCDs and service capacity and access.
As measured by this index, the levels of service coverage varied widely across countries in 2015 ¬ from 22 to 86 (out of a maximum index score of 100). At least half of the world’s population do not have full coverage of essential health services. Among those who were able to access needed services, many suffered undue financial hardship. In 2010, an estimated 808 million people ¬ 11.7% of the world’s population ¬ spent at least 10% of their household budget (total household expenditure or income) paying out of their own pocket for health services. For 179 million of these people such payments exceeded a quarter of their household budget. An estimated 97 million people ¬ 1.4% of the world’s population ¬ were impoverished by out-of-pocket health-care spending in 2010 (at the 2011 poverty line of PPP $ 1.90 a day) (25).
Functioning health systems require a qualified health workforce that is available, equitably distributed and accessible by the population. According to the latest available data for the period 2007¬2016, 76 countries reported having less than one physician per 1000 population, and 87 countries reporting having fewer than three nursing and midwifery personnel per 1000 population. In many countries, nurses and midwives constitute more than half of the national health workforce (26).
In addition to a qualified and accessible health workforce, health system functioning also relies crucially on access to affordable essential medicines of assured quality that are available at all times in adequate amounts and in the appropriate dosage forms. The term “essential medicines” covers a wide range of medicines, including those needed for pain management and palliative care. Data from health-facility surveys conducted nationally in 29 countries during the period 2007¬2017 indicate that 64% of public-sector facilities surveyed in low-income countries and 58% of public-sector facilities surveyed in lower-middle-income countries

9MONITORING HEALTH FOR THE SDGs
stocked medicines for pain management and palliative care. Less than 10% of the public-sector health facilities surveyed in low-income countries stocked opioid analgesics such as morphine, buprenorphine, codeine, methadone and tramadol ¬ essential medications for treating the pain associated with many advanced progressive conditions (27, 28).
Latest estimates indicate that in 2016, one in 10 children worldwide did not receive even the first dose of diphtheria-tetanus-pertussis (DTP1) vaccine. In the same year, the global coverage of three doses of DTP (DTP3) vaccine among children was 86% (Fig. 2.8). As shown in Fig. 2.8, this level has essentially remained unchanged since 2010. During this same period, coverage of a second dose of measles-containing vaccine (MCV2) increased from 39% to 64% but this is still insufficient to prevent measles outbreaks and avoid preventable deaths. Global coverage
levels of more recently recommended vaccines such as rotavirus vaccine and pneumococcal-conjugated vaccine (PCV) are still under 50%. By the end of 2016, PCV had been introduced in 135 countries with global coverage of the third dose (PCV3) reaching 42%. Middle-income countries are lagging behind in the introduction of such new vaccines as their health budgets are insufficient to cover the costs and there may be a lack of external support (29, 30).
Each year, billions of dollars are spent on research and development into new or improved health products and processes, ranging from medicines to vaccines to diagnostics. But the way these funds are distributed and spent is often poorly aligned with global public health needs. Countries with comparable levels of income and health needs receive different levels of official development assistance for medical research and for basic health sectors. Of grant recipients by income group, low-income countries received only 0.3% of all direct grants (31).
In terms of monitoring health status, WHO estimates that about half of its 194 Member States register at least 80% of deaths of population aged 15 years and older, with associated information provided on cause of death (18). In addition, data-quality problems further limit the use of such information.
2.6 Environmental risks
Access to clean fuels and technologies for cooking has marginally improved and in 2016 reached 59% globally ¬ an increase of 10 percentage points since 2000. However, coverage levels vary greatly between countries (Fig. 2.9)
Fig. 2.8 Global coverage of DTP3, MCV2 and PCV3, 2000–2016
Cove
rage
(%)
80 —
60 —
50 —
40 —
70 —
90 —
0 —
30 —
20 —
10 —
100 —
DTP3
MCV2
PCV3
l2000
l2005
l2010
l2016
Fig. 2.9Proportion of population with primary reliance on clean fuels and technologies (%), 2016
0 1,700 3,400850 Kilometers
Proportion of population (%)<5
5–30
31–50
51–95
>95
Data not available
Not applicable
Note: Estimates for India, Israel, Lithuania and Portugal are under country consultation as of May 2018.
10 WORLD HEALTH STATISTICS: 2018
and population growth continues to outpace the transition to clean fuels and technologies in many countries, leaving over 3 billion people still cooking with polluting stove and fuel combinations (32). The resulting household air pollution is estimated to have caused 3.8 million deaths from NCDs (including heart disease, stroke and cancer) and acute lower respiratory infections in 2016 (18, 32).
In 2016, 91% of the world’s population did not breathe clean air, and more than half of urban population were exposed to outdoor air pollution levels at least 2.5 times above the safety standard set by WHO. It has been estimated that in 2016 outdoor air pollution in both cities and rural areas caused 4.2 million deaths worldwide. Taken together, indoor and outdoor air pollution caused an estimated 7 million deaths ¬ one in eight deaths ¬ globally in 2016 (18, 32).
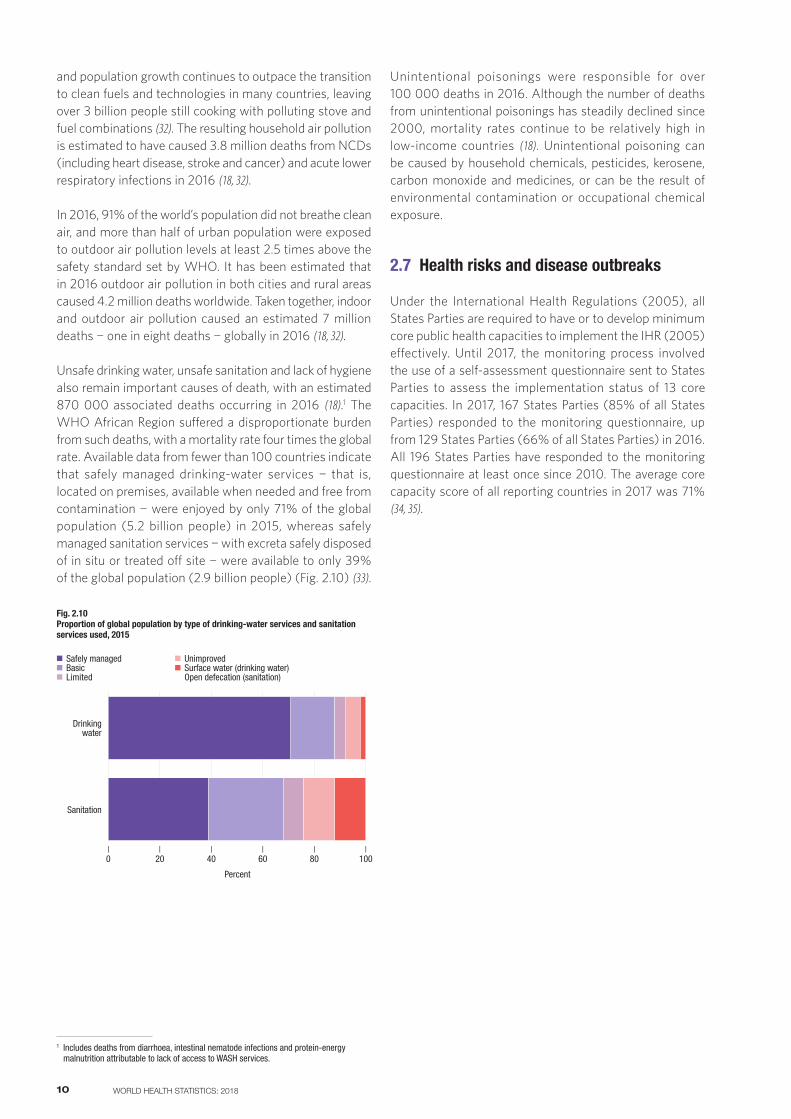
Unsafe drinking water, unsafe sanitation and lack of hygiene also remain important causes of death, with an estimated 870 000 associated deaths occurring in 2016 (18).1 The WHO African Region suffered a disproportionate burden from such deaths, with a mortality rate four times the global rate. Available data from fewer than 100 countries indicate that safely managed drinking-water services ¬ that is, located on premises, available when needed and free from contamination ¬ were enjoyed by only 71% of the global population (5.2 billion people) in 2015, whereas safely managed sanitation services ¬ with excreta safely disposed of in situ or treated off site ¬ were available to only 39% of the global population (2.9 billion people) (Fig. 2.10) (33).
l0
l20
l100
l40
l80
l60
Fig. 2.10Proportion of global population by type of drinking-water services and sanitation services used, 2015
DrinkingWater
Sanitation
Percent
Safely managed
Basic
Limited
ImprovedSurface water (Water) Open defecation (Sanitation)
0 20 40 60 80 100
DrinkingWater
Sanitation
Percent
Safely managed Basic Limited
Unimproved Surface water (drinking water)
Open defecation (sanitation)
Drinking water
Sanitation
Percent
1 Includes deaths from diarrhoea, intestinal nematode infections and protein-energy malnutrition attributable to lack of access to WASH services.
Unintentional poisonings were responsible for over 100 000 deaths in 2016. Although the number of deaths from unintentional poisonings has steadily declined since 2000, mortality rates continue to be relatively high in low-income countries (18). Unintentional poisoning can be caused by household chemicals, pesticides, kerosene, carbon monoxide and medicines, or can be the result of environmental contamination or occupational chemical exposure.
2.7 Health risks and disease outbreaks
Under the International Health Regulations (2005), all States Parties are required to have or to develop minimum core public health capacities to implement the IHR (2005) effectively. Until 2017, the monitoring process involved the use of a self-assessment questionnaire sent to States Parties to assess the implementation status of 13 core capacities. In 2017, 167 States Parties (85% of all States Parties) responded to the monitoring questionnaire, up from 129 States Parties (66% of all States Parties) in 2016. All 196 States Parties have responded to the monitoring questionnaire at least once since 2010. The average core capacity score of all reporting countries in 2017 was 71% (34, 35).

11MONITORING HEALTH FOR THE SDGs
References1. World Health Statistics 2017. Geneva: World Health Organization;
2017 (http://www.who.int/gho/publications/world_health_statistics/2017/en/, accessed 28 March 2018).
2. Trends in maternal mortality: 1990 to 2015. Estimates by WHO, UNICEF, UNFPA, World Bank Group and the United Nations Population Division. Geneva: World Health Organization; 2015 (http://www.who.int/reproductivehealth/publications/monitoring/maternal-mortality-2015/en/, accessed 12 April 2018).
3. Moller AB, Petzold M, Chou D, Say L. Early antenatal care visit: a systematic analysis of regional and global levels and trends of coverage from 1990 to 2013. Lancet Glob Health. 2017;5:e977–83 (http://www.thelancet.com/journals/langlo/article/PIIS2214-109X(17)30325-X/fulltext).
4. Joint UNICEF/WHO database 2018 of skilled health personnel, based on population-based national household survey data and routine health systems data (https://data.unicef.org/wp-content/uploads/2018/02/Interagency-SAB-Database_UNICEF_WHO_Apr-2018.xlsx).
5. Estimates and projections of family planning indicators 2018. New York (NY): United Nations, Department of Economic and Social Affairs, Population Division; 2018 (http://www.un.org/en/development/desa/population/theme/family-planning/cp_model.shtml, accessed 2 May 2018).
6. World Population Prospects. The 2017 Revision. New York (NY): United Nations, Department of Economic and Social Affairs, Population Division; 2017 (https://esa.un.org/unpd/wpp/Download/Standard/Fertility/, accessed 12 April 2018).
7. Levels & Trends in Child Mortality. Report 2017. Estimates developed by the UN Inter-agency Group for Child Mortality Estimation. United Nations Children’s Fund, World Health Organization, World Bank and United Nations. New York (NY): United Nations Children’s Fund; 2017 (http://www.childmortality.org /files_v21/download/IGME%20report%202017%20child%20mortality%20final.pdf, accessed 12 April 2018).
8. Disease burden and mortality estimates [website]. WHO-MCEE estimates for child causes of death 2000–2016. Geneva: World Health Organization (http://www.who.int/healthinfo/global_burden_disease/estimates/en/index3.html).
9. Levels and trends in child malnutrition: UNICEF/WHO/World Bank Group Joint child malnutrition estimates; Key findings of the 2018 edition. New York (NY), Geneva and Washington (DC): United Nations Children’s Fund, World Health Organization and World Bank Group; 2018.
10. AIDSinfo [online database]. Geneva: Joint United Nations Programme on HIV/AIDS (UNAIDS); 2017 (http://aidsinfo.unaids.org/, accessed 30 March 2018).
11. HIV/AIDS [online database]. Global Health Observatory (GHO) data. Geneva: World Health Organization (http://www.who.int/gho/hiv/en/, accessed 12 April 2018).)
12. Ending AIDS. Progress towards the 90–90–90 targets. Geneva: Joint United Nations Programme on HIV/AIDS (UNAIDS); 2017 (http://www.unaids.org/sites/default/files/media_asset/Global_AIDS_update_2017_en.pdf, accessed 12 April 2018).
13. World malaria report 2017. Geneva: World Health Organization; 2017 (http://www.who.int/malaria/publications/world-malaria-report-2017/en/, accessed 12 April 2018).
14. Global tuberculosis report 2017. Geneva: World Health Organization; 2017 (http://www.who.int/tb/publications/global_report/en/, accessed 12 April 2018).
15. Global hepatitis report. Geneva: World Health Organization; 2 0 1 7 ( h t t p : //a p p s .w h o . i n t / i r i s / b i t s t r e a m / h a n dle/10665/255016/9789241565455-eng.pdf?sequence=1, accessed 12 April 2018).
16. Neglected tropical diseases. Prevention, control, elimination and eradication. Report by the Secretariat to the Sixty-sixth World Health Assembly, Geneva, 20–28 May 2013. Geneva: World Health Organization; 2013. Provisional agenda item 16.2 (http://apps.who.int/gb/ebwha/pdf_files/WHA66/A66_20-en.pdf?ua=1, accessed 12 April 2018).
17. Neglected tropical diseases [online database]. Global Health Observatory (GHO) data. Geneva: World Health Organization (http://www.who.int/gho/neglected_diseases/en/); and Neglected tropical diseases. Preventive chemotherapy and transmission control (PCT) databank. Geneva: World Health Organization (http://www.who.int/neglected_diseases/preventive_chemotherapy/databank/en/).
18. Global Health Estimates 2016: Deaths by cause, age, sex, by country and by region, 2000–2016. Geneva: World Health Organization; 2018 (http://www.who.int/healthinfo/global_burden_disease/estimates/en/index1.html).
19. WHO Global Information System on Alcohol and Health (GISAH) [online database]. Global Health Observatory (GHO) data. Geneva: World Health Organization (http://www.who.int/gho/alcohol/en/).
20. WHO global report on trends in prevalence of tobacco smoking, 2nd edition. Geneva: World Health Organization; 2018 (upcoming).
21. WHO Framework Convention on Tobacco Control. Geneva: World Health Organization, 2003, updated reprint 2004; 2005 (http://www.who.int/fctc/cop/about/en/, accessed 12 April 2018).
22. Global status report on road safety 2015. Geneva: World Health Organization; 2015 (http://www.who.int/violence_injury_prevention/road_safety_status/2015/en/, accessed 12 April 2018).
23. World Health Organization, United Nations Office on Drugs and Crime and United Nations Development Programme. Global status report on violence prevention 2014. Geneva: World Health Organization; 2014 (http://www.who.int/violence_injury_prevention/violence/status_report/2014/en/, accessed 12 April 2018).
24. World Health Organization, London School of Hygiene & Tropical Medicine and South African Medical Research Council. Global and regional estimates of violence against women: prevalence and health effects of intimate partner violence and non- partner sexual violence. Geneva: World Health Organization; 2013 (http://www.who.int/reproductivehealth/publications/violence/9789241564625/en/).
25. Tracking universal health coverage: 2017 global monitoring report. Geneva and Washington (DC): World Health Organization and the International Bank for Reconstruction and Development / The World Bank; 2017 (http://apps.who.int/iris/bitstream/handle/10665/259817/9789241513555-eng.pdf?sequence=1, accessed 12 April 2018).
26. WHO Global Health Workforce Statistics. 2017 update [online database]. Geneva: World Health Organization (http://who.int/hrh/statistics/hwfstats/en/, accessed 12 April 2018).
27. Medicine Prices, Availability, Affordability & Price Components [online database]. Health Action International and WHO (http://www.haiweb.org/medicineprices/).
28. WHO Department of Essential Medicines and Health Products. MedMon Mobile Application. Geneva: World Health Organization; 2016–2017 (unpublished).
12 WORLD HEALTH STATISTICS: 2018
329. Progress and challenges with achieving universal immunization
coverage: 2016 estimates of immunization coverage. WHO/UNICEF Estimates of National Immunization Coverage (Data as of July 2017). Geneva: World Health Organization; 2017 (http://www.who.int/immunization/monitoring_surveillance/who-immuniz.pdf?ua=1, accessed 12 April 2018).
30. WHO/UNICEF estimates of national immunization coverage [online database]. July 2017 revision. Geneva: World Health Organization (http://www.who.int/immunization/monitoring_surveillance/routine/coverage/en/index4.html, accessed 12 April 2018).
31. Global Observatory on Health R&D. One year on, Global Observatory on Health R&D identifies striking gaps and inequalities (http://www.who.int/features/2018/health-research-and-development/en/, accessed 12 April 2018).
32. Public health and environment [online database]. Global Health Observatory (GHO) data. Geneva: World Health Organization (http://www.who.int/gho/phe/en/).
33. Progress on drinking water, sanitation and hygiene. 2017. Update and SDG baselines. Geneva and New York (NY): World Health Organization and the United Nations Children’s Fund; 2017 (https://washdata.org/sites/default/files/documents/reports/2018-01/JMP-2017-report-final.pdf, accessed 12 April 2018).
34. International Health Regulations (2005) Monitoring Framework [online database]. Global Health Observatory (GHO) data. Geneva: World Health Organization (http://www.who.int/gho/ ihr/en/).
35. States Parties to the International Health Regulations (2005) [website]. Geneva: World Health Organization (http://www.who. int/ihr/legal_issues/states_parties/en/, accessed 24 April 2017).
A BROAD SPECTRUM OF HEALTH CHALLENGES – SELECTED ISSUES3
14 WORLD HEALTH STATISTICS: 2018
3.1 INCREASING THE COVERAGE OF ESSENTIAL HEALTH SERVICES
Universal health coverage in the SDGs
Achieving universal health coverage (UHC) means ensuring that all people receive the essential health services they need without being exposed to financial hardship as a result. Such services include public health services to promote health and prevent illness, and to provide treatment, rehabilitation and palliative care of sufficient quality to be effective. SDG Target 3.8 commits all countries to work towards the achieving of UHC by ensuring access by all to quality essential health-care services, and to safe, effective and affordable medicines and vaccines.
In order to monitor the progress of countries towards UHC, two SDG indicators have been established ¬ one on coverage of essential services and one on financial protection.1 Taken together, these two indicators were chosen to capture the two key dimensions of health service coverage and protection against financial hardship, and are intended to be monitored jointly. In addition to the “tracer” indicators used to produce an overall index of essential health services coverage, other SDG indicators to monitor specific services have also been developed for: (a) births attended by skilled health personnel; (b) treatment interventions for substance use disorders; (c) family planning services; (d) implementation of the WHO Framework Convention on Tobacco Control; (e) vaccination coverage; (f) access to essential medicines; and (g) safely managed sanitation services. Achieving the SDG health targets on infant, child and maternal health, HIV, TB, malaria and NCDs will require the scaling-up of these and other essential services as key steps in the journey towards UHC.
One very clear aspiration of the SDGs is to “leave no one behind”. Provided that data are available for all of the tracer indicators used to produce the overall service coverage index then this index could be computed and compared across different dimensions of inequality ¬ such as level of wealth and education, geographical locations within a country, and age and sex. Currently this is not possible for all of the tracer indicators of SDG indicator 3.8.1 due to data limitations (Box 3.1). Nevertheless, a subset of indicators can be used to illustrate variations in health service inequalities across countries (1). Data on inequalities in health service coverage are most readily available in the areas of reproductive, maternal, newborn and child health (RMNCH). As these indicators are measured at the individual level in a single survey it is possible to assess
1 SDG indicator 3.8.1: Coverage of essential health services (defined as the average coverage of essential services based on tracer interventions that include reproductive, maternal, newborn and child health, infectious diseases, noncommunicable diseases and service capacity and access, among the general and the most disadvantaged population); and SDG indicator 3.8.2: Proportion of population with large household expenditures on health as a share of total household expenditure or income.
the fraction of needed services that each person receives. This measurement approach is often referred to as “co-coverage” (2).
There are three key challenges associated with monitoring effective service coverage, which is defined as service coverage that results in the maximum possible health gains. The first challenge is accurate measurement of the population in need of the service. Administrative records from service providers and self-reported prior diagnosis are often unreliable sources of information, as those who do not have access to health services remain undiagnosed. A full assessment of population need requires alternative sources of data, such as a set of survey questions or biomarkers collected in a household health examination survey. Because few conditions requiring treatment can be diagnosed in this way, this substantially limits the set of effective coverage indicators that may be reliably monitored.
Determining effectiveness of service coverage – that is, the degree to which services result in health improvement – is a second challenge. For some indicators it is possible to directly measure quality of care. For example, monitoring of treatment for hypertension can include measurement of whether hypertension is effectively controlled, and monitoring of cataract surgical coverage can include measurement of current visual acuity (5). However, generally speaking, measuring effectiveness of care is more complicated than measuring service provision.
The third key challenge is to monitor equity in access to quality health services. Making sure that no one is left behind as countries strive for UHC requires access to data disaggregated by inequality dimensions, such as wealth or geographical location. Disaggregated data are commonly available for RMNCH interventions and water and sanitation services in LMIC, as described here, as well as for malaria prevention, but may not be available for other health topics and indicators required for UHC monitoring. Therefore, investments are needed in data collection, especially for conducting regular household health examination surveys and developing electronic and harmonized facility reporting systems. In addition, it is crucial to build capacities for analysing and reporting health inequality data. Only then can countries tie this information to the policies they are implementing to improve health equity.
Box 3.1 Challenges of monitoring effective service coverage2
Inequalities in basic maternal, child and environmental health services in low- and lower-middle-income countries
To assess inequalities in the coverage of basic maternal, child and environmental health services, co-coverage data collected in Demographic and Health Surveys (DHS) on seven basic health services in low- and lower-middle-income countries were evaluated (3). The seven services were: (a) four or more antenatal care (ANC) visits; (b) at least one tetanus vaccination during pregnancy; (c) skilled birth attendance; (d) bacille Calmette–Guérin vaccination;3 (e) receiving the third dose of a vaccine containing diphtheria, tetanus and pertussis; (f) measles vaccination; and (g) access to improved drinking water in the household. All seven indicators were calculated for children aged 12¬59 months, using information available from their mothers’ most recent pregnancy where relevant (for example, for ANC visits). The analysis shows the absolute number and proportion of the basic services received by each mother–child pair, and can be summarized across key dimensions of inequality such as wealth.
2 Adapted from reference (3).3 Although this vaccine is not part of the recommended series in all countries, it is
recommended in all of the countries assessed here.

15MONITORING HEALTH FOR THE SDGs
It is clear that in low- and lower-middle-income countries large gaps persist in basic maternal, child and environmental health services coverage. These gaps are not evenly distributed across population groups (Fig. 3.1).1 Whereas 39% of mother–child pairs in these countries received at least six of the seven basic interventions, 4% of mother–child pairs received no interventions at all. When the data are stratified by wealth quintile, significant inequalities emerge. Overall, only 17% of those in households in the poorest wealth quintile (Q1) in their countries received at least six basic interventions ¬ as opposed to 74% in the richest quintile (Q5). Those in the poorest wealth quintile in each country were also the most likely to receive no interventions at all (9%). The mean number of interventions received ranged from three in the poorest wealth quintile to six in the wealthiest, with an overall average of five out of the seven interventions being received.
Relationship between average coverage and full coverage
For communicating the sheer magnitude of the task ahead in increasing health service coverage to improve health outcomes and achieve the health-related SDGs, perhaps no single statistic is more in demand than the number of people receiving needed essential health services. Fully answering this question is highly challenging because there is no dataset that contains full information on the health service needs of all people and on whether they received those services (Box 3.1). However, the analysis of co-coverage of basic services in mother–child pairs outlined above offers one way of estimating the relationship between the average coverage of such services (which is more straightforward to monitor) and the proportion of people with full coverage (3). Data obtained from 180 DHS in 63 countries were therefore analysed. To allow for measurement error, coverage with at least six of the seven basic services (85%) was used to approximate full coverage rather than coverage with all seven. This analysis demonstrated that the proportion of
1 In this paragraph and Fig. 3.1, all analyses were carried out using the most recent survey in each country during the time period 2005–2015. Data were available for 48 countries, covering 90% of all live births in 2010 in low- and lower-middle-income countries; the median survey year was 2012. To create estimates for all low- and lower-middle-income countries, country data were weighted by the number of live births in 2010 in each country.
mother–child pairs with access to at least six of the seven basic services was far lower than the average coverage of the seven interventions (Fig. 3.2).
One very important implication of this finding is that the proportion of people who have access to a full range of essential services is far lower than the average coverage of such services (as approximated by the SDG index of essential services coverage). Thus, it would not be correct to simply multiply the average coverage of essential services by population in order to obtain the number of people with full access to them.
Way forward
Gaps in basic maternal, child and environmental health service coverage remain largest among those in the poorest wealth quintile. Unless health interventions are designed to explicitly promote equity, efforts to attain UHC may lead to improvements in the national average of service coverage while at the same time worsening national inequalities (4). Health services must be structured in such a way as to ensure that no one is left behind. It is also likely to be the case that current gaps in the coverage of NCD services and hospital services will be even larger than the gaps in the basic interventions discussed here.
Fig. 3.1Proportion of mother–child pairs in low- and lower-middle-income countries, by wealth quintile and number of basic interventions received (out of seven), 2005–2015
l0
l2
l4
l6
Number of interventions received
Q1 (poorest)Q1 (poorest)Q1 (poorest)Q1 (poorest)Q1 (poorest)Q1 (poorest)Q1 (poorest)Q1 (poorest) Q2Q2Q2Q2Q2Q2Q2Q2 Q3Q3Q3Q3Q3Q3Q3Q3 Q4Q4Q4Q4Q4Q4Q4Q4 Q5 (richest) Q5 (richest) Q5 (richest) Q5 (richest) Q5 (richest) Q5 (richest) Q5 (richest) Q5 (richest)
0 2 4 6 0 2 4 6 0 2 4 6 0 2 4 6 0 2 4 60
10
20
30
40
Number of interventions received
Perc
entag
e40 —
Perc
enta
ge
30 —
20 —
10 —
0 —l0
l2
l4
l6
l0
l2
l4
l6
l0
l2
l4
l6
l0
l2
l4
l6
Q1 (poorest) Q2 Q3 Q4 Q5 (richest)
Fig. 3.2Average coverage of seven basic interventions against the proportion of mother–child pairs receiving at least six of the seven interventions
0 20 40 60 80 1000
20
40
60
80
100
Average coverage of 7 basic interventions (%)
Prop
ortio
n of
peo
ple
rece
ivin
g at
leas
t 6
of 7
bas
ic in
terv
entio
ns (%
)
Average coverage of 7 basic interventions (%)
Prop
ortio
n of
peo
ple
rece
ivin
g at
leas
t 6 o
f 7 b
asic
in
terv
entio
ns (%
)
80
100
40
60
0
20
0 20 40 60 80 100

16 WORLD HEALTH STATISTICS: 2018
Cholera and the SDGs
Cholera is an acute diarrhoeal infection caused by ingestion of food or water contaminated with the bacterium Vibrio cholerae. Cholera is extremely virulent, with a very short incubation period of between 12 hours and 5 days (6), and affects all ages. If left untreated, cholera can kill within hours.
Despite the availability of prevention, control and treatment tools and approaches, cholera remains a serious threat to public health. In addition, cholera is a stark indicator of inequality and lack of social and economic development as it disproportionately affects the world’s poorest and most vulnerable populations (7). Cholera transmission is closely linked to inadequate access to clean water and sanitation facilities. As shown in Fig. 3.3, most of the countries that reported locally transmitted cholera cases to WHO during the period 2011¬2015 were those in which only a low proportion of the population had access to basic drinking-water and sanitation services (7).
Fig. 3.31 Cholera reporting and level of access to basic drinking-water and sanitation services in LMIC, 2015 (7, 8)
global coverage
glob
al c
over
age
0
25
50
75
100
0 25 50 75 100Population using at least basic sanitation services (%)
Popu
latio
n us
ing
at le
ast b
asic
drin
king
−wat
er s
ervi
ces
(%)
Countries not reporting cholera cases
Countries reporting only imported cholera cases (no local transmission)
Countries reporting cholera cases with local transmission
Population using at least basic sanitation services (%)
Popu
latio
n us
ing
at le
ast b
asic
drin
king
-wat
er s
ervi
ces
(%)
75
100
25
50
00 25 50 75 100
Countries not reporting cholera cases Countries reporting only imported cholera cases (no local transmission) Countries reporting cholera cases with local transmission
Note: Cholera reporting status refers to the period 2011–2015.
SDG Target 3.3 calls for an end to the epidemics of communicable diseases, including waterborne diseases such as cholera, by 2030. In addition, SDG Target 3.9 aims to reduce deaths and illness from environmental pollution, including water contamination. Linked to these targets, the SDGs also strive to achieve universal and equitable access to safe and affordable drinking water (SDG Target 6.1)
1 Adapted from reference (7).
and to adequate and equitable sanitation and hygiene (SDG Target 6.2), paying special attention to vulnerable populations.
Estimated and reported burden of cholera
The exact burden of cholera is unknown as many cases and deaths go unreported. Factors contributing to the underreporting of cholera can include weak surveillance systems, inconsistencies in case definitions, lack of laboratory diagnostic capacity, and fear of impact on trade and tourism (9).
It is estimated that during the period 2008¬2012, a total of between 1.3 and 4.0 million cases of cholera occurred annually in 69 cholera-endemic countries, resulting in 21 000 to 143 000 deaths each year (10). However, the average annual number of cases and deaths reported to WHO during this same period were only around 313 000 and 5700 respectively (11¬15). In 2016, 132 121 cholera cases and 2420 deaths were reported to WHO from 38 countries, including 47 imported cases reported in nine countries (Fig. 3.4) (16).
Cholera outbreaks: the role of surveillance in early detection and response
Cholera outbreaks often hit communities already made vulnerable by tragedies such as conflicts, natural disasters and famines (7). During the 2010¬2011 cholera outbreak following an earthquake in Haiti, over 7000 people died from cholera in the country and neighbouring Dominican Republic (13, 14). During the 2016¬2017 cholera outbreak in South Sudan, more than 20 000 suspected cases and over 400 deaths were reported (Box 3.2) (17). Since January 2017, more than 1000 people have died of cholera in Somalia (18) and over 1000 in the Democratic Republic of the Congo (17). Currently, Yemen is facing the world’s largest cholera outbreak, with over 1 million suspected cases and more than 2000 deaths reported since April 2017 (19).
In order to contain outbreaks and dramatically reduce the number of cholera deaths, early detection and immediate and effective responses are vital. This requires strong early-warning surveillance system and laboratory capacities, health systems and supply readiness, and the establishment of rapid response teams. Surveillance data is also a key element in helping to prioritize areas for intervention.
3.2 CHOLERA – AN UNDERREPORTED THREAT TO PROGRESS
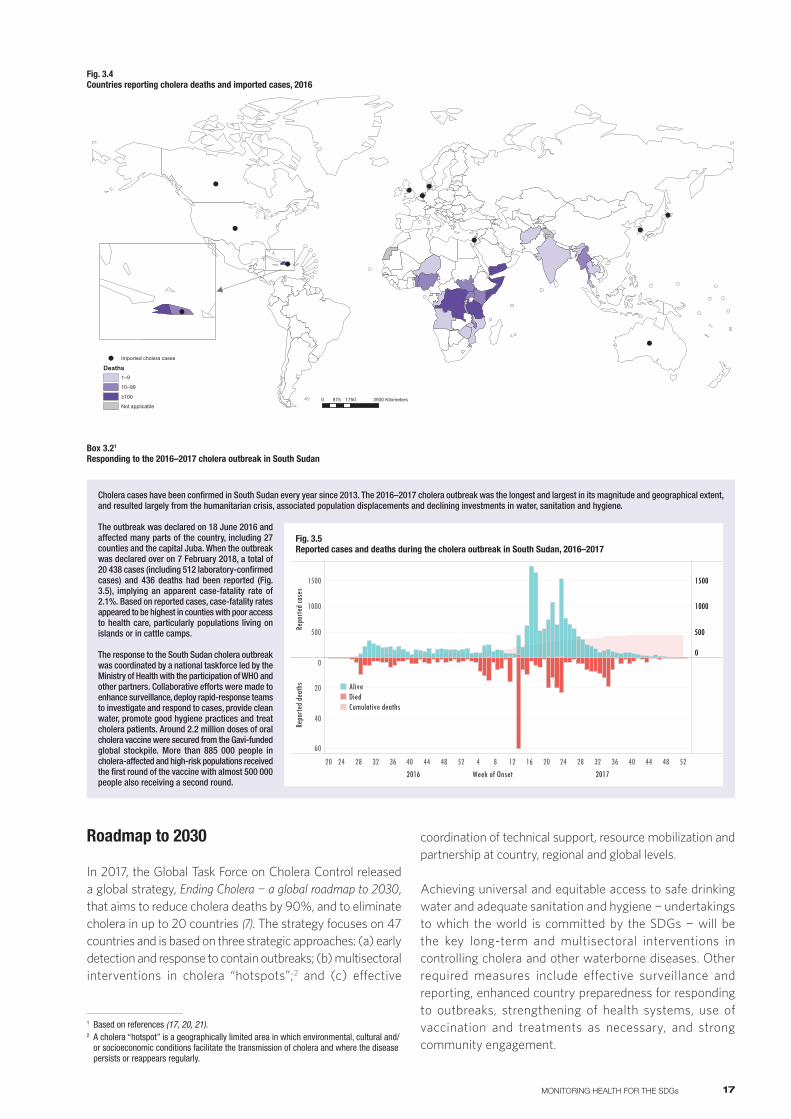
17MONITORING HEALTH FOR THE SDGs
!
!
!
!
!
!
!
!
!
0 1750 3500875 Kilometers
! Imported cholera cases
Deaths1–9
10–99
≥100
Not applicable
!
!
Cholera cases have been confirmed in South Sudan every year since 2013. The 2016–2017 cholera outbreak was the longest and largest in its magnitude and geographical extent, and resulted largely from the humanitarian crisis, associated population displacements and declining investments in water, sanitation and hygiene.
The outbreak was declared on 18 June 2016 and affected many parts of the country, including 27 counties and the capital Juba. When the outbreak was declared over on 7 February 2018, a total of 20 438 cases (including 512 laboratory-confirmed cases) and 436 deaths had been reported (Fig. 3.5), implying an apparent case-fatality rate of 2.1%. Based on reported cases, case-fatality rates appeared to be highest in counties with poor access to health care, particularly populations living on islands or in cattle camps.
The response to the South Sudan cholera outbreak was coordinated by a national taskforce led by the Ministry of Health with the participation of WHO and other partners. Collaborative efforts were made to enhance surveillance, deploy rapid-response teams to investigate and respond to cases, provide clean water, promote good hygiene practices and treat cholera patients. Around 2.2 million doses of oral cholera vaccine were secured from the Gavi-funded global stockpile. More than 885 000 people in cholera-affected and high-risk populations received the first round of the vaccine with almost 500 000 people also receiving a second round.
Box 3.21 Responding to the 2016–2017 cholera outbreak in South Sudan
Fig. 3.5Reported cases and deaths during the cholera outbreak in South Sudan, 2016–2017
20 24 28 32 36 40 44 48 52 4 8 12 16 20 24 28 32 36 40 44 48 522016 Week of Onset 2017
500
1000
1500
Repo
rted c
ases
0
20
40
60
Repo
rted d
eath
s
0
500
1000
1500
Cumu
lative
repo
rted d
eath
s
AliveDiedCumulative deaths
Roadmap to 2030
In 2017, the Global Task Force on Cholera Control released a global strategy, Ending Cholera ¬ a global roadmap to 2030, that aims to reduce cholera deaths by 90%, and to eliminate cholera in up to 20 countries (7). The strategy focuses on 47 countries and is based on three strategic approaches: (a) early detection and response to contain outbreaks; (b) multisectoral interventions in cholera “hotspots”;2 and (c) effective
1 Based on references (17, 20, 21).2 A cholera “hotspot” is a geographically limited area in which environmental, cultural and/
or socioeconomic conditions facilitate the transmission of cholera and where the disease persists or reappears regularly.
coordination of technical support, resource mobilization and partnership at country, regional and global levels.
Achieving universal and equitable access to safe drinking water and adequate sanitation and hygiene ¬ undertakings to which the world is committed by the SDGs ¬ will be the key long-term and multisectoral interventions in controlling cholera and other waterborne diseases. Other required measures include effective surveillance and reporting, enhanced country preparedness for responding to outbreaks, strengthening of health systems, use of vaccination and treatments as necessary, and strong community engagement.
Fig. 3.4Countries reporting cholera deaths and imported cases, 2016
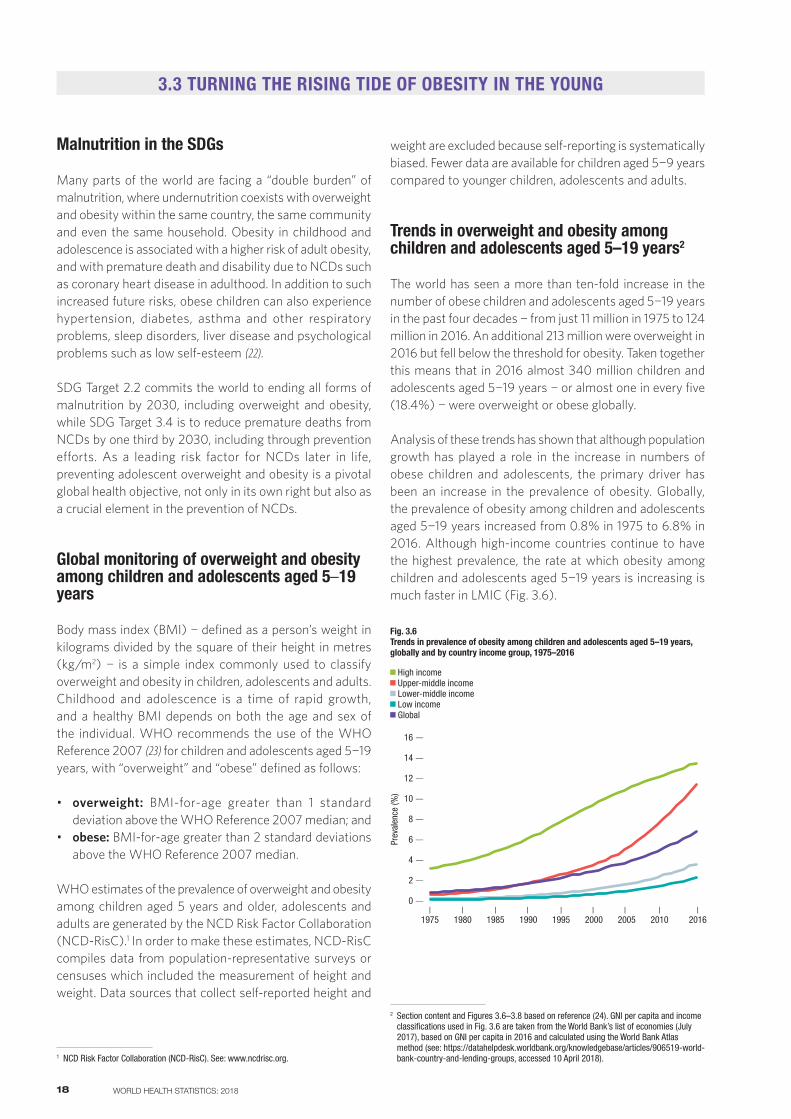
18 WORLD HEALTH STATISTICS: 2018
Malnutrition in the SDGs
Many parts of the world are facing a “double burden” of malnutrition, where undernutrition coexists with overweight and obesity within the same country, the same community and even the same household. Obesity in childhood and adolescence is associated with a higher risk of adult obesity, and with premature death and disability due to NCDs such as coronary heart disease in adulthood. In addition to such increased future risks, obese children can also experience hypertension, diabetes, asthma and other respiratory problems, sleep disorders, liver disease and psychological problems such as low self-esteem (22).
SDG Target 2.2 commits the world to ending all forms of malnutrition by 2030, including overweight and obesity, while SDG Target 3.4 is to reduce premature deaths from NCDs by one third by 2030, including through prevention efforts. As a leading risk factor for NCDs later in life, preventing adolescent overweight and obesity is a pivotal global health objective, not only in its own right but also as a crucial element in the prevention of NCDs.
Global monitoring of overweight and obesity among children and adolescents aged 5–19 years
Body mass index (BMI) ¬ defined as a person’s weight in kilograms divided by the square of their height in metres (kg/m2) ¬ is a simple index commonly used to classify overweight and obesity in children, adolescents and adults. Childhood and adolescence is a time of rapid growth, and a healthy BMI depends on both the age and sex of the individual. WHO recommends the use of the WHO Reference 2007 (23) for children and adolescents aged 5¬19 years, with “overweight” and “obese” defined as follows:
• overweight: BMI-for-age greater than 1 standard deviation above the WHO Reference 2007 median; and
• obese: BMI-for-age greater than 2 standard deviations above the WHO Reference 2007 median.
WHO estimates of the prevalence of overweight and obesity among children aged 5 years and older, adolescents and adults are generated by the NCD Risk Factor Collaboration (NCD-RisC).1 In order to make these estimates, NCD-RisC compiles data from population-representative surveys or censuses which included the measurement of height and weight. Data sources that collect self-reported height and
1 NCD Risk Factor Collaboration (NCD-RisC). See: www.ncdrisc.org.
weight are excluded because self-reporting is systematically biased. Fewer data are available for children aged 5¬9 years compared to younger children, adolescents and adults.
Trends in overweight and obesity among children and adolescents aged 5–19 years2
The world has seen a more than ten-fold increase in the number of obese children and adolescents aged 5¬19 years in the past four decades ¬ from just 11 million in 1975 to 124 million in 2016. An additional 213 million were overweight in 2016 but fell below the threshold for obesity. Taken together this means that in 2016 almost 340 million children and adolescents aged 5¬19 years ¬ or almost one in every five (18.4%) ¬ were overweight or obese globally.
Analysis of these trends has shown that although population growth has played a role in the increase in numbers of obese children and adolescents, the primary driver has been an increase in the prevalence of obesity. Globally, the prevalence of obesity among children and adolescents aged 5¬19 years increased from 0.8% in 1975 to 6.8% in 2016. Although high-income countries continue to have the highest prevalence, the rate at which obesity among children and adolescents aged 5¬19 years is increasing is much faster in LMIC (Fig. 3.6).
l1975
l1985
l1990
l2016
l1980
l1995
l2000
l2005
l2010
Fig. 3.6Trends in prevalence of obesity among children and adolescents aged 5–19 years, globally and by country income group, 1975–2016
Prev
alen
ce (%
)
16 —
12 —
10 —
8 —
14 —
0 —
6 —
4 —
2 —
High income Upper-middle income Lower-middle income Low income Global
2 Section content and Figures 3.6–3.8 based on reference (24). GNI per capita and income classifications used in Fig. 3.6 are taken from the World Bank’s list of economies (July 2017), based on GNI per capita in 2016 and calculated using the World Bank Atlas method (see: https://datahelpdesk.worldbank.org/knowledgebase/articles/906519-world-bank-country-and-lending-groups, accessed 10 April 2018).
3.3 TURNING THE RISING TIDE OF OBESITY IN THE YOUNG
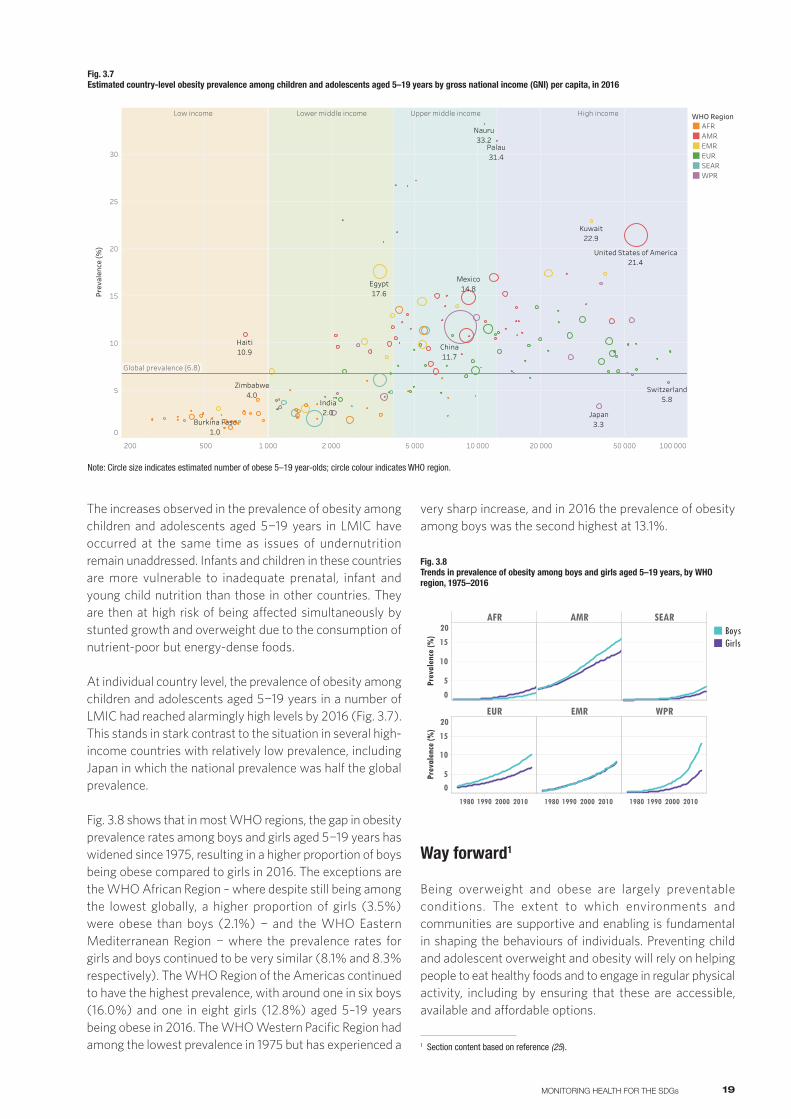
19MONITORING HEALTH FOR THE SDGs
Fig. 3.7Estimated country-level obesity prevalence among children and adolescents aged 5–19 years by gross national income (GNI) per capita, in 2016
200 500 1 000 2 000 5 000 10 000 20 000 50 000 100 000
GNI per capita, 2016 (Atlas method, US$, log scale)
0
5
10
15
20
25
30
Prev
alen
ce (%
)
China11.7
India2.0
Mexico14.8
Zimbabwe4.0
Burkina Faso1.0
Palau31.4
Nauru33.2
Japan3.3
Switzerland5.8
Kuwait22.9
Egypt17.6
United States of America21.4
Haiti10.9
Global prevalence (6.8)
Low income Lower middle income Upper middle income High income WHO RegionAFRAMREMREURSEARWPR
Note: Circle size indicates estimated number of obese 5–19 year-olds; circle colour indicates WHO region.
The increases observed in the prevalence of obesity among children and adolescents aged 5¬19 years in LMIC have occurred at the same time as issues of undernutrition remain unaddressed. Infants and children in these countries are more vulnerable to inadequate prenatal, infant and young child nutrition than those in other countries. They are then at high risk of being affected simultaneously by stunted growth and overweight due to the consumption of nutrient-poor but energy-dense foods.
At individual country level, the prevalence of obesity among children and adolescents aged 5¬19 years in a number of LMIC had reached alarmingly high levels by 2016 (Fig. 3.7). This stands in stark contrast to the situation in several high-income countries with relatively low prevalence, including Japan in which the national prevalence was half the global prevalence.
Fig. 3.8 shows that in most WHO regions, the gap in obesity prevalence rates among boys and girls aged 5¬19 years has widened since 1975, resulting in a higher proportion of boys being obese compared to girls in 2016. The exceptions are the WHO African Region – where despite still being among the lowest globally, a higher proportion of girls (3.5%) were obese than boys (2.1%) ¬ and the WHO Eastern Mediterranean Region ¬ where the prevalence rates for girls and boys continued to be very similar (8.1% and 8.3% respectively). The WHO Region of the Americas continued to have the highest prevalence, with around one in six boys (16.0%) and one in eight girls (12.8%) aged 5–19 years being obese in 2016. The WHO Western Pacific Region had among the lowest prevalence in 1975 but has experienced a
very sharp increase, and in 2016 the prevalence of obesity among boys was the second highest at 13.1%.
Fig. 3.8Trends in prevalence of obesity among boys and girls aged 5–19 years, by WHO region, 1975–2016
AFR AMR SEAR
0
5
10
15
20
Prev
alen
ce (%
)
EUR EMR WPR
1980 1990 2000 2010 1980 1990 2000 2010 1980 1990 2000 2010
05
10
15
20
Prev
alen
ce (%
)
SEXBoysGirls
Way forward1
Being overweight and obese are largely preventable conditions. The extent to which environments and communities are supportive and enabling is fundamental in shaping the behaviours of individuals. Preventing child and adolescent overweight and obesity will rely on helping people to eat healthy foods and to engage in regular physical activity, including by ensuring that these are accessible, available and affordable options.
1 Section content based on reference (25).
20 WORLD HEALTH STATISTICS: 2018
No single intervention can halt the rise in childhood and adolescent obesity on its own. A broad array of large-scale actions is needed if the rising tide of obesity is to be turned. This will require the engagement of multiple sectors, including education, communications, commerce, urban planning, agriculture and health.
Specific policy interventions to address child and adolescent obesity include:
• Implement national regulatory measures on nutrition labelling, including front-of-pack labelling, supported by public education of both adults and children to promote nutritional literacy.
• Adopt effective measures, such as legislation or regulation, to restrict the marketing of foods and beverages to children, and to ensure that schools and sporting events where children gather are free from unhealthy food marketing or promotion (including through sponsorship).
• Implement effective taxes on sugar-sweetened beverages.
• Establish and implement healthy nutritional standards for meals provided in all schools, ensuring that all foods and beverages sold and promoted in schools encourage and enable the adoption of healthy diets.
• Ensure that regular good quality physical education is included in the school curriculum for all children.
• Increase access to adequate and safe facilities in communities, schools and public spaces that allow children to be active through play, recreation and sports.
• Ensure that health services fully support breastfeeding through appropriate lactation counselling for prenatal and postpartum mothers, and through the application of the Ten Steps to Successful Breastfeeding (26) in all maternity facilities.
• Establish and disseminate national guidance for children and their parents on physical activity, regulating the use of screen-based entertainment, sleep and healthy nutrition.
21MONITORING HEALTH FOR THE SDGs
References1. Hogan DR, Stevens GA, Hosseinpoor AR, Boerma T. Monitoring
universal health coverage within the Sustainable Development Goals: development and baseline data for an index of essential health services. Lancet Glob Health. 2018;6(2):e152–68 (http://www.thelancet.com/journals/langlo/article/PIIS2214-109X(17)30472-2/fulltext, accessed 22 March 2018).
2. Victora CG, Fenn B, Bryce J, Kirkwood BR. Co-coverage of preventive interventions and implications for child-survival strategies: evidence from national surveys. Lancet. 2005;366(9495):1460–6 (http://www.thelancet.com/journals/lancet/article/PIIS0140-6736(05)67599-X/fulltext, accessed 22 March 2018).
3. Tracking universal health coverage: 2017 global monitoring report. Geneva and Washington (DC): World Health Organization and the International Bank for Reconstruction and Development / The World Bank; 2017 (http://apps.who.int/iris/bitstream/handle/10665/259817/9789241513555-eng.pdf?sequence=1, accessed 26 March 2018).
4. Hosseinpoor AR, Bergen N, Koller T, Prasad A, Schlotheuber A, Valentine N et al. Equity-oriented monitoring in the context of universal health coverage. PLoS Med. 2014;11(9):e1001727 (http://journals.plos.org/plosmedicine/article?id=10.1371/journal.pmed.1001727, accessed 22 March 2018).
5. Ramke J, Gilbert CE, Lee AC, Ackland P, Limburg H, Foster A. Effective cataract surgical coverage: an indicator for measuring quality-of-care in the context of universal health coverage. PloS One. 2017;12(3):e0172342 (https://www.ncbi.nlm.nih.gov/pmc/articles/PMC5382971/, accessed 22 March 2018).
6. Azman AS, Rudolph KE, Cummings DAT, Lessler J. The incubation period of cholera: a systematic review. J Infect. 2013;66(5):432–8 (https://www.ncbi.nlm.nih.gov/pmc/articles/PMC3677557/, accessed 25 March 2018).
7. Global Task Force on Cholera Control. Ending cholera – a global roadmap to 2030. Geneva: World Health Organization; 2017 (http://www.who.int/cholera/publications/global-roadmap.pdf?ua=1, accessed 25 March 2018).
8. Progress on drinking water, sanitation and hygiene. 2017. Update and SDG baselines. Geneva and New York (NY): World Health Organization and the United Nations Children’s Fund; 2017 (https://washdata.org/sites/default/files/documents/reports/2018-01/JMP-2017-report-final.pdf, accessed 12 April 2018).
9. Interim guidance document on cholera surveillance. Global Task Force on Cholera Control (GTFCC) Surveillance Working Group; 2017 (http://www.who.int/cholera/task_force/GTFCC-Guidance-cholera-surveillance.pdf?ua=1, accessed 25 March 2018).
10. Ali M, Nelson AR, Lopez AL, Sack DA. Updated global burden of cholera in endemic countries. PLoS Negl Trop Dis. 2015;9(6):e0003832 (https://www.ncbi.nlm.nih.gov/pmc/articles/PMC4455997/, accessed 25 March 2018).
11. Cholera: global surveillance summary, 2008. Wkly Epidemiol Rec. 2009;84(31):309–24 (http://www.who.int/wer/2009/wer8431.pdf?ua=1, accessed 9 April 2018).
12. Cholera, 2009. Wkly Epidemiol Rec. 2010;85(31):293–308 (http://www.who.int/wer/2010/wer8531.pdf?ua=1, accessed 9 April 2018).
13. Cholera, 2010. Wkly Epidemiol Rec. 2011;86(31):325–40 (http://www.who.int/wer/2011/wer8631.pdf?ua=1, accessed 9 April 2018).
14. Cholera, 2011. Wkly Epidemiol Rec. 2012;87(31-32):289–304 (http://www.who.int/wer/2012/wer8731_32.pdf?ua=1, accessed 9 April 2018).
15. Cholera, 2012. Wkly Epidemiol Rec. 2013;88(31):321–36 (http://www.who.int/wer/2013/wer8831.pdf?ua=1, accessed 9 April 2018).
16. Cholera, 2016. Wkly Epidemiol Rec. 2017;92(36):521–33 (http://apps.who.int/iris/bitstream/10665/258910/1/WER9236.pdf?ua=1, accessed 25 March 2018).
17. Weekly bulletin on outbreaks and other emergencies. Week 6: 9 February 2018. Brazzaville: WHO Regional Office for Africa; 2018 (http://apps.who.int/iris/bitstream/10665/260157/1/OEW6-030922018.pdf, accessed 25 March 2018).
18. Cholera outbreak updates [website]. Cairo: WHO Regional Office for the Eastern Mediterranean (http://www.emro.who.int/health-topics/cholera-outbreak/outbreaks.html, accessed 25 March 2018).
19. Cholera situation in Yemen. March 2018. Cairo: WHO Regional Office for the Eastern Mediterranean (http://applications.emro.who.int/docs/EMROPub_2018_EN_16998.pdf?ua=1, accessed 9 April 2018).
20. Prevention for a cholera free world [website]. Geneva: World Health Organization; September 2017 (http://www.who.int/features/2017/cholera-overview/en/, accessed 25 March 2018).
21. South Sudan declares the end of its longest cholera outbreak [website]. Brazzaville: WHO Regional Office for Africa (http://www.afro.who.int/news/south-sudan-declares-end-its-longest-cholera-outbreak, accessed 25 March 2018).
22. Global nutrition targets 2025: Childhood Overweight, Policy brief. Geneva: World Health Organization; 2014 (WHO/NMH/NHD/14.6; http://apps.who.int/iris/bitstream/handle/10665/149021/WHO_NMH_NHD_14.6_eng.pdf; jsessionid=219C715B3107EB472EC5D036186F03CA?sequence=2, accessed 10 April 2018).
23. De Onis M, Onyango AW, Borghi E, Siyam A, Nishida C, Siekmann J. Development of a WHO growth reference for school-aged children and adolescents. Bull World Health Organ. 2007;85:660–7 (http://www.who.int/growthref/growthref_who_bull.pdf?ua=1, accessed 10 April 2018).
24. NCD Risk Factor Collaboration (NCD-RisC). Worldwide trends in body-mass index, underweight, overweight, and obesity from 1975 to 2016: a pooled analysis of 2416 population-based measurement studies in 128·9 million children, adolescents, and adults. Lancet. 2017;390(10113):2627–42 (http://www.thelancet.com/journals/lancet/article/PIIS0140-6736(17)32129-3/fulltext, accessed 23 March 2018).
25. Report of the Commission on Ending Childhood Obesity. Implementation plan: Executive summary. Geneva: World Health Organization; 2017 (WHO/NMH/PND/ECHO/17.1; http://apps.who.int/iris/bitstream/handle/10665/259349/WHO-NMH-PND-ECHO-17.1-eng.pdf?sequence=1, accessed 10 April 2018).
26. Protecting, promoting and supporting breast-feeding: the special role of maternity services. A Joint WHO/UNICEF Statement. Geneva: World Health Organization; 1989 (http://apps.who.int/iris/bitstream/handle/10665/39679/9241561300.pdf?sequence=1, accessed 10 April 2018).

22 WORLD HEALTH STATISTICS: 2018
ANNEX A Summaries of selected health-related SDG indicators
Explanatory notes
The statistics shown below represent official WHO statistics for selected health-related SDG indicators based on evidence available in early 2018. They have been compiled primarily from publications and databases produced and maintained by WHO or United Nations groups of which WHO is a member. A number of statistics have been derived from data produced and maintained by other international organizations. For each indicator, the source of the data series is provided. Member States may have more data than are available for global monitoring.
For the first time in the World Health Statistics series, the type of data used for each data series (comparable estimates, primary data or other data) is also provided. Please refer to Part 1 of this report for more information on these different data categories.
It is important to note that comparable estimates are subject to considerable uncertainty, especially for countries where the availability and quality of the underlying primary data is limited. Uncertainty intervals and other details on the indicators and statistics presented here can be found online at the WHO Global Health Observatory.1
While every effort has been made to maximize the comparability of statistics across countries and over time, users are advised that data series based on primary data may differ in terms of the definitions, data-collection methods, population coverage and estimation methods used. Please refer to the accompanying footnotes for more details.
In some cases, as SDG indicator definitions are being refined and baseline data are being collected, proxy indicators have been presented in this annex and have been clearly indicated as such through the use of accompanying footnotes.
For indicators with a reference period expressed as a range, country values refer to the latest available year in the range unless otherwise noted. Within each WHO region, countries are sorted in ascending order for mortality, incidence and risk-factor indicators, and in descending order for coverage and capacity indicators. Countries for which data are not available or applicable are sorted alphabetically at the end of the respective regional listing.
Changes in the values shown for indicators reported on in previous editions in the World Health Statistics series should not be assumed to accurately reflect underlying trends. This applies to all data types (comparable estimates, primary data and other data) and all reporting levels (country, regional and global). The data presented here may also differ from, and should not be regarded as, the official national statistics of individual WHO Member States.
1 The Global Health Observatory (GHO) is WHO’s portal providing access to data and analyses for monitoring the global health situation. See: http://www.who.int/gho/en/, accessed 29 March 2018.

Cabo Verde
Mauritius
Botswana
South Africa
Algeria
Sao Tome and Principe
Zambia
Namibia
Rwanda
Gabon
Senegal
Ghana
Comoros
Equatorial Guinea
Uganda
Ethiopia
Madagascar
Togo
Burkina Faso
Swaziland
United Republic of Tanzania
Benin
Congo
Zimbabwe
Angola
Lesotho
Mozambique
Eritrea
Kenya
Guinea-Bissau
Niger
Mali
Cameroon
Mauritania
Malawi
Côte d'Ivoire
Guinea
Democratic Republic of the Congo
Gambia
Burundi
Liberia
South Sudan
Nigeria
Chad
Central African Republic
Sierra Leone
Seychelles
882
856
814
789
725
712
706
693
679
645
634
602
596
587
553
549
510
501
489
487
477
443
442
405
398
389
371
368
353
353
343
342
335
319
315
291
290
265
224
156
140
138
129
53
42
1 360
AFRCanada
United States of America
Uruguay
Chile
Costa Rica
Barbados
Grenada
Belize
Mexico
Cuba
Brazil
Saint Vincent and the Grenadines
Saint Lucia
Argentina
El Salvador
Trinidad and Tobago
Colombia
Ecuador
Peru
Bahamas
Guatemala
Jamaica
Dominican Republic
Panama
Venezuela (Bolivarian Republic of)
Honduras
Paraguay
Nicaragua
Suriname
Bolivia (Plurinational State of)
Guyana
Haiti
Antigua and Barbuda
Dominica
Saint Kitts and Nevis
359
229
206
155
150
132
129
95
94
92
89
88
80
68
64
64
63
54
52
48
45
44
39
38
28
27
27
25
22
15
14
7
AMR
Thailand
Sri Lanka
Maldives
Democratic People's Republic ofKorea
Indonesia
Bhutan
India
Bangladesh
Myanmar
Timor-Leste
Nepal
126
148
174
176
178
215
258
20
30
68
82
SEAR
Finland
Greece
Iceland
Poland
Austria
Belarus
Czechia
Italy
Sweden
Israel
Norway
Spain
Switzerland
Denmark
Germany
Slovakia
Belgium
Cyprus
Montenegro
Netherlands
Croatia
France
Ireland
The former Yugoslav Republic of ..
Estonia
Malta
Slovenia
United Kingdom
Lithuania
Luxembourg
Portugal
Bosnia and Herzegovina
Bulgaria
Kazakhstan
Turkey
Hungary
Serbia
Latvia
Republic of Moldova
Ukraine
Armenia
Azerbaijan
Russian Federation
Albania
Romania
Tajikistan
Georgia
Uzbekistan
Turkmenistan
Kyrgyzstan
Andorra
Monaco
San Marino
76
42
36
36
32
31
29
25
25
25
24
23
18
17
17
16
12
11
11
10
10
10
9
9
9
9
8
8
8
8
7
7
7
7
6
6
6
5
5
5
5
4
4
4
4
4
3
3
3
3
EURKuwait
United Arab Emirates
Libya
Saudi Arabia
Qatar
Bahrain
Lebanon
Oman
Iran (Islamic Republic of)
Egypt
Iraq
Jordan
Tunisia
Syrian Arab Republic
Morocco
Pakistan
Djibouti
Sudan
Yemen
Afghanistan
Somalia 732
396
385
311
229
178
121
68
62
58
50
33
25
17
15
15
13
12
9
6
4
EMR
Japan
Australia
Singapore
New Zealand
Republic of Korea
Brunei Darussalam
China
Fiji
Malaysia
Mongolia
Samoa
Viet Nam
Vanuatu
Kiribati
Micronesia (Federated States of)
Philippines
Solomon Islands
Tonga
Cambodia
Lao People's Democratic Republic
Papua New Guinea
Cook Islands
Marshall Islands
Nauru
Niue
Palau
Tuvalu
215
197
161
124
114
114
100
90
78
54
51
44
40
30
27
23
11
11
10
6
5
WPRThe former Yugoslav Republic of Macedonia
23MONITORING HEALTH FOR THE SDGs
MATERNAL MORTALITYSDG Target 3.1By 2030, reduce the global maternal mortality ratio to less than 70 per 100 000 live births
Indicator 3.1.1: Maternal mortality ratio
Maternal mortality ratio (per 100 000 live births), 20151
Data type: Comparable estimates
Indicator 3.1.1 Maternal mortality
1 Trends in maternal mortality: 1990 to 2015. Estimates by WHO, UNICEF, UNFPA, World Bank Group and the United Nations Population Division. Geneva: World Health Organization; 2015 (http://www.who.int/reproductivehealth/publications/monitoring/maternal-mortality-2015/en/, accessed 29 March 2018). WHO Member States with a population of less than 100 000 in 2015 were not included in the analysis.
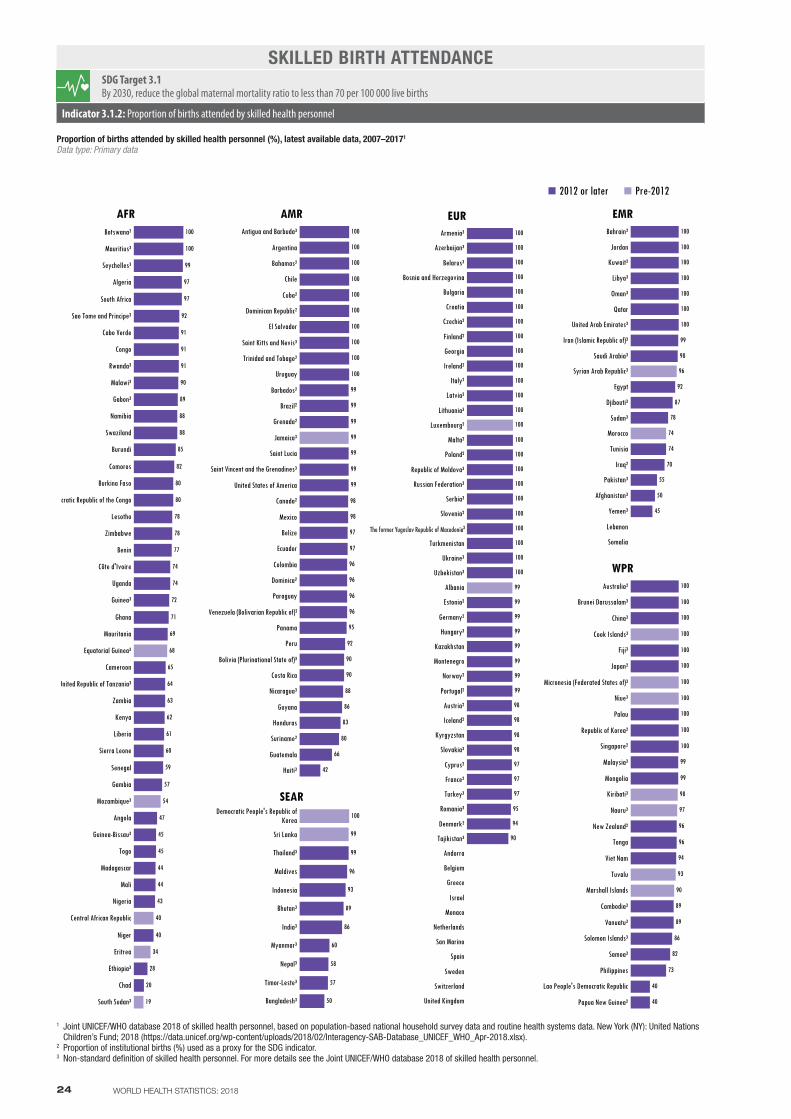
Botswana²
Mauritius³
Seychelles³
Algeria
South Africa
Sao Tome and Principe³
Cabo Verde
Congo
Rwanda³
Malawi³
Gabon³
Namibia
Swaziland
Burundi
Comoros
Burkina Faso
Democratic Republic of the Congo
Lesotho
Zimbabwe
Benin
Côte d'Ivoire
Uganda
Guinea³
Ghana
Mauritania
Equatorial Guinea³
Cameroon
United Republic of Tanzania³
Zambia
Kenya
Liberia
Sierra Leone
Senegal
Gambia
Mozambique³
Angola
Guinea-Bissau³
Togo
Madagascar
Mali
Nigeria
Central African Republic
Niger
Eritrea
Ethiopia³
Chad
South Sudan³
68
54
40
34
19
100
100
99
97
97
92
91
91
91
90
89
88
88
85
82
80
80
78
78
77
74
74
72
71
69
65
64
63
62
61
60
59
57
47
45
45
44
44
43
40
28
20
AFRAntigua and Barbuda³
Argentina
Bahamas²
Chile
Cuba²
Dominican Republic²
El Salvador
Saint Kitts and Nevis³
Trinidad and Tobago²
Uruguay
Barbados²
Brazil²
Grenada²
Jamaica³
Saint Lucia
Saint Vincent and the Grenadines³
United States of America
Canada²
Mexico
Belize
Ecuador
Colombia
Dominica²
Paraguay
Venezuela (Bolivarian Republic of)²
Panama
Peru
Bolivia (Plurinational State of)³
Costa Rica
Nicaragua³
Guyana
Honduras
Suriname²
Guatemala
Haiti³
99
100
100
100
100
100
100
100
100
100
100
99
99
99
99
99
99
98
98
97
97
96
96
96
96
95
92
90
90
88
86
83
80
66
42
AMR
Democratic People's Republic ofKorea
Sri Lanka
Thailand³
Maldives
Indonesia
Bhutan³
India³
Myanmar³
Nepal³
Timor-Leste³
Bangladesh³
100
50
57
58
60
86
89
93
96
99
99
SEAR
Armenia³
Azerbaijan³
Belarus³
Bosnia and Herzegovina
Bulgaria
Croatia
Czechia²
Finland²
Georgia
Ireland²
Italy²
Latvia²
Lithuania³
Luxembourg²
Malta²
Poland²
Republic of Moldova³
Russian Federation³
Serbia³
Slovenia²
The former Yugoslav Republic of ..
Turkmenistan
Ukraine³
Uzbekistan³
Albania
Estonia²
Germany²
Hungary³
Kazakhstan
Montenegro
Norway²
Portugal²
Austria²
Iceland²
Kyrgyzstan
Slovakia³
Cyprus²
France²
Turkey³
Romania³
Denmark²
Tajikistan³
Andorra
Belgium
Greece
Israel
Monaco
Netherlands
San Marino
Spain
Sweden
Switzerland
United Kingdom
100
99
100
100
100
100
100
100
100
100
100
100
100
100
100
100
100
100
100
100
100
100
100
100
100
99
99
99
99
99
99
99
98
98
98
98
97
97
97
95
94
90
EURBahrain²
Jordan
Kuwait²
Libya³
Oman³
Qatar
United Arab Emirates³
Iran (Islamic Republic of)³
Saudi Arabia³
Syrian Arab Republic³
Egypt
Djibouti³
Sudan³
Morocco
Tunisia
Iraq²
Pakistan³
Afghanistan³
Yemen³
Lebanon
Somalia
96
74
100
100
100
100
100
100
100
99
98
92
87
78
74
70
55
50
45
EMR
Australia²
Brunei Darussalam³
China³
Cook Islands³
Fiji³
Japan²
Micronesia (Federated States of)³
Niue³
Palau
Republic of Korea²
Singapore²
Malaysia³
Mongolia
Kiribati³
Nauru³
New Zealand²
Tonga
Viet Nam
Tuvalu
Marshall Islands
Cambodia³
Vanuatu³
Solomon Islands³
Samoa³
Philippines
Lao People's Democratic Republic
Papua New Guinea²
100
100
100
98
97
93
90
100
100
100
100
100
100
100
100
99
99
96
96
94
89
89
86
82
73
40
40
WPR
2012 or later Pre-2012
The former Yugoslav Republic of Macedonia3
24 WORLD HEALTH STATISTICS: 2018
SKILLED BIRTH ATTENDANCESDG Target 3.1By 2030, reduce the global maternal mortality ratio to less than 70 per 100 000 live births
Indicator 3.1.2: Proportion of births attended by skilled health personnel
Proportion of births attended by skilled health personnel (%), latest available data, 2007–20171
Data type: Primary data
Indicator 3.1.2 Skilled birth attendance
1 Joint UNICEF/WHO database 2018 of skilled health personnel, based on population-based national household survey data and routine health systems data. New York (NY): United Nations Children’s Fund; 2018 (https://data.unicef.org/wp-content/uploads/2018/02/Interagency-SAB-Database_UNICEF_WHO_Apr-2018.xlsx).
2 Proportion of institutional births (%) used as a proxy for the SDG indicator.3 Non-standard definition of skilled health personnel. For more details see the Joint UNICEF/WHO database 2018 of skilled health personnel.
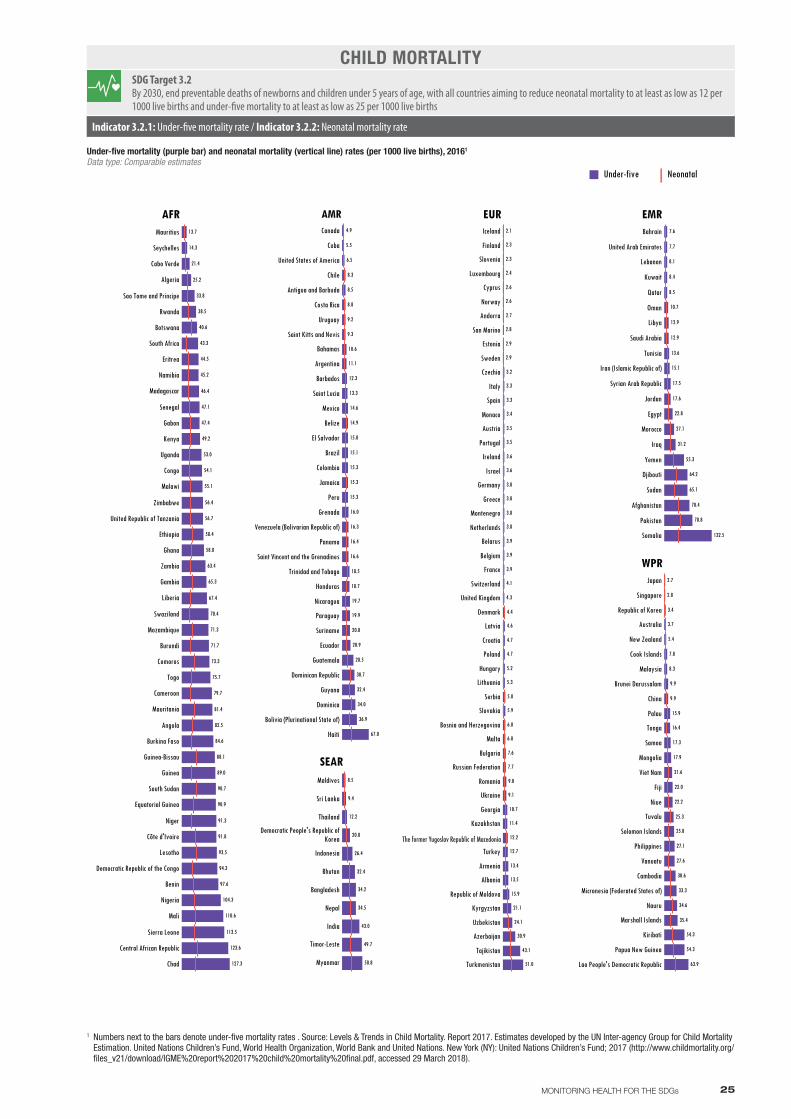
25MONITORING HEALTH FOR THE SDGs
CHILD MORTALITYSDG Target 3.2By 2030, end preventable deaths of newborns and children under 5 years of age, with all countries aiming to reduce neonatal mortality to at least as low as 12 per 1000 live births and under-five mortality to at least as low as 25 per 1000 live births
Indicator 3.2.1: Under-five mortality rate / Indicator 3.2.2: Neonatal mortality rate
Under-five mortality (purple bar) and neonatal mortality (vertical line) rates (per 1000 live births), 20161
Data type: Comparable estimates
Iceland
Finland
Slovenia
Luxembourg
Cyprus
Norway
Andorra
San Marino
Estonia
Sweden
Czechia
Italy
Spain
Monaco
Austria
Portugal
Ireland
Israel
Germany
Greece
Montenegro
Netherlands
Belarus
Belgium
France
Switzerland
United Kingdom
Denmark
Latvia
Croatia
Poland
Hungary
Lithuania
Serbia
Slovakia
Bosnia and Herzegovina
Malta
Bulgaria
Russian Federation
Romania
Ukraine
Georgia
Kazakhstan
The former Yugoslav Republic of ..
Turkey
Armenia
Albania
Republic of Moldova
Kyrgyzstan
Uzbekistan
Azerbaijan
Tajikistan
Turkmenistan 51.0
13.5
10.7
11.4
12.2
12.7
13.4
15.9
21.1
24.1
30.9
43.1
3.3
3.4
3.5
3.5
3.6
3.6
3.8
3.8
3.8
3.8
3.9
3.9
3.9
4.1
2.7
4.4
4.6
4.7
4.7
5.2
5.3
5.8
5.9
6.0
6.8
7.6
7.7
9.0
2.1
2.3
2.3
2.4
2.6
2.6
4.3
2.8
2.9
2.9
3.2
3.3
9.1
EURBahrain
United Arab Emirates
Lebanon
Kuwait
Qatar
Oman
Libya
Saudi Arabia
Tunisia
Iran (Islamic Republic of)
Syrian Arab Republic
Jordan
Egypt
Morocco
Iraq
Yemen
Djibouti
Sudan
Afghanistan
Pakistan
Somalia 132.5
10.7
12.9
12.9
13.6
15.1
17.5
17.6
22.8
27.1
31.2
55.3
64.2
65.1
70.4
78.8
7.6
7.7
8.1
8.4
8.5
EMRCanada
Cuba
United States of America
Chile
Antigua and Barbuda
Costa Rica
Uruguay
Saint Kitts and Nevis
Bahamas
Argentina
Barbados
Saint Lucia
Mexico
Belize
El Salvador
Brazil
Colombia
Jamaica
Peru
Grenada
Venezuela (Bolivarian Republic of)
Panama
Saint Vincent and the Grenadines
Trinidad and Tobago
Honduras
Nicaragua
Paraguay
Suriname
Ecuador
Guatemala
Dominican Republic
Guyana
Dominica
Bolivia (Plurinational State of)
Haiti
15.3
20.0
20.9
28.5
30.7
32.4
34.0
36.9
10.6
11.1
12.3
13.3
14.6
14.9
15.0
15.1
15.3
67.0
15.3
16.0
16.3
16.4
16.6
18.5
18.7
19.7
19.9
5.5
6.5
8.3
8.5
8.8
9.2
9.3
4.9
AMR
Maldives
Sri Lanka
Thailand
Democratic People's Republic ofKorea
Indonesia
Bhutan
Bangladesh
Nepal
India
Timor-Leste
Myanmar
12.2
20.0
26.4
32.4
34.2
34.5
43.0
49.7
50.8
8.5
9.4
SEAR
Mauritius
Seychelles
Cabo Verde
Algeria
Sao Tome and Principe
Rwanda
Botswana
South Africa
Eritrea
Namibia
Madagascar
Senegal
Gabon
Kenya
Uganda
Congo
Malawi
Zimbabwe
United Republic of Tanzania
Ethiopia
Ghana
Zambia
Gambia
Liberia
Swaziland
Mozambique
Burundi
Comoros
Togo
Cameroon
Mauritania
Angola
Burkina Faso
Guinea-Bissau
Guinea
South Sudan
Equatorial Guinea
Niger
Côte d'Ivoire
Lesotho
Democratic Republic of the Congo
Benin
Nigeria
Mali
Sierra Leone
Central African Republic
Chad 127.3
104.3
110.6
113.5
123.6
38.5
40.6
43.3
44.5
45.2
46.4
47.1
47.4
49.2
53.0
54.1
55.1
56.4
56.7
58.4
58.8
63.4
65.3
67.4
70.4
71.3
71.7
73.3
75.7
79.7
81.4
82.5
84.6
88.1
89.0
90.7
13.7
91.3
91.8
93.5
94.3
90.9
14.3
21.4
25.2
33.8
97.6
AFR
Japan
Singapore
Republic of Korea
Australia
New Zealand
Cook Islands
Malaysia
Brunei Darussalam
China
Palau
Tonga
Samoa
Mongolia
Viet Nam
Fiji
Niue
Tuvalu
Solomon Islands
Philippines
Vanuatu
Cambodia
Micronesia (Federated States of)
Nauru
Marshall Islands
Kiribati
Papua New Guinea
Lao People's Democratic Republic
15.9
16.4
17.3
17.9
21.6
22.0
22.2
25.3
25.8
27.1
27.6
30.6
33.3
34.6
35.4
54.3
54.3
63.9
2.7
2.8
3.4
3.7
5.4
7.8
8.3
9.9
9.9
WPR
The former Yugoslav Republic of Macedonia
Under-five Neonatal
Indicators 3.2.1/3.2.2 Child mortality
1 Numbers next to the bars denote under-five mortality rates . Source: Levels & Trends in Child Mortality. Report 2017. Estimates developed by the UN Inter-agency Group for Child Mortality Estimation. United Nations Children’s Fund, World Health Organization, World Bank and United Nations. New York (NY): United Nations Children’s Fund; 2017 (http://www.childmortality.org/files_v21/download/IGME%20report%202017%20child%20mortality%20final.pdf, accessed 29 March 2018).
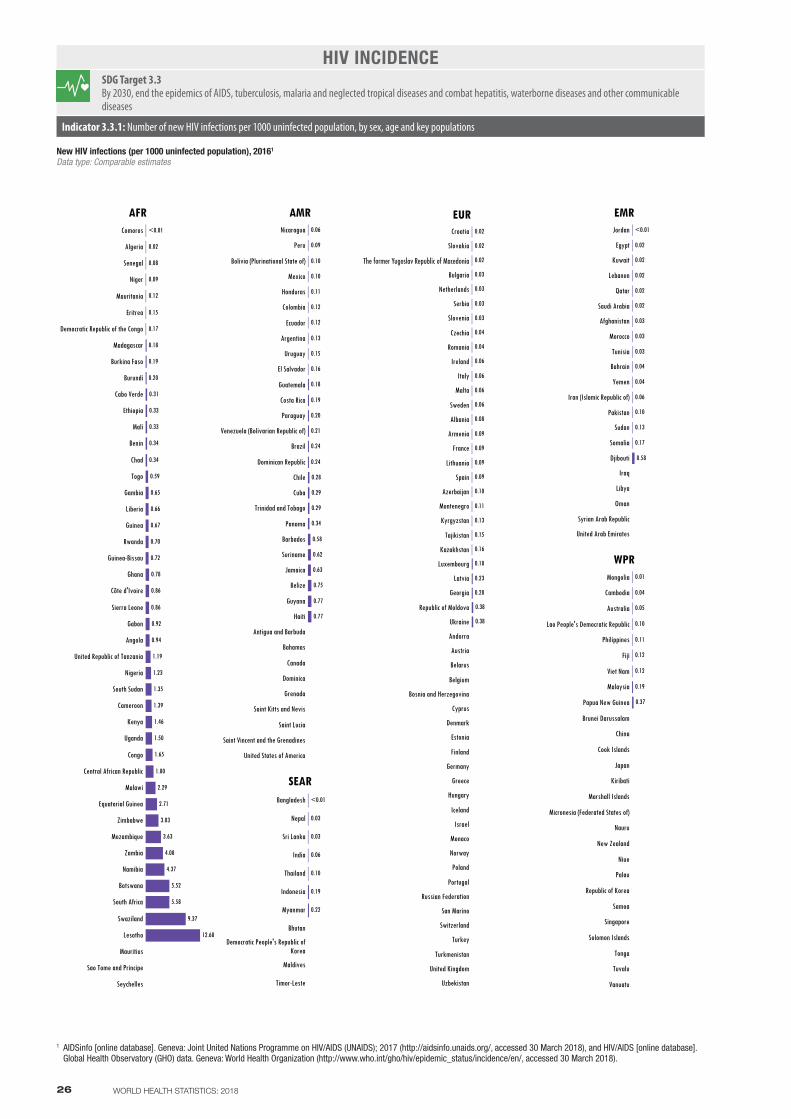
Comoros
Algeria
Senegal
Niger
Mauritania
Eritrea
Democratic Republic of the Congo
Madagascar
Burkina Faso
Burundi
Cabo Verde
Ethiopia
Mali
Benin
Chad
Togo
Gambia
Liberia
Guinea
Rwanda
Guinea-Bissau
Ghana
Côte d'Ivoire
Sierra Leone
Gabon
Angola
United Republic of Tanzania
Nigeria
South Sudan
Cameroon
Kenya
Uganda
Congo
Central African Republic
Malawi
Equatorial Guinea
Zimbabwe
Mozambique
Zambia
Namibia
Botswana
South Africa
Swaziland
Lesotho
Mauritius
Sao Tome and Principe
Seychelles
<0.01
12.68
9.37
5.58
5.52
4.37
4.08
3.63
3.03
2.71
2.29
1.80
1.65
1.50
1.46
1.39
1.35
1.23
1.19
0.94
0.92
0.86
0.86
0.78
0.72
0.70
0.67
0.66
0.65
0.59
0.34
0.34
0.33
0.33
0.31
0.20
0.19
0.18
0.17
0.15
0.12
0.09
0.08
0.02
AFRNicaragua
Peru
Bolivia (Plurinational State of)
Mexico
Honduras
Colombia
Ecuador
Argentina
Uruguay
El Salvador
Guatemala
Costa Rica
Paraguay
Venezuela (Bolivarian Republic of)
Brazil
Dominican Republic
Chile
Cuba
Trinidad and Tobago
Panama
Barbados
Suriname
Jamaica
Belize
Guyana
Haiti
Antigua and Barbuda
Bahamas
Canada
Dominica
Grenada
Saint Kitts and Nevis
Saint Lucia
Saint Vincent and the Grenadines
United States of America
0.77
0.77
0.75
0.63
0.62
0.58
0.34
0.29
0.29
0.28
0.24
0.24
0.21
0.20
0.19
0.18
0.16
0.15
0.13
0.12
0.12
0.11
0.10
0.10
0.09
0.06
AMR
Bangladesh
Nepal
Sri Lanka
India
Thailand
Indonesia
Myanmar
Bhutan
Democratic People's Republic ofKorea
Maldives
Timor-Leste
<0.01
0.03
0.03
0.06
0.10
0.19
0.22
SEAR
Croatia
Slovakia
The former Yugoslav Republic of ..
Bulgaria
Netherlands
Serbia
Slovenia
Czechia
Romania
Ireland
Italy
Malta
Sweden
Albania
Armenia
France
Lithuania
Spain
Azerbaijan
Montenegro
Kyrgyzstan
Tajikistan
Kazakhstan
Luxembourg
Latvia
Georgia
Republic of Moldova
Ukraine
Andorra
Austria
Belarus
Belgium
Bosnia and Herzegovina
Cyprus
Denmark
Estonia
Finland
Germany
Greece
Hungary
Iceland
Israel
Monaco
Norway
Poland
Portugal
Russian Federation
San Marino
Switzerland
Turkey
Turkmenistan
United Kingdom
Uzbekistan
0.38
0.38
0.28
0.23
0.18
0.16
0.15
0.13
0.11
0.10
0.09
0.09
0.09
0.09
0.08
0.06
0.06
0.06
0.06
0.04
0.04
0.03
0.03
0.03
0.03
0.02
0.02
0.02
EURJordan
Egypt
Kuwait
Lebanon
Qatar
Saudi Arabia
Afghanistan
Morocco
Tunisia
Bahrain
Yemen
Iran (Islamic Republic of)
Pakistan
Sudan
Somalia
Djibouti
Iraq
Libya
Oman
Syrian Arab Republic
United Arab Emirates
<0.01
0.58
0.17
0.13
0.10
0.06
0.04
0.04
0.03
0.03
0.03
0.02
0.02
0.02
0.02
0.02
EMR
Mongolia
Cambodia
Australia
Lao People's Democratic Republic
Philippines
Fiji
Viet Nam
Malaysia
Papua New Guinea
Brunei Darussalam
China
Cook Islands
Japan
Kiribati
Marshall Islands
Micronesia (Federated States of)
Nauru
New Zealand
Niue
Palau
Republic of Korea
Samoa
Singapore
Solomon Islands
Tonga
Tuvalu
Vanuatu
0.37
0.19
0.12
0.12
0.11
0.10
0.05
0.04
0.01
WPR
The former Yugoslav Republic of Macedonia
26 WORLD HEALTH STATISTICS: 2018
HIV INCIDENCESDG Target 3.3By 2030, end the epidemics of AIDS, tuberculosis, malaria and neglected tropical diseases and combat hepatitis, waterborne diseases and other communicable diseases
Indicator 3.3.1: Number of new HIV infections per 1000 uninfected population, by sex, age and key populations
New HIV infections (per 1000 uninfected population), 20161
Data type: Comparable estimates
Indicator 3.3.1 HIV incidence
1 AIDSinfo [online database]. Geneva: Joint United Nations Programme on HIV/AIDS (UNAIDS); 2017 (http://aidsinfo.unaids.org/, accessed 30 March 2018), and HIV/AIDS [online database]. Global Health Observatory (GHO) data. Geneva: World Health Organization (http://www.who.int/gho/hiv/epidemic_status/incidence/en/, accessed 30 March 2018).
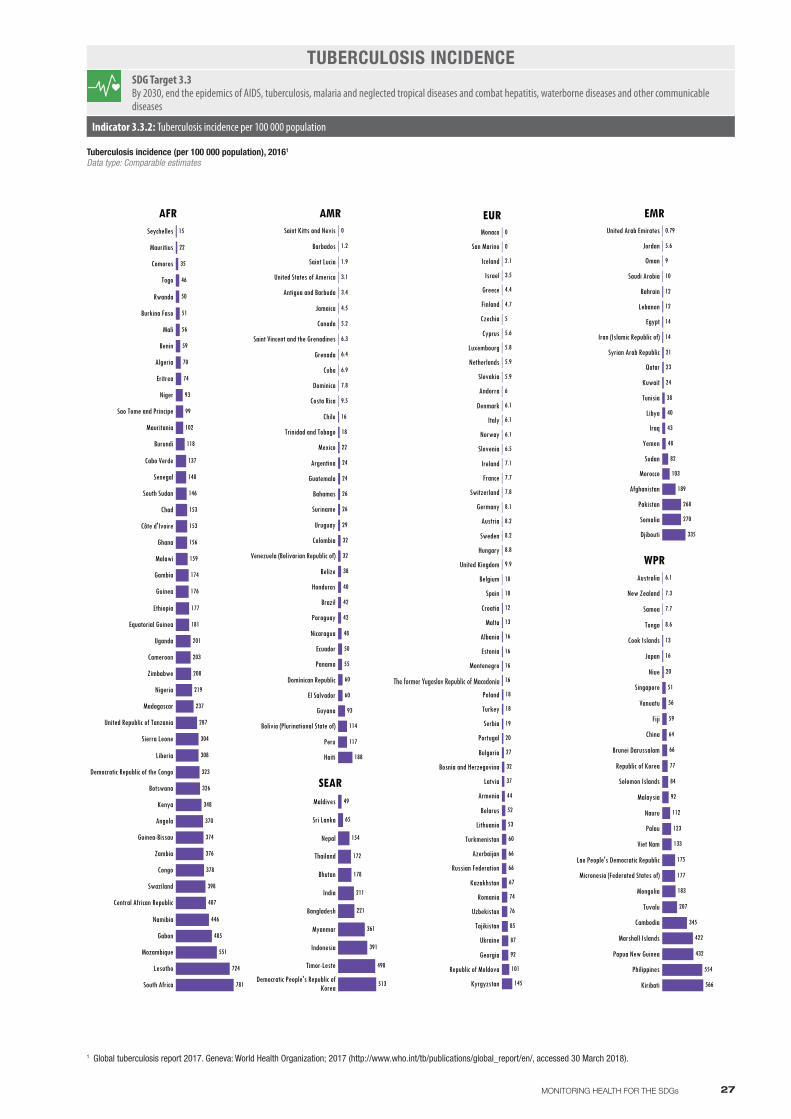
Seychelles
Mauritius
Comoros
Togo
Rwanda
Burkina Faso
Mali
Benin
Algeria
Eritrea
Niger
Sao Tome and Principe
Mauritania
Burundi
Cabo Verde
Senegal
South Sudan
Chad
Côte d'Ivoire
Ghana
Malawi
Gambia
Guinea
Ethiopia
Equatorial Guinea
Uganda
Cameroon
Zimbabwe
Nigeria
Madagascar
United Republic of Tanzania
Sierra Leone
Liberia
Democratic Republic of the Congo
Botswana
Kenya
Angola
Guinea-Bissau
Zambia
Congo
Swaziland
Central African Republic
Namibia
Gabon
Mozambique
Lesotho
South Africa 781
724
551
485
446
407
398
378
376
374
370
348
326
323
308
304
287
237
219
208
203
201
181
177
176
174
159
156
153
153
146
140
137
118
102
99
93
74
70
59
56
51
50
46
35
22
15
AFRSaint Kitts and Nevis
Barbados
Saint Lucia
United States of America
Antigua and Barbuda
Jamaica
Canada
Saint Vincent and the Grenadines
Grenada
Cuba
Dominica
Costa Rica
Chile
Trinidad and Tobago
Mexico
Argentina
Guatemala
Bahamas
Suriname
Uruguay
Colombia
Venezuela (Bolivarian Republic of)
Belize
Honduras
Brazil
Paraguay
Nicaragua
Ecuador
Panama
Dominican Republic
El Salvador
Guyana
Bolivia (Plurinational State of)
Peru
Haiti 188
117
114
93
60
60
55
50
48
42
42
40
38
32
32
29
26
26
24
24
22
18
16
9.5
7.8
6.9
6.4
6.3
5.2
4.5
3.4
3.1
1.9
1.2
0
AMR
Maldives
Sri Lanka
Nepal
Thailand
Bhutan
India
Bangladesh
Myanmar
Indonesia
Timor-Leste
Democratic People's Republic ofKorea
154
172
178
211
221
361
391
498
513
49
65
SEAR
Monaco
San Marino
Iceland
Israel
Greece
Finland
Czechia
Cyprus
Luxembourg
Netherlands
Slovakia
Andorra
Denmark
Italy
Norway
Slovenia
Ireland
France
Switzerland
Germany
Austria
Sweden
Hungary
United Kingdom
Belgium
Spain
Croatia
Malta
Albania
Estonia
Montenegro
The former Yugoslav Republic of ..
Poland
Turkey
Serbia
Portugal
Bulgaria
Bosnia and Herzegovina
Latvia
Armenia
Belarus
Lithuania
Turkmenistan
Azerbaijan
Russian Federation
Kazakhstan
Romania
Uzbekistan
Tajikistan
Ukraine
Georgia
Republic of Moldova
Kyrgyzstan 145
101
92
87
85
76
74
67
66
66
60
53
52
44
37
32
27
20
19
18
18
16
16
16
16
13
12
10
10
9.9
8.8
8.2
8.2
8.1
7.8
7.7
7.1
6.5
6.1
6.1
6.1
6
5.9
5.9
5.8
5.6
5
4.7
4.4
3.5
2.1
0
0
EURUnited Arab Emirates
Jordan
Oman
Saudi Arabia
Bahrain
Lebanon
Egypt
Iran (Islamic Republic of)
Syrian Arab Republic
Qatar
Kuwait
Tunisia
Libya
Iraq
Yemen
Sudan
Morocco
Afghanistan
Pakistan
Somalia
Djibouti 335
270
268
189
103
82
48
43
40
38
24
23
21
14
14
12
12
10
9
5.6
0.79
EMR
Australia
New Zealand
Samoa
Tonga
Cook Islands
Japan
Niue
Singapore
Vanuatu
Fiji
China
Brunei Darussalam
Republic of Korea
Solomon Islands
Malaysia
Nauru
Palau
Viet Nam
Lao People's Democratic Republic
Micronesia (Federated States of)
Mongolia
Tuvalu
Cambodia
Marshall Islands
Papua New Guinea
Philippines
Kiribati 566
554
432
422
345
207
183
177
175
133
123
112
92
84
77
66
64
59
56
51
20
16
13
8.6
7.7
7.3
6.1
WPR
The former Yugoslav Republic of Macedonia
27MONITORING HEALTH FOR THE SDGs
TUBERCULOSIS INCIDENCESDG Target 3.3By 2030, end the epidemics of AIDS, tuberculosis, malaria and neglected tropical diseases and combat hepatitis, waterborne diseases and other communicable diseases
Indicator 3.3.2: Tuberculosis incidence per 100 000 population
Tuberculosis incidence (per 100 000 population), 20161
Data type: Comparable estimates
Indicator 3.3.2 Tuberculosis incidence
1 Global tuberculosis report 2017. Geneva: World Health Organization; 2017 (http://www.who.int/tb/publications/global_report/en/, accessed 30 March 2018).

Algeria
Cabo Verde
South Africa
Comoros
Swaziland
Botswana
Sao Tome and Principe
Eritrea
Namibia
Senegal
Ethiopia
Madagascar
Guinea-Bissau
Zimbabwe
Kenya
Mauritania
Angola
Gambia
United Republic of Tanzania
Burundi
South Sudan
Chad
Uganda
Zambia
Congo
Gabon
Côte d'Ivoire
Liberia
Equatorial Guinea
Malawi
Cameroon
Ghana
Democratic Republic of the Congo
Benin
Sierra Leone
Mozambique
Central African Republic
Nigeria
Togo
Niger
Guinea
Rwanda
Burkina Faso
Mali
Lesotho
Mauritius
Seychelles
459.7
423.3
392.7
386.5
378.9
360.4
349.6
311.6
307.8
303.5
297.3
291.9
285.6
271.3
249.1
238.8
237.0
223.2
206.2
204.7
189.8
187.2
167.6
159.0
156.2
144.2
129.6
120.3
88.5
85.3
77.9
73.0
64.4
53.1
49.0
29.3
17.2
11.2
2.4
1.9
1.8
1.1
0.7
0.0
AFRArgentina
Paraguay
Belize
Costa Rica
El Salvador
Dominican Republic
Mexico
Panama
Guatemala
Suriname
Honduras
Bolivia (Plurinational State of)
Ecuador
Brazil
Nicaragua
Haiti
Colombia
Peru
Venezuela (Bolivarian Republic of)
Guyana
Antigua and Barbuda
Bahamas
Barbados
Canada
Chile
Cuba
Dominica
Grenada
Jamaica
Saint Kitts and Nevis
Saint Lucia
Saint Vincent and the Grenadines
Trinidad and Tobago
United States of America
Uruguay
<0.1
<0.1
<0.1
77.7
44.7
17.8
17.2
13.9
7.8
6.7
3.8
2.7
1.7
1.4
0.8
0.4
0.4
0.3
0.0
0.0
AMR
Sri Lanka
Bhutan
Democratic People's Republic ofKorea
Bangladesh
Nepal
Timor-Leste
Thailand
Myanmar
Indonesia
India
Maldives
<0.1
18.8
0.0
0.5
0.6
0.9
0.9
1.6
7.2
9.2
SEAR
Azerbaijan
Georgia
Kyrgyzstan
Tajikistan
Turkey
Uzbekistan
Albania
Andorra
Armenia
Austria
Belarus
Belgium
Bosnia and Herzegovina
Bulgaria
Croatia
Cyprus
Czechia
Denmark
Estonia
Finland
France
Germany
Greece
Hungary
Iceland
Ireland
Israel
Italy
Kazakhstan
Latvia
Lithuania
Luxembourg
Malta
Monaco
Montenegro
Netherlands
Norway
Poland
Portugal
Republic of Moldova
Romania
Russian Federation
San Marino
Serbia
Slovakia
Slovenia
Spain
Sweden
Switzerland
The former Yugoslav Republic of ..
Turkmenistan
Ukraine
United Kingdom
0.0
0.0
0.0
0.0
0.0
0.0
EURIraq
Iran (Islamic Republic of)
Saudi Arabia
Djibouti
Pakistan
Yemen
Afghanistan
Sudan
Somalia
Bahrain
Egypt
Jordan
Kuwait
Lebanon
Libya
Morocco
Oman
Qatar
Syrian Arab Republic
Tunisia
United Arab Emirates
60.2
35.3
30.8
30.5
10.6
9.6
0.2
0.2
0.0
EMR
China
Viet Nam
Malaysia
Republic of Korea
Philippines
Lao People's Democratic Republic
Cambodia
Vanuatu
Solomon Islands
Papua New Guinea
Australia
Brunei Darussalam
Cook Islands
Fiji
Japan
Kiribati
Marshall Islands
Micronesia (Federated States of)
Mongolia
Nauru
New Zealand
Niue
Palau
Samoa
Singapore
Tonga
Tuvalu
<0.1
179.4
144.8
14.7
8.9
7.8
0.5
0.3
0.2
0.1
WPR
The former Yugoslav Republic of Macedonia
28 WORLD HEALTH STATISTICS: 2018
MALARIA INCIDENCESDG Target 3.3By 2030, end the epidemics of AIDS, tuberculosis, malaria and neglected tropical diseases and combat hepatitis, waterborne diseases and other communicable diseases
Indicator 3.3.3: Malaria incidence per 1000 population
Malaria incidence (per 1000 population at risk), 20161
Data type: Comparable estimates
Indicator 3.3.3 Malaria incidence
1 World malaria report 2017. Geneva: World Health Organization; 2017 (http://www.who.int/malaria/publications/world-malaria-report-2017/report/en/, accessed 30 March 2018).
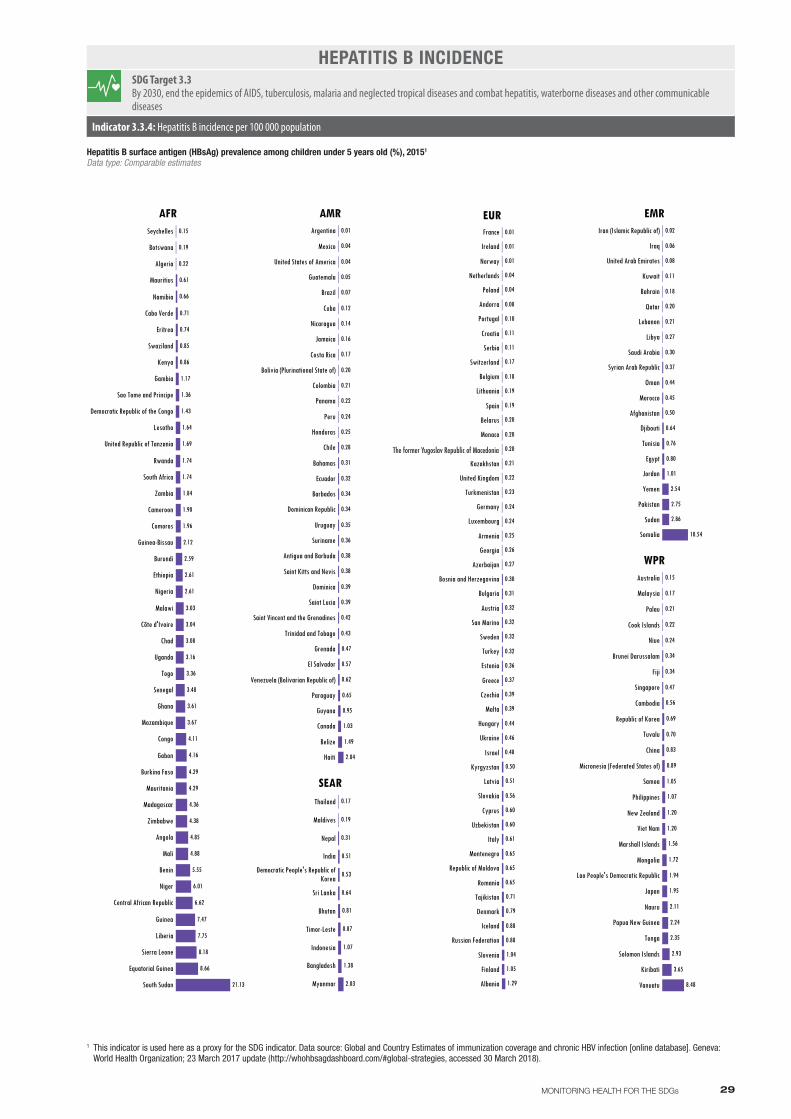
Seychelles
Botswana
Algeria
Mauritius
Namibia
Cabo Verde
Eritrea
Swaziland
Kenya
Gambia
Sao Tome and Principe
Democratic Republic of the Congo
Lesotho
United Republic of Tanzania
Rwanda
South Africa
Zambia
Cameroon
Comoros
Guinea-Bissau
Burundi
Ethiopia
Nigeria
Malawi
Côte d'Ivoire
Chad
Uganda
Togo
Senegal
Ghana
Mozambique
Congo
Gabon
Burkina Faso
Mauritania
Madagascar
Zimbabwe
Angola
Mali
Benin
Niger
Central African Republic
Guinea
Liberia
Sierra Leone
Equatorial Guinea
South Sudan 21.13
8.66
8.18
7.75
7.47
6.62
6.01
5.55
4.88
4.85
4.38
4.36
4.29
4.29
4.16
4.11
3.67
3.61
3.48
3.36
3.16
3.08
3.04
3.03
2.61
2.61
2.59
2.12
1.96
1.90
1.84
1.74
1.74
1.69
1.64
1.43
1.36
1.17
0.86
0.85
0.74
0.71
0.66
0.61
0.22
0.19
0.15
AFRArgentina
Mexico
United States of America
Guatemala
Brazil
Cuba
Nicaragua
Jamaica
Costa Rica
Bolivia (Plurinational State of)
Colombia
Panama
Peru
Honduras
Chile
Bahamas
Ecuador
Barbados
Dominican Republic
Uruguay
Suriname
Antigua and Barbuda
Saint Kitts and Nevis
Dominica
Saint Lucia
Saint Vincent and the Grenadines
Trinidad and Tobago
Grenada
El Salvador
Venezuela (Bolivarian Republic of)
Paraguay
Guyana
Canada
Belize
Haiti 2.04
1.49
1.03
0.95
0.65
0.62
0.57
0.47
0.43
0.42
0.39
0.39
0.38
0.38
0.36
0.35
0.34
0.34
0.32
0.31
0.28
0.25
0.24
0.22
0.21
0.20
0.17
0.16
0.14
0.12
0.07
0.05
0.04
0.04
0.01
AMR
Thailand
Maldives
Nepal
India
Democratic People's Republic ofKorea
Sri Lanka
Bhutan
Timor-Leste
Indonesia
Bangladesh
Myanmar
0.17
0.19
0.31
0.51
0.53
0.64
0.81
0.87
1.07
1.38
2.03
SEAR
France
Ireland
Norway
Netherlands
Poland
Andorra
Portugal
Croatia
Serbia
Switzerland
Belgium
Lithuania
Spain
Belarus
Monaco
The former Yugoslav Republic of ..
Kazakhstan
United Kingdom
Turkmenistan
Germany
Luxembourg
Armenia
Georgia
Azerbaijan
Bosnia and Herzegovina
Bulgaria
Austria
San Marino
Sweden
Turkey
Estonia
Greece
Czechia
Malta
Hungary
Ukraine
Israel
Kyrgyzstan
Latvia
Slovakia
Cyprus
Uzbekistan
Italy
Montenegro
Republic of Moldova
Romania
Tajikistan
Denmark
Iceland
Russian Federation
Slovenia
Finland
Albania 1.29
1.05
1.04
0.88
0.88
0.79
0.71
0.65
0.65
0.65
0.61
0.60
0.60
0.56
0.51
0.50
0.48
0.46
0.44
0.39
0.39
0.37
0.36
0.32
0.32
0.32
0.32
0.31
0.30
0.27
0.26
0.25
0.24
0.24
0.23
0.22
0.21
0.20
0.20
0.20
0.19
0.19
0.18
0.17
0.11
0.11
0.10
0.08
0.04
0.04
0.01
0.01
0.01
EURIran (Islamic Republic of)
Iraq
United Arab Emirates
Kuwait
Bahrain
Qatar
Lebanon
Libya
Saudi Arabia
Syrian Arab Republic
Oman
Morocco
Afghanistan
Djibouti
Tunisia
Egypt
Jordan
Yemen
Pakistan
Sudan
Somalia 10.54
2.86
2.75
2.54
1.01
0.80
0.76
0.64
0.50
0.45
0.44
0.37
0.30
0.27
0.21
0.20
0.18
0.11
0.08
0.06
0.02
EMR
Australia
Malaysia
Palau
Cook Islands
Niue
Brunei Darussalam
Fiji
Singapore
Cambodia
Republic of Korea
Tuvalu
China
Micronesia (Federated States of)
Samoa
Philippines
New Zealand
Viet Nam
Marshall Islands
Mongolia
Lao People's Democratic Republic
Japan
Nauru
Papua New Guinea
Tonga
Solomon Islands
Kiribati
Vanuatu 8.48
3.65
2.93
2.35
2.24
2.11
1.95
1.94
1.72
1.56
1.20
1.20
1.07
1.05
0.89
0.83
0.70
0.69
0.56
0.47
0.34
0.34
0.24
0.22
0.21
0.17
0.15
WPR
The former Yugoslav Republic of Macedonia
29MONITORING HEALTH FOR THE SDGs
HEPATITIS B INCIDENCESDG Target 3.3By 2030, end the epidemics of AIDS, tuberculosis, malaria and neglected tropical diseases and combat hepatitis, waterborne diseases and other communicable diseases
Indicator 3.3.4: Hepatitis B incidence per 100 000 population
Hepatitis B surface antigen (HBsAg) prevalence among children under 5 years old (%), 20151
Data type: Comparable estimates
Indicator 3.3.4 Hepatitis B incidence
1 This indicator is used here as a proxy for the SDG indicator. Data source: Global and Country Estimates of immunization coverage and chronic HBV infection [online database]. Geneva: World Health Organization; 23 March 2017 update (http://whohbsagdashboard.com/#global-strategies, accessed 30 March 2018).
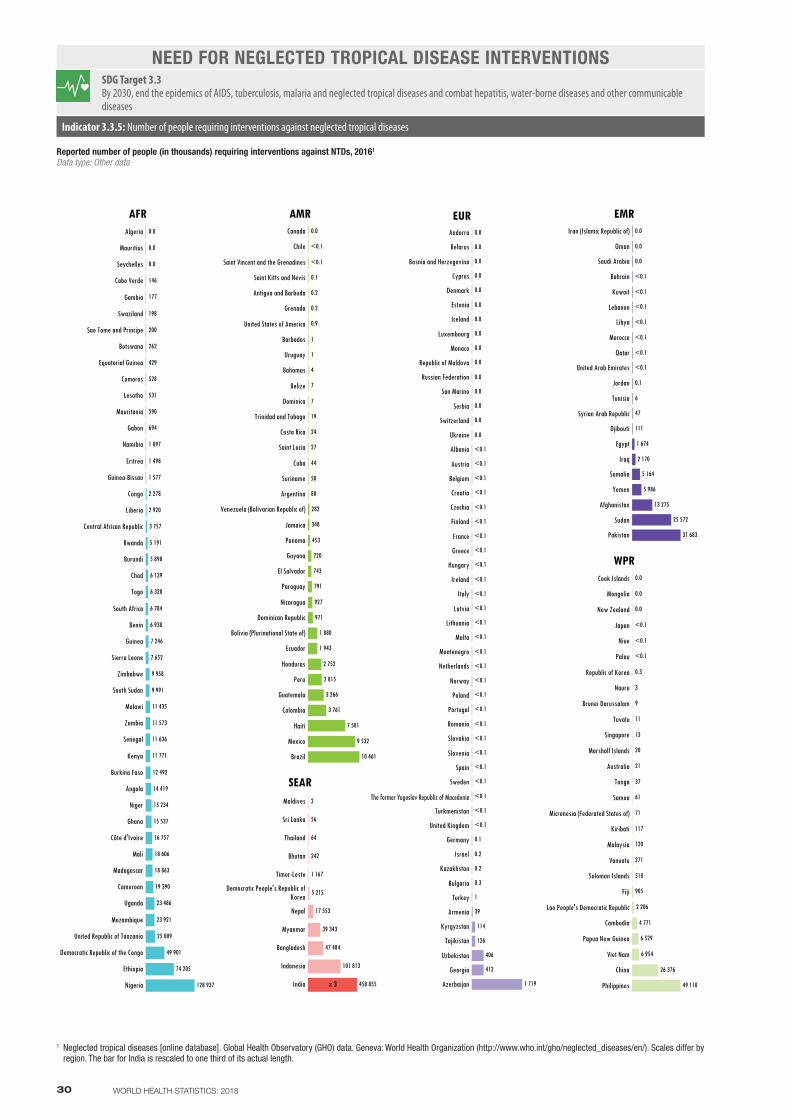
Algeria
Mauritius
Seychelles
Cabo Verde
Gambia
Swaziland
Sao Tome and Principe
Botswana
Equatorial Guinea
Comoros
Lesotho
Mauritania
Gabon
Namibia
Eritrea
Guinea-Bissau
Congo
Liberia
Central African Republic
Rwanda
Burundi
Chad
Togo
South Africa
Benin
Guinea
Sierra Leone
Zimbabwe
South Sudan
Malawi
Zambia
Senegal
Kenya
Burkina Faso
Angola
Niger
Ghana
Côte d'Ivoire
Mali
Madagascar
Cameroon
Uganda
Mozambique
United Republic of Tanzania
Democratic Republic of the Congo
Ethiopia
Nigeria
694
590
531
528
429
262
200
198
177
146
128 937
74 205
49 901
25 009
23 921
23 486
19 390
18 863
18 606
16 757
15 537
15 234
14 419
12 492
11 771
11 636
11 573
11 435
9 991
9 958
7 652
7 246
6 938
6 784
6 328
6 139
5 898
5 191
3 757
2 920
2 278
1 577
1 498
1 097
0.0
0.0
0.0
AFRCanada
Chile
Saint Vincent and the Grenadines
Saint Kitts and Nevis
Antigua and Barbuda
Grenada
United States of America
Barbados
Uruguay
Bahamas
Belize
Dominica
Trinidad and Tobago
Costa Rica
Saint Lucia
Cuba
Suriname
Argentina
Venezuela (Bolivarian Republic of)
Jamaica
Panama
Guyana
El Salvador
Paraguay
Nicaragua
Dominican Republic
Bolivia (Plurinational State of)
Ecuador
Honduras
Peru
Guatemala
Colombia
Haiti
Mexico
Brazil
<0.1
<0.1
971
927
791
743
720
453
348
282
80
58
44
27
24
19
10 461
9 532
7 581
7
7
4
3 761
3 266
2 815
2 752
1 943
1 880
1
1
0.9
0.2
0.2
0.1
0.0
AMR
Maldives
Sri Lanka
Thailand
Bhutan
Timor-Leste
Democratic People's Republic ofKorea
Nepal
Myanmar
Bangladesh
Indonesia
India
101 813
458 855
17 553
39 343
47 484
1 167
5 215
242
56
64
2
x 3
SEAR
Andorra
Belarus
Bosnia and Herzegovina
Cyprus
Denmark
Estonia
Iceland
Luxembourg
Monaco
Republic of Moldova
Russian Federation
San Marino
Serbia
Switzerland
Ukraine
Albania
Austria
Belgium
Croatia
Czechia
Finland
France
Greece
Hungary
Ireland
Italy
Latvia
Lithuania
Malta
Montenegro
Netherlands
Norway
Poland
Portugal
Romania
Slovakia
Slovenia
Spain
Sweden
The former Yugoslav Republic of ..
Turkmenistan
United Kingdom
Germany
Israel
Kazakhstan
Bulgaria
Turkey
Armenia
Kyrgyzstan
Tajikistan
Uzbekistan
Georgia
Azerbaijan
<0.1
<0.1
<0.1
<0.1
<0.1
<0.1
<0.1
<0.1
<0.1
<0.1
<0.1
<0.1
<0.1
<0.1
<0.1
<0.1
<0.1
<0.1
<0.1
<0.1
<0.1
<0.1
<0.1
<0.1
<0.1
<0.1
<0.1
412
406
126
114
39
1 719
1
0.3
0.2
0.2
0.1
0.0
0.0
0.0
0.0
0.0
0.0
0.0
0.0
0.0
0.0
0.0
0.0
0.0
0.0
0.0
EURIran (Islamic Republic of)
Oman
Saudi Arabia
Bahrain
Kuwait
Lebanon
Libya
Morocco
Qatar
United Arab Emirates
Jordan
Tunisia
Syrian Arab Republic
Djibouti
Egypt
Iraq
Somalia
Yemen
Afghanistan
Sudan
Pakistan
<0.1
<0.1
<0.1
<0.1
<0.1
<0.1
<0.1
111
47
31 683
25 572
13 275
6
5 986
5 164
2 170
1 674
0.1
0.0
0.0
0.0
EMR
Cook Islands
Mongolia
New Zealand
Japan
Niue
Palau
Republic of Korea
Nauru
Brunei Darussalam
Tuvalu
Singapore
Marshall Islands
Australia
Tonga
Samoa
Micronesia (Federated States of)
Kiribati
Malaysia
Vanuatu
Solomon Islands
Fiji
Lao People's Democratic Republic
Cambodia
Papua New Guinea
Viet Nam
China
Philippines
<0.1
<0.1
<0.1
905
518
271
120
117
71
61
49 110
37
26 376
21
20
13
11
9
6 954
6 529
4 771
3
2 206
0.3
0.0
0.0
0.0
WPR
The former Yugoslav Republic of Macedonia
30 WORLD HEALTH STATISTICS: 2018
NEED FOR NEGLECTED TROPICAL DISEASE INTERVENTIONSSDG Target 3.3By 2030, end the epidemics of AIDS, tuberculosis, malaria and neglected tropical diseases and combat hepatitis, water-borne diseases and other communicable diseases
Indicator 3.3.5: Number of people requiring interventions against neglected tropical diseases
Reported number of people (in thousands) requiring interventions against NTDs, 20161
Data type: Other data
Indicator 3.3.5 Need for neglected tropical disease interventions
1 Neglected tropical diseases [online database]. Global Health Observatory (GHO) data. Geneva: World Health Organization (http://www.who.int/gho/neglected_diseases/en/). Scales differ by region. The bar for India is rescaled to one third of its actual length.

Kenya
Algeria
Gabon
Malawi
Angola
Congo
Cabo Verde
Liberia
United Republic of Tanzania
Zambia
Mauritania
Senegal
Rwanda
Ethiopia
Mozambique
Sao Tome and Principe
Zimbabwe
Democratic Republic of the Congo
Benin
South Sudan
Guinea-Bissau
Niger
Botswana
Gambia
Ghana
Seychelles
Namibia
Cameroon
Burkina Faso
Uganda
Equatorial Guinea
Guinea
Nigeria
Mauritius
Burundi
Comoros
Madagascar
Central African Republic
Togo
Chad
Eritrea
Mali
South Africa
Lesotho
Swaziland
Côte d'Ivoire
Sierra Leone 30.5
29.1
26.7
26.6
26.2
24.6
23.9
23.9
23.6
23.1
22.9
22.9
22.9
22.6
22.5
22.4
22.0
21.9
21.7
21.6
21.3
21.2
20.8
20.4
20.3
20.0
20.0
19.8
19.6
19.4
19.3
18.5
18.4
18.3
18.2
18.1
18.1
17.9
17.9
17.6
17.2
16.7
16.5
16.4
14.4
14.2
13.4
AFRCanada
Costa Rica
Chile
Peru
Ecuador
Panama
El Salvador
Honduras
Nicaragua
United States of America
Jamaica
Guatemala
Bahamas
Mexico
Argentina
Colombia
Barbados
Cuba
Brazil
Uruguay
Bolivia (Plurinational State of)
Paraguay
Venezuela (Bolivarian Republic of)
Saint Lucia
Dominican Republic
Trinidad and Tobago
Grenada
Suriname
Belize
Antigua and Barbuda
Saint Vincent and the Grenadines
Haiti
Guyana
Dominica
Saint Kitts and Nevis
30.5
26.5
23.2
22.6
22.1
21.7
21.4
21.3
19.0
18.8
18.1
17.5
17.2
16.7
16.6
16.4
16.2
15.8
15.8
15.7
15.5
14.9
14.7
14.6
14.2
14.0
14.0
13.0
13.0
12.6
12.4
11.5
9.8
AMR
Maldives
Thailand
Sri Lanka
Timor-Leste
Bangladesh
Nepal
Bhutan
India
Myanmar
Democratic People's Republic ofKorea
Indonesia
13.4
14.5
17.4
19.9
21.6
21.8
23.3
23.3
24.2
25.6
26.4
SEAR
Switzerland
Iceland
Sweden
Norway
Italy
Israel
Spain
Luxembourg
Finland
Ireland
France
Malta
United Kingdom
Portugal
Netherlands
Cyprus
Denmark
Austria
Belgium
Germany
Greece
Slovenia
Czechia
Turkey
Croatia
Albania
Estonia
Slovakia
Bosnia and Herzegovina
Poland
Serbia
The former Yugoslav Republic of ..
Montenegro
Lithuania
Romania
Latvia
Azerbaijan
Armenia
Hungary
Bulgaria
Belarus
Uzbekistan
Ukraine
Georgia
Kyrgyzstan
Republic of Moldova
Tajikistan
Russian Federation
Kazakhstan
Turkmenistan
Andorra
Monaco
San Marino
29.5
26.8
25.4
25.3
24.9
24.9
24.9
24.7
24.5
23.7
23.6
23.0
22.3
22.2
21.9
21.4
20.7
20.6
20.3
19.1
18.7
17.8
17.2
17.0
17.0
16.7
16.1
15.0
12.7
12.4
12.1
11.4
11.4
11.3
11.3
11.2
11.1
10.9
10.8
10.6
10.3
10.2
10.0
9.9
9.6
9.5
9.2
9.1
9.1
8.6
EURBahrain
Morocco
Iran (Islamic Republic of)
Qatar
Tunisia
Saudi Arabia
United Arab Emirates
Kuwait
Oman
Lebanon
Jordan
Djibouti
Libya
Iraq
Somalia
Syrian Arab Republic
Pakistan
Sudan
Egypt
Afghanistan
Yemen 30.6
29.8
27.7
26.0
24.7
21.8
21.8
21.3
20.1
19.6
19.2
17.9
17.8
17.4
16.8
16.4
16.1
15.3
14.8
12.4
11.3
EMR
Republic of Korea
Japan
Australia
Singapore
New Zealand
Brunei Darussalam
China
Viet Nam
Malaysia
Samoa
Cambodia
Tonga
Vanuatu
Solomon Islands
Micronesia (Federated States of)
Philippines
Lao People's Democratic Republic
Kiribati
Papua New Guinea
Mongolia
Fiji
Cook Islands
Marshall Islands
Nauru
Niue
Palau
Tuvalu
30.6
30.2
30.0
28.4
27.0
26.8
26.1
23.8
23.3
23.3
21.1
20.6
17.2
17.1
17.0
16.6
10.1
9.3
9.1
8.4
7.8
WPR
The former Yugoslav Republic of Macedonia
31MONITORING HEALTH FOR THE SDGs
MORTALITY DUE TO NONCOMMUNICABLE DISEASESSDG Target 3.4By 2030, reduce by one third premature mortality from noncommunicable diseases through prevention and treatment and promote mental health and well-being
Indicator 3.4.1: Mortality rate attributed to cardiovascular disease, cancer, diabetes or chronic respiratory disease
Probability of dying from any of CVD, cancer, diabetes, CRD between age 30 and exact age 70 (%), 20161
Data type: Comparable estimates
Indicator 3.4.1 Mortality due to noncommunicable diseases
1 Global Health Estimates 2016: Deaths by cause, age, sex, by country and by region, 2000–2016. Geneva: World Health Organization; 2018. WHO Member States with a population of less than 90 000 in 2016 were not included in the analysis.
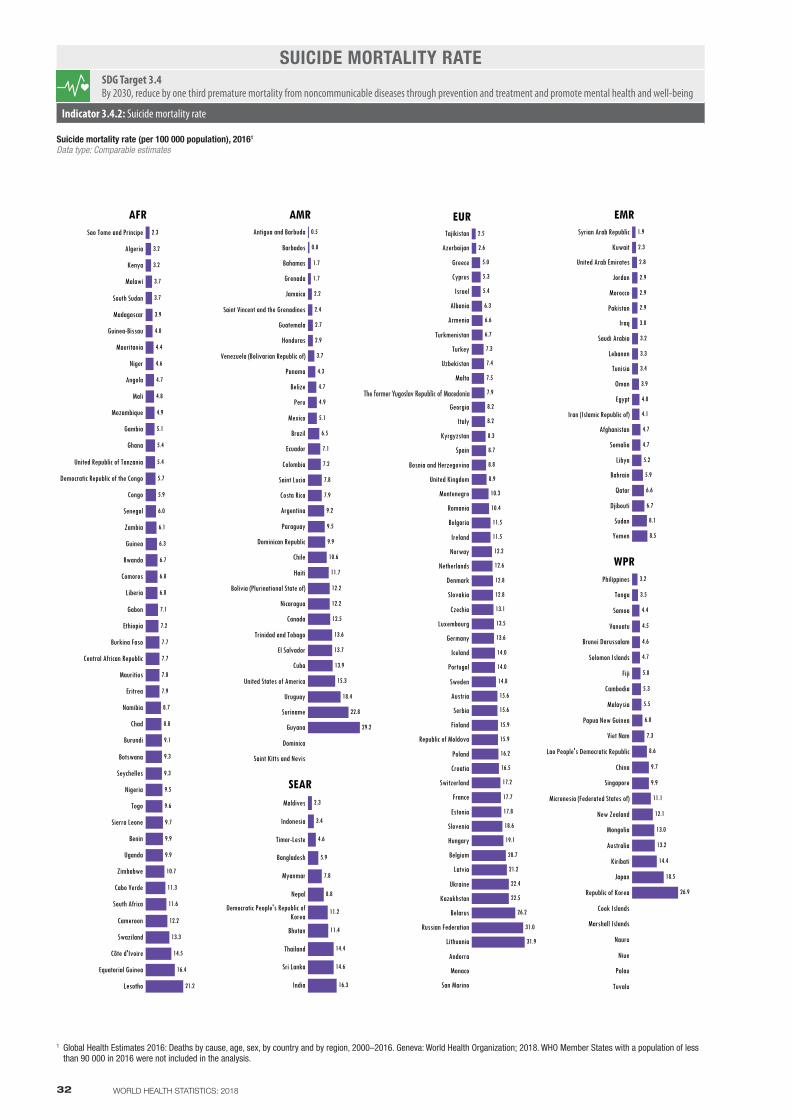
Sao Tome and Principe
Algeria
Kenya
Malawi
South Sudan
Madagascar
Guinea-Bissau
Mauritania
Niger
Angola
Mali
Mozambique
Gambia
Ghana
United Republic of Tanzania
Democratic Republic of the Congo
Congo
Senegal
Zambia
Guinea
Rwanda
Comoros
Liberia
Gabon
Ethiopia
Burkina Faso
Central African Republic
Mauritius
Eritrea
Namibia
Chad
Burundi
Botswana
Seychelles
Nigeria
Togo
Sierra Leone
Benin
Uganda
Zimbabwe
Cabo Verde
South Africa
Cameroon
Swaziland
Côte d'Ivoire
Equatorial Guinea
Lesotho 21.2
16.4
14.5
13.3
12.2
11.6
11.3
10.7
9.9
9.9
9.7
9.6
9.5
9.3
9.3
9.1
8.8
8.7
7.9
7.8
7.7
7.7
7.2
7.1
6.8
6.8
6.7
6.3
6.1
6.0
5.9
5.7
5.4
5.4
5.1
4.9
4.8
4.7
4.6
4.4
4.0
3.9
3.7
3.7
3.2
3.2
2.3
AFRAntigua and Barbuda
Barbados
Bahamas
Grenada
Jamaica
Saint Vincent and the Grenadines
Guatemala
Honduras
Venezuela (Bolivarian Republic of)
Panama
Belize
Peru
Mexico
Brazil
Ecuador
Colombia
Saint Lucia
Costa Rica
Argentina
Paraguay
Dominican Republic
Chile
Haiti
Bolivia (Plurinational State of)
Nicaragua
Canada
Trinidad and Tobago
El Salvador
Cuba
United States of America
Uruguay
Suriname
Guyana
Dominica
Saint Kitts and Nevis
29.2
22.8
18.4
15.3
13.9
13.7
13.6
12.5
12.2
12.2
11.7
10.6
9.9
9.5
9.2
7.9
7.8
7.2
7.1
6.5
5.1
4.9
4.7
4.3
3.7
2.9
2.7
2.4
2.2
1.7
1.7
0.8
0.5
AMR
Maldives
Indonesia
Timor-Leste
Bangladesh
Myanmar
Nepal
Democratic People's Republic ofKorea
Bhutan
Thailand
Sri Lanka
India
11.2
11.4
14.4
14.6
16.3
2.3
3.4
4.6
5.9
7.8
8.8
SEAR
Tajikistan
Azerbaijan
Greece
Cyprus
Israel
Albania
Armenia
Turkmenistan
Turkey
Uzbekistan
Malta
The former Yugoslav Republic of ..
Georgia
Italy
Kyrgyzstan
Spain
Bosnia and Herzegovina
United Kingdom
Montenegro
Romania
Bulgaria
Ireland
Norway
Netherlands
Denmark
Slovakia
Czechia
Luxembourg
Germany
Iceland
Portugal
Sweden
Austria
Serbia
Finland
Republic of Moldova
Poland
Croatia
Switzerland
France
Estonia
Slovenia
Hungary
Belgium
Latvia
Ukraine
Kazakhstan
Belarus
Russian Federation
Lithuania
Andorra
Monaco
San Marino
31.9
31.0
26.2
22.5
22.4
21.2
20.7
19.1
18.6
17.8
17.7
17.2
16.5
16.2
15.9
15.9
15.6
15.6
14.8
14.0
14.0
13.6
13.5
13.1
12.8
12.8
12.6
12.2
11.5
11.5
10.4
10.3
8.9
8.8
8.7
8.3
8.2
8.2
7.9
7.5
7.4
7.3
6.7
6.6
6.3
5.4
5.3
5.0
2.6
2.5
EURSyrian Arab Republic
Kuwait
United Arab Emirates
Jordan
Morocco
Pakistan
Iraq
Saudi Arabia
Lebanon
Tunisia
Oman
Egypt
Iran (Islamic Republic of)
Afghanistan
Somalia
Libya
Bahrain
Qatar
Djibouti
Sudan
Yemen 8.5
8.1
6.7
6.6
5.9
5.2
4.7
4.7
4.1
4.0
3.9
3.4
3.3
3.2
3.0
2.9
2.9
2.9
2.8
2.3
1.9
EMR
Philippines
Tonga
Samoa
Vanuatu
Brunei Darussalam
Solomon Islands
Fiji
Cambodia
Malaysia
Papua New Guinea
Viet Nam
Lao People's Democratic Republic
China
Singapore
Micronesia (Federated States of)
New Zealand
Mongolia
Australia
Kiribati
Japan
Republic of Korea
Cook Islands
Marshall Islands
Nauru
Niue
Palau
Tuvalu
26.9
18.5
14.4
13.2
13.0
12.1
11.1
9.9
9.7
8.6
7.3
6.0
5.5
5.3
5.0
4.7
4.6
4.5
4.4
3.5
3.2
WPR
The former Yugoslav Republic of Macedonia
32 WORLD HEALTH STATISTICS: 2018
SUICIDE MORTALITY RATESDG Target 3.4By 2030, reduce by one third premature mortality from noncommunicable diseases through prevention and treatment and promote mental health and well-being
Indicator 3.4.2: Suicide mortality rate
Suicide mortality rate (per 100 000 population), 20161
Data type: Comparable estimates
Indicator 3.4.2 Suicide mortality rate
1 Global Health Estimates 2016: Deaths by cause, age, sex, by country and by region, 2000–2016. Geneva: World Health Organization; 2018. WHO Member States with a population of less than 90 000 in 2016 were not included in the analysis.
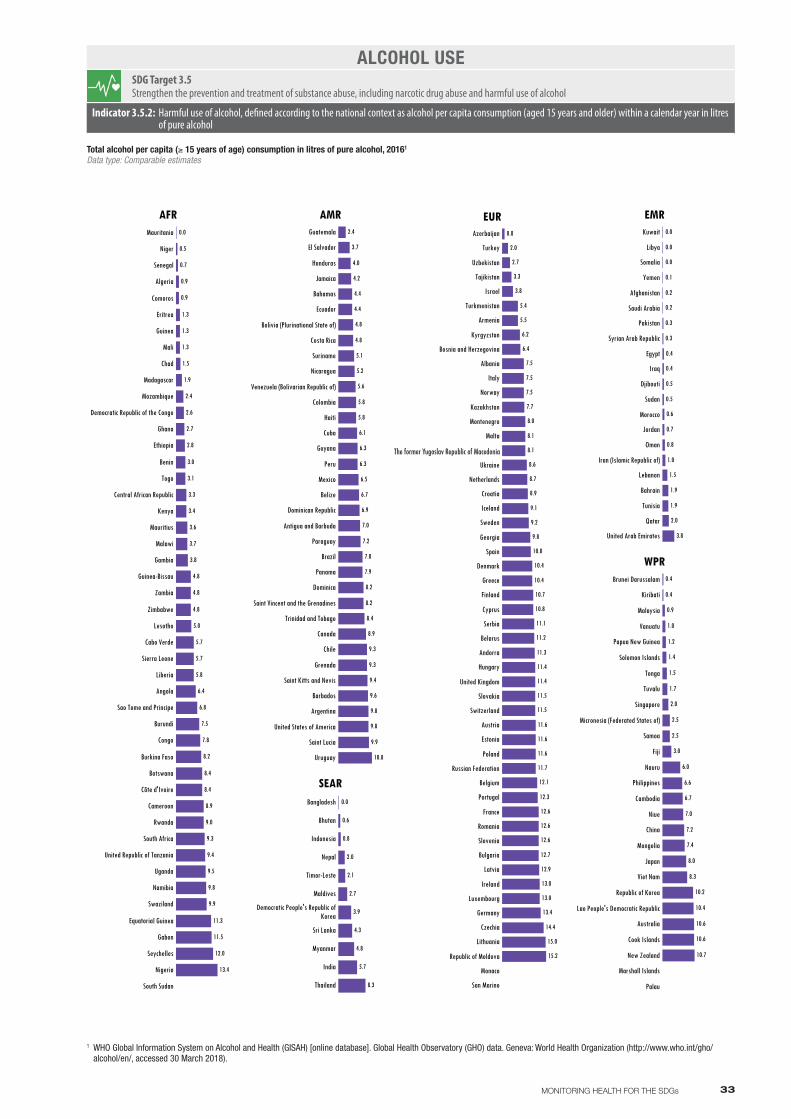
Mauritania
Niger
Senegal
Algeria
Comoros
Eritrea
Guinea
Mali
Chad
Madagascar
Mozambique
Democratic Republic of the Congo
Ghana
Ethiopia
Benin
Togo
Central African Republic
Kenya
Mauritius
Malawi
Gambia
Guinea-Bissau
Zambia
Zimbabwe
Lesotho
Cabo Verde
Sierra Leone
Liberia
Angola
Sao Tome and Principe
Burundi
Congo
Burkina Faso
Botswana
Côte d'Ivoire
Cameroon
Rwanda
South Africa
United Republic of Tanzania
Uganda
Namibia
Swaziland
Equatorial Guinea
Gabon
Seychelles
Nigeria
South Sudan
13.4
12.0
11.5
11.3
9.9
9.8
9.5
9.4
9.3
9.0
8.9
8.4
8.4
8.2
7.8
7.5
6.8
6.4
5.8
5.7
5.7
5.0
4.8
4.8
4.8
3.8
3.7
3.6
3.4
3.3
3.1
3.0
2.8
2.7
2.6
2.4
1.9
1.5
1.3
1.3
1.3
0.9
0.9
0.7
0.5
0.0
AFRGuatemala
El Salvador
Honduras
Jamaica
Bahamas
Ecuador
Bolivia (Plurinational State of)
Costa Rica
Suriname
Nicaragua
Venezuela (Bolivarian Republic of)
Colombia
Haiti
Cuba
Guyana
Peru
Mexico
Belize
Dominican Republic
Antigua and Barbuda
Paraguay
Brazil
Panama
Dominica
Saint Vincent and the Grenadines
Trinidad and Tobago
Canada
Chile
Grenada
Saint Kitts and Nevis
Barbados
Argentina
United States of America
Saint Lucia
Uruguay 10.8
9.9
9.8
9.8
9.6
9.4
9.3
9.3
8.9
8.4
8.2
8.2
7.9
7.8
7.2
7.0
6.9
6.7
6.5
6.3
6.3
6.1
5.8
5.8
5.6
5.2
5.1
4.8
4.8
4.4
4.4
4.2
4.0
3.7
2.4
AMR
Bangladesh
Bhutan
Indonesia
Nepal
Timor-Leste
Maldives
Democratic People's Republic ofKorea
Sri Lanka
Myanmar
India
Thailand
0.0
0.6
0.8
2.0
2.1
2.7
3.9
4.3
4.8
5.7
8.3
SEAR
Azerbaijan
Turkey
Uzbekistan
Tajikistan
Israel
Turkmenistan
Armenia
Kyrgyzstan
Bosnia and Herzegovina
Albania
Italy
Norway
Kazakhstan
Montenegro
Malta
The former Yugoslav Republic of ..
Ukraine
Netherlands
Croatia
Iceland
Sweden
Georgia
Spain
Denmark
Greece
Finland
Cyprus
Serbia
Belarus
Andorra
Hungary
United Kingdom
Slovakia
Switzerland
Austria
Estonia
Poland
Russian Federation
Belgium
Portugal
France
Romania
Slovenia
Bulgaria
Latvia
Ireland
Luxembourg
Germany
Czechia
Lithuania
Republic of Moldova
Monaco
San Marino
15.2
15.0
14.4
13.4
13.0
13.0
12.9
12.7
12.6
12.6
12.6
12.3
12.1
11.7
11.6
11.6
11.6
11.5
11.5
11.4
11.4
11.3
11.2
11.1
10.8
10.7
10.4
10.4
10.0
9.8
9.2
9.1
8.9
8.7
8.6
8.1
8.1
8.0
7.7
7.5
7.5
7.5
6.4
6.2
5.5
5.4
3.8
3.3
2.7
2.0
0.8
EURKuwait
Libya
Somalia
Yemen
Afghanistan
Saudi Arabia
Pakistan
Syrian Arab Republic
Egypt
Iraq
Djibouti
Sudan
Morocco
Jordan
Oman
Iran (Islamic Republic of)
Lebanon
Bahrain
Tunisia
Qatar
United Arab Emirates 3.8
2.0
1.9
1.9
1.5
1.0
0.8
0.7
0.6
0.5
0.5
0.4
0.4
0.3
0.3
0.2
0.2
0.1
0.0
0.0
0.0
EMR
Brunei Darussalam
Kiribati
Malaysia
Vanuatu
Papua New Guinea
Solomon Islands
Tonga
Tuvalu
Singapore
Micronesia (Federated States of)
Samoa
Fiji
Nauru
Philippines
Cambodia
Niue
China
Mongolia
Japan
Viet Nam
Republic of Korea
Lao People's Democratic Republic
Australia
Cook Islands
New Zealand
Marshall Islands
Palau
10.7
10.6
10.6
10.4
10.2
8.3
8.0
7.4
7.2
7.0
6.7
6.6
6.0
3.0
2.5
2.5
2.0
1.7
1.5
1.4
1.2
1.0
0.9
0.4
0.4
WPR
The former Yugoslav Republic of Macedonia
33MONITORING HEALTH FOR THE SDGs
Total alcohol per capita (≥ 15 years of age) consumption in litres of pure alcohol, 20161
Data type: Comparable estimates
ALCOHOL USESDG Target 3.5Strengthen the prevention and treatment of substance abuse, including narcotic drug abuse and harmful use of alcohol
Indicator 3.5.2: Harmful use of alcohol, defined according to the national context as alcohol per capita consumption (aged 15 years and older) within a calendar year in litres of pure alcohol
Indicator 3.5.2 Alcohol use
1 WHO Global Information System on Alcohol and Health (GISAH) [online database]. Global Health Observatory (GHO) data. Geneva: World Health Organization (http://www.who.int/gho/alcohol/en/, accessed 30 March 2018).

Seychelles
Mauritius
Nigeria
Equatorial Guinea
Gabon
Botswana
Algeria
Namibia
Chad
Eritrea
Côte d'Ivoire
Swaziland
Mauritania
Zambia
South Africa
Ethiopia
Mali
Cabo Verde
Ghana
Congo
Niger
Angola
Senegal
Guinea
Sierra Leone
Uganda
Guinea-Bissau
Cameroon
Benin
South Sudan
Comoros
Lesotho
Zimbabwe
Madagascar
Kenya
Gambia
Burkina Faso
Sao Tome and Principe
Togo
Burundi
Mozambique
Rwanda
Central African Republic
United Republic of Tanzania
Democratic Republic of the Congo
Liberia
Malawi 35.0
33.7
33.2
32.9
32.4
32.1
31.6
31.3
31.1
31.1
30.0
29.4
29.1
28.4
28.2
28.2
28.0
27.9
27.7
27.6
27.5
27.4
27.3
27.3
27.2
26.9
26.4
26.4
26.2
26.1
25.6
25.3
25.1
24.7
24.5
24.2
24.2
24.1
24.1
23.9
23.8
23.6
22.9
22.9
20.5
12.2
8.6
AFRGrenada
Canada
Antigua and Barbuda
Barbados
Cuba
Saint Vincent and the Grenadines
Panama
United States of America
Jamaica
Mexico
Chile
Argentina
Bahamas
Costa Rica
Peru
Trinidad and Tobago
Haiti
Dominica
Nicaragua
Uruguay
Colombia
Guyana
Honduras
Saint Lucia
Guatemala
Suriname
Ecuador
Paraguay
El Salvador
Bolivia (Plurinational State of)
Brazil
Belize
Dominican Republic
Venezuela (Bolivarian Republic of)
Saint Kitts and Nevis
45.1
29.3
24.4
23.4
23.2
21.1
20.7
20.1
19.1
19.0
18.1
17.4
17.3
16.8
16.6
15.3
15.3
15.1
14.1
13.9
13.9
13.8
13.6
12.4
12.3
11.5
10.6
10.0
8.2
7.5
6.7
6.7
6.0
5.7
AMR
Maldives
Bangladesh
Bhutan
Indonesia
India
Timor-Leste
Nepal
Sri Lanka
Myanmar
Democratic People's Republic ofKorea
Thailand
13.6
15.1
15.3
16.6
16.6
17.0
17.4
20.3
20.8
36.2
3.5
SEAR
Monaco
Sweden
United Kingdom
San Marino
Switzerland
Netherlands
Denmark
Israel
Spain
Norway
Ireland
Germany
Iceland
Finland
France
Malta
Cyprus
Austria
Czechia
Italy
Slovenia
Slovakia
Belgium
Estonia
Andorra
Hungary
Serbia
Portugal
Bulgaria
Luxembourg
Romania
Turkey
Greece
Croatia
The former Yugoslav Republic of ..
Azerbaijan
Latvia
Poland
Lithuania
Ukraine
Uzbekistan
Georgia
Montenegro
Republic of Moldova
Belarus
Albania
Turkmenistan
Bosnia and Herzegovina
Armenia
Tajikistan
Russian Federation
Kyrgyzstan
Kazakhstan 24.2
22.0
18.9
18.8
18.3
17.7
17.4
15.1
13.7
12.5
11.9
11.8
11.2
10.6
10.6
10.3
10.0
10.0
9.4
9.2
9.1
8.9
8.7
8.7
8.3
7.8
7.7
7.7
7.6
7.0
6.7
6.6
6.4
6.1
6.1
5.4
5.2
5.1
5.1
4.8
4.6
4.3
4.1
3.8
3.7
3.6
3.5
3.4
3.3
3.2
2.9
2.8
0.0
EURBahrain
United Arab Emirates
Egypt
Pakistan
Qatar
Afghanistan
Kuwait
Syrian Arab Republic
Iraq
Morocco
Yemen
Lebanon
Libya²
Sudan
Tunisia
Djibouti
Oman
Somalia
Jordan
Saudi Arabia
Iran (Islamic Republic of) 32.1
27.4
26.3
25.4
25.4
24.7
24.4
24.3
23.8
22.6
21.5
20.8
20.2
20.0
18.7
15.5
15.2
14.2
12.8
10.9
8.0
EMR
Micronesia (Federated States of)
Kiribati
Singapore
Japan
Palau
Australia
Marshall Islands
Fiji
New Zealand
Tonga
Brunei Darussalam
Philippines
Republic of Korea
Lao People's Democratic Republic
Samoa
Vanuatu
Papua New Guinea
Cambodia
China
Solomon Islands
Mongolia
Malaysia
Cook Islands
Viet Nam
Nauru
Niue
Tuvalu
24.5
24.2
24.0
21.0
19.2
18.8
17.4
16.8
16.6
15.8
14.3
12.0
10.5
8.0
7.6
6.0
5.8
5.7
5.4
4.8
4.7
3.6
2.9
1.9
WPR
The former Yugoslav Republic of Macedonia
34 WORLD HEALTH STATISTICS: 2018
Road traffic mortality rate (per 100 000 population), 20131
Data type: Comparable estimates
DEATHS FROM ROAD TRAFFIC INJURIESSDG Target 3.6By 2020, halve the number of global deaths and injuries from road traffic accidents
Indicator 3.6.1: Death rate due to road traffic injuries
Indicator 3.6.1 Deaths from road traffic injuries
1 Global status report on road safety 2015. Geneva: World Health Organization; 2015 (http://www.who.int/violence_injury_prevention/road_safety_status/2015/en/, accessed 30 March 2018). WHO Member States with a population of less than 90 000 in 2015 who did not participate in the survey used to produce the report were not included in the analysis.
2 Updated estimate.

Zimbabwe
Swaziland
South Africa²
Kenya
Algeria³
Lesotho
Namibia
Malawi
Rwanda
Zambia
Ethiopia
United Republic of Tanzania
Mozambique²
Sao Tome and Principe
Uganda
Madagascar
Senegal
Ghana
Mali
Niger
Burkina Faso
Mauritius
Cameroon
Burundi²
Congo
Guinea-Bissau
Sierra Leone
Liberia
Gabon
Togo
Côte d'Ivoire
Mauritania
Central African Republic³
Comoros
Nigeria³
Benin
Angola
Gambia
Guinea
Equatorial Guinea
Eritrea
Chad
Democratic Republic of the Congo
South Sudan³
Botswana
Cabo Verde
Seychelles
49.6
28.7
20.5
19.6
5.6
85.2
80.6
77.9
77.6
77.2
76.1
75.1
74.6
65.9
63.8
59.4
52.9
50.4
50.3
49.9
47.4
46.2
46.0
45.4
45.0
41.9
40.1
39.3
38.5
37.6
37.5
37.2
33.7
32.1
31.1
30.4
27.8
26.3
24.5
24.2
23.9
21.5
17.5
15.6
AFRNicaragua
Brazil
Costa Rica³
Cuba
Colombia
Dominican Republic²
Jamaica
Paraguay
El Salvador
Mexico
Ecuador
Honduras
Panama
Suriname³
Saint Lucia
Barbados³
Peru
Belize
Guatemala
Trinidad and Tobago
Guyana²
Haiti
Bolivia (Plurinational State of)
Antigua and Barbuda
Argentina
Bahamas
Canada
Chile
Dominica
Grenada
Saint Kitts and Nevis
Saint Vincent and the Grenadines
United States of America
Uruguay
Venezuela (Bolivarian Republic of)
89.3
89.1
82.9
73.2
58.2
42.8
89.8
88.4
86.5
84.1
82.6
81.9
80.9
80.7
76.0
75.9
72.4
70.0
66.1
65.9
65.6
52.5
44.0
AMR
Thailand
Bhutan³
Indonesia
Myanmar
Sri Lanka
Bangladesh
India
Nepal
Timor-Leste²
Maldives
Democratic People's Republic ofKorea
46.1
56.1
72.0
72.5
74.1
75.0
77.9
89.2
42.7
84.6
SEAR
Kazakhstan³
Turkmenistan
Belarus³
Ukraine
Kyrgyzstan
Republic of Moldova
Turkey
Tajikistan
Armenia
Montenegro³
Serbia³
The former Yugoslav Republic of ..
Bosnia and Herzegovina³
Albania
Andorra
Austria
Azerbaijan
Belgium
Bulgaria
Croatia
Cyprus
Czechia
Denmark
Estonia
Finland
France
Georgia
Germany
Greece
Hungary
Iceland
Ireland
Israel
Italy
Latvia
Lithuania
Luxembourg
Malta
Monaco
Netherlands
Norway
Poland
Portugal
Romania
Russian Federation
San Marino
Slovakia
Slovenia
Spain
Sweden
Switzerland
United Kingdom
Uzbekistan
79.6
22.3
12.9
75.6
74.2
68.0
62.1
60.4
59.7
50.8
40.2
34.1
25.1
21.9
EUREgypt
Morocco
Tunisia³
Qatar³
Iran (Islamic Republic of)
Iraq³
Jordan
Syrian Arab Republic
Pakistan
Yemen
Afghanistan
Oman
Sudan
Libya
Bahrain
Djibouti
Kuwait
Lebanon
Saudi Arabia
Somalia
United Arab Emirates
74.8
68.6
59.3
53.3
29.6
80.0
73.2
68.9
58.0
47.0
46.9
42.1
39.6
30.2
EMR
Marshall Islands
Viet Nam³
Mongolia³
Lao People's Democratic Republic
Cambodia
Philippines
Vanuatu
Tonga
Nauru
Tuvalu
Papua New Guinea
Samoa
Solomon Islands
Kiribati
Australia
Brunei Darussalam
China
Cook Islands
Fiji
Japan
Malaysia
Micronesia (Federated States of)
New Zealand
Niue
Palau
Republic of Korea
Singapore
80.5
42.5
41.0
40.6
35.8
69.7
68.3
61.3
56.4
51.5
50.7
47.9
39.4
38.0
WPR
2012 or later Pre-2012
The former Yugoslav Republic of Macedonia3
35MONITORING HEALTH FOR THE SDGs
Proportion of married or in-union women of reproductive age who have their need for family planning satisfied with modern methods (%), latest available data, 2007–20171
Data type: Primary data
FAMILY PLANNINGSDG Target 3.7By 2030, ensure universal access to sexual and reproductive health-care services, including for family planning, information and education, and the integration of reproductive health into national strategies and programmes
Indicator 3.7.1: Proportion of women of reproductive age (aged 15–49 years) who have their need for family planning satisfied with modern methods
Indicator 3.7.1 Family planning
1 Data pertaining to women aged 15-49 years who were married or in union, extracted by WHO from World Contraceptive Use 2018 [online database]. New York (NY): United Nations, Department of Economic and Social Affairs, Population Division; 2018 (http://www.un.org/en/development/desa/population/publications/dataset/contraception/wcu2018.shtml, accessed 2 May 2018).
2 Preliminary data.3 Deviation from standard question or measurement method. Please refer to World Contraceptive Use 2018 for more information.

Algeria
Mauritius
Botswana
Rwanda
Burundi
Ghana
Seychelles
Comoros
South Africa
Eritrea
Mauritania
Cabo Verde
Ethiopia
Senegal
Namibia
Togo
Swaziland
Gambia
Gabon
Sao Tome and Principe
Benin
Lesotho
Kenya
Liberia
Guinea-Bissau
Zimbabwe
Cameroon
Burkina Faso
Sierra Leone
Côte d'Ivoire
United Republic of Tanzania
Malawi
Democratic Republic of the Congo
Uganda
Zambia
Nigeria
Guinea
Niger
Congo
Madagascar
South Sudan
Angola
Mozambique
Mali
Equatorial Guinea
Chad
Central African Republic 229.0
176.0
167.0
158.1
147.0
146.0
129.0
104.8
88.0
85.0
80.0
76.0
70.0
37.5
9.0
179.0
174.0
163.0
152.0
146.0
145.0
141.0
141.0
138.0
136.0
132.0
125.0
122.0
119.0
110.0
106.0
96.0
94.0
94.0
92.0
91.0
87.0
82.0
80.0
80.0
77.0
71.0
65.8
59.0
58.0
45.0
24.1
AFRCanada
United States of America
Bahamas
Trinidad and Tobago
Chile
Dominican Republic
Jamaica
Haiti
Peru
Barbados
Cuba
Uruguay
Ecuador
Suriname
Brazil
Paraguay
Saint Vincent and the Grenadines
Argentina
Mexico
El Salvador
Bolivia (Plurinational State of)
Colombia
Belize
Guyana
Panama
Guatemala
Nicaragua
Honduras
Antigua and Barbuda
Costa Rica
Dominica
Grenada
Saint Kitts and Nevis
Saint Lucia
Venezuela (Bolivarian Republic of)
101.0
92.0
62.8
49.7
49.0
45.7
38.0
92.0
84.3
74.0
74.0
71.6
71.0
69.2
66.2
65.5
63.7
60.8
57.7
56.5
55.6
50.0
49.4
45.3
44.7
32.0
22.3
11.1
AMR
Democratic People's Republic ofKorea
Maldives
Sri Lanka
India
Bhutan
Myanmar
Indonesia
Thailand
Bangladesh
Nepal
Timor-Leste
12.9
28.1
28.4
36.0
40.1
51.0
78.0
88.0
20.3
0.7
SEAR
Switzerland
Netherlands
Denmark
Sweden
Slovenia
Norway
Cyprus
Italy
Luxembourg
Finland
Belgium
Austria
Spain
Germany
Greece
Iceland
Portugal
Ireland
France
Croatia
Israel
Bosnia and Herzegovina
Montenegro
Malta
Czechia
Poland
Estonia
Lithuania
United Kingdom
Serbia
Latvia
Albania
The former Yugoslav Republic of ..
Belarus
Hungary
Russian Federation
Armenia
Slovakia
Ukraine
Republic of Moldova
Turkey
Turkmenistan
Uzbekistan
Romania
Kazakhstan
Bulgaria
Georgia
Azerbaijan
Tajikistan
Andorra
Kyrgyzstan
Monaco
San Marino
54.0
29.5
20.1
52.8
47.9
39.4
36.0
35.3
28.0
26.9
26.7
26.1
24.3
24.3
24.0
22.8
20.4
18.9
18.0
16.4
14.4
14.1
12.5
12.3
11.6
11.4
11.1
10.7
9.7
9.6
9.2
8.6
8.2
8.0
8.0
7.8
7.7
7.6
6.6
6.2
5.6
5.1
4.9
4.6
4.5
4.4
3.4
3.2
2.6
EURTunisia
Kuwait
Qatar
Libya
Oman
Bahrain
Djibouti
Iran (Islamic Republic of)
Jordan
Morocco
United Arab Emirates
Pakistan
Syrian Arab Republic
Egypt
Yemen
Iraq
Afghanistan
Sudan
Lebanon
Saudi Arabia
Somalia
82.0
54.0
44.0
34.2
32.0
26.0
23.0
20.6
3.0
87.0
87.0
67.0
56.0
14.3
13.5
10.9
10.5
6.1
EMR
Republic of Korea
Singapore
Japan
China
Brunei Darussalam
Malaysia
Australia
New Zealand
Mongolia
Tonga
Viet Nam
Samoa
Solomon Islands
Kiribati
Cambodia
Philippines
Lao People's Democratic Republic
Vanuatu
Cook Islands
Fiji
Marshall Islands
Micronesia (Federated States of)
Nauru
Niue
Palau
Papua New Guinea
Tuvalu
78.0
49.9
42.0
39.2
30.0
75.6
57.0
57.0
30.1
26.7
16.0
11.9
11.5
11.4
9.2
4.1
2.7
1.3
WPR
2012 or later Pre-2012
The former Yugoslav Republic of Macedonia
36 WORLD HEALTH STATISTICS: 2018
Adolescent birth rate (per 1000 women aged 15–19 years), 2007–20161
Data type: Primary data
ADOLESCENT BIRTH RATESDG Target 3.7By 2030, ensure universal access to sexual and reproductive health-care services, including for family planning, information and education, and the integration of reproductive health into national strategies and programmes
Indicator 3.7.2: Adolescent birth rate (aged 10–14 years; aged 15–19 years) per 1000 women in that age group
Indicator 3.7.2 Adolescent birth rate
1 Data extracted by WHO from World Fertility Data 2017 [online database]. New York (NY): United Nations, Department of Economic and Social Affairs, Population Division; November 2017 (http://www.un.org/en/development/desa/population/publications/dataset/fertility/wfd2017.shtml).
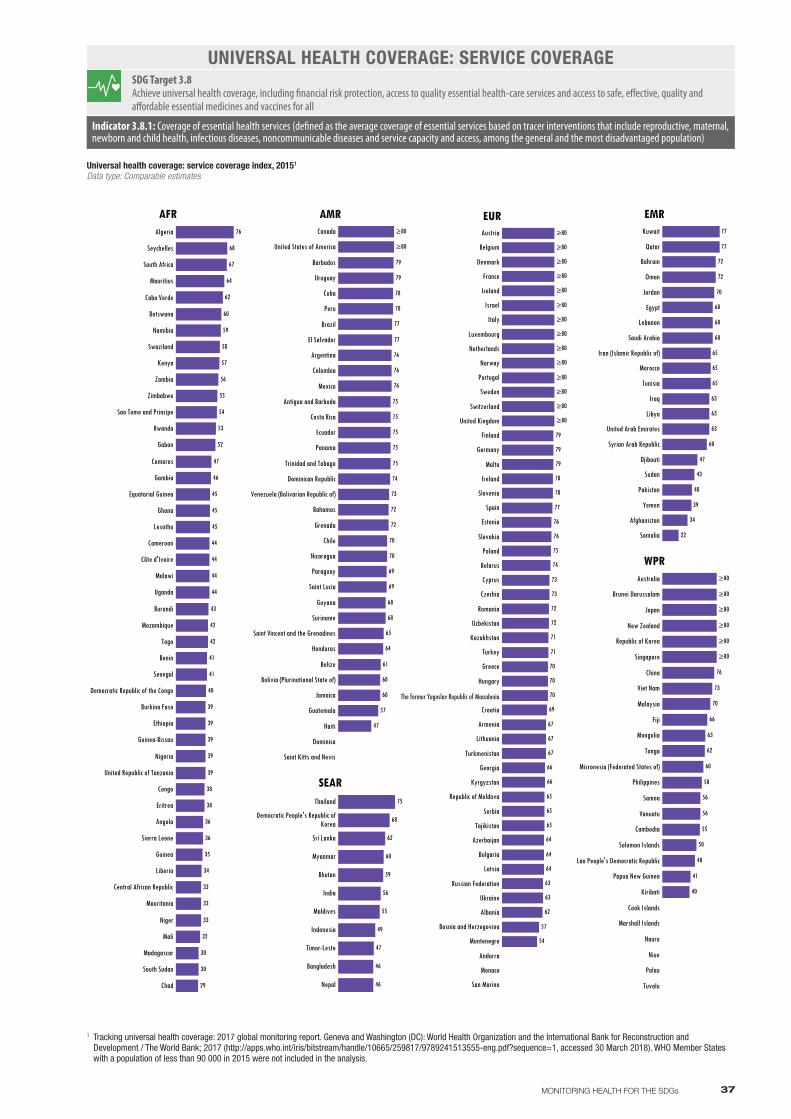
Algeria
Seychelles
South Africa
Mauritius
Cabo Verde
Botswana
Namibia
Swaziland
Kenya
Zambia
Zimbabwe
Sao Tome and Principe
Rwanda
Gabon
Comoros
Gambia
Equatorial Guinea
Ghana
Lesotho
Cameroon
Côte d'Ivoire
Malawi
Uganda
Burundi
Mozambique
Togo
Benin
Senegal
Democratic Republic of the Congo
Burkina Faso
Ethiopia
Guinea-Bissau
Nigeria
United Republic of Tanzania
Congo
Eritrea
Angola
Sierra Leone
Guinea
Liberia
Central African Republic
Mauritania
Niger
Mali
Madagascar
South Sudan
Chad
76
68
67
64
62
60
59
58
57
56
55
54
53
52
47
46
45
45
45
44
44
44
44
43
42
42
41
41
40
39
39
39
39
39
38
38
36
36
35
34
33
33
33
32
30
30
29
AFRCanada
United States of America
Barbados
Uruguay
Cuba
Peru
Brazil
El Salvador
Argentina
Colombia
Mexico
Antigua and Barbuda
Costa Rica
Ecuador
Panama
Trinidad and Tobago
Dominican Republic
Venezuela (Bolivarian Republic of)
Bahamas
Grenada
Chile
Nicaragua
Paraguay
Saint Lucia
Guyana
Suriname
Saint Vincent and the Grenadines
Honduras
Belize
Bolivia (Plurinational State of)
Jamaica
Guatemala
Haiti
Dominica
Saint Kitts and Nevis
≥80
≥80
79
79
78
78
77
77
76
76
76
75
75
75
75
75
74
73
72
72
70
70
69
69
68
68
65
64
61
60
60
57
47
AMR
Thailand
Democratic People's Republic ofKorea
Sri Lanka
Myanmar
Bhutan
India
Maldives
Indonesia
Timor-Leste
Bangladesh
Nepal
46
46
47
49
55
56
59
60
62
68
75
SEAR
Austria
Belgium
Denmark
France
Iceland
Israel
Italy
Luxembourg
Netherlands
Norway
Portugal
Sweden
Switzerland
United Kingdom
Finland
Germany
Malta
Ireland
Slovenia
Spain
Estonia
Slovakia
Poland
Belarus
Cyprus
Czechia
Romania
Uzbekistan
Kazakhstan
Turkey
Greece
Hungary
The former Yugoslav Republic of ..
Croatia
Armenia
Lithuania
Turkmenistan
Georgia
Kyrgyzstan
Republic of Moldova
Serbia
Tajikistan
Azerbaijan
Bulgaria
Latvia
Russian Federation
Ukraine
Albania
Bosnia and Herzegovina
Montenegro
Andorra
Monaco
San Marino
≥80
≥80
≥80
≥80
≥80
≥80
≥80
≥80
≥80
≥80
≥80
≥80
≥80
≥80
79
79
79
78
78
77
76
76
75
74
73
73
72
72
71
71
70
70
70
69
67
67
67
66
66
65
65
65
64
64
64
63
63
62
57
54
EURKuwait
Qatar
Bahrain
Oman
Jordan
Egypt
Lebanon
Saudi Arabia
Iran (Islamic Republic of)
Morocco
Tunisia
Iraq
Libya
United Arab Emirates
Syrian Arab Republic
Djibouti
Sudan
Pakistan
Yemen
Afghanistan
Somalia
77
77
72
72
70
68
68
68
65
65
65
63
63
63
60
47
43
40
39
34
22
EMR
Australia
Brunei Darussalam
Japan
New Zealand
Republic of Korea
Singapore
China
Viet Nam
Malaysia
Fiji
Mongolia
Tonga
Micronesia (Federated States of)
Philippines
Samoa
Vanuatu
Cambodia
Solomon Islands
Lao People's Democratic Republic
Papua New Guinea
Kiribati
Cook Islands
Marshall Islands
Nauru
Niue
Palau
Tuvalu
≥80
≥80
≥80
≥80
≥80
≥80
76
73
70
66
63
62
60
58
56
56
55
50
48
41
40
WPR
The former Yugoslav Republic of Macedonia
37MONITORING HEALTH FOR THE SDGs
UNIVERSAL HEALTH COVERAGE: SERVICE COVERAGESDG Target 3.8Achieve universal health coverage, including financial risk protection, access to quality essential health-care services and access to safe, effective, quality and affordable essential medicines and vaccines for all
Indicator 3.8.1: Coverage of essential health services (defined as the average coverage of essential services based on tracer interventions that include reproductive, maternal, newborn and child health, infectious diseases, noncommunicable diseases and service capacity and access, among the general and the most disadvantaged population)
Universal health coverage: service coverage index, 20151
Data type: Comparable estimates
Indicator 3.8.1 Universal health coverage: service coverage
1 Tracking universal health coverage: 2017 global monitoring report. Geneva and Washington (DC): World Health Organization and the International Bank for Reconstruction and Development / The World Bank; 2017 (http://apps.who.int/iris/bitstream/handle/10665/259817/9789241513555-eng.pdf?sequence=1, accessed 30 March 2018). WHO Member States with a population of less than 90 000 in 2015 were not included in the analysis.
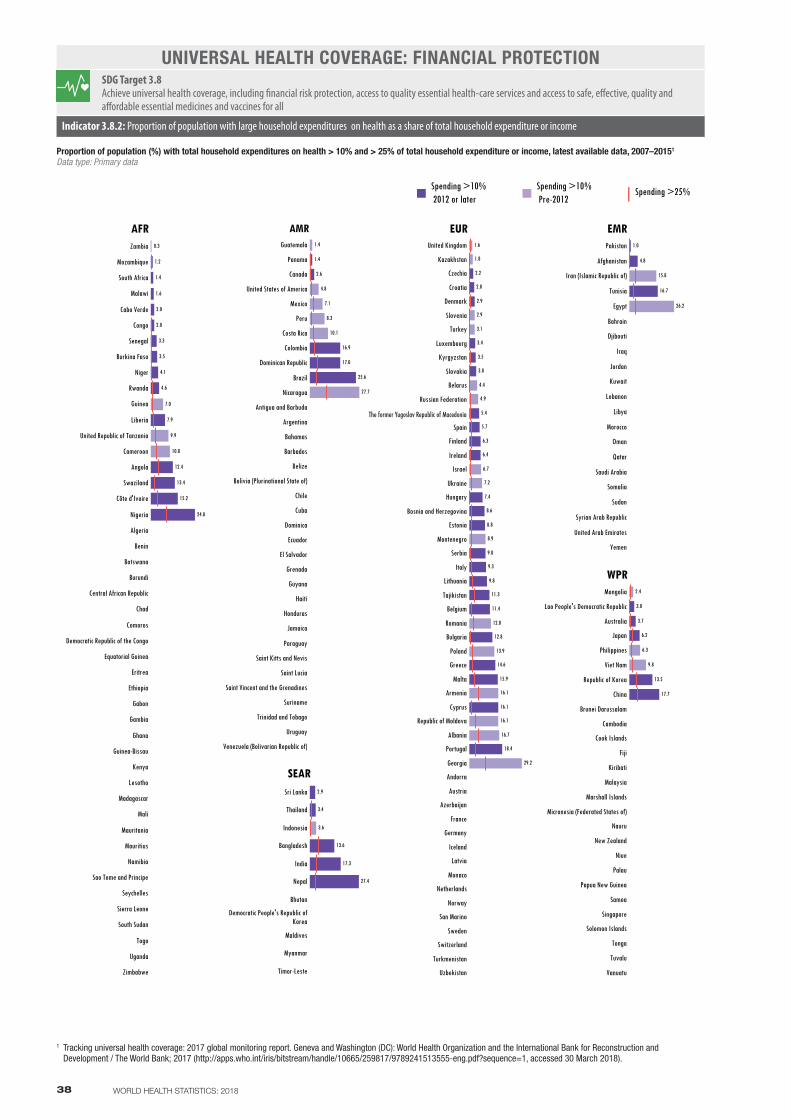
38 WORLD HEALTH STATISTICS: 2018
UNIVERSAL HEALTH COVERAGE: FINANCIAL PROTECTIONSDG Target 3.8Achieve universal health coverage, including financial risk protection, access to quality essential health-care services and access to safe, effective, quality and affordable essential medicines and vaccines for all
Indicator 3.8.2: Proportion of population with large household expenditures on health as a share of total household expenditure or income
Proportion of population (%) with total household expenditures on health > 10% and > 25% of total household expenditure or income, latest available data, 2007–20151
Data type: Primary data
United Kingdom
Kazakhstan
Czechia
Croatia
Denmark
Slovenia
Turkey
Luxembourg
Kyrgyzstan
Slovakia
Belarus
Russian Federation
The former Yugoslav Republic of ..
Spain
Finland
Ireland
Israel
Ukraine
Hungary
Bosnia and Herzegovina
Estonia
Montenegro
Serbia
Italy
Lithuania
Tajikistan
Belgium
Romania
Bulgaria
Poland
Greece
Malta
Armenia
Cyprus
Republic of Moldova
Albania
Portugal
Georgia
Andorra
Austria
Azerbaijan
France
Germany
Iceland
Latvia
Monaco
Netherlands
Norway
San Marino
Sweden
Switzerland
Turkmenistan
Uzbekistan
18.4
16.7
29.2
12.0
13.9
16.1
16.1
11.3
11.4
12.8
14.6
15.9
16.1
7.2
8.9
2.2
2.8
2.9
1.6
3.5
3.8
5.4
5.7
6.3
6.4
7.4
8.6
8.8
9.0
9.3
9.8
1.8
2.9
3.1
4.4
4.9
6.7
3.4
EURPakistan
Afghanistan
Iran (Islamic Republic of)
Tunisia
Egypt
Bahrain
Djibouti
Iraq
Jordan
Kuwait
Lebanon
Libya
Morocco
Oman
Qatar
Saudi Arabia
Somalia
Sudan
Syrian Arab Republic
United Arab Emirates
Yemen
15.8
26.2
16.7
1.0
4.8
EMRGuatemala
Panama
Canada
United States of America
Mexico
Peru
Costa Rica
Colombia
Dominican Republic
Brazil
Nicaragua
Antigua and Barbuda
Argentina
Bahamas
Barbados
Belize
Bolivia (Plurinational State of)
Chile
Cuba
Dominica
Ecuador
El Salvador
Grenada
Guyana
Haiti
Honduras
Jamaica
Paraguay
Saint Kitts and Nevis
Saint Lucia
Saint Vincent and the Grenadines
Suriname
Trinidad and Tobago
Uruguay
Venezuela (Bolivarian Republic of)
10.1
27.7
16.9
17.0
25.6
1.4
4.8
7.1
8.3
1.4
2.6
AMR
Sri Lanka
Thailand
Indonesia
Bangladesh
India
Nepal
Bhutan
Democratic People's Republic ofKorea
Maldives
Myanmar
Timor-Leste
13.6
17.3
27.4
3.6
2.9
3.4
SEAR
Zambia
Mozambique
South Africa
Malawi
Cabo Verde
Congo
Senegal
Burkina Faso
Niger
Rwanda
Guinea
Liberia
United Republic of Tanzania
Cameroon
Angola
Swaziland
Côte d'Ivoire
Nigeria
Algeria
Benin
Botswana
Burundi
Central African Republic
Chad
Comoros
Democratic Republic of the Congo
Equatorial Guinea
Eritrea
Ethiopia
Gabon
Gambia
Ghana
Guinea-Bissau
Kenya
Lesotho
Madagascar
Mali
Mauritania
Mauritius
Namibia
Sao Tome and Principe
Seychelles
Sierra Leone
South Sudan
Togo
Uganda
Zimbabwe
10.8
12.4
13.4
15.2
24.8
7.0
9.9
0.3
1.2
1.4
1.6
2.0
2.0
3.3
3.5
4.1
4.6
7.9
AFR
Mongolia
Lao People's Democratic Republic
Australia
Japan
Philippines
Viet Nam
Republic of Korea
China
Brunei Darussalam
Cambodia
Cook Islands
Fiji
Kiribati
Malaysia
Marshall Islands
Micronesia (Federated States of)
Nauru
New Zealand
Niue
Palau
Papua New Guinea
Samoa
Singapore
Solomon Islands
Tonga
Tuvalu
Vanuatu
13.5
17.7
2.4
6.3
9.8
3.0
3.7
6.2
WPR
The former Yugoslav Republic of Macedonia
Spending >10% 2012 or later
Spending >10% Pre-2012
Spending >25%
Indicator 3.8.2 Universal health coverage: financial protection
1 Tracking universal health coverage: 2017 global monitoring report. Geneva and Washington (DC): World Health Organization and the International Bank for Reconstruction and Development / The World Bank; 2017 (http://apps.who.int/iris/bitstream/handle/10665/259817/9789241513555-eng.pdf?sequence=1, accessed 30 March 2018).
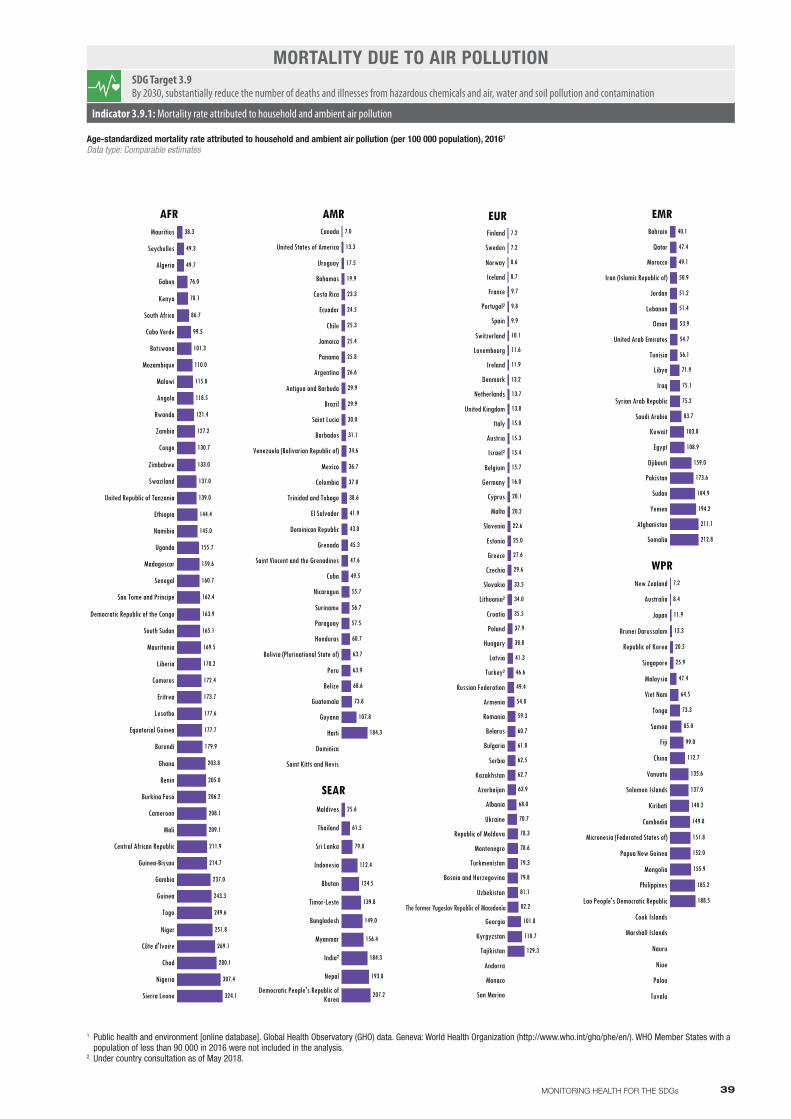
Mauritius
Seychelles
Algeria
Gabon
Kenya
South Africa
Cabo Verde
Botswana
Mozambique
Malawi
Angola
Rwanda
Zambia
Congo
Zimbabwe
Swaziland
United Republic of Tanzania
Ethiopia
Namibia
Uganda
Madagascar
Senegal
Sao Tome and Principe
Democratic Republic of the Congo
South Sudan
Mauritania
Liberia
Comoros
Eritrea
Lesotho
Equatorial Guinea
Burundi
Ghana
Benin
Burkina Faso
Cameroon
Mali
Central African Republic
Guinea-Bissau
Gambia
Guinea
Togo
Niger
Côte d'Ivoire
Chad
Nigeria
Sierra Leone 324.1
307.4
280.1
269.1
251.8
249.6
243.3
237.0
214.7
211.9
209.1
208.1
206.2
205.0
203.8
179.9
177.7
177.6
173.7
172.4
170.2
169.5
165.1
163.9
162.4
160.7
159.6
155.7
145.0
144.4
139.0
137.0
133.0
130.7
127.2
121.4
118.5
115.0
110.0
101.3
99.5
86.7
78.1
76.0
49.7
49.3
38.3
AFRCanada
United States of America
Uruguay
Bahamas
Costa Rica
Ecuador
Chile
Jamaica
Panama
Argentina
Antigua and Barbuda
Brazil
Saint Lucia
Barbados
Venezuela (Bolivarian Republic of)
Mexico
Colombia
Trinidad and Tobago
El Salvador
Dominican Republic
Grenada
Saint Vincent and the Grenadines
Cuba
Nicaragua
Suriname
Paraguay
Honduras
Bolivia (Plurinational State of)
Peru
Belize
Guatemala
Guyana
Haiti
Dominica
Saint Kitts and Nevis
184.3
107.8
73.8
68.6
63.9
63.7
60.7
57.5
56.7
55.7
49.5
47.6
45.3
43.0
41.9
38.6
37.0
36.7
34.6
31.1
30.0
29.9
29.9
26.6
25.8
25.4
25.3
24.5
23.3
19.9
17.5
13.3
7.0
AMR
Maldives
Thailand
Sri Lanka
Indonesia
Bhutan
Timor-Leste
Bangladesh
Myanmar
India²
Nepal
Democratic People's Republic ofKorea
112.4
124.5
139.8
149.0
156.4
184.3
193.8
207.2
25.6
61.5
79.8
SEAR
Finland
Sweden
Norway
Iceland
France
Portugal²
Spain
Switzerland
Luxembourg
Ireland
Denmark
Netherlands
United Kingdom
Italy
Austria
Israel²
Belgium
Germany
Cyprus
Malta
Slovenia
Estonia
Greece
Czechia
Slovakia
Lithuania²
Croatia
Poland
Hungary
Latvia
Turkey²
Russian Federation
Armenia
Romania
Belarus
Bulgaria
Serbia
Kazakhstan
Azerbaijan
Albania
Ukraine
Republic of Moldova
Montenegro
Turkmenistan
Bosnia and Herzegovina
Uzbekistan
The former Yugoslav Republic of ..
Georgia
Kyrgyzstan
Tajikistan
Andorra
Monaco
San Marino
129.3
110.7
101.8
82.2
81.1
79.8
79.3
78.6
78.3
70.7
68.0
63.9
62.7
62.5
61.8
60.7
59.3
54.8
49.4
46.6
41.3
38.8
37.9
35.5
34.0
33.5
29.6
27.6
25.0
22.6
20.2
20.1
16.0
15.7
15.4
15.3
15.0
13.8
13.7
13.2
11.9
11.6
10.1
9.9
9.8
9.7
8.7
8.6
7.2
7.2
EURBahrain
Qatar
Morocco
Iran (Islamic Republic of)
Jordan
Lebanon
Oman
United Arab Emirates
Tunisia
Libya
Iraq
Syrian Arab Republic
Saudi Arabia
Kuwait
Egypt
Djibouti
Pakistan
Sudan
Yemen
Afghanistan
Somalia 212.8
211.1
194.2
184.9
173.6
159.0
108.9
103.8
83.7
75.2
75.1
71.9
56.1
54.7
53.9
51.4
51.2
50.9
49.1
47.4
40.1
EMR
New Zealand
Australia
Japan
Brunei Darussalam
Republic of Korea
Singapore
Malaysia
Viet Nam
Tonga
Samoa
Fiji
China
Vanuatu
Solomon Islands
Kiribati
Cambodia
Micronesia (Federated States of)
Papua New Guinea
Mongolia
Philippines
Lao People's Democratic Republic
Cook Islands
Marshall Islands
Nauru
Niue
Palau
Tuvalu
188.5
185.2
155.9
152.0
151.8
149.8
140.2
137.0
135.6
112.7
99.0
85.0
73.3
64.5
47.4
25.9
20.5
13.3
11.9
8.4
7.2
WPR
The former Yugoslav Republic of Macedonia
39MONITORING HEALTH FOR THE SDGs
Age-standardized mortality rate attributed to household and ambient air pollution (per 100 000 population), 20161
Data type: Comparable estimates
MORTALITY DUE TO AIR POLLUTIONSDG Target 3.9By 2030, substantially reduce the number of deaths and illnesses from hazardous chemicals and air, water and soil pollution and contamination
Indicator 3.9.1: Mortality rate attributed to household and ambient air pollution
Indicator 3.9.1 Mortality due to air pollution
1 Public health and environment [online database]. Global Health Observatory (GHO) data. Geneva: World Health Organization (http://www.who.int/gho/phe/en/). WHO Member States with a population of less than 90 000 in 2016 were not included in the analysis.
2 Under country consultation as of May 2018.
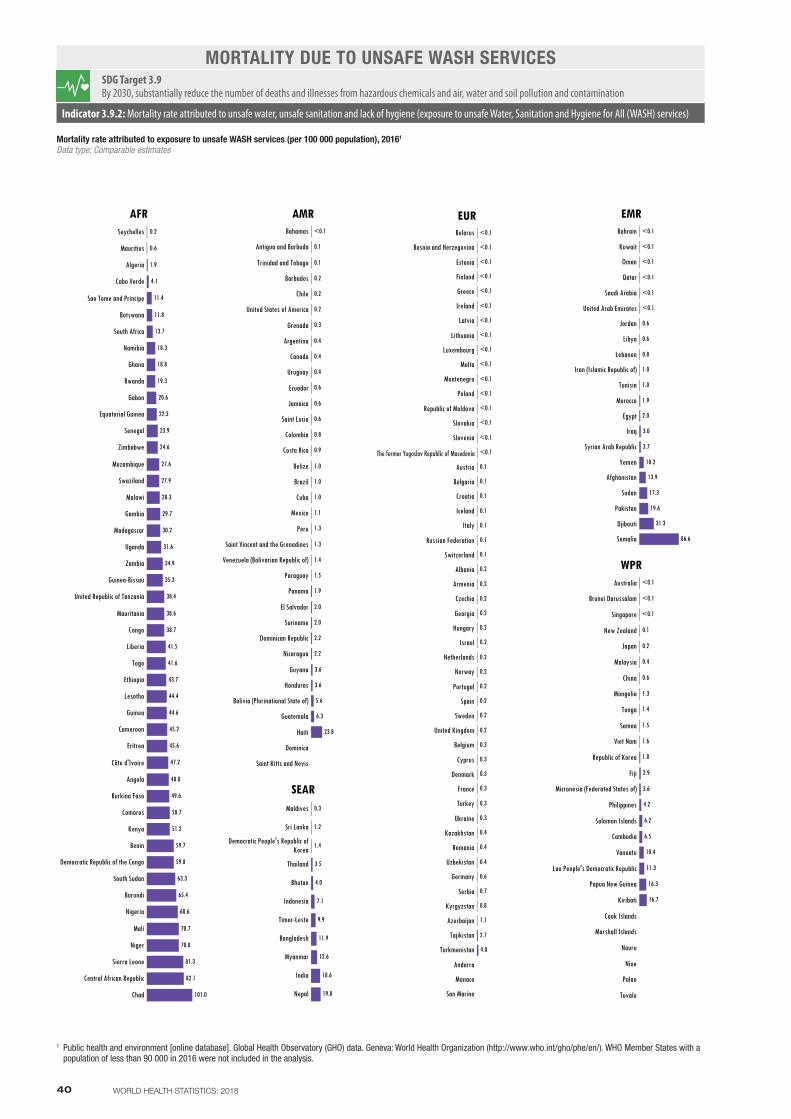
Seychelles
Mauritius
Algeria
Cabo Verde
Sao Tome and Principe
Botswana
South Africa
Namibia
Ghana
Rwanda
Gabon
Equatorial Guinea
Senegal
Zimbabwe
Mozambique
Swaziland
Malawi
Gambia
Madagascar
Uganda
Zambia
Guinea-Bissau
United Republic of Tanzania
Mauritania
Congo
Liberia
Togo
Ethiopia
Lesotho
Guinea
Cameroon
Eritrea
Côte d'Ivoire
Angola
Burkina Faso
Comoros
Kenya
Benin
Democratic Republic of the Congo
South Sudan
Burundi
Nigeria
Mali
Niger
Sierra Leone
Central African Republic
Chad 101.0
82.1
81.3
70.8
70.7
68.6
65.4
63.3
59.8
59.7
51.2
50.7
49.6
48.8
47.2
45.6
45.2
44.6
44.4
43.7
41.6
41.5
38.7
38.6
38.4
35.3
34.9
31.6
30.2
29.7
28.3
27.9
27.6
24.6
23.9
22.3
20.6
19.3
18.8
18.3
13.7
11.8
11.4
4.1
1.9
0.6
0.2
AFRBahamas
Antigua and Barbuda
Trinidad and Tobago
Barbados
Chile
United States of America
Grenada
Argentina
Canada
Uruguay
Ecuador
Jamaica
Saint Lucia
Colombia
Costa Rica
Belize
Brazil
Cuba
Mexico
Peru
Saint Vincent and the Grenadines
Venezuela (Bolivarian Republic of)
Paraguay
Panama
El Salvador
Suriname
Dominican Republic
Nicaragua
Guyana
Honduras
Bolivia (Plurinational State of)
Guatemala
Haiti
Dominica
Saint Kitts and Nevis
<0.1
23.8
6.3
5.6
3.6
3.6
2.2
2.2
2.0
2.0
1.9
1.5
1.4
1.3
1.3
1.1
1.0
1.0
1.0
0.9
0.8
0.6
0.6
0.6
0.4
0.4
0.4
0.3
0.2
0.2
0.2
0.1
0.1
AMR
Maldives
Sri Lanka
Democratic People's Republic ofKorea
Thailand
Bhutan
Indonesia
Timor-Leste
Bangladesh
Myanmar
India
Nepal
11.9
12.6
18.6
19.8
0.3
1.2
1.4
3.5
4.0
7.1
9.9
SEAR
Belarus
Bosnia and Herzegovina
Estonia
Finland
Greece
Ireland
Latvia
Lithuania
Luxembourg
Malta
Montenegro
Poland
Republic of Moldova
Slovakia
Slovenia
The former Yugoslav Republic of ..
Austria
Bulgaria
Croatia
Iceland
Italy
Russian Federation
Switzerland
Albania
Armenia
Czechia
Georgia
Hungary
Israel
Netherlands
Norway
Portugal
Spain
Sweden
United Kingdom
Belgium
Cyprus
Denmark
France
Turkey
Ukraine
Kazakhstan
Romania
Uzbekistan
Germany
Serbia
Kyrgyzstan
Azerbaijan
Tajikistan
Turkmenistan
Andorra
Monaco
San Marino
<0.1
<0.1
<0.1
<0.1
<0.1
<0.1
<0.1
<0.1
<0.1
<0.1
<0.1
<0.1
<0.1
<0.1
<0.1
<0.1
4.0
2.7
1.1
0.8
0.7
0.6
0.4
0.4
0.4
0.3
0.3
0.3
0.3
0.3
0.3
0.2
0.2
0.2
0.2
0.2
0.2
0.2
0.2
0.2
0.2
0.2
0.2
0.1
0.1
0.1
0.1
0.1
0.1
0.1
EURBahrain
Kuwait
Oman
Qatar
Saudi Arabia
United Arab Emirates
Jordan
Libya
Lebanon
Iran (Islamic Republic of)
Tunisia
Morocco
Egypt
Iraq
Syrian Arab Republic
Yemen
Afghanistan
Sudan
Pakistan
Djibouti
Somalia
<0.1
<0.1
<0.1
<0.1
<0.1
<0.1
86.6
31.3
19.6
17.3
13.9
10.2
3.7
3.0
2.0
1.9
1.0
1.0
0.8
0.6
0.6
EMR
Australia
Brunei Darussalam
Singapore
New Zealand
Japan
Malaysia
China
Mongolia
Tonga
Samoa
Viet Nam
Republic of Korea
Fiji
Micronesia (Federated States of)
Philippines
Solomon Islands
Cambodia
Vanuatu
Lao People's Democratic Republic
Papua New Guinea
Kiribati
Cook Islands
Marshall Islands
Nauru
Niue
Palau
Tuvalu
<0.1
<0.1
<0.1
16.7
16.3
11.3
10.4
6.5
6.2
4.2
3.6
2.9
1.8
1.6
1.5
1.4
1.3
0.6
0.4
0.2
0.1
WPR
The former Yugoslav Republic of Macedonia
40 WORLD HEALTH STATISTICS: 2018
Mortality rate attributed to exposure to unsafe WASH services (per 100 000 population), 20161
Data type: Comparable estimates
MORTALITY DUE TO UNSAFE WASH SERVICESSDG Target 3.9By 2030, substantially reduce the number of deaths and illnesses from hazardous chemicals and air, water and soil pollution and contamination
Indicator 3.9.2: Mortality rate attributed to unsafe water, unsafe sanitation and lack of hygiene (exposure to unsafe Water, Sanitation and Hygiene for All (WASH) services)
Indicator 3.9.2 Mortality due to unsafe WASH services
1 Public health and environment [online database]. Global Health Observatory (GHO) data. Geneva: World Health Organization (http://www.who.int/gho/phe/en/). WHO Member States with a population of less than 90 000 in 2016 were not included in the analysis.

Mauritius
Cabo Verde
Seychelles
Algeria
Gabon
Sao Tome and Principe
Botswana
Congo
South Africa
Namibia
Ghana
Kenya
Liberia
Equatorial Guinea
Gambia
Mauritania
Malawi
Guinea-Bissau
Zimbabwe
Senegal
Comoros
Rwanda
Togo
Angola
United Republic of Tanzania
Ethiopia
Mozambique
Zambia
Burkina Faso
Guinea
Nigeria
Cameroon
Lesotho
Central African Republic
Democratic Republic of the Congo
Uganda
Madagascar
Mali
Swaziland
Benin
Chad
Côte d'Ivoire
South Sudan
Sierra Leone
Eritrea
Niger
Burundi 5.2
4.2
4.2
4.1
4.0
3.9
3.6
3.5
3.3
3.3
3.3
3.2
3.2
3.2
3.1
3.1
3.0
3.0
3.0
2.9
2.9
2.9
2.7
2.7
2.4
2.4
2.4
2.3
2.2
2.2
2.0
1.9
1.9
1.9
1.8
1.8
1.7
1.5
1.2
1.2
1.1
0.9
0.9
0.8
0.6
0.5
0.1
AFRBahamas
Barbados
Brazil
Chile
El Salvador
Jamaica
Saint Lucia
Saint Vincent and the Grenadines
Trinidad and Tobago
Canada
Costa Rica
Cuba
Paraguay
Venezuela (Bolivarian Republic of)
Antigua and Barbuda
Colombia
Dominican Republic
Grenada
Honduras
Mexico
Panama
Suriname
Uruguay
Belize
Argentina
Ecuador
Nicaragua
Guyana
Peru
United States of America
Guatemala
Bolivia (Plurinational State of)
Haiti
Dominica
Saint Kitts and Nevis
2.6
2.0
1.1
0.9
0.9
0.7
0.6
0.6
0.6
0.5
0.4
0.4
0.4
0.4
0.4
0.4
0.4
0.4
0.4
0.3
0.3
0.3
0.3
0.3
0.2
0.2
0.2
0.2
0.2
0.2
0.2
0.2
0.1
AMR
Maldives
Bangladesh
Indonesia
Nepal
Sri Lanka
Thailand
Timor-Leste
Bhutan
Myanmar
Democratic People's Republic ofKorea
India
0.0
0.3
0.4
0.4
0.4
0.4
0.4
0.6
1.4
1.9
2.4
SEAR
Cyprus
Denmark
Israel
Luxembourg
Malta
Netherlands
Switzerland
Austria
Belgium
Croatia
Finland
Germany
Greece
Iceland
Ireland
Norway
Poland
Spain
United Kingdom
Czechia
Hungary
Italy
Portugal
Serbia
Slovenia
Turkey
Albania
Romania
Slovakia
Sweden
The former Yugoslav Republic of ..
Bosnia and Herzegovina
Estonia
France
Montenegro
Armenia
Azerbaijan
Bulgaria
Kyrgyzstan
Lithuania
Turkmenistan
Georgia
Latvia
Uzbekistan
Republic of Moldova
Tajikistan
Russian Federation
Kazakhstan
Ukraine
Belarus
Andorra
Monaco
San Marino
2.6
2.5
2.3
1.7
1.2
1.2
1.0
0.8
0.8
0.7
0.7
0.6
0.6
0.6
0.6
0.5
0.5
0.5
0.5
0.4
0.4
0.4
0.4
0.4
0.3
0.3
0.3
0.3
0.3
0.3
0.3
0.2
0.2
0.2
0.2
0.2
0.2
0.2
0.2
0.2
0.2
0.2
0.2
0.1
0.1
0.1
0.1
0.1
0.1
0.1
EURBahrain
Egypt
Kuwait
Lebanon
United Arab Emirates
Oman
Qatar
Syrian Arab Republic
Iraq
Tunisia
Jordan
Libya
Morocco
Saudi Arabia
Afghanistan
Iran (Islamic Republic of)
Pakistan
Djibouti
Yemen
Sudan
Somalia 4.6
3.9
3.8
2.4
2.3
1.2
1.2
0.7
0.6
0.6
0.6
0.5
0.5
0.4
0.4
0.4
0.3
0.3
0.2
0.2
0.2
EMR
Singapore
Australia
New Zealand
Philippines
Brunei Darussalam
Fiji
Japan
Malaysia
Republic of Korea
Samoa
Cambodia
Lao People's Democratic Republic
Solomon Islands
Vanuatu
Viet Nam
Micronesia (Federated States of)
Tonga
China
Mongolia
Papua New Guinea
Kiribati
Cook Islands
Marshall Islands
Nauru
Niue
Palau
Tuvalu
2.6
1.7
1.6
1.4
1.3
1.0
0.9
0.9
0.9
0.9
0.6
0.5
0.5
0.5
0.4
0.4
0.3
0.2
0.2
0.2
0.1
WPR
The former Yugoslav Republic of Macedonia
41MONITORING HEALTH FOR THE SDGs
Mortality rate attributed to unintentional poisoning (per 100 000 population), 20161
Data type: Comparable estimates
MORTALITY DUE TO UNINTENTIONAL POISONINGSDG Target 3.9By 2030, substantially reduce the number of deaths and illnesses from hazardous chemicals and air, water and soil pollution and contamination
Indicator 3.9.3: Mortality rate attributed to unintentional poisoning
Indicator 3.9.3 Mortality due to unintentional poisoning
1 Global Health Estimates 2016: Deaths by cause, age, sex, by country and by region, 2000–2016. Geneva: World Health Organization; 2018. WHO Member States with a population of less than 90 000 in 2016 were not included in the analysis.

Female Male
South Sudan
Sao Tome and Principe
Mauritania
Madagascar
Guinea-Bissau
Guinea
Gabon
Equatorial Guinea
Côte d'Ivoire
Chad
Central African Republic
Cameroon
Burundi
Angola
Lesotho
Congo
Sierra Leone
Mauritius
Seychelles
Botswana
Namibia
South Africa
Gambia
Zimbabwe
Algeria
Mozambique
United Republic of Tanzania
Malawi
Zambia
Burkina Faso
Comoros
Mali
Rwanda
Kenya
Liberia
Uganda
Senegal
Cabo Verde
Swaziland
Niger
Togo
Benin
Eritrea
Nigeria
Ethiopia
Ghana
Democratic Republicof the Congo
53.9
52.3
41.3
40.7
35.7
34.4
34.2
33.2
31.2
30.7
30.4
29.1
AFR
Venezuela (Bolivarian Republic of)
Trinidad and Tobago
Saint Vincent and the Grenadines
Saint Lucia
Peru
Nicaragua
Honduras
Guyana
Guatemala
Grenada
Dominica
Belize
Antigua and Barbuda
Bolivia (Plurinational State of)
Cuba
Suriname
Chile
Jamaica
Argentina
United States of America
Haiti
Paraguay
Mexico
Bahamas
Uruguay
Dominican Republic
El Salvador
Brazil
Costa Rica
Canada
Saint Kitts and Nevis
Barbados
Colombia
Ecuador
Panama
67.3
53.3
42.9
41.5
28.6
27.7
34.2
AMR
Bhutan
Timor-Leste
Indonesia
Maldives
Bangladesh
Thailand
Nepal
Myanmar
Sri Lanka
India
Democratic People's Republicof Korea
78.1
76.1
55.0
44.7
38.8
37.8
35.2
SEAR
Turkmenistan
Tajikistan
San Marino
Monaco
Russian Federation
Georgia
Cyprus
Armenia
Greece
Albania
Latvia
Kyrgyzstan
Montenegro
Bosnia and Herzegovina
Ukraine
Belarus
Republic of Moldova
Bulgaria
Kazakhstan
Azerbaijan
Turkey
Serbia
Croatia
Estonia
Czechia
Lithuania
Andorra
Slovakia
Romania
France
Israel
Hungary
Germany
Poland
Spain
Belgium
Austria
Malta
Portugal
Switzerland
Italy
Netherlands
Luxembourg
Ireland
Slovenia
United Kingdom
Uzbekistan
Finland
Norway
Sweden
Denmark
Iceland
The former Yugoslav Republicof Macedonia
58.3
55.5
52.7
52.1
52.0
51.2
51.0
50.5
47.9
47.7
47.4
46.1
44.6
44.4
43.1
42.5
41.1
40.2
39.9
39.3
38.3
38.0
37.8
37.7
37.1
35.6
35.4
34.8
33.1
33.1
31.4
31.4
30.9
30.2
30.0
28.9
27.8
27.3
35.3
44.0
30.2
30.1
37.7
34.3
30.5
29.0
30.1
28.2
27.4
28.4
EUR
Tuvalu
Solomon Islands
Micronesia (Federated States of)
Marshall Islands
Kiribati
Lao People's Democratic Republic
Papua New Guinea
China
Mongolia
Viet Nam
Tonga
Malaysia
Republic of Korea
Philippines
Samoa
Nauru
Fiji
Vanuatu
Japan
Cambodia
Brunei Darussalam
Cook Islands
Singapore
Palau
Niue
New Zealand
Australia
58.9
51.2
48.8
48.4
46.5
45.9
44.4
42.4
40.9
40.8
38.1
36.9
34.8
34.5
33.7
33.7
30.9
29.8
28.3
35.9
43.0
WPRSyrian Arab Republic
Sudan
Somalia
Libya
Jordan
Afghanistan
Tunisia
Egypt
Morocco
Lebanon
Iraq
Bahrain
United Arab Emirates
Kuwait
Pakistan
Yemen
Qatar
Saudi Arabia
Djibouti
Iran (Islamic Republic of)
Oman
65.8
50.1
47.1
40.7
39.3
37.6
37.4
37.0
36.7
29.2
EMR
42 WORLD HEALTH STATISTICS: 2018
Age-standardized prevalence of tobacco smoking among persons 15 years and older, by sex, 20161
Data type: Comparable estimates
TOBACCO USESDG Target 3.aStrengthen the implementation of the WHO Framework Convention on Tobacco Control in all countries, as appropriate
Indicator 3.a.1: Age-standardized prevalence of current tobacco use among persons aged 15 years and older
Indicator 3.a.1 Tobacco use
1 WHO global report on trends in prevalence of tobacco smoking, 2nd edition. Geneva: World Health Organization; 2018 (upcoming). Within each WHO region, countries are sorted in order of ascending prevalence among males.

Seychelles
Algeria
Cabo Verde
Mauritius
Rwanda
Swaziland
Eritrea
Lesotho
Gambia
Sao Tome and Principe
Ghana
Senegal
Botswana
Burundi
United Republic of Tanzania
South Africa
Zimbabwe
Malawi
Zambia
Mozambique
Burkina Faso
Sierra Leone
Niger
Kenya
Angola
Benin
Cameroon
Central African Republic
Chad
Comoros
Congo
Côte d'Ivoire
Democratic Republic of the Congo
Equatorial Guinea
Ethiopia
Gabon
Guinea
Guinea-Bissau
Liberia
Madagascar
Mali
Mauritania
Namibia
Nigeria
South Sudan
Togo
Uganda
99
96
95
92
90
89
85
82
79
76
75
75
74
72
71
70
63
61
58
51
50
50
37
32
26
AFRCuba
Saint Vincent and the Grenadines
Mexico
Saint Kitts and Nevis
Belize
Guyana
Dominica
Panama
Paraguay
Uruguay
Argentina
Saint Lucia
Antigua and Barbuda
Barbados
Chile
Colombia
Costa Rica
El Salvador
Canada
Grenada
Jamaica
Ecuador
Bahamas
Brazil
Peru
Guatemala
Trinidad and Tobago
Venezuela (Bolivarian Republic of)
Suriname
Haiti
Bolivia (Plurinational State of)
Dominican Republic
Honduras
Nicaragua
United States of America
99
99
98
97
96
94
92
92
92
92
88
88
87
87
87
87
87
87
86
85
85
76
74
72
66
65
65
53
44
26
AMR
Maldives
Sri Lanka
Democratic People's Republic ofKorea
Thailand
Bangladesh
Bhutan
Myanmar
India
Indonesia
Nepal
Timor-Leste 22
25
56
76
86
90
93
95
98
99
99
SEAR
Hungary
Kazakhstan
Turkmenistan
Uzbekistan
Albania
Azerbaijan
Belarus
Kyrgyzstan
Armenia
Israel
Russian Federation
Slovakia
Tajikistan
Croatia
Iceland
Portugal
Republic of Moldova
Spain
Sweden
Poland
Czechia
Germany
Slovenia
The former Yugoslav Republic of ..
Estonia
Lithuania
Netherlands
Norway
Andorra
Serbia
Austria
Latvia
Switzerland
United Kingdom
Bulgaria
Cyprus
Luxembourg
Malta
Montenegro
Belgium
Denmark
Finland
Georgia
Turkey
Greece
Italy
France
Bosnia and Herzegovina
Romania
San Marino
Ukraine
Ireland
Monaco
99
99
99
99
98
98
98
98
97
97
97
97
97
96
95
95
95
95
95
94
93
93
93
93
92
92
91
91
90
90
89
89
89
89
88
88
86
86
86
85
85
85
85
85
83
83
79
78
76
36
31
EURBahrain
Jordan
Morocco
Oman
United Arab Emirates
Iran (Islamic Republic of)
Tunisia
Egypt
Kuwait
Libya
Saudi Arabia
Qatar
Djibouti
Lebanon
Sudan
Iraq
Pakistan
Syrian Arab Republic
Yemen
Afghanistan
Somalia
99
99
99
99
99
98
97
96
96
96
96
92
82
75
69
64
53
52
49
39
EMR
China
Malaysia
Niue
Brunei Darussalam
Republic of Korea
Nauru
Palau
Viet Nam
Australia
Fiji
Japan
Tuvalu
Cook Islands
Mongolia
New Zealand
Singapore
Tonga
Kiribati
Micronesia (Federated States of)
Philippines
Cambodia
Marshall Islands
Samoa
Lao People's Democratic Republic
Papua New Guinea
Solomon Islands
Vanuatu
99
99
99
97
97
96
95
95
94
94
93
92
90
90
89
88
85
79
74
66
58
49
44
WPRThe former Yugoslav Republic of Macedonia
43MONITORING HEALTH FOR THE SDGs
VACCINE COVERAGESDG Target 3.bSupport the research and development of vaccines and medicines for the communicable and noncommunicable diseases that primarily affect developing countries, provide access to affordable essential medicines and vaccines, in accordance with the Doha Declaration on the TRIPS Agreement and Public Health, which affirms the right of developing countries to use to the full the provisions in the Agreement on Trade-Related Aspects of Intellectual Property Rights regarding flexibilities to protect public health, and, in particular, provide access to medicines for all
Indicator 3.b.1: Proportion of the target population covered by all vaccines included in their national programme
Measles-containing vaccine second-dose (MCV2) immunization coverage by the nationally recommended age (%), 20161
Data type: Comparable estimates
Indicator 3.b.1 Vaccine coverage
1 The SDG indicator includes immunization coverage with diphtheria-tetanus-pertussis-containing vaccine third-dose (DTP3), MCV2, pneumococcal conjugate vaccine third-dose (PcV3) and human papillomavirus (HPV) vaccine. See Annex B for more data. Source: WHO/UNICEF estimates of national immunization coverage [online database]. July 2017 revision (http://www.who.int/immunization/monitoring_surveillance/routine/coverage/en/index4.html, accessed 30 March 2018).

Seychelles
Sao Tome and Principe
Liberia
Swaziland
Gambia
Malawi
Sierra Leone
Guinea-Bissau
Zambia
Central African Republic
Burundi
Burkina Faso
Guinea
Comoros
Mozambique
Mali
Rwanda
Lesotho
Uganda
Senegal
Democratic Republic of the Congo
South Sudan
Ghana
Zimbabwe
Togo
United Republic of Tanzania
Benin
Côte d'Ivoire
Chad
Madagascar
Namibia
Ethiopia
Niger
Kenya
Nigeria
Mauritania
Eritrea
Botswana
Gabon
Cameroon
Congo
Angola
South Africa
Equatorial Guinea
Cabo Verde
Mauritius
Algeria
34.17
24.88
14.27
13.21
12.72
12.64
11.30
11.23
10.75
10.62
9.57
9.15
8.26
8.21
8.10
7.55
6.65
6.61
6.31
5.36
5.27
5.02
4.94
4.94
4.82
4.66
4.39
4.23
4.16
4.08
3.97
3.53
3.48
3.36
2.87
2.53
2.44
2.36
2.25
2.22
1.65
1.57
1.55
1.29
0.92
0.28
0.02
AFRHaiti
Belize
Saint Lucia
Nicaragua
Honduras
Guyana
Bolivia (Plurinational State of)
Guatemala
Suriname
Paraguay
El Salvador
Ecuador
Peru
Panama
Saint Vincent and the Grenadines
Dominican Republic
Cuba
Colombia
Jamaica
Brazil
Argentina
Costa Rica
Mexico
Venezuela (Bolivarian Republic of)
Dominica
Grenada
8.73
8.41
6.33
3.58
2.92
2.85
1.69
1.28
1.09
0.89
0.77
0.50
0.48
0.46
0.36
0.24
0.11
0.07
0.04
0.03
0.01
0.01
0.01
0.00
AMR
Timor-Leste
Myanmar
Bhutan
Nepal
Maldives
Bangladesh
Sri Lanka
Democratic People's Republic ofKorea
Indonesia
Thailand
India
12.12
0.28
0.37
0.51
0.90
0.98
1.25
1.29
2.47
2.57
2.78
SEAR
Bosnia and Herzegovina
Armenia
Republic of Moldova
Tajikistan
Kyrgyzstan
Georgia
Montenegro
Uzbekistan
Turkmenistan
Ukraine
Albania
Belarus
The former Yugoslav Republic of ..
Azerbaijan
Kazakhstan
Turkey
Serbia
Andorra
Austria
Belgium
Bulgaria
Croatia
Cyprus
Czechia
Denmark
Estonia
Finland
France
Germany
Greece
Hungary
Iceland
Ireland
Israel
Italy
Latvia
Lithuania
Luxembourg
Malta
Monaco
Netherlands
Norway
Poland
Portugal
Romania
Russian Federation
San Marino
Slovakia
Slovenia
Spain
Sweden
Switzerland
United Kingdom
9.93
5.03
3.48
3.07
2.91
2.23
1.84
1.79
1.77
1.46
0.63
0.60
0.56
0.39
0.36
0.36
0.10
EURDjibouti
Lebanon
Afghanistan
Somalia
Sudan
Jordan
Yemen
Morocco
Pakistan
Syrian Arab Republic
Egypt
Tunisia
Iraq
Libya
Iran (Islamic Republic of)
Bahrain
Kuwait
Oman
Qatar
Saudi Arabia
United Arab Emirates
11.73
5.84
5.82
3.52
3.34
2.78
2.44
1.92
1.63
0.71
0.20
0.19
0.13
0.07
0.03
EMR
Tuvalu
Tonga
Nauru
Solomon Islands
Samoa
Kiribati
Vanuatu
Fiji
Mongolia
Niue
Cook Islands
Micronesia (Federated States of)
Lao People's Democratic Republic
Cambodia
Papua New Guinea
Palau
Marshall Islands
Viet Nam
Philippines
China
Malaysia
Australia
Brunei Darussalam
Japan
New Zealand
Republic of Korea
Singapore
60.03
45.41
43.29
26.32
22.31
9.95
7.20
7.00
6.47
6.01
5.02
3.65
3.33
3.01
2.92
2.72
2.67
0.84
0.73
0.11
0.05
WPR
Income High Upper middle Lower middle Low Not applicable
The former Yugoslav Republic of Macedonia
Country income classification
44 WORLD HEALTH STATISTICS: 2018
DEVELOPMENT ASSISTANCE FOR HEALTHSDG Target 3.bSupport the research and development of vaccines and medicines for the communicable and noncommunicable diseases that primarily affect developing countries, provide access to affordable essential medicines and vaccines, in accordance with the Doha Declaration on the TRIPS Agreement and Public Health, which affirms the right of developing countries to use to the full the provisions in the Agreement on Trade-Related Aspects of Intellectual Property Rights regarding flexibilities to protect public health, and, in particular, provide access to medicines for all
Indicator 3.b.2: Total net official development assistance to the medical research and basic health sectors
Total net official development assistance to medical research and basic health sectors per capita (US$), by recipient country, 20161
Data type: Primary data
Indicator 3.b.2 Development assistance for health
1 Organisation for Economic Co-operation and Development. OECD.Stat [online database]. Paris: Organisation for Economic Co-operation and Development (http://stats.oecd.org/, accessed 19 January 2018). Income classification is based on the July 2017 World Bank list of economies (https://datahelpdesk.worldbank.org/knowledgebase/articles/906519-world-bank-country-and-lending-groups, accessed 19 January 2018).
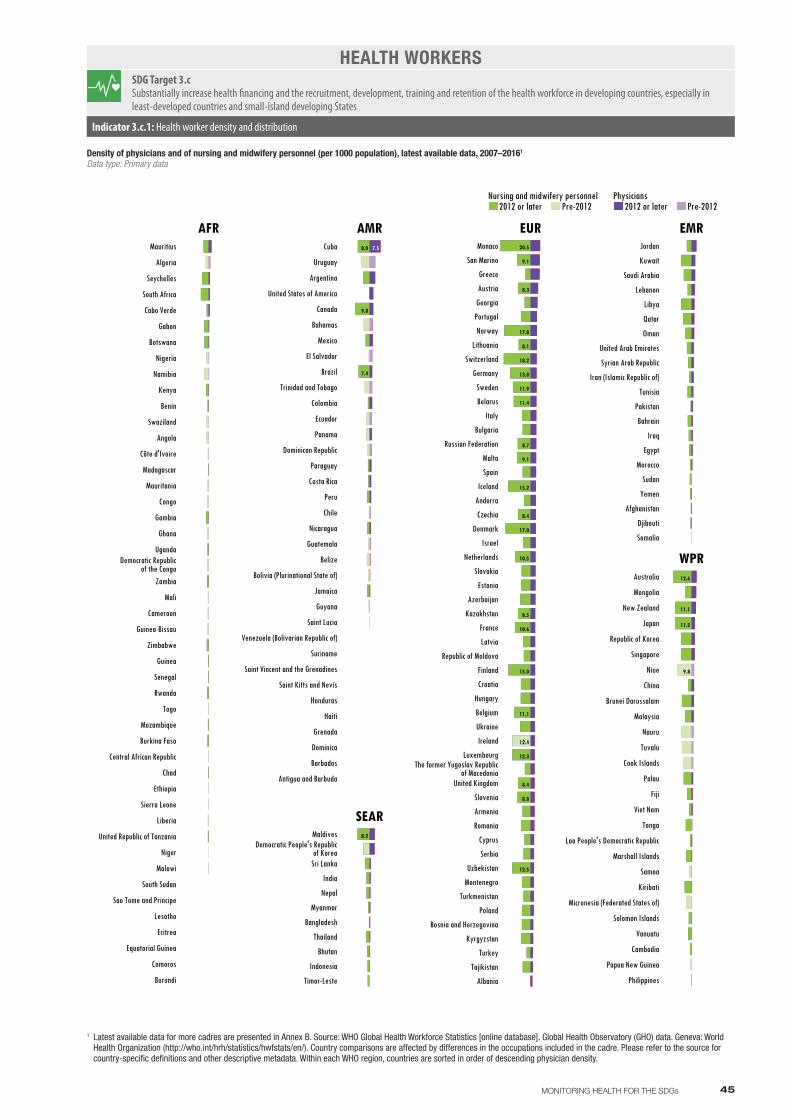
Nursing and midwifery personnel Physicians2012 or later Pre-2012 2012 or later Pre-2012
Burundi
Comoros
Equatorial Guinea
Eritrea
Lesotho
Sao Tome and Principe
South Sudan
Malawi
Niger
United Republic of Tanzania
Liberia
Sierra Leone
Ethiopia
Chad
Central African Republic
Burkina Faso
Mozambique
Togo
Rwanda
Senegal
Guinea
Zimbabwe
Guinea-Bissau
Cameroon
Mali
Zambia
Uganda
Ghana
Gambia
Congo
Mauritania
Madagascar
Côte d'Ivoire
Angola
Swaziland
Benin
Kenya
Namibia
Nigeria
Botswana
Gabon
Cabo Verde
South Africa
Seychelles
Algeria
Mauritius
Democratic Republicof the Congo
AFR
Antigua and Barbuda
Barbados
Dominica
Grenada
Haiti
Honduras
Saint Kitts and Nevis
Saint Vincent and the Grenadines
Suriname
Venezuela (Bolivarian Republic of)
Saint Lucia
Guyana
Jamaica
Bolivia (Plurinational State of)
Belize
Guatemala
Nicaragua
Chile
Peru
Costa Rica
Paraguay
Dominican Republic
Panama
Ecuador
Colombia
Trinidad and Tobago
Brazil
El Salvador
Mexico
Bahamas
Canada
United States of America
Argentina
Uruguay
Cuba 7.5
7.4
9.8
8.0
AMR
Timor-Leste
Indonesia
Bhutan
Thailand
Bangladesh
Myanmar
Nepal
India
Sri Lanka
MaldivesDemocratic People's Republic
of Korea
8.2
SEAR
Albania
Tajikistan
Turkey
Kyrgyzstan
Bosnia and Herzegovina
Poland
Turkmenistan
Montenegro
Uzbekistan
Serbia
Cyprus
Romania
Armenia
Slovenia
United Kingdom
Luxembourg
Ireland
Ukraine
Belgium
Hungary
Croatia
Finland
Republic of Moldova
Latvia
France
Kazakhstan
Azerbaijan
Estonia
Slovakia
Netherlands
Israel
Denmark
Czechia
Andorra
Iceland
Spain
Malta
Russian Federation
Bulgaria
Italy
Belarus
Sweden
Germany
Switzerland
Lithuania
Norway
Portugal
Georgia
Austria
Greece
San Marino
Monaco
The former Yugoslav Republicof Macedonia
12.5
8.8
8.4
12.3
12.4
11.1
15.0
10.6
8.5
10.5
17.0
8.4
15.2
9.1
8.7
11.4
11.9
13.8
18.2
8.1
17.8
8.3
9.1
20.5
EUR
Philippines
Papua New Guinea
Cambodia
Vanuatu
Solomon Islands
Micronesia (Federated States of)
Kiribati
Samoa
Marshall Islands
Lao People's Democratic Republic
Tonga
Viet Nam
Fiji
Palau
Cook Islands
Tuvalu
Nauru
Malaysia
Brunei Darussalam
China
Niue
Singapore
Republic of Korea
Japan
New Zealand
Mongolia
Australia
9.8
11.2
11.1
12.6
WPRSomalia
Djibouti
Afghanistan
Yemen
Sudan
Morocco
Egypt
Iraq
Bahrain
Pakistan
Tunisia
Iran (Islamic Republic of)
Syrian Arab Republic
United Arab Emirates
Oman
Qatar
Libya
Lebanon
Saudi Arabia
Kuwait
Jordan
EMR
45MONITORING HEALTH FOR THE SDGs
Density of physicians and of nursing and midwifery personnel (per 1000 population), latest available data, 2007–20161
Data type: Primary data
HEALTH WORKERSSDG Target 3.cSubstantially increase health financing and the recruitment, development, training and retention of the health workforce in developing countries, especially in least-developed countries and small-island developing States
Indicator 3.c.1: Health worker density and distribution
Indicator 3.c.1 Health workers
1 Latest available data for more cadres are presented in Annex B. Source: WHO Global Health Workforce Statistics [online database]. Global Health Observatory (GHO) data. Geneva: World Health Organization (http://who.int/hrh/statistics/hwfstats/en/). Country comparisons are affected by differences in the occupations included in the cadre. Please refer to the source for country-specific definitions and other descriptive metadata. Within each WHO region, countries are sorted in order of descending physician density.
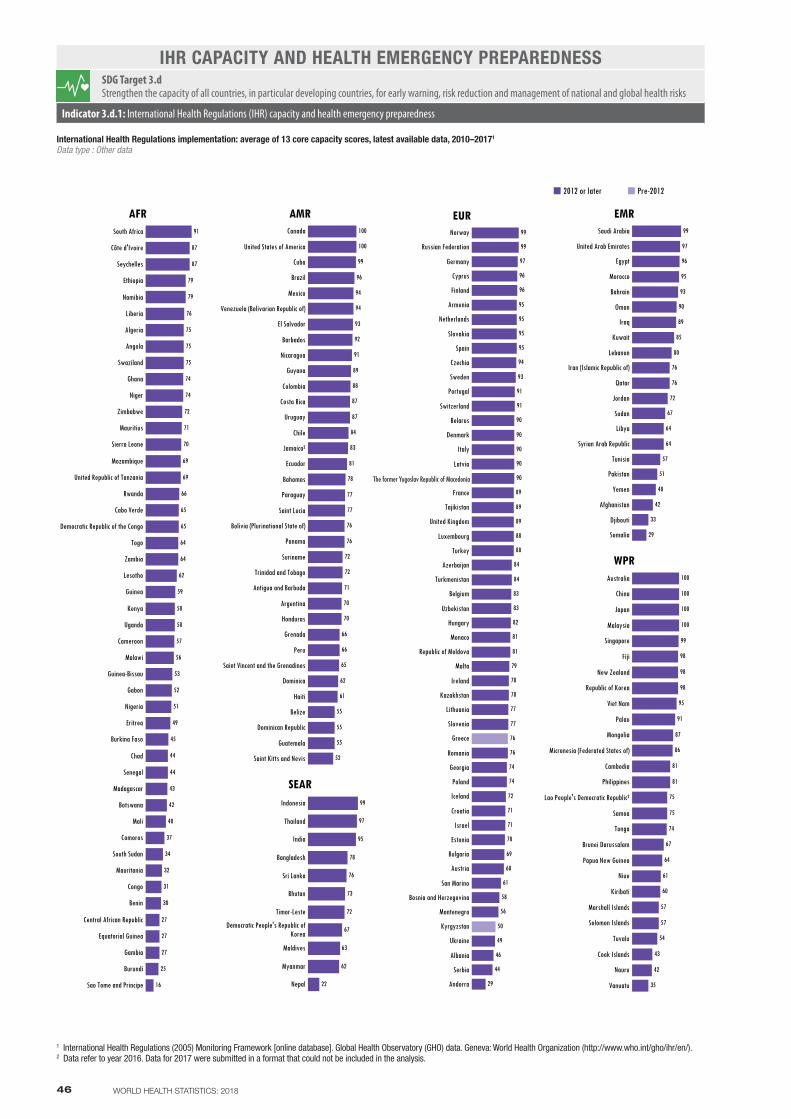
46 WORLD HEALTH STATISTICS: 2018
International Health Regulations implementation: average of 13 core capacity scores, latest available data, 2010–20171
Data type : Other data
IHR CAPACITY AND HEALTH EMERGENCY PREPAREDNESSSDG Target 3.dStrengthen the capacity of all countries, in particular developing countries, for early warning, risk reduction and management of national and global health risks
Indicator 3.d.1: International Health Regulations (IHR) capacity and health emergency preparedness
Indicator 3.d.1 IHR capacity and health emergency preparedness
South Africa
Côte d'Ivoire
Seychelles
Ethiopia
Namibia
Liberia
Algeria
Angola
Swaziland
Ghana
Niger
Zimbabwe
Mauritius
Sierra Leone
Mozambique
United Republic of Tanzania
Rwanda
Cabo Verde
Democratic Republic of the Congo
Togo
Zambia
Lesotho
Guinea
Kenya
Uganda
Cameroon
Malawi
Guinea-Bissau
Gabon
Nigeria
Eritrea
Burkina Faso
Chad
Senegal
Madagascar
Botswana
Mali
Comoros
South Sudan
Mauritania
Congo
Benin
Central African Republic
Equatorial Guinea
Gambia
Burundi
Sao Tome and Principe
91
87
87
79
79
76
75
75
75
74
74
72
71
70
69
69
66
65
65
64
64
62
59
58
58
57
56
53
52
51
49
45
44
44
43
42
40
37
34
32
31
30
27
27
27
25
16
AFRCanada
United States of America
Cuba
Brazil
Mexico
Venezuela (Bolivarian Republic of)
El Salvador
Barbados
Nicaragua
Guyana
Colombia
Costa Rica
Uruguay
Chile
Jamaica²
Ecuador
Bahamas
Paraguay
Saint Lucia
Bolivia (Plurinational State of)
Panama
Suriname
Trinidad and Tobago
Antigua and Barbuda
Argentina
Honduras
Grenada
Peru
Saint Vincent and the Grenadines
Dominica
Haiti
Belize
Dominican Republic
Guatemala
Saint Kitts and Nevis
100
100
99
96
94
94
93
92
91
89
88
87
87
84
83
81
78
77
77
76
76
72
72
71
70
70
66
66
65
62
61
55
55
55
52
AMR
Indonesia
Thailand
India
Bangladesh
Sri Lanka
Bhutan
Timor-Leste
Democratic People's Republic ofKorea
Maldives
Myanmar
Nepal 22
62
63
67
72
73
76
78
95
97
99
SEAR
Norway
Russian Federation
Germany
Cyprus
Finland
Armenia
Netherlands
Slovakia
Spain
Czechia
Sweden
Portugal
Switzerland
Belarus
Denmark
Italy
Latvia
The former Yugoslav Republic of ..
France
Tajikistan
United Kingdom
Luxembourg
Turkey
Azerbaijan
Turkmenistan
Belgium
Uzbekistan
Hungary
Monaco
Republic of Moldova
Malta
Ireland
Kazakhstan
Lithuania
Slovenia
Greece
Romania
Georgia
Poland
Iceland
Croatia
Israel
Estonia
Bulgaria
Austria
San Marino
Bosnia and Herzegovina
Montenegro
Kyrgyzstan
Ukraine
Albania
Serbia
Andorra
76
50
99
99
97
96
96
95
95
95
95
94
93
91
91
90
90
90
90
90
89
89
89
88
88
84
84
83
83
82
81
81
79
78
78
77
77
76
74
74
72
71
71
70
69
68
61
58
56
49
46
44
29
EURSaudi Arabia
United Arab Emirates
Egypt
Morocco
Bahrain
Oman
Iraq
Kuwait
Lebanon
Iran (Islamic Republic of)
Qatar
Jordan
Sudan
Libya
Syrian Arab Republic
Tunisia
Pakistan
Yemen
Afghanistan
Djibouti
Somalia
99
97
96
95
93
90
89
85
80
76
76
72
67
64
64
57
51
48
42
33
29
EMR
Australia
China
Japan
Malaysia
Singapore
Fiji
New Zealand
Republic of Korea
Viet Nam
Palau
Mongolia
Micronesia (Federated States of)
Cambodia
Philippines
Lao People's Democratic Republic²
Samoa
Tonga
Brunei Darussalam
Papua New Guinea
Niue
Kiribati
Marshall Islands
Solomon Islands
Tuvalu
Cook Islands
Nauru
Vanuatu
100
100
100
100
99
98
98
98
95
91
87
86
81
81
75
75
74
67
64
61
60
57
57
54
43
42
35
WPR
2012 or later Pre-2012
The former Yugoslav Republic of Macedonia
1 International Health Regulations (2005) Monitoring Framework [online database]. Global Health Observatory (GHO) data. Geneva: World Health Organization (http://www.who.int/gho/ihr/en/).2 Data refer to year 2016. Data for 2017 were submitted in a format that could not be included in the analysis.

Madagascar
Swaziland
South Africa
Namibia
Burundi
Cabo Verde
Malawi
Algeria
Sao Tome and Principe
Gambia
Seychelles
Mauritius
Guinea-Bissau
Lesotho
Botswana
Zimbabwe
Sierra Leone
United Republic of Tanzania
Burkina Faso
Ghana
Gabon
Zambia
Chad
Kenya
Rwanda
Ethiopia
Togo
Uganda
Mauritania
Nigeria
Côte d'Ivoire
Democratic Republic of the Congo
Niger
Mali
Senegal
Central African Republic
Comoros
Angola
Benin
Cameroon
Congo
Guinea
Liberia
Eritrea
South Sudan
Equatorial Guinea
Mozambique
15.6
14.9
14.1
12.9
11.8
10.8
10.8
10.7
10.7
10.6
10.0
9.9
9.5
9.3
8.8
8.1
7.9
7.4
7.2
7.1
7.0
6.8
6.3
6.3
6.2
6.0
5.7
5.6
5.5
5.3
5.0
5.0
4.6
4.5
4.2
4.1
3.8
3.7
3.4
3.1
3.1
2.7
2.7
1.8
1.6
1.3
1.2
AFRUnited States of America
Uruguay
Chile
Canada
El Salvador
Costa Rica
Nicaragua
Antigua and Barbuda
Guatemala
Peru
Bahamas
Jamaica
Argentina
Colombia
Honduras
Mexico
Panama
Belize
Ecuador
Paraguay
Dominica
Suriname
Saint Vincent and the Grenadines
Bolivia (Plurinational State of)
Dominican Republic
Saint Lucia
Trinidad and Tobago
Guyana
Brazil
Barbados
Grenada
Saint Kitts and Nevis
Haiti
Venezuela (Bolivarian Republic of)
Cuba
22.6
20.0
19.6
19.1
19.1
18.8
17.4
14.9
14.9
14.4
14.2
12.6
12.3
12.2
11.3
11.3
11.3
11.1
11.0
10.8
10.6
10.5
10.0
9.8
9.5
8.5
8.5
7.8
7.7
7.4
7.4
6.5
3.3
3.1
AMR
Maldives
Thailand
Bhutan
Sri Lanka
Indonesia
Nepal
Myanmar
Timor-Leste
India
Bangladesh
Democratic People's Republic ofKorea
16.6
22.8
2.8
3.4
4.2
4.9
5.5
7.4
7.9
9.1
SEAR
Switzerland
Germany
Netherlands
Andorra
United Kingdom
Ireland
Sweden
Norway
Iceland
Belgium
Denmark
France
Austria
Bosnia and Herzegovina
Spain
Czechia
San Marino
Malta
Italy
Finland
Slovenia
Portugal
Serbia
Estonia
Lithuania
Republic of Moldova
Luxembourg
The former Yugoslav Republic of ..
Slovakia
Croatia
Kazakhstan
Romania
Poland
Georgia
Bulgaria
Turkey
Kyrgyzstan
Hungary
Russian Federation
Albania
Uzbekistan
Greece
Latvia
Montenegro
Turkmenistan
Belarus
Ukraine
Monaco
Cyprus
Armenia
Tajikistan
Azerbaijan
Israel
25.2
21.4
19.0
18.5
18.5
18.4
18.4
17.5
16.4
16.0
15.8
15.3
15.1
14.9
14.9
14.3
14.3
14.2
13.4
12.8
12.7
12.3
12.3
12.2
12.2
12.2
12.1
12.1
12.0
11.7
10.9
10.8
10.7
10.5
10.3
10.1
9.9
9.7
9.6
9.5
9.3
9.1
8.9
8.8
8.7
8.5
8.3
8.1
7.1
6.1
6.1
4.1
EURIran (Islamic Republic of)
Sudan
Lebanon
Tunisia
Jordan
Saudi Arabia
Bahrain
United Arab Emirates
Morocco
Oman
Qatar
Kuwait
Egypt
Djibouti
Pakistan
Yemen
Afghanistan
Iraq
Libya
Somalia
Syrian Arab Republic
22.6
18.1
14.3
13.6
12.4
10.1
9.5
8.0
7.7
6.7
6.3
6.2
4.2
4.1
3.7
2.2
2.0
1.7
EMR
Marshall Islands
Palau
Republic of Korea
Tuvalu
Singapore
Vanuatu
Samoa
Solomon Islands
China
Papua New Guinea
Tonga
Malaysia
Viet Nam
Philippines
Fiji
Brunei Darussalam
Kiribati
Cambodia
Micronesia (Federated States of)
Mongolia
Nauru
Cook Islands
Lao People's Democratic Republic
Niue
Australia
Japan
New Zealand
21.2
13.1
12.9
12.1
12.0
11.8
11.5
10.6
10.1
8.7
8.4
8.3
7.9
7.4
7.2
6.4
6.3
6.1
6.1
6.0
5.2
5.1
3.8
2.2
WPR
The former Yugoslav Republic of Macedonia
47MONITORING HEALTH FOR THE SDGs
Domestic general government health expenditure (GGHE-D) as a percentage of general government expenditure (GGE) (%), 20151
Data type: Comparable estimate
GOVERNMENT SPENDING ON ESSENTIAL SERVICES, INCLUDING HEALTHSDG Target 1.aEnsure significant mobilization of resources from a variety of sources, including through enhanced development cooperation, in order to provide adequate and predictable means for developing countries, in particular least-developed countries, to implement programmes and policies to end poverty in all its dimensions
Indicator 1.a.2: Proportion of total government spending on essential services (education, health and social protection)
Indicator 1.a.2 Government spending on essential services, including health
1 This indicator is presented here as it could constitute the health-related portion of the SDG indicator. Source: Global Health Expenditure Database [online database]. Geneva: World Health Organization (http://apps.who.int/nha/database/Select/Indicators/en, accessed 7 April 2018).
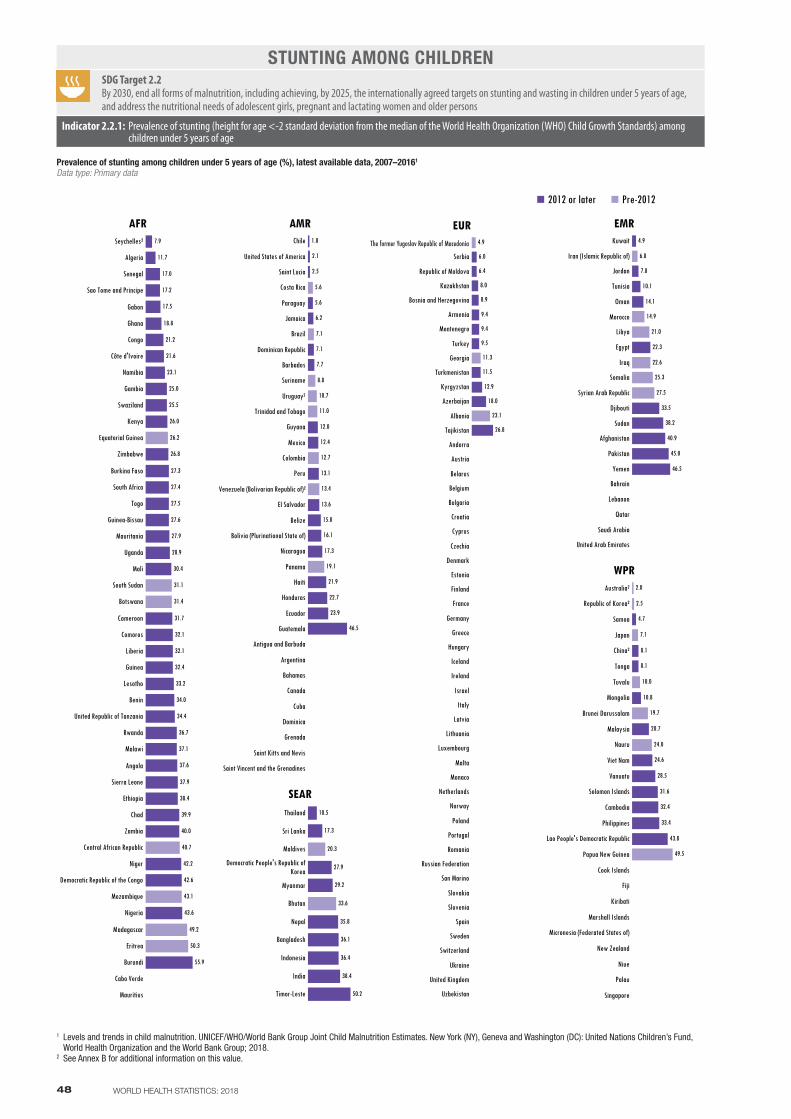
Seychelles²
Algeria
Senegal
Sao Tome and Principe
Gabon
Ghana
Congo
Côte d'Ivoire
Namibia
Gambia
Swaziland
Kenya
Equatorial Guinea
Zimbabwe
Burkina Faso
South Africa
Togo
Guinea-Bissau
Mauritania
Uganda
Mali
South Sudan
Botswana
Cameroon
Comoros
Liberia
Guinea
Lesotho
Benin
United Republic of Tanzania
Rwanda
Malawi
Angola
Sierra Leone
Ethiopia
Chad
Zambia
Central African Republic
Niger
Democratic Republic of the Congo
Mozambique
Nigeria
Madagascar
Eritrea
Burundi
Cabo Verde
Mauritius
50.3
49.2
43.1
40.7
31.4
31.1
26.2
55.9
43.6
42.6
42.2
40.0
39.9
38.4
37.9
37.6
37.1
36.7
34.4
34.0
33.2
32.4
32.1
32.1
31.7
30.4
28.9
27.9
27.6
27.5
27.4
27.3
26.8
26.0
25.5
25.0
23.1
21.6
21.2
18.8
17.5
17.2
17.0
11.7
7.9
AFRChile
United States of America
Saint Lucia
Costa Rica
Paraguay
Jamaica
Brazil
Dominican Republic
Barbados
Suriname
Uruguay²
Trinidad and Tobago
Guyana
Mexico
Colombia
Peru
Venezuela (Bolivarian Republic of)²
El Salvador
Belize
Bolivia (Plurinational State of)
Nicaragua
Panama
Haiti
Honduras
Ecuador
Guatemala
Antigua and Barbuda
Argentina
Bahamas
Canada
Cuba
Dominica
Grenada
Saint Kitts and Nevis
Saint Vincent and the Grenadines
19.1
13.4
12.7
11.0
10.7
8.8
7.1
5.6
46.5
23.9
22.7
21.9
17.3
16.1
15.0
13.6
13.1
12.4
12.0
7.7
7.1
6.2
5.6
2.5
2.1
1.8
AMR
Thailand
Sri Lanka
Maldives
Democratic People's Republic ofKorea
Myanmar
Bhutan
Nepal
Bangladesh
Indonesia
India
Timor-Leste
10.5
17.3
27.9
29.2
35.8
36.1
36.4
38.4
50.2
20.3
33.6
SEAR
The former Yugoslav Republic of ..
Serbia
Republic of Moldova
Kazakhstan
Bosnia and Herzegovina
Armenia
Montenegro
Turkey
Georgia
Turkmenistan
Kyrgyzstan
Azerbaijan
Albania
Tajikistan
Andorra
Austria
Belarus
Belgium
Bulgaria
Croatia
Cyprus
Czechia
Denmark
Estonia
Finland
France
Germany
Greece
Hungary
Iceland
Ireland
Israel
Italy
Latvia
Lithuania
Luxembourg
Malta
Monaco
Netherlands
Norway
Poland
Portugal
Romania
Russian Federation
San Marino
Slovakia
Slovenia
Spain
Sweden
Switzerland
Ukraine
United Kingdom
Uzbekistan
23.1
11.3
4.9
26.8
18.0
12.9
11.5
9.5
9.4
9.4
8.9
8.0
6.4
6.0
EURKuwait
Iran (Islamic Republic of)
Jordan
Tunisia
Oman
Morocco
Libya
Egypt
Iraq
Somalia
Syrian Arab Republic
Djibouti
Sudan
Afghanistan
Pakistan
Yemen
Bahrain
Lebanon
Qatar
Saudi Arabia
United Arab Emirates
27.5
25.3
22.6
21.0
14.9
6.8
46.5
45.0
40.9
38.2
33.5
22.3
14.1
10.1
7.8
4.9
EMR
Australia²
Republic of Korea²
Samoa
Japan
China²
Tonga
Tuvalu
Mongolia
Brunei Darussalam
Malaysia
Nauru
Viet Nam
Vanuatu
Solomon Islands
Cambodia
Philippines
Lao People's Democratic Republic
Papua New Guinea
Cook Islands
Fiji
Kiribati
Marshall Islands
Micronesia (Federated States of)
New Zealand
Niue
Palau
Singapore
49.5
24.0
19.7
10.0
7.1
2.5
2.0
43.8
33.4
32.4
31.6
28.5
24.6
20.7
10.8
8.1
8.1
4.7
WPR
2012 or later Pre-2012
The former Yugoslav Republic of Macedonia
48 WORLD HEALTH STATISTICS: 2018
Prevalence of stunting among children under 5 years of age (%), latest available data, 2007–20161
Data type: Primary data
STUNTING AMONG CHILDRENSDG Target 2.2By 2030, end all forms of malnutrition, including achieving, by 2025, the internationally agreed targets on stunting and wasting in children under 5 years of age, and address the nutritional needs of adolescent girls, pregnant and lactating women and older persons
Indicator 2.2.1: Prevalence of stunting (height for age <-2 standard deviation from the median of the World Health Organization (WHO) Child Growth Standards) among children under 5 years of age
Indicator 2.2.1 Stunting among children
1 Levels and trends in child malnutrition. UNICEF/WHO/World Bank Group Joint Child Malnutrition Estimates. New York (NY), Geneva and Washington (DC): United Nations Children’s Fund, World Health Organization and the World Bank Group; 2018.
2 See Annex B for additional information on this value.
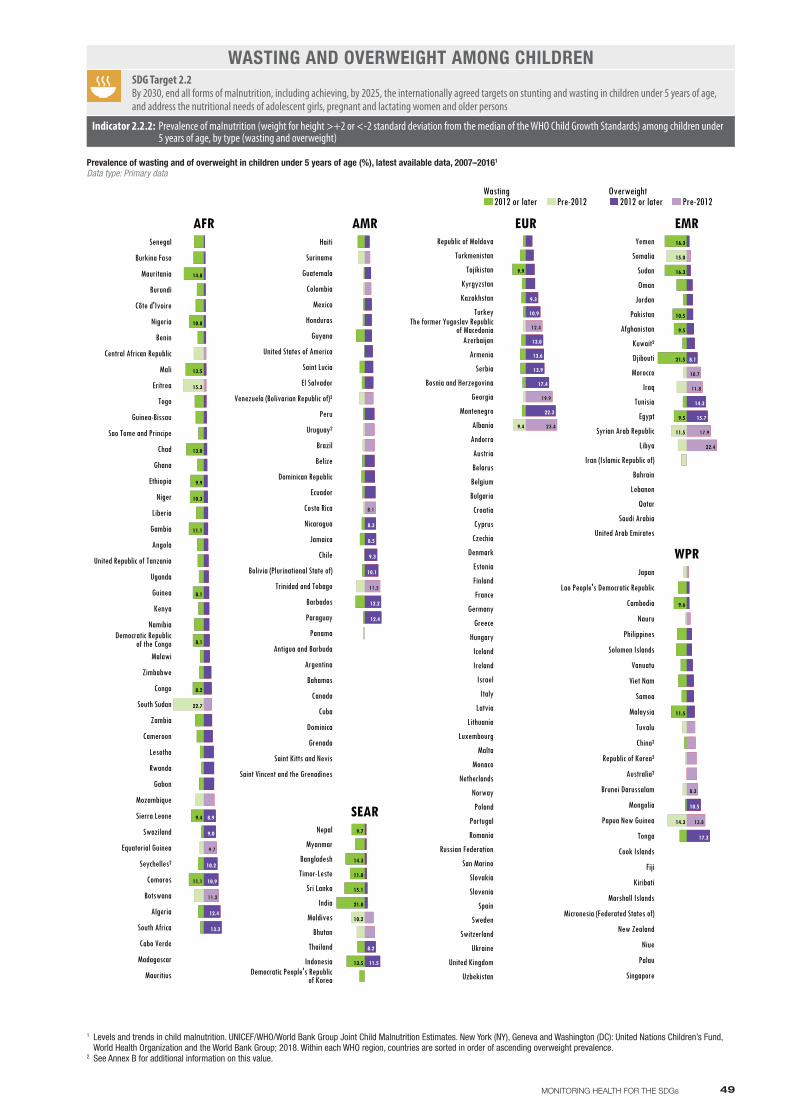
Wasting Overweight2012 or later Pre-2012 2012 or later Pre-2012
Mauritius
Madagascar
Cabo Verde
South Africa
Algeria
Botswana
Comoros
Seychelles²
Equatorial Guinea
Swaziland
Sierra Leone
Mozambique
Gabon
Rwanda
Lesotho
Cameroon
Zambia
South Sudan
Congo
Zimbabwe
Malawi
Namibia
Kenya
Guinea
Uganda
United Republic of Tanzania
Angola
Gambia
Liberia
Niger
Ethiopia
Ghana
Chad
Sao Tome and Principe
Guinea-Bissau
Togo
Eritrea
Mali
Central African Republic
Benin
Nigeria
Côte d'Ivoire
Burundi
Mauritania
Burkina Faso
Senegal
Democratic Republicof the Congo
13.3
12.4
11.2
10.9
10.2
9.7
9.0
8.9
11.2
9.7
11.1
9.4
22.7
8.2
8.1
8.1
11.1
10.3
9.9
13.0
15.3
13.5
10.8
14.8
AFR
Saint Vincent and the Grenadines
Saint Kitts and Nevis
Grenada
Dominica
Cuba
Canada
Bahamas
Argentina
Antigua and Barbuda
Panama
Paraguay
Barbados
Trinidad and Tobago
Bolivia (Plurinational State of)
Chile
Jamaica
Nicaragua
Costa Rica
Ecuador
Dominican Republic
Belize
Brazil
Uruguay²
Peru
Venezuela (Bolivarian Republic of)²
El Salvador
Saint Lucia
United States of America
Guyana
Honduras
Mexico
Colombia
Guatemala
Suriname
Haiti
12.4
12.2
11.5
10.1
9.3
8.5
8.3
8.1
11.5
8.1
AMR
Indonesia
Thailand
Bhutan
Maldives
India
Sri Lanka
Timor-Leste
Bangladesh
Myanmar
Nepal
Democratic People's Republicof Korea
11.5
8.2
13.5
10.2
21.0
15.1
11.0
14.3
9.7
SEAR
Uzbekistan
United Kingdom
Ukraine
Switzerland
Sweden
Spain
Slovenia
Slovakia
San Marino
Russian Federation
Romania
Portugal
Poland
Norway
Netherlands
Monaco
Malta
Luxembourg
Lithuania
Latvia
Italy
Israel
Ireland
Iceland
Hungary
Greece
Germany
France
Finland
Estonia
Denmark
Czechia
Cyprus
Croatia
Bulgaria
Belgium
Belarus
Austria
Andorra
Albania
Montenegro
Georgia
Bosnia and Herzegovina
Serbia
Armenia
Azerbaijan
Turkey
Kazakhstan
Kyrgyzstan
Tajikistan
Turkmenistan
Republic of Moldova
The former Yugoslav Republicof Macedonia
23.4
22.3
19.9
17.4
13.9
13.6
13.0
12.4
10.9
9.3
23.4
19.9
12.4
9.4
9.9
EUR
Singapore
Palau
Niue
New Zealand
Micronesia (Federated States of)
Marshall Islands
Kiribati
Fiji
Cook Islands
Tonga
Papua New Guinea
Mongolia
Brunei Darussalam
Australia²
Republic of Korea²
China²
Tuvalu
Malaysia
Samoa
Viet Nam
Vanuatu
Solomon Islands
Philippines
Nauru
Cambodia
Lao People's Democratic Republic
Japan
17.3
13.8
10.5
8.3
13.8
8.3
14.3
11.5
9.6
WPRUnited Arab Emirates
Saudi Arabia
Qatar
Lebanon
Bahrain
Iran (Islamic Republic of)
Libya
Syrian Arab Republic
Egypt
Tunisia
Iraq
Morocco
Djibouti
Kuwait²
Afghanistan
Pakistan
Jordan
Oman
Sudan
Somalia
Yemen
22.4
17.9
15.7
14.3
11.8
10.7
8.1
22.4
17.9
11.8
10.7
11.5
9.5
21.5
9.5
10.5
16.3
15.0
16.3
EMR
49MONITORING HEALTH FOR THE SDGs
Prevalence of wasting and of overweight in children under 5 years of age (%), latest available data, 2007–20161
Data type: Primary data
WASTING AND OVERWEIGHT AMONG CHILDRENSDG Target 2.2By 2030, end all forms of malnutrition, including achieving, by 2025, the internationally agreed targets on stunting and wasting in children under 5 years of age, and address the nutritional needs of adolescent girls, pregnant and lactating women and older persons
Indicator 2.2.2: Prevalence of malnutrition (weight for height >+2 or <-2 standard deviation from the median of the WHO Child Growth Standards) among children under 5 years of age, by type (wasting and overweight)
Indicator 2.2.2 Wasting and overweight among children
1 Levels and trends in child malnutrition. UNICEF/WHO/World Bank Group Joint Child Malnutrition Estimates. New York (NY), Geneva and Washington (DC): United Nations Children’s Fund, World Health Organization and the World Bank Group; 2018. Within each WHO region, countries are sorted in order of ascending overweight prevalence.
2 See Annex B for additional information on this value.

Côte d'Ivoire
Congo
Ghana
Nigeria
Ethiopia
Uganda
Algeria
Angola
Benin
Botswana
Burkina Faso
Burundi
Cabo Verde
Cameroon
Central African Republic
Chad
Comoros
Democratic Republic of the Congo
Equatorial Guinea
Eritrea
Gabon
Gambia
Guinea
Guinea-Bissau
Kenya
Lesotho
Liberia
Madagascar
Malawi
Mali
Mauritania
Mauritius
Mozambique
Namibia
Niger
Rwanda
Sao Tome and Principe
Senegal
Seychelles
Sierra Leone
South Africa
South Sudan
Swaziland
Togo
United Republic of Tanzania
Zambia
Zimbabwe
46
37
27
19
11
6
AFRUnited States of America
Chile
Costa Rica
Ecuador
Colombia
Guatemala
Nicaragua
Peru
Mexico
Antigua and Barbuda
Argentina
Bahamas
Barbados
Belize
Bolivia (Plurinational State of)
Brazil
Canada
Cuba
Dominica
Dominican Republic
El Salvador
Grenada
Guyana
Haiti
Honduras
Jamaica
Panama
Paraguay
Saint Kitts and Nevis
Saint Lucia
Saint Vincent and the Grenadines
Suriname
Trinidad and Tobago
Uruguay
Venezuela (Bolivarian Republic of)
99
98
90
74
71
61
59
50
43
AMR
Bangladesh
Bhutan
Nepal
Democratic People's Republic ofKorea
India
Indonesia
Maldives
Myanmar
Sri Lanka
Thailand
Timor-Leste
27
34
56
SEAR
Cyprus
Malta
Monaco
Netherlands
San Marino
Austria
Germany
Greece
Ireland
Israel
Belgium
Czechia
Iceland
Luxembourg
Slovenia
Spain
Sweden
Bulgaria
Denmark
Finland
United Kingdom
Norway
Portugal
Switzerland
Belarus
Italy
Poland
France
Slovakia
Lithuania
Ukraine
Croatia
Montenegro
Bosnia and Herzegovina
Serbia
Turkmenistan
The former Yugoslav Republic of ..
Estonia
Hungary
Latvia
Romania
Russian Federation
Georgia
Azerbaijan
Republic of Moldova
Albania
Kyrgyzstan
Armenia
Tajikistan
Andorra
Kazakhstan
Turkey
Uzbekistan
100
100
100
100
100
99
99
99
99
99
98
98
98
98
98
98
98
97
97
97
96
95
95
95
94
94
94
93
93
92
92
90
90
89
88
86
83
82
82
82
82
76
73
72
70
69
66
61
47
EURKuwait
Bahrain
Jordan
Tunisia
Iran (Islamic Republic of)
Oman
Morocco
Lebanon
Pakistan
Afghanistan
Djibouti
Egypt
Iraq
Libya
Qatar
Saudi Arabia
Somalia
Sudan
Syrian Arab Republic
United Arab Emirates
Yemen
100
99
93
93
91
88
69
48
36
EMR
New Zealand
Singapore
Republic of Korea
Japan
Niue
Malaysia
Cambodia
Australia
Brunei Darussalam
China
Cook Islands
Fiji
Kiribati
Lao People's Democratic Republic
Marshall Islands
Micronesia (Federated States of)
Mongolia
Nauru
Palau
Papua New Guinea
Philippines
Samoa
Solomon Islands
Tonga
Tuvalu
Vanuatu
Viet Nam
100
100
98
97
97
92
24
WPR
The former Yugoslav Republic of Macedonia
50 WORLD HEALTH STATISTICS: 2018
Proportion of population using safely managed drinking-water services (%), 20151
Data type: Comparable estimates
SAFELY MANAGED DRINKING-WATER SERVICESSDG Target 6.1By 2030, achieve universal and equitable access to safe and affordable drinking water for all
Indicator 6.1.1: Proportion of population using safely managed drinking-water services
Indicator 6.1.1 Safely managed drinking-water services
1 Progress on drinking water, sanitation and hygiene – 2017 update and SDG baselines. Geneva and New York (NY): World Health Organization and United Nations Children’s Fund; 2017 (https://washdata.org/sites/default/files/documents/reports/2018-01/JMP-2017-report-final.pdf, accessed 31 March 2018) and Water and sanitation [online database]. Global Health Observatory (GHO) data. Geneva: World Health Organization (http://www.who.int/gho/mdg/environmental_sustainability/en/). Comparable estimates are only shown for countries with recent primary data.
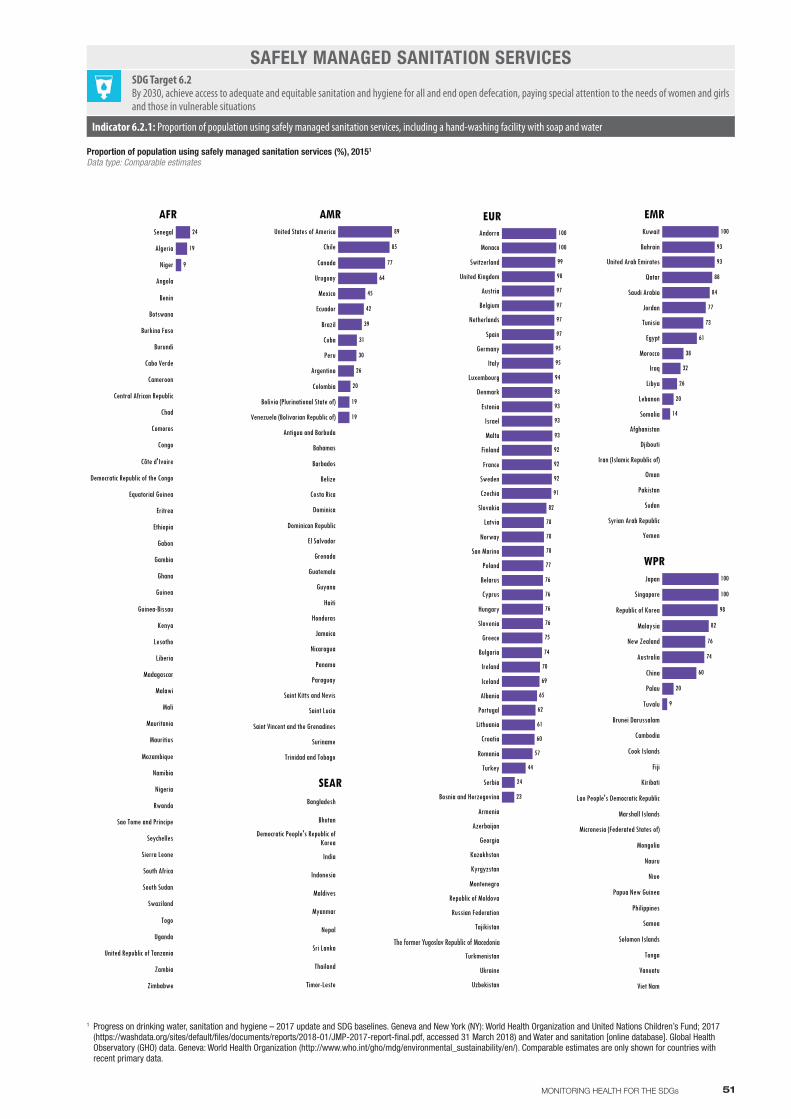
Senegal
Algeria
Niger
Angola
Benin
Botswana
Burkina Faso
Burundi
Cabo Verde
Cameroon
Central African Republic
Chad
Comoros
Congo
Côte d'Ivoire
Democratic Republic of the Congo
Equatorial Guinea
Eritrea
Ethiopia
Gabon
Gambia
Ghana
Guinea
Guinea-Bissau
Kenya
Lesotho
Liberia
Madagascar
Malawi
Mali
Mauritania
Mauritius
Mozambique
Namibia
Nigeria
Rwanda
Sao Tome and Principe
Seychelles
Sierra Leone
South Africa
South Sudan
Swaziland
Togo
Uganda
United Republic of Tanzania
Zambia
Zimbabwe
24
19
9
AFRUnited States of America
Chile
Canada
Uruguay
Mexico
Ecuador
Brazil
Cuba
Peru
Argentina
Colombia
Bolivia (Plurinational State of)
Venezuela (Bolivarian Republic of)
Antigua and Barbuda
Bahamas
Barbados
Belize
Costa Rica
Dominica
Dominican Republic
El Salvador
Grenada
Guatemala
Guyana
Haiti
Honduras
Jamaica
Nicaragua
Panama
Paraguay
Saint Kitts and Nevis
Saint Lucia
Saint Vincent and the Grenadines
Suriname
Trinidad and Tobago
89
85
77
64
45
42
39
31
30
26
20
19
19
AMR
Bangladesh
Bhutan
Democratic People's Republic ofKorea
India
Indonesia
Maldives
Myanmar
Nepal
Sri Lanka
Thailand
Timor-Leste
SEAR
Andorra
Monaco
Switzerland
United Kingdom
Austria
Belgium
Netherlands
Spain
Germany
Italy
Luxembourg
Denmark
Estonia
Israel
Malta
Finland
France
Sweden
Czechia
Slovakia
Latvia
Norway
San Marino
Poland
Belarus
Cyprus
Hungary
Slovenia
Greece
Bulgaria
Ireland
Iceland
Albania
Portugal
Lithuania
Croatia
Romania
Turkey
Serbia
Bosnia and Herzegovina
Armenia
Azerbaijan
Georgia
Kazakhstan
Kyrgyzstan
Montenegro
Republic of Moldova
Russian Federation
Tajikistan
The former Yugoslav Republic of ..
Turkmenistan
Ukraine
Uzbekistan
100
100
99
98
97
97
97
97
95
95
94
93
93
93
93
92
92
92
91
82
78
78
78
77
76
76
76
76
75
74
70
69
65
62
61
60
57
44
24
23
EURKuwait
Bahrain
United Arab Emirates
Qatar
Saudi Arabia
Jordan
Tunisia
Egypt
Morocco
Iraq
Libya
Lebanon
Somalia
Afghanistan
Djibouti
Iran (Islamic Republic of)
Oman
Pakistan
Sudan
Syrian Arab Republic
Yemen
100
93
93
88
84
77
73
61
38
32
26
20
14
EMR
Japan
Singapore
Republic of Korea
Malaysia
New Zealand
Australia
China
Palau
Tuvalu
Brunei Darussalam
Cambodia
Cook Islands
Fiji
Kiribati
Lao People's Democratic Republic
Marshall Islands
Micronesia (Federated States of)
Mongolia
Nauru
Niue
Papua New Guinea
Philippines
Samoa
Solomon Islands
Tonga
Vanuatu
Viet Nam
100
100
98
82
76
74
60
20
9
WPR
The former Yugoslav Republic of Macedonia
51MONITORING HEALTH FOR THE SDGs
Proportion of population using safely managed sanitation services (%), 20151
Data type: Comparable estimates
SAFELY MANAGED SANITATION SERVICESSDG Target 6.2By 2030, achieve access to adequate and equitable sanitation and hygiene for all and end open defecation, paying special attention to the needs of women and girls and those in vulnerable situations
Indicator 6.2.1: Proportion of population using safely managed sanitation services, including a hand-washing facility with soap and water
Indicator 6.2.1 Safely managed sanitation services
1 Progress on drinking water, sanitation and hygiene – 2017 update and SDG baselines. Geneva and New York (NY): World Health Organization and United Nations Children’s Fund; 2017 (https://washdata.org/sites/default/files/documents/reports/2018-01/JMP-2017-report-final.pdf, accessed 31 March 2018) and Water and sanitation [online database]. Global Health Observatory (GHO) data. Geneva: World Health Organization (http://www.who.int/gho/mdg/environmental_sustainability/en/). Comparable estimates are only shown for countries with recent primary data.
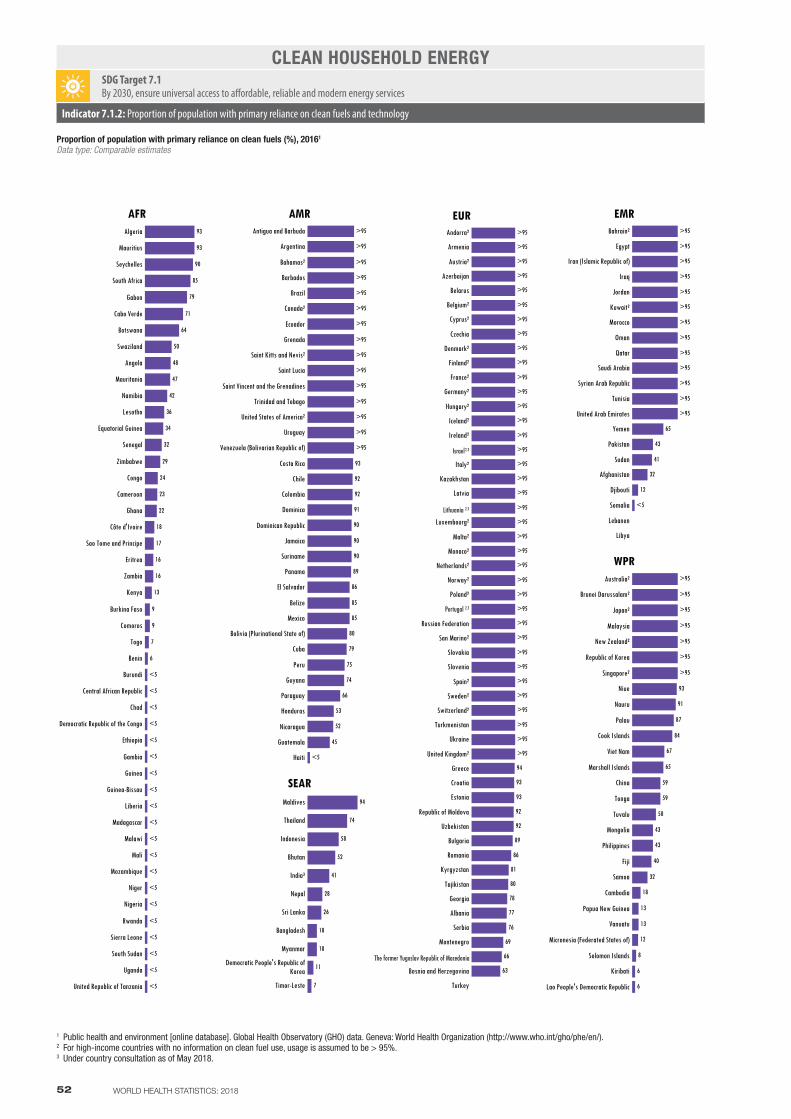
Algeria
Mauritius
Seychelles
South Africa
Gabon
Cabo Verde
Botswana
Swaziland
Angola
Mauritania
Namibia
Lesotho
Equatorial Guinea
Senegal
Zimbabwe
Congo
Cameroon
Ghana
Côte d'Ivoire
Sao Tome and Principe
Eritrea
Zambia
Kenya
Burkina Faso
Comoros
Togo
Benin
Burundi
Central African Republic
Chad
Democratic Republic of the Congo
Ethiopia
Gambia
Guinea
Guinea-Bissau
Liberia
Madagascar
Malawi
Mali
Mozambique
Niger
Nigeria
Rwanda
Sierra Leone
South Sudan
Uganda
United Republic of Tanzania <5
<5
<5
<5
<5
<5
<5
<5
<5
<5
<5
<5
<5
<5
<5
<5
<5
<5
<5
<5
93
93
90
85
79
71
64
50
48
47
42
36
34
32
29
24
23
22
18
17
16
16
13
9
9
7
6
AFRAntigua and Barbuda
Argentina
Bahamas²
Barbados
Brazil
Canada²
Ecuador
Grenada
Saint Kitts and Nevis²
Saint Lucia
Saint Vincent and the Grenadines
Trinidad and Tobago
United States of America²
Uruguay
Venezuela (Bolivarian Republic of)
Costa Rica
Chile
Colombia
Dominica
Dominican Republic
Jamaica
Suriname
Panama
El Salvador
Belize
Mexico
Bolivia (Plurinational State of)
Cuba
Peru
Guyana
Paraguay
Honduras
Nicaragua
Guatemala
Haiti
>95
>95
>95
>95
>95
>95
>95
>95
>95
>95
>95
>95
>95
>95
>95
<5
93
92
92
91
90
90
90
89
86
85
85
80
79
75
74
66
53
52
45
AMR
Maldives
Thailand
Indonesia
Bhutan
India³
Nepal
Sri Lanka
Bangladesh
Myanmar
Democratic People's Republic ofKorea
Timor-Leste
11
18
18
26
28
41
52
58
74
94
7
SEAR
Andorra²
Armenia
Austria²
Azerbaijan
Belarus
Belgium²
Cyprus²
Czechia
Denmark²
Finland²
France²
Germany²
Hungary²
Iceland²
Ireland²
Israel² ³
Italy²
Kazakhstan
Latvia
Lithuania² ³
Luxembourg²
Malta²
Monaco²
Netherlands²
Norway²
Poland²
Portugal² ³
Russian Federation
San Marino²
Slovakia
Slovenia
Spain²
Sweden²
Switzerland²
Turkmenistan
Ukraine
United Kingdom²
Greece
Croatia
Estonia
Republic of Moldova
Uzbekistan
Bulgaria
Romania
Kyrgyzstan
Tajikistan
Georgia
Albania
Serbia
Montenegro
The former Yugoslav Republic of ..
Bosnia and Herzegovina
Turkey
>95
>95
>95
>95
>95
>95
>95
>95
>95
>95
>95
>95
>95
>95
>95
>95
>95
>95
>95
>95
>95
>95
>95
>95
>95
>95
>95
>95
>95
>95
>95
>95
>95
>95
>95
>95
>95
94
93
93
92
92
89
86
81
80
78
77
76
69
66
63
EURBahrain²
Egypt
Iran (Islamic Republic of)
Iraq
Jordan
Kuwait²
Morocco
Oman
Qatar
Saudi Arabia
Syrian Arab Republic
Tunisia
United Arab Emirates
Yemen
Pakistan
Sudan
Afghanistan
Djibouti
Somalia
Lebanon
Libya
>95
>95
>95
>95
>95
>95
>95
>95
>95
>95
>95
>95
>95
<5
65
43
41
32
12
EMR
Australia²
Brunei Darussalam²
Japan²
Malaysia
New Zealand²
Republic of Korea
Singapore²
Niue
Nauru
Palau
Cook Islands
Viet Nam
Marshall Islands
China
Tonga
Tuvalu
Mongolia
Philippines
Fiji
Samoa
Cambodia
Papua New Guinea
Vanuatu
Micronesia (Federated States of)
Solomon Islands
Kiribati
Lao People's Democratic Republic
>95
>95
>95
>95
>95
>95
>95
93
91
87
84
67
65
59
59
50
43
43
40
32
18
13
13
12
8
6
6
WPR
The former Yugoslav Republic of Macedonia
Israel 2,3
Portugal 2,3
Lithuania 2,3
52 WORLD HEALTH STATISTICS: 2018
Proportion of population with primary reliance on clean fuels (%), 20161
Data type: Comparable estimates
CLEAN HOUSEHOLD ENERGYSDG Target 7.1By 2030, ensure universal access to affordable, reliable and modern energy services
Indicator 7.1.2: Proportion of population with primary reliance on clean fuels and technology
Indicator 7.1.2 Clean household energy
1 Public health and environment [online database]. Global Health Observatory (GHO) data. Geneva: World Health Organization (http://www.who.int/gho/phe/en/).2 For high-income countries with no information on clean fuel use, usage is assumed to be > 95%.3 Under country consultation as of May 2018.
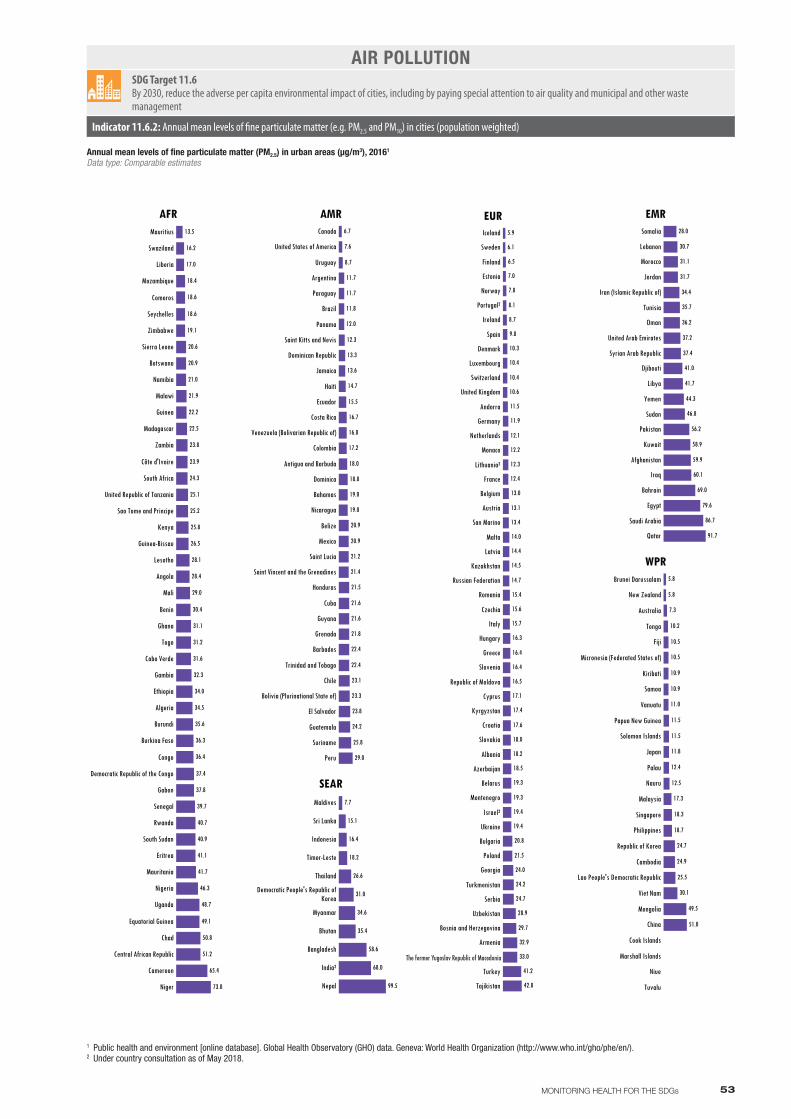
Mauritius
Swaziland
Liberia
Mozambique
Comoros
Seychelles
Zimbabwe
Sierra Leone
Botswana
Namibia
Malawi
Guinea
Madagascar
Zambia
Côte d'Ivoire
South Africa
United Republic of Tanzania
Sao Tome and Principe
Kenya
Guinea-Bissau
Lesotho
Angola
Mali
Benin
Ghana
Togo
Cabo Verde
Gambia
Ethiopia
Algeria
Burundi
Burkina Faso
Congo
Democratic Republic of the Congo
Gabon
Senegal
Rwanda
South Sudan
Eritrea
Mauritania
Nigeria
Uganda
Equatorial Guinea
Chad
Central African Republic
Cameroon
Niger 73.0
65.4
51.2
50.8
49.1
48.7
46.3
41.7
41.1
40.9
40.7
39.7
37.8
37.4
36.4
36.3
35.6
34.5
34.0
32.3
31.6
31.2
31.1
30.4
29.0
28.4
28.1
26.5
25.8
25.2
25.1
24.3
23.9
23.8
22.5
22.2
21.9
21.0
20.9
20.6
19.1
18.6
18.6
18.4
17.0
16.2
13.5
AFRCanada
United States of America
Uruguay
Argentina
Paraguay
Brazil
Panama
Saint Kitts and Nevis
Dominican Republic
Jamaica
Haiti
Ecuador
Costa Rica
Venezuela (Bolivarian Republic of)
Colombia
Antigua and Barbuda
Dominica
Bahamas
Nicaragua
Belize
Mexico
Saint Lucia
Saint Vincent and the Grenadines
Honduras
Cuba
Guyana
Grenada
Barbados
Trinidad and Tobago
Chile
Bolivia (Plurinational State of)
El Salvador
Guatemala
Suriname
Peru 29.0
25.8
24.2
23.8
23.3
23.1
22.4
22.4
21.8
21.6
21.6
21.5
21.4
21.2
20.9
20.9
19.0
19.0
18.8
18.0
17.2
16.8
16.7
15.5
14.7
13.6
13.3
12.3
12.0
11.8
11.7
11.7
8.7
7.6
6.7
AMR
Maldives
Sri Lanka
Indonesia
Timor-Leste
Thailand
Democratic People's Republic ofKorea
Myanmar
Bhutan
Bangladesh
India²
Nepal
15.1
16.4
18.2
26.6
31.0
34.6
35.4
58.6
68.0
99.5
7.7
SEAR
Iceland
Sweden
Finland
Estonia
Norway
Portugal²
Ireland
Spain
Denmark
Luxembourg
Switzerland
United Kingdom
Andorra
Germany
Netherlands
Monaco
Lithuania²
France
Belgium
Austria
San Marino
Malta
Latvia
Kazakhstan
Russian Federation
Romania
Czechia
Italy
Hungary
Greece
Slovenia
Republic of Moldova
Cyprus
Kyrgyzstan
Croatia
Slovakia
Albania
Azerbaijan
Belarus
Montenegro
Israel²
Ukraine
Bulgaria
Poland
Georgia
Turkmenistan
Serbia
Uzbekistan
Bosnia and Herzegovina
Armenia
The former Yugoslav Republic of ..
Turkey
Tajikistan 42.8
41.2
33.0
32.9
29.7
28.9
24.7
24.2
24.0
21.5
20.8
19.4
19.4
19.3
19.3
18.5
18.2
18.0
17.6
17.4
17.1
16.5
16.4
16.4
16.3
15.7
15.6
15.4
14.7
14.5
14.4
14.0
13.4
13.1
13.0
12.4
12.3
12.2
12.1
11.9
11.5
10.6
10.4
10.4
10.3
9.8
8.7
8.1
7.8
7.0
6.5
6.1
5.9
EURSomalia
Lebanon
Morocco
Jordan
Iran (Islamic Republic of)
Tunisia
Oman
United Arab Emirates
Syrian Arab Republic
Djibouti
Libya
Yemen
Sudan
Pakistan
Kuwait
Afghanistan
Iraq
Bahrain
Egypt
Saudi Arabia
Qatar 91.7
86.7
79.6
69.0
60.1
59.9
58.9
56.2
46.8
44.3
41.7
41.0
37.4
37.2
36.2
35.7
34.4
31.7
31.1
30.7
28.0
EMR
Brunei Darussalam
New Zealand
Australia
Tonga
Fiji
Micronesia (Federated States of)
Kiribati
Samoa
Vanuatu
Papua New Guinea
Solomon Islands
Japan
Palau
Nauru
Malaysia
Singapore
Philippines
Republic of Korea
Cambodia
Lao People's Democratic Republic
Viet Nam
Mongolia
China
Cook Islands
Marshall Islands
Niue
Tuvalu
51.0
49.5
30.1
25.5
24.9
24.7
18.7
18.3
17.3
12.5
12.4
11.8
11.5
11.5
11.0
10.9
10.9
10.5
10.5
10.2
7.3
5.8
5.8
WPR
The former Yugoslav Republic of Macedonia
53MONITORING HEALTH FOR THE SDGs
Annual mean levels of fine particulate matter (PM2.5) in urban areas (μg/m3), 20161
Data type: Comparable estimates
AIR POLLUTIONSDG Target 11.6By 2030, reduce the adverse per capita environmental impact of cities, including by paying special attention to air quality and municipal and other waste management
Indicator 11.6.2: Annual mean levels of fine particulate matter (e.g. PM2.5 and PM10) in cities (population weighted)
Indicator 11.6.2 Air pollution
1 Public health and environment [online database]. Global Health Observatory (GHO) data. Geneva: World Health Organization (http://www.who.int/gho/phe/en/).2 Under country consultation as of May 2018.
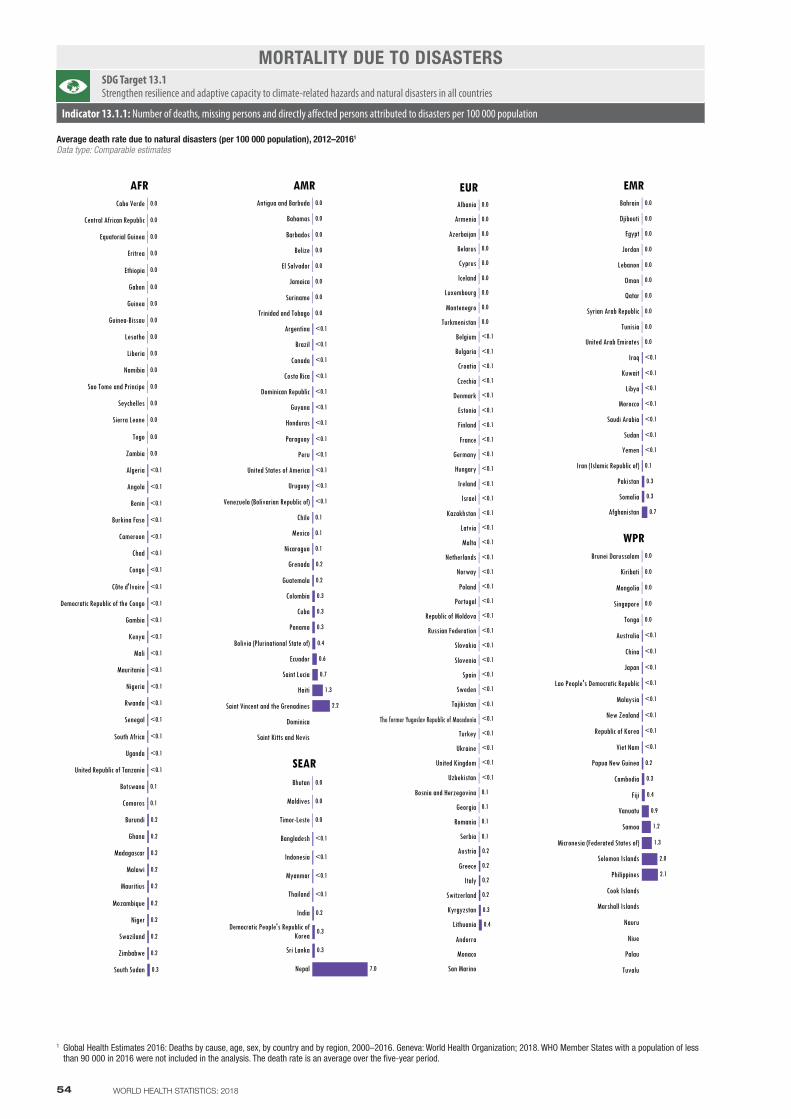
Cabo Verde
Central African Republic
Equatorial Guinea
Eritrea
Ethiopia
Gabon
Guinea
Guinea-Bissau
Lesotho
Liberia
Namibia
Sao Tome and Principe
Seychelles
Sierra Leone
Togo
Zambia
Algeria
Angola
Benin
Burkina Faso
Cameroon
Chad
Congo
Côte d'Ivoire
Democratic Republic of the Congo
Gambia
Kenya
Mali
Mauritania
Nigeria
Rwanda
Senegal
South Africa
Uganda
United Republic of Tanzania
Botswana
Comoros
Burundi
Ghana
Madagascar
Malawi
Mauritius
Mozambique
Niger
Swaziland
Zimbabwe
South Sudan
<0.1
<0.1
<0.1
<0.1
<0.1
<0.1
<0.1
<0.1
<0.1
<0.1
<0.1
<0.1
<0.1
<0.1
<0.1
<0.1
<0.1
<0.1
<0.1
0.3
0.2
0.2
0.2
0.2
0.2
0.2
0.2
0.2
0.2
0.1
0.1
0.0
0.0
0.0
0.0
0.0
0.0
0.0
0.0
0.0
0.0
0.0
0.0
0.0
0.0
0.0
0.0
AFRAntigua and Barbuda
Bahamas
Barbados
Belize
El Salvador
Jamaica
Suriname
Trinidad and Tobago
Argentina
Brazil
Canada
Costa Rica
Dominican Republic
Guyana
Honduras
Paraguay
Peru
United States of America
Uruguay
Venezuela (Bolivarian Republic of)
Chile
Mexico
Nicaragua
Grenada
Guatemala
Colombia
Cuba
Panama
Bolivia (Plurinational State of)
Ecuador
Saint Lucia
Haiti
Saint Vincent and the Grenadines
Dominica
Saint Kitts and Nevis
<0.1
<0.1
<0.1
<0.1
<0.1
<0.1
<0.1
<0.1
<0.1
<0.1
<0.1
<0.1
2.2
1.3
0.7
0.6
0.4
0.3
0.3
0.3
0.2
0.2
0.1
0.1
0.1
0.0
0.0
0.0
0.0
0.0
0.0
0.0
0.0
AMR
Bhutan
Maldives
Timor-Leste
Bangladesh
Indonesia
Myanmar
Thailand
India
Democratic People's Republic ofKorea
Sri Lanka
Nepal
<0.1
<0.1
<0.1
<0.1
0.0
0.0
0.0
0.2
0.3
0.3
7.0
SEAR
Albania
Armenia
Azerbaijan
Belarus
Cyprus
Iceland
Luxembourg
Montenegro
Turkmenistan
Belgium
Bulgaria
Croatia
Czechia
Denmark
Estonia
Finland
France
Germany
Hungary
Ireland
Israel
Kazakhstan
Latvia
Malta
Netherlands
Norway
Poland
Portugal
Republic of Moldova
Russian Federation
Slovakia
Slovenia
Spain
Sweden
Tajikistan
The former Yugoslav Republic of ..
Turkey
Ukraine
United Kingdom
Uzbekistan
Bosnia and Herzegovina
Georgia
Romania
Serbia
Austria
Greece
Italy
Switzerland
Kyrgyzstan
Lithuania
Andorra
Monaco
San Marino
<0.1
<0.1
<0.1
<0.1
<0.1
<0.1
<0.1
<0.1
<0.1
<0.1
<0.1
<0.1
<0.1
<0.1
<0.1
<0.1
<0.1
<0.1
<0.1
<0.1
<0.1
<0.1
<0.1
<0.1
<0.1
<0.1
<0.1
<0.1
<0.1
<0.1
<0.1
0.4
0.3
0.2
0.2
0.2
0.2
0.1
0.1
0.1
0.1
0.0
0.0
0.0
0.0
0.0
0.0
0.0
0.0
0.0
EURBahrain
Djibouti
Egypt
Jordan
Lebanon
Oman
Qatar
Syrian Arab Republic
Tunisia
United Arab Emirates
Iraq
Kuwait
Libya
Morocco
Saudi Arabia
Sudan
Yemen
Iran (Islamic Republic of)
Pakistan
Somalia
Afghanistan
<0.1
<0.1
<0.1
<0.1
<0.1
<0.1
<0.1
0.7
0.3
0.3
0.1
0.0
0.0
0.0
0.0
0.0
0.0
0.0
0.0
0.0
0.0
EMR
Brunei Darussalam
Kiribati
Mongolia
Singapore
Tonga
Australia
China
Japan
Lao People's Democratic Republic
Malaysia
New Zealand
Republic of Korea
Viet Nam
Papua New Guinea
Cambodia
Fiji
Vanuatu
Samoa
Micronesia (Federated States of)
Solomon Islands
Philippines
Cook Islands
Marshall Islands
Nauru
Niue
Palau
Tuvalu
<0.1
<0.1
<0.1
<0.1
<0.1
<0.1
<0.1
<0.1
2.1
2.0
1.3
1.2
0.9
0.4
0.3
0.2
0.0
0.0
0.0
0.0
0.0
WPR
The former Yugoslav Republic of Macedonia
54 WORLD HEALTH STATISTICS: 2018
Average death rate due to natural disasters (per 100 000 population), 2012–20161
Data type: Comparable estimates
MORTALITY DUE TO DISASTERSSDG Target 13.1Strengthen resilience and adaptive capacity to climate-related hazards and natural disasters in all countries
Indicator 13.1.1: Number of deaths, missing persons and directly affected persons attributed to disasters per 100 000 population
Indicator 13.1.1 Mortality due to disasters
1 Global Health Estimates 2016: Deaths by cause, age, sex, by country and by region, 2000–2016. Geneva: World Health Organization; 2018. WHO Member States with a population of less than 90 000 in 2016 were not included in the analysis. The death rate is an average over the five-year period.
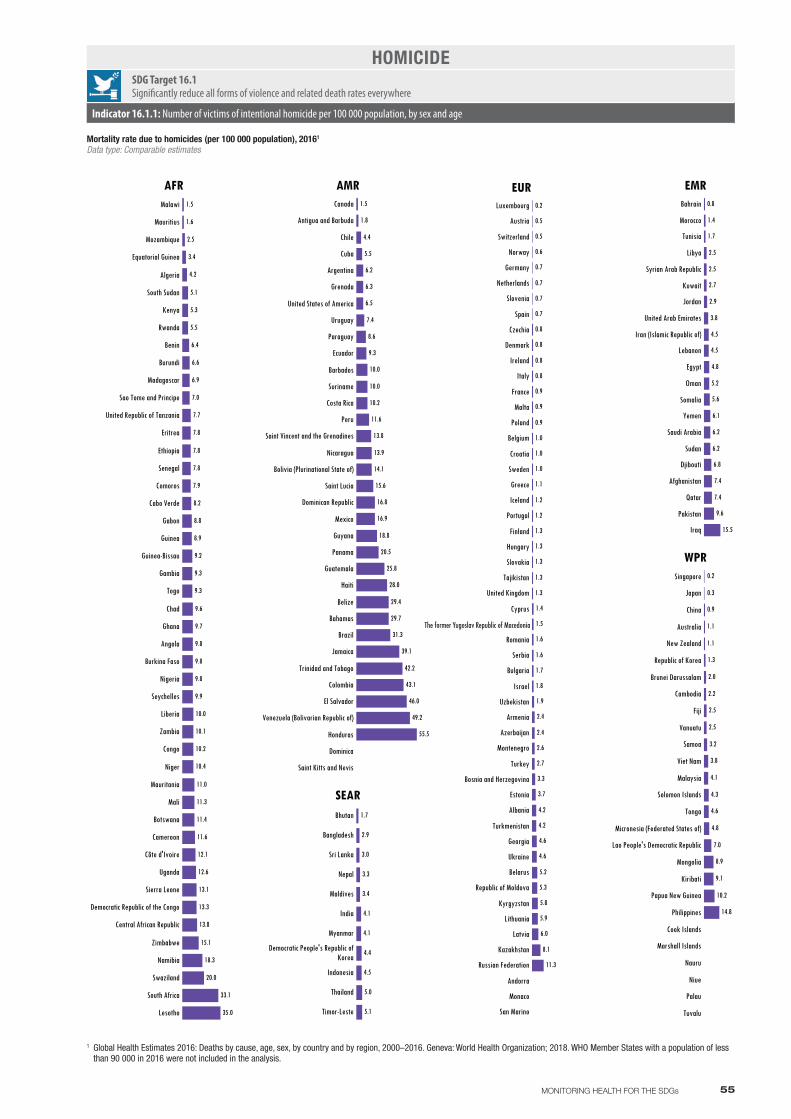
Malawi
Mauritius
Mozambique
Equatorial Guinea
Algeria
South Sudan
Kenya
Rwanda
Benin
Burundi
Madagascar
Sao Tome and Principe
United Republic of Tanzania
Eritrea
Ethiopia
Senegal
Comoros
Cabo Verde
Gabon
Guinea
Guinea-Bissau
Gambia
Togo
Chad
Ghana
Angola
Burkina Faso
Nigeria
Seychelles
Liberia
Zambia
Congo
Niger
Mauritania
Mali
Botswana
Cameroon
Côte d'Ivoire
Uganda
Sierra Leone
Democratic Republic of the Congo
Central African Republic
Zimbabwe
Namibia
Swaziland
South Africa
Lesotho 35.0
33.1
20.0
18.3
15.1
13.8
13.3
13.1
12.6
12.1
11.6
11.4
11.3
11.0
10.4
10.2
10.1
10.0
9.9
9.8
9.8
9.8
9.7
9.6
9.3
9.3
9.2
8.9
8.8
8.2
7.9
7.8
7.8
7.8
7.7
7.0
6.9
6.6
6.4
5.5
5.3
5.1
4.2
3.4
2.5
1.6
1.5
AFRCanada
Antigua and Barbuda
Chile
Cuba
Argentina
Grenada
United States of America
Uruguay
Paraguay
Ecuador
Barbados
Suriname
Costa Rica
Peru
Saint Vincent and the Grenadines
Nicaragua
Bolivia (Plurinational State of)
Saint Lucia
Dominican Republic
Mexico
Guyana
Panama
Guatemala
Haiti
Belize
Bahamas
Brazil
Jamaica
Trinidad and Tobago
Colombia
El Salvador
Venezuela (Bolivarian Republic of)
Honduras
Dominica
Saint Kitts and Nevis
55.5
49.2
46.0
43.1
42.2
39.1
31.3
29.7
29.4
28.0
25.8
20.5
18.8
16.9
16.8
15.6
14.1
13.9
13.8
11.6
10.2
10.0
10.0
9.3
8.6
7.4
6.5
6.3
6.2
5.5
4.4
1.8
1.5
AMR
Bhutan
Bangladesh
Sri Lanka
Nepal
Maldives
India
Myanmar
Democratic People's Republic ofKorea
Indonesia
Thailand
Timor-Leste
1.7
2.9
3.0
3.3
3.4
4.1
4.1
4.4
4.5
5.0
5.1
SEAR
Luxembourg
Austria
Switzerland
Norway
Germany
Netherlands
Slovenia
Spain
Czechia
Denmark
Ireland
Italy
France
Malta
Poland
Belgium
Croatia
Sweden
Greece
Iceland
Portugal
Finland
Hungary
Slovakia
Tajikistan
United Kingdom
Cyprus
The former Yugoslav Republic of ..
Romania
Serbia
Bulgaria
Israel
Uzbekistan
Armenia
Azerbaijan
Montenegro
Turkey
Bosnia and Herzegovina
Estonia
Albania
Turkmenistan
Georgia
Ukraine
Belarus
Republic of Moldova
Kyrgyzstan
Lithuania
Latvia
Kazakhstan
Russian Federation
Andorra
Monaco
San Marino
11.3
8.1
6.0
5.9
5.8
5.3
5.2
4.6
4.6
4.2
4.2
3.7
3.3
2.7
2.6
2.4
2.4
1.9
1.8
1.7
1.6
1.6
1.5
1.4
1.3
1.3
1.3
1.3
1.3
1.2
1.2
1.1
1.0
1.0
1.0
0.9
0.9
0.9
0.8
0.8
0.8
0.8
0.7
0.7
0.7
0.7
0.6
0.5
0.5
0.2
EURBahrain
Morocco
Tunisia
Libya
Syrian Arab Republic
Kuwait
Jordan
United Arab Emirates
Iran (Islamic Republic of)
Lebanon
Egypt
Oman
Somalia
Yemen
Saudi Arabia
Sudan
Djibouti
Afghanistan
Qatar
Pakistan
Iraq 15.5
9.6
7.4
7.4
6.8
6.2
6.2
6.1
5.6
5.2
4.8
4.5
4.5
3.8
2.9
2.7
2.5
2.5
1.7
1.4
0.8
EMR
Singapore
Japan
China
Australia
New Zealand
Republic of Korea
Brunei Darussalam
Cambodia
Fiji
Vanuatu
Samoa
Viet Nam
Malaysia
Solomon Islands
Tonga
Micronesia (Federated States of)
Lao People's Democratic Republic
Mongolia
Kiribati
Papua New Guinea
Philippines
Cook Islands
Marshall Islands
Nauru
Niue
Palau
Tuvalu
14.8
10.2
9.1
8.9
7.0
4.8
4.6
4.3
4.1
3.8
3.2
2.5
2.5
2.2
2.0
1.3
1.1
1.1
0.9
0.3
0.2
WPR
The former Yugoslav Republic of Macedonia
55MONITORING HEALTH FOR THE SDGs
Mortality rate due to homicides (per 100 000 population), 20161
Data type: Comparable estimates
HOMICIDESDG Target 16.1Significantly reduce all forms of violence and related death rates everywhere
Indicator 16.1.1: Number of victims of intentional homicide per 100 000 population, by sex and age
Indicator 16.1.1 Homicide
1 Global Health Estimates 2016: Deaths by cause, age, sex, by country and by region, 2000–2016. Geneva: World Health Organization; 2018. WHO Member States with a population of less than 90 000 in 2016 were not included in the analysis.
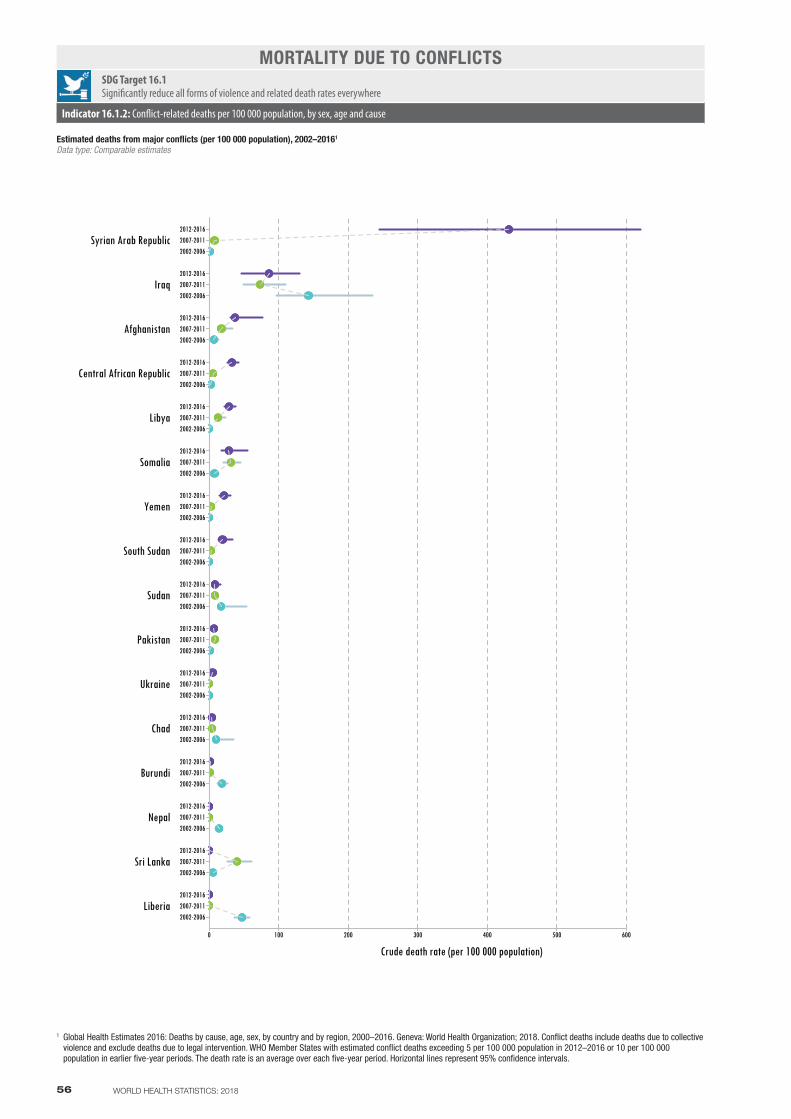
56 WORLD HEALTH STATISTICS: 2018
Estimated deaths from major conflicts (per 100 000 population), 2002–20161
Data type: Comparable estimates
MORTALITY DUE TO CONFLICTSSDG Target 16.1Significantly reduce all forms of violence and related death rates everywhere
Indicator 16.1.2: Conflict-related deaths per 100 000 population, by sex, age and cause
Indicator 16.1.2 Mortality due to conflicts
Crude death rate (per 100 000 population)0 100 200 300 400 500 600
2002-20062007-20112012-2016
2002-20062007-20112012-2016
2002-20062007-20112012-2016
2002-20062007-20112012-2016
2002-20062007-20112012-2016
2002-20062007-20112012-2016
2002-20062007-20112012-2016
2002-20062007-20112012-2016
2002-20062007-20112012-2016
2002-20062007-20112012-2016
2002-20062007-20112012-2016
2002-20062007-20112012-2016
2002-20062007-20112012-2016
2002-20062007-20112012-2016
2002-20062007-20112012-2016
2002-20062007-20112012-2016
Liberia
Sri Lanka
Nepal
Burundi
Chad
Ukraine
Pakistan
Sudan
South Sudan
Yemen
Somalia
Libya
Central African Republic
Afghanistan
Iraq
Syrian Arab Republic
1 Global Health Estimates 2016: Deaths by cause, age, sex, by country and by region, 2000–2016. Geneva: World Health Organization; 2018. Conflict deaths include deaths due to collective violence and exclude deaths due to legal intervention. WHO Member States with estimated conflict deaths exceeding 5 per 100 000 population in 2012–2016 or 10 per 100 000 population in earlier five-year periods. The death rate is an average over each five-year period. Horizontal lines represent 95% confidence intervals.
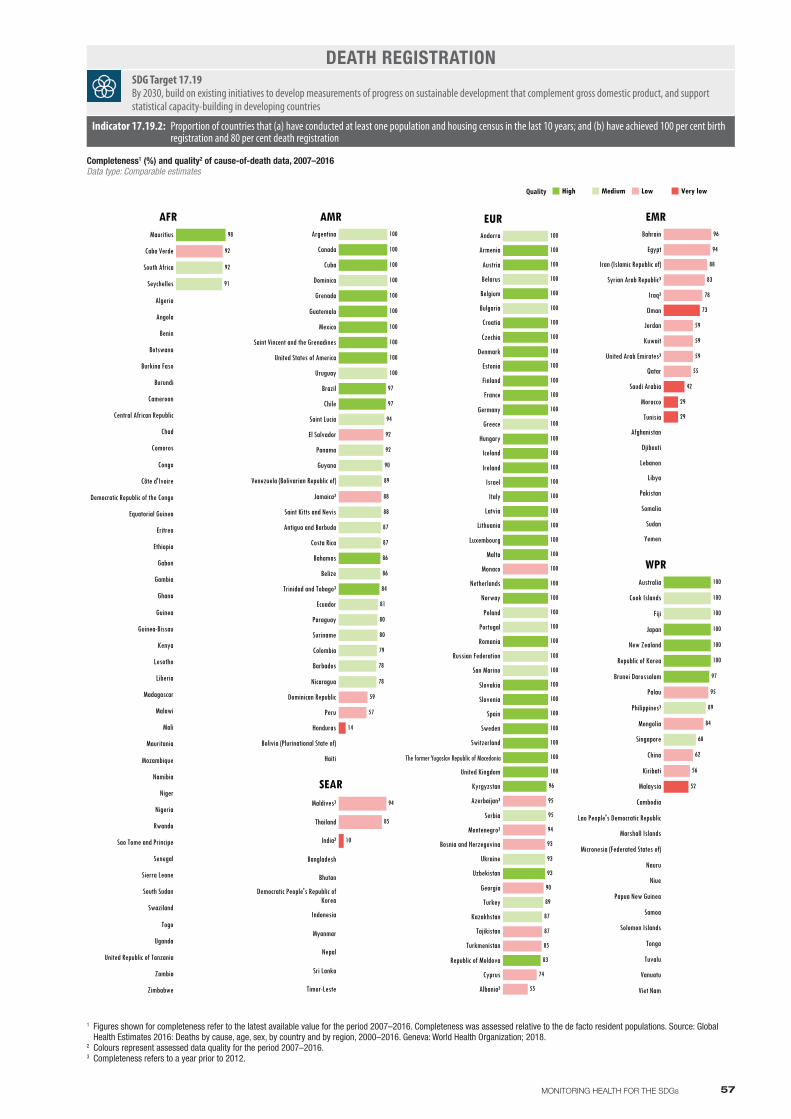
57MONITORING HEALTH FOR THE SDGs
DEATH REGISTRATIONSDG Target 17.19By 2030, build on existing initiatives to develop measurements of progress on sustainable development that complement gross domestic product, and support statistical capacity-building in developing countries
Indicator 17.19.2: Proportion of countries that (a) have conducted at least one population and housing census in the last 10 years; and (b) have achieved 100 per cent birth registration and 80 per cent death registration
Completeness1 (%) and quality2 of cause-of-death data, 2007–2016Data type: Comparable estimates
Indicator 17.19.2 Death registration
Mauritius
Cabo Verde
South Africa
Seychelles
Algeria
Angola
Benin
Botswana
Burkina Faso
Burundi
Cameroon
Central African Republic
Chad
Comoros
Congo
Côte d'Ivoire
Democratic Republic of the Congo
Equatorial Guinea
Eritrea
Ethiopia
Gabon
Gambia
Ghana
Guinea
Guinea-Bissau
Kenya
Lesotho
Liberia
Madagascar
Malawi
Mali
Mauritania
Mozambique
Namibia
Niger
Nigeria
Rwanda
Sao Tome and Principe
Senegal
Sierra Leone
South Sudan
Swaziland
Togo
Uganda
United Republic of Tanzania
Zambia
Zimbabwe
98
92
92
91
AFRArgentina
Canada
Cuba
Dominica
Grenada
Guatemala
Mexico
Saint Vincent and the Grenadines
United States of America
Uruguay
Brazil
Chile
Saint Lucia
El Salvador
Panama
Guyana
Venezuela (Bolivarian Republic of)
Jamaica³
Saint Kitts and Nevis
Antigua and Barbuda
Costa Rica
Bahamas
Belize
Trinidad and Tobago³
Ecuador
Paraguay
Suriname
Colombia
Barbados
Nicaragua
Dominican Republic
Peru
Honduras
Bolivia (Plurinational State of)
Haiti
100
100
100
100
100
100
100
100
100
100
97
97
94
92
92
90
89
88
88
87
87
86
86
84
81
80
80
79
78
78
59
57
14
AMR
Maldives³
Thailand
India³
Bangladesh
Bhutan
Democratic People's Republic ofKorea
Indonesia
Myanmar
Nepal
Sri Lanka
Timor-Leste
10
85
94
SEAR
Andorra
Armenia
Austria
Belarus
Belgium
Bulgaria
Croatia
Czechia
Denmark
Estonia
Finland
France
Germany
Greece
Hungary
Iceland
Ireland
Israel
Italy
Latvia
Lithuania
Luxembourg
Malta
Monaco
Netherlands
Norway
Poland
Portugal
Romania
Russian Federation
San Marino
Slovakia
Slovenia
Spain
Sweden
Switzerland
The former Yugoslav Republic of ..
United Kingdom
Kyrgyzstan
Azerbaijan³
Serbia
Montenegro³
Bosnia and Herzegovina
Ukraine
Uzbekistan
Georgia
Turkey
Kazakhstan
Tajikistan
Turkmenistan
Republic of Moldova
Cyprus
Albania³
100
100
100
100
100
100
100
100
100
100
100
100
100
100
100
100
100
100
100
100
100
100
100
100
100
100
100
100
100
100
100
100
100
100
100
100
100
100
96
95
95
94
93
93
93
90
89
87
87
85
83
74
55
EURBahrain
Egypt
Iran (Islamic Republic of)
Syrian Arab Republic³
Iraq³
Oman
Jordan
Kuwait
United Arab Emirates³
Qatar
Saudi Arabia
Morocco
Tunisia
Afghanistan
Djibouti
Lebanon
Libya
Pakistan
Somalia
Sudan
Yemen
96
94
88
83
78
73
59
59
59
55
42
29
29
EMR
Australia
Cook Islands
Fiji
Japan
New Zealand
Republic of Korea
Brunei Darussalam
Palau
Philippines³
Mongolia
Singapore
China
Kiribati
Malaysia
Cambodia
Lao People's Democratic Republic
Marshall Islands
Micronesia (Federated States of)
Nauru
Niue
Papua New Guinea
Samoa
Solomon Islands
Tonga
Tuvalu
Vanuatu
Viet Nam
100
100
100
100
100
100
97
95
89
84
68
62
56
52
WPR
High Medium Low Very low
The former Yugoslav Republic of Macedonia
Quality
1 Figures shown for completeness refer to the latest available value for the period 2007–2016. Completeness was assessed relative to the de facto resident populations. Source: Global Health Estimates 2016: Deaths by cause, age, sex, by country and by region, 2000–2016. Geneva: World Health Organization; 2018.
2 Colours represent assessed data quality for the period 2007–2016.3 Completeness refers to a year prior to 2012.

59MONITORING HEALTH FOR THE SDGs
ANNEX B Tables of health-related SDG statistics by country, WHO region and globally
Explanatory notes
The statistics shown below represent official WHO statistics for selected health-related SDG indicators based on evidence available in early 2018. In addition, summary measures of health such as (healthy) life expectancy, and basic demographic and health-economic statistics, are included to provide a general indication of the situation.
These statistics have been compiled primarily from publications and databases produced and maintained by WHO or United Nations groups of which WHO is a member. A number of statistics have been derived from data produced and maintained by other international organizations. For each indicator, the source of the data series is provided. Member States may have more data than are available for global monitoring.
For the first time in the World Health Statistics series, the type of data used for each data series (comparable estimates, primary data or other data) is also provided. Please refer to Part 1 of this report for more information on these different data categories. It is important to note that comparable estimates are subject to considerable uncertainty, especially for countries where the availability and quality of the underlying primary data is limited. Uncertainty intervals and other details on the indicators and statistics presented here can be found online at the WHO Global Health Observatory.1
While every effort has been made to maximize the comparability of statistics across countries and over time, users are advised that data series based on primary data may differ in terms of the definitions, data-collection methods, population coverage and estimation methods used. For indicators with a reference period expressed as a range, country values refer to the latest available year in the range unless otherwise noted. Please refer to the accompanying footnotes for more details. In some cases, as SDG indicator definitions are being refined and baseline data are being collected, proxy indicators have been presented in this annex and have been clearly indicated as such through the use of accompanying footnotes.
Unless otherwise stated, the WHO regional and global aggregates for rates and ratios are weighted averages when relevant, while for absolute numbers they are the sums. For indicators with a reference period expressed as a range, aggregates are for a specific year or period as indicated in the accompanying footnotes. Some WHO regional and global aggregates may include country estimates that are not individually reported.
Changes in the values shown for indicators reported on in previous editions of the World Health Statistics series should not be assumed to accurately reflect underlying trends. This applies to all data types (comparable estimates, primary data and other data) and all reporting levels (country, regional and global). The data presented here may also differ from, and should not be regarded as, the official national statistics of individual WHO Member States.
Note: – indicates data not available or not applicable.
1 The Global Health Observatory (GHO) is WHO’s portal providing access to data and analyses for monitoring the global health situation. See: http://www.who.int/gho/en/, accessed 29 March 2018.

60 WORLD HEALTH STATISTICS: 2018
3.1 3.2 3.2 3.3 3.4 3.5
Member State
ANNEX BPart 1
Healthy life expectancy at birthb,c (years)
Current health expenditure (CHE) per
capitad (US$)
Current health expenditure
(CHE) as percentage
of gross domestic product
(GDP)d (%)
Maternal mortality ratioe (per
100 000 live births)
Proportion of births
attended by skilled health
personnelf (%)
Under-five mortality rateg
(per 1000 live births)
Neonatal mortality rateg (per 1000 live
births)
New HIV infectionsh (per 1000 uninfected population)
Tuberculosis incidencei
(per 100 000 population)
Malaria incidencej (per 1000
population at risk)
Hepatitis B surface antigen
(HBsAg) prevalence
among children under 5 yearsk
(%)
Reported number
of people requiring
interventions against NTDsl
Probability of dying
from any of CVD, cancer,
diabetes, CRD between age 30 and exact age 70c,m (%)
Suicide mortality
ratec,m (per 100 000
population)
Total alcohol per capita
(>= 15 years of age) consumptionn
(litres of pure alcohol)
Total populationa
(000s)
Life expectancy at birthb,c (years)
Male Female Both sexes
Data type Comparable estimates Comparable estimates
Comparable estimates
Comparable estimates
Comparable estimates
Comparable estimates Primary data
Comparable estimates
Comparable estimates
Comparable estimates
Comparable estimates
Comparable estimates
Comparable estimates Other data
Comparable estimates
Comparable estimates
Comparable estimates
Member State 2016 2016 2016 2015 2015 2015 2007–2017 2016 2016 2016 2016 2016 2015 2016 2016 2016 2016
Afghanistan 34 656 61.0 64.5 62.7 53.0 60 10.3 396 50af 70.4 40.0 0.03 189 30.8 0.50 13 275 429 29.8 4.7 0.2 Afghanistan
Albania 2 926 74.3 78.6 76.4 68.1 266 6.8 29 99 13.5 6.2 0.08 16 – 1.29 21 17.0 6.3 7.5 Albania
Algeria 40 606 75.4 77.4 76.4 65.5 292 7.1 140 97 25.2 15.6 0.02 70 0.0 0.22 0 14.2 3.2 0.9 Algeria
Andorra 77 – – – – 4 316 12.0 – – 2.7 1.1 – 6 – 0.08 0 – – 11.3 Andorra
Angola 28 813 60.3 64.9 62.6 55.8 109 2.9 477 47 82.5 29.3 0.94 370 120.3 4.85 14 419 092 16.5 4.7 6.4 Angola
Antigua and Barbuda 101 72.5 77.5 75.0 67.0 657 4.8 – 100af 8.5 3.8 – 3.4 – 0.38 176 22.6 0.5 7.0 Antigua and Barbuda
Argentina 43 847 73.5 80.3 76.9 68.4 998 6.8 52 100 11.1 6.2 0.13 24 0.0 0.01 80 002 15.8 9.2 9.8 Argentina
Armenia 2 925 71.2 78.1 74.8 66.3 366 10.1 25 100af 13.4 7.4 0.09 44 – 0.25 39 149 22.3 6.6 5.5 Armenia
Australia 24 126 81.0 84.8 82.9 73.0 4 934 9.4 6 100ag 3.7 2.2 0.05 6.1 – 0.15 20 994 9.1 13.2 10.6 Australia
Austria 8 712 79.4 84.2 81.9 72.4 4 536 10.3 4 98ag 3.5 2.2 – 8.2 – 0.32 26 11.4 15.6 11.6 Austria
Azerbaijan 9 725 70.3 75.7 73.1 64.9 368 6.7 25 100af 30.9 18.1 0.10 66 0.0 0.27 1 719 031 22.2 2.6 0.8 Azerbaijan
Bahamas 391 72.6 78.6 75.7 66.8 1 685 7.4 80 100ag 10.6 5.8 – 26 – 0.31 4 077 15.5 1.7 4.4 Bahamas
Bahrain 1 425 78.6 79.6 79.1 68.1 1 190 5.2 15 100ag 7.6 3.1 0.04 12 – 0.18 3 11.3 5.9 1.9 Bahrain
Bangladesh 162 952 71.1 74.4 72.7 63.3 32 2.6 176 50af 34.2 20.1 <0.01 221 0.6 1.38 47 484 224 21.6 5.9 0.0 Bangladesh
Barbados 285 73.1 78.0 75.6 67.0 1 160 7.5 27 99ag 12.3 7.9 0.58 1.2 – 0.34 1 433 16.2 0.8 9.6 Barbados
Belarus 9 480 68.8 79.2 74.2 65.5 352 6.1 4 100af 3.9 1.5 – 52 – 0.20 0 23.7 26.2 11.2 Belarus
Belgium 11 358 78.8 83.5 81.2 71.6 4 228 10.5 7 – 3.9 2.2 – 10 – 0.18 20 11.4 20.7 12.1 Belgium
Belize 367 67.9 73.4 70.5 62.5 301 6.2 28 97 14.9 10.3 0.75 38 <0.1 1.49 7 312 22.1 4.7 6.7 Belize
Benin 10 872 59.7 62.4 61.1 53.5 31 4.0 405 77 97.6 31.4 0.34 59 297.3 5.55 6 938 376 19.6 9.9 3.0 Benin
Bhutan 798 70.4 70.8 70.6 60.7 91 3.5 148 89af 32.4 18.1 – 178 <0.1 0.81 241 761 23.3 11.4 0.6 Bhutan
Bolivia (Plurinational State of) 10 888 69.1 74.0 71.5 63.0 197 6.4 206 90af 36.9 19.0 0.10 114 2.7 0.20 1 879 813 17.2 12.2 4.8 Bolivia (Plurinational
State of)
Bosnia and Herzegovina 3 517 74.8 79.8 77.3 67.2 431 9.4 11 100 6.0 4.7 – 32 – 0.30 0 17.8 8.8 6.4 Bosnia and Herzegovina
Botswana 2 250 63.6 68.4 66.1 57.5 389 6.0 129 100ag 40.6 25.5 5.52 326 2.4 0.19 261 950 20.3 9.3 8.4 Botswana
Brazil 207 653 71.4 78.9 75.1 66.0 780 8.9 44 99ag 15.1 7.8 0.24 42 6.7 0.07 10 461 013 16.6 6.5 7.8 Brazil
Brunei Darussalam 423 75.3 77.6 76.4 67.9 812 2.6 23 100af 9.9 4.4 – 66 – 0.34 9 240 16.6 4.6 0.4 Brunei Darussalam
Bulgaria 7 131 71.4 78.4 74.8 66.4 572 8.2 11 100 7.6 3.8 0.03 27 – 0.31 272 23.6 11.5 12.7 Bulgaria
Burkina Faso 18 646 59.6 60.9 60.3 52.9 33 5.4 371 80 84.6 25.6 0.19 51 423.3 4.29 12 492 287 21.7 7.7 8.2 Burkina Faso
Burundi 10 524 58.5 61.8 60.1 52.6 24 8.2 712 85 71.7 24.2 0.20 118 156.2 2.59 5 898 120 22.9 9.1 7.5 Burundi
Cabo Verde 540 71.1 75.0 73.2 64.5 146 4.8 42 91 21.4 10.2 0.31 137 0.7 0.71 145 562 17.2 11.3 5.7 Cabo Verde
Cambodia 15 762 67.3 71.2 69.4 60.8 70 6.0 161 89af 30.6 16.2 0.04 345 8.9 0.56 4 771 389 21.1 5.3 6.7 Cambodia
Cameroon 23 439 56.7 59.4 58.1 51.1 64 5.1 596 65 79.7 23.9 1.39 203 271.3 1.90 19 389 766 21.6 12.2 8.9 Cameroon
Canada 36 290 80.9 84.7 82.8 73.2 4 508 10.4 7 98ag 4.9 3.2 – 5.2 – 1.03 0 9.8 12.5 8.9 Canada
Central African Republic 4 595 51.7 54.4 53.0 44.9 17 4.8 882 40 123.6 42.3 1.80 407 311.6 6.62 3 756 993 23.1 7.7 3.3 Central African Republic
Chad 14 453 53.1 55.4 54.3 47.2 36 4.6 856 20 127.3 35.1 0.34 153 167.6 3.08 6 138 675 23.9 8.8 1.5 Chad
Chile 17 910 76.5 82.4 79.5 69.7 1 102 8.1 22 100 8.3 5.4 0.28 16 – 0.28 44 12.4 10.6 9.3 Chile
China 1 411 415 75.0 77.9 76.4 68.7 426 5.3 27 100af 9.9 5.1 – 64 <0.1 0.83 26 375 574 17.0 9.7 7.2 China
Colombia 48 653 71.5 78.8 75.1 67.1 374 6.2 64 96 15.3 8.5 0.12 32 17.2 0.21 3 761 361 15.8 7.2 5.8 Colombia
Comoros 796 62.3 65.5 63.9 56.6 59 8.0 335 82 73.3 32.8 <0.01 35 1.8 1.96 527 919 22.9 6.8 0.9 Comoros
Congo 5 126 63.0 65.6 64.3 56.7 59 3.4 442 91 54.1 20.5 1.65 378 204.7 4.11 2 278 289 16.7 5.9 7.8 Congo
Cook Islands 17 – – – – 461 2.7 – 100af 7.8 4.1 – 13 – 0.22 0 – – 10.6 Cook Islands
Costa Rica 4 857 77.0 82.2 79.6 70.9 929 8.1 25 90 8.8 5.7 0.19 9.5 <0.1 0.17 23 769 11.5 7.9 4.8 Costa Rica
Côte d'Ivoire 23 696 53.6 55.7 54.6 48.3 75 5.4 645 74 91.8 36.6 0.86 153 223.2 3.04 16 756 532 29.1 14.5 8.4 Côte d'Ivoire
Croatia 4 213 75.0 81.5 78.3 69.0 852 7.4 8 100 4.7 2.9 0.02 12 – 0.11 9 16.7 16.5 8.9 Croatia
Cuba 11 476 76.8 81.3 79.0 69.9 826 10.9 39 100ag 5.5 2.4 0.29 6.9 – 0.12 43 687 16.4 13.9 6.1 Cuba
Cyprus 1 170 78.4 83.1 80.7 73.3 1 563 6.8 7 97ag 2.6 1.4 – 5.6 – 0.60 0 11.3 5.3 10.8 Cyprus
Czechia 10 611 76.2 82.1 79.2 69.3 1 284 7.3 4 100ag 3.2 1.6 0.04 5 – 0.39 4 15.0 13.1 14.4 Czechia
Democratic People's Republic of Korea 25 369 68.2 75.5 71.9 64.6 – – 82 100 20.0 10.7 – 513 0.5 0.53 5 214 937 25.6 11.2 3.9 Democratic People's
Republic of Korea
Democratic Republic of the Congo 78 736 58.9 62.0 60.5 52.5 20 4.3 693 80 94.3 28.8 0.17 323 291.9 1.43 49 900 757 19.4 5.7 2.6 Democratic Republic of
the Congo
Denmark 5 712 79.3 83.2 81.2 71.8 5 497 10.3 6 94ag 4.4 3.2 – 6.1 – 0.79 0 11.3 12.8 10.4 Denmark
Djibouti 942 62.2 65.5 63.8 56.6 82 4.4 229 87af 64.2 32.8 0.58 335 9.6 0.64 110 561 19.6 6.7 0.5 Djibouti
Dominica 74 – – – – 384 5.4 – 96ag 34.0 24.0 – 7.8 – 0.39 7 473 – – 8.2 Dominica
Dominican Republic 10 649 70.6 76.7 73.5 65.2 397 6.2 92 100ag 30.7 20.8 0.24 60 0.3 0.34 970 832 19.0 9.9 6.9 Dominican Republic

61MONITORING HEALTH FOR THE SDGs
3.1 3.2 3.2 3.3 3.4 3.5
Member State
ANNEX BPart 1
Healthy life expectancy at birthb,c (years)
Current health expenditure (CHE) per
capitad (US$)
Current health expenditure
(CHE) as percentage
of gross domestic product
(GDP)d (%)
Maternal mortality ratioe (per
100 000 live births)
Proportion of births
attended by skilled health
personnelf (%)
Under-five mortality rateg
(per 1000 live births)
Neonatal mortality rateg (per 1000 live
births)
New HIV infectionsh (per 1000 uninfected population)
Tuberculosis incidencei
(per 100 000 population)
Malaria incidencej (per 1000
population at risk)
Hepatitis B surface antigen
(HBsAg) prevalence
among children under 5 yearsk
(%)
Reported number
of people requiring
interventions against NTDsl
Probability of dying
from any of CVD, cancer,
diabetes, CRD between age 30 and exact age 70c,m (%)
Suicide mortality
ratec,m (per 100 000
population)
Total alcohol per capita
(>= 15 years of age) consumptionn
(litres of pure alcohol)
Total populationa
(000s)
Life expectancy at birthb,c (years)
Male Female Both sexes
Data type Comparable estimates Comparable estimates
Comparable estimates
Comparable estimates
Comparable estimates
Comparable estimates Primary data
Comparable estimates
Comparable estimates
Comparable estimates
Comparable estimates
Comparable estimates
Comparable estimates Other data
Comparable estimates
Comparable estimates
Comparable estimates
Member State 2016 2016 2016 2015 2015 2015 2007–2017 2016 2016 2016 2016 2016 2015 2016 2016 2016 2016
Afghanistan 34 656 61.0 64.5 62.7 53.0 60 10.3 396 50af 70.4 40.0 0.03 189 30.8 0.50 13 275 429 29.8 4.7 0.2 Afghanistan
Albania 2 926 74.3 78.6 76.4 68.1 266 6.8 29 99 13.5 6.2 0.08 16 – 1.29 21 17.0 6.3 7.5 Albania
Algeria 40 606 75.4 77.4 76.4 65.5 292 7.1 140 97 25.2 15.6 0.02 70 0.0 0.22 0 14.2 3.2 0.9 Algeria
Andorra 77 – – – – 4 316 12.0 – – 2.7 1.1 – 6 – 0.08 0 – – 11.3 Andorra
Angola 28 813 60.3 64.9 62.6 55.8 109 2.9 477 47 82.5 29.3 0.94 370 120.3 4.85 14 419 092 16.5 4.7 6.4 Angola
Antigua and Barbuda 101 72.5 77.5 75.0 67.0 657 4.8 – 100af 8.5 3.8 – 3.4 – 0.38 176 22.6 0.5 7.0 Antigua and Barbuda
Argentina 43 847 73.5 80.3 76.9 68.4 998 6.8 52 100 11.1 6.2 0.13 24 0.0 0.01 80 002 15.8 9.2 9.8 Argentina
Armenia 2 925 71.2 78.1 74.8 66.3 366 10.1 25 100af 13.4 7.4 0.09 44 – 0.25 39 149 22.3 6.6 5.5 Armenia
Australia 24 126 81.0 84.8 82.9 73.0 4 934 9.4 6 100ag 3.7 2.2 0.05 6.1 – 0.15 20 994 9.1 13.2 10.6 Australia
Austria 8 712 79.4 84.2 81.9 72.4 4 536 10.3 4 98ag 3.5 2.2 – 8.2 – 0.32 26 11.4 15.6 11.6 Austria
Azerbaijan 9 725 70.3 75.7 73.1 64.9 368 6.7 25 100af 30.9 18.1 0.10 66 0.0 0.27 1 719 031 22.2 2.6 0.8 Azerbaijan
Bahamas 391 72.6 78.6 75.7 66.8 1 685 7.4 80 100ag 10.6 5.8 – 26 – 0.31 4 077 15.5 1.7 4.4 Bahamas
Bahrain 1 425 78.6 79.6 79.1 68.1 1 190 5.2 15 100ag 7.6 3.1 0.04 12 – 0.18 3 11.3 5.9 1.9 Bahrain
Bangladesh 162 952 71.1 74.4 72.7 63.3 32 2.6 176 50af 34.2 20.1 <0.01 221 0.6 1.38 47 484 224 21.6 5.9 0.0 Bangladesh
Barbados 285 73.1 78.0 75.6 67.0 1 160 7.5 27 99ag 12.3 7.9 0.58 1.2 – 0.34 1 433 16.2 0.8 9.6 Barbados
Belarus 9 480 68.8 79.2 74.2 65.5 352 6.1 4 100af 3.9 1.5 – 52 – 0.20 0 23.7 26.2 11.2 Belarus
Belgium 11 358 78.8 83.5 81.2 71.6 4 228 10.5 7 – 3.9 2.2 – 10 – 0.18 20 11.4 20.7 12.1 Belgium
Belize 367 67.9 73.4 70.5 62.5 301 6.2 28 97 14.9 10.3 0.75 38 <0.1 1.49 7 312 22.1 4.7 6.7 Belize
Benin 10 872 59.7 62.4 61.1 53.5 31 4.0 405 77 97.6 31.4 0.34 59 297.3 5.55 6 938 376 19.6 9.9 3.0 Benin
Bhutan 798 70.4 70.8 70.6 60.7 91 3.5 148 89af 32.4 18.1 – 178 <0.1 0.81 241 761 23.3 11.4 0.6 Bhutan
Bolivia (Plurinational State of) 10 888 69.1 74.0 71.5 63.0 197 6.4 206 90af 36.9 19.0 0.10 114 2.7 0.20 1 879 813 17.2 12.2 4.8 Bolivia (Plurinational
State of)
Bosnia and Herzegovina 3 517 74.8 79.8 77.3 67.2 431 9.4 11 100 6.0 4.7 – 32 – 0.30 0 17.8 8.8 6.4 Bosnia and Herzegovina
Botswana 2 250 63.6 68.4 66.1 57.5 389 6.0 129 100ag 40.6 25.5 5.52 326 2.4 0.19 261 950 20.3 9.3 8.4 Botswana
Brazil 207 653 71.4 78.9 75.1 66.0 780 8.9 44 99ag 15.1 7.8 0.24 42 6.7 0.07 10 461 013 16.6 6.5 7.8 Brazil
Brunei Darussalam 423 75.3 77.6 76.4 67.9 812 2.6 23 100af 9.9 4.4 – 66 – 0.34 9 240 16.6 4.6 0.4 Brunei Darussalam
Bulgaria 7 131 71.4 78.4 74.8 66.4 572 8.2 11 100 7.6 3.8 0.03 27 – 0.31 272 23.6 11.5 12.7 Bulgaria
Burkina Faso 18 646 59.6 60.9 60.3 52.9 33 5.4 371 80 84.6 25.6 0.19 51 423.3 4.29 12 492 287 21.7 7.7 8.2 Burkina Faso
Burundi 10 524 58.5 61.8 60.1 52.6 24 8.2 712 85 71.7 24.2 0.20 118 156.2 2.59 5 898 120 22.9 9.1 7.5 Burundi
Cabo Verde 540 71.1 75.0 73.2 64.5 146 4.8 42 91 21.4 10.2 0.31 137 0.7 0.71 145 562 17.2 11.3 5.7 Cabo Verde
Cambodia 15 762 67.3 71.2 69.4 60.8 70 6.0 161 89af 30.6 16.2 0.04 345 8.9 0.56 4 771 389 21.1 5.3 6.7 Cambodia
Cameroon 23 439 56.7 59.4 58.1 51.1 64 5.1 596 65 79.7 23.9 1.39 203 271.3 1.90 19 389 766 21.6 12.2 8.9 Cameroon
Canada 36 290 80.9 84.7 82.8 73.2 4 508 10.4 7 98ag 4.9 3.2 – 5.2 – 1.03 0 9.8 12.5 8.9 Canada
Central African Republic 4 595 51.7 54.4 53.0 44.9 17 4.8 882 40 123.6 42.3 1.80 407 311.6 6.62 3 756 993 23.1 7.7 3.3 Central African Republic
Chad 14 453 53.1 55.4 54.3 47.2 36 4.6 856 20 127.3 35.1 0.34 153 167.6 3.08 6 138 675 23.9 8.8 1.5 Chad
Chile 17 910 76.5 82.4 79.5 69.7 1 102 8.1 22 100 8.3 5.4 0.28 16 – 0.28 44 12.4 10.6 9.3 Chile
China 1 411 415 75.0 77.9 76.4 68.7 426 5.3 27 100af 9.9 5.1 – 64 <0.1 0.83 26 375 574 17.0 9.7 7.2 China
Colombia 48 653 71.5 78.8 75.1 67.1 374 6.2 64 96 15.3 8.5 0.12 32 17.2 0.21 3 761 361 15.8 7.2 5.8 Colombia
Comoros 796 62.3 65.5 63.9 56.6 59 8.0 335 82 73.3 32.8 <0.01 35 1.8 1.96 527 919 22.9 6.8 0.9 Comoros
Congo 5 126 63.0 65.6 64.3 56.7 59 3.4 442 91 54.1 20.5 1.65 378 204.7 4.11 2 278 289 16.7 5.9 7.8 Congo
Cook Islands 17 – – – – 461 2.7 – 100af 7.8 4.1 – 13 – 0.22 0 – – 10.6 Cook Islands
Costa Rica 4 857 77.0 82.2 79.6 70.9 929 8.1 25 90 8.8 5.7 0.19 9.5 <0.1 0.17 23 769 11.5 7.9 4.8 Costa Rica
Côte d'Ivoire 23 696 53.6 55.7 54.6 48.3 75 5.4 645 74 91.8 36.6 0.86 153 223.2 3.04 16 756 532 29.1 14.5 8.4 Côte d'Ivoire
Croatia 4 213 75.0 81.5 78.3 69.0 852 7.4 8 100 4.7 2.9 0.02 12 – 0.11 9 16.7 16.5 8.9 Croatia
Cuba 11 476 76.8 81.3 79.0 69.9 826 10.9 39 100ag 5.5 2.4 0.29 6.9 – 0.12 43 687 16.4 13.9 6.1 Cuba
Cyprus 1 170 78.4 83.1 80.7 73.3 1 563 6.8 7 97ag 2.6 1.4 – 5.6 – 0.60 0 11.3 5.3 10.8 Cyprus
Czechia 10 611 76.2 82.1 79.2 69.3 1 284 7.3 4 100ag 3.2 1.6 0.04 5 – 0.39 4 15.0 13.1 14.4 Czechia
Democratic People's Republic of Korea 25 369 68.2 75.5 71.9 64.6 – – 82 100 20.0 10.7 – 513 0.5 0.53 5 214 937 25.6 11.2 3.9 Democratic People's
Republic of Korea
Democratic Republic of the Congo 78 736 58.9 62.0 60.5 52.5 20 4.3 693 80 94.3 28.8 0.17 323 291.9 1.43 49 900 757 19.4 5.7 2.6 Democratic Republic of
the Congo
Denmark 5 712 79.3 83.2 81.2 71.8 5 497 10.3 6 94ag 4.4 3.2 – 6.1 – 0.79 0 11.3 12.8 10.4 Denmark
Djibouti 942 62.2 65.5 63.8 56.6 82 4.4 229 87af 64.2 32.8 0.58 335 9.6 0.64 110 561 19.6 6.7 0.5 Djibouti
Dominica 74 – – – – 384 5.4 – 96ag 34.0 24.0 – 7.8 – 0.39 7 473 – – 8.2 Dominica
Dominican Republic 10 649 70.6 76.7 73.5 65.2 397 6.2 92 100ag 30.7 20.8 0.24 60 0.3 0.34 970 832 19.0 9.9 6.9 Dominican Republic
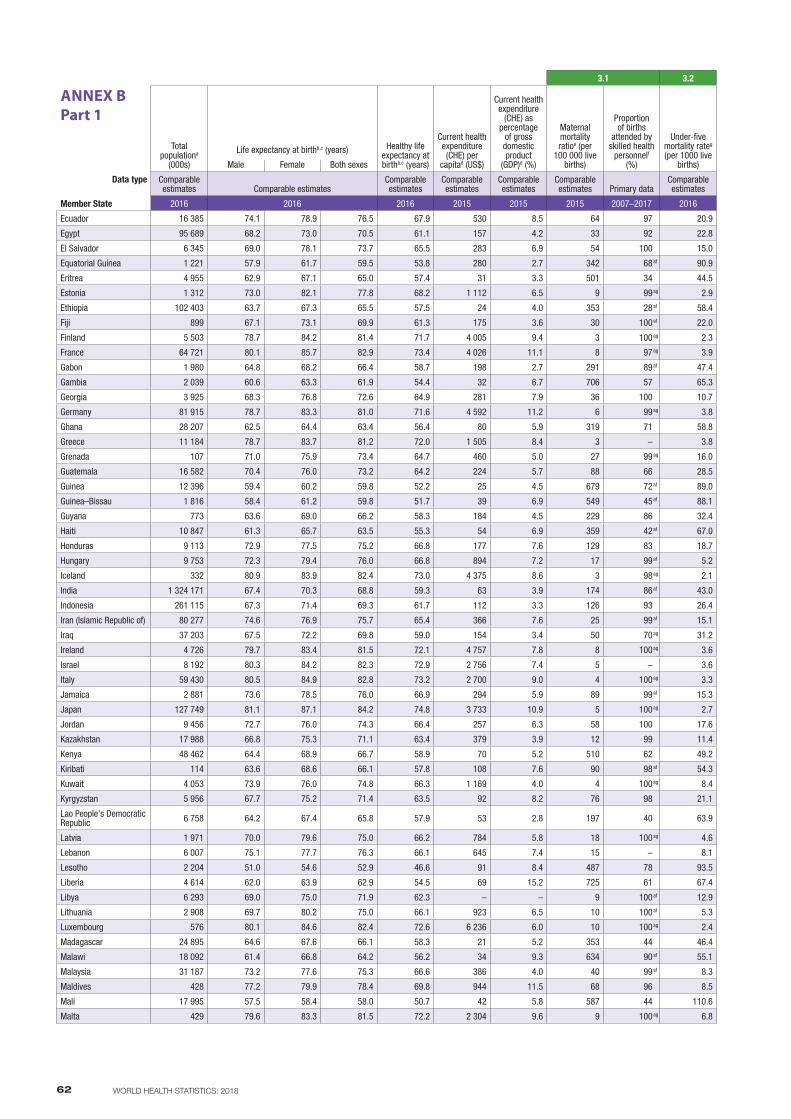
62 WORLD HEALTH STATISTICS: 2018
3.1 3.2 3.2 3.3 3.4 3.5
Member State
ANNEX BPart 1
Healthy life expectancy at birthb,c (years)
Current health expenditure (CHE) per
capitad (US$)
Current health expenditure
(CHE) as percentage
of gross domestic product
(GDP)d (%)
Maternal mortality ratioe (per
100 000 live births)
Proportion of births
attended by skilled health
personnelf (%)
Under-five mortality rateg
(per 1000 live births)
Neonatal mortality rateg (per 1000 live
births)
New HIV infectionsh (per 1000 uninfected population)
Tuberculosis incidencei
(per 100 000 population)
Malaria incidencej (per 1000
population at risk)
Hepatitis B surface antigen
(HBsAg) prevalence
among children under 5 yearsk
(%)
Reported number
of people requiring
interventions against NTDsl
Probability of dying
from any of CVD, cancer,
diabetes, CRD between age 30 and exact age 70c,m (%)
Suicide mortality
ratec,m (per 100 000
population)
Total alcohol per capita
(>= 15 years of age) consumptionn
(litres of pure alcohol)
Total populationa
(000s)
Life expectancy at birthb,c (years)
Male Female Both sexes
Data type Comparable estimates Comparable estimates
Comparable estimates
Comparable estimates
Comparable estimates
Comparable estimates Primary data
Comparable estimates
Comparable estimates
Comparable estimates
Comparable estimates
Comparable estimates
Comparable estimates Other data
Comparable estimates
Comparable estimates
Comparable estimates
Member State 2016 2016 2016 2015 2015 2015 2007–2017 2016 2016 2016 2016 2016 2015 2016 2016 2016 2016
Ecuador 16 385 74.1 78.9 76.5 67.9 530 8.5 64 97 20.9 11.2 0.12 50 3.8 0.32 1 942 753 13.0 7.1 4.4 Ecuador
Egypt 95 689 68.2 73.0 70.5 61.1 157 4.2 33 92 22.8 12.8 0.02 14 – 0.80 1 673 826 27.7 4.0 0.4 Egypt
El Salvador 6 345 69.0 78.1 73.7 65.5 283 6.9 54 100 15.0 7.5 0.16 60 <0.1 0.57 742 568 14.0 13.7 3.7 El Salvador
Equatorial Guinea 1 221 57.9 61.7 59.5 53.8 280 2.7 342 68af 90.9 32.0 2.71 181 238.8 8.66 428 948 22.0 16.4 11.3 Equatorial Guinea
Eritrea 4 955 62.9 67.1 65.0 57.4 31 3.3 501 34 44.5 17.7 0.15 74 17.2 0.74 1 497 725 23.9 7.9 1.3 Eritrea
Estonia 1 312 73.0 82.1 77.8 68.2 1 112 6.5 9 99ag 2.9 1.3 – 16 – 0.36 0 17.0 17.8 11.6 Estonia
Ethiopia 102 403 63.7 67.3 65.5 57.5 24 4.0 353 28af 58.4 27.6 0.33 177 53.1 2.61 74 204 513 18.3 7.2 2.8 Ethiopia
Fiji 899 67.1 73.1 69.9 61.3 175 3.6 30 100af 22.0 8.8 0.12 59 – 0.34 905 113 30.6 5.0 3.0 Fiji
Finland 5 503 78.7 84.2 81.4 71.7 4 005 9.4 3 100ag 2.3 1.2 – 4.7 – 1.05 4 10.2 15.9 10.7 Finland
France 64 721 80.1 85.7 82.9 73.4 4 026 11.1 8 97ag 3.9 2.4 0.09 7.7 – 0.01 49 10.6 17.7 12.6 France
Gabon 1 980 64.8 68.2 66.4 58.7 198 2.7 291 89af 47.4 21.8 0.92 485 206.2 4.16 694 499 14.4 7.1 11.5 Gabon
Gambia 2 039 60.6 63.3 61.9 54.4 32 6.7 706 57 65.3 27.5 0.65 174 129.6 1.17 177 144 20.4 5.1 3.8 Gambia
Georgia 3 925 68.3 76.8 72.6 64.9 281 7.9 36 100 10.7 7.1 0.28 92 0.0 0.26 412 310 24.9 8.2 9.8 Georgia
Germany 81 915 78.7 83.3 81.0 71.6 4 592 11.2 6 99ag 3.8 2.3 – 8.1 – 0.24 111 12.1 13.6 13.4 Germany
Ghana 28 207 62.5 64.4 63.4 56.4 80 5.9 319 71 58.8 26.9 0.78 156 285.6 3.61 15 536 910 20.8 5.4 2.7 Ghana
Greece 11 184 78.7 83.7 81.2 72.0 1 505 8.4 3 – 3.8 2.3 – 4.4 – 0.37 77 12.4 5.0 10.4 Greece
Grenada 107 71.0 75.9 73.4 64.7 460 5.0 27 99ag 16.0 8.3 – 6.4 – 0.47 151 21.4 1.7 9.3 Grenada
Guatemala 16 582 70.4 76.0 73.2 64.2 224 5.7 88 66 28.5 14.0 0.18 24 0.8 0.05 3 265 661 14.9 2.7 2.4 Guatemala
Guinea 12 396 59.4 60.2 59.8 52.2 25 4.5 679 72af 89.0 25.1 0.67 176 386.5 7.47 7 246 135 22.4 6.3 1.3 Guinea
Guinea–Bissau 1 816 58.4 61.2 59.8 51.7 39 6.9 549 45af 88.1 38.2 0.72 374 73.0 2.12 1 576 882 20.0 4.0 4.8 Guinea–Bissau
Guyana 773 63.6 69.0 66.2 58.3 184 4.5 229 86 32.4 20.0 0.77 93 77.7 0.95 720 459 30.5 29.2 6.3 Guyana
Haiti 10 847 61.3 65.7 63.5 55.3 54 6.9 359 42af 67.0 24.6 0.77 188 13.9 2.04 7 581 135 26.5 11.7 5.8 Haiti
Honduras 9 113 72.9 77.5 75.2 66.8 177 7.6 129 83 18.7 10.4 0.11 40 1.7 0.25 2 752 416 14.0 2.9 4.0 Honduras
Hungary 9 753 72.3 79.4 76.0 66.8 894 7.2 17 99af 5.2 2.8 – 8.8 – 0.44 5 23.0 19.1 11.4 Hungary
Iceland 332 80.9 83.9 82.4 73.0 4 375 8.6 3 98ag 2.1 1.0 – 2.1 – 0.88 0 9.1 14.0 9.1 Iceland
India 1 324 171 67.4 70.3 68.8 59.3 63 3.9 174 86af 43.0 25.4 0.06 211 18.8 0.51 458 855 231 23.3 16.3 5.7 India
Indonesia 261 115 67.3 71.4 69.3 61.7 112 3.3 126 93 26.4 13.7 0.19 391 9.2 1.07 101 813 236 26.4 3.4 0.8 Indonesia
Iran (Islamic Republic of) 80 277 74.6 76.9 75.7 65.4 366 7.6 25 99af 15.1 9.6 0.06 14 0.2 0.02 0 14.8 4.1 1.0 Iran (Islamic Republic of)
Iraq 37 203 67.5 72.2 69.8 59.0 154 3.4 50 70ag 31.2 18.2 – 43 0.0 0.06 2 170 486 21.3 3.0 0.4 Iraq
Ireland 4 726 79.7 83.4 81.5 72.1 4 757 7.8 8 100ag 3.6 2.2 0.06 7.1 – 0.01 2 10.3 11.5 13.0 Ireland
Israel 8 192 80.3 84.2 82.3 72.9 2 756 7.4 5 – 3.6 2.0 – 3.5 – 0.48 233 9.6 5.4 3.8 Israel
Italy 59 430 80.5 84.9 82.8 73.2 2 700 9.0 4 100ag 3.3 2.0 0.06 6.1 – 0.61 12 9.5 8.2 7.5 Italy
Jamaica 2 881 73.6 78.5 76.0 66.9 294 5.9 89 99af 15.3 10.9 0.63 4.5 – 0.16 347 536 14.7 2.2 4.2 Jamaica
Japan 127 749 81.1 87.1 84.2 74.8 3 733 10.9 5 100ag 2.7 0.9 – 16 – 1.95 5 8.4 18.5 8.0 Japan
Jordan 9 456 72.7 76.0 74.3 66.4 257 6.3 58 100 17.6 10.6 <0.01 5.6 – 1.01 126 19.2 2.9 0.7 Jordan
Kazakhstan 17 988 66.8 75.3 71.1 63.4 379 3.9 12 99 11.4 5.9 0.16 67 – 0.21 185 26.8 22.5 7.7 Kazakhstan
Kenya 48 462 64.4 68.9 66.7 58.9 70 5.2 510 62 49.2 22.6 1.46 348 85.3 0.86 11 770 703 13.4 3.2 3.4 Kenya
Kiribati 114 63.6 68.6 66.1 57.8 108 7.6 90 98af 54.3 22.6 – 566 – 3.65 117 424 28.4 14.4 0.4 Kiribati
Kuwait 4 053 73.9 76.0 74.8 66.3 1 169 4.0 4 100ag 8.4 4.4 0.02 24 – 0.11 6 17.4 2.3 0.0 Kuwait
Kyrgyzstan 5 956 67.7 75.2 71.4 63.5 92 8.2 76 98 21.1 11.6 0.13 145 0.0 0.50 113 625 24.9 8.3 6.2 Kyrgyzstan
Lao People's Democratic Republic 6 758 64.2 67.4 65.8 57.9 53 2.8 197 40 63.9 28.7 0.10 175 7.8 1.94 2 206 011 27.0 8.6 10.4 Lao People's Democratic
Republic
Latvia 1 971 70.0 79.6 75.0 66.2 784 5.8 18 100ag 4.6 2.4 0.23 37 – 0.51 11 21.9 21.2 12.9 Latvia
Lebanon 6 007 75.1 77.7 76.3 66.1 645 7.4 15 – 8.1 4.7 0.02 12 – 0.21 1 17.9 3.3 1.5 Lebanon
Lesotho 2 204 51.0 54.6 52.9 46.6 91 8.4 487 78 93.5 38.5 12.68 724 – 1.64 530 557 26.6 21.2 5.0 Lesotho
Liberia 4 614 62.0 63.9 62.9 54.5 69 15.2 725 61 67.4 22.8 0.66 308 237.0 7.75 2 919 973 17.6 6.8 5.8 Liberia
Libya 6 293 69.0 75.0 71.9 62.3 – – 9 100af 12.9 7.1 – 40 – 0.27 1 20.1 5.2 0.0 Libya
Lithuania 2 908 69.7 80.2 75.0 66.1 923 6.5 10 100af 5.3 2.5 0.09 53 – 0.19 26 20.7 31.9 15.0 Lithuania
Luxembourg 576 80.1 84.6 82.4 72.6 6 236 6.0 10 100ag 2.4 1.5 0.18 5.8 – 0.24 0 10.0 13.5 13.0 Luxembourg
Madagascar 24 895 64.6 67.6 66.1 58.3 21 5.2 353 44 46.4 18.6 0.18 237 64.4 4.36 18 863 123 22.9 3.9 1.9 Madagascar
Malawi 18 092 61.4 66.8 64.2 56.2 34 9.3 634 90af 55.1 23.1 2.29 159 249.1 3.03 11 435 030 16.4 3.7 3.7 Malawi
Malaysia 31 187 73.2 77.6 75.3 66.6 386 4.0 40 99af 8.3 4.4 0.19 92 0.2 0.17 120 318 17.2 5.5 0.9 Malaysia
Maldives 428 77.2 79.9 78.4 69.8 944 11.5 68 96 8.5 4.8 – 49 – 0.19 1 937 13.4 2.3 2.7 Maldives
Mali 17 995 57.5 58.4 58.0 50.7 42 5.8 587 44 110.6 35.7 0.33 56 459.7 4.88 18 605 778 24.6 4.8 1.3 Mali
Malta 429 79.6 83.3 81.5 72.2 2 304 9.6 9 100ag 6.8 4.6 0.06 13 – 0.39 1 10.8 7.5 8.1 Malta
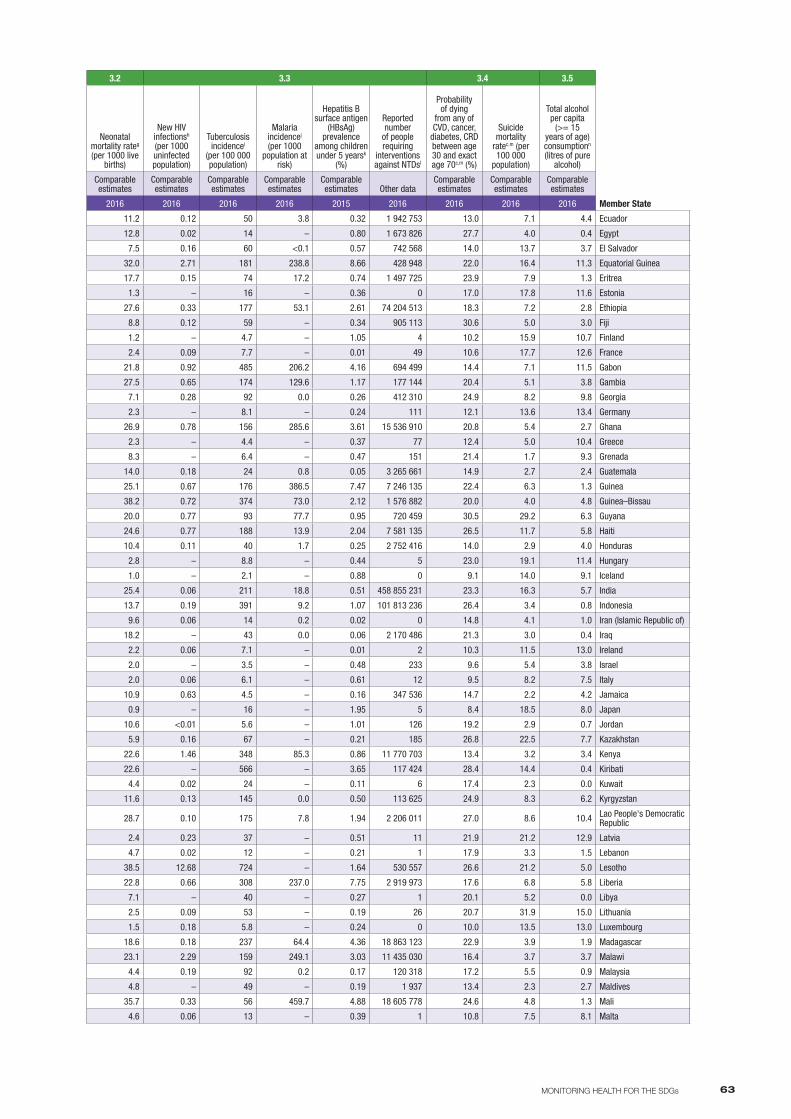
63MONITORING HEALTH FOR THE SDGs
3.1 3.2 3.2 3.3 3.4 3.5
Member State
ANNEX BPart 1
Healthy life expectancy at birthb,c (years)
Current health expenditure (CHE) per
capitad (US$)
Current health expenditure
(CHE) as percentage
of gross domestic product
(GDP)d (%)
Maternal mortality ratioe (per
100 000 live births)
Proportion of births
attended by skilled health
personnelf (%)
Under-five mortality rateg
(per 1000 live births)
Neonatal mortality rateg (per 1000 live
births)
New HIV infectionsh (per 1000 uninfected population)
Tuberculosis incidencei
(per 100 000 population)
Malaria incidencej (per 1000
population at risk)
Hepatitis B surface antigen
(HBsAg) prevalence
among children under 5 yearsk
(%)
Reported number
of people requiring
interventions against NTDsl
Probability of dying
from any of CVD, cancer,
diabetes, CRD between age 30 and exact age 70c,m (%)
Suicide mortality
ratec,m (per 100 000
population)
Total alcohol per capita
(>= 15 years of age) consumptionn
(litres of pure alcohol)
Total populationa
(000s)
Life expectancy at birthb,c (years)
Male Female Both sexes
Data type Comparable estimates Comparable estimates
Comparable estimates
Comparable estimates
Comparable estimates
Comparable estimates Primary data
Comparable estimates
Comparable estimates
Comparable estimates
Comparable estimates
Comparable estimates
Comparable estimates Other data
Comparable estimates
Comparable estimates
Comparable estimates
Member State 2016 2016 2016 2015 2015 2015 2007–2017 2016 2016 2016 2016 2016 2015 2016 2016 2016 2016
Ecuador 16 385 74.1 78.9 76.5 67.9 530 8.5 64 97 20.9 11.2 0.12 50 3.8 0.32 1 942 753 13.0 7.1 4.4 Ecuador
Egypt 95 689 68.2 73.0 70.5 61.1 157 4.2 33 92 22.8 12.8 0.02 14 – 0.80 1 673 826 27.7 4.0 0.4 Egypt
El Salvador 6 345 69.0 78.1 73.7 65.5 283 6.9 54 100 15.0 7.5 0.16 60 <0.1 0.57 742 568 14.0 13.7 3.7 El Salvador
Equatorial Guinea 1 221 57.9 61.7 59.5 53.8 280 2.7 342 68af 90.9 32.0 2.71 181 238.8 8.66 428 948 22.0 16.4 11.3 Equatorial Guinea
Eritrea 4 955 62.9 67.1 65.0 57.4 31 3.3 501 34 44.5 17.7 0.15 74 17.2 0.74 1 497 725 23.9 7.9 1.3 Eritrea
Estonia 1 312 73.0 82.1 77.8 68.2 1 112 6.5 9 99ag 2.9 1.3 – 16 – 0.36 0 17.0 17.8 11.6 Estonia
Ethiopia 102 403 63.7 67.3 65.5 57.5 24 4.0 353 28af 58.4 27.6 0.33 177 53.1 2.61 74 204 513 18.3 7.2 2.8 Ethiopia
Fiji 899 67.1 73.1 69.9 61.3 175 3.6 30 100af 22.0 8.8 0.12 59 – 0.34 905 113 30.6 5.0 3.0 Fiji
Finland 5 503 78.7 84.2 81.4 71.7 4 005 9.4 3 100ag 2.3 1.2 – 4.7 – 1.05 4 10.2 15.9 10.7 Finland
France 64 721 80.1 85.7 82.9 73.4 4 026 11.1 8 97ag 3.9 2.4 0.09 7.7 – 0.01 49 10.6 17.7 12.6 France
Gabon 1 980 64.8 68.2 66.4 58.7 198 2.7 291 89af 47.4 21.8 0.92 485 206.2 4.16 694 499 14.4 7.1 11.5 Gabon
Gambia 2 039 60.6 63.3 61.9 54.4 32 6.7 706 57 65.3 27.5 0.65 174 129.6 1.17 177 144 20.4 5.1 3.8 Gambia
Georgia 3 925 68.3 76.8 72.6 64.9 281 7.9 36 100 10.7 7.1 0.28 92 0.0 0.26 412 310 24.9 8.2 9.8 Georgia
Germany 81 915 78.7 83.3 81.0 71.6 4 592 11.2 6 99ag 3.8 2.3 – 8.1 – 0.24 111 12.1 13.6 13.4 Germany
Ghana 28 207 62.5 64.4 63.4 56.4 80 5.9 319 71 58.8 26.9 0.78 156 285.6 3.61 15 536 910 20.8 5.4 2.7 Ghana
Greece 11 184 78.7 83.7 81.2 72.0 1 505 8.4 3 – 3.8 2.3 – 4.4 – 0.37 77 12.4 5.0 10.4 Greece
Grenada 107 71.0 75.9 73.4 64.7 460 5.0 27 99ag 16.0 8.3 – 6.4 – 0.47 151 21.4 1.7 9.3 Grenada
Guatemala 16 582 70.4 76.0 73.2 64.2 224 5.7 88 66 28.5 14.0 0.18 24 0.8 0.05 3 265 661 14.9 2.7 2.4 Guatemala
Guinea 12 396 59.4 60.2 59.8 52.2 25 4.5 679 72af 89.0 25.1 0.67 176 386.5 7.47 7 246 135 22.4 6.3 1.3 Guinea
Guinea–Bissau 1 816 58.4 61.2 59.8 51.7 39 6.9 549 45af 88.1 38.2 0.72 374 73.0 2.12 1 576 882 20.0 4.0 4.8 Guinea–Bissau
Guyana 773 63.6 69.0 66.2 58.3 184 4.5 229 86 32.4 20.0 0.77 93 77.7 0.95 720 459 30.5 29.2 6.3 Guyana
Haiti 10 847 61.3 65.7 63.5 55.3 54 6.9 359 42af 67.0 24.6 0.77 188 13.9 2.04 7 581 135 26.5 11.7 5.8 Haiti
Honduras 9 113 72.9 77.5 75.2 66.8 177 7.6 129 83 18.7 10.4 0.11 40 1.7 0.25 2 752 416 14.0 2.9 4.0 Honduras
Hungary 9 753 72.3 79.4 76.0 66.8 894 7.2 17 99af 5.2 2.8 – 8.8 – 0.44 5 23.0 19.1 11.4 Hungary
Iceland 332 80.9 83.9 82.4 73.0 4 375 8.6 3 98ag 2.1 1.0 – 2.1 – 0.88 0 9.1 14.0 9.1 Iceland
India 1 324 171 67.4 70.3 68.8 59.3 63 3.9 174 86af 43.0 25.4 0.06 211 18.8 0.51 458 855 231 23.3 16.3 5.7 India
Indonesia 261 115 67.3 71.4 69.3 61.7 112 3.3 126 93 26.4 13.7 0.19 391 9.2 1.07 101 813 236 26.4 3.4 0.8 Indonesia
Iran (Islamic Republic of) 80 277 74.6 76.9 75.7 65.4 366 7.6 25 99af 15.1 9.6 0.06 14 0.2 0.02 0 14.8 4.1 1.0 Iran (Islamic Republic of)
Iraq 37 203 67.5 72.2 69.8 59.0 154 3.4 50 70ag 31.2 18.2 – 43 0.0 0.06 2 170 486 21.3 3.0 0.4 Iraq
Ireland 4 726 79.7 83.4 81.5 72.1 4 757 7.8 8 100ag 3.6 2.2 0.06 7.1 – 0.01 2 10.3 11.5 13.0 Ireland
Israel 8 192 80.3 84.2 82.3 72.9 2 756 7.4 5 – 3.6 2.0 – 3.5 – 0.48 233 9.6 5.4 3.8 Israel
Italy 59 430 80.5 84.9 82.8 73.2 2 700 9.0 4 100ag 3.3 2.0 0.06 6.1 – 0.61 12 9.5 8.2 7.5 Italy
Jamaica 2 881 73.6 78.5 76.0 66.9 294 5.9 89 99af 15.3 10.9 0.63 4.5 – 0.16 347 536 14.7 2.2 4.2 Jamaica
Japan 127 749 81.1 87.1 84.2 74.8 3 733 10.9 5 100ag 2.7 0.9 – 16 – 1.95 5 8.4 18.5 8.0 Japan
Jordan 9 456 72.7 76.0 74.3 66.4 257 6.3 58 100 17.6 10.6 <0.01 5.6 – 1.01 126 19.2 2.9 0.7 Jordan
Kazakhstan 17 988 66.8 75.3 71.1 63.4 379 3.9 12 99 11.4 5.9 0.16 67 – 0.21 185 26.8 22.5 7.7 Kazakhstan
Kenya 48 462 64.4 68.9 66.7 58.9 70 5.2 510 62 49.2 22.6 1.46 348 85.3 0.86 11 770 703 13.4 3.2 3.4 Kenya
Kiribati 114 63.6 68.6 66.1 57.8 108 7.6 90 98af 54.3 22.6 – 566 – 3.65 117 424 28.4 14.4 0.4 Kiribati
Kuwait 4 053 73.9 76.0 74.8 66.3 1 169 4.0 4 100ag 8.4 4.4 0.02 24 – 0.11 6 17.4 2.3 0.0 Kuwait
Kyrgyzstan 5 956 67.7 75.2 71.4 63.5 92 8.2 76 98 21.1 11.6 0.13 145 0.0 0.50 113 625 24.9 8.3 6.2 Kyrgyzstan
Lao People's Democratic Republic 6 758 64.2 67.4 65.8 57.9 53 2.8 197 40 63.9 28.7 0.10 175 7.8 1.94 2 206 011 27.0 8.6 10.4 Lao People's Democratic
Republic
Latvia 1 971 70.0 79.6 75.0 66.2 784 5.8 18 100ag 4.6 2.4 0.23 37 – 0.51 11 21.9 21.2 12.9 Latvia
Lebanon 6 007 75.1 77.7 76.3 66.1 645 7.4 15 – 8.1 4.7 0.02 12 – 0.21 1 17.9 3.3 1.5 Lebanon
Lesotho 2 204 51.0 54.6 52.9 46.6 91 8.4 487 78 93.5 38.5 12.68 724 – 1.64 530 557 26.6 21.2 5.0 Lesotho
Liberia 4 614 62.0 63.9 62.9 54.5 69 15.2 725 61 67.4 22.8 0.66 308 237.0 7.75 2 919 973 17.6 6.8 5.8 Liberia
Libya 6 293 69.0 75.0 71.9 62.3 – – 9 100af 12.9 7.1 – 40 – 0.27 1 20.1 5.2 0.0 Libya
Lithuania 2 908 69.7 80.2 75.0 66.1 923 6.5 10 100af 5.3 2.5 0.09 53 – 0.19 26 20.7 31.9 15.0 Lithuania
Luxembourg 576 80.1 84.6 82.4 72.6 6 236 6.0 10 100ag 2.4 1.5 0.18 5.8 – 0.24 0 10.0 13.5 13.0 Luxembourg
Madagascar 24 895 64.6 67.6 66.1 58.3 21 5.2 353 44 46.4 18.6 0.18 237 64.4 4.36 18 863 123 22.9 3.9 1.9 Madagascar
Malawi 18 092 61.4 66.8 64.2 56.2 34 9.3 634 90af 55.1 23.1 2.29 159 249.1 3.03 11 435 030 16.4 3.7 3.7 Malawi
Malaysia 31 187 73.2 77.6 75.3 66.6 386 4.0 40 99af 8.3 4.4 0.19 92 0.2 0.17 120 318 17.2 5.5 0.9 Malaysia
Maldives 428 77.2 79.9 78.4 69.8 944 11.5 68 96 8.5 4.8 – 49 – 0.19 1 937 13.4 2.3 2.7 Maldives
Mali 17 995 57.5 58.4 58.0 50.7 42 5.8 587 44 110.6 35.7 0.33 56 459.7 4.88 18 605 778 24.6 4.8 1.3 Mali
Malta 429 79.6 83.3 81.5 72.2 2 304 9.6 9 100ag 6.8 4.6 0.06 13 – 0.39 1 10.8 7.5 8.1 Malta

64 WORLD HEALTH STATISTICS: 2018
3.1 3.2 3.2 3.3 3.4 3.5
Member State
ANNEX BPart 1
Healthy life expectancy at birthb,c (years)
Current health expenditure (CHE) per
capitad (US$)
Current health expenditure
(CHE) as percentage
of gross domestic product
(GDP)d (%)
Maternal mortality ratioe (per
100 000 live births)
Proportion of births
attended by skilled health
personnelf (%)
Under-five mortality rateg
(per 1000 live births)
Neonatal mortality rateg (per 1000 live
births)
New HIV infectionsh (per 1000 uninfected population)
Tuberculosis incidencei
(per 100 000 population)
Malaria incidencej (per 1000
population at risk)
Hepatitis B surface antigen
(HBsAg) prevalence
among children under 5 yearsk
(%)
Reported number
of people requiring
interventions against NTDsl
Probability of dying
from any of CVD, cancer,
diabetes, CRD between age 30 and exact age 70c,m (%)
Suicide mortality
ratec,m (per 100 000
population)
Total alcohol per capita
(>= 15 years of age) consumptionn
(litres of pure alcohol)
Total populationa
(000s)
Life expectancy at birthb,c (years)
Male Female Both sexes
Data type Comparable estimates Comparable estimates
Comparable estimates
Comparable estimates
Comparable estimates
Comparable estimates Primary data
Comparable estimates
Comparable estimates
Comparable estimates
Comparable estimates
Comparable estimates
Comparable estimates Other data
Comparable estimates
Comparable estimates
Comparable estimates
Member State 2016 2016 2016 2015 2015 2015 2007–2017 2016 2016 2016 2016 2016 2015 2016 2016 2016 2016
Marshall Islands 53 – – – – 747 22.1 – 90 35.4 16.4 – 422 – 1.56 19 594 – – – Marshall Islands
Mauritania 4 301 62.6 65.2 63.9 56.4 54 4.6 602 69 81.4 33.7 0.12 102 88.5 4.29 589 697 18.1 4.4 0.0 Mauritania
Mauritius 1 262 71.6 78.1 74.8 65.8 506 5.5 53 100af 13.7 8.4 – 22 – 0.61 0 22.6 7.8 3.6 Mauritius
Mexico 127 540 74.0 79.2 76.6 67.7 535 5.9 38 98 14.6 7.8 0.10 22 0.4 0.04 9 532 039 15.7 5.1 6.5 Mexico
Micronesia (Federated States of) 105 68.4 70.8 69.6 61.1 395 13.1 100 100af 33.3 17.2 – 177 – 0.89 70 736 26.1 11.1 2.5 Micronesia (Federated
States of)
Monaco 38 – – – – 3 316 2.0 – – 3.4 1.8 – 0 – 0.20 0 – – – Monaco
Mongolia 3 027 65.7 74.2 69.8 61.9 152 3.9 44 99 17.9 9.7 0.01 183 – 1.72 0 30.2 13.0 7.4 Mongolia
Montenegro 629 74.4 79.2 76.8 68.1 382 6.0 7 99 3.8 2.4 0.11 16 – 0.65 6 20.6 10.3 8.0 Montenegro
Morocco 35 277 74.8 77.0 76.0 65.3 160 5.5 121 74 27.1 17.8 0.03 103 – 0.45 25 12.4 2.9 0.6 Morocco
Mozambique 28 829 57.7 62.3 60.1 52.2 28 5.4 489 54af 71.3 27.1 3.63 551 307.8 3.67 23 920 538 18.4 4.9 2.4 Mozambique
Myanmar 52 885 64.6 68.9 66.8 58.4 59 4.9 178 60af 50.8 24.5 0.22 361 7.2 2.03 39 343 021 24.2 7.8 4.8 Myanmar
Namibia 2 480 61.1 66.1 63.7 55.9 423 8.9 265 88 45.2 17.8 4.37 446 29.3 0.66 1 097 233 21.3 8.7 9.8 Namibia
Nauru 11 – – – – 812 4.8 – 97af 34.6 22.2 – 112 – 2.11 2 844 – – 6.0 Nauru
Nepal 28 983 68.8 71.6 70.2 61.3 44 6.1 258 58af 34.5 21.1 0.03 154 0.9 0.31 17 552 881 21.8 8.8 2.0 Nepal
Netherlands 16 987 80.0 83.2 81.6 72.1 4 746 10.7 7 – 3.8 2.5 0.03 5.9 – 0.04 38 11.2 12.6 8.7 Netherlands
New Zealand 4 661 80.5 84.0 82.2 72.8 3 554 9.3 11 96ag 5.4 3.0 – 7.3 – 1.20 0 10.1 12.1 10.7 New Zealand
Nicaragua 6 150 72.5 78.4 75.5 66.9 163 7.8 150 88af 19.7 8.8 0.06 48 7.8 0.14 926 646 14.2 12.2 5.2 Nicaragua
Niger 20 673 59.0 60.8 59.8 52.5 26 7.2 553 40 91.3 25.7 0.09 93 378.9 6.01 15 233 885 20.0 4.6 0.5 Niger
Nigeria 185 990 54.7 55.7 55.2 48.9 97 3.6 814 43 104.3 34.1 1.23 219 349.6 2.61 128 936 746 22.5 9.5 13.4 Nigeria
Niue 2 – – – – 867 6.3 – 100af 22.2 11.6 – 20 – 0.24 1 – – 7.0 Niue
Norway 5 255 80.6 84.3 82.5 73.0 7 464 10.0 5 99ag 2.6 1.5 – 6.1 – 0.01 3 9.2 12.2 7.5 Norway
Oman 4 425 75.3 79.5 77.0 65.6 636 3.8 17 100af 10.7 5.2 – 9 – 0.44 0 17.8 3.9 0.8 Oman
Pakistan 193 203 65.7 67.4 66.5 57.7 38 2.7 178 55af 78.8 45.6 0.10 268 10.6 2.75 31 683 212 24.7 2.9 0.3 Pakistan
Palau 22 – – – – 1 420 10.6 – 100 15.9 8.4 – 123 – 0.21 41 – – – Palau
Panama 4 034 75.0 81.2 78.0 69.4 921 7.0 94 95 16.4 9.6 0.34 55 0.4 0.22 453 129 13.0 4.3 7.9 Panama
Papua New Guinea 8 085 63.6 68.3 65.9 58.0 77 3.8 215 40ag 54.3 23.5 0.37 432 179.4 2.24 6 528 722 30.0 6.0 1.2 Papua New Guinea
Paraguay 6 725 72.4 76.1 74.2 65.3 321 7.8 132 96 19.9 11.1 0.20 42 0.0 0.65 790 833 17.5 9.5 7.2 Paraguay
Peru 31 774 73.4 78.3 75.9 67.5 323 5.3 68 92 15.3 7.5 0.09 117 17.8 0.24 2 814 779 12.6 4.9 6.3 Peru
Philippines 103 320 66.2 72.6 69.3 61.7 127 4.4 114 73 27.1 12.6 0.11 554 0.5 1.07 49 110 117 26.8 3.2 6.6 Philippines
Poland 38 224 73.8 81.6 77.8 68.5 797 6.3 3 100ag 4.7 2.8 – 18 – 0.04 64 18.7 16.2 11.6 Poland
Portugal 10 372 78.3 84.5 81.5 72.0 1 722 9.0 10 99ag 3.5 2.1 – 20 – 0.10 6 11.1 14.0 12.3 Portugal
Qatar 2 570 77.3 79.9 78.1 68.6 2 030 3.1 13 100 8.5 4.1 0.02 23 – 0.20 36 15.3 6.6 2.0 Qatar
Republic of Korea 50 792 79.5 85.6 82.7 73.0 2 013 7.4 11 100ag 3.4 1.5 – 77 0.3 0.69 323 7.8 26.9 10.2 Republic of Korea
Republic of Moldova 4 060 67.6 75.3 71.5 63.6 186 10.2 23 100af 15.9 11.9 0.38 101 – 0.65 0 24.9 15.9 15.2 Republic of Moldova
Romania 19 778 71.6 79.0 75.2 66.6 442 5.0 31 95af 9.0 4.3 0.04 74 – 0.65 13 21.4 10.4 12.6 Romania
Russian Federation 143 965 66.4 77.2 71.9 63.5 524 5.6 25 100af 7.7 3.4 – 66 – 0.88 0 25.4 31.0 11.7 Russian Federation
Rwanda 11 918 66.1 69.9 68.0 59.9 57 7.9 290 91af 38.5 16.5 0.70 50 392.7 1.74 5 190 529 18.2 6.7 9.0 Rwanda
Saint Kitts and Nevis 55 – – – – 907 5.6 – 100af 9.3 5.9 – 0 – 0.38 136 – – 9.4 Saint Kitts and Nevis
Saint Lucia 178 73.0 78.3 75.6 66.4 482 6.0 48 99 13.3 9.2 – 1.9 – 0.39 26 921 18.8 7.8 9.9 Saint Lucia
Saint Vincent and the Grenadines 110 69.4 74.9 72.0 63.4 284 4.2 45 99af 16.6 10.3 – 6.3 – 0.42 89 23.2 2.4 8.2 Saint Vincent and the
Grenadines
Samoa 195 72.0 78.4 75.1 66.0 223 5.6 51 82af 17.3 9.2 – 7.7 – 1.05 61 325 20.6 4.4 2.5 Samoa
San Marino 33 – – – – 3 243 6.8 – – 2.8 0.6 – 0 – 0.32 0 – – – San Marino
Sao Tome and Principe 200 66.7 70.7 68.7 60.7 160 9.8 156 92af 33.8 15.0 – 99 11.2 1.36 200 169 18.5 2.3 6.8 Sao Tome and Principe
Saudi Arabia 32 276 73.5 76.5 74.8 65.7 1 194 5.8 12 98af 12.9 6.9 0.02 10 0.2 0.30 0 16.4 3.2 0.2 Saudi Arabia
Senegal 15 412 64.7 68.7 66.8 58.8 36 4.0 315 59 47.1 20.6 0.08 140 49.0 3.48 11 635 621 18.1 6.0 0.7 Senegal
Serbia 8 820 73.8 78.9 76.3 67.4 491 9.4 17 100af 5.8 3.7 0.03 19 – 0.11 0 19.1 15.6 11.1 Serbia
Seychelles 94 69.0 78.0 73.3 65.7 492 3.4 – 99af 14.3 9.0 – 15 – 0.15 0 21.2 9.3 12.0 Seychelles
Sierra Leone 7 396 52.5 53.8 53.1 47.6 107 18.3 1 360 60 113.5 33.2 0.86 304 303.5 8.18 7 651 657 30.5 9.7 5.7 Sierra Leone
Singapore 5 622 80.8 85.0 82.9 76.2 2 280 4.3 10 100ag 2.8 1.1 – 51 – 0.47 13 098 9.3 9.9 2.0 Singapore
Slovakia 5 444 73.8 80.9 77.4 68.3 1 108 6.9 6 98af 5.9 3.0 0.02 5.9 – 0.56 4 17.2 12.8 11.5 Slovakia
Slovenia 2 078 78.0 83.7 80.9 70.5 1 772 8.5 9 100ag 2.3 1.3 0.03 6.5 – 1.04 3 12.7 18.6 12.6 Slovenia
Solomon Islands 599 69.7 72.7 71.1 61.9 152 8.0 114 86af 25.8 10.4 – 84 144.8 2.93 518 106 23.8 4.7 1.4 Solomon Islands
Somalia 14 318 53.7 57.3 55.4 50.0 – – 732 – 132.5 38.8 0.17 270 60.2 10.54 5 163 752 21.8 4.7 0.0 Somalia
South Africa 56 015 60.2 67.0 63.6 55.7 471 8.2 138 97 43.3 12.4 5.58 781 1.1 1.74 6 784 419 26.2 11.6 9.3 South Africa

65MONITORING HEALTH FOR THE SDGs
3.1 3.2 3.2 3.3 3.4 3.5
Member State
ANNEX BPart 1
Healthy life expectancy at birthb,c (years)
Current health expenditure (CHE) per
capitad (US$)
Current health expenditure
(CHE) as percentage
of gross domestic product
(GDP)d (%)
Maternal mortality ratioe (per
100 000 live births)
Proportion of births
attended by skilled health
personnelf (%)
Under-five mortality rateg
(per 1000 live births)
Neonatal mortality rateg (per 1000 live
births)
New HIV infectionsh (per 1000 uninfected population)
Tuberculosis incidencei
(per 100 000 population)
Malaria incidencej (per 1000
population at risk)
Hepatitis B surface antigen
(HBsAg) prevalence
among children under 5 yearsk
(%)
Reported number
of people requiring
interventions against NTDsl
Probability of dying
from any of CVD, cancer,
diabetes, CRD between age 30 and exact age 70c,m (%)
Suicide mortality
ratec,m (per 100 000
population)
Total alcohol per capita
(>= 15 years of age) consumptionn
(litres of pure alcohol)
Total populationa
(000s)
Life expectancy at birthb,c (years)
Male Female Both sexes
Data type Comparable estimates Comparable estimates
Comparable estimates
Comparable estimates
Comparable estimates
Comparable estimates Primary data
Comparable estimates
Comparable estimates
Comparable estimates
Comparable estimates
Comparable estimates
Comparable estimates Other data
Comparable estimates
Comparable estimates
Comparable estimates
Member State 2016 2016 2016 2015 2015 2015 2007–2017 2016 2016 2016 2016 2016 2015 2016 2016 2016 2016
Marshall Islands 53 – – – – 747 22.1 – 90 35.4 16.4 – 422 – 1.56 19 594 – – – Marshall Islands
Mauritania 4 301 62.6 65.2 63.9 56.4 54 4.6 602 69 81.4 33.7 0.12 102 88.5 4.29 589 697 18.1 4.4 0.0 Mauritania
Mauritius 1 262 71.6 78.1 74.8 65.8 506 5.5 53 100af 13.7 8.4 – 22 – 0.61 0 22.6 7.8 3.6 Mauritius
Mexico 127 540 74.0 79.2 76.6 67.7 535 5.9 38 98 14.6 7.8 0.10 22 0.4 0.04 9 532 039 15.7 5.1 6.5 Mexico
Micronesia (Federated States of) 105 68.4 70.8 69.6 61.1 395 13.1 100 100af 33.3 17.2 – 177 – 0.89 70 736 26.1 11.1 2.5 Micronesia (Federated
States of)
Monaco 38 – – – – 3 316 2.0 – – 3.4 1.8 – 0 – 0.20 0 – – – Monaco
Mongolia 3 027 65.7 74.2 69.8 61.9 152 3.9 44 99 17.9 9.7 0.01 183 – 1.72 0 30.2 13.0 7.4 Mongolia
Montenegro 629 74.4 79.2 76.8 68.1 382 6.0 7 99 3.8 2.4 0.11 16 – 0.65 6 20.6 10.3 8.0 Montenegro
Morocco 35 277 74.8 77.0 76.0 65.3 160 5.5 121 74 27.1 17.8 0.03 103 – 0.45 25 12.4 2.9 0.6 Morocco
Mozambique 28 829 57.7 62.3 60.1 52.2 28 5.4 489 54af 71.3 27.1 3.63 551 307.8 3.67 23 920 538 18.4 4.9 2.4 Mozambique
Myanmar 52 885 64.6 68.9 66.8 58.4 59 4.9 178 60af 50.8 24.5 0.22 361 7.2 2.03 39 343 021 24.2 7.8 4.8 Myanmar
Namibia 2 480 61.1 66.1 63.7 55.9 423 8.9 265 88 45.2 17.8 4.37 446 29.3 0.66 1 097 233 21.3 8.7 9.8 Namibia
Nauru 11 – – – – 812 4.8 – 97af 34.6 22.2 – 112 – 2.11 2 844 – – 6.0 Nauru
Nepal 28 983 68.8 71.6 70.2 61.3 44 6.1 258 58af 34.5 21.1 0.03 154 0.9 0.31 17 552 881 21.8 8.8 2.0 Nepal
Netherlands 16 987 80.0 83.2 81.6 72.1 4 746 10.7 7 – 3.8 2.5 0.03 5.9 – 0.04 38 11.2 12.6 8.7 Netherlands
New Zealand 4 661 80.5 84.0 82.2 72.8 3 554 9.3 11 96ag 5.4 3.0 – 7.3 – 1.20 0 10.1 12.1 10.7 New Zealand
Nicaragua 6 150 72.5 78.4 75.5 66.9 163 7.8 150 88af 19.7 8.8 0.06 48 7.8 0.14 926 646 14.2 12.2 5.2 Nicaragua
Niger 20 673 59.0 60.8 59.8 52.5 26 7.2 553 40 91.3 25.7 0.09 93 378.9 6.01 15 233 885 20.0 4.6 0.5 Niger
Nigeria 185 990 54.7 55.7 55.2 48.9 97 3.6 814 43 104.3 34.1 1.23 219 349.6 2.61 128 936 746 22.5 9.5 13.4 Nigeria
Niue 2 – – – – 867 6.3 – 100af 22.2 11.6 – 20 – 0.24 1 – – 7.0 Niue
Norway 5 255 80.6 84.3 82.5 73.0 7 464 10.0 5 99ag 2.6 1.5 – 6.1 – 0.01 3 9.2 12.2 7.5 Norway
Oman 4 425 75.3 79.5 77.0 65.6 636 3.8 17 100af 10.7 5.2 – 9 – 0.44 0 17.8 3.9 0.8 Oman
Pakistan 193 203 65.7 67.4 66.5 57.7 38 2.7 178 55af 78.8 45.6 0.10 268 10.6 2.75 31 683 212 24.7 2.9 0.3 Pakistan
Palau 22 – – – – 1 420 10.6 – 100 15.9 8.4 – 123 – 0.21 41 – – – Palau
Panama 4 034 75.0 81.2 78.0 69.4 921 7.0 94 95 16.4 9.6 0.34 55 0.4 0.22 453 129 13.0 4.3 7.9 Panama
Papua New Guinea 8 085 63.6 68.3 65.9 58.0 77 3.8 215 40ag 54.3 23.5 0.37 432 179.4 2.24 6 528 722 30.0 6.0 1.2 Papua New Guinea
Paraguay 6 725 72.4 76.1 74.2 65.3 321 7.8 132 96 19.9 11.1 0.20 42 0.0 0.65 790 833 17.5 9.5 7.2 Paraguay
Peru 31 774 73.4 78.3 75.9 67.5 323 5.3 68 92 15.3 7.5 0.09 117 17.8 0.24 2 814 779 12.6 4.9 6.3 Peru
Philippines 103 320 66.2 72.6 69.3 61.7 127 4.4 114 73 27.1 12.6 0.11 554 0.5 1.07 49 110 117 26.8 3.2 6.6 Philippines
Poland 38 224 73.8 81.6 77.8 68.5 797 6.3 3 100ag 4.7 2.8 – 18 – 0.04 64 18.7 16.2 11.6 Poland
Portugal 10 372 78.3 84.5 81.5 72.0 1 722 9.0 10 99ag 3.5 2.1 – 20 – 0.10 6 11.1 14.0 12.3 Portugal
Qatar 2 570 77.3 79.9 78.1 68.6 2 030 3.1 13 100 8.5 4.1 0.02 23 – 0.20 36 15.3 6.6 2.0 Qatar
Republic of Korea 50 792 79.5 85.6 82.7 73.0 2 013 7.4 11 100ag 3.4 1.5 – 77 0.3 0.69 323 7.8 26.9 10.2 Republic of Korea
Republic of Moldova 4 060 67.6 75.3 71.5 63.6 186 10.2 23 100af 15.9 11.9 0.38 101 – 0.65 0 24.9 15.9 15.2 Republic of Moldova
Romania 19 778 71.6 79.0 75.2 66.6 442 5.0 31 95af 9.0 4.3 0.04 74 – 0.65 13 21.4 10.4 12.6 Romania
Russian Federation 143 965 66.4 77.2 71.9 63.5 524 5.6 25 100af 7.7 3.4 – 66 – 0.88 0 25.4 31.0 11.7 Russian Federation
Rwanda 11 918 66.1 69.9 68.0 59.9 57 7.9 290 91af 38.5 16.5 0.70 50 392.7 1.74 5 190 529 18.2 6.7 9.0 Rwanda
Saint Kitts and Nevis 55 – – – – 907 5.6 – 100af 9.3 5.9 – 0 – 0.38 136 – – 9.4 Saint Kitts and Nevis
Saint Lucia 178 73.0 78.3 75.6 66.4 482 6.0 48 99 13.3 9.2 – 1.9 – 0.39 26 921 18.8 7.8 9.9 Saint Lucia
Saint Vincent and the Grenadines 110 69.4 74.9 72.0 63.4 284 4.2 45 99af 16.6 10.3 – 6.3 – 0.42 89 23.2 2.4 8.2 Saint Vincent and the
Grenadines
Samoa 195 72.0 78.4 75.1 66.0 223 5.6 51 82af 17.3 9.2 – 7.7 – 1.05 61 325 20.6 4.4 2.5 Samoa
San Marino 33 – – – – 3 243 6.8 – – 2.8 0.6 – 0 – 0.32 0 – – – San Marino
Sao Tome and Principe 200 66.7 70.7 68.7 60.7 160 9.8 156 92af 33.8 15.0 – 99 11.2 1.36 200 169 18.5 2.3 6.8 Sao Tome and Principe
Saudi Arabia 32 276 73.5 76.5 74.8 65.7 1 194 5.8 12 98af 12.9 6.9 0.02 10 0.2 0.30 0 16.4 3.2 0.2 Saudi Arabia
Senegal 15 412 64.7 68.7 66.8 58.8 36 4.0 315 59 47.1 20.6 0.08 140 49.0 3.48 11 635 621 18.1 6.0 0.7 Senegal
Serbia 8 820 73.8 78.9 76.3 67.4 491 9.4 17 100af 5.8 3.7 0.03 19 – 0.11 0 19.1 15.6 11.1 Serbia
Seychelles 94 69.0 78.0 73.3 65.7 492 3.4 – 99af 14.3 9.0 – 15 – 0.15 0 21.2 9.3 12.0 Seychelles
Sierra Leone 7 396 52.5 53.8 53.1 47.6 107 18.3 1 360 60 113.5 33.2 0.86 304 303.5 8.18 7 651 657 30.5 9.7 5.7 Sierra Leone
Singapore 5 622 80.8 85.0 82.9 76.2 2 280 4.3 10 100ag 2.8 1.1 – 51 – 0.47 13 098 9.3 9.9 2.0 Singapore
Slovakia 5 444 73.8 80.9 77.4 68.3 1 108 6.9 6 98af 5.9 3.0 0.02 5.9 – 0.56 4 17.2 12.8 11.5 Slovakia
Slovenia 2 078 78.0 83.7 80.9 70.5 1 772 8.5 9 100ag 2.3 1.3 0.03 6.5 – 1.04 3 12.7 18.6 12.6 Slovenia
Solomon Islands 599 69.7 72.7 71.1 61.9 152 8.0 114 86af 25.8 10.4 – 84 144.8 2.93 518 106 23.8 4.7 1.4 Solomon Islands
Somalia 14 318 53.7 57.3 55.4 50.0 – – 732 – 132.5 38.8 0.17 270 60.2 10.54 5 163 752 21.8 4.7 0.0 Somalia
South Africa 56 015 60.2 67.0 63.6 55.7 471 8.2 138 97 43.3 12.4 5.58 781 1.1 1.74 6 784 419 26.2 11.6 9.3 South Africa

66 WORLD HEALTH STATISTICS: 2018
3.1 3.2 3.2 3.3 3.4 3.5
Member State
ANNEX BPart 1
Healthy life expectancy at birthb,c (years)
Current health expenditure (CHE) per
capitad (US$)
Current health expenditure
(CHE) as percentage
of gross domestic product
(GDP)d (%)
Maternal mortality ratioe (per
100 000 live births)
Proportion of births
attended by skilled health
personnelf (%)
Under-five mortality rateg
(per 1000 live births)
Neonatal mortality rateg (per 1000 live
births)
New HIV infectionsh (per 1000 uninfected population)
Tuberculosis incidencei
(per 100 000 population)
Malaria incidencej (per 1000
population at risk)
Hepatitis B surface antigen
(HBsAg) prevalence
among children under 5 yearsk
(%)
Reported number
of people requiring
interventions against NTDsl
Probability of dying
from any of CVD, cancer,
diabetes, CRD between age 30 and exact age 70c,m (%)
Suicide mortality
ratec,m (per 100 000
population)
Total alcohol per capita
(>= 15 years of age) consumptionn
(litres of pure alcohol)
Total populationa
(000s)
Life expectancy at birthb,c (years)
Male Female Both sexes
Data type Comparable estimates Comparable estimates
Comparable estimates
Comparable estimates
Comparable estimates
Comparable estimates Primary data
Comparable estimates
Comparable estimates
Comparable estimates
Comparable estimates
Comparable estimates
Comparable estimates Other data
Comparable estimates
Comparable estimates
Comparable estimates
Member State 2016 2016 2016 2015 2015 2015 2007–2017 2016 2016 2016 2016 2016 2015 2016 2016 2016 2016
South Sudan 12 231 57.7 59.6 58.6 50.6 28 2.5 789 19af 90.7 37.9 1.35 146 159.0 21.13 9 991 337 19.8 3.7 – South Sudan
Spain 46 348 80.3 85.7 83.1 73.8 2 354 9.2 5 – 3.3 2.0 0.09 10 – 0.19 87 9.9 8.7 10.0 Spain
Sri Lanka 20 798 72.1 78.5 75.3 66.8 118 3.0 30 99 9.4 5.3 0.03 65 0.0 0.64 55 720 17.4 14.6 4.3 Sri Lanka
Sudan 39 579 63.4 66.9 65.1 55.7 152 6.3 311 78af 65.1 29.4 0.13 82 35.3 2.86 25 572 281 26.0 8.1 0.5 Sudan
Suriname 558 68.7 75.1 71.8 63.2 577 6.5 155 80ag 20.0 10.6 0.62 26 1.4 0.36 58 237 21.7 22.8 5.1 Suriname
Swaziland 1 343 55.1 59.9 57.7 50.2 233 7.0 389 88 70.4 21.4 9.37 398 1.9 0.85 198 319 26.7 13.3 9.9 Swaziland
Sweden 9 838 80.6 84.1 82.4 72.4 5 600 11.0 4 – 2.9 1.6 0.06 8.2 – 0.32 27 9.1 14.8 9.2 Sweden
Switzerland 8 402 81.2 85.2 83.3 73.5 9 818 12.1 5 – 4.1 2.9 – 7.8 – 0.17 0 8.6 17.2 11.5 Switzerland
Syrian Arab Republic 18 430 59.4 68.9 63.8 55.8 – – 68 96af 17.5 8.9 – 21 – 0.37 47 402 21.8 1.9 0.3 Syrian Arab Republic
Tajikistan 8 735 68.7 73.0 70.8 63.5 63 6.9 32 90af 43.1 19.9 0.15 85 0.0 0.71 125 863 25.3 2.5 3.3 Tajikistan
Thailand 68 864 71.8 79.3 75.5 66.8 217 3.8 20 99af 12.2 7.3 0.10 172 1.6 0.17 64 094 14.5 14.4 8.3 Thailand
The former Yugoslav Republic of Macedonia 2 081 73.8 78.0 75.9 67.1 295 6.1 8 100af 12.2 8.3 0.02 16 – 0.20 5 20.3 7.9 8.1 The former Yugoslav
Republic of Macedonia
Timor–Leste 1 269 66.8 70.4 68.6 59.2 72 3.1 215 57af 49.7 21.6 – 498 0.9 0.87 1 167 125 19.9 4.6 2.1 Timor–Leste
Togo 7 606 59.7 61.5 60.6 53.9 37 6.6 368 45 75.7 26.0 0.59 46 360.4 3.36 6 328 077 23.6 9.6 3.1 Togo
Tonga 107 70.5 76.4 73.4 64.3 221 5.9 124 96 16.4 6.8 – 8.6 – 2.35 37 131 23.3 3.5 1.5 Tonga
Trinidad and Tobago 1 365 68.2 75.6 71.8 63.3 1 146 6.0 63 100ag 18.5 12.6 0.29 18 – 0.43 19 498 21.3 13.6 8.4 Trinidad and Tobago
Tunisia 11 403 74.1 78.1 76.0 66.3 258 6.7 62 74 13.6 8.1 0.03 38 – 0.76 6 082 16.1 3.4 1.9 Tunisia
Turkey 79 512 73.3 79.4 76.4 66.0 455 4.1 16 97af 12.7 6.5 – 18 0.0 0.32 1 497 16.1 7.3 2.0 Turkey
Turkmenistan 5 663 64.7 71.7 68.2 61.4 405 6.3 42 100 51.0 22.3 – 60 – 0.23 52 29.5 6.7 5.4 Turkmenistan
Tuvalu 11 – – – – 439 15.0 – 93 25.3 17.2 – 207 – 0.70 10 782 – – 1.7 Tuvalu
Uganda 41 488 60.2 64.8 62.5 54.9 46 7.3 343 74 53.0 21.4 1.50 201 187.2 3.16 23 486 474 21.9 9.9 9.5 Uganda
Ukraine 44 439 67.6 77.1 72.5 64.0 125 6.1 24 100af 9.1 5.4 0.38 87 – 0.46 0 24.7 22.4 8.6 Ukraine
United Arab Emirates 9 270 76.5 78.7 77.2 66.7 1 402 3.5 6 100af 7.7 4.0 – 0.79 – 0.08 40 16.8 2.8 3.8 United Arab Emirates
United Kingdom 65 789 79.7 83.2 81.4 71.9 4 356 9.9 9 – 4.3 2.6 – 9.9 – 0.22 5 10.9 8.9 11.4 United Kingdom
United Republic of Tanzania 55 572 62.0 65.8 63.9 56.5 32 6.1 398 64af 56.7 21.7 1.19 287 144.2 1.69 25 008 679 17.9 5.4 9.4 United Republic of
Tanzania
United States of America 322 180 76.0 81.0 78.5 68.5 9 536 16.8 14 99 6.5 3.7 – 3.1 – 0.04 932 14.6 15.3 9.8 United States of America
Uruguay 3 444 73.2 80.8 77.1 68.8 1 281 9.2 15 100 9.2 5.0 0.15 29 – 0.35 1 340 16.7 18.4 10.8 Uruguay
Uzbekistan 31 447 69.7 75.0 72.3 64.5 134 6.2 36 100af 24.1 13.8 – 76 0.0 0.60 405 951 24.5 7.4 2.7 Uzbekistan
Vanuatu 270 70.1 74.1 72.0 62.7 99 3.5 78 89af 27.6 11.8 – 56 14.7 8.48 271 465 23.3 4.5 1.0 Vanuatu
Venezuela (Bolivarian Republic of) 31 568 69.5 79.0 74.1 66.1 973 3.2 95 96ag 16.3 10.3 0.21 32 44.7 0.62 282 294 18.1 3.7 5.6 Venezuela (Bolivarian
Republic of)
Viet Nam 94 569 71.7 80.9 76.3 67.5 117 5.7 54 94 21.6 11.5 0.12 133 0.1 1.20 6 953 978 17.1 7.3 8.3 Viet Nam
Yemen 27 584 63.9 66.8 65.3 55.1 72 6.0 385 45af 55.3 26.8 0.04 48 30.5 2.54 5 985 649 30.6 8.5 0.1 Yemen
Zambia 16 591 60.2 64.4 62.3 54.3 69 5.4 224 63 63.4 22.9 4.08 376 189.8 1.84 11 573 334 17.9 6.1 4.8 Zambia
Zimbabwe 16 150 59.6 63.1 61.4 54.4 94 10.3 443 78 56.4 22.9 3.03 208 77.9 4.38 9 958 235 19.3 10.7 4.8 Zimbabwe
WHO region WHO region
African Region 1 019 922 59.6 62.7 61.2 53.8 115 6.2 542 – 76.5 27.2 1.24 254 239.6 3.00 591 698 691 20.6 7.4 6.3 African Region
Region of the Americas 992 155 73.8 79.8 76.8 67.5 974 6.9 52 – 14.2 7.5 0.16 27 11.3 0.20 49 500 544 15.1 9.8 8.0 Region of the Americas
South-East Asia Region 1 947 632 67.9 71.3 69.5 60.4 176 4.6 164 – 38.9 22.6 0.08 240 16.5 0.70 671 797 672 23.1 13.2 4.5 South-East Asia Region
European Region 916 315 74.2 80.8 77.5 68.4 2 192 7.9 16 – 9.6 5.1 0.25 32 0.0 0.40 2 821 690 16.7 15.4 9.8 European Region
Eastern Mediterranean Region 664 336 67.7 70.7 69.1 59.7 557 5.3 166 – 51.7 27.7 0.06 114 20.5 1.60 85 715 716 22.0 3.9 0.6 Eastern Mediterranean
Region
Western Pacific Region 1 889 901 75.0 78.9 76.9 68.9 920 7.0 41 – 12.9 6.5 0.05 95 4.2 0.90 98 201 330 16.2 10.2 7.3 Western Pacific Region
Global 7 430 261 69.8 74.2 72.0 63.3 822 6.3 216 – 40.8 18.6 0.26 140 90.8 1.30 1 499 735 642 18.3 10.6 6.4 Global
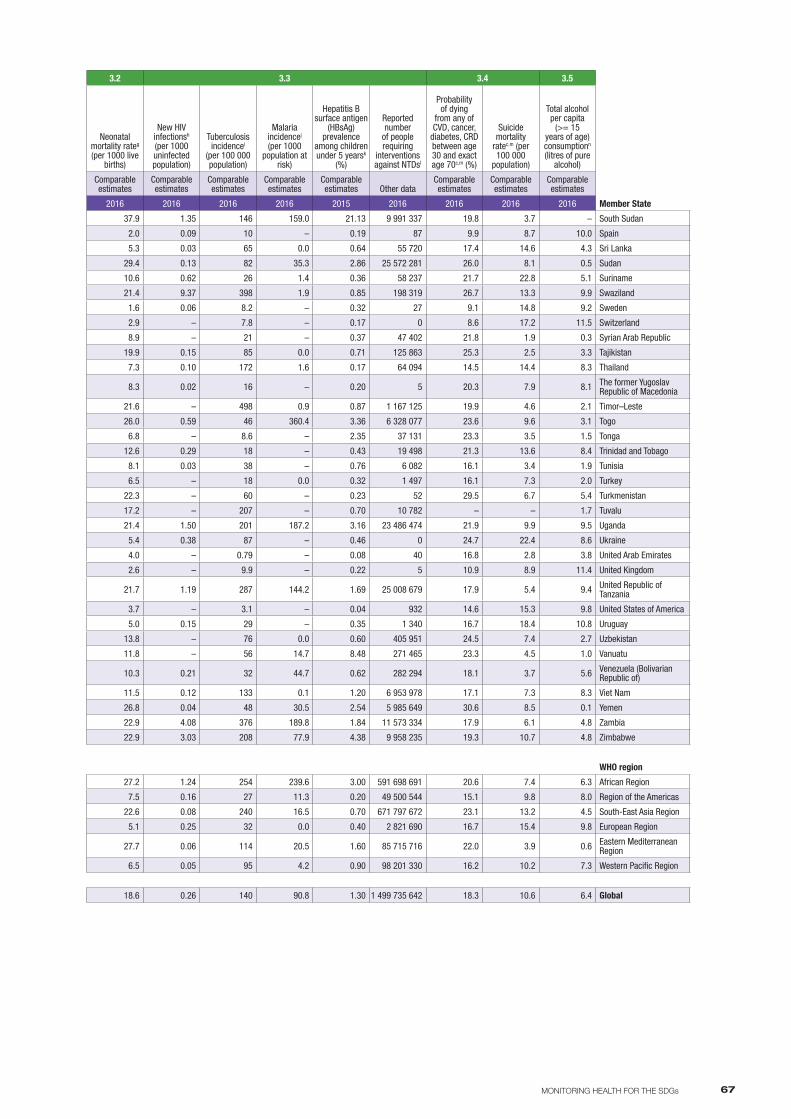
67MONITORING HEALTH FOR THE SDGs
3.1 3.2 3.2 3.3 3.4 3.5
Member State
ANNEX BPart 1
Healthy life expectancy at birthb,c (years)
Current health expenditure (CHE) per
capitad (US$)
Current health expenditure
(CHE) as percentage
of gross domestic product
(GDP)d (%)
Maternal mortality ratioe (per
100 000 live births)
Proportion of births
attended by skilled health
personnelf (%)
Under-five mortality rateg
(per 1000 live births)
Neonatal mortality rateg (per 1000 live
births)
New HIV infectionsh (per 1000 uninfected population)
Tuberculosis incidencei
(per 100 000 population)
Malaria incidencej (per 1000
population at risk)
Hepatitis B surface antigen
(HBsAg) prevalence
among children under 5 yearsk
(%)
Reported number
of people requiring
interventions against NTDsl
Probability of dying
from any of CVD, cancer,
diabetes, CRD between age 30 and exact age 70c,m (%)
Suicide mortality
ratec,m (per 100 000
population)
Total alcohol per capita
(>= 15 years of age) consumptionn
(litres of pure alcohol)
Total populationa
(000s)
Life expectancy at birthb,c (years)
Male Female Both sexes
Data type Comparable estimates Comparable estimates
Comparable estimates
Comparable estimates
Comparable estimates
Comparable estimates Primary data
Comparable estimates
Comparable estimates
Comparable estimates
Comparable estimates
Comparable estimates
Comparable estimates Other data
Comparable estimates
Comparable estimates
Comparable estimates
Member State 2016 2016 2016 2015 2015 2015 2007–2017 2016 2016 2016 2016 2016 2015 2016 2016 2016 2016
South Sudan 12 231 57.7 59.6 58.6 50.6 28 2.5 789 19af 90.7 37.9 1.35 146 159.0 21.13 9 991 337 19.8 3.7 – South Sudan
Spain 46 348 80.3 85.7 83.1 73.8 2 354 9.2 5 – 3.3 2.0 0.09 10 – 0.19 87 9.9 8.7 10.0 Spain
Sri Lanka 20 798 72.1 78.5 75.3 66.8 118 3.0 30 99 9.4 5.3 0.03 65 0.0 0.64 55 720 17.4 14.6 4.3 Sri Lanka
Sudan 39 579 63.4 66.9 65.1 55.7 152 6.3 311 78af 65.1 29.4 0.13 82 35.3 2.86 25 572 281 26.0 8.1 0.5 Sudan
Suriname 558 68.7 75.1 71.8 63.2 577 6.5 155 80ag 20.0 10.6 0.62 26 1.4 0.36 58 237 21.7 22.8 5.1 Suriname
Swaziland 1 343 55.1 59.9 57.7 50.2 233 7.0 389 88 70.4 21.4 9.37 398 1.9 0.85 198 319 26.7 13.3 9.9 Swaziland
Sweden 9 838 80.6 84.1 82.4 72.4 5 600 11.0 4 – 2.9 1.6 0.06 8.2 – 0.32 27 9.1 14.8 9.2 Sweden
Switzerland 8 402 81.2 85.2 83.3 73.5 9 818 12.1 5 – 4.1 2.9 – 7.8 – 0.17 0 8.6 17.2 11.5 Switzerland
Syrian Arab Republic 18 430 59.4 68.9 63.8 55.8 – – 68 96af 17.5 8.9 – 21 – 0.37 47 402 21.8 1.9 0.3 Syrian Arab Republic
Tajikistan 8 735 68.7 73.0 70.8 63.5 63 6.9 32 90af 43.1 19.9 0.15 85 0.0 0.71 125 863 25.3 2.5 3.3 Tajikistan
Thailand 68 864 71.8 79.3 75.5 66.8 217 3.8 20 99af 12.2 7.3 0.10 172 1.6 0.17 64 094 14.5 14.4 8.3 Thailand
The former Yugoslav Republic of Macedonia 2 081 73.8 78.0 75.9 67.1 295 6.1 8 100af 12.2 8.3 0.02 16 – 0.20 5 20.3 7.9 8.1 The former Yugoslav
Republic of Macedonia
Timor–Leste 1 269 66.8 70.4 68.6 59.2 72 3.1 215 57af 49.7 21.6 – 498 0.9 0.87 1 167 125 19.9 4.6 2.1 Timor–Leste
Togo 7 606 59.7 61.5 60.6 53.9 37 6.6 368 45 75.7 26.0 0.59 46 360.4 3.36 6 328 077 23.6 9.6 3.1 Togo
Tonga 107 70.5 76.4 73.4 64.3 221 5.9 124 96 16.4 6.8 – 8.6 – 2.35 37 131 23.3 3.5 1.5 Tonga
Trinidad and Tobago 1 365 68.2 75.6 71.8 63.3 1 146 6.0 63 100ag 18.5 12.6 0.29 18 – 0.43 19 498 21.3 13.6 8.4 Trinidad and Tobago
Tunisia 11 403 74.1 78.1 76.0 66.3 258 6.7 62 74 13.6 8.1 0.03 38 – 0.76 6 082 16.1 3.4 1.9 Tunisia
Turkey 79 512 73.3 79.4 76.4 66.0 455 4.1 16 97af 12.7 6.5 – 18 0.0 0.32 1 497 16.1 7.3 2.0 Turkey
Turkmenistan 5 663 64.7 71.7 68.2 61.4 405 6.3 42 100 51.0 22.3 – 60 – 0.23 52 29.5 6.7 5.4 Turkmenistan
Tuvalu 11 – – – – 439 15.0 – 93 25.3 17.2 – 207 – 0.70 10 782 – – 1.7 Tuvalu
Uganda 41 488 60.2 64.8 62.5 54.9 46 7.3 343 74 53.0 21.4 1.50 201 187.2 3.16 23 486 474 21.9 9.9 9.5 Uganda
Ukraine 44 439 67.6 77.1 72.5 64.0 125 6.1 24 100af 9.1 5.4 0.38 87 – 0.46 0 24.7 22.4 8.6 Ukraine
United Arab Emirates 9 270 76.5 78.7 77.2 66.7 1 402 3.5 6 100af 7.7 4.0 – 0.79 – 0.08 40 16.8 2.8 3.8 United Arab Emirates
United Kingdom 65 789 79.7 83.2 81.4 71.9 4 356 9.9 9 – 4.3 2.6 – 9.9 – 0.22 5 10.9 8.9 11.4 United Kingdom
United Republic of Tanzania 55 572 62.0 65.8 63.9 56.5 32 6.1 398 64af 56.7 21.7 1.19 287 144.2 1.69 25 008 679 17.9 5.4 9.4 United Republic of
Tanzania
United States of America 322 180 76.0 81.0 78.5 68.5 9 536 16.8 14 99 6.5 3.7 – 3.1 – 0.04 932 14.6 15.3 9.8 United States of America
Uruguay 3 444 73.2 80.8 77.1 68.8 1 281 9.2 15 100 9.2 5.0 0.15 29 – 0.35 1 340 16.7 18.4 10.8 Uruguay
Uzbekistan 31 447 69.7 75.0 72.3 64.5 134 6.2 36 100af 24.1 13.8 – 76 0.0 0.60 405 951 24.5 7.4 2.7 Uzbekistan
Vanuatu 270 70.1 74.1 72.0 62.7 99 3.5 78 89af 27.6 11.8 – 56 14.7 8.48 271 465 23.3 4.5 1.0 Vanuatu
Venezuela (Bolivarian Republic of) 31 568 69.5 79.0 74.1 66.1 973 3.2 95 96ag 16.3 10.3 0.21 32 44.7 0.62 282 294 18.1 3.7 5.6 Venezuela (Bolivarian
Republic of)
Viet Nam 94 569 71.7 80.9 76.3 67.5 117 5.7 54 94 21.6 11.5 0.12 133 0.1 1.20 6 953 978 17.1 7.3 8.3 Viet Nam
Yemen 27 584 63.9 66.8 65.3 55.1 72 6.0 385 45af 55.3 26.8 0.04 48 30.5 2.54 5 985 649 30.6 8.5 0.1 Yemen
Zambia 16 591 60.2 64.4 62.3 54.3 69 5.4 224 63 63.4 22.9 4.08 376 189.8 1.84 11 573 334 17.9 6.1 4.8 Zambia
Zimbabwe 16 150 59.6 63.1 61.4 54.4 94 10.3 443 78 56.4 22.9 3.03 208 77.9 4.38 9 958 235 19.3 10.7 4.8 Zimbabwe
WHO region WHO region
African Region 1 019 922 59.6 62.7 61.2 53.8 115 6.2 542 – 76.5 27.2 1.24 254 239.6 3.00 591 698 691 20.6 7.4 6.3 African Region
Region of the Americas 992 155 73.8 79.8 76.8 67.5 974 6.9 52 – 14.2 7.5 0.16 27 11.3 0.20 49 500 544 15.1 9.8 8.0 Region of the Americas
South-East Asia Region 1 947 632 67.9 71.3 69.5 60.4 176 4.6 164 – 38.9 22.6 0.08 240 16.5 0.70 671 797 672 23.1 13.2 4.5 South-East Asia Region
European Region 916 315 74.2 80.8 77.5 68.4 2 192 7.9 16 – 9.6 5.1 0.25 32 0.0 0.40 2 821 690 16.7 15.4 9.8 European Region
Eastern Mediterranean Region 664 336 67.7 70.7 69.1 59.7 557 5.3 166 – 51.7 27.7 0.06 114 20.5 1.60 85 715 716 22.0 3.9 0.6 Eastern Mediterranean
Region
Western Pacific Region 1 889 901 75.0 78.9 76.9 68.9 920 7.0 41 – 12.9 6.5 0.05 95 4.2 0.90 98 201 330 16.2 10.2 7.3 Western Pacific Region
Global 7 430 261 69.8 74.2 72.0 63.3 822 6.3 216 – 40.8 18.6 0.26 140 90.8 1.30 1 499 735 642 18.3 10.6 6.4 Global
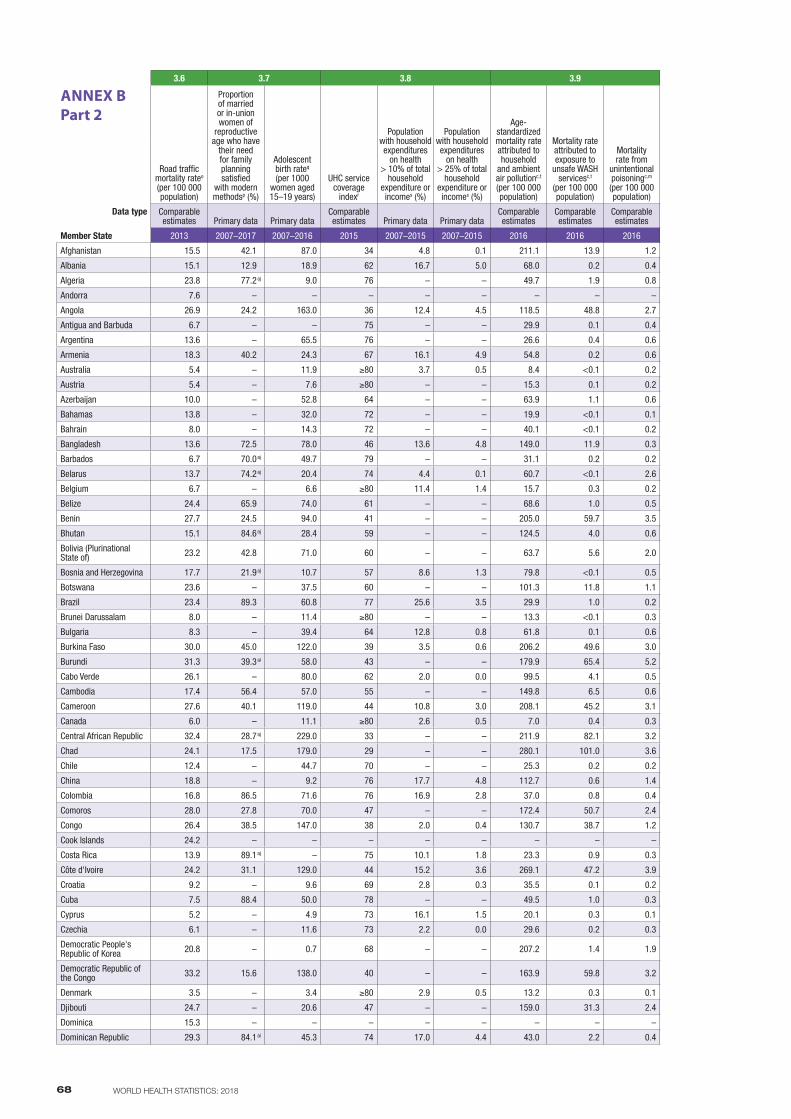
68 WORLD HEALTH STATISTICS: 2018
3.6 3.7 3.8 3.9 3.a 3.b.1 3.b.2 3.c 3.d
Member State
ANNEX BPart 2
Road traffic mortality rateo (per 100 000 population)
Proportion of married or in-union women of
reproductive age who have
their need for family planning satisfied
with modern methodsp (%)
Adolescent birth rateq (per 1000
women aged 15–19 years)
UHC service coverage
indexr
Population with household expenditures
on health > 10% of total
household expenditure or incomes (%)
Population with household expenditures
on health > 25% of total
household expenditure or incomes (%)
Age-standardized mortality rate attributed to household
and ambient air pollutionc,t (per 100 000 population)
Mortality rate attributed to exposure to
unsafe WASH servicesc,t
(per 100 000 population)
Mortality rate from
unintentional poisoningc,m (per 100 000 population)
Diphtheria-tetanus-pertussis (DTP3)
immunization coverage among
1-year-oldsv (%)
Measles-containing-
vaccine second-dose
(MCV2) immunization coverage by the nationally recommended
agev (%)
Pneumococcal conjugate 3rd dose (PCV3)
immunization coverage
among 1-year oldsv (%)
Total net official
development assistance to medical
research and basic health per capitaw (US$), by recipient country
Density of physiciansx (per 1000
population)
Density of nursing and midwifery personnelx (per 1000
population)
Density of dentistry
personnelx (per 1000
population)
Density of pharmaceutical
personnelx (per 1000
population)
Average of 13 International
Health Regulations
core capacity scoresy
Age-standardized prevalence of tobacco
smoking among persons 15 years
and olderu (%)
Male Female
Data type Comparable estimates Primary data Primary data
Comparable estimates Primary data Primary data
Comparable estimates
Comparable estimates
Comparable estimates
Comparable estimates
Comparable estimates
Comparable estimates
Comparable estimates Primary data Primary data Primary data Primary data Primary data Other data
Member State 2013 2007–2017 2007–2016 2015 2007–2015 2007–2015 2016 2016 2016 2016 2016 2016 2016 2016 2007–2016 2007–2016 2007–2016 2007–2016 2010–2017
Afghanistan 15.5 42.1 87.0 34 4.8 0.1 211.1 13.9 1.2 – – 65 39 65 5.82 0.3 0.4 0.0 0.0 42 Afghanistan
Albania 15.1 12.9 18.9 62 16.7 5.0 68.0 0.2 0.4 51.2 7.1 98 98 98 0.63 1.3 – – 0.8 46 Albania
Algeria 23.8 77.2aj 9.0 76 – – 49.7 1.9 0.8 30.4 0.7 91 96 61 0.02 1.2 1.9 0.3 0.2 75 Algeria
Andorra 7.6 – – – – – – – – 37.8 29.0 98 90 92 – 3.7 4.4 0.9 1.2 29 Andorra
Angola 26.9 24.2 163.0 36 12.4 4.5 118.5 48.8 2.7 – – 64 26 58 1.57 0.1 1.4 – – 75 Angola
Antigua and Barbuda 6.7 – – 75 – – 29.9 0.1 0.4 – – 99 87 – – – – – – 71 Antigua and Barbuda
Argentina 13.6 – 65.5 76 – – 26.6 0.4 0.6 27.7 16.2 92 88 82 0.01 3.9 4.2 – – 70 Argentina
Armenia 18.3 40.2 24.3 67 16.1 4.9 54.8 0.2 0.6 52.1 1.5 94 97 94 5.03 2.8 5.4 0.4 0.0 95 Armenia
Australia 5.4 – 11.9 ≥80 3.7 0.5 8.4 <0.1 0.2 16.5 13.0 94 94 94 – 3.5 12.6 0.6 0.8 100 Australia
Austria 5.4 – 7.6 ≥80 – – 15.3 0.1 0.2 30.9 28.4 87 89 – – 5.2 8.3 0.6 0.7 68 Austria
Azerbaijan 10.0 – 52.8 64 – – 63.9 1.1 0.6 42.5 0.3 97 98 97 0.39 3.4 6.9 0.3 0.2 84 Azerbaijan
Bahamas 13.8 – 32.0 72 – – 19.9 <0.1 0.1 20.4 3.1 94 74 94 – 2.3 4.0 0.4 0.8 78 Bahamas
Bahrain 8.0 – 14.3 72 – – 40.1 <0.1 0.2 37.6 5.8 99 99 99 – 0.9 2.5 0.2 0.2 93 Bahrain
Bangladesh 13.6 72.5 78.0 46 13.6 4.8 149.0 11.9 0.3 44.7 1.0 97 93 97 1.25 0.5 0.3 0.0 0.6 78 Bangladesh
Barbados 6.7 70.0aj 49.7 79 – – 31.1 0.2 0.2 14.5 1.9 97 87 96 – – – – – 92 Barbados
Belarus 13.7 74.2aj 20.4 74 4.4 0.1 60.7 <0.1 2.6 46.1 10.5 98 98 – 0.60 4.1 11.4 0.6 0.3 90 Belarus
Belgium 6.7 – 6.6 ≥80 11.4 1.4 15.7 0.3 0.2 31.4 25.1 98 85 94 – 3.0 11.1 0.7 1.2 83 Belgium
Belize 24.4 65.9 74.0 61 – – 68.6 1.0 0.5 – – 95 96 – 8.41 0.8 1.8 0.0 0.4 55 Belize
Benin 27.7 24.5 94.0 41 – – 205.0 59.7 3.5 12.3 0.6 82 – 75 4.39 0.2 0.6 0.0 0.0 30 Benin
Bhutan 15.1 84.6aj 28.4 59 – – 124.5 4.0 0.6 – – 98 90 – 2.57 0.4 1.5 0.1 0.0 73 Bhutan
Bolivia (Plurinational State of) 23.2 42.8 71.0 60 – – 63.7 5.6 2.0 67.3 10.5 99 – 97 1.69 0.5 1.0 0.1 0.1 76 Bolivia (Plurinational
State of)
Bosnia and Herzegovina 17.7 21.9aj 10.7 57 8.6 1.3 79.8 <0.1 0.5 47.7 30.2 78 78 – 9.93 1.9 5.9 0.2 0.1 58 Bosnia and Herzegovina
Botswana 23.6 – 37.5 60 – – 101.3 11.8 1.1 34.4 5.7 95 74 95 2.36 0.4 2.7 0.1 0.2 42 Botswana
Brazil 23.4 89.3 60.8 77 25.6 3.5 29.9 1.0 0.2 17.9 10.1 86 72 94 0.03 1.9 7.4 1.2 0.7 96 Brazil
Brunei Darussalam 8.0 – 11.4 ≥80 – – 13.3 <0.1 0.3 30.9 2.0 99 97 – – 1.7 6.5 0.4 0.2 67 Brunei Darussalam
Bulgaria 8.3 – 39.4 64 12.8 0.8 61.8 0.1 0.6 44.4 30.1 92 88 90 – 4.0 5.3 1.0 – 69 Bulgaria
Burkina Faso 30.0 45.0 122.0 39 3.5 0.6 206.2 49.6 3.0 23.9 1.6 91 50 91 9.15 0.0 0.6 0.0 0.0 45 Burkina Faso
Burundi 31.3 39.3ai 58.0 43 – – 179.9 65.4 5.2 – – 94 72 94 9.57 – – – 0.0 25 Burundi
Cabo Verde 26.1 – 80.0 62 2.0 0.0 99.5 4.1 0.5 16.5 2.1 96 95 – 0.92 0.8 1.3 0.0 0.0 65 Cabo Verde
Cambodia 17.4 56.4 57.0 55 – – 149.8 6.5 0.6 33.7 2.0 90 58 87 3.01 0.1 1.0 0.0 0.0 81 Cambodia
Cameroon 27.6 40.1 119.0 44 10.8 3.0 208.1 45.2 3.1 – – 85 – 84 2.22 0.1 0.5 0.0 0.0 57 Cameroon
Canada 6.0 – 11.1 ≥80 2.6 0.5 7.0 0.4 0.3 16.6 12.0 91 86 79 – 2.5 9.8 1.3 1.0 100 Canada
Central African Republic 32.4 28.7aj 229.0 33 – – 211.9 82.1 3.2 – – 47 – 47 10.62 0.0 0.3 0.0 0.0 27 Central African Republic
Chad 24.1 17.5 179.0 29 – – 280.1 101.0 3.6 – – 46 – – 4.16 0.0 0.3 – 0.0 44 Chad
Chile 12.4 – 44.7 70 – – 25.3 0.2 0.2 41.5 34.2 95 87 90 0.01 1.0 0.1 0.0 0.0 84 Chile
China 18.8 – 9.2 76 17.7 4.8 112.7 0.6 1.4 48.4 1.9 99 99 – 0.11 1.8 2.3 – 0.3 100 China
Colombia 16.8 86.5 71.6 76 16.9 2.8 37.0 0.8 0.4 13.5 4.7 91 87 89 0.07 1.8 1.1 1.0 – 88 Colombia
Comoros 28.0 27.8 70.0 47 – – 172.4 50.7 2.4 23.6 4.4 91 – – 8.21 – – – – 37 Comoros
Congo 26.4 38.5 147.0 38 2.0 0.4 130.7 38.7 1.2 52.3 1.7 80 – 80 1.65 0.1 0.9 – 0.0 31 Congo
Cook Islands 24.2 – – – – – – – – 29.8 21.2 99 90 – 5.02 1.2 5.8 0.9 0.4 43 Cook Islands
Costa Rica 13.9 89.1aj – 75 10.1 1.8 23.3 0.9 0.3 17.4 6.4 97 87 94 0.01 1.1 0.8 0.1 0.2 87 Costa Rica
Côte d'Ivoire 24.2 31.1 129.0 44 15.2 3.6 269.1 47.2 3.9 – – 85 – 83 4.23 0.1 0.5 0.0 0.0 87 Côte d'Ivoire
Croatia 9.2 – 9.6 69 2.8 0.3 35.5 0.1 0.2 39.9 34.3 93 96 – – 3.1 6.5 0.9 0.7 71 Croatia
Cuba 7.5 88.4 50.0 78 – – 49.5 1.0 0.3 53.3 17.1 99 99 – 0.11 7.5 8.0 1.8 0.3 99 Cuba
Cyprus 5.2 – 4.9 73 16.1 1.5 20.1 0.3 0.1 52.7 19.6 97 88 81 – 2.5 4.1 0.7 0.2 96 Cyprus
Czechia 6.1 – 11.6 73 2.2 0.0 29.6 0.2 0.3 38.3 30.5 96 93 – – 3.7 8.4 0.8 0.7 94 Czechia
Democratic People's Republic of Korea 20.8 – 0.7 68 – – 207.2 1.4 1.9 – – 96 98 – 0.90 3.5 4.2 0.2 0.4 67 Democratic People's
Republic of Korea
Democratic Republic of the Congo 33.2 15.6 138.0 40 – – 163.9 59.8 3.2 – – 79 – 77 5.27 0.1 1.0 0.0 0.0 65 Democratic Republic of
the Congo
Denmark 3.5 – 3.4 ≥80 2.9 0.5 13.2 0.3 0.1 18.8 19.3 94 85 94 – 3.7 17.0 0.8 0.5 90 Denmark
Djibouti 24.7 – 20.6 47 – – 159.0 31.3 2.4 24.5 1.7 84 82 82 11.73 0.2 0.6 0.0 0.2 33 Djibouti
Dominica 15.3 – – – – – – – – – – 99 92 – – – – – – 62 Dominica
Dominican Republic 29.3 84.1ai 45.3 74 17.0 4.4 43.0 2.2 0.4 19.1 8.5 87 – 30 0.24 1.5 1.3 0.2 – 55 Dominican Republic
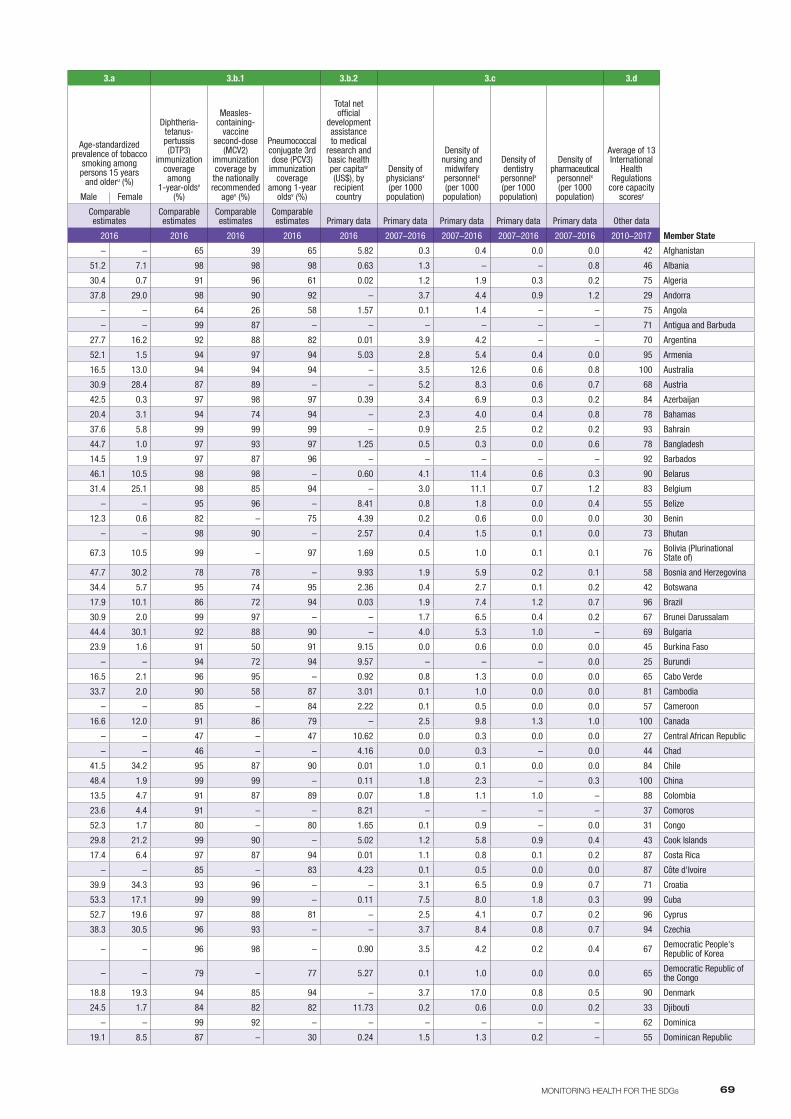
69MONITORING HEALTH FOR THE SDGs
3.6 3.7 3.8 3.9 3.a 3.b.1 3.b.2 3.c 3.d
Member State
ANNEX BPart 2
Road traffic mortality rateo (per 100 000 population)
Proportion of married or in-union women of
reproductive age who have
their need for family planning satisfied
with modern methodsp (%)
Adolescent birth rateq (per 1000
women aged 15–19 years)
UHC service coverage
indexr
Population with household expenditures
on health > 10% of total
household expenditure or incomes (%)
Population with household expenditures
on health > 25% of total
household expenditure or incomes (%)
Age-standardized mortality rate attributed to household
and ambient air pollutionc,t (per 100 000 population)
Mortality rate attributed to exposure to
unsafe WASH servicesc,t
(per 100 000 population)
Mortality rate from
unintentional poisoningc,m (per 100 000 population)
Diphtheria-tetanus-pertussis (DTP3)
immunization coverage among
1-year-oldsv (%)
Measles-containing-
vaccine second-dose
(MCV2) immunization coverage by the nationally recommended
agev (%)
Pneumococcal conjugate 3rd dose (PCV3)
immunization coverage
among 1-year oldsv (%)
Total net official
development assistance to medical
research and basic health per capitaw (US$), by recipient country
Density of physiciansx (per 1000
population)
Density of nursing and midwifery personnelx (per 1000
population)
Density of dentistry
personnelx (per 1000
population)
Density of pharmaceutical
personnelx (per 1000
population)
Average of 13 International
Health Regulations
core capacity scoresy
Age-standardized prevalence of tobacco
smoking among persons 15 years
and olderu (%)
Male Female
Data type Comparable estimates Primary data Primary data
Comparable estimates Primary data Primary data
Comparable estimates
Comparable estimates
Comparable estimates
Comparable estimates
Comparable estimates
Comparable estimates
Comparable estimates Primary data Primary data Primary data Primary data Primary data Other data
Member State 2013 2007–2017 2007–2016 2015 2007–2015 2007–2015 2016 2016 2016 2016 2016 2016 2016 2016 2007–2016 2007–2016 2007–2016 2007–2016 2010–2017
Afghanistan 15.5 42.1 87.0 34 4.8 0.1 211.1 13.9 1.2 – – 65 39 65 5.82 0.3 0.4 0.0 0.0 42 Afghanistan
Albania 15.1 12.9 18.9 62 16.7 5.0 68.0 0.2 0.4 51.2 7.1 98 98 98 0.63 1.3 – – 0.8 46 Albania
Algeria 23.8 77.2aj 9.0 76 – – 49.7 1.9 0.8 30.4 0.7 91 96 61 0.02 1.2 1.9 0.3 0.2 75 Algeria
Andorra 7.6 – – – – – – – – 37.8 29.0 98 90 92 – 3.7 4.4 0.9 1.2 29 Andorra
Angola 26.9 24.2 163.0 36 12.4 4.5 118.5 48.8 2.7 – – 64 26 58 1.57 0.1 1.4 – – 75 Angola
Antigua and Barbuda 6.7 – – 75 – – 29.9 0.1 0.4 – – 99 87 – – – – – – 71 Antigua and Barbuda
Argentina 13.6 – 65.5 76 – – 26.6 0.4 0.6 27.7 16.2 92 88 82 0.01 3.9 4.2 – – 70 Argentina
Armenia 18.3 40.2 24.3 67 16.1 4.9 54.8 0.2 0.6 52.1 1.5 94 97 94 5.03 2.8 5.4 0.4 0.0 95 Armenia
Australia 5.4 – 11.9 ≥80 3.7 0.5 8.4 <0.1 0.2 16.5 13.0 94 94 94 – 3.5 12.6 0.6 0.8 100 Australia
Austria 5.4 – 7.6 ≥80 – – 15.3 0.1 0.2 30.9 28.4 87 89 – – 5.2 8.3 0.6 0.7 68 Austria
Azerbaijan 10.0 – 52.8 64 – – 63.9 1.1 0.6 42.5 0.3 97 98 97 0.39 3.4 6.9 0.3 0.2 84 Azerbaijan
Bahamas 13.8 – 32.0 72 – – 19.9 <0.1 0.1 20.4 3.1 94 74 94 – 2.3 4.0 0.4 0.8 78 Bahamas
Bahrain 8.0 – 14.3 72 – – 40.1 <0.1 0.2 37.6 5.8 99 99 99 – 0.9 2.5 0.2 0.2 93 Bahrain
Bangladesh 13.6 72.5 78.0 46 13.6 4.8 149.0 11.9 0.3 44.7 1.0 97 93 97 1.25 0.5 0.3 0.0 0.6 78 Bangladesh
Barbados 6.7 70.0aj 49.7 79 – – 31.1 0.2 0.2 14.5 1.9 97 87 96 – – – – – 92 Barbados
Belarus 13.7 74.2aj 20.4 74 4.4 0.1 60.7 <0.1 2.6 46.1 10.5 98 98 – 0.60 4.1 11.4 0.6 0.3 90 Belarus
Belgium 6.7 – 6.6 ≥80 11.4 1.4 15.7 0.3 0.2 31.4 25.1 98 85 94 – 3.0 11.1 0.7 1.2 83 Belgium
Belize 24.4 65.9 74.0 61 – – 68.6 1.0 0.5 – – 95 96 – 8.41 0.8 1.8 0.0 0.4 55 Belize
Benin 27.7 24.5 94.0 41 – – 205.0 59.7 3.5 12.3 0.6 82 – 75 4.39 0.2 0.6 0.0 0.0 30 Benin
Bhutan 15.1 84.6aj 28.4 59 – – 124.5 4.0 0.6 – – 98 90 – 2.57 0.4 1.5 0.1 0.0 73 Bhutan
Bolivia (Plurinational State of) 23.2 42.8 71.0 60 – – 63.7 5.6 2.0 67.3 10.5 99 – 97 1.69 0.5 1.0 0.1 0.1 76 Bolivia (Plurinational
State of)
Bosnia and Herzegovina 17.7 21.9aj 10.7 57 8.6 1.3 79.8 <0.1 0.5 47.7 30.2 78 78 – 9.93 1.9 5.9 0.2 0.1 58 Bosnia and Herzegovina
Botswana 23.6 – 37.5 60 – – 101.3 11.8 1.1 34.4 5.7 95 74 95 2.36 0.4 2.7 0.1 0.2 42 Botswana
Brazil 23.4 89.3 60.8 77 25.6 3.5 29.9 1.0 0.2 17.9 10.1 86 72 94 0.03 1.9 7.4 1.2 0.7 96 Brazil
Brunei Darussalam 8.0 – 11.4 ≥80 – – 13.3 <0.1 0.3 30.9 2.0 99 97 – – 1.7 6.5 0.4 0.2 67 Brunei Darussalam
Bulgaria 8.3 – 39.4 64 12.8 0.8 61.8 0.1 0.6 44.4 30.1 92 88 90 – 4.0 5.3 1.0 – 69 Bulgaria
Burkina Faso 30.0 45.0 122.0 39 3.5 0.6 206.2 49.6 3.0 23.9 1.6 91 50 91 9.15 0.0 0.6 0.0 0.0 45 Burkina Faso
Burundi 31.3 39.3ai 58.0 43 – – 179.9 65.4 5.2 – – 94 72 94 9.57 – – – 0.0 25 Burundi
Cabo Verde 26.1 – 80.0 62 2.0 0.0 99.5 4.1 0.5 16.5 2.1 96 95 – 0.92 0.8 1.3 0.0 0.0 65 Cabo Verde
Cambodia 17.4 56.4 57.0 55 – – 149.8 6.5 0.6 33.7 2.0 90 58 87 3.01 0.1 1.0 0.0 0.0 81 Cambodia
Cameroon 27.6 40.1 119.0 44 10.8 3.0 208.1 45.2 3.1 – – 85 – 84 2.22 0.1 0.5 0.0 0.0 57 Cameroon
Canada 6.0 – 11.1 ≥80 2.6 0.5 7.0 0.4 0.3 16.6 12.0 91 86 79 – 2.5 9.8 1.3 1.0 100 Canada
Central African Republic 32.4 28.7aj 229.0 33 – – 211.9 82.1 3.2 – – 47 – 47 10.62 0.0 0.3 0.0 0.0 27 Central African Republic
Chad 24.1 17.5 179.0 29 – – 280.1 101.0 3.6 – – 46 – – 4.16 0.0 0.3 – 0.0 44 Chad
Chile 12.4 – 44.7 70 – – 25.3 0.2 0.2 41.5 34.2 95 87 90 0.01 1.0 0.1 0.0 0.0 84 Chile
China 18.8 – 9.2 76 17.7 4.8 112.7 0.6 1.4 48.4 1.9 99 99 – 0.11 1.8 2.3 – 0.3 100 China
Colombia 16.8 86.5 71.6 76 16.9 2.8 37.0 0.8 0.4 13.5 4.7 91 87 89 0.07 1.8 1.1 1.0 – 88 Colombia
Comoros 28.0 27.8 70.0 47 – – 172.4 50.7 2.4 23.6 4.4 91 – – 8.21 – – – – 37 Comoros
Congo 26.4 38.5 147.0 38 2.0 0.4 130.7 38.7 1.2 52.3 1.7 80 – 80 1.65 0.1 0.9 – 0.0 31 Congo
Cook Islands 24.2 – – – – – – – – 29.8 21.2 99 90 – 5.02 1.2 5.8 0.9 0.4 43 Cook Islands
Costa Rica 13.9 89.1aj – 75 10.1 1.8 23.3 0.9 0.3 17.4 6.4 97 87 94 0.01 1.1 0.8 0.1 0.2 87 Costa Rica
Côte d'Ivoire 24.2 31.1 129.0 44 15.2 3.6 269.1 47.2 3.9 – – 85 – 83 4.23 0.1 0.5 0.0 0.0 87 Côte d'Ivoire
Croatia 9.2 – 9.6 69 2.8 0.3 35.5 0.1 0.2 39.9 34.3 93 96 – – 3.1 6.5 0.9 0.7 71 Croatia
Cuba 7.5 88.4 50.0 78 – – 49.5 1.0 0.3 53.3 17.1 99 99 – 0.11 7.5 8.0 1.8 0.3 99 Cuba
Cyprus 5.2 – 4.9 73 16.1 1.5 20.1 0.3 0.1 52.7 19.6 97 88 81 – 2.5 4.1 0.7 0.2 96 Cyprus
Czechia 6.1 – 11.6 73 2.2 0.0 29.6 0.2 0.3 38.3 30.5 96 93 – – 3.7 8.4 0.8 0.7 94 Czechia
Democratic People's Republic of Korea 20.8 – 0.7 68 – – 207.2 1.4 1.9 – – 96 98 – 0.90 3.5 4.2 0.2 0.4 67 Democratic People's
Republic of Korea
Democratic Republic of the Congo 33.2 15.6 138.0 40 – – 163.9 59.8 3.2 – – 79 – 77 5.27 0.1 1.0 0.0 0.0 65 Democratic Republic of
the Congo
Denmark 3.5 – 3.4 ≥80 2.9 0.5 13.2 0.3 0.1 18.8 19.3 94 85 94 – 3.7 17.0 0.8 0.5 90 Denmark
Djibouti 24.7 – 20.6 47 – – 159.0 31.3 2.4 24.5 1.7 84 82 82 11.73 0.2 0.6 0.0 0.2 33 Djibouti
Dominica 15.3 – – – – – – – – – – 99 92 – – – – – – 62 Dominica
Dominican Republic 29.3 84.1ai 45.3 74 17.0 4.4 43.0 2.2 0.4 19.1 8.5 87 – 30 0.24 1.5 1.3 0.2 – 55 Dominican Republic
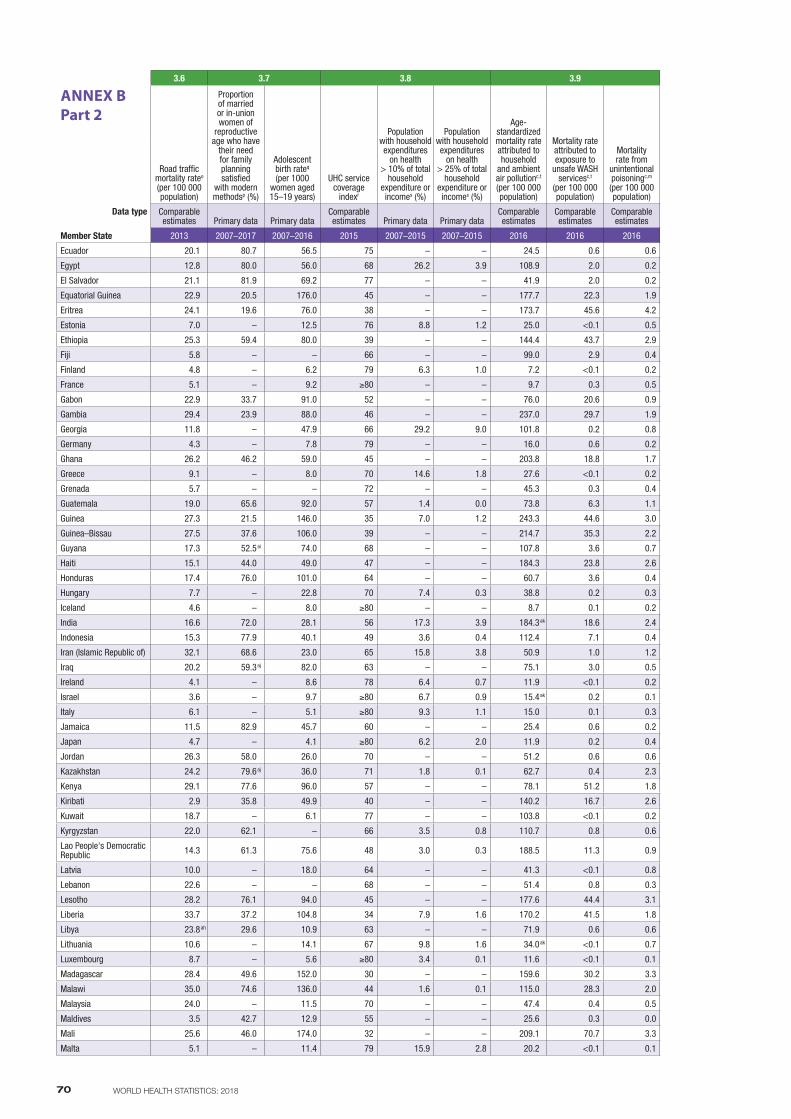
70 WORLD HEALTH STATISTICS: 2018
3.6 3.7 3.8 3.9 3.a 3.b.1 3.b.2 3.c 3.d
Member State
ANNEX BPart 2
Road traffic mortality rateo (per 100 000 population)
Proportion of married or in-union women of
reproductive age who have
their need for family planning satisfied
with modern methodsp (%)
Adolescent birth rateq (per 1000
women aged 15–19 years)
UHC service coverage
indexr
Population with household expenditures
on health > 10% of total
household expenditure or incomes (%)
Population with household expenditures
on health > 25% of total
household expenditure or incomes (%)
Age-standardized mortality rate attributed to household
and ambient air pollutionc,t (per 100 000 population)
Mortality rate attributed to exposure to
unsafe WASH servicesc,t
(per 100 000 population)
Mortality rate from
unintentional poisoningc,m (per 100 000 population)
Diphtheria-tetanus-pertussis (DTP3)
immunization coverage among
1-year-oldsv (%)
Measles-containing-
vaccine second-dose
(MCV2) immunization coverage by the nationally recommended
agev (%)
Pneumococcal conjugate 3rd dose (PCV3)
immunization coverage
among 1-year oldsv (%)
Total net official
development assistance to medical
research and basic health per capitaw (US$), by recipient country
Density of physiciansx (per 1000
population)
Density of nursing and midwifery personnelx (per 1000
population)
Density of dentistry
personnelx (per 1000
population)
Density of pharmaceutical
personnelx (per 1000
population)
Average of 13 International
Health Regulations
core capacity scoresy
Age-standardized prevalence of tobacco
smoking among persons 15 years
and olderu (%)
Male Female
Data type Comparable estimates Primary data Primary data
Comparable estimates Primary data Primary data
Comparable estimates
Comparable estimates
Comparable estimates
Comparable estimates
Comparable estimates
Comparable estimates
Comparable estimates Primary data Primary data Primary data Primary data Primary data Other data
Member State 2013 2007–2017 2007–2016 2015 2007–2015 2007–2015 2016 2016 2016 2016 2016 2016 2016 2016 2007–2016 2007–2016 2007–2016 2007–2016 2010–2017
Ecuador 20.1 80.7 56.5 75 – – 24.5 0.6 0.6 12.3 2.0 83 76 84 0.50 1.7 2.1 0.3 0.1 81 Ecuador
Egypt 12.8 80.0 56.0 68 26.2 3.9 108.9 2.0 0.2 50.1 0.2 95 96 – 0.20 0.8 1.4 0.2 0.3 96 Egypt
El Salvador 21.1 81.9 69.2 77 – – 41.9 2.0 0.2 18.8 2.5 93 87 90 0.77 1.9 0.5 0.8 0.4 93 El Salvador
Equatorial Guinea 22.9 20.5 176.0 45 – – 177.7 22.3 1.9 – – 19 – – 1.29 – – – – 27 Equatorial Guinea
Eritrea 24.1 19.6 76.0 38 – – 173.7 45.6 4.2 11.4 0.2 95 85 95 2.44 – – – – 49 Eritrea
Estonia 7.0 – 12.5 76 8.8 1.2 25.0 <0.1 0.5 39.3 24.5 93 92 – – 3.4 6.4 0.9 0.7 70 Estonia
Ethiopia 25.3 59.4 80.0 39 – – 144.4 43.7 2.9 8.5 0.4 77 – 76 3.53 0.0 0.3 – 0.0 79 Ethiopia
Fiji 5.8 – – 66 – – 99.0 2.9 0.4 34.8 10.2 99 94 99 7.00 0.8 2.9 0.3 0.1 98 Fiji
Finland 4.8 – 6.2 79 6.3 1.0 7.2 <0.1 0.2 22.6 18.3 92 85 87 – 3.2 15.0 0.7 1.1 96 Finland
France 5.1 – 9.2 ≥80 – – 9.7 0.3 0.5 35.6 30.1 97 79 91 – 3.2 10.6 0.7 1.1 89 France
Gabon 22.9 33.7 91.0 52 – – 76.0 20.6 0.9 – – 75 – – 2.25 0.4 2.9 0.0 0.1 52 Gabon
Gambia 29.4 23.9 88.0 46 – – 237.0 29.7 1.9 31.2 0.7 95 79 95 12.72 0.1 1.6 0.0 0.1 27 Gambia
Georgia 11.8 – 47.9 66 29.2 9.0 101.8 0.2 0.8 55.5 5.3 92 85 75 2.23 4.8 4.0 0.5 0.1 74 Georgia
Germany 4.3 – 7.8 79 – – 16.0 0.6 0.2 33.1 28.2 95 93 86 – 4.2 13.8 0.9 0.7 97 Germany
Ghana 26.2 46.2 59.0 45 – – 203.8 18.8 1.7 7.7 0.3 93 75 93 4.94 0.1 0.9 0.0 0.1 74 Ghana
Greece 9.1 – 8.0 70 14.6 1.8 27.6 <0.1 0.2 52.0 35.3 99 83 96 – 6.3 3.4 1.2 1.1 76 Greece
Grenada 5.7 – – 72 – – 45.3 0.3 0.4 – – 96 85 – – – – – 0.8 66 Grenada
Guatemala 19.0 65.6 92.0 57 1.4 0.0 73.8 6.3 1.1 – – 80 65 81 1.28 0.9 0.9 0.2 – 55 Guatemala
Guinea 27.3 21.5 146.0 35 7.0 1.2 243.3 44.6 3.0 – – 57 – – 8.26 0.1 0.4 – 0.0 59 Guinea
Guinea–Bissau 27.5 37.6 106.0 39 – – 214.7 35.3 2.2 – – 87 – 80 11.23 0.1 0.7 0.0 0.0 53 Guinea–Bissau
Guyana 17.3 52.5ai 74.0 68 – – 107.8 3.6 0.7 – – 97 94 92 2.85 0.2 0.5 0.1 0.1 89 Guyana
Haiti 15.1 44.0 49.0 47 – – 184.3 23.8 2.6 23.1 2.9 58 26 – 8.73 – – – – 61 Haiti
Honduras 17.4 76.0 101.0 64 – – 60.7 3.6 0.4 – – 97 – 97 2.92 – – – – 70 Honduras
Hungary 7.7 – 22.8 70 7.4 0.3 38.8 0.2 0.3 34.8 26.8 99 99 98 – 3.1 6.6 0.6 0.7 82 Hungary
Iceland 4.6 – 8.0 ≥80 – – 8.7 0.1 0.2 15.2 14.3 91 95 90 – 3.8 15.2 0.8 1.1 72 Iceland
India 16.6 72.0 28.1 56 17.3 3.9 184.3ak 18.6 2.4 20.6 1.9 88 76 – 0.28 0.8 2.1 0.1 0.6 95 India
Indonesia 15.3 77.9 40.1 49 3.6 0.4 112.4 7.1 0.4 76.1 2.8 79 56 – 0.51 0.2 1.3 0.0 0.1 99 Indonesia
Iran (Islamic Republic of) 32.1 68.6 23.0 65 15.8 3.8 50.9 1.0 1.2 21.1 0.8 99 98 – 0.03 1.5 1.6 0.4 0.2 76 Iran (Islamic Republic of)
Iraq 20.2 59.3aj 82.0 63 – – 75.1 3.0 0.5 39.3 4.7 63 64 – 0.13 0.9 1.8 0.2 0.2 89 Iraq
Ireland 4.1 – 8.6 78 6.4 0.7 11.9 <0.1 0.2 25.7 23.0 95 – 91 – 3.0 12.4 0.6 1.1 78 Ireland
Israel 3.6 – 9.7 ≥80 6.7 0.9 15.4ak 0.2 0.1 35.4 15.4 94 97 93 – 3.6 5.1 0.8 0.8 71 Israel
Italy 6.1 – 5.1 ≥80 9.3 1.1 15.0 0.1 0.3 27.8 19.8 93 83 89 – 4.0 5.7 0.8 1.1 90 Italy
Jamaica 11.5 82.9 45.7 60 – – 25.4 0.6 0.2 28.6 5.3 99 85 – 0.04 0.5 1.7 0.1 0.1 83al Jamaica
Japan 4.7 – 4.1 ≥80 6.2 2.0 11.9 0.2 0.4 33.7 11.2 99 93 99 – 2.4 11.2 0.8 1.7 100 Japan
Jordan 26.3 58.0 26.0 70 – – 51.2 0.6 0.6 – – 98 99 – 2.78 3.4 3.1 0.9 1.6 72 Jordan
Kazakhstan 24.2 79.6aj 36.0 71 1.8 0.1 62.7 0.4 2.3 43.1 7.0 82 99 97 0.36 3.3 8.5 0.4 0.8 78 Kazakhstan
Kenya 29.1 77.6 96.0 57 – – 78.1 51.2 1.8 20.4 1.2 89 32 78 3.36 0.2 1.6 0.0 0.1 58 Kenya
Kiribati 2.9 35.8 49.9 40 – – 140.2 16.7 2.6 58.9 35.9 81 79 79 9.95 0.2 4.6 0.2 0.1 60 Kiribati
Kuwait 18.7 – 6.1 77 – – 103.8 <0.1 0.2 37.0 2.7 99 96 99 – 2.6 7.0 0.7 0.5 85 Kuwait
Kyrgyzstan 22.0 62.1 – 66 3.5 0.8 110.7 0.8 0.6 50.5 3.6 96 98 – 2.91 1.9 6.4 0.2 0.0 50 Kyrgyzstan
Lao People's Democratic Republic 14.3 61.3 75.6 48 3.0 0.3 188.5 11.3 0.9 51.2 7.3 82 – 78 3.33 0.5 1.0 0.1 0.2 75al Lao People's Democratic
Republic
Latvia 10.0 – 18.0 64 – – 41.3 <0.1 0.8 51.0 25.6 98 89 82 – 3.2 4.9 0.7 0.8 90 Latvia
Lebanon 22.6 – – 68 – – 51.4 0.8 0.3 40.7 26.9 81 75 – 5.84 2.4 2.6 1.0 1.4 80 Lebanon
Lesotho 28.2 76.1 94.0 45 – – 177.6 44.4 3.1 53.9 0.4 93 82 93 6.61 – – – – 62 Lesotho
Liberia 33.7 37.2 104.8 34 7.9 1.6 170.2 41.5 1.8 18.1 1.5 79 – 79 14.27 0.0 0.5 0.0 0.0 76 Liberia
Libya 23.8ah 29.6 10.9 63 – – 71.9 0.6 0.6 – – 97 96 96 0.07 2.1 6.9 0.7 0.6 64 Libya
Lithuania 10.6 – 14.1 67 9.8 1.6 34.0ak <0.1 0.7 38.0 21.3 94 92 82 – 4.4 8.1 0.9 – 77 Lithuania
Luxembourg 8.7 – 5.6 ≥80 3.4 0.1 11.6 <0.1 0.1 26.0 20.9 99 86 95 – 2.9 12.3 1.0 0.7 88 Luxembourg
Madagascar 28.4 49.6 152.0 30 – – 159.6 30.2 3.3 – – 77 – 76 4.08 0.1 0.2 0.0 0.0 43 Madagascar
Malawi 35.0 74.6 136.0 44 1.6 0.1 115.0 28.3 2.0 24.7 4.4 84 61 83 12.64 0.0 0.3 0.0 0.0 56 Malawi
Malaysia 24.0 – 11.5 70 – – 47.4 0.4 0.5 42.4 1.0 98 99 – 0.05 1.5 4.1 0.5 0.5 100 Malaysia
Maldives 3.5 42.7 12.9 55 – – 25.6 0.3 0.0 55.0 2.1 99 99 – 1.29 3.6 8.2 0.2 1.1 63 Maldives
Mali 25.6 46.0 174.0 32 – – 209.1 70.7 3.3 23.0 1.6 68 – 70 7.55 0.1 0.4 0.0 0.0 40 Mali
Malta 5.1 – 11.4 79 15.9 2.8 20.2 <0.1 0.1 30.2 20.9 97 86 – – 3.9 9.1 0.5 1.3 79 Malta
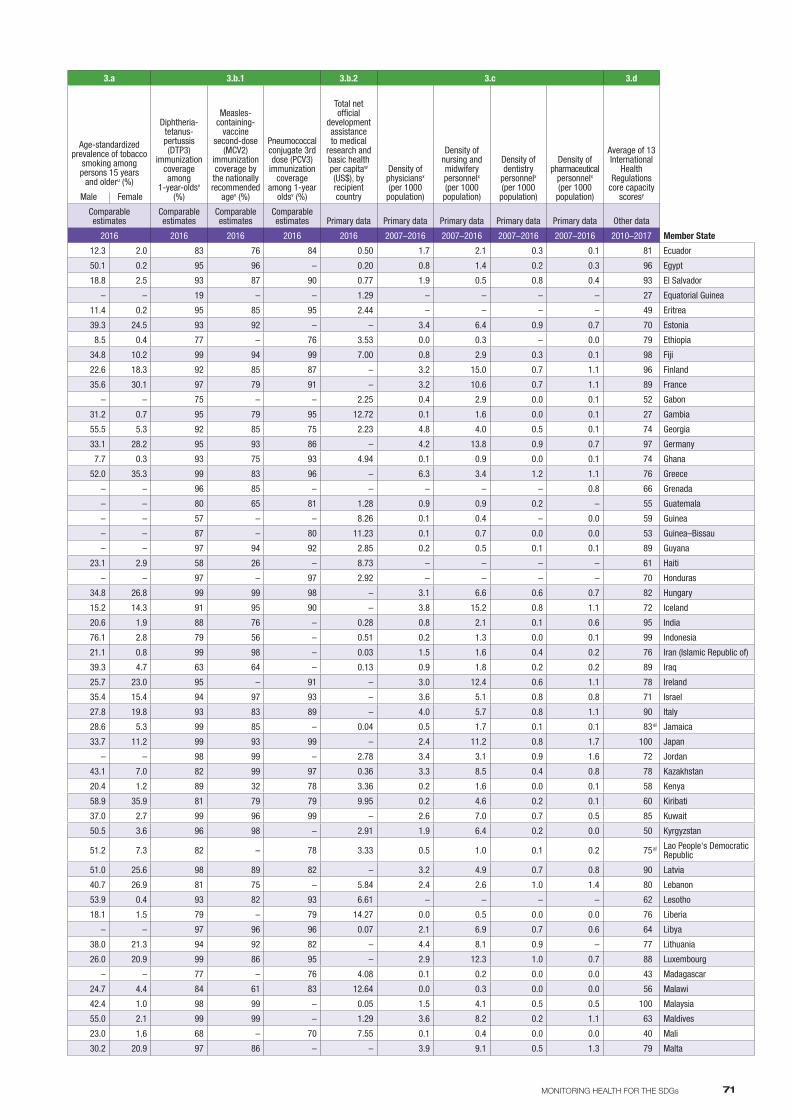
71MONITORING HEALTH FOR THE SDGs
3.6 3.7 3.8 3.9 3.a 3.b.1 3.b.2 3.c 3.d
Member State
ANNEX BPart 2
Road traffic mortality rateo (per 100 000 population)
Proportion of married or in-union women of
reproductive age who have
their need for family planning satisfied
with modern methodsp (%)
Adolescent birth rateq (per 1000
women aged 15–19 years)
UHC service coverage
indexr
Population with household expenditures
on health > 10% of total
household expenditure or incomes (%)
Population with household expenditures
on health > 25% of total
household expenditure or incomes (%)
Age-standardized mortality rate attributed to household
and ambient air pollutionc,t (per 100 000 population)
Mortality rate attributed to exposure to
unsafe WASH servicesc,t
(per 100 000 population)
Mortality rate from
unintentional poisoningc,m (per 100 000 population)
Diphtheria-tetanus-pertussis (DTP3)
immunization coverage among
1-year-oldsv (%)
Measles-containing-
vaccine second-dose
(MCV2) immunization coverage by the nationally recommended
agev (%)
Pneumococcal conjugate 3rd dose (PCV3)
immunization coverage
among 1-year oldsv (%)
Total net official
development assistance to medical
research and basic health per capitaw (US$), by recipient country
Density of physiciansx (per 1000
population)
Density of nursing and midwifery personnelx (per 1000
population)
Density of dentistry
personnelx (per 1000
population)
Density of pharmaceutical
personnelx (per 1000
population)
Average of 13 International
Health Regulations
core capacity scoresy
Age-standardized prevalence of tobacco
smoking among persons 15 years
and olderu (%)
Male Female
Data type Comparable estimates Primary data Primary data
Comparable estimates Primary data Primary data
Comparable estimates
Comparable estimates
Comparable estimates
Comparable estimates
Comparable estimates
Comparable estimates
Comparable estimates Primary data Primary data Primary data Primary data Primary data Other data
Member State 2013 2007–2017 2007–2016 2015 2007–2015 2007–2015 2016 2016 2016 2016 2016 2016 2016 2016 2007–2016 2007–2016 2007–2016 2007–2016 2010–2017
Ecuador 20.1 80.7 56.5 75 – – 24.5 0.6 0.6 12.3 2.0 83 76 84 0.50 1.7 2.1 0.3 0.1 81 Ecuador
Egypt 12.8 80.0 56.0 68 26.2 3.9 108.9 2.0 0.2 50.1 0.2 95 96 – 0.20 0.8 1.4 0.2 0.3 96 Egypt
El Salvador 21.1 81.9 69.2 77 – – 41.9 2.0 0.2 18.8 2.5 93 87 90 0.77 1.9 0.5 0.8 0.4 93 El Salvador
Equatorial Guinea 22.9 20.5 176.0 45 – – 177.7 22.3 1.9 – – 19 – – 1.29 – – – – 27 Equatorial Guinea
Eritrea 24.1 19.6 76.0 38 – – 173.7 45.6 4.2 11.4 0.2 95 85 95 2.44 – – – – 49 Eritrea
Estonia 7.0 – 12.5 76 8.8 1.2 25.0 <0.1 0.5 39.3 24.5 93 92 – – 3.4 6.4 0.9 0.7 70 Estonia
Ethiopia 25.3 59.4 80.0 39 – – 144.4 43.7 2.9 8.5 0.4 77 – 76 3.53 0.0 0.3 – 0.0 79 Ethiopia
Fiji 5.8 – – 66 – – 99.0 2.9 0.4 34.8 10.2 99 94 99 7.00 0.8 2.9 0.3 0.1 98 Fiji
Finland 4.8 – 6.2 79 6.3 1.0 7.2 <0.1 0.2 22.6 18.3 92 85 87 – 3.2 15.0 0.7 1.1 96 Finland
France 5.1 – 9.2 ≥80 – – 9.7 0.3 0.5 35.6 30.1 97 79 91 – 3.2 10.6 0.7 1.1 89 France
Gabon 22.9 33.7 91.0 52 – – 76.0 20.6 0.9 – – 75 – – 2.25 0.4 2.9 0.0 0.1 52 Gabon
Gambia 29.4 23.9 88.0 46 – – 237.0 29.7 1.9 31.2 0.7 95 79 95 12.72 0.1 1.6 0.0 0.1 27 Gambia
Georgia 11.8 – 47.9 66 29.2 9.0 101.8 0.2 0.8 55.5 5.3 92 85 75 2.23 4.8 4.0 0.5 0.1 74 Georgia
Germany 4.3 – 7.8 79 – – 16.0 0.6 0.2 33.1 28.2 95 93 86 – 4.2 13.8 0.9 0.7 97 Germany
Ghana 26.2 46.2 59.0 45 – – 203.8 18.8 1.7 7.7 0.3 93 75 93 4.94 0.1 0.9 0.0 0.1 74 Ghana
Greece 9.1 – 8.0 70 14.6 1.8 27.6 <0.1 0.2 52.0 35.3 99 83 96 – 6.3 3.4 1.2 1.1 76 Greece
Grenada 5.7 – – 72 – – 45.3 0.3 0.4 – – 96 85 – – – – – 0.8 66 Grenada
Guatemala 19.0 65.6 92.0 57 1.4 0.0 73.8 6.3 1.1 – – 80 65 81 1.28 0.9 0.9 0.2 – 55 Guatemala
Guinea 27.3 21.5 146.0 35 7.0 1.2 243.3 44.6 3.0 – – 57 – – 8.26 0.1 0.4 – 0.0 59 Guinea
Guinea–Bissau 27.5 37.6 106.0 39 – – 214.7 35.3 2.2 – – 87 – 80 11.23 0.1 0.7 0.0 0.0 53 Guinea–Bissau
Guyana 17.3 52.5ai 74.0 68 – – 107.8 3.6 0.7 – – 97 94 92 2.85 0.2 0.5 0.1 0.1 89 Guyana
Haiti 15.1 44.0 49.0 47 – – 184.3 23.8 2.6 23.1 2.9 58 26 – 8.73 – – – – 61 Haiti
Honduras 17.4 76.0 101.0 64 – – 60.7 3.6 0.4 – – 97 – 97 2.92 – – – – 70 Honduras
Hungary 7.7 – 22.8 70 7.4 0.3 38.8 0.2 0.3 34.8 26.8 99 99 98 – 3.1 6.6 0.6 0.7 82 Hungary
Iceland 4.6 – 8.0 ≥80 – – 8.7 0.1 0.2 15.2 14.3 91 95 90 – 3.8 15.2 0.8 1.1 72 Iceland
India 16.6 72.0 28.1 56 17.3 3.9 184.3ak 18.6 2.4 20.6 1.9 88 76 – 0.28 0.8 2.1 0.1 0.6 95 India
Indonesia 15.3 77.9 40.1 49 3.6 0.4 112.4 7.1 0.4 76.1 2.8 79 56 – 0.51 0.2 1.3 0.0 0.1 99 Indonesia
Iran (Islamic Republic of) 32.1 68.6 23.0 65 15.8 3.8 50.9 1.0 1.2 21.1 0.8 99 98 – 0.03 1.5 1.6 0.4 0.2 76 Iran (Islamic Republic of)
Iraq 20.2 59.3aj 82.0 63 – – 75.1 3.0 0.5 39.3 4.7 63 64 – 0.13 0.9 1.8 0.2 0.2 89 Iraq
Ireland 4.1 – 8.6 78 6.4 0.7 11.9 <0.1 0.2 25.7 23.0 95 – 91 – 3.0 12.4 0.6 1.1 78 Ireland
Israel 3.6 – 9.7 ≥80 6.7 0.9 15.4ak 0.2 0.1 35.4 15.4 94 97 93 – 3.6 5.1 0.8 0.8 71 Israel
Italy 6.1 – 5.1 ≥80 9.3 1.1 15.0 0.1 0.3 27.8 19.8 93 83 89 – 4.0 5.7 0.8 1.1 90 Italy
Jamaica 11.5 82.9 45.7 60 – – 25.4 0.6 0.2 28.6 5.3 99 85 – 0.04 0.5 1.7 0.1 0.1 83al Jamaica
Japan 4.7 – 4.1 ≥80 6.2 2.0 11.9 0.2 0.4 33.7 11.2 99 93 99 – 2.4 11.2 0.8 1.7 100 Japan
Jordan 26.3 58.0 26.0 70 – – 51.2 0.6 0.6 – – 98 99 – 2.78 3.4 3.1 0.9 1.6 72 Jordan
Kazakhstan 24.2 79.6aj 36.0 71 1.8 0.1 62.7 0.4 2.3 43.1 7.0 82 99 97 0.36 3.3 8.5 0.4 0.8 78 Kazakhstan
Kenya 29.1 77.6 96.0 57 – – 78.1 51.2 1.8 20.4 1.2 89 32 78 3.36 0.2 1.6 0.0 0.1 58 Kenya
Kiribati 2.9 35.8 49.9 40 – – 140.2 16.7 2.6 58.9 35.9 81 79 79 9.95 0.2 4.6 0.2 0.1 60 Kiribati
Kuwait 18.7 – 6.1 77 – – 103.8 <0.1 0.2 37.0 2.7 99 96 99 – 2.6 7.0 0.7 0.5 85 Kuwait
Kyrgyzstan 22.0 62.1 – 66 3.5 0.8 110.7 0.8 0.6 50.5 3.6 96 98 – 2.91 1.9 6.4 0.2 0.0 50 Kyrgyzstan
Lao People's Democratic Republic 14.3 61.3 75.6 48 3.0 0.3 188.5 11.3 0.9 51.2 7.3 82 – 78 3.33 0.5 1.0 0.1 0.2 75al Lao People's Democratic
Republic
Latvia 10.0 – 18.0 64 – – 41.3 <0.1 0.8 51.0 25.6 98 89 82 – 3.2 4.9 0.7 0.8 90 Latvia
Lebanon 22.6 – – 68 – – 51.4 0.8 0.3 40.7 26.9 81 75 – 5.84 2.4 2.6 1.0 1.4 80 Lebanon
Lesotho 28.2 76.1 94.0 45 – – 177.6 44.4 3.1 53.9 0.4 93 82 93 6.61 – – – – 62 Lesotho
Liberia 33.7 37.2 104.8 34 7.9 1.6 170.2 41.5 1.8 18.1 1.5 79 – 79 14.27 0.0 0.5 0.0 0.0 76 Liberia
Libya 23.8ah 29.6 10.9 63 – – 71.9 0.6 0.6 – – 97 96 96 0.07 2.1 6.9 0.7 0.6 64 Libya
Lithuania 10.6 – 14.1 67 9.8 1.6 34.0ak <0.1 0.7 38.0 21.3 94 92 82 – 4.4 8.1 0.9 – 77 Lithuania
Luxembourg 8.7 – 5.6 ≥80 3.4 0.1 11.6 <0.1 0.1 26.0 20.9 99 86 95 – 2.9 12.3 1.0 0.7 88 Luxembourg
Madagascar 28.4 49.6 152.0 30 – – 159.6 30.2 3.3 – – 77 – 76 4.08 0.1 0.2 0.0 0.0 43 Madagascar
Malawi 35.0 74.6 136.0 44 1.6 0.1 115.0 28.3 2.0 24.7 4.4 84 61 83 12.64 0.0 0.3 0.0 0.0 56 Malawi
Malaysia 24.0 – 11.5 70 – – 47.4 0.4 0.5 42.4 1.0 98 99 – 0.05 1.5 4.1 0.5 0.5 100 Malaysia
Maldives 3.5 42.7 12.9 55 – – 25.6 0.3 0.0 55.0 2.1 99 99 – 1.29 3.6 8.2 0.2 1.1 63 Maldives
Mali 25.6 46.0 174.0 32 – – 209.1 70.7 3.3 23.0 1.6 68 – 70 7.55 0.1 0.4 0.0 0.0 40 Mali
Malta 5.1 – 11.4 79 15.9 2.8 20.2 <0.1 0.1 30.2 20.9 97 86 – – 3.9 9.1 0.5 1.3 79 Malta
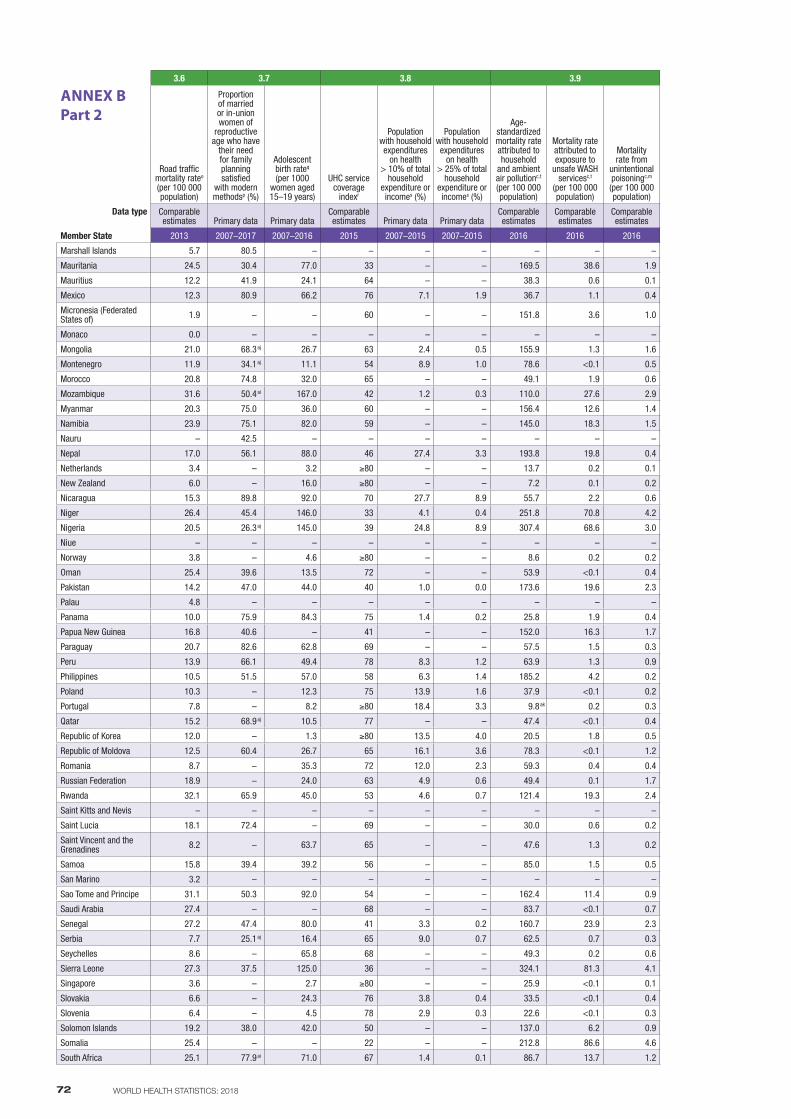
72 WORLD HEALTH STATISTICS: 2018
3.6 3.7 3.8 3.9 3.a 3.b.1 3.b.2 3.c 3.d
Member State
ANNEX BPart 2
Road traffic mortality rateo (per 100 000 population)
Proportion of married or in-union women of
reproductive age who have
their need for family planning satisfied
with modern methodsp (%)
Adolescent birth rateq (per 1000
women aged 15–19 years)
UHC service coverage
indexr
Population with household expenditures
on health > 10% of total
household expenditure or incomes (%)
Population with household expenditures
on health > 25% of total
household expenditure or incomes (%)
Age-standardized mortality rate attributed to household
and ambient air pollutionc,t (per 100 000 population)
Mortality rate attributed to exposure to
unsafe WASH servicesc,t
(per 100 000 population)
Mortality rate from
unintentional poisoningc,m (per 100 000 population)
Diphtheria-tetanus-pertussis (DTP3)
immunization coverage among
1-year-oldsv (%)
Measles-containing-
vaccine second-dose
(MCV2) immunization coverage by the nationally recommended
agev (%)
Pneumococcal conjugate 3rd dose (PCV3)
immunization coverage
among 1-year oldsv (%)
Total net official
development assistance to medical
research and basic health per capitaw (US$), by recipient country
Density of physiciansx (per 1000
population)
Density of nursing and midwifery personnelx (per 1000
population)
Density of dentistry
personnelx (per 1000
population)
Density of pharmaceutical
personnelx (per 1000
population)
Average of 13 International
Health Regulations
core capacity scoresy
Age-standardized prevalence of tobacco
smoking among persons 15 years
and olderu (%)
Male Female
Data type Comparable estimates Primary data Primary data
Comparable estimates Primary data Primary data
Comparable estimates
Comparable estimates
Comparable estimates
Comparable estimates
Comparable estimates
Comparable estimates
Comparable estimates Primary data Primary data Primary data Primary data Primary data Other data
Member State 2013 2007–2017 2007–2016 2015 2007–2015 2007–2015 2016 2016 2016 2016 2016 2016 2016 2016 2007–2016 2007–2016 2007–2016 2007–2016 2010–2017
Marshall Islands 5.7 80.5 – – – – – – – – – 71 49 51 2.67 0.5 3.6 0.5 0.1 57 Marshall Islands
Mauritania 24.5 30.4 77.0 33 – – 169.5 38.6 1.9 – – 73 – 73 2.53 0.1 0.7 0.0 0.0 32 Mauritania
Mauritius 12.2 41.9 24.1 64 – – 38.3 0.6 0.1 40.7 3.2 96 92 10 0.28 2.0 3.3 0.3 0.4 71 Mauritius
Mexico 12.3 80.9 66.2 76 7.1 1.9 36.7 1.1 0.4 21.4 6.9 97 98 92 0.01 2.2 2.6 0.1 – 94 Mexico
Micronesia (Federated States of) 1.9 – – 60 – – 151.8 3.6 1.0 – – 69 74 63 3.65 0.2 3.6 0.4 0.2 86 Micronesia (Federated
States of)
Monaco 0.0 – – – – – – – – – – 99 – – – 6.6 20.5 1.0 2.6 81 Monaco
Mongolia 21.0 68.3aj 26.7 63 2.4 0.5 155.9 1.3 1.6 46.5 5.5 99 90 – 6.47 3.3 4.1 0.2 0.5 87 Mongolia
Montenegro 11.9 34.1aj 11.1 54 8.9 1.0 78.6 <0.1 0.5 47.9 44.0 89 86 – 1.84 2.3 5.7 0.0 0.2 56 Montenegro
Morocco 20.8 74.8 32.0 65 – – 49.1 1.9 0.6 47.1 0.8 99 99 98 1.92 0.6 0.9 0.1 0.3 95 Morocco
Mozambique 31.6 50.4ai 167.0 42 1.2 0.3 110.0 27.6 2.9 29.1 5.1 80 51 80 8.10 0.1 0.4 0.0 0.1 69 Mozambique
Myanmar 20.3 75.0 36.0 60 – – 156.4 12.6 1.4 35.2 6.3 90 86 14 2.78 0.6 0.9 0.1 – 62 Myanmar
Namibia 23.9 75.1 82.0 59 – – 145.0 18.3 1.5 34.2 9.7 92 – 81 3.97 0.4 2.8 0.0 0.2 79 Namibia
Nauru – 42.5 – – – – – – – 36.9 43.0 91 96 – 43.29 1.4 7.0 0.6 1.0 42 Nauru
Nepal 17.0 56.1 88.0 46 27.4 3.3 193.8 19.8 0.4 37.8 9.5 87 25 46 2.47 0.6 2.0 – 0.2 22 Nepal
Netherlands 3.4 – 3.2 ≥80 – – 13.7 0.2 0.1 27.3 24.4 95 91 94 – 3.5 10.5 0.5 0.2 95 Netherlands
New Zealand 6.0 – 16.0 ≥80 – – 7.2 0.1 0.2 17.2 14.8 92 89 93 – 3.1 11.1 0.4 0.7 98 New Zealand
Nicaragua 15.3 89.8 92.0 70 27.7 8.9 55.7 2.2 0.6 – – 98 – 98 3.58 0.9 1.4 0.0 – 91 Nicaragua
Niger 26.4 45.4 146.0 33 4.1 0.4 251.8 70.8 4.2 15.4 0.1 67 37 64 3.48 0.0 0.1 0.0 0.0 74 Niger
Nigeria 20.5 26.3aj 145.0 39 24.8 8.9 307.4 68.6 3.0 10.8 0.6 49 – 26 2.87 0.4 1.5 0.0 0.1 51 Nigeria
Niue – – – – – – – – – 19.3 10.5 99 99 99 6.01 1.8 9.8 2.5 0.6 61 Niue
Norway 3.8 – 4.6 ≥80 – – 8.6 0.2 0.2 20.7 19.6 96 91 94 – 4.4 17.8 0.9 0.7 99 Norway
Oman 25.4 39.6 13.5 72 – – 53.9 <0.1 0.4 15.6 0.5 99 99 99 – 1.9 4.2 0.2 0.9 90 Oman
Pakistan 14.2 47.0 44.0 40 1.0 0.0 173.6 19.6 2.3 36.7 2.8 72 53 72 1.63 1.0 0.5 0.1 – 51 Pakistan
Palau 4.8 – – – – – – – – 22.7 7.7 98 95 98 2.72 1.2 5.3 0.2 0.0 91 Palau
Panama 10.0 75.9 84.3 75 1.4 0.2 25.8 1.9 0.4 9.9 2.4 73 92 83 0.46 1.6 2.3 0.3 – 76 Panama
Papua New Guinea 16.8 40.6 – 41 – – 152.0 16.3 1.7 48.8 23.5 72 – 20 2.92 0.1 0.5 0.0 0.0 64 Papua New Guinea
Paraguay 20.7 82.6 62.8 69 – – 57.5 1.5 0.3 21.6 5.0 93 92 99 0.89 1.3 1.0 0.2 – 77 Paraguay
Peru 13.9 66.1 49.4 78 8.3 1.2 63.9 1.3 0.9 – – 89 66 86 0.48 1.1 1.5 0.1 0.1 66 Peru
Philippines 10.5 51.5 57.0 58 6.3 1.4 185.2 4.2 0.2 40.8 7.8 86 66 36 0.73 – 0.2 0.0 0.9 81 Philippines
Poland 10.3 – 12.3 75 13.9 1.6 37.9 <0.1 0.2 33.1 23.3 98 94 – – 2.3 5.7 0.3 0.7 74 Poland
Portugal 7.8 – 8.2 ≥80 18.4 3.3 9.8ak 0.2 0.3 30.0 16.3 98 95 – – 4.4 6.4 0.9 0.9 91 Portugal
Qatar 15.2 68.9aj 10.5 77 – – 47.4 <0.1 0.4 26.9 0.8 98 92 97 – 2.0 5.7 0.6 0.9 76 Qatar
Republic of Korea 12.0 – 1.3 ≥80 13.5 4.0 20.5 1.8 0.5 40.9 6.2 98 97 98 – 2.3 6.9 0.5 0.7 98 Republic of Korea
Republic of Moldova 12.5 60.4 26.7 65 16.1 3.6 78.3 <0.1 1.2 44.6 5.9 89 95 77 3.48 3.2 4.5 0.4 0.5 81 Republic of Moldova
Romania 8.7 – 35.3 72 12.0 2.3 59.3 0.4 0.4 37.1 22.9 89 76 – – 2.7 6.4 0.7 0.8 76 Romania
Russian Federation 18.9 – 24.0 63 4.9 0.6 49.4 0.1 1.7 58.3 23.4 97 97 35 – 4.0 8.7 – – 99 Russian Federation
Rwanda 32.1 65.9 45.0 53 4.6 0.7 121.4 19.3 2.4 21.0 4.7 98 90 98 6.65 0.1 0.8 0.0 0.0 66 Rwanda
Saint Kitts and Nevis – – – – – – – – – 15.2 0.8 97 97 – – – – – – 52 Saint Kitts and Nevis
Saint Lucia 18.1 72.4 – 69 – – 30.0 0.6 0.2 – – 95 88 – 6.33 0.1 – 0.2 – 77 Saint Lucia
Saint Vincent and the Grenadines 8.2 – 63.7 65 – – 47.6 1.3 0.2 – – 98 99 – 0.36 – – – – 65 Saint Vincent and the
Grenadines
Samoa 15.8 39.4 39.2 56 – – 85.0 1.5 0.5 38.1 16.7 62 44 – 22.31 0.3 1.5 0.2 0.3 75 Samoa
San Marino 3.2 – – – – – – – – – – 66 36 12 – 6.4 9.1 0.7 0.7 61 San Marino
Sao Tome and Principe 31.1 50.3 92.0 54 – – 162.4 11.4 0.9 – – 96 76 96 24.88 – – – – 16 Sao Tome and Principe
Saudi Arabia 27.4 – – 68 – – 83.7 <0.1 0.7 25.4 1.8 98 96 98 – 2.6 5.2 0.4 0.7 99 Saudi Arabia
Senegal 27.2 47.4 80.0 41 3.3 0.2 160.7 23.9 2.3 16.6 0.4 93 75 93 5.36 0.1 0.3 0.0 0.0 44 Senegal
Serbia 7.7 25.1aj 16.4 65 9.0 0.7 62.5 0.7 0.3 40.2 37.7 92 90 – 0.10 2.5 4.7 0.3 0.5 44 Serbia
Seychelles 8.6 – 65.8 68 – – 49.3 0.2 0.6 35.7 7.1 96 99 – 34.17 1.0 4.4 0.1 0.0 87 Seychelles
Sierra Leone 27.3 37.5 125.0 36 – – 324.1 81.3 4.1 41.3 8.8 84 50 84 11.30 0.0 0.3 0.0 0.0 70 Sierra Leone
Singapore 3.6 – 2.7 ≥80 – – 25.9 <0.1 0.1 28.3 5.2 97 88 78 – 2.3 7.1 0.4 0.5 99 Singapore
Slovakia 6.6 – 24.3 76 3.8 0.4 33.5 <0.1 0.4 37.7 23.1 96 97 96 – 3.4 6.0 0.5 1.1 95 Slovakia
Slovenia 6.4 – 4.5 78 2.9 0.3 22.6 <0.1 0.3 25.0 20.1 94 93 50 – 2.8 8.8 0.7 0.6 77 Slovenia
Solomon Islands 19.2 38.0 42.0 50 – – 137.0 6.2 0.9 – – 99 – 87 26.32 0.2 1.8 0.1 0.1 57 Solomon Islands
Somalia 25.4 – – 22 – – 212.8 86.6 4.6 – – 42 – – 3.52 0.0 0.1 – – 29 Somalia
South Africa 25.1 77.9ai 71.0 67 1.4 0.1 86.7 13.7 1.2 33.2 8.1 66 70 69 1.55 0.8 5.2 0.2 0.7 91 South Africa
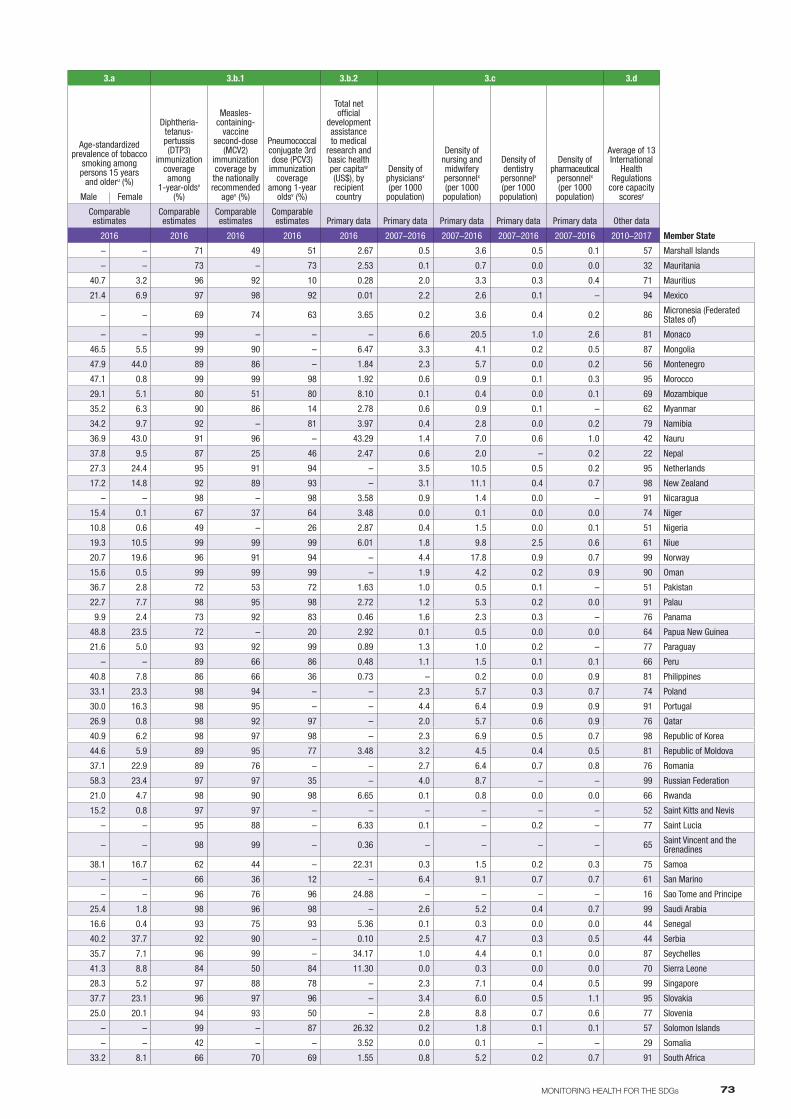
73MONITORING HEALTH FOR THE SDGs
3.6 3.7 3.8 3.9 3.a 3.b.1 3.b.2 3.c 3.d
Member State
ANNEX BPart 2
Road traffic mortality rateo (per 100 000 population)
Proportion of married or in-union women of
reproductive age who have
their need for family planning satisfied
with modern methodsp (%)
Adolescent birth rateq (per 1000
women aged 15–19 years)
UHC service coverage
indexr
Population with household expenditures
on health > 10% of total
household expenditure or incomes (%)
Population with household expenditures
on health > 25% of total
household expenditure or incomes (%)
Age-standardized mortality rate attributed to household
and ambient air pollutionc,t (per 100 000 population)
Mortality rate attributed to exposure to
unsafe WASH servicesc,t
(per 100 000 population)
Mortality rate from
unintentional poisoningc,m (per 100 000 population)
Diphtheria-tetanus-pertussis (DTP3)
immunization coverage among
1-year-oldsv (%)
Measles-containing-
vaccine second-dose
(MCV2) immunization coverage by the nationally recommended
agev (%)
Pneumococcal conjugate 3rd dose (PCV3)
immunization coverage
among 1-year oldsv (%)
Total net official
development assistance to medical
research and basic health per capitaw (US$), by recipient country
Density of physiciansx (per 1000
population)
Density of nursing and midwifery personnelx (per 1000
population)
Density of dentistry
personnelx (per 1000
population)
Density of pharmaceutical
personnelx (per 1000
population)
Average of 13 International
Health Regulations
core capacity scoresy
Age-standardized prevalence of tobacco
smoking among persons 15 years
and olderu (%)
Male Female
Data type Comparable estimates Primary data Primary data
Comparable estimates Primary data Primary data
Comparable estimates
Comparable estimates
Comparable estimates
Comparable estimates
Comparable estimates
Comparable estimates
Comparable estimates Primary data Primary data Primary data Primary data Primary data Other data
Member State 2013 2007–2017 2007–2016 2015 2007–2015 2007–2015 2016 2016 2016 2016 2016 2016 2016 2016 2007–2016 2007–2016 2007–2016 2007–2016 2010–2017
Marshall Islands 5.7 80.5 – – – – – – – – – 71 49 51 2.67 0.5 3.6 0.5 0.1 57 Marshall Islands
Mauritania 24.5 30.4 77.0 33 – – 169.5 38.6 1.9 – – 73 – 73 2.53 0.1 0.7 0.0 0.0 32 Mauritania
Mauritius 12.2 41.9 24.1 64 – – 38.3 0.6 0.1 40.7 3.2 96 92 10 0.28 2.0 3.3 0.3 0.4 71 Mauritius
Mexico 12.3 80.9 66.2 76 7.1 1.9 36.7 1.1 0.4 21.4 6.9 97 98 92 0.01 2.2 2.6 0.1 – 94 Mexico
Micronesia (Federated States of) 1.9 – – 60 – – 151.8 3.6 1.0 – – 69 74 63 3.65 0.2 3.6 0.4 0.2 86 Micronesia (Federated
States of)
Monaco 0.0 – – – – – – – – – – 99 – – – 6.6 20.5 1.0 2.6 81 Monaco
Mongolia 21.0 68.3aj 26.7 63 2.4 0.5 155.9 1.3 1.6 46.5 5.5 99 90 – 6.47 3.3 4.1 0.2 0.5 87 Mongolia
Montenegro 11.9 34.1aj 11.1 54 8.9 1.0 78.6 <0.1 0.5 47.9 44.0 89 86 – 1.84 2.3 5.7 0.0 0.2 56 Montenegro
Morocco 20.8 74.8 32.0 65 – – 49.1 1.9 0.6 47.1 0.8 99 99 98 1.92 0.6 0.9 0.1 0.3 95 Morocco
Mozambique 31.6 50.4ai 167.0 42 1.2 0.3 110.0 27.6 2.9 29.1 5.1 80 51 80 8.10 0.1 0.4 0.0 0.1 69 Mozambique
Myanmar 20.3 75.0 36.0 60 – – 156.4 12.6 1.4 35.2 6.3 90 86 14 2.78 0.6 0.9 0.1 – 62 Myanmar
Namibia 23.9 75.1 82.0 59 – – 145.0 18.3 1.5 34.2 9.7 92 – 81 3.97 0.4 2.8 0.0 0.2 79 Namibia
Nauru – 42.5 – – – – – – – 36.9 43.0 91 96 – 43.29 1.4 7.0 0.6 1.0 42 Nauru
Nepal 17.0 56.1 88.0 46 27.4 3.3 193.8 19.8 0.4 37.8 9.5 87 25 46 2.47 0.6 2.0 – 0.2 22 Nepal
Netherlands 3.4 – 3.2 ≥80 – – 13.7 0.2 0.1 27.3 24.4 95 91 94 – 3.5 10.5 0.5 0.2 95 Netherlands
New Zealand 6.0 – 16.0 ≥80 – – 7.2 0.1 0.2 17.2 14.8 92 89 93 – 3.1 11.1 0.4 0.7 98 New Zealand
Nicaragua 15.3 89.8 92.0 70 27.7 8.9 55.7 2.2 0.6 – – 98 – 98 3.58 0.9 1.4 0.0 – 91 Nicaragua
Niger 26.4 45.4 146.0 33 4.1 0.4 251.8 70.8 4.2 15.4 0.1 67 37 64 3.48 0.0 0.1 0.0 0.0 74 Niger
Nigeria 20.5 26.3aj 145.0 39 24.8 8.9 307.4 68.6 3.0 10.8 0.6 49 – 26 2.87 0.4 1.5 0.0 0.1 51 Nigeria
Niue – – – – – – – – – 19.3 10.5 99 99 99 6.01 1.8 9.8 2.5 0.6 61 Niue
Norway 3.8 – 4.6 ≥80 – – 8.6 0.2 0.2 20.7 19.6 96 91 94 – 4.4 17.8 0.9 0.7 99 Norway
Oman 25.4 39.6 13.5 72 – – 53.9 <0.1 0.4 15.6 0.5 99 99 99 – 1.9 4.2 0.2 0.9 90 Oman
Pakistan 14.2 47.0 44.0 40 1.0 0.0 173.6 19.6 2.3 36.7 2.8 72 53 72 1.63 1.0 0.5 0.1 – 51 Pakistan
Palau 4.8 – – – – – – – – 22.7 7.7 98 95 98 2.72 1.2 5.3 0.2 0.0 91 Palau
Panama 10.0 75.9 84.3 75 1.4 0.2 25.8 1.9 0.4 9.9 2.4 73 92 83 0.46 1.6 2.3 0.3 – 76 Panama
Papua New Guinea 16.8 40.6 – 41 – – 152.0 16.3 1.7 48.8 23.5 72 – 20 2.92 0.1 0.5 0.0 0.0 64 Papua New Guinea
Paraguay 20.7 82.6 62.8 69 – – 57.5 1.5 0.3 21.6 5.0 93 92 99 0.89 1.3 1.0 0.2 – 77 Paraguay
Peru 13.9 66.1 49.4 78 8.3 1.2 63.9 1.3 0.9 – – 89 66 86 0.48 1.1 1.5 0.1 0.1 66 Peru
Philippines 10.5 51.5 57.0 58 6.3 1.4 185.2 4.2 0.2 40.8 7.8 86 66 36 0.73 – 0.2 0.0 0.9 81 Philippines
Poland 10.3 – 12.3 75 13.9 1.6 37.9 <0.1 0.2 33.1 23.3 98 94 – – 2.3 5.7 0.3 0.7 74 Poland
Portugal 7.8 – 8.2 ≥80 18.4 3.3 9.8ak 0.2 0.3 30.0 16.3 98 95 – – 4.4 6.4 0.9 0.9 91 Portugal
Qatar 15.2 68.9aj 10.5 77 – – 47.4 <0.1 0.4 26.9 0.8 98 92 97 – 2.0 5.7 0.6 0.9 76 Qatar
Republic of Korea 12.0 – 1.3 ≥80 13.5 4.0 20.5 1.8 0.5 40.9 6.2 98 97 98 – 2.3 6.9 0.5 0.7 98 Republic of Korea
Republic of Moldova 12.5 60.4 26.7 65 16.1 3.6 78.3 <0.1 1.2 44.6 5.9 89 95 77 3.48 3.2 4.5 0.4 0.5 81 Republic of Moldova
Romania 8.7 – 35.3 72 12.0 2.3 59.3 0.4 0.4 37.1 22.9 89 76 – – 2.7 6.4 0.7 0.8 76 Romania
Russian Federation 18.9 – 24.0 63 4.9 0.6 49.4 0.1 1.7 58.3 23.4 97 97 35 – 4.0 8.7 – – 99 Russian Federation
Rwanda 32.1 65.9 45.0 53 4.6 0.7 121.4 19.3 2.4 21.0 4.7 98 90 98 6.65 0.1 0.8 0.0 0.0 66 Rwanda
Saint Kitts and Nevis – – – – – – – – – 15.2 0.8 97 97 – – – – – – 52 Saint Kitts and Nevis
Saint Lucia 18.1 72.4 – 69 – – 30.0 0.6 0.2 – – 95 88 – 6.33 0.1 – 0.2 – 77 Saint Lucia
Saint Vincent and the Grenadines 8.2 – 63.7 65 – – 47.6 1.3 0.2 – – 98 99 – 0.36 – – – – 65 Saint Vincent and the
Grenadines
Samoa 15.8 39.4 39.2 56 – – 85.0 1.5 0.5 38.1 16.7 62 44 – 22.31 0.3 1.5 0.2 0.3 75 Samoa
San Marino 3.2 – – – – – – – – – – 66 36 12 – 6.4 9.1 0.7 0.7 61 San Marino
Sao Tome and Principe 31.1 50.3 92.0 54 – – 162.4 11.4 0.9 – – 96 76 96 24.88 – – – – 16 Sao Tome and Principe
Saudi Arabia 27.4 – – 68 – – 83.7 <0.1 0.7 25.4 1.8 98 96 98 – 2.6 5.2 0.4 0.7 99 Saudi Arabia
Senegal 27.2 47.4 80.0 41 3.3 0.2 160.7 23.9 2.3 16.6 0.4 93 75 93 5.36 0.1 0.3 0.0 0.0 44 Senegal
Serbia 7.7 25.1aj 16.4 65 9.0 0.7 62.5 0.7 0.3 40.2 37.7 92 90 – 0.10 2.5 4.7 0.3 0.5 44 Serbia
Seychelles 8.6 – 65.8 68 – – 49.3 0.2 0.6 35.7 7.1 96 99 – 34.17 1.0 4.4 0.1 0.0 87 Seychelles
Sierra Leone 27.3 37.5 125.0 36 – – 324.1 81.3 4.1 41.3 8.8 84 50 84 11.30 0.0 0.3 0.0 0.0 70 Sierra Leone
Singapore 3.6 – 2.7 ≥80 – – 25.9 <0.1 0.1 28.3 5.2 97 88 78 – 2.3 7.1 0.4 0.5 99 Singapore
Slovakia 6.6 – 24.3 76 3.8 0.4 33.5 <0.1 0.4 37.7 23.1 96 97 96 – 3.4 6.0 0.5 1.1 95 Slovakia
Slovenia 6.4 – 4.5 78 2.9 0.3 22.6 <0.1 0.3 25.0 20.1 94 93 50 – 2.8 8.8 0.7 0.6 77 Slovenia
Solomon Islands 19.2 38.0 42.0 50 – – 137.0 6.2 0.9 – – 99 – 87 26.32 0.2 1.8 0.1 0.1 57 Solomon Islands
Somalia 25.4 – – 22 – – 212.8 86.6 4.6 – – 42 – – 3.52 0.0 0.1 – – 29 Somalia
South Africa 25.1 77.9ai 71.0 67 1.4 0.1 86.7 13.7 1.2 33.2 8.1 66 70 69 1.55 0.8 5.2 0.2 0.7 91 South Africa
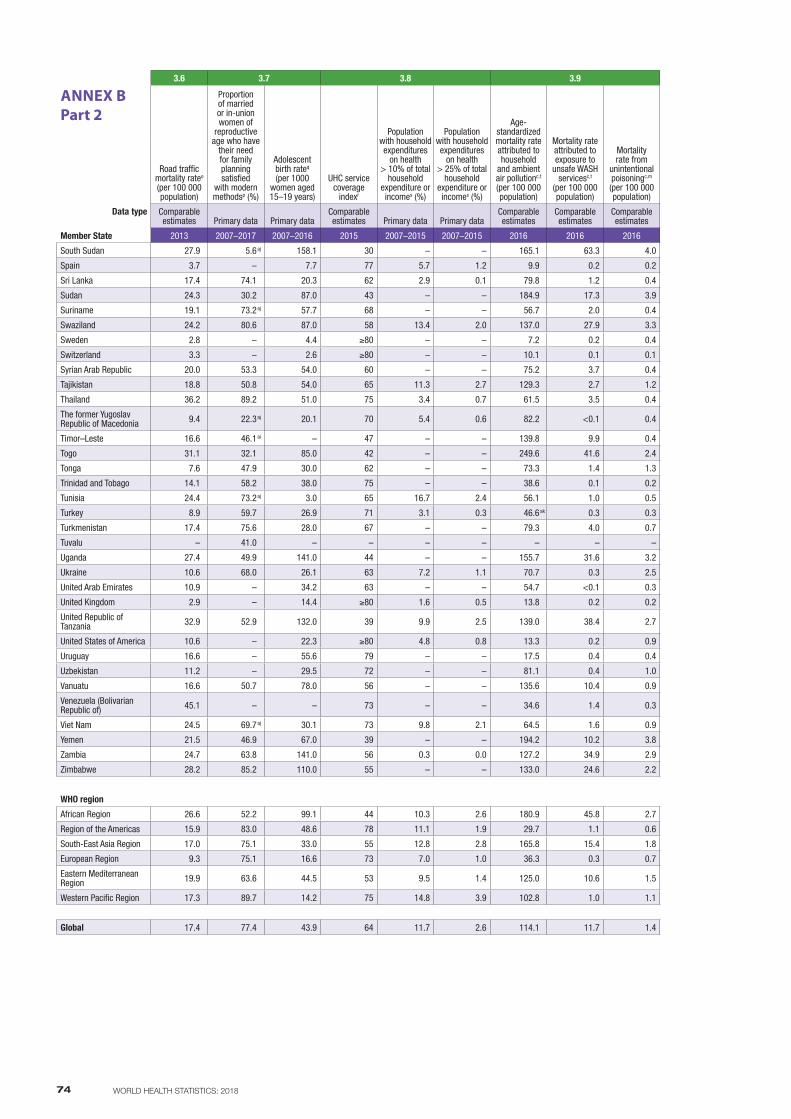
74 WORLD HEALTH STATISTICS: 2018
3.6 3.7 3.8 3.9 3.a 3.b.1 3.b.2 3.c 3.d
Member State
ANNEX BPart 2
Road traffic mortality rateo (per 100 000 population)
Proportion of married or in-union women of
reproductive age who have
their need for family planning satisfied
with modern methodsp (%)
Adolescent birth rateq (per 1000
women aged 15–19 years)
UHC service coverage
indexr
Population with household expenditures
on health > 10% of total
household expenditure or incomes (%)
Population with household expenditures
on health > 25% of total
household expenditure or incomes (%)
Age-standardized mortality rate attributed to household
and ambient air pollutionc,t (per 100 000 population)
Mortality rate attributed to exposure to
unsafe WASH servicesc,t
(per 100 000 population)
Mortality rate from
unintentional poisoningc,m (per 100 000 population)
Diphtheria-tetanus-pertussis (DTP3)
immunization coverage among
1-year-oldsv (%)
Measles-containing-
vaccine second-dose
(MCV2) immunization coverage by the nationally recommended
agev (%)
Pneumococcal conjugate 3rd dose (PCV3)
immunization coverage
among 1-year oldsv (%)
Total net official
development assistance to medical
research and basic health per capitaw (US$), by recipient country
Density of physiciansx (per 1000
population)
Density of nursing and midwifery personnelx (per 1000
population)
Density of dentistry
personnelx (per 1000
population)
Density of pharmaceutical
personnelx (per 1000
population)
Average of 13 International
Health Regulations
core capacity scoresy
Age-standardized prevalence of tobacco
smoking among persons 15 years
and olderu (%)
Male Female
Data type Comparable estimates Primary data Primary data
Comparable estimates Primary data Primary data
Comparable estimates
Comparable estimates
Comparable estimates
Comparable estimates
Comparable estimates
Comparable estimates
Comparable estimates Primary data Primary data Primary data Primary data Primary data Other data
Member State 2013 2007–2017 2007–2016 2015 2007–2015 2007–2015 2016 2016 2016 2016 2016 2016 2016 2016 2007–2016 2007–2016 2007–2016 2007–2016 2010–2017
South Sudan 27.9 5.6aj 158.1 30 – – 165.1 63.3 4.0 – – 26 – – 5.02 – – – – 34 South Sudan
Spain 3.7 – 7.7 77 5.7 1.2 9.9 0.2 0.2 31.4 27.4 97 95 – – 3.9 5.3 0.7 1.2 95 Spain
Sri Lanka 17.4 74.1 20.3 62 2.9 0.1 79.8 1.2 0.4 27.0 0.3 99 99 – 0.98 0.9 2.8 0.1 0.1 76 Sri Lanka
Sudan 24.3 30.2 87.0 43 – – 184.9 17.3 3.9 – – 93 69 93 3.34 0.3 1.2 0.0 0.0 67 Sudan
Suriname 19.1 73.2aj 57.7 68 – – 56.7 2.0 0.4 42.9 7.4 91 44 – 1.09 – – – – 72 Suriname
Swaziland 24.2 80.6 87.0 58 13.4 2.0 137.0 27.9 3.3 16.5 1.7 90 89 90 13.21 0.1 1.4 0.0 0.0 75 Swaziland
Sweden 2.8 – 4.4 ≥80 – – 7.2 0.2 0.4 18.9 18.8 98 95 97 – 4.2 11.9 0.8 0.8 93 Sweden
Switzerland 3.3 – 2.6 ≥80 – – 10.1 0.1 0.1 28.9 22.6 97 89 81 – 4.2 18.2 0.5 0.5 91 Switzerland
Syrian Arab Republic 20.0 53.3 54.0 60 – – 75.2 3.7 0.4 – – 42 52 – 0.71 1.5 2.3 0.9 1.5 64 Syrian Arab Republic
Tajikistan 18.8 50.8 54.0 65 11.3 2.7 129.3 2.7 1.2 – – 96 97 – 3.07 1.7 5.3 0.2 – 89 Tajikistan
Thailand 36.2 89.2 51.0 75 3.4 0.7 61.5 3.5 0.4 38.8 1.9 99 95 – 0.37 0.5 2.3 0.3 0.2 97 Thailand
The former Yugoslav Republic of Macedonia 9.4 22.3aj 20.1 70 5.4 0.6 82.2 <0.1 0.4 – – 95 93 – 0.56 2.9 3.8 0.9 0.5 90 The former Yugoslav
Republic of Macedonia
Timor–Leste 16.6 46.1ai – 47 – – 139.8 9.9 0.4 78.1 6.3 85 22 – 12.12 0.1 1.3 0.0 0.1 72 Timor–Leste
Togo 31.1 32.1 85.0 42 – – 249.6 41.6 2.4 14.2 0.9 89 – 89 4.82 0.1 0.3 0.0 0.0 64 Togo
Tonga 7.6 47.9 30.0 62 – – 73.3 1.4 1.3 44.4 11.8 78 85 – 45.41 0.6 3.9 0.4 0.3 74 Tonga
Trinidad and Tobago 14.1 58.2 38.0 75 – – 38.6 0.1 0.2 – – 97 65 91 – 1.8 3.3 0.3 0.5 72 Trinidad and Tobago
Tunisia 24.4 73.2aj 3.0 65 16.7 2.4 56.1 1.0 0.5 65.8 1.1 98 97 – 0.19 1.3 2.6 0.3 0.3 57 Tunisia
Turkey 8.9 59.7 26.9 71 3.1 0.3 46.6ak 0.3 0.3 41.1 14.1 98 85 98 0.36 1.7 2.6 0.3 0.3 88 Turkey
Turkmenistan 17.4 75.6 28.0 67 – – 79.3 4.0 0.7 – – 98 99 – 1.77 2.3 4.8 0.1 0.2 84 Turkmenistan
Tuvalu – 41.0 – – – – – – – – – 94 92 – 60.03 1.2 6.5 0.4 0.2 54 Tuvalu
Uganda 27.4 49.9 141.0 44 – – 155.7 31.6 3.2 16.7 3.4 78 – 78 6.31 0.1 0.6 0.0 0.0 58 Uganda
Ukraine 10.6 68.0 26.1 63 7.2 1.1 70.7 0.3 2.5 47.4 13.5 19 31 – 1.46 3.0 7.0 0.6 0.0 49 Ukraine
United Arab Emirates 10.9 – 34.2 63 – – 54.7 <0.1 0.3 37.4 1.2 99 99 99 – 1.6 3.1 0.3 0.4 97 United Arab Emirates
United Kingdom 2.9 – 14.4 ≥80 1.6 0.5 13.8 0.2 0.2 24.7 20.0 94 89 92 – 2.8 8.4 0.5 0.9 89 United Kingdom
United Republic of Tanzania 32.9 52.9 132.0 39 9.9 2.5 139.0 38.4 2.7 26.7 3.3 97 71 96 4.66 0.0 0.4 0.0 0.0 69 United Republic of
Tanzania
United States of America 10.6 – 22.3 ≥80 4.8 0.8 13.3 0.2 0.9 24.6 19.1 95 – 93 – 2.6 – – 0.9 100 United States of America
Uruguay 16.6 – 55.6 79 – – 17.5 0.4 0.4 19.9 14.0 95 92 94 0.05 3.9 5.8 0.7 0.3 87 Uruguay
Uzbekistan 11.2 – 29.5 72 – – 81.1 0.4 1.0 24.7 1.3 99 99 99 1.79 2.5 12.5 0.2 0.0 83 Uzbekistan
Vanuatu 16.6 50.7 78.0 56 – – 135.6 10.4 0.9 34.5 2.8 64 – – 7.20 0.2 2.2 0.1 0.1 35 Vanuatu
Venezuela (Bolivarian Republic of) 45.1 – – 73 – – 34.6 1.4 0.3 – – 84 53 7 0.00 – – – – 94 Venezuela (Bolivarian
Republic of)
Viet Nam 24.5 69.7aj 30.1 73 9.8 2.1 64.5 1.6 0.9 45.9 1.0 96 95 – 0.84 0.8 1.4 – 0.3 95 Viet Nam
Yemen 21.5 46.9 67.0 39 – – 194.2 10.2 3.8 29.2 7.6 71 49 71 2.44 0.3 0.8 0.0 0.1 48 Yemen
Zambia 24.7 63.8 141.0 56 0.3 0.0 127.2 34.9 2.9 24.7 3.1 91 58 90 10.75 0.1 0.9 0.0 0.1 64 Zambia
Zimbabwe 28.2 85.2 110.0 55 – – 133.0 24.6 2.2 30.7 1.6 90 63 90 4.94 0.1 1.2 0.0 0.0 72 Zimbabwe
WHO region WHO region
African Region 26.6 52.2 99.1 44 10.3 2.6 180.9 45.8 2.7 17.5 2.2 74 24 65 – – – – – 56 African Region
Region of the Americas 15.9 83.0 48.6 78 11.1 1.9 29.7 1.1 0.6 21.4 12.4 91 54 84 – – – – – 80 Region of the Americas
South-East Asia Region 17.0 75.1 33.0 55 12.8 2.8 165.8 15.4 1.8 31.6 2.2 88 75 9 – – – – – 73 South-East Asia Region
European Region 9.3 75.1 16.6 73 7.0 1.0 36.3 0.3 0.7 38.1 20.7 92 88 62 – – – – – 79 European Region
Eastern Mediterranean Region 19.9 63.6 44.5 53 9.5 1.4 125.0 10.6 1.5 34.0 2.2 80 69 48 – – – – – 72 Eastern Mediterranean
Region
Western Pacific Region 17.3 89.7 14.2 75 14.8 3.9 102.8 1.0 1.1 46.0 3.0 97 93 14 – – – – – 79 Western Pacific Region
Global 17.4 77.4 43.9 64 11.7 2.6 114.1 11.7 1.4 33.7 6.2 86 64 42 – – – – – 71 Global
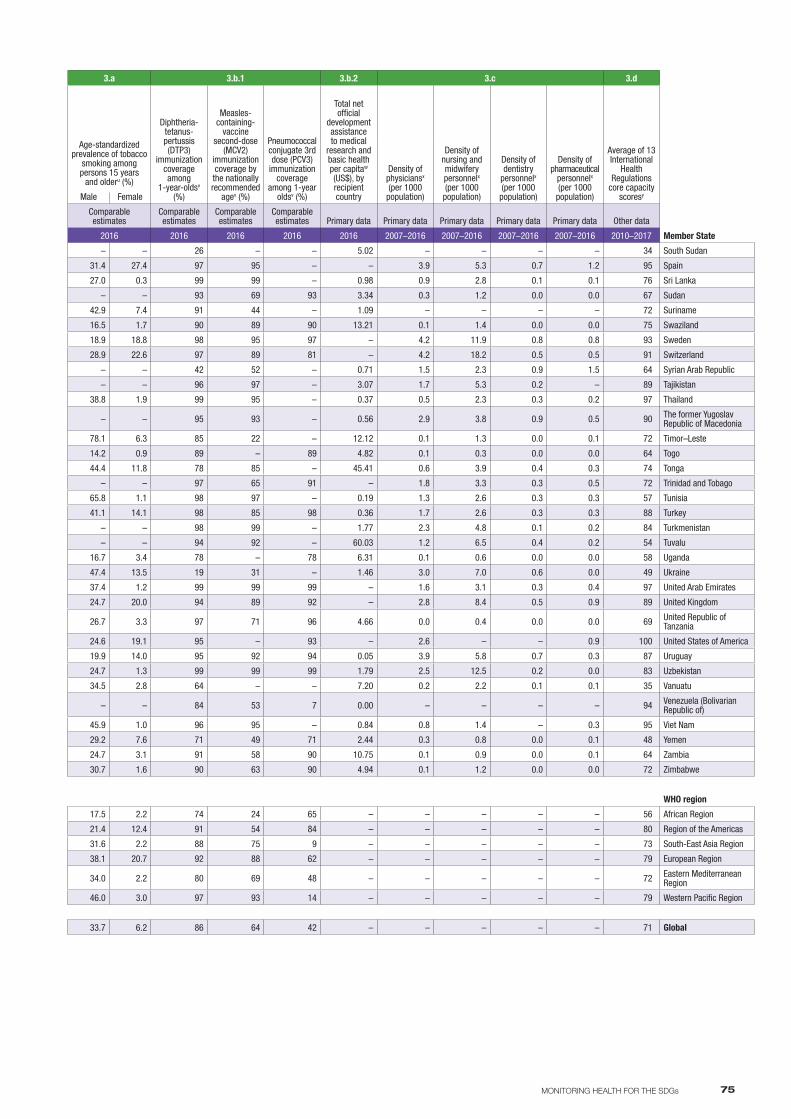
75MONITORING HEALTH FOR THE SDGs
3.6 3.7 3.8 3.9 3.a 3.b.1 3.b.2 3.c 3.d
Member State
ANNEX BPart 2
Road traffic mortality rateo (per 100 000 population)
Proportion of married or in-union women of
reproductive age who have
their need for family planning satisfied
with modern methodsp (%)
Adolescent birth rateq (per 1000
women aged 15–19 years)
UHC service coverage
indexr
Population with household expenditures
on health > 10% of total
household expenditure or incomes (%)
Population with household expenditures
on health > 25% of total
household expenditure or incomes (%)
Age-standardized mortality rate attributed to household
and ambient air pollutionc,t (per 100 000 population)
Mortality rate attributed to exposure to
unsafe WASH servicesc,t
(per 100 000 population)
Mortality rate from
unintentional poisoningc,m (per 100 000 population)
Diphtheria-tetanus-pertussis (DTP3)
immunization coverage among
1-year-oldsv (%)
Measles-containing-
vaccine second-dose
(MCV2) immunization coverage by the nationally recommended
agev (%)
Pneumococcal conjugate 3rd dose (PCV3)
immunization coverage
among 1-year oldsv (%)
Total net official
development assistance to medical
research and basic health per capitaw (US$), by recipient country
Density of physiciansx (per 1000
population)
Density of nursing and midwifery personnelx (per 1000
population)
Density of dentistry
personnelx (per 1000
population)
Density of pharmaceutical
personnelx (per 1000
population)
Average of 13 International
Health Regulations
core capacity scoresy
Age-standardized prevalence of tobacco
smoking among persons 15 years
and olderu (%)
Male Female
Data type Comparable estimates Primary data Primary data
Comparable estimates Primary data Primary data
Comparable estimates
Comparable estimates
Comparable estimates
Comparable estimates
Comparable estimates
Comparable estimates
Comparable estimates Primary data Primary data Primary data Primary data Primary data Other data
Member State 2013 2007–2017 2007–2016 2015 2007–2015 2007–2015 2016 2016 2016 2016 2016 2016 2016 2016 2007–2016 2007–2016 2007–2016 2007–2016 2010–2017
South Sudan 27.9 5.6aj 158.1 30 – – 165.1 63.3 4.0 – – 26 – – 5.02 – – – – 34 South Sudan
Spain 3.7 – 7.7 77 5.7 1.2 9.9 0.2 0.2 31.4 27.4 97 95 – – 3.9 5.3 0.7 1.2 95 Spain
Sri Lanka 17.4 74.1 20.3 62 2.9 0.1 79.8 1.2 0.4 27.0 0.3 99 99 – 0.98 0.9 2.8 0.1 0.1 76 Sri Lanka
Sudan 24.3 30.2 87.0 43 – – 184.9 17.3 3.9 – – 93 69 93 3.34 0.3 1.2 0.0 0.0 67 Sudan
Suriname 19.1 73.2aj 57.7 68 – – 56.7 2.0 0.4 42.9 7.4 91 44 – 1.09 – – – – 72 Suriname
Swaziland 24.2 80.6 87.0 58 13.4 2.0 137.0 27.9 3.3 16.5 1.7 90 89 90 13.21 0.1 1.4 0.0 0.0 75 Swaziland
Sweden 2.8 – 4.4 ≥80 – – 7.2 0.2 0.4 18.9 18.8 98 95 97 – 4.2 11.9 0.8 0.8 93 Sweden
Switzerland 3.3 – 2.6 ≥80 – – 10.1 0.1 0.1 28.9 22.6 97 89 81 – 4.2 18.2 0.5 0.5 91 Switzerland
Syrian Arab Republic 20.0 53.3 54.0 60 – – 75.2 3.7 0.4 – – 42 52 – 0.71 1.5 2.3 0.9 1.5 64 Syrian Arab Republic
Tajikistan 18.8 50.8 54.0 65 11.3 2.7 129.3 2.7 1.2 – – 96 97 – 3.07 1.7 5.3 0.2 – 89 Tajikistan
Thailand 36.2 89.2 51.0 75 3.4 0.7 61.5 3.5 0.4 38.8 1.9 99 95 – 0.37 0.5 2.3 0.3 0.2 97 Thailand
The former Yugoslav Republic of Macedonia 9.4 22.3aj 20.1 70 5.4 0.6 82.2 <0.1 0.4 – – 95 93 – 0.56 2.9 3.8 0.9 0.5 90 The former Yugoslav
Republic of Macedonia
Timor–Leste 16.6 46.1ai – 47 – – 139.8 9.9 0.4 78.1 6.3 85 22 – 12.12 0.1 1.3 0.0 0.1 72 Timor–Leste
Togo 31.1 32.1 85.0 42 – – 249.6 41.6 2.4 14.2 0.9 89 – 89 4.82 0.1 0.3 0.0 0.0 64 Togo
Tonga 7.6 47.9 30.0 62 – – 73.3 1.4 1.3 44.4 11.8 78 85 – 45.41 0.6 3.9 0.4 0.3 74 Tonga
Trinidad and Tobago 14.1 58.2 38.0 75 – – 38.6 0.1 0.2 – – 97 65 91 – 1.8 3.3 0.3 0.5 72 Trinidad and Tobago
Tunisia 24.4 73.2aj 3.0 65 16.7 2.4 56.1 1.0 0.5 65.8 1.1 98 97 – 0.19 1.3 2.6 0.3 0.3 57 Tunisia
Turkey 8.9 59.7 26.9 71 3.1 0.3 46.6ak 0.3 0.3 41.1 14.1 98 85 98 0.36 1.7 2.6 0.3 0.3 88 Turkey
Turkmenistan 17.4 75.6 28.0 67 – – 79.3 4.0 0.7 – – 98 99 – 1.77 2.3 4.8 0.1 0.2 84 Turkmenistan
Tuvalu – 41.0 – – – – – – – – – 94 92 – 60.03 1.2 6.5 0.4 0.2 54 Tuvalu
Uganda 27.4 49.9 141.0 44 – – 155.7 31.6 3.2 16.7 3.4 78 – 78 6.31 0.1 0.6 0.0 0.0 58 Uganda
Ukraine 10.6 68.0 26.1 63 7.2 1.1 70.7 0.3 2.5 47.4 13.5 19 31 – 1.46 3.0 7.0 0.6 0.0 49 Ukraine
United Arab Emirates 10.9 – 34.2 63 – – 54.7 <0.1 0.3 37.4 1.2 99 99 99 – 1.6 3.1 0.3 0.4 97 United Arab Emirates
United Kingdom 2.9 – 14.4 ≥80 1.6 0.5 13.8 0.2 0.2 24.7 20.0 94 89 92 – 2.8 8.4 0.5 0.9 89 United Kingdom
United Republic of Tanzania 32.9 52.9 132.0 39 9.9 2.5 139.0 38.4 2.7 26.7 3.3 97 71 96 4.66 0.0 0.4 0.0 0.0 69 United Republic of
Tanzania
United States of America 10.6 – 22.3 ≥80 4.8 0.8 13.3 0.2 0.9 24.6 19.1 95 – 93 – 2.6 – – 0.9 100 United States of America
Uruguay 16.6 – 55.6 79 – – 17.5 0.4 0.4 19.9 14.0 95 92 94 0.05 3.9 5.8 0.7 0.3 87 Uruguay
Uzbekistan 11.2 – 29.5 72 – – 81.1 0.4 1.0 24.7 1.3 99 99 99 1.79 2.5 12.5 0.2 0.0 83 Uzbekistan
Vanuatu 16.6 50.7 78.0 56 – – 135.6 10.4 0.9 34.5 2.8 64 – – 7.20 0.2 2.2 0.1 0.1 35 Vanuatu
Venezuela (Bolivarian Republic of) 45.1 – – 73 – – 34.6 1.4 0.3 – – 84 53 7 0.00 – – – – 94 Venezuela (Bolivarian
Republic of)
Viet Nam 24.5 69.7aj 30.1 73 9.8 2.1 64.5 1.6 0.9 45.9 1.0 96 95 – 0.84 0.8 1.4 – 0.3 95 Viet Nam
Yemen 21.5 46.9 67.0 39 – – 194.2 10.2 3.8 29.2 7.6 71 49 71 2.44 0.3 0.8 0.0 0.1 48 Yemen
Zambia 24.7 63.8 141.0 56 0.3 0.0 127.2 34.9 2.9 24.7 3.1 91 58 90 10.75 0.1 0.9 0.0 0.1 64 Zambia
Zimbabwe 28.2 85.2 110.0 55 – – 133.0 24.6 2.2 30.7 1.6 90 63 90 4.94 0.1 1.2 0.0 0.0 72 Zimbabwe
WHO region WHO region
African Region 26.6 52.2 99.1 44 10.3 2.6 180.9 45.8 2.7 17.5 2.2 74 24 65 – – – – – 56 African Region
Region of the Americas 15.9 83.0 48.6 78 11.1 1.9 29.7 1.1 0.6 21.4 12.4 91 54 84 – – – – – 80 Region of the Americas
South-East Asia Region 17.0 75.1 33.0 55 12.8 2.8 165.8 15.4 1.8 31.6 2.2 88 75 9 – – – – – 73 South-East Asia Region
European Region 9.3 75.1 16.6 73 7.0 1.0 36.3 0.3 0.7 38.1 20.7 92 88 62 – – – – – 79 European Region
Eastern Mediterranean Region 19.9 63.6 44.5 53 9.5 1.4 125.0 10.6 1.5 34.0 2.2 80 69 48 – – – – – 72 Eastern Mediterranean
Region
Western Pacific Region 17.3 89.7 14.2 75 14.8 3.9 102.8 1.0 1.1 46.0 3.0 97 93 14 – – – – – 79 Western Pacific Region
Global 17.4 77.4 43.9 64 11.7 2.6 114.1 11.7 1.4 33.7 6.2 86 64 42 – – – – – 71 Global
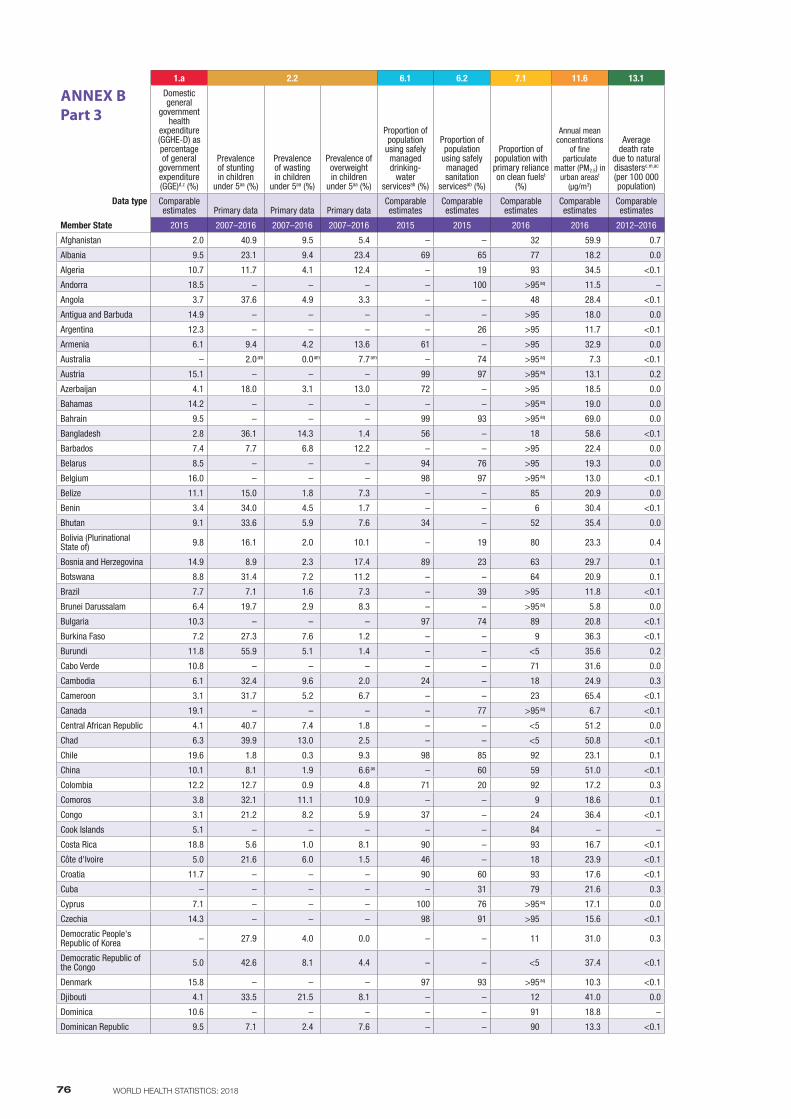
76 WORLD HEALTH STATISTICS: 2018
1.a 2.2 6.1 6.2 7.1 11.6 13.1 16.1 17.19.2
Member State
ANNEX BPart 3
Domestic general
government health
expenditure (GGHE-D) as percentage of general
government expenditure (GGE)d,z (%)
Prevalence of stunting in children
under 5aa (%)
Prevalence of wasting in children
under 5aa (%)
Prevalence of overweight in children
under 5aa (%)
Proportion of population
using safely managed drinking-
water servicesab (%)
Proportion of population
using safely managed sanitation
servicesab (%)
Proportion of population with primary reliance on clean fuelst
(%)
Annual mean concentrations
of fine particulate
matter (PM2.5) in urban areast
(µg/m3)
Average death rate
due to natural disastersc,m,ac (per 100 000 population)
Mortality rate due to homicidec,m
(per 100 000 population)
Estimated direct deaths from major
conflictsc,m,ac,ad (per 100 000 population)
Completeness of cause-of-
death datac,m,ae (%)
Data type Comparable estimates Primary data Primary data Primary data
Comparable estimates
Comparable estimates
Comparable estimates
Comparable estimates
Comparable estimates
Comparable estimates
Comparable estimates
Comparable estimates
Member State 2015 2007–2016 2007–2016 2007–2016 2015 2015 2016 2016 2012–2016 2016 2012–2016 2007–2016
Afghanistan 2.0 40.9 9.5 5.4 – – 32 59.9 0.7 7.4 37.3 – Afghanistan
Albania 9.5 23.1 9.4 23.4 69 65 77 18.2 0.0 4.2 <0.1 55ar Albania
Algeria 10.7 11.7 4.1 12.4 – 19 93 34.5 <0.1 4.2 0.7 – Algeria
Andorra 18.5 – – – – 100 >95aq 11.5 – – – 100 Andorra
Angola 3.7 37.6 4.9 3.3 – – 48 28.4 <0.1 9.8 <0.1 – Angola
Antigua and Barbuda 14.9 – – – – – >95 18.0 0.0 1.8 0.0 87 Antigua and Barbuda
Argentina 12.3 – – – – 26 >95 11.7 <0.1 6.2 <0.1 100 Argentina
Armenia 6.1 9.4 4.2 13.6 61 – >95 32.9 0.0 2.4 <0.1 100 Armenia
Australia – 2.0am 0.0am 7.7am – 74 >95aq 7.3 <0.1 1.1 <0.1 100 Australia
Austria 15.1 – – – 99 97 >95aq 13.1 0.2 0.5 <0.1 100 Austria
Azerbaijan 4.1 18.0 3.1 13.0 72 – >95 18.5 0.0 2.4 0.8 95ar Azerbaijan
Bahamas 14.2 – – – – – >95aq 19.0 0.0 29.7 0.0 86 Bahamas
Bahrain 9.5 – – – 99 93 >95aq 69.0 0.0 0.8 0.3 96 Bahrain
Bangladesh 2.8 36.1 14.3 1.4 56 – 18 58.6 <0.1 2.9 <0.1 – Bangladesh
Barbados 7.4 7.7 6.8 12.2 – – >95 22.4 0.0 10.0 0.0 78 Barbados
Belarus 8.5 – – – 94 76 >95 19.3 0.0 5.2 <0.1 100 Belarus
Belgium 16.0 – – – 98 97 >95aq 13.0 <0.1 1.0 <0.1 100 Belgium
Belize 11.1 15.0 1.8 7.3 – – 85 20.9 0.0 29.4 0.0 86 Belize
Benin 3.4 34.0 4.5 1.7 – – 6 30.4 <0.1 6.4 0.0 – Benin
Bhutan 9.1 33.6 5.9 7.6 34 – 52 35.4 0.0 1.7 0.0 – Bhutan
Bolivia (Plurinational State of) 9.8 16.1 2.0 10.1 – 19 80 23.3 0.4 14.1 0.0 – Bolivia (Plurinational
State of)
Bosnia and Herzegovina 14.9 8.9 2.3 17.4 89 23 63 29.7 0.1 3.3 <0.1 93 Bosnia and Herzegovina
Botswana 8.8 31.4 7.2 11.2 – – 64 20.9 0.1 11.4 0.0 – Botswana
Brazil 7.7 7.1 1.6 7.3 – 39 >95 11.8 <0.1 31.3 0.3 97 Brazil
Brunei Darussalam 6.4 19.7 2.9 8.3 – – >95aq 5.8 0.0 2.0 0.0 97 Brunei Darussalam
Bulgaria 10.3 – – – 97 74 89 20.8 <0.1 1.7 <0.1 100 Bulgaria
Burkina Faso 7.2 27.3 7.6 1.2 – – 9 36.3 <0.1 9.8 0.2 – Burkina Faso
Burundi 11.8 55.9 5.1 1.4 – – <5 35.6 0.2 6.6 1.5 – Burundi
Cabo Verde 10.8 – – – – – 71 31.6 0.0 8.2 0.0 92 Cabo Verde
Cambodia 6.1 32.4 9.6 2.0 24 – 18 24.9 0.3 2.2 0.0 – Cambodia
Cameroon 3.1 31.7 5.2 6.7 – – 23 65.4 <0.1 11.6 3.7 – Cameroon
Canada 19.1 – – – – 77 >95aq 6.7 <0.1 1.5 <0.1 100 Canada
Central African Republic 4.1 40.7 7.4 1.8 – – <5 51.2 0.0 13.8 32.4 – Central African Republic
Chad 6.3 39.9 13.0 2.5 – – <5 50.8 <0.1 9.6 3.8 – Chad
Chile 19.6 1.8 0.3 9.3 98 85 92 23.1 0.1 4.4 <0.1 97 Chile
China 10.1 8.1 1.9 6.6as – 60 59 51.0 <0.1 0.9 <0.1 62 China
Colombia 12.2 12.7 0.9 4.8 71 20 92 17.2 0.3 43.1 0.5 79 Colombia
Comoros 3.8 32.1 11.1 10.9 – – 9 18.6 0.1 7.9 0.0 – Comoros
Congo 3.1 21.2 8.2 5.9 37 – 24 36.4 <0.1 10.2 0.4 – Congo
Cook Islands 5.1 – – – – – 84 – – – – 100 Cook Islands
Costa Rica 18.8 5.6 1.0 8.1 90 – 93 16.7 <0.1 10.2 0.0 87 Costa Rica
Côte d'Ivoire 5.0 21.6 6.0 1.5 46 – 18 23.9 <0.1 12.1 <0.1 – Côte d'Ivoire
Croatia 11.7 – – – 90 60 93 17.6 <0.1 1.0 <0.1 100 Croatia
Cuba – – – – – 31 79 21.6 0.3 5.5 <0.1 100 Cuba
Cyprus 7.1 – – – 100 76 >95aq 17.1 0.0 1.4 <0.1 74 Cyprus
Czechia 14.3 – – – 98 91 >95 15.6 <0.1 0.8 <0.1 100 Czechia
Democratic People's Republic of Korea – 27.9 4.0 0.0 – – 11 31.0 0.3 4.4 <0.1 – Democratic People's
Republic of Korea
Democratic Republic of the Congo 5.0 42.6 8.1 4.4 – – <5 37.4 <0.1 13.3 2.2 – Democratic Republic of
the Congo
Denmark 15.8 – – – 97 93 >95aq 10.3 <0.1 0.8 <0.1 100 Denmark
Djibouti 4.1 33.5 21.5 8.1 – – 12 41.0 0.0 6.8 2.0 – Djibouti
Dominica 10.6 – – – – – 91 18.8 – – – 100 Dominica
Dominican Republic 9.5 7.1 2.4 7.6 – – 90 13.3 <0.1 16.8 0.0 59 Dominican Republic
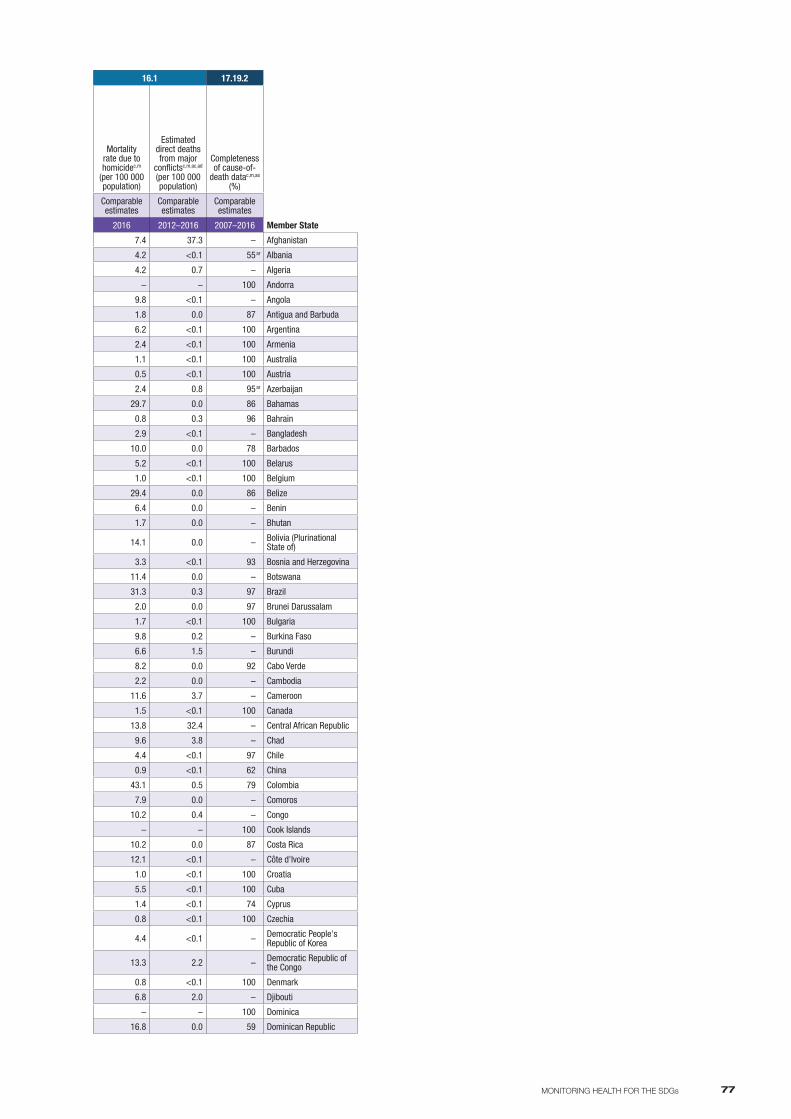
77MONITORING HEALTH FOR THE SDGs
1.a 2.2 6.1 6.2 7.1 11.6 13.1 16.1 17.19.2
Member State
ANNEX BPart 3
Domestic general
government health
expenditure (GGHE-D) as percentage of general
government expenditure (GGE)d,z (%)
Prevalence of stunting in children
under 5aa (%)
Prevalence of wasting in children
under 5aa (%)
Prevalence of overweight in children
under 5aa (%)
Proportion of population
using safely managed drinking-
water servicesab (%)
Proportion of population
using safely managed sanitation
servicesab (%)
Proportion of population with primary reliance on clean fuelst
(%)
Annual mean concentrations
of fine particulate
matter (PM2.5) in urban areast
(µg/m3)
Average death rate
due to natural disastersc,m,ac (per 100 000 population)
Mortality rate due to homicidec,m
(per 100 000 population)
Estimated direct deaths from major
conflictsc,m,ac,ad (per 100 000 population)
Completeness of cause-of-
death datac,m,ae (%)
Data type Comparable estimates Primary data Primary data Primary data
Comparable estimates
Comparable estimates
Comparable estimates
Comparable estimates
Comparable estimates
Comparable estimates
Comparable estimates
Comparable estimates
Member State 2015 2007–2016 2007–2016 2007–2016 2015 2015 2016 2016 2012–2016 2016 2012–2016 2007–2016
Afghanistan 2.0 40.9 9.5 5.4 – – 32 59.9 0.7 7.4 37.3 – Afghanistan
Albania 9.5 23.1 9.4 23.4 69 65 77 18.2 0.0 4.2 <0.1 55ar Albania
Algeria 10.7 11.7 4.1 12.4 – 19 93 34.5 <0.1 4.2 0.7 – Algeria
Andorra 18.5 – – – – 100 >95aq 11.5 – – – 100 Andorra
Angola 3.7 37.6 4.9 3.3 – – 48 28.4 <0.1 9.8 <0.1 – Angola
Antigua and Barbuda 14.9 – – – – – >95 18.0 0.0 1.8 0.0 87 Antigua and Barbuda
Argentina 12.3 – – – – 26 >95 11.7 <0.1 6.2 <0.1 100 Argentina
Armenia 6.1 9.4 4.2 13.6 61 – >95 32.9 0.0 2.4 <0.1 100 Armenia
Australia – 2.0am 0.0am 7.7am – 74 >95aq 7.3 <0.1 1.1 <0.1 100 Australia
Austria 15.1 – – – 99 97 >95aq 13.1 0.2 0.5 <0.1 100 Austria
Azerbaijan 4.1 18.0 3.1 13.0 72 – >95 18.5 0.0 2.4 0.8 95ar Azerbaijan
Bahamas 14.2 – – – – – >95aq 19.0 0.0 29.7 0.0 86 Bahamas
Bahrain 9.5 – – – 99 93 >95aq 69.0 0.0 0.8 0.3 96 Bahrain
Bangladesh 2.8 36.1 14.3 1.4 56 – 18 58.6 <0.1 2.9 <0.1 – Bangladesh
Barbados 7.4 7.7 6.8 12.2 – – >95 22.4 0.0 10.0 0.0 78 Barbados
Belarus 8.5 – – – 94 76 >95 19.3 0.0 5.2 <0.1 100 Belarus
Belgium 16.0 – – – 98 97 >95aq 13.0 <0.1 1.0 <0.1 100 Belgium
Belize 11.1 15.0 1.8 7.3 – – 85 20.9 0.0 29.4 0.0 86 Belize
Benin 3.4 34.0 4.5 1.7 – – 6 30.4 <0.1 6.4 0.0 – Benin
Bhutan 9.1 33.6 5.9 7.6 34 – 52 35.4 0.0 1.7 0.0 – Bhutan
Bolivia (Plurinational State of) 9.8 16.1 2.0 10.1 – 19 80 23.3 0.4 14.1 0.0 – Bolivia (Plurinational
State of)
Bosnia and Herzegovina 14.9 8.9 2.3 17.4 89 23 63 29.7 0.1 3.3 <0.1 93 Bosnia and Herzegovina
Botswana 8.8 31.4 7.2 11.2 – – 64 20.9 0.1 11.4 0.0 – Botswana
Brazil 7.7 7.1 1.6 7.3 – 39 >95 11.8 <0.1 31.3 0.3 97 Brazil
Brunei Darussalam 6.4 19.7 2.9 8.3 – – >95aq 5.8 0.0 2.0 0.0 97 Brunei Darussalam
Bulgaria 10.3 – – – 97 74 89 20.8 <0.1 1.7 <0.1 100 Bulgaria
Burkina Faso 7.2 27.3 7.6 1.2 – – 9 36.3 <0.1 9.8 0.2 – Burkina Faso
Burundi 11.8 55.9 5.1 1.4 – – <5 35.6 0.2 6.6 1.5 – Burundi
Cabo Verde 10.8 – – – – – 71 31.6 0.0 8.2 0.0 92 Cabo Verde
Cambodia 6.1 32.4 9.6 2.0 24 – 18 24.9 0.3 2.2 0.0 – Cambodia
Cameroon 3.1 31.7 5.2 6.7 – – 23 65.4 <0.1 11.6 3.7 – Cameroon
Canada 19.1 – – – – 77 >95aq 6.7 <0.1 1.5 <0.1 100 Canada
Central African Republic 4.1 40.7 7.4 1.8 – – <5 51.2 0.0 13.8 32.4 – Central African Republic
Chad 6.3 39.9 13.0 2.5 – – <5 50.8 <0.1 9.6 3.8 – Chad
Chile 19.6 1.8 0.3 9.3 98 85 92 23.1 0.1 4.4 <0.1 97 Chile
China 10.1 8.1 1.9 6.6as – 60 59 51.0 <0.1 0.9 <0.1 62 China
Colombia 12.2 12.7 0.9 4.8 71 20 92 17.2 0.3 43.1 0.5 79 Colombia
Comoros 3.8 32.1 11.1 10.9 – – 9 18.6 0.1 7.9 0.0 – Comoros
Congo 3.1 21.2 8.2 5.9 37 – 24 36.4 <0.1 10.2 0.4 – Congo
Cook Islands 5.1 – – – – – 84 – – – – 100 Cook Islands
Costa Rica 18.8 5.6 1.0 8.1 90 – 93 16.7 <0.1 10.2 0.0 87 Costa Rica
Côte d'Ivoire 5.0 21.6 6.0 1.5 46 – 18 23.9 <0.1 12.1 <0.1 – Côte d'Ivoire
Croatia 11.7 – – – 90 60 93 17.6 <0.1 1.0 <0.1 100 Croatia
Cuba – – – – – 31 79 21.6 0.3 5.5 <0.1 100 Cuba
Cyprus 7.1 – – – 100 76 >95aq 17.1 0.0 1.4 <0.1 74 Cyprus
Czechia 14.3 – – – 98 91 >95 15.6 <0.1 0.8 <0.1 100 Czechia
Democratic People's Republic of Korea – 27.9 4.0 0.0 – – 11 31.0 0.3 4.4 <0.1 – Democratic People's
Republic of Korea
Democratic Republic of the Congo 5.0 42.6 8.1 4.4 – – <5 37.4 <0.1 13.3 2.2 – Democratic Republic of
the Congo
Denmark 15.8 – – – 97 93 >95aq 10.3 <0.1 0.8 <0.1 100 Denmark
Djibouti 4.1 33.5 21.5 8.1 – – 12 41.0 0.0 6.8 2.0 – Djibouti
Dominica 10.6 – – – – – 91 18.8 – – – 100 Dominica
Dominican Republic 9.5 7.1 2.4 7.6 – – 90 13.3 <0.1 16.8 0.0 59 Dominican Republic
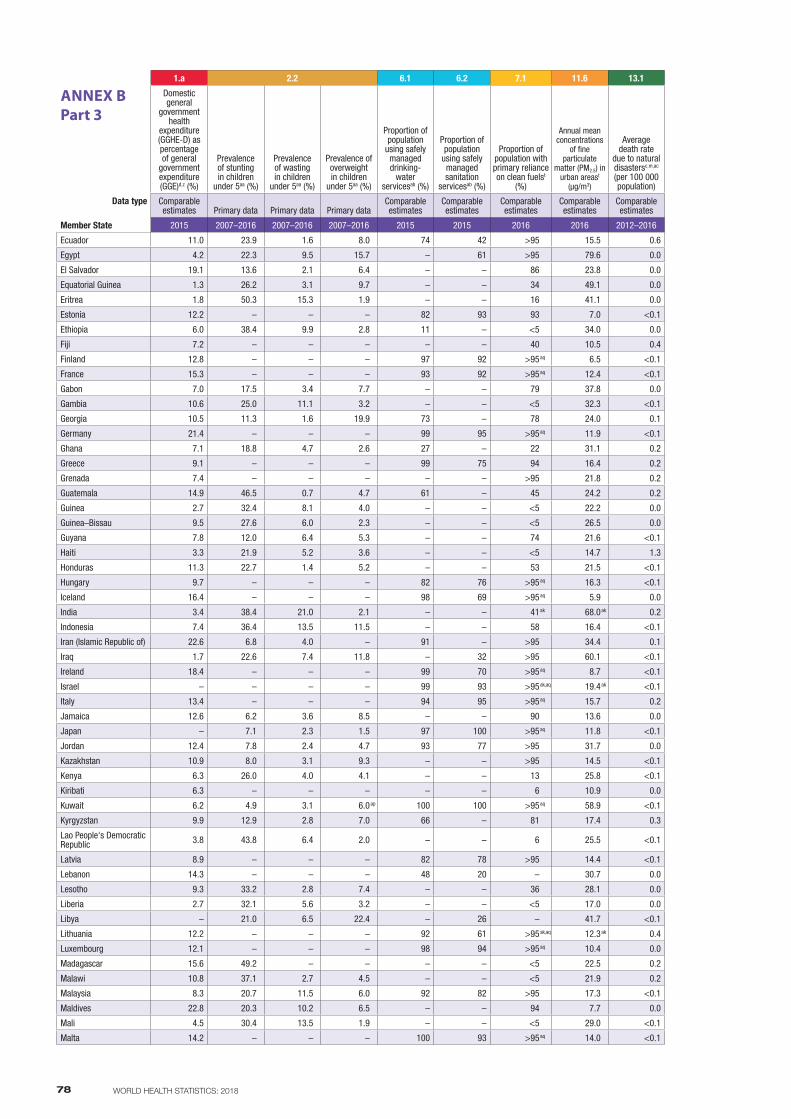
78 WORLD HEALTH STATISTICS: 2018
1.a 2.2 6.1 6.2 7.1 11.6 13.1 16.1 17.19.2
Member State
ANNEX BPart 3
Domestic general
government health
expenditure (GGHE-D) as percentage of general
government expenditure (GGE)d,z (%)
Prevalence of stunting in children
under 5aa (%)
Prevalence of wasting in children
under 5aa (%)
Prevalence of overweight in children
under 5aa (%)
Proportion of population
using safely managed drinking-
water servicesab (%)
Proportion of population
using safely managed sanitation
servicesab (%)
Proportion of population with primary reliance on clean fuelst
(%)
Annual mean concentrations
of fine particulate
matter (PM2.5) in urban areast
(µg/m3)
Average death rate
due to natural disastersc,m,ac (per 100 000 population)
Mortality rate due to homicidec,m
(per 100 000 population)
Estimated direct deaths from major
conflictsc,m,ac,ad (per 100 000 population)
Completeness of cause-of-
death datac,m,ae (%)
Data type Comparable estimates Primary data Primary data Primary data
Comparable estimates
Comparable estimates
Comparable estimates
Comparable estimates
Comparable estimates
Comparable estimates
Comparable estimates
Comparable estimates
Member State 2015 2007–2016 2007–2016 2007–2016 2015 2015 2016 2016 2012–2016 2016 2012–2016 2007–2016
Ecuador 11.0 23.9 1.6 8.0 74 42 >95 15.5 0.6 9.3 <0.1 81 Ecuador
Egypt 4.2 22.3 9.5 15.7 – 61 >95 79.6 0.0 4.8 0.6 94 Egypt
El Salvador 19.1 13.6 2.1 6.4 – – 86 23.8 0.0 46.0 0.0 92 El Salvador
Equatorial Guinea 1.3 26.2 3.1 9.7 – – 34 49.1 0.0 3.4 0.0 – Equatorial Guinea
Eritrea 1.8 50.3 15.3 1.9 – – 16 41.1 0.0 7.8 0.0 – Eritrea
Estonia 12.2 – – – 82 93 93 7.0 <0.1 3.7 <0.1 100 Estonia
Ethiopia 6.0 38.4 9.9 2.8 11 – <5 34.0 0.0 7.8 0.2 – Ethiopia
Fiji 7.2 – – – – – 40 10.5 0.4 2.5 0.0 100 Fiji
Finland 12.8 – – – 97 92 >95aq 6.5 <0.1 1.3 <0.1 100 Finland
France 15.3 – – – 93 92 >95aq 12.4 <0.1 0.9 <0.1 100 France
Gabon 7.0 17.5 3.4 7.7 – – 79 37.8 0.0 8.8 0.0 – Gabon
Gambia 10.6 25.0 11.1 3.2 – – <5 32.3 <0.1 9.3 0.0 – Gambia
Georgia 10.5 11.3 1.6 19.9 73 – 78 24.0 0.1 4.6 <0.1 90 Georgia
Germany 21.4 – – – 99 95 >95aq 11.9 <0.1 0.7 <0.1 100 Germany
Ghana 7.1 18.8 4.7 2.6 27 – 22 31.1 0.2 9.7 0.0 – Ghana
Greece 9.1 – – – 99 75 94 16.4 0.2 1.1 <0.1 100 Greece
Grenada 7.4 – – – – – >95 21.8 0.2 6.3 0.0 100 Grenada
Guatemala 14.9 46.5 0.7 4.7 61 – 45 24.2 0.2 25.8 <0.1 100 Guatemala
Guinea 2.7 32.4 8.1 4.0 – – <5 22.2 0.0 8.9 0.2 – Guinea
Guinea–Bissau 9.5 27.6 6.0 2.3 – – <5 26.5 0.0 9.2 <0.1 – Guinea–Bissau
Guyana 7.8 12.0 6.4 5.3 – – 74 21.6 <0.1 18.8 0.2 90 Guyana
Haiti 3.3 21.9 5.2 3.6 – – <5 14.7 1.3 28.0 0.0 – Haiti
Honduras 11.3 22.7 1.4 5.2 – – 53 21.5 <0.1 55.5 <0.1 14 Honduras
Hungary 9.7 – – – 82 76 >95aq 16.3 <0.1 1.3 <0.1 100 Hungary
Iceland 16.4 – – – 98 69 >95aq 5.9 0.0 1.2 <0.1 100 Iceland
India 3.4 38.4 21.0 2.1 – – 41ak 68.0ak 0.2 4.1 <0.1 10ar India
Indonesia 7.4 36.4 13.5 11.5 – – 58 16.4 <0.1 4.5 <0.1 – Indonesia
Iran (Islamic Republic of) 22.6 6.8 4.0 – 91 – >95 34.4 0.1 4.5 <0.1 88 Iran (Islamic Republic of)
Iraq 1.7 22.6 7.4 11.8 – 32 >95 60.1 <0.1 15.5 86.3 78ar Iraq
Ireland 18.4 – – – 99 70 >95aq 8.7 <0.1 0.8 0.0 100 Ireland
Israel – – – – 99 93 >95ak,aq 19.4ak <0.1 1.8 0.3 100 Israel
Italy 13.4 – – – 94 95 >95aq 15.7 0.2 0.8 <0.1 100 Italy
Jamaica 12.6 6.2 3.6 8.5 – – 90 13.6 0.0 39.1 0.0 88ar Jamaica
Japan – 7.1 2.3 1.5 97 100 >95aq 11.8 <0.1 0.3 <0.1 100 Japan
Jordan 12.4 7.8 2.4 4.7 93 77 >95 31.7 0.0 2.9 <0.1 59 Jordan
Kazakhstan 10.9 8.0 3.1 9.3 – – >95 14.5 <0.1 8.1 <0.1 87 Kazakhstan
Kenya 6.3 26.0 4.0 4.1 – – 13 25.8 <0.1 5.3 0.7 – Kenya
Kiribati 6.3 – – – – – 6 10.9 0.0 9.1 0.0 56 Kiribati
Kuwait 6.2 4.9 3.1 6.0ap 100 100 >95aq 58.9 <0.1 2.7 0.2 59 Kuwait
Kyrgyzstan 9.9 12.9 2.8 7.0 66 – 81 17.4 0.3 5.8 <0.1 96 Kyrgyzstan
Lao People's Democratic Republic 3.8 43.8 6.4 2.0 – – 6 25.5 <0.1 7.0 <0.1 – Lao People's Democratic
Republic
Latvia 8.9 – – – 82 78 >95 14.4 <0.1 6.0 0.0 100 Latvia
Lebanon 14.3 – – – 48 20 – 30.7 0.0 4.5 3.3 – Lebanon
Lesotho 9.3 33.2 2.8 7.4 – – 36 28.1 0.0 35.0 <0.1 – Lesotho
Liberia 2.7 32.1 5.6 3.2 – – <5 17.0 0.0 10.0 0.0 – Liberia
Libya – 21.0 6.5 22.4 – 26 – 41.7 <0.1 2.5 28.7 – Libya
Lithuania 12.2 – – – 92 61 >95ak,aq 12.3ak 0.4 5.9 0.0 100 Lithuania
Luxembourg 12.1 – – – 98 94 >95aq 10.4 0.0 0.2 0.0 100 Luxembourg
Madagascar 15.6 49.2 – – – – <5 22.5 0.2 6.9 <0.1 – Madagascar
Malawi 10.8 37.1 2.7 4.5 – – <5 21.9 0.2 1.5 0.0 – Malawi
Malaysia 8.3 20.7 11.5 6.0 92 82 >95 17.3 <0.1 4.1 <0.1 52 Malaysia
Maldives 22.8 20.3 10.2 6.5 – – 94 7.7 0.0 3.4 0.9 94ar Maldives
Mali 4.5 30.4 13.5 1.9 – – <5 29.0 <0.1 11.3 3.9 – Mali
Malta 14.2 – – – 100 93 >95aq 14.0 <0.1 0.9 0.0 100 Malta
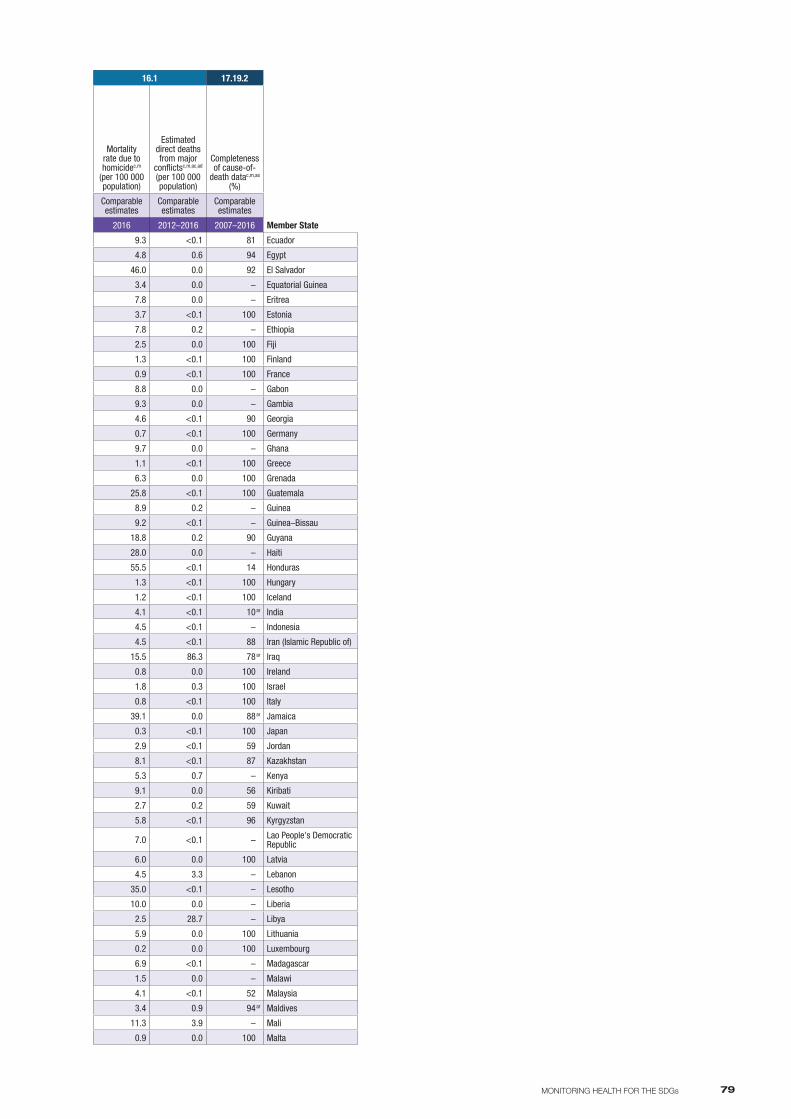
79MONITORING HEALTH FOR THE SDGs
1.a 2.2 6.1 6.2 7.1 11.6 13.1 16.1 17.19.2
Member State
ANNEX BPart 3
Domestic general
government health
expenditure (GGHE-D) as percentage of general
government expenditure (GGE)d,z (%)
Prevalence of stunting in children
under 5aa (%)
Prevalence of wasting in children
under 5aa (%)
Prevalence of overweight in children
under 5aa (%)
Proportion of population
using safely managed drinking-
water servicesab (%)
Proportion of population
using safely managed sanitation
servicesab (%)
Proportion of population with primary reliance on clean fuelst
(%)
Annual mean concentrations
of fine particulate
matter (PM2.5) in urban areast
(µg/m3)
Average death rate
due to natural disastersc,m,ac (per 100 000 population)
Mortality rate due to homicidec,m
(per 100 000 population)
Estimated direct deaths from major
conflictsc,m,ac,ad (per 100 000 population)
Completeness of cause-of-
death datac,m,ae (%)
Data type Comparable estimates Primary data Primary data Primary data
Comparable estimates
Comparable estimates
Comparable estimates
Comparable estimates
Comparable estimates
Comparable estimates
Comparable estimates
Comparable estimates
Member State 2015 2007–2016 2007–2016 2007–2016 2015 2015 2016 2016 2012–2016 2016 2012–2016 2007–2016
Ecuador 11.0 23.9 1.6 8.0 74 42 >95 15.5 0.6 9.3 <0.1 81 Ecuador
Egypt 4.2 22.3 9.5 15.7 – 61 >95 79.6 0.0 4.8 0.6 94 Egypt
El Salvador 19.1 13.6 2.1 6.4 – – 86 23.8 0.0 46.0 0.0 92 El Salvador
Equatorial Guinea 1.3 26.2 3.1 9.7 – – 34 49.1 0.0 3.4 0.0 – Equatorial Guinea
Eritrea 1.8 50.3 15.3 1.9 – – 16 41.1 0.0 7.8 0.0 – Eritrea
Estonia 12.2 – – – 82 93 93 7.0 <0.1 3.7 <0.1 100 Estonia
Ethiopia 6.0 38.4 9.9 2.8 11 – <5 34.0 0.0 7.8 0.2 – Ethiopia
Fiji 7.2 – – – – – 40 10.5 0.4 2.5 0.0 100 Fiji
Finland 12.8 – – – 97 92 >95aq 6.5 <0.1 1.3 <0.1 100 Finland
France 15.3 – – – 93 92 >95aq 12.4 <0.1 0.9 <0.1 100 France
Gabon 7.0 17.5 3.4 7.7 – – 79 37.8 0.0 8.8 0.0 – Gabon
Gambia 10.6 25.0 11.1 3.2 – – <5 32.3 <0.1 9.3 0.0 – Gambia
Georgia 10.5 11.3 1.6 19.9 73 – 78 24.0 0.1 4.6 <0.1 90 Georgia
Germany 21.4 – – – 99 95 >95aq 11.9 <0.1 0.7 <0.1 100 Germany
Ghana 7.1 18.8 4.7 2.6 27 – 22 31.1 0.2 9.7 0.0 – Ghana
Greece 9.1 – – – 99 75 94 16.4 0.2 1.1 <0.1 100 Greece
Grenada 7.4 – – – – – >95 21.8 0.2 6.3 0.0 100 Grenada
Guatemala 14.9 46.5 0.7 4.7 61 – 45 24.2 0.2 25.8 <0.1 100 Guatemala
Guinea 2.7 32.4 8.1 4.0 – – <5 22.2 0.0 8.9 0.2 – Guinea
Guinea–Bissau 9.5 27.6 6.0 2.3 – – <5 26.5 0.0 9.2 <0.1 – Guinea–Bissau
Guyana 7.8 12.0 6.4 5.3 – – 74 21.6 <0.1 18.8 0.2 90 Guyana
Haiti 3.3 21.9 5.2 3.6 – – <5 14.7 1.3 28.0 0.0 – Haiti
Honduras 11.3 22.7 1.4 5.2 – – 53 21.5 <0.1 55.5 <0.1 14 Honduras
Hungary 9.7 – – – 82 76 >95aq 16.3 <0.1 1.3 <0.1 100 Hungary
Iceland 16.4 – – – 98 69 >95aq 5.9 0.0 1.2 <0.1 100 Iceland
India 3.4 38.4 21.0 2.1 – – 41ak 68.0ak 0.2 4.1 <0.1 10ar India
Indonesia 7.4 36.4 13.5 11.5 – – 58 16.4 <0.1 4.5 <0.1 – Indonesia
Iran (Islamic Republic of) 22.6 6.8 4.0 – 91 – >95 34.4 0.1 4.5 <0.1 88 Iran (Islamic Republic of)
Iraq 1.7 22.6 7.4 11.8 – 32 >95 60.1 <0.1 15.5 86.3 78ar Iraq
Ireland 18.4 – – – 99 70 >95aq 8.7 <0.1 0.8 0.0 100 Ireland
Israel – – – – 99 93 >95ak,aq 19.4ak <0.1 1.8 0.3 100 Israel
Italy 13.4 – – – 94 95 >95aq 15.7 0.2 0.8 <0.1 100 Italy
Jamaica 12.6 6.2 3.6 8.5 – – 90 13.6 0.0 39.1 0.0 88ar Jamaica
Japan – 7.1 2.3 1.5 97 100 >95aq 11.8 <0.1 0.3 <0.1 100 Japan
Jordan 12.4 7.8 2.4 4.7 93 77 >95 31.7 0.0 2.9 <0.1 59 Jordan
Kazakhstan 10.9 8.0 3.1 9.3 – – >95 14.5 <0.1 8.1 <0.1 87 Kazakhstan
Kenya 6.3 26.0 4.0 4.1 – – 13 25.8 <0.1 5.3 0.7 – Kenya
Kiribati 6.3 – – – – – 6 10.9 0.0 9.1 0.0 56 Kiribati
Kuwait 6.2 4.9 3.1 6.0ap 100 100 >95aq 58.9 <0.1 2.7 0.2 59 Kuwait
Kyrgyzstan 9.9 12.9 2.8 7.0 66 – 81 17.4 0.3 5.8 <0.1 96 Kyrgyzstan
Lao People's Democratic Republic 3.8 43.8 6.4 2.0 – – 6 25.5 <0.1 7.0 <0.1 – Lao People's Democratic
Republic
Latvia 8.9 – – – 82 78 >95 14.4 <0.1 6.0 0.0 100 Latvia
Lebanon 14.3 – – – 48 20 – 30.7 0.0 4.5 3.3 – Lebanon
Lesotho 9.3 33.2 2.8 7.4 – – 36 28.1 0.0 35.0 <0.1 – Lesotho
Liberia 2.7 32.1 5.6 3.2 – – <5 17.0 0.0 10.0 0.0 – Liberia
Libya – 21.0 6.5 22.4 – 26 – 41.7 <0.1 2.5 28.7 – Libya
Lithuania 12.2 – – – 92 61 >95ak,aq 12.3ak 0.4 5.9 0.0 100 Lithuania
Luxembourg 12.1 – – – 98 94 >95aq 10.4 0.0 0.2 0.0 100 Luxembourg
Madagascar 15.6 49.2 – – – – <5 22.5 0.2 6.9 <0.1 – Madagascar
Malawi 10.8 37.1 2.7 4.5 – – <5 21.9 0.2 1.5 0.0 – Malawi
Malaysia 8.3 20.7 11.5 6.0 92 82 >95 17.3 <0.1 4.1 <0.1 52 Malaysia
Maldives 22.8 20.3 10.2 6.5 – – 94 7.7 0.0 3.4 0.9 94ar Maldives
Mali 4.5 30.4 13.5 1.9 – – <5 29.0 <0.1 11.3 3.9 – Mali
Malta 14.2 – – – 100 93 >95aq 14.0 <0.1 0.9 0.0 100 Malta
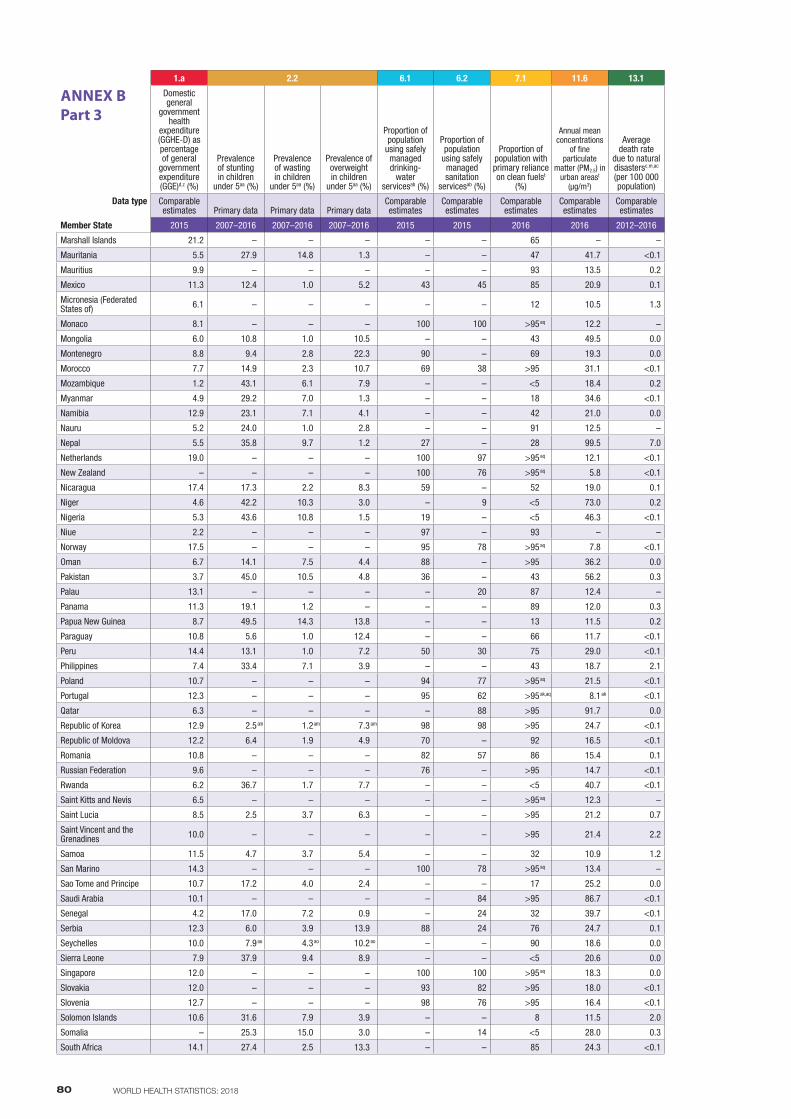
80 WORLD HEALTH STATISTICS: 2018
1.a 2.2 6.1 6.2 7.1 11.6 13.1 16.1 17.19.2
Member State
ANNEX BPart 3
Domestic general
government health
expenditure (GGHE-D) as percentage of general
government expenditure (GGE)d,z (%)
Prevalence of stunting in children
under 5aa (%)
Prevalence of wasting in children
under 5aa (%)
Prevalence of overweight in children
under 5aa (%)
Proportion of population
using safely managed drinking-
water servicesab (%)
Proportion of population
using safely managed sanitation
servicesab (%)
Proportion of population with primary reliance on clean fuelst
(%)
Annual mean concentrations
of fine particulate
matter (PM2.5) in urban areast
(µg/m3)
Average death rate
due to natural disastersc,m,ac (per 100 000 population)
Mortality rate due to homicidec,m
(per 100 000 population)
Estimated direct deaths from major
conflictsc,m,ac,ad (per 100 000 population)
Completeness of cause-of-
death datac,m,ae (%)
Data type Comparable estimates Primary data Primary data Primary data
Comparable estimates
Comparable estimates
Comparable estimates
Comparable estimates
Comparable estimates
Comparable estimates
Comparable estimates
Comparable estimates
Member State 2015 2007–2016 2007–2016 2007–2016 2015 2015 2016 2016 2012–2016 2016 2012–2016 2007–2016
Marshall Islands 21.2 – – – – – 65 – – – – – Marshall Islands
Mauritania 5.5 27.9 14.8 1.3 – – 47 41.7 <0.1 11.0 0.0 – Mauritania
Mauritius 9.9 – – – – – 93 13.5 0.2 1.6 0.0 98 Mauritius
Mexico 11.3 12.4 1.0 5.2 43 45 85 20.9 0.1 16.9 2.1 100 Mexico
Micronesia (Federated States of) 6.1 – – – – – 12 10.5 1.3 4.8 0.0 – Micronesia (Federated
States of)
Monaco 8.1 – – – 100 100 >95aq 12.2 – – – 100 Monaco
Mongolia 6.0 10.8 1.0 10.5 – – 43 49.5 0.0 8.9 0.0 84 Mongolia
Montenegro 8.8 9.4 2.8 22.3 90 – 69 19.3 0.0 2.6 0.0 94ar Montenegro
Morocco 7.7 14.9 2.3 10.7 69 38 >95 31.1 <0.1 1.4 0.0 29 Morocco
Mozambique 1.2 43.1 6.1 7.9 – – <5 18.4 0.2 2.5 0.1 – Mozambique
Myanmar 4.9 29.2 7.0 1.3 – – 18 34.6 <0.1 4.1 1.9 – Myanmar
Namibia 12.9 23.1 7.1 4.1 – – 42 21.0 0.0 18.3 0.0 – Namibia
Nauru 5.2 24.0 1.0 2.8 – – 91 12.5 – – – – Nauru
Nepal 5.5 35.8 9.7 1.2 27 – 28 99.5 7.0 3.3 <0.1 – Nepal
Netherlands 19.0 – – – 100 97 >95aq 12.1 <0.1 0.7 0.2 100 Netherlands
New Zealand – – – – 100 76 >95aq 5.8 <0.1 1.1 <0.1 100 New Zealand
Nicaragua 17.4 17.3 2.2 8.3 59 – 52 19.0 0.1 13.9 <0.1 78 Nicaragua
Niger 4.6 42.2 10.3 3.0 – 9 <5 73.0 0.2 10.4 1.2 – Niger
Nigeria 5.3 43.6 10.8 1.5 19 – <5 46.3 <0.1 9.8 4.1 – Nigeria
Niue 2.2 – – – 97 – 93 – – – – – Niue
Norway 17.5 – – – 95 78 >95aq 7.8 <0.1 0.6 <0.1 100 Norway
Oman 6.7 14.1 7.5 4.4 88 – >95 36.2 0.0 5.2 0.0 73 Oman
Pakistan 3.7 45.0 10.5 4.8 36 – 43 56.2 0.3 9.6 6.9 – Pakistan
Palau 13.1 – – – – 20 87 12.4 – – – 95 Palau
Panama 11.3 19.1 1.2 – – – 89 12.0 0.3 20.5 0.0 92 Panama
Papua New Guinea 8.7 49.5 14.3 13.8 – – 13 11.5 0.2 10.2 0.1 – Papua New Guinea
Paraguay 10.8 5.6 1.0 12.4 – – 66 11.7 <0.1 8.6 0.1 80 Paraguay
Peru 14.4 13.1 1.0 7.2 50 30 75 29.0 <0.1 11.6 <0.1 57 Peru
Philippines 7.4 33.4 7.1 3.9 – – 43 18.7 2.1 14.8 1.6 89ar Philippines
Poland 10.7 – – – 94 77 >95aq 21.5 <0.1 0.9 <0.1 100 Poland
Portugal 12.3 – – – 95 62 >95ak,aq 8.1ak <0.1 1.2 0.0 100 Portugal
Qatar 6.3 – – – – 88 >95 91.7 0.0 7.4 0.0 55 Qatar
Republic of Korea 12.9 2.5am 1.2am 7.3am 98 98 >95 24.7 <0.1 1.3 0.5 100 Republic of Korea
Republic of Moldova 12.2 6.4 1.9 4.9 70 – 92 16.5 <0.1 5.3 0.0 83 Republic of Moldova
Romania 10.8 – – – 82 57 86 15.4 0.1 1.6 <0.1 100 Romania
Russian Federation 9.6 – – – 76 – >95 14.7 <0.1 11.3 0.3 100 Russian Federation
Rwanda 6.2 36.7 1.7 7.7 – – <5 40.7 <0.1 5.5 0.3 – Rwanda
Saint Kitts and Nevis 6.5 – – – – – >95aq 12.3 – – – 88 Saint Kitts and Nevis
Saint Lucia 8.5 2.5 3.7 6.3 – – >95 21.2 0.7 15.6 0.0 94 Saint Lucia
Saint Vincent and the Grenadines 10.0 – – – – – >95 21.4 2.2 13.8 <0.1 100 Saint Vincent and the
Grenadines
Samoa 11.5 4.7 3.7 5.4 – – 32 10.9 1.2 3.2 0.0 – Samoa
San Marino 14.3 – – – 100 78 >95aq 13.4 – – – 100 San Marino
Sao Tome and Principe 10.7 17.2 4.0 2.4 – – 17 25.2 0.0 7.0 0.0 – Sao Tome and Principe
Saudi Arabia 10.1 – – – – 84 >95 86.7 <0.1 6.2 0.2 42 Saudi Arabia
Senegal 4.2 17.0 7.2 0.9 – 24 32 39.7 <0.1 7.8 <0.1 – Senegal
Serbia 12.3 6.0 3.9 13.9 88 24 76 24.7 0.1 1.6 <0.1 95 Serbia
Seychelles 10.0 7.9ao 4.3ao 10.2ao – – 90 18.6 0.0 9.9 0.0 91 Seychelles
Sierra Leone 7.9 37.9 9.4 8.9 – – <5 20.6 0.0 13.1 0.0 – Sierra Leone
Singapore 12.0 – – – 100 100 >95aq 18.3 0.0 0.2 <0.1 68 Singapore
Slovakia 12.0 – – – 93 82 >95 18.0 <0.1 1.3 0.0 100 Slovakia
Slovenia 12.7 – – – 98 76 >95 16.4 <0.1 0.7 0.1 100 Slovenia
Solomon Islands 10.6 31.6 7.9 3.9 – – 8 11.5 2.0 4.3 0.0 – Solomon Islands
Somalia – 25.3 15.0 3.0 – 14 <5 28.0 0.3 5.6 28.2 – Somalia
South Africa 14.1 27.4 2.5 13.3 – – 85 24.3 <0.1 33.1 <0.1 92 South Africa
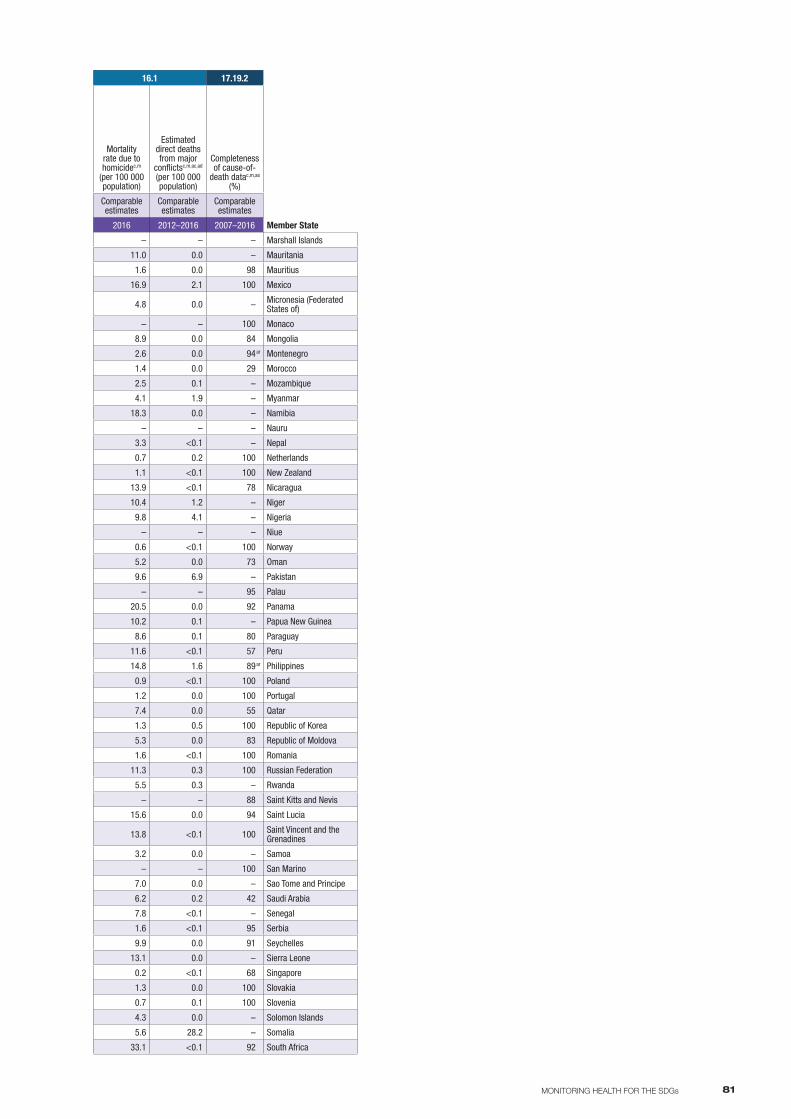
81MONITORING HEALTH FOR THE SDGs
1.a 2.2 6.1 6.2 7.1 11.6 13.1 16.1 17.19.2
Member State
ANNEX BPart 3
Domestic general
government health
expenditure (GGHE-D) as percentage of general
government expenditure (GGE)d,z (%)
Prevalence of stunting in children
under 5aa (%)
Prevalence of wasting in children
under 5aa (%)
Prevalence of overweight in children
under 5aa (%)
Proportion of population
using safely managed drinking-
water servicesab (%)
Proportion of population
using safely managed sanitation
servicesab (%)
Proportion of population with primary reliance on clean fuelst
(%)
Annual mean concentrations
of fine particulate
matter (PM2.5) in urban areast
(µg/m3)
Average death rate
due to natural disastersc,m,ac (per 100 000 population)
Mortality rate due to homicidec,m
(per 100 000 population)
Estimated direct deaths from major
conflictsc,m,ac,ad (per 100 000 population)
Completeness of cause-of-
death datac,m,ae (%)
Data type Comparable estimates Primary data Primary data Primary data
Comparable estimates
Comparable estimates
Comparable estimates
Comparable estimates
Comparable estimates
Comparable estimates
Comparable estimates
Comparable estimates
Member State 2015 2007–2016 2007–2016 2007–2016 2015 2015 2016 2016 2012–2016 2016 2012–2016 2007–2016
Marshall Islands 21.2 – – – – – 65 – – – – – Marshall Islands
Mauritania 5.5 27.9 14.8 1.3 – – 47 41.7 <0.1 11.0 0.0 – Mauritania
Mauritius 9.9 – – – – – 93 13.5 0.2 1.6 0.0 98 Mauritius
Mexico 11.3 12.4 1.0 5.2 43 45 85 20.9 0.1 16.9 2.1 100 Mexico
Micronesia (Federated States of) 6.1 – – – – – 12 10.5 1.3 4.8 0.0 – Micronesia (Federated
States of)
Monaco 8.1 – – – 100 100 >95aq 12.2 – – – 100 Monaco
Mongolia 6.0 10.8 1.0 10.5 – – 43 49.5 0.0 8.9 0.0 84 Mongolia
Montenegro 8.8 9.4 2.8 22.3 90 – 69 19.3 0.0 2.6 0.0 94ar Montenegro
Morocco 7.7 14.9 2.3 10.7 69 38 >95 31.1 <0.1 1.4 0.0 29 Morocco
Mozambique 1.2 43.1 6.1 7.9 – – <5 18.4 0.2 2.5 0.1 – Mozambique
Myanmar 4.9 29.2 7.0 1.3 – – 18 34.6 <0.1 4.1 1.9 – Myanmar
Namibia 12.9 23.1 7.1 4.1 – – 42 21.0 0.0 18.3 0.0 – Namibia
Nauru 5.2 24.0 1.0 2.8 – – 91 12.5 – – – – Nauru
Nepal 5.5 35.8 9.7 1.2 27 – 28 99.5 7.0 3.3 <0.1 – Nepal
Netherlands 19.0 – – – 100 97 >95aq 12.1 <0.1 0.7 0.2 100 Netherlands
New Zealand – – – – 100 76 >95aq 5.8 <0.1 1.1 <0.1 100 New Zealand
Nicaragua 17.4 17.3 2.2 8.3 59 – 52 19.0 0.1 13.9 <0.1 78 Nicaragua
Niger 4.6 42.2 10.3 3.0 – 9 <5 73.0 0.2 10.4 1.2 – Niger
Nigeria 5.3 43.6 10.8 1.5 19 – <5 46.3 <0.1 9.8 4.1 – Nigeria
Niue 2.2 – – – 97 – 93 – – – – – Niue
Norway 17.5 – – – 95 78 >95aq 7.8 <0.1 0.6 <0.1 100 Norway
Oman 6.7 14.1 7.5 4.4 88 – >95 36.2 0.0 5.2 0.0 73 Oman
Pakistan 3.7 45.0 10.5 4.8 36 – 43 56.2 0.3 9.6 6.9 – Pakistan
Palau 13.1 – – – – 20 87 12.4 – – – 95 Palau
Panama 11.3 19.1 1.2 – – – 89 12.0 0.3 20.5 0.0 92 Panama
Papua New Guinea 8.7 49.5 14.3 13.8 – – 13 11.5 0.2 10.2 0.1 – Papua New Guinea
Paraguay 10.8 5.6 1.0 12.4 – – 66 11.7 <0.1 8.6 0.1 80 Paraguay
Peru 14.4 13.1 1.0 7.2 50 30 75 29.0 <0.1 11.6 <0.1 57 Peru
Philippines 7.4 33.4 7.1 3.9 – – 43 18.7 2.1 14.8 1.6 89ar Philippines
Poland 10.7 – – – 94 77 >95aq 21.5 <0.1 0.9 <0.1 100 Poland
Portugal 12.3 – – – 95 62 >95ak,aq 8.1ak <0.1 1.2 0.0 100 Portugal
Qatar 6.3 – – – – 88 >95 91.7 0.0 7.4 0.0 55 Qatar
Republic of Korea 12.9 2.5am 1.2am 7.3am 98 98 >95 24.7 <0.1 1.3 0.5 100 Republic of Korea
Republic of Moldova 12.2 6.4 1.9 4.9 70 – 92 16.5 <0.1 5.3 0.0 83 Republic of Moldova
Romania 10.8 – – – 82 57 86 15.4 0.1 1.6 <0.1 100 Romania
Russian Federation 9.6 – – – 76 – >95 14.7 <0.1 11.3 0.3 100 Russian Federation
Rwanda 6.2 36.7 1.7 7.7 – – <5 40.7 <0.1 5.5 0.3 – Rwanda
Saint Kitts and Nevis 6.5 – – – – – >95aq 12.3 – – – 88 Saint Kitts and Nevis
Saint Lucia 8.5 2.5 3.7 6.3 – – >95 21.2 0.7 15.6 0.0 94 Saint Lucia
Saint Vincent and the Grenadines 10.0 – – – – – >95 21.4 2.2 13.8 <0.1 100 Saint Vincent and the
Grenadines
Samoa 11.5 4.7 3.7 5.4 – – 32 10.9 1.2 3.2 0.0 – Samoa
San Marino 14.3 – – – 100 78 >95aq 13.4 – – – 100 San Marino
Sao Tome and Principe 10.7 17.2 4.0 2.4 – – 17 25.2 0.0 7.0 0.0 – Sao Tome and Principe
Saudi Arabia 10.1 – – – – 84 >95 86.7 <0.1 6.2 0.2 42 Saudi Arabia
Senegal 4.2 17.0 7.2 0.9 – 24 32 39.7 <0.1 7.8 <0.1 – Senegal
Serbia 12.3 6.0 3.9 13.9 88 24 76 24.7 0.1 1.6 <0.1 95 Serbia
Seychelles 10.0 7.9ao 4.3ao 10.2ao – – 90 18.6 0.0 9.9 0.0 91 Seychelles
Sierra Leone 7.9 37.9 9.4 8.9 – – <5 20.6 0.0 13.1 0.0 – Sierra Leone
Singapore 12.0 – – – 100 100 >95aq 18.3 0.0 0.2 <0.1 68 Singapore
Slovakia 12.0 – – – 93 82 >95 18.0 <0.1 1.3 0.0 100 Slovakia
Slovenia 12.7 – – – 98 76 >95 16.4 <0.1 0.7 0.1 100 Slovenia
Solomon Islands 10.6 31.6 7.9 3.9 – – 8 11.5 2.0 4.3 0.0 – Solomon Islands
Somalia – 25.3 15.0 3.0 – 14 <5 28.0 0.3 5.6 28.2 – Somalia
South Africa 14.1 27.4 2.5 13.3 – – 85 24.3 <0.1 33.1 <0.1 92 South Africa
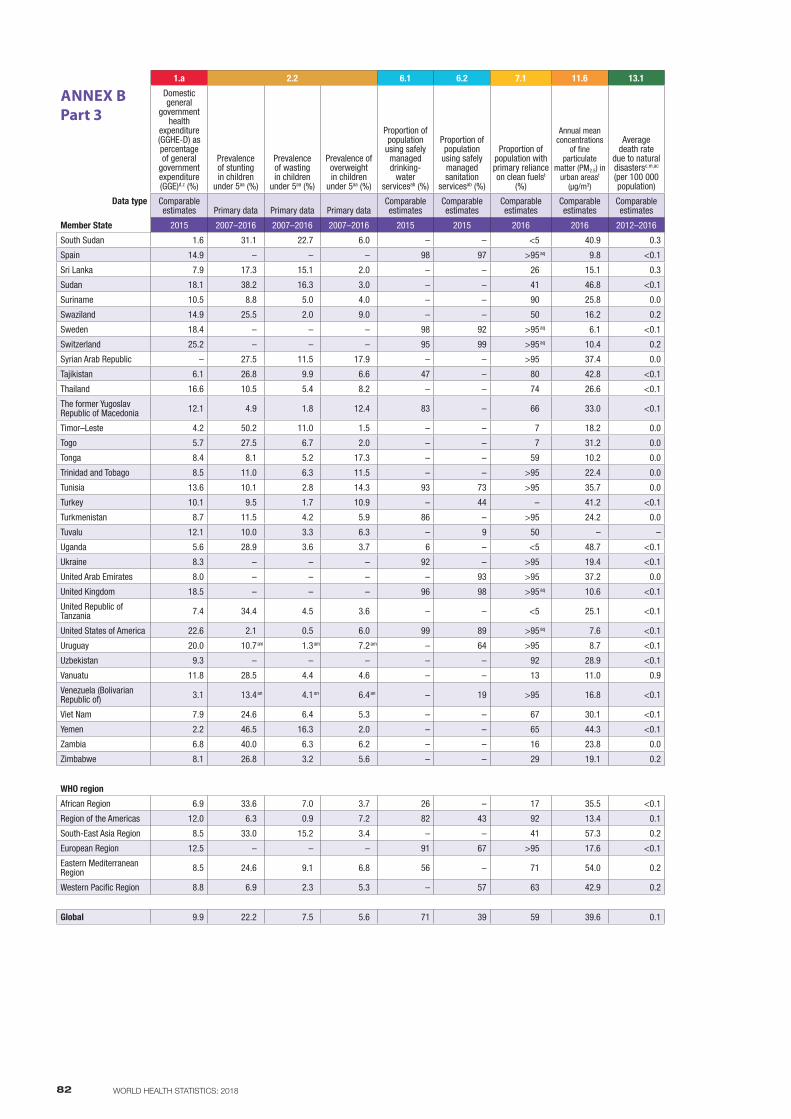
82 WORLD HEALTH STATISTICS: 2018
1.a 2.2 6.1 6.2 7.1 11.6 13.1 16.1 17.19.2
Member State
ANNEX BPart 3
Domestic general
government health
expenditure (GGHE-D) as percentage of general
government expenditure (GGE)d,z (%)
Prevalence of stunting in children
under 5aa (%)
Prevalence of wasting in children
under 5aa (%)
Prevalence of overweight in children
under 5aa (%)
Proportion of population
using safely managed drinking-
water servicesab (%)
Proportion of population
using safely managed sanitation
servicesab (%)
Proportion of population with primary reliance on clean fuelst
(%)
Annual mean concentrations
of fine particulate
matter (PM2.5) in urban areast
(µg/m3)
Average death rate
due to natural disastersc,m,ac (per 100 000 population)
Mortality rate due to homicidec,m
(per 100 000 population)
Estimated direct deaths from major
conflictsc,m,ac,ad (per 100 000 population)
Completeness of cause-of-
death datac,m,ae (%)
Data type Comparable estimates Primary data Primary data Primary data
Comparable estimates
Comparable estimates
Comparable estimates
Comparable estimates
Comparable estimates
Comparable estimates
Comparable estimates
Comparable estimates
Member State 2015 2007–2016 2007–2016 2007–2016 2015 2015 2016 2016 2012–2016 2016 2012–2016 2007–2016
South Sudan 1.6 31.1 22.7 6.0 – – <5 40.9 0.3 5.1 19.4 – South Sudan
Spain 14.9 – – – 98 97 >95aq 9.8 <0.1 0.7 <0.1 100 Spain
Sri Lanka 7.9 17.3 15.1 2.0 – – 26 15.1 0.3 3.0 <0.1 – Sri Lanka
Sudan 18.1 38.2 16.3 3.0 – – 41 46.8 <0.1 6.2 8.3 – Sudan
Suriname 10.5 8.8 5.0 4.0 – – 90 25.8 0.0 10.0 0.0 80 Suriname
Swaziland 14.9 25.5 2.0 9.0 – – 50 16.2 0.2 20.0 0.0 – Swaziland
Sweden 18.4 – – – 98 92 >95aq 6.1 <0.1 1.0 <0.1 100 Sweden
Switzerland 25.2 – – – 95 99 >95aq 10.4 0.2 0.5 <0.1 100 Switzerland
Syrian Arab Republic – 27.5 11.5 17.9 – – >95 37.4 0.0 2.5 430.8 83ar Syrian Arab Republic
Tajikistan 6.1 26.8 9.9 6.6 47 – 80 42.8 <0.1 1.3 <0.1 87 Tajikistan
Thailand 16.6 10.5 5.4 8.2 – – 74 26.6 <0.1 5.0 0.4 85 Thailand
The former Yugoslav Republic of Macedonia 12.1 4.9 1.8 12.4 83 – 66 33.0 <0.1 1.5 <0.1 100 The former Yugoslav
Republic of Macedonia
Timor–Leste 4.2 50.2 11.0 1.5 – – 7 18.2 0.0 5.1 0.0 – Timor–Leste
Togo 5.7 27.5 6.7 2.0 – – 7 31.2 0.0 9.3 0.0 – Togo
Tonga 8.4 8.1 5.2 17.3 – – 59 10.2 0.0 4.6 0.0 – Tonga
Trinidad and Tobago 8.5 11.0 6.3 11.5 – – >95 22.4 0.0 42.2 0.0 84ar Trinidad and Tobago
Tunisia 13.6 10.1 2.8 14.3 93 73 >95 35.7 0.0 1.7 0.4 29 Tunisia
Turkey 10.1 9.5 1.7 10.9 – 44 – 41.2 <0.1 2.7 1.1 89 Turkey
Turkmenistan 8.7 11.5 4.2 5.9 86 – >95 24.2 0.0 4.2 <0.1 85 Turkmenistan
Tuvalu 12.1 10.0 3.3 6.3 – 9 50 – – – – – Tuvalu
Uganda 5.6 28.9 3.6 3.7 6 – <5 48.7 <0.1 12.6 1.4 – Uganda
Ukraine 8.3 – – – 92 – >95 19.4 <0.1 4.6 5.0 93 Ukraine
United Arab Emirates 8.0 – – – – 93 >95 37.2 0.0 3.8 0.0 59ar United Arab Emirates
United Kingdom 18.5 – – – 96 98 >95aq 10.6 <0.1 1.3 <0.1 100 United Kingdom
United Republic of Tanzania 7.4 34.4 4.5 3.6 – – <5 25.1 <0.1 7.7 <0.1 – United Republic of
Tanzania
United States of America 22.6 2.1 0.5 6.0 99 89 >95aq 7.6 <0.1 6.5 0.2 100 United States of America
Uruguay 20.0 10.7am 1.3am 7.2am – 64 >95 8.7 <0.1 7.4 <0.1 100 Uruguay
Uzbekistan 9.3 – – – – – 92 28.9 <0.1 1.9 <0.1 93 Uzbekistan
Vanuatu 11.8 28.5 4.4 4.6 – – 13 11.0 0.9 2.5 0.0 – Vanuatu
Venezuela (Bolivarian Republic of) 3.1 13.4an 4.1an 6.4an – 19 >95 16.8 <0.1 49.2 0.3 89 Venezuela (Bolivarian
Republic of)
Viet Nam 7.9 24.6 6.4 5.3 – – 67 30.1 <0.1 3.8 0.0 – Viet Nam
Yemen 2.2 46.5 16.3 2.0 – – 65 44.3 <0.1 6.1 21.6 – Yemen
Zambia 6.8 40.0 6.3 6.2 – – 16 23.8 0.0 10.1 0.0 – Zambia
Zimbabwe 8.1 26.8 3.2 5.6 – – 29 19.1 0.2 15.1 <0.1 – Zimbabwe
WHO region WHO region
African Region 6.9 33.6 7.0 3.7 26 – 17 35.5 <0.1 10.4 1.7 6 African Region
Region of the Americas 12.0 6.3 0.9 7.2 82 43 92 13.4 0.1 17.9 0.4 93 Region of the Americas
South-East Asia Region 8.5 33.0 15.2 3.4 – – 41 57.3 0.2 4.1 0.1 10 South-East Asia Region
European Region 12.5 – – – 91 67 >95 17.6 <0.1 3.3 0.4 98 European Region
Eastern Mediterranean Region 8.5 24.6 9.1 6.8 56 – 71 54.0 0.2 6.7 24.1 33 Eastern Mediterranean
Region
Western Pacific Region 8.8 6.9 2.3 5.3 – 57 63 42.9 0.2 1.9 0.1 64 Western Pacific Region
Global 9.9 22.2 7.5 5.6 71 39 59 39.6 0.1 6.4 2.5 49 Global
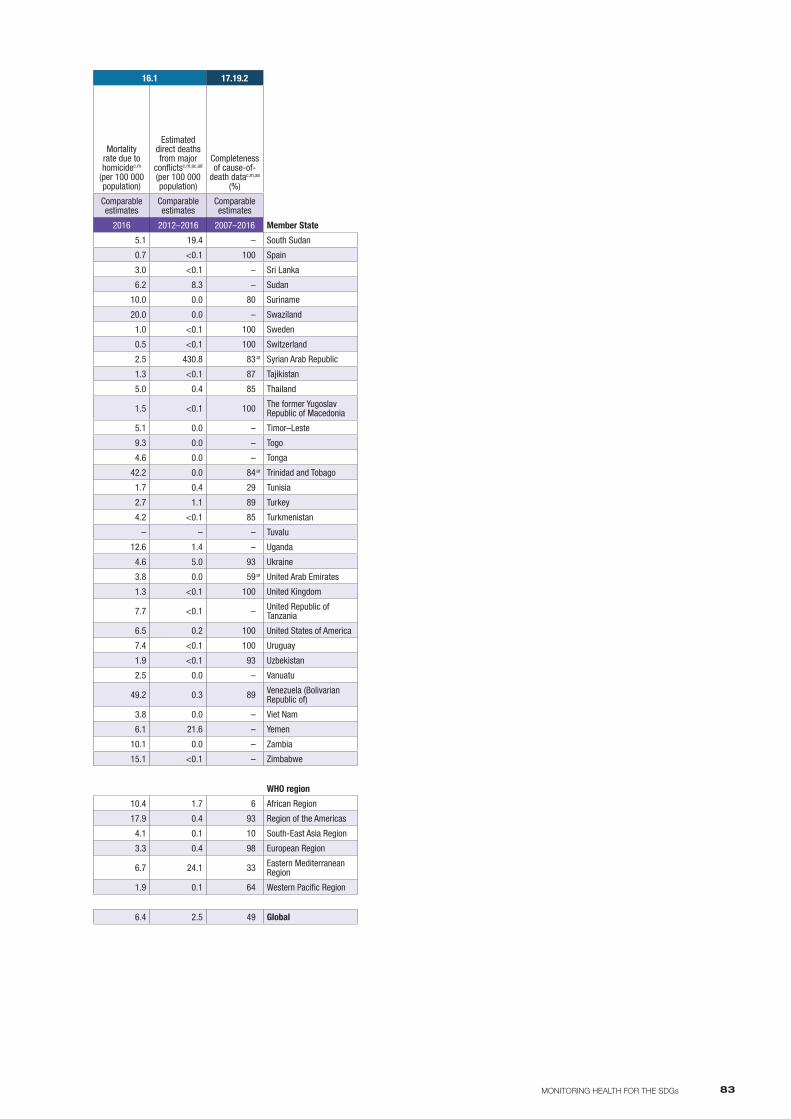
83MONITORING HEALTH FOR THE SDGs
1.a 2.2 6.1 6.2 7.1 11.6 13.1 16.1 17.19.2
Member State
ANNEX BPart 3
Domestic general
government health
expenditure (GGHE-D) as percentage of general
government expenditure (GGE)d,z (%)
Prevalence of stunting in children
under 5aa (%)
Prevalence of wasting in children
under 5aa (%)
Prevalence of overweight in children
under 5aa (%)
Proportion of population
using safely managed drinking-
water servicesab (%)
Proportion of population
using safely managed sanitation
servicesab (%)
Proportion of population with primary reliance on clean fuelst
(%)
Annual mean concentrations
of fine particulate
matter (PM2.5) in urban areast
(µg/m3)
Average death rate
due to natural disastersc,m,ac (per 100 000 population)
Mortality rate due to homicidec,m
(per 100 000 population)
Estimated direct deaths from major
conflictsc,m,ac,ad (per 100 000 population)
Completeness of cause-of-
death datac,m,ae (%)
Data type Comparable estimates Primary data Primary data Primary data
Comparable estimates
Comparable estimates
Comparable estimates
Comparable estimates
Comparable estimates
Comparable estimates
Comparable estimates
Comparable estimates
Member State 2015 2007–2016 2007–2016 2007–2016 2015 2015 2016 2016 2012–2016 2016 2012–2016 2007–2016
South Sudan 1.6 31.1 22.7 6.0 – – <5 40.9 0.3 5.1 19.4 – South Sudan
Spain 14.9 – – – 98 97 >95aq 9.8 <0.1 0.7 <0.1 100 Spain
Sri Lanka 7.9 17.3 15.1 2.0 – – 26 15.1 0.3 3.0 <0.1 – Sri Lanka
Sudan 18.1 38.2 16.3 3.0 – – 41 46.8 <0.1 6.2 8.3 – Sudan
Suriname 10.5 8.8 5.0 4.0 – – 90 25.8 0.0 10.0 0.0 80 Suriname
Swaziland 14.9 25.5 2.0 9.0 – – 50 16.2 0.2 20.0 0.0 – Swaziland
Sweden 18.4 – – – 98 92 >95aq 6.1 <0.1 1.0 <0.1 100 Sweden
Switzerland 25.2 – – – 95 99 >95aq 10.4 0.2 0.5 <0.1 100 Switzerland
Syrian Arab Republic – 27.5 11.5 17.9 – – >95 37.4 0.0 2.5 430.8 83ar Syrian Arab Republic
Tajikistan 6.1 26.8 9.9 6.6 47 – 80 42.8 <0.1 1.3 <0.1 87 Tajikistan
Thailand 16.6 10.5 5.4 8.2 – – 74 26.6 <0.1 5.0 0.4 85 Thailand
The former Yugoslav Republic of Macedonia 12.1 4.9 1.8 12.4 83 – 66 33.0 <0.1 1.5 <0.1 100 The former Yugoslav
Republic of Macedonia
Timor–Leste 4.2 50.2 11.0 1.5 – – 7 18.2 0.0 5.1 0.0 – Timor–Leste
Togo 5.7 27.5 6.7 2.0 – – 7 31.2 0.0 9.3 0.0 – Togo
Tonga 8.4 8.1 5.2 17.3 – – 59 10.2 0.0 4.6 0.0 – Tonga
Trinidad and Tobago 8.5 11.0 6.3 11.5 – – >95 22.4 0.0 42.2 0.0 84ar Trinidad and Tobago
Tunisia 13.6 10.1 2.8 14.3 93 73 >95 35.7 0.0 1.7 0.4 29 Tunisia
Turkey 10.1 9.5 1.7 10.9 – 44 – 41.2 <0.1 2.7 1.1 89 Turkey
Turkmenistan 8.7 11.5 4.2 5.9 86 – >95 24.2 0.0 4.2 <0.1 85 Turkmenistan
Tuvalu 12.1 10.0 3.3 6.3 – 9 50 – – – – – Tuvalu
Uganda 5.6 28.9 3.6 3.7 6 – <5 48.7 <0.1 12.6 1.4 – Uganda
Ukraine 8.3 – – – 92 – >95 19.4 <0.1 4.6 5.0 93 Ukraine
United Arab Emirates 8.0 – – – – 93 >95 37.2 0.0 3.8 0.0 59ar United Arab Emirates
United Kingdom 18.5 – – – 96 98 >95aq 10.6 <0.1 1.3 <0.1 100 United Kingdom
United Republic of Tanzania 7.4 34.4 4.5 3.6 – – <5 25.1 <0.1 7.7 <0.1 – United Republic of
Tanzania
United States of America 22.6 2.1 0.5 6.0 99 89 >95aq 7.6 <0.1 6.5 0.2 100 United States of America
Uruguay 20.0 10.7am 1.3am 7.2am – 64 >95 8.7 <0.1 7.4 <0.1 100 Uruguay
Uzbekistan 9.3 – – – – – 92 28.9 <0.1 1.9 <0.1 93 Uzbekistan
Vanuatu 11.8 28.5 4.4 4.6 – – 13 11.0 0.9 2.5 0.0 – Vanuatu
Venezuela (Bolivarian Republic of) 3.1 13.4an 4.1an 6.4an – 19 >95 16.8 <0.1 49.2 0.3 89 Venezuela (Bolivarian
Republic of)
Viet Nam 7.9 24.6 6.4 5.3 – – 67 30.1 <0.1 3.8 0.0 – Viet Nam
Yemen 2.2 46.5 16.3 2.0 – – 65 44.3 <0.1 6.1 21.6 – Yemen
Zambia 6.8 40.0 6.3 6.2 – – 16 23.8 0.0 10.1 0.0 – Zambia
Zimbabwe 8.1 26.8 3.2 5.6 – – 29 19.1 0.2 15.1 <0.1 – Zimbabwe
WHO region WHO region
African Region 6.9 33.6 7.0 3.7 26 – 17 35.5 <0.1 10.4 1.7 6 African Region
Region of the Americas 12.0 6.3 0.9 7.2 82 43 92 13.4 0.1 17.9 0.4 93 Region of the Americas
South-East Asia Region 8.5 33.0 15.2 3.4 – – 41 57.3 0.2 4.1 0.1 10 South-East Asia Region
European Region 12.5 – – – 91 67 >95 17.6 <0.1 3.3 0.4 98 European Region
Eastern Mediterranean Region 8.5 24.6 9.1 6.8 56 – 71 54.0 0.2 6.7 24.1 33 Eastern Mediterranean
Region
Western Pacific Region 8.8 6.9 2.3 5.3 – 57 63 42.9 0.2 1.9 0.1 64 Western Pacific Region
Global 9.9 22.2 7.5 5.6 71 39 59 39.6 0.1 6.4 2.5 49 Global
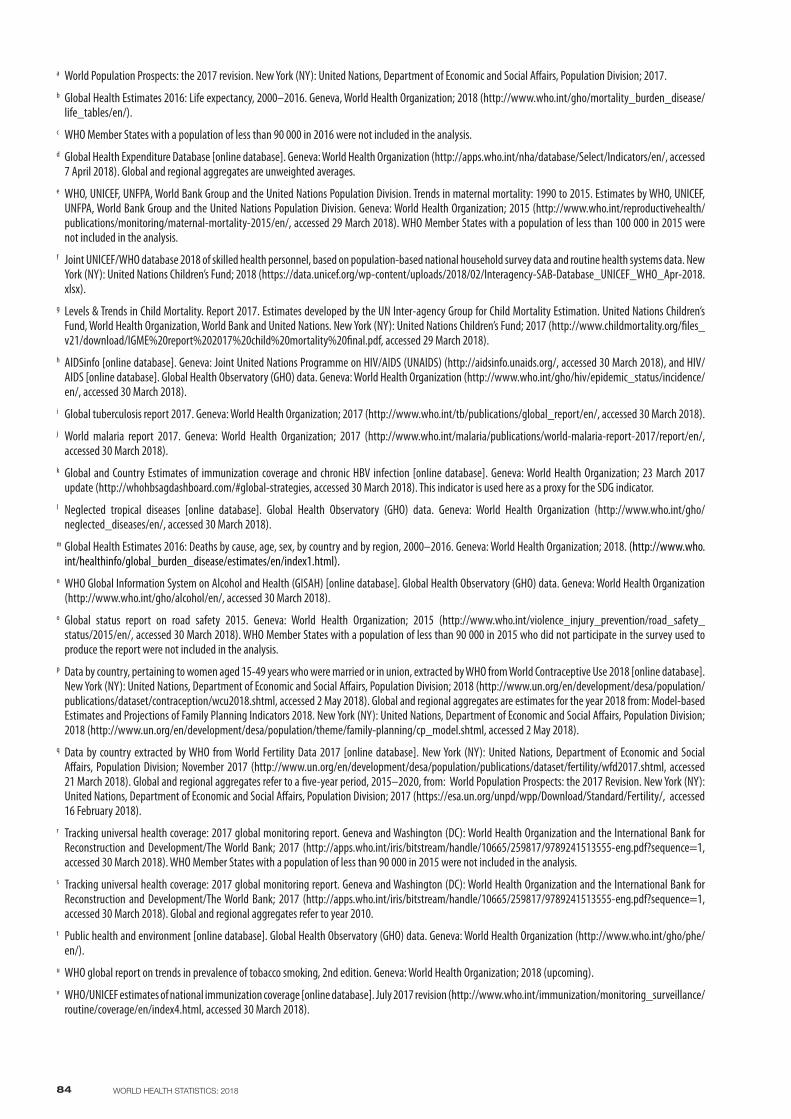
84 WORLD HEALTH STATISTICS: 2018
a World Population Prospects: the 2017 revision. New York (NY): United Nations, Department of Economic and Social Affairs, Population Division; 2017.b Global Health Estimates 2016: Life expectancy, 2000–2016. Geneva, World Health Organization; 2018 (http://www.who.int/gho/mortality_burden_disease/
life_tables/en/). c WHO Member States with a population of less than 90 000 in 2016 were not included in the analysis. d Global Health Expenditure Database [online database]. Geneva: World Health Organization (http://apps.who.int/nha/database/Select/Indicators/en/, accessed
7 April 2018). Global and regional aggregates are unweighted averages.e WHO, UNICEF, UNFPA, World Bank Group and the United Nations Population Division. Trends in maternal mortality: 1990 to 2015. Estimates by WHO, UNICEF,
UNFPA, World Bank Group and the United Nations Population Division. Geneva: World Health Organization; 2015 (http://www.who.int/reproductivehealth/publications/monitoring/maternal-mortality-2015/en/, accessed 29 March 2018). WHO Member States with a population of less than 100 000 in 2015 were not included in the analysis.
f Joint UNICEF/WHO database 2018 of skilled health personnel, based on population-based national household survey data and routine health systems data. New York (NY): United Nations Children’s Fund; 2018 (https://data.unicef.org/wp-content/uploads/2018/02/Interagency-SAB-Database_UNICEF_WHO_Apr-2018.xlsx).
g Levels & Trends in Child Mortality. Report 2017. Estimates developed by the UN Inter-agency Group for Child Mortality Estimation. United Nations Children’s Fund, World Health Organization, World Bank and United Nations. New York (NY): United Nations Children’s Fund; 2017 (http://www.childmortality.org/files_v21/download/IGME%20report%202017%20child%20mortality%20final.pdf, accessed 29 March 2018).
h AIDSinfo [online database]. Geneva: Joint United Nations Programme on HIV/AIDS (UNAIDS) (http://aidsinfo.unaids.org/, accessed 30 March 2018), and HIV/AIDS [online database]. Global Health Observatory (GHO) data. Geneva: World Health Organization (http://www.who.int/gho/hiv/epidemic_status/incidence/en/, accessed 30 March 2018).
i Global tuberculosis report 2017. Geneva: World Health Organization; 2017 (http://www.who.int/tb/publications/global_report/en/, accessed 30 March 2018).j World malaria report 2017. Geneva: World Health Organization; 2017 (http://www.who.int/malaria/publications/world-malaria-report-2017/report/en/,
accessed 30 March 2018).k Global and Country Estimates of immunization coverage and chronic HBV infection [online database]. Geneva: World Health Organization; 23 March 2017
update (http://whohbsagdashboard.com/#global-strategies, accessed 30 March 2018). This indicator is used here as a proxy for the SDG indicator.l Neglected tropical diseases [online database]. Global Health Observatory (GHO) data. Geneva: World Health Organization (http://www.who.int/gho/
neglected_diseases/en/, accessed 30 March 2018).m Global Health Estimates 2016: Deaths by cause, age, sex, by country and by region, 2000–2016. Geneva: World Health Organization; 2018. (http://www.who.
int/healthinfo/global_burden_disease/estimates/en/index1.html). n WHO Global Information System on Alcohol and Health (GISAH) [online database]. Global Health Observatory (GHO) data. Geneva: World Health Organization
(http://www.who.int/gho/alcohol/en/, accessed 30 March 2018).o Global status report on road safety 2015. Geneva: World Health Organization; 2015 (http://www.who.int/violence_injury_prevention/road_safety_
status/2015/en/, accessed 30 March 2018). WHO Member States with a population of less than 90 000 in 2015 who did not participate in the survey used to produce the report were not included in the analysis.
p Data by country, pertaining to women aged 15-49 years who were married or in union, extracted by WHO from World Contraceptive Use 2018 [online database]. New York (NY): United Nations, Department of Economic and Social Affairs, Population Division; 2018 (http://www.un.org/en/development/desa/population/publications/dataset/contraception/wcu2018.shtml, accessed 2 May 2018). Global and regional aggregates are estimates for the year 2018 from: Model-based Estimates and Projections of Family Planning Indicators 2018. New York (NY): United Nations, Department of Economic and Social Affairs, Population Division; 2018 (http://www.un.org/en/development/desa/population/theme/family-planning/cp_model.shtml, accessed 2 May 2018).
q Data by country extracted by WHO from World Fertility Data 2017 [online database]. New York (NY): United Nations, Department of Economic and Social Affairs, Population Division; November 2017 (http://www.un.org/en/development/desa/population/publications/dataset/fertility/wfd2017.shtml, accessed 21 March 2018). Global and regional aggregates refer to a five-year period, 2015–2020, from: World Population Prospects: the 2017 Revision. New York (NY): United Nations, Department of Economic and Social Affairs, Population Division; 2017 (https://esa.un.org/unpd/wpp/Download/Standard/Fertility/, accessed 16 February 2018).
r Tracking universal health coverage: 2017 global monitoring report. Geneva and Washington (DC): World Health Organization and the International Bank for Reconstruction and Development/The World Bank; 2017 (http://apps.who.int/iris/bitstream/handle/10665/259817/9789241513555-eng.pdf?sequence=1, accessed 30 March 2018). WHO Member States with a population of less than 90 000 in 2015 were not included in the analysis.
s Tracking universal health coverage: 2017 global monitoring report. Geneva and Washington (DC): World Health Organization and the International Bank for Reconstruction and Development/The World Bank; 2017 (http://apps.who.int/iris/bitstream/handle/10665/259817/9789241513555-eng.pdf?sequence=1, accessed 30 March 2018). Global and regional aggregates refer to year 2010.
t Public health and environment [online database]. Global Health Observatory (GHO) data. Geneva: World Health Organization (http://www.who.int/gho/phe/en/).
u WHO global report on trends in prevalence of tobacco smoking, 2nd edition. Geneva: World Health Organization; 2018 (upcoming).v WHO/UNICEF estimates of national immunization coverage [online database]. July 2017 revision (http://www.who.int/immunization/monitoring_surveillance/
routine/coverage/en/index4.html, accessed 30 March 2018).
85MONITORING HEALTH FOR THE SDGs
w Organisation for Economic Co-operation and Development. OECD.Stat [online database]. Paris: Organisation for Economic Co-operation and Development (http://stats.oecd.org/, accessed 19 January 2018).
x WHO Global Health Workforce Statistics [online database]. Global Health Observatory (GHO) data. Geneva: World Health Organization (http://who.int/hrh/statistics/hwfstats/en/, accessed 30 March 2018). Country comparisons are affected by differences in the occupations included in the cadre. Please refer to the source for country-specific definitions and other descriptive metadata.
y International Health Regulations (2005) Monitoring Framework [online database]. Global Health Observatory (GHO) data. Geneva: WHO (http://www.who.int/gho/ihr/en/). Global and regional aggregates are for the year 2017.
z This indicator is presented here as it could constitute the health-related portion of the SDG indicator 1.a.2. aa Levels and trends in child malnutrition. UNICEF/WHO/World Bank Group Joint Child Malnutrition Estimates. New York (NY), Geneva and Washington (DC):
United Nations Children’s Fund, World Health Organization and the World Bank Group; 2018. Global and regional aggregates are for the year 2017.ab Progress on drinking water, sanitation and hygiene – 2017 update and SDG baselines. Geneva and New York (NY): World Health Organization and United Nations
Children’s Fund; 2017 (https://washdata.org/sites/default/files/documents/reports/2018-01/JMP-2017-report-final.pdf, accessed 31 March 2018) and Water and sanitation [online database]. Global Health Observatory (GHO) data. Geneva: World Health Organization (http://www.who.int/gho/mdg/environmental_sustainability/en/). Comparable estimates are only shown for countries with recent primary data.
ac The death rate is an average over the five-year period.ad Conflict deaths include deaths due to collective violence and exclude deaths due to legal intervention. ae Completeness was assessed relative to the de facto resident populations and refer to the latest available value for the period 2007–2016. Global and regional
aggregates are for 2016.af Non-standard definition. For more details see the Joint UNICEF/WHO database 2018 of skilled health personnel (https://data.unicef.org/wp-content/
uploads/2018/02/Interagency-SAB-Database_UNICEF_WHO_Apr-2018.xlsx).ag Proportion of institutional births (%) used as a proxy for the SDG indicator.ah Updated estimate.ai Preliminary data.aj Deviation from standard question or measurement method. For more details see World Contraceptive Use 2018 (http://www.un.org/en/development/desa/
population/publications/dataset/contraception/wcu2018.shtml).ak Under country consultation as of May 2018.al Data refer to year 2016. Data for 2017 were submitted in a format that could not be included in the analysis.am Survey data did not cover the 0–59 months age range. Data were adjusted for comparability.an Conversion of estimates based on the old NCHS/WHO references to WHO Child Growth Standards when raw data were not available to allow comparability.ao Data are from a facility-based surveillance system, which include 80% of health centres in the country.ap Prevalence of overweight was calculated using BMI-for-age z-scores.aq For high-income countries with no information on clean fuel use, usage is assumed to be >95%.ar Completeness refers to year prior to 2012.as Data are from the Nutrition Survey System, which covers 25 provinces.

86 WORLD HEALTH STATISTICS: 2018
ANNEX C WHO regional groupings
WHO African Region: Algeria, Angola, Benin, Botswana, Burkina Faso, Burundi, Cabo Verde, Cameroon, Central African Republic, Chad, Comoros, Congo, Côte d’Ivoire, Democratic Republic of the Congo, Equatorial Guinea, Eritrea, Ethiopia, Gabon, Gambia, Ghana, Guinea, Guinea-Bissau, Kenya, Lesotho, Liberia, Madagascar, Malawi, Mali, Mauritania, Mauritius, Mozambique, Namibia, Niger, Nigeria, Rwanda, Sao Tome and Principe, Senegal, Seychelles, Sierra Leone, South Africa, South Sudan, Swaziland, Togo, Uganda, United Republic of Tanzania, Zambia, Zimbabwe.
WHO Region of the Americas: Antigua and Barbuda, Argentina, Bahamas, Barbados, Belize, Bolivia (Plurinational State of), Brazil, Canada, Chile, Colombia, Costa Rica, Cuba, Dominica, Dominican Republic, Ecuador, El Salvador, Grenada, Guatemala, Guyana, Haiti, Honduras, Jamaica, Mexico, Nicaragua, Panama, Paraguay, Peru, Saint Kitts and Nevis, Saint Lucia, Saint Vincent and the Grenadines, Suriname, Trinidad and Tobago, United States of America, Uruguay, Venezuela (Bolivarian Republic of).
WHO South-East Asia Region: Bangladesh, Bhutan, Democratic People’s Republic of Korea, India, Indonesia, Maldives, Myanmar, Nepal, Sri Lanka, Thailand, Timor-Leste.
WHO European Region: Albania, Andorra, Armenia, Austria, Azerbaijan, Belarus, Belgium, Bosnia and Herzegovina, Bulgaria, Croatia, Cyprus, Czechia, Denmark, Estonia, Finland, France, Georgia, Germany, Greece, Hungary, Iceland, Ireland, Israel, Italy, Kazakhstan, Kyrgyzstan, Latvia, Lithuania, Luxembourg, Malta, Monaco, Montenegro, Netherlands, Norway, Poland, Portugal, Republic of Moldova, Romania, Russian Federation, San Marino, Serbia, Slovakia, Slovenia, Spain, Sweden, Switzerland, Tajikistan, The former Yugoslav Republic of Macedonia, Turkey, Turkmenistan, Ukraine, United Kingdom of Great Britain and Northern Ireland, Uzbekistan.
WHO Eastern Mediterranean Region: Afghanistan, Bahrain, Djibouti, Egypt, Iran (Islamic Republic of), Iraq, Jordan, Kuwait, Lebanon, Libya, Morocco, Oman, Pakistan, Qatar, Saudi Arabia, Somalia, Sudan, Syrian Arab Republic, Tunisia, United Arab Emirates, Yemen.
WHO Western Pacific Region: Australia, Brunei Darussalam, Cambodia, China, Cook Islands, Fiji, Japan, Kiribati, Lao People’s Democratic Republic, Malaysia, Marshall Islands, Micronesia (Federated States of), Mongolia, Nauru, New Zealand, Niue, Palau, Papua New Guinea, Philippines, Republic of Korea, Samoa, Singapore, Solomon Islands, Tonga, Tuvalu, Vanuatu, Viet Nam.


ISBN 978 92 4 156558 5
2018 2018