6. capital flight from thailand, 1980–2000
TRANSCRIPT

143
6 Capital Flight from Thailand 1980ndash2000
Edsel L Beja Jr Pokpong Junvith and Jared Ragusett
______________________________________________________________ INTRODUCTION We measure capital flight from Thailand from 1980 to 2000 and analyze the relationships between capital flight and capital inflows economic growth crisis and financial liberalization We define capital flight as net private unrecorded capital outflows from a capital-scarce developing country measured as the difference between the recorded sources and uses of funds This definition is commonly referred to as the lsquoresidualrsquo definition of capital flight (see for example Erbe 1985 Morgan Guaranty 1986 World Bank 1985)
As discussed in Chapter 3 there are several definitions of capital flight capital flight as the undeclared stock of external assets of domestic residents (Dooley 1986) capital flight as only lsquohotrsquo money (Cuddington 1986) capital flight as illegal activities like trade faking (see for example Bhagwati 1964 Gulati 1987) and capital flight as a lsquomirrorrsquo statistic of domestic residentsrsquo deposits abroad (BIS 1984) In this particular case study we choose to use the residual definition and measure of capital flight because net unrecorded capital outflows suggest the extent of lost funds that could have been invested in the domestic economy to generate additional output and employment
Many studies investigate capital flight because of its link with external debt (see for example Lessard and Williamson 1987 Boyce 1992) Highly indebted countries like Mexico Brazil Argentina or the Philippines have experienced significant capital flight Thailand however is not a highly indebted country so presumably capital flight would not be an important concern for the country Yet our research shows that Thailand experienced a sizeable amount of capital flight in real terms for most of the period covered in the study
To the best of our knowledge there are no studies specifically on capital flight from Thailand Studies like Morgan Guaranty (1986) and Schneider (2003) for example contain estimates of capital flight including from
144 Capital Flight Case Studies
Thailand but they do not discuss capital flight specifically from this country We illustrate in this chapter why capital flight is an important concern for Thailand to this end we explore five issues linked to capital flight
The first issue we explore is the link between capital inflows and capital flight While capital inflows can directly influence capital flight it is possible that these inflows will be accumulated especially when the economy is expanding but will exit in the future when economic conditions are no longer favorable to capital (such as an economic crisis) In this latter scenario we would expect capital flight to be substantial In the case of Thailand our study confirms this contention when there was an economic expansion capital inflows were larger than capital flight when there was an economic crisis capital flight exceeded capital inflows
The second issue is the relationship between economic growth and capital flight Conventional analysis suggests that economic growth implies high returns to capital both domestic and foreign and an attractive investment environment in general As such we expect capital not to flee in a high growth environment In the case of Thailand our research confirms this argument economic growth and capital flight are inversely related
Furthermore we explore the relationship between economic crises or shocks in particular the 1983ndash87 banking crisis and 1997ndash98 Asian financial crisis1 and capital flight In both cases our research supports the notion that economic crisis induces capital flight In the case of Thailand capital flight was especially high during these economic crises
We then go on to explore the relationship between financial liberalization and capital flight Conventional analysis suggests that favorable policy changes (like opening the capital account and financial market integration) will discourage capital from fleeing The alternative view is that financial liberalization produces an environment that is relatively volatile for capital flows creating uncertainty and making the economy vulnerable to economic crises and thus capital flight Our research supports the latter argument in the case of Thailand financial liberalization resulted in high and volatile levels of capital flight
Finally we explore the potential contribution of capital flight if it were instead invested in the domestic economy Put another way how much additional output and employment could have been generated in Thailand if the capital that fled had been repatriated or if capital had not fled but had been invested in the country Our research demonstrates that there would have been substantial potential gains for the Thai economy if capital flight had been repatriated or invested in the country
This chapter has five sections Following this introduction Section 2 presents a description of the methodology and Section 3 presents the data and results Section 4 presents our analysis particularly presenting relationships between capital flight and capital inflows economic growth
Capital Flight from Thailand 1980ndash2000 145
economic shocks or crises and financial liberalization policies Section 5 draws conclusions DESCRIPTION OF THE METHODOLOGY
We measure capital flight as the residual of total capital inflows and recorded foreign exchange outflows The sum of net additions to external debt (∆DEBT) and net foreign investments (NFI) constitute total capital inflows and the current account balance (CA) and international reserves accumulation (∆RES) constitute recorded foreign exchange outflows2 Thus
KFt = ∆DEBTt + NFIt ndash (CAt + ∆RESt) (61a) Estimates from equation 61a are called baseline capital flight Positive
estimates imply capital flight negative estimates imply lsquoreversersquo capital flight (ie net unrecorded capital inflows)
Data used to estimate Equation 1a might contain errors in particular errors in the capital account and in the current account Some adjustments are therefore needed to correct them
In the capital account one adjustment concerns total external debt Long-term debts are acquired from different countries and expressed in their respective denominations as such currency fluctuations will affect their respective values across periods Accordingly we compute the foreign exchange adjusted external debt in time tndash1 (FX_DEBT) to obtain adjusted external debt (∆DEBTADJ) in time t3
∆DEBTADJt = DEBTt ndash FX_DEBTt-1 (62) All other things constant the appreciation of a hard currency relative to
the US dollar increases estimates for equation 2 Since DEBTt is what is normally reported ∆DEBTADJt captures unreported debt inflows Accordingly Equation 61a is re-estimated as
KFt = ∆DEBTADJt + FDIt ndash (CAt + ∆RESt) (61b) Estimates from Equation 61b are called baseline capital flight with
adjusted external debt The other adjustment concerns the current account Specifically export
and import data could be inaccurate because of systematic trade misinvoicing either through import overinvoicing or export underinvoicing As such capital flight also takes place through these means Import underinvoicing represents technical smuggling undertaken to evade custom duties and
146 Capital Flight Case Studies
restrictions which can be interpreted as a form of reverse capital flight Export overinvoicing may be a response to government incentives that reward industries based on performance indicators like export revenues
Three steps are required to compute trade misinvoicing The first is to compute export and import discrepancies for Thailand in its trade with major trading partners
DXt = PXt ndash CIFXt (63a)
DMt = Mt ndash CIFPMt (63b)
where DXt and DMt are the total export and import discrepancies respectively PXt is the value of the trading partnersrsquo imports from Thailand as reported by trade partners and PMt is the value of the trading partnersrsquo exports to Thailand as reported by trade partners Xt and Mt are Thailandrsquos exports to and imports from major trading partners respectively as reported by the country4 CIF is the ciffob factor to adjusting export data for cost of freight and insurance
The second step is to calculate the global export and import discrepancies for trade misinvoicing by multiplying these discrepancies with the inverse of the shares of the major trading partners in Thailandrsquos exports and imports
The last step is to find the sum of export and import discrepancies from the second step to get total trade misinvoicing that is
MISt = DXt + DMt (64) We then add this calculation to Equation 61b to obtain total adjusted
baseline capital flight (Adj KFlight) Adj KFlightt = KFt + MISt (61c) We also compute real capital flight (RKF) in order to make estimates
comparable across periods by deflating Equation 61c using the United States producer price index (PPI) with a base year of 19955
RKFt = Adj KFlight t PPI t (65) We note that capital flight is like capital invested abroad thus such capital
will earn some return We compute the stock of capital flight (SKF) which is accumulated capital flight and the interest earnings on capital flight
SKFt = [SKF t-1 (1 + rt)] + Adj KFlightt (66)
Capital Flight from Thailand 1980ndash2000 147
where r is the interest rate on the 90-day United States Treasury bill6 Equation 66 is an estimate of the total opportunity cost of capital flight at time t CAPITAL FLIGHT FROM THAILAND DATA AND RESULTS
Description of the Data
In this section we describe the data on Thailandrsquos external debt net foreign investment current account and international reserves accumulation The data we use were compiled from the IMFrsquos Direction of Trade Statistics CD-ROM (2003) International Financial Statistics (online) and the World Bankrsquos Global Development Finance CD-ROM (2002) and World Development Indicators CD-ROM (2003)
External debts outstanding Thailandrsquos total external debt grew from $83 billion to $233 billion during the 1980s (Table 61) In 1990 total external debt stood at $281 billion and grew swiftly to $100 billion by 1995 For the period 1995 to 1999 Thailandrsquos total debt averaged $1038 billion By 2000 total external debt had declined to $797 billion
Table 61 presents a breakdown of total external debt according to long-term and short-term loans as well as the use of IMF credits Thailandrsquos long-term external debt grew significantly over the years and remained a significant share of total external debt in the period 1980 to 2000 In 1980 long-term debt stood at $56 billion It increased to $131 billion in 1985 and expanded further reaching $171 billion in 1989 Following a jump in 1991 to $252 billion long-term debt expanded throughout most of the 1990s peaking at $72 billion in 1998 with significant increases throughout the period 1994 to 1998 Only in 1999 did external debt show some decline In 2000 long-term external debt was $617 billion For both decades long-term debt was a significant portion of total external debt
Short-term debt saw significant increases from 1980 to 2000 especially in the early 1990s falling gradually after 1995 Short-term debt however never reached 50 percent of total external debt From 1980 to 1987 it remained fairly steady averaging about $3 billion This value began to accumulate gradually beginning in 1988 growing to $147 billion by 1992 with its peak at $441 billion in 1995 In 2000 Thailandrsquos short-term debt decreased to $149 billion
148
Table 61 External debt and other capital flows
Year
Long-term debt
Short-term debt
Use of IMF credits
Total debt
Net foreign investment
Current account
Change in reserves
1980 56458 23030 3483 82971 2440 (20763) (735) 1981 71156 28780 8580 108516 3040 (25711) (3059) 1982 83479 30410 8463 122352 2200 (10031) (465) 1983 95440 33050 10404 138894 3660 (28735) (1180) 1984 105355 35510 9034 149899 4360 (21086) 1315 1985 131870 32000 11216 175086 2050 (15373) 3160 1986 145830 28400 10693 184923 3600 2470 7732 1987 166937 26640 9724 203301 10210 (3665) 14292 1988 162475 48000 3310 213785 15730 (16544) 19066 1989 171043 61120 453 232616 32490 (24979) 33959 1990 197714 83224 07 280945 30240 (72811) 37501 1991 252108 124922 00 377030 22180 (75715) 41344 1992 270571 147269 00 417840 27150 (63034) 27904 1993 300038 226342 00 526380 47160 (63636) 42562
149
1994 363544 291788 00 655332 14750 (80854) 48410 1995 559435 440950 00 1000385 50790 (135539) 66585 1996 651225 426131 00 1077356 44720 (146915) 17059 1997 694342 378360 24287 1096989 83830 (30211) (117473) 1998 720176 296599 32385 1049160 77130 142425 26397 1999 699193 234180 34213 967586 73950 124279 52438 2000 617334 148800 30618 796752 43970 93693 (21154)
Notes a Sources of raw data Global Development Finance CD-ROM (2002) and International Financial Statistics (online) b Positive number suggests an inflow a negative suggests an outflow A positive change in reserves means an accumulation of (or increase in) reserves External debt data are stock volumes The other columns are flows
150 Capital Flight Case Studies
Net foreign investment Net foreign investment (NFI) was $244 million in 1980 and grew to $436 million in 1984 with a decrease in 1982 of $84 Million (Table 61) Following another decline in 1985 NFI picked up again and rose to $1 billion in 1987 From 1988 to 1997 NFI averaged $37 billion reaching its peak of $84 billion in 1997 Thereafter NFI began a downturn dropping as low as $44 billion in 2000 Current Account The current account (CA) was in deficit over the course of the period considered with the exceptions of 1986 and from 1998 to 2000 (Table 61) The average deficit between 1980 and 1985 was $2 billion between 1987 and 1997 it was $65 billion In 1986 there was a surplus of $247 million however the following year the deficit on the current account returned and steadily worsened reaching $73 billion in 1990 The deficit reached its highest levels in 1995 and 1996 when it stood at $136 billion and $147 billion respectively due to substantial reductions in exports In 1997 the deficit contracted to $3 billion and in 1998 Thailand witnessed a surplus of $142 billion Although the current account remained in surplus to 2000 in that year the surplus decreased to $94 billion
Accumulation of foreign reserves From 1980 to 1983 there were outflows in foreign reserves of about $5439 million (Table 61) From 1984 to 1996 there was a steady accumulation of foreign reserves starting with an increase of about $1315 million in 1984 and peaking at $66 billion in 1995 Table 61 shows that there was a large decline in foreign reserves in 1997 ($117 billion) and again in 2000 ($21 billion) Description of the results
Using Equation 61b we compute estimates of baseline capital flight with adjusted external debt (Table 62) Figure 61 shows the trend of adjusted baseline capital flight as a share of gross domestic product (GDP) which relates capital flight to the size of the economy Notice that the pattern shows a cyclical movement in capital flight on the whole however the trend suggests overall flight Notice also that between the 1980s and 1990s there is an apparent difference in the character of the trend with the latter decade exhibiting some systematic volatility
Table 62 presents other capital flight calculations namely real capital flight (RKF) and stock of capital flight (SKF) In 1980 RKF was $3992 million Real capital flight rose to $22 billion by 1982 dipping back down to $8027 million in 1983 with a jump in 1985 and again in 1986 to $51
151
-10
-5
0
5
10
15
20
1980 1981 1982 1983 1984 1985 1986 1987 1988 1989 1990 1991 1992 1993 1994 1995 1996 1997 1998 1999 2000
Figure 61 Capital flight with adjusted debt (using Equation 61b) as a percentage of GDP
152 Capital Flight Case Studies
Table 62 Capital flight computations (in $ millions)
Year
Baseline Kflight
Adj Kflight (Equation
61c)
Real
Kflight
Stock
Kflight
1980 (1065) 2874 3992 2874 1981 5932 12507 15912 15786 1982 6470 17223 21502 34703 1983 (7353) 6510 8027 44204 1984 (7035) 9623 11580 57978 1985 8704 36166 43732 98486 1986 8175 40935 50978 145301 1987 10631 38693 46958 192466 1988 (6084) 15909 18563 221212 1989 (8656) (672) (747) 238502 1990 (34016) (19736) (21176) 236677 1991 1207 17005 18206 271220 1992 (22978) (6229) (6633) 274375 1993 49502 102405 107456 385561 1994 14438 68100 70570 470125 1995 193718 218098 218098 714127 1996 (42282) (33873) (33112) 716103 1997 190725 189809 185541 942218 1998 145329 216754 217406 1204387 1999 64316 189078 187950 1449589 2000 (12117) 17894 16818 1552139 Ave 1980s 972 17977 22050 Ave 1990s 54784 95931 96112 Total 557563 1139074 1181623 1552139 Average 26551 54242 56268
Note US PPP 1995 = 100
Source Computations of the authors
billion There was a decline in RKF from 1987 to 1990 Average RKF in the 1980s was $22 billion In the 1990s RKF increased reaching around $218 billion in 1995 and $217 billion in 1998 Average RKF in the 1990s was $98 billion which is more than four times the average in the previous decade During the 1997ndash98 Asian Financial Crisis total RKF was $42 billion Total RKF for the two decades was $1181 billion which represents
Capital Flight from Thailand 1980ndash2000 153
Table 63 Trade misinvoicing (in $ millions)
Year
Export misinvoicing
Import misinvoicing
Total trade misinvoicing
1980 (350) (350) (700) 1981 199 4790 4988 1982 961 2732 3694 1983 (391) 6287 5897 1984 (1103) 10165 9063 1985 3650 7439 11089 1986 3955 6037 9992 1987 280 1623 1903 1988 (3155) 18475 15320 1989 (6677) 17805 11128 1990 (8998) 13705 4707 1991 (13581) 24119 10538 1992 (7740) 25739 17999 1993 694 40218 40912 1994 10564 24671 35234 1995 10408 17534 27942 1996 24909 19888 44797 1997 24971 12115 37086 1998 22436 (6384) 16053 1999 28026 30585 58612 2000 20889 14748 35637 1980s ave (263) 7500 7237 1990s ave 9169 20219 29388 Total 109948 291942 401890 Average 5236 13902 19138
Note For exports positive numbers mean underinvoicing and negative numbers mean overinvoicing For imports positive numbers mean overinvoicing and negative numbers mean underinvoicing
Source Authorsrsquo computations a substantial loss of capital to Thailand SKF in 2000 was $1552 billion7 This estimate represents the opportunity cost of capital flight8
In addition we take note of trade misinvoicing Average misinvoicing in Thailand for the two decades was $19 billion9 Estimates in Table 63 show that overall trade misinvoicing increased over the two decades In the 1980s
154 Capital Flight Case Studies
average total trade misinvoicing was $7237 million and in the 1990s it was $29 billion
Table 63 suggests that export underinvoicing and import overinvoicing are regular sources of capital flight through trade But it is interesting that there was some export overinvoicing in some years in the 1980s and early 1990s This finding may illustrate the notion that trade misinvoicing was undertaken to cover price uncertainties and risks in the export market But more interestingly export underinvoicing is large particularly in the latter part of the 1990s while import overinvoicing is large particularly in the early 1990s
CAPITAL FLIGHT FROM THAILAND ANALYSIS
Capital Inflows and Capital Flight
We further examine the link between capital inflows and capital flight In Figure 62 we find that Thailand experienced a swift expansion of capital inflows beginning in the late 1980s as the country became increasingly outward-oriented and integrated into global trade and finance Following a brief slump in inflows in the early 1990s capital inflows grew very rapidly The turning point for capital inflows seems to have occurred in 1995 when capital inflows declined and continued to do so in 2000 Although some capital particularly net foreign investments (NFI) continued to flow into Thailand the total inflows were nowhere near pre-crisis levels Total capital inflow was negative after 1999
External debts have clearly comprised a greater share in capital inflows from 1980 to 2000 NFI only began to increase its share in capital inflows in the late 1980s coinciding with the end of the rule of Prime Minister General Prem Tinsulanonda (1979ndash1988) Democracy and sound macroeconomic policies marked the economic boom that started in 1988 It is also noteworthy that after the Plaza Accord in 1985 Japanese firms started to relocate their foreign investments to Thailand and subsequently Taiwanese and South Korean foreign investments followed suit While an increase in NFI is clear change in total external debts (∆DEBT) play a much more significant role in driving capital inflows
The structure of Thailandrsquos total external debts is shown in Figure 63 (see Table 61) From 1980 to 2000 long-term external debt unambiguously comprised a greater share of Thailandrsquos external debt position The share of short-term external debt increased from 1986 reaching a maximum of approximately 44 percent in total external debt in 1995 and 1996
There is clearly a rise in short-term indebtedness as the country experienced sustained economic growth from 1986 to 1995 This finding is
155
-20000
-10000
0
10000
20000
30000
40000
1980 1981 1982 1983 1984 1985 1986 1987 1988 1989 1990 1991 1992 1993 1994 1995 1996 1997 1998 1999 2000
Total inflows ∆DEBT Net foreign investment
Figure 62 Composition of capital inflows (in $ millions)
156
0
0
10
20
30
40
50
60
70
80
90
100
1980 1981 1982 1983 1984 1985 1986 1987 1988 1989 1990 1991 1992 1993 1994 1995 1996 1997 1998 1999 2000
Long-term debt Short-term debt
Figure 63 Share of long- term and short-term debt to total external debt
157
-20000
-10000
0
10000
20000
30000
40000
50000
1980 1981 1982 1983 1984 1985 1986 1987 1988 1989 1990 1991 1992 1993 1994 1995 1996 1997 1998 1999 2000
Real inflow Real capital flight
Figure 64 Real capital inflows and real capital flight (in $ millions)
158 Capital Flight Case Studies
consistent with the common notion that financial liberalization leads to the acquisition of more short-term debt (see for example Wade 1998 Wade and Veneroso 1998) Large short-term debt creates vulnerability an economic shock could drive debtors to reclaim or refuse to reissue debt If that happens we have a precondition for an economic crisis
Figure 64 which shows trends in real capital inflows and real capital fight (RKF) tells an interesting story We observe that in some periods RKF exceeded real capital inflows (1985ndash87 and 1997ndash2000) and in other periods real capital inflow was greater than RKF We think that this situation illustrates that RKF is not only fueled by real capital inflows Such a situation is possible when capital flight is driven by capital already in the domestic economy that is fleeing This suggests that it is possible for foreign capital to be accumulated in a country for an undetermined period only to flee in the future when for instance economic conditions deteriorate
Indeed Figure 64 illustrates that there is a close year-to-year trend between RKF and real capital inflows
Does Economic Growth Discourage Capital Flight
We explore the question of whether economic growth dampens capital flight The relationship is expected to be negative since economic growth raises incentives for capital to remain in the domestic economy and consequently discourages flight To examine this link we obtain growth rates of real gross domestic product (RGDP) and the share of real capital flight (RKF) to RGDP (RKRGDP) RGDP allows a comparison of growth rates over time while RKRGDP shows the relative burden of capital flight to the economy over time
Figure 65 shows the trends From 1980 to 1985 growth declined while RKRGDP was increasing a trend that became most pronounced in 1985 Between 1986 and 1995 there was sustained high growth as RKRGDP declined and remained low growth declined beginning in 1996 and becoming negative as the financial crisis deepened reaching an unprecedented low point in 1998 During this period RKRGDP rose also reaching an unprecedented and alarming level in 1998 There was a recovery in 1999 but with little capital coming into Thailand RKRGDP and growth declined in 2000 Therefore we argue that there is a negative relationship between growth and capital flight10
Three periods 1985 1986ndash1990 and 1997ndash1998 are of interest in Figure 65 In the first and third periods there was an economic slowdown and a severe recession respectively in Thailand Both periods are associated with the banking crises in Thailand (see for example Jansen 2000) Of course these periods are qualitatively different But it appears that when a recession takes place capital is pushed to flee More importantly when the recession
159
-20
-15
-10
-5
0
5
10
15
20
25
30
1980 1981 1982 1983 1984 1985 1986 1987 1988 1989 1990 1991 1992 1993 1994 1995 1996 1997 1998 1999 2000
Real growth RKF RGDP ratio
Figure 65 Real growth (in percentages) and real capital flight as a share of real GDP
160 Capital Flight Case Studies
is severe and intensifies or is prolonged even more capital is pushed to flee From 1986 to 1990 there was sustained high growth and it appears that capital was discouraged from fleeing
Figure 65 also shows an interesting trend in RKRGDP between the 1980s and the 1990s In the 1980s there appeared to be no systematic pattern in RKRGDP except that the highs coincided with economic shocks like the devaluations in 1981 and the 1983ndash87 Banking Crisis However after 1992ndash93 the trend appears to be different In particular the trend in the 1990s appears to be a systematic cycle with each swing becoming wider over time We argue below that the wider swings in RKRGDP were linked to financial liberalization
Again we confirm that economic growth reduces capital flight and vice versa But the pattern is more complex than it seems In the case of Thailand we hypothesize the following relationships between growth and capital flight
First declining growth rates can lead to declining capital flight This condition arises because low growth rates would not attract capital into the country and therefore there is less capital flight Second significantly declining growth rates that steadily worsen can lead to intense capital flight A recession can drive capital out of the country Third recovery can reduce capital flight because of the significant potential returns to capital within the country Fourth sustained growth especially at high levels can result in lower capital flight Finally negative economic shocks induce capital flight A negative shock can increase risk and uncertainty which make capital flee11
Economic crises and capital flight We highlight the contention raised above namely that economic crises or shocks induce capital flight In particular we focus on two economic crises namely the 1982ndash87 Banking Crisis and 1997ndash98 Asian Financial Crisis Figure 65 above shows the trend in the share of real capital flight (RKF) to real gross domestic product (RGDP) or RKRGDP during the two crises periods we can infer from the trend that during an economic crisis capital flight increases12
In order to argue that an economic shock induces capital flight we have to consider the historical context In the 1980s Thailand devalued the Baht twice first in 1981 and later in 1985 In both periods there was a rise in RKRGDP (Figure 65) These shocks resulted in relatively high levels of capital flight
In the 1990s the years to consider are 1993 1995 and 1996 The year 1993 is particularly important because it was in this year that Thailand pursued full financial liberalization With liberalized financial flows there were sudden and large swings in the flows of capital (see Figure 64) and in
Capital Flight from Thailand 1980ndash2000 161
the case of Thailand large and volatile capital flight (see below) 1995 and 1996 are also interesting years In 1995 China devalued the renminbi and in 1996 Japan devalued the yen We think that successivedevaluations in China and Japan led to the export shock of 1996 when Thailand experienced negative growth in exports for the first time Also during this period there was a surplus of semi-conductors (Thailandrsquos main export) on the world market causing prices of these exports to decline and reducing Thai export earnings (see for example Ito 2000) These years are important because they represent a turnaround in the Thai economy Indeed Ito (1999 2000) argues that 1996 marked the turning point that eventually led to the speculative attack on the Baht in 1997 He points out that the current account deficit in 1996 (about 8 percent of GDP) was the same size as the deficit that led to the Tequila Crisis in Mexico in 1994 Suffice it to say that the speculative attack on the baht in 1997 led to the financial crisis
Economic Liberalization and Capital Flight
Financial regulation governance and capital flight Figures 61 and 66 illustrate that movements in capital flight (and real capital flight) are different before and after 1992 Except in the mid-1980s when there was a rise in capital flight due to an economic crisis capital flight in the pre-1992 period was relatively low In fact the levels were below the two-decade period average
In Figure 66 we see that after 1992 capital flight was more significant in size and had large fluctuations with figures way above the average of the 1990s and the two-decade period average We argue that the structural change in the movement of capital flight might be due to institutional changes in the countryrsquos financial system Financial liberalization in the early 1990s allowed for large flows of capital Accordingly this had significant implications for the movement and size of capital flight
In terms of financial integration the World Bank (1997) classified Thailand in the lsquohigh-mediumrsquo income category during the mid-1980s Alba et al (1999) suggest that the country already had reasonably open current and capital accounts and liberal treatment of foreign direct and portfolio investment They point out that the foundations for significant changes in the financial sector were laid as early as 1986
Important policy changes in the financial sector started in 1990 In that year for example Thailand accepted the IMF Article VIII obligations leading to comprehensive financial reforms Thus for instance there were reductions in tax treatment of dividends royalty payments capital gains and interest payments on foreign debentures In 1991 the repatriation of investment funds interest and loan repayments by foreign investors was fully liberalized In addition the Investment Promotion Act was amended to
162
-5000
0
5000
10000
15000
20000
25000
1980 1981 1982 1983 1984 1985 1986 1987 1988 1989 1990 1991 1992 1993 1994 1995 1996 1997 1998 1999 2000
Figure 66 Real capital flight (in $ millions)
Capital Flight from Thailand 1980ndash2000 163
encourage more foreign investment Likewise around the same period the Bank of Thailand (BOT) relaxed interest rate controls having already abandoned the ceiling on the commercial bank deposit rate in 1989ndash91 In 1992 BOT finally abandoned the ceiling on financial and credit companiesrsquo deposit and lending rates and on commercial banksrsquo lending rate it also relaxed portfolio restrictions on the scope of activities and the portfolio composition of commercial banks In addition policies to create a competitive environment for a domestic financial market were launched These policy changes included granting financial companies the autonomy to conduct leasing business and permitting commercial banks to expand their operations (for example they could undertake underwriting issuance and distribution of debt securities and they could act as selling agents of mutual funds among others)13
Another important financial liberalization policy was the Bangkok International Banking Facility (BIBF) program in 1993 The BIBF program enabled commercial banks and firms to access foreign funds with relative ease It also favored short-term capital (Alba et al 1999) With high interest rates tax breaks and the exchange rate of the Baht fixed foreign exchange rate risk was eliminated encouraging large amounts of short-term and long-term capital to enter Thailand Alba et al (1999) point out that such policy changes resulted in a moral hazard problem because the policies favored short-term foreign borrowing and made borrowers ignore exchange rate risks because the Baht was artificially fixed They argue that the BIBF program was indeed one important policy change that resulted in volatile and unstable financial flows With our results we argue that the adoption of liberalization policy can explain the higher magnitude of capital flight in the 1990s Needless to say financial liberalization has been identified as a major cause of the 1997 economic crisis
As we noted earlier Thailand faced two economic crises between 1980 and 2000 Comparing the two crises we noted that in the 1983ndash87 Banking Crisis Thailand experienced relatively lower capital flight than in the 1997ndash 98 Asian Financial Crisis In the latter period there were larger swings in capital flight We further argue that the structural difference in the levels of capital flight was the result of financial liberalization which created high volatility and unpredictability and dependence on foreign capital
Volatility of capital flight In this section we investigate the volatility of capital flight We use data from Tables 61 and 62 Data in Table 62 indicate that average real capital flight in the 1980s was $22 billion and in the 1990s $96 billion over four times the level of the previous decade The average for the two decades was about $56 billion Over time there was indeed a change in the level of real capital flight (see Figures 61 and 66) We argued earlier that there is a link
164
-20000
-15000
-10000
-5000
0
5000
10000
15000
20000
1980 1981 1982 1983 1984 1985 1986 1987 1988 1989 1990 1991 1992 1993 1994 1995 1996 1997 1998 1999 2000
Figure 67 Capital flight deviations from the mean (in $ millions)
Capital Flight from Thailand 1980ndash2000 165
between financial liberalization and capital flight We further argue that financial liberalization increases the volatility of capital flight
To highlight abnormal fluctuations in real capital flight in the 1990s we show that the expected returns on real capital flight are lsquoabnormalrsquo meaning expected returns far exceed the average return In doing this we follow Fatehi and Gupta (1992) who utilize the mean value of capital as proxy for the expected returns Accordingly we obtain the mean of real capital flight which is $56 billion and compute deviations of real capital flight from the mean We obtain plusmn 1 standard deviation of real capital flight which is $78 billion Obviously plusmn 1 standard deviation is somewhat arbitrary however our purpose is to set a marker against which we can compare the mean deviation of real capital flight and at the same time stress significant deviations during the period considered When the marker is breached we consider the level to be significant When the marker is breached repeatedly we consider the situation to be volatile
Figure 67 shows that in the post-liberalization period (that is post 1992ndash 1993) the deviation of real capital flight from its mean exceeded plusmn 1 standard deviation In the other periods the mean deviation of real capital flight was within range The figure shows that real capital flight in this period was relatively more volatile especially in the latter part of the 1990s Thus we argue that financial liberalization increases the volatility of capital flight Foregone Output and Employment
In this section we estimate foregone output and employment due to capital flight1415 If flight capital had been repatriated and invested in Thailand or if there had been no capital flight additional output and employment could have been generated In other words suppose we assume that capital flight was invested in the domestic economy what would have been its impact in terms of output and employment To obtain the potential additional output due to the repatriation (or investment) of flight capital we need the incremental capital output ratio (ICOR)16 To obtain the potential additional employment of capital flight we need the incremental labor-capital ratio (ILCR)17
Table 64 shows that if the estimated flight capital in 1980 had been repatriated or had not fled Thailand would have obtained an additional output of $3551 million If flight capital in 1981 had been invested in the country $634 million worth of output would have been generated These findings mean that Thailandrsquos GDP could have been higher than what was reported for 1980 or 1981 The same logic applies to the other years18 Moreover an initial investment in one year can continue to generate output until it is fully depreciated For instance an initial investment of $3992
166
Table 64 Potential additional output and employment (in millions)
Year
Real capital flight
Additional output in year t
Ratio to GDP
Stream of output in year t
Stock of output by year t
Additional employment
1980 3992 3551 11 3551 3551 438 1981 15912 6340 18 7286 10836 2113 1982 21502 6932 19 10253 21089 3272 1983 8027 2588 06 8953 30042 904 1984 1158 2709 06 6358 3640 1306 1985 43732 16612 43 22722 59123 5907 1986 50978 19365 45 34938 9406 7234 1987 46958 42967 85 101521 195581 5476 1988 18563 16016 26 80659 27624 2626 1989 (747) ndash ndash 39171 315411 ndash 1990 (21176) ndash ndash 21096 336507 ndash 1991 18206 7824 08 18705 355212 179 1992 (6633) ndash ndash 14496 369708 ndash 1993 107456 43229 35 54739 424447 643 1994 7057 35109 24 101839 526286 3071 1995
218098 109725 65 212415 738702 1939
167
1996 (33112) ndash ndash 119586 858288 ndash 1997 15541 75183 50 246211 1104499 6086 1998 217406 87094 78 33051 1435009 7971 1999 18795 132968 109 716642 2151651 602 2000 16818 7069 06 432865 2584516 ndash Total 1181623 61528 ndash 2582516 2582516 6097
Note Authorsrsquo computations using raw data from the World Development Index CD-ROM and Thailandrsquos National Economic and Social Development Board
168 Capital Flight Case Studies
million in 1980 (capital flight) would continue to generate a stream of output in succeeding years about $945 million in 1981 With an additional output of $634 million from 1981 repatriated flight capital Thailand would have gained a total stream of additional output of $7286 million in 1981 or a total stock of output of $1 billion by 1981 In 1982 repatriated flight capital from 1980 would have continued to generate some output about $462 million and the same for 1981 repatriated capital about $2857 million Counting additional output from 1982 repatriated capital flight at $6932 billion Thailand would have obtained a total stream of output of $1 billion in 1982 or a total stock of additional output of $21 billion by 1982 The same logic applies for the succeeding years19 By 2000 past capital flight would have generated $614 billion in output or a total stock of additional output of $2582 billion by 2000 As a share of real gross domestic product (RGDP) the potential output in 1980 would be 06 percent of RGDP that in 1981 would be 1 percent of RGDP Counting the streams of output by 1981 we get 12 per cent of GDP in 1981 The potential output in 2000 would be 07 percent of RGDP As expected during years of high levels of capital flight the potential output would indicate significant shares of GDP These numbers suggest large increases in potential output with repatriated capital flight
Also if the estimated flight capital in 1980 had been repatriated or had not fled but was invested in the country Thailand would have created an additional 43800 jobs in 1980 We estimate that there were 200000 people unemployed in 1980 (extrapolated using figures from the World Development Index) thus unemployment could have been cut by about 22 percent In 1981 with an estimated 335000 unemployed 211300 jobs could have been created in other words about 63 percent of the unemployed could have got jobs in 1981 For these two years a total of 255100 jobs could have been created with repatriation of capital flight In 1999 about 602000 jobs could have been created About 986000 people were unemployed in 1999 (International Financial Statistics Online) and again a significant proportion of the unemployed could have found jobs if capital had been repatriated or invested in the country Table 64 shows that we obtain a total of about 6 million potential jobs between 1980 and 2000
With these results we therefore argue that capital flight implies significant losses in jobs and output We furthermore argue that for Thailand the repatriation of flight capital (or the investment of this capital within the country) can be a valuable aid in realizing increased employment and development
Capital Flight from Thailand 1980ndash2000 169
CONCLUSION Using the residual method we estimated capital flight from Thailand from 1980 to 2000 We found that during the two decades period total real capital flight from the country was $1181 billion Accounting for interest earnings (assuming the amount was fully invested abroad) we arrived at a total stock of capital flight of $1552 billion in 2000 or about 15 times real gross domestic product (RGDP) in 2000 By any measure this amount suggests large opportunity costs of capital flight
We investigated five issues in the chapter First we examined the relationship between capital inflows and capital flight and found a close year-to-year trend between capital inflows and capital flight This situation illustrates that RKF is not only fueled by real capital inflows Such a situation is possible when the capital flight is driven by capital already in the domestic economy and is fleeing Next we asked whether economic growth discourages capital flight and whether economic crisis induces capital flight Our answers to the two questions were in the affirmative In the case of Thailand we suggested how these were linked (1) a declining growth rate can lead to declining capital flight (2) when the declining growth rates worsens and becomes severe capital flees and flight intensifies (3) economic recovery can reduce capital flight (4) sustained growth rates especially at high levels can result in declining capital flight and (5) economic shocks induce capital flight We also explored the question of whether financial liberalization increases the volatility of capital flight Our results indicated that in the case of Thailand the volatility of capital flight increased under financial liberalization Finally we calculated the potential losses of output and employment due to capital flight Our estimates show that capital flight from Thailand was indeed substantial The repatriation of capital flight (or investing it in the country) could mean more output and employment Our total estimate of foregone output is $615 billion by 2000 or an average of 23 percent of GDP for the whole period We also estimated that total foregone employment was 6 million between 1980 and 2000 or approximately 15 per cent of total unemployment for the same period By any measure capital flight implies large foregone opportunities in Thailand If capital had not fled or if capital flight had been repatriated and invested in Thailand it could have generated more economic growth and more jobs in Thailand
However there remain more questions for future research In particular it would be worth exploring the extent to which capital flight was fueled or driven by external debt and vice versa that is whether or not there is a lsquorevolving doorrsquo relationship between capital flight and capital inflows in Thailand (see for example Boyce 1992) It would also be worth exploring how changes in Thailandrsquos trade policies and the world market have
170 Capital Flight Case Studies
influenced systematic trade misinvoicing
NOTES We thank James K Boyce James Crotty Gerald Epstein Gerald Friedman Carol Heim James Heintz Leacuteonce Ndikumana Peter Skott and members of the Capital Flight Working Group at the University of Massachusetts Amherst for comments The usual disclaimers apply
1 See for example Alba et al (1999) for the 1983ndash1987 Thai Banking Crisis Montes
(1998) for the 1997ndash1998 Asian Financial Crisis and Jansen (2000) for a comparison of the 1983ndash1984 and 1997 financial crises in Thailand
2 Total external debt refers to long-term and short-term debt and use of IMF credits Long term and short-term debt covers public debt private publicly guaranteed debt and private non-guaranteed debt NFI is the sum of net direct foreign investments (FDI) and net portfolio equities investments (PORT) Net FDI is FDI by non-residents into the country (inflow) and FDI of residentsrsquo abroad (outflow) PORT covers portfolio equities investments of non-residents into the country (inflow) and portfolio equities investments of residentsrsquo abroad (outflow)
3 See Chapter 3 for details of the estimation procedure 4 We consider trade data with industrialized countries on the assumption that the
information is reasonably accurate compared to trade data with developing countries (see for example Boyce 1993 Boyce and Ndikumana 2001)
5 Other indices can be utilized as deflator It is important that the same index for deflating figures is used throughout the estimation procedure
6 Of course it is possible to get higher returns on the capital The 90-day US Treasury Bill rate can be the minimum rate of return or guaranteed return on investment
7 Note that the starting stock of capital flight affects the subsequent stock of capital flight Cline (1995) follows a different approach in which the stock is not allowed to become negative
8 Clearly there is a private gain for those who engage in capital flight An estimate of the private gain can be subtracted to get a more accurate estimate of the opportunity cost
9 In the literature trade misinvoicing is also called secondary capital flight Primary capital flight refers to baseline capital flight (see Equation 61a)
10 Correlation analyses between RKRGDP and growth rates and between real capital fight and growth rates show a negative relationship We ran Granger tests and results showed that movements in RKRGDP were Granger-caused by growth rates but not the reverse Also movements in real capital flight were Granger-caused by growth rates but not the reverse These findings were consistent using one to three lags Note that we have a limited number of observations (only 21 years)
11 Positive external shocks can reduce capital flight DrsquoArista (1996) discusses the pro-cyclical nature of business cycles and volatility of capital flows
12 Note that capital flight was increasing before the crisis 13 For a detailed discussion of this issue see Alba et al (1999) and Jensen (2000) 14 We acknowledge James K Boyce for the suggestion 15 Clearly there can be other possible tradeoffs If capital did not flee there could be more
resources for public services (public education health services) To illustrate the tradeoff relationship at the aggregate level we consider total output and employment It is possible to disaggregate potential increases in output and employment according to sectors
16 ICOR indicates how much output is generated per unit of capital It is computed as the ratio of net fixed capital formation and change in GDP The reciprocal of ICOR is the marginal product of capital Capital flight divided by ICOR gives the potential additional output due to full capital flight repatriation Clearly this procedure is an approximation of the potential additional output We assume that the repatriated capital will be invested in some productive activity and generate some positive output in the current year and a
Capital Flight from Thailand 1980ndash2000 171
stream of output in the future We use the fixed capital depreciation rate as an adjustment to net fixed capital in computing the stream of output When GDP declines or when net fixed capital formation is negative in a particular year ICOR is also negative To avoid this problem we use the previous five-year average of ICOR as proxy for that year
17 ILCR indicates how much employment is generated per unit of capital It is computed as the ratio of change in employment and net fixed capital formation Capital flight multiplied by ILCR gives the potential additional employment due to capital flight (full) repatriation Clearly this procedure is only an approximation of potential additional employment Again we assume that capital fight (full) repatriation will generate employment as it generates output When GDP declines or when net fixed capital formation is negative in a particular year ILCR is also negative To avoid this problem we use the previous five-year average of ILCR as proxy for that year
18 Some years have negative capital flight and we assume no capital repatriation for those years Table 64 assumes that the repatriated capital flight is used in productive investments It is possible that some amount of repatriated capital goes into consumption This aspect is a limitation of the calculations
19 Excel files for ICOR and ILCR are available from the authors
REFERENCES
Alba Pedro Leonardo Hernandez and Daniela Klingebiel (1999) lsquoFinancial Liberalization and the Capital Account Thailand 1988ndash1997rsquo Policy Research Working Paper No 2188 World Bank
Bank for International Settlements (1984) BIS 54th Annual Report Geneva Switzerland Bank for International Settlements
Bhagwati Jagdish (1964) lsquoOn the Underinvoicing of Importsrsquo Bulletin of the Oxford University Institute of Economics and Statistics 26 389ndash397
Boyce James (1992) lsquoThe Revolving Door External Debts and Capital Flight Philippine Case Studyrsquo World Development 20 (3) 335ndash345
Boyce James (1993) The Political Economy of Growth and Impoverishment in the Marcos Era Manila the Philippines Ateneo de Manila University Press
Boyce James and Leonce Ndikumana (2001) lsquoIs Africa a Net Creditor New Estimates of Capital Flight from Severely Indebted Sub-Saharan African Countries 1970ndash 96rsquo Journal of Development Studies 38 (2) 27ndash56
Chang Kevin Stijn Claessens and Robert Cumby (1997) lsquoConceptual and Methodological Issues in the Measurement of Capital Flightrsquo International Journal of Financial Economics 2 101ndash119
Cline William (1995) International Debt Reexamined Washington DC Institute for International Economics
Cuddington John (1986) lsquoCapital Flight Estimates Issues and Explanationrsquo Princeton Studies in International Finance No 58 Princeton University
Cumby Robert and Richard Levich (1987) lsquoDefinitions and Magnitudes On the Definition and Magnitude of Recent Capital Flightrsquo in Donald Lessard and John Williamson (eds) Capital Flight and the Third World Debt Washington DC Institute of International Economics
Deppler Michael and John Williamson (1987) lsquoCapital Flight Concepts Measurement and Issuesrsquo Staff Studies for the World Economic Outlook Washington DC International Monetary Fund 39ndash58
DrsquoArista Jane (1996) lsquoInternational Capital Flows and National Macroeconomic Policiesrsquo Otaru University of Commerce (Japan) Institute of Economic Research
172 Capital Flight Case Studies
Discussion Paper No 32 Dooley Michael (1986) lsquoCountry Specific Risk Premiums Capital Flight and Net
Investment Income Payments in Selected Developing Countriesrsquo International Monetary Fund (unpublished manuscript)
Erbe Suzanne (1985) lsquoThe Flight of Capital from Developing Countriesrsquo Inter- economics NovemberDecember 268ndash275
Fatehi Kamal and Manoj Gupta (1992) lsquoPolitical Instability and Capital Flight An Application of Event Study Methodologyrsquo The International Executive 34 (5) 441ndash461
Gordon David and Ross Levine (1989) lsquoThe lsquoProblemrsquo of Capital Flight ndash A Cautionary Notersquo World Economy 12 237ndash252
Gulati Sanil (1987) lsquoA Note on Trade Misinvoicingrsquo in Donald Lessard and John Williamson (eds) Capital Flight and Third World Debt Washington DC Institute for International Economics
Ito Takatoshi (1999) lsquoCapital Flows in Asiarsquo NBER Working Paper No 7134 National Bureau of Economic Research
Ito Takatoshi (2000) lsquoPrincipal Causes of Asian Export Decelerationrsquo in Dilip Das (ed) Asian Exports Manila Asian Development Bank
Jansen Jos (2003) lsquoWhat do Capital Inflows do Dissecting the Transmission Mechanism for Thailand 1980ndash96rsquo Journal of Macroeconomics 25 (4) 457ndash 480
Jansen Karel (2000) lsquoThailand Crisis Two Crises Comparedrsquo Chulalongkorn Journal of Economics 12 (3) 1ndash25
Lessard Donald and John Williamson (eds) (1987) Capital Flight and the Third World Debt Washington DC Institute for International Economics
Montes Manuel (1998) The Currency Crisis in Southeast Asia Singapore Institute of Southeast Asian Studies
Morgan Guaranty Trust Company (1986) lsquoLDC Capital Flightrsquo World Financial Markets March 13ndash15
Schneider Benu (2003) lsquoMeasuring Capital Flight Estimates and Interpretationsrsquo Working Paper No 154 Overseas Development Institute (UK)
Wade Robert (1998) lsquoThe Asian Debt and Development Crisis of 1997 Causes and Consequencesrsquo World Development 26 (8) 1535ndash1553
Wade Robert and Frank Veneroso (1998) lsquoThe Asian Crisis The High Debt Model Versus the Wall Street-Treasury-IMF Complexrsquo New Left Review MarchApril (228) 3ndash23
World Bank (1985) World Development Report Washington DC World Bank World Bank (1997) Private Capital Flows to Developing Countries The Road to
Financial Integration Washington DC World Bank Databases Bank of Thailand wwwbotorth Direction of Trade Statistics CD-ROM (2003) Global Development Financial CD-ROM (2002) International Financial Statistics (Online) wwwifsapdinetimflogonaspx National Economic and Social Development Board wwwnesdbgoth World Development Indicators CD-ROM (2003)
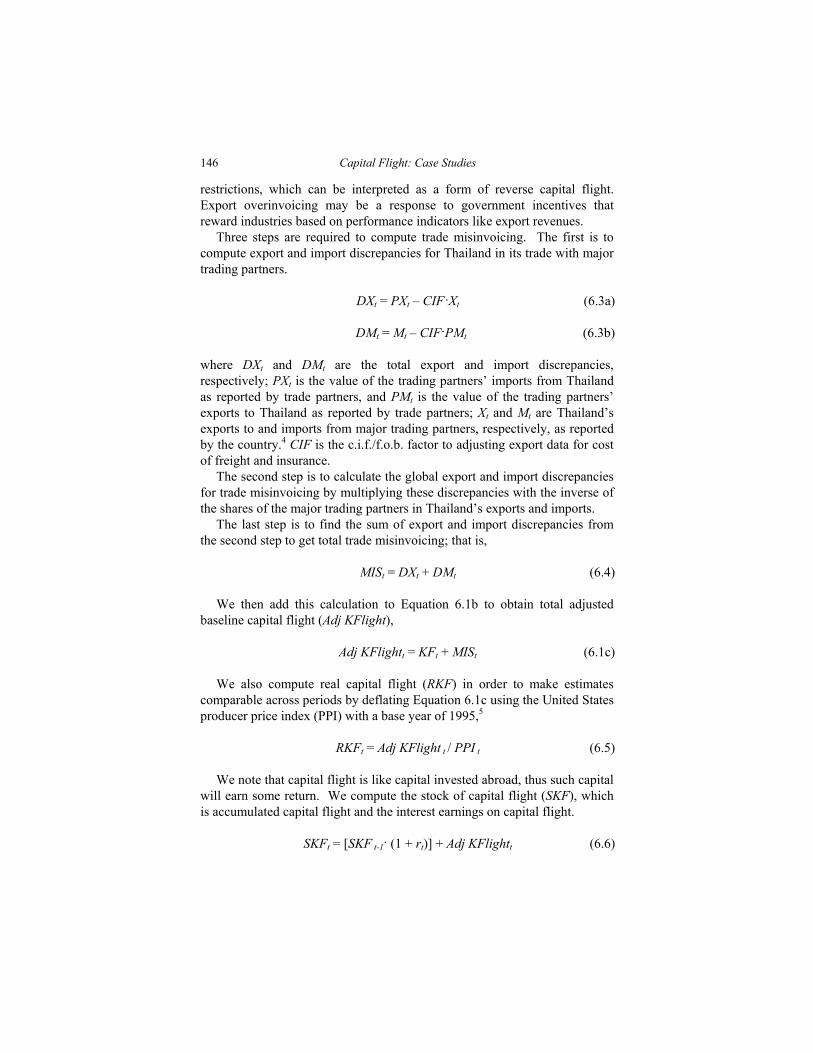
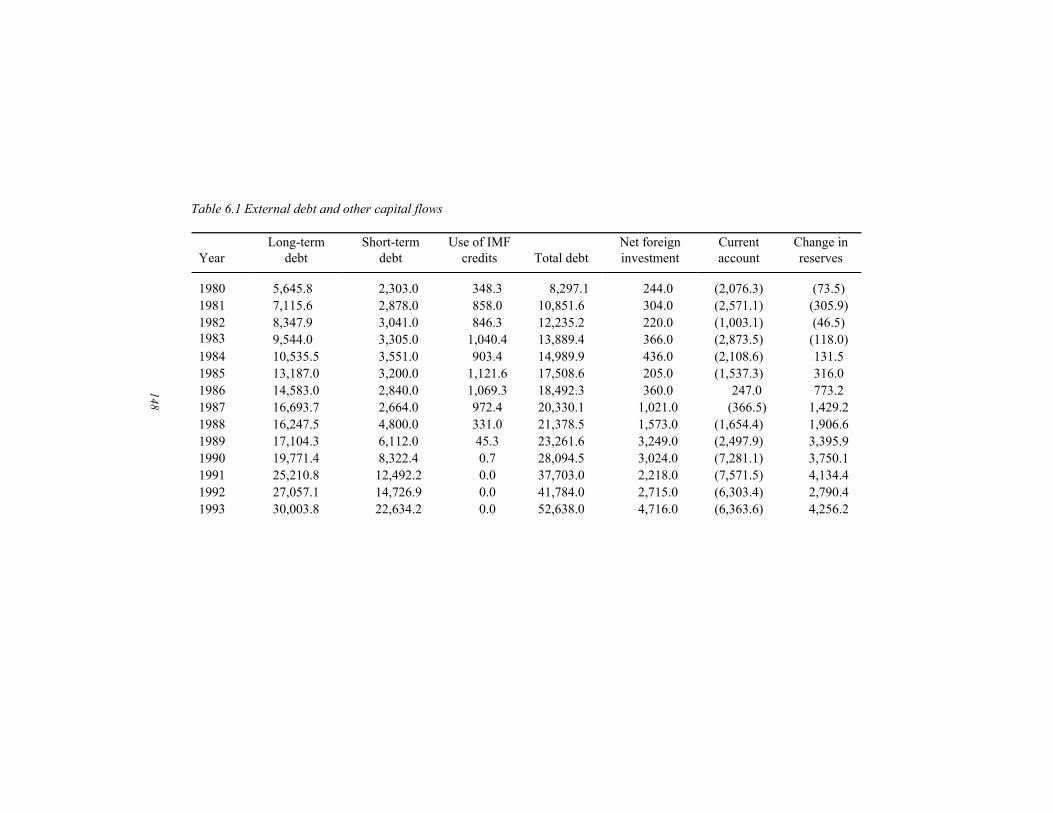
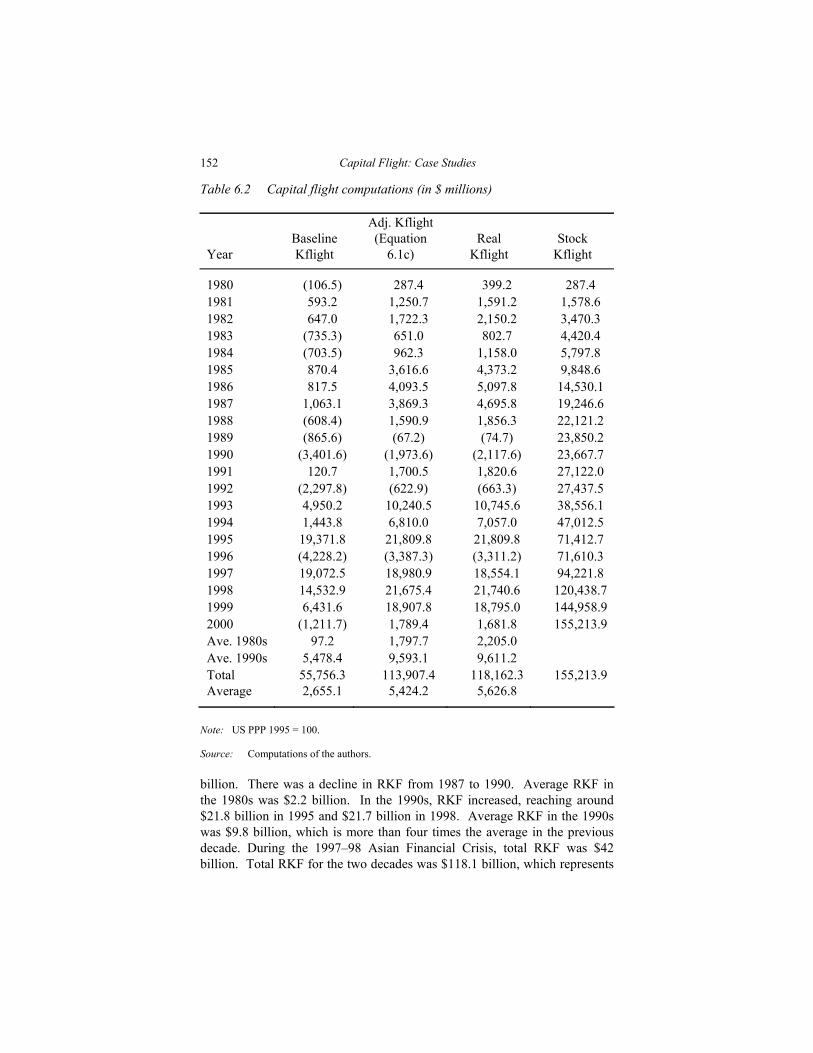
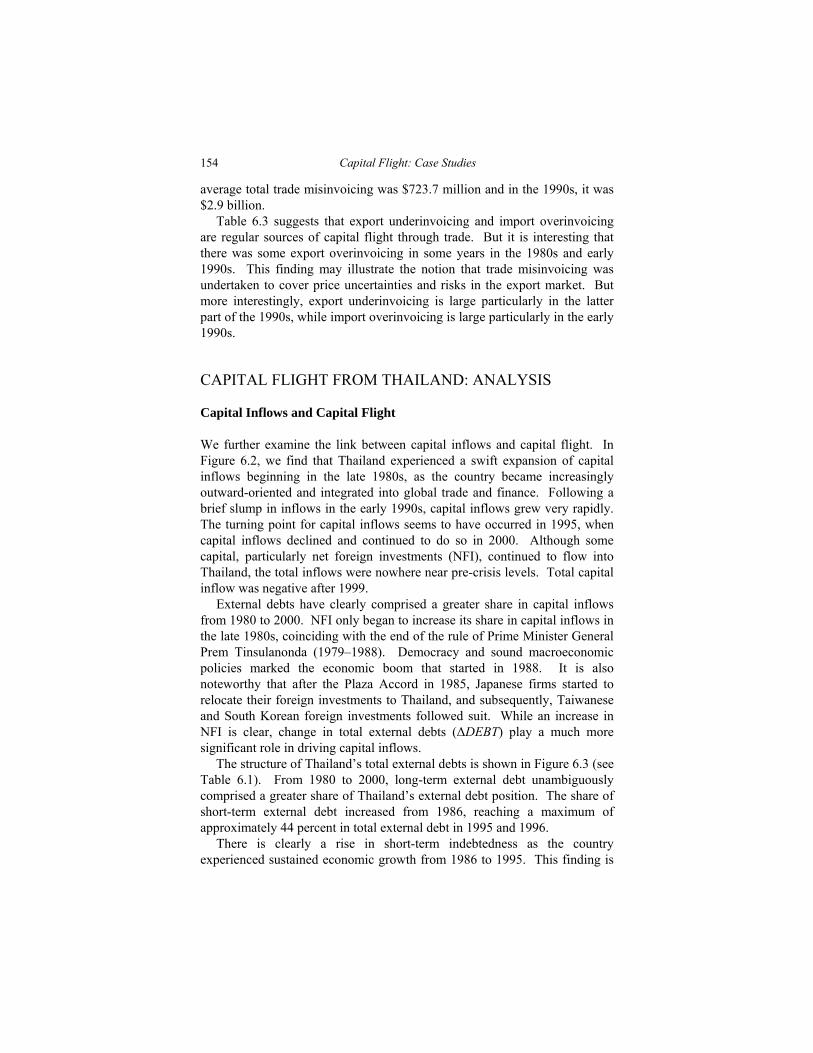
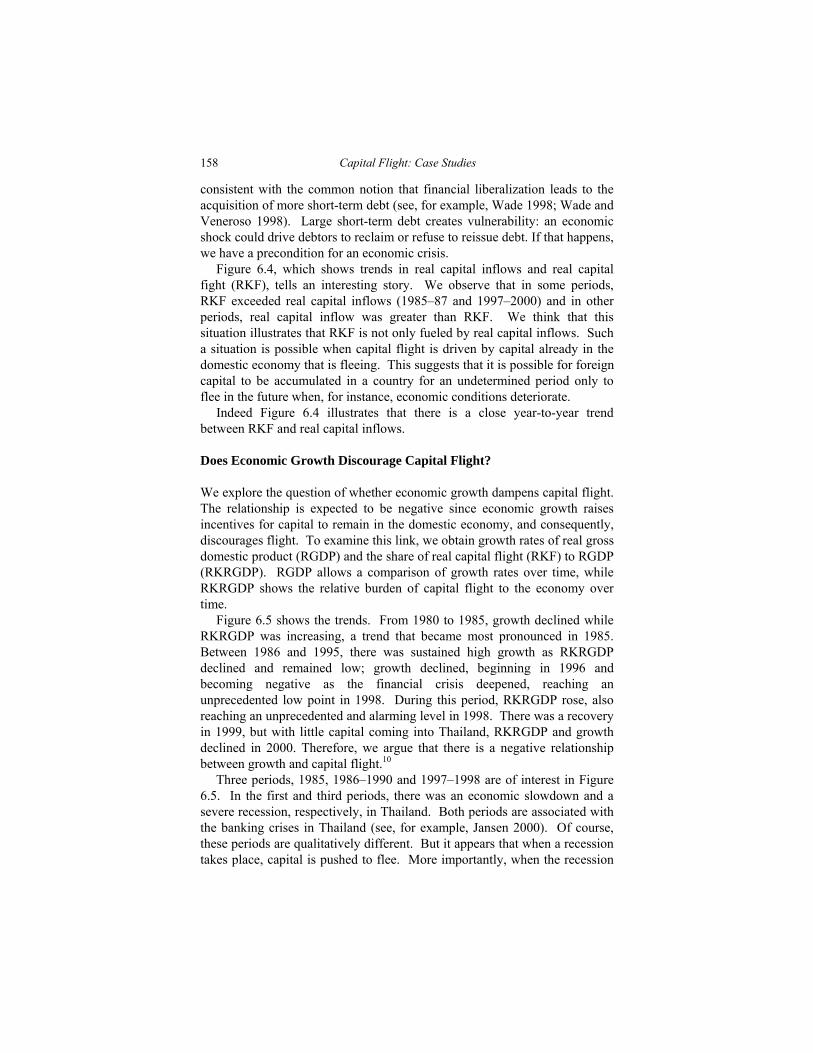
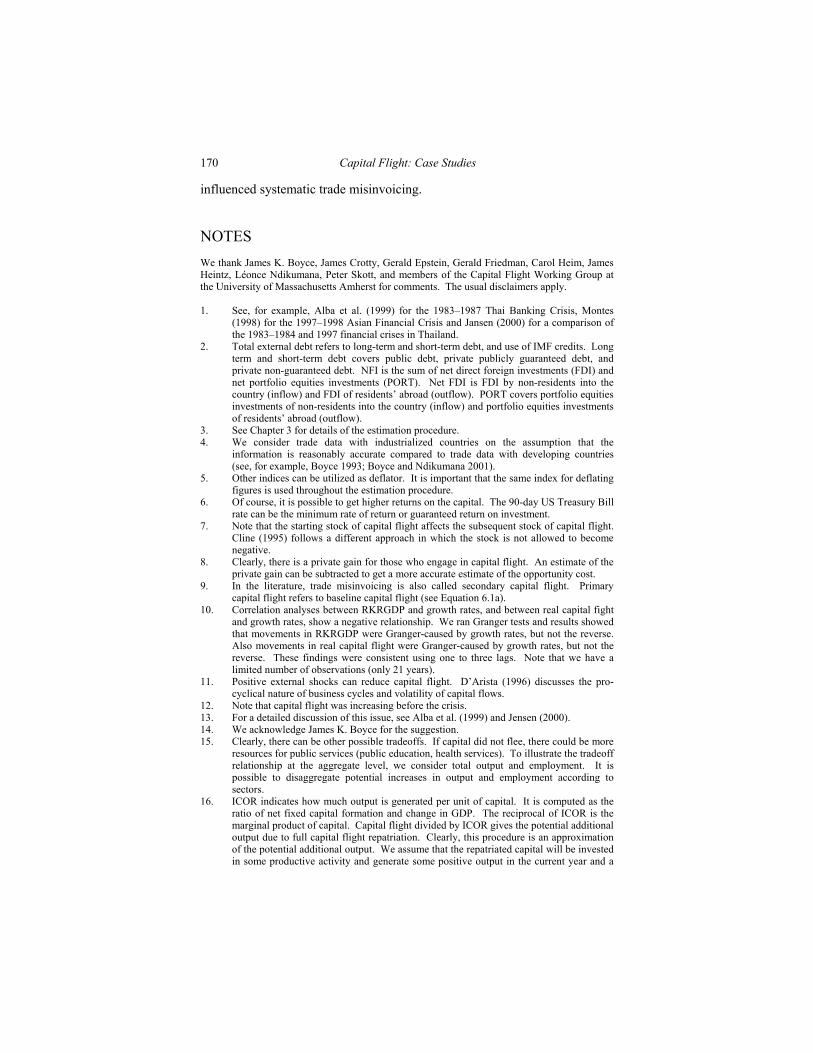